the Creative Commons Attribution 4.0 License.
the Creative Commons Attribution 4.0 License.
 | 09 Jun 2020
Net ozone production and its relationship to nitrogen oxides and volatile organic compounds in the marine boundary layer around the Arabian Peninsula
John N. Crowley
Dirk Dienhart
Philipp Eger
Hartwig Harder
Bettina Hottmann
Monica Martinez
Uwe Parchatka
Jean-Daniel Paris
Andrea Pozzer
Roland Rohloff
Jan Schuladen
Justin Shenolikar
Sebastian Tauer
Jos Lelieveld
Horst Fischer
Strongly enhanced tropospheric ozone (O3) mixing ratios have been reported in the Arabian Basin, a region with intense solar radiation and high concentrations of O3 precursors such as nitrogen oxides (NOx) and volatile organic compounds (VOCs). To analyze photochemical O3 production in the marine boundary layer (MBL) around the Arabian Peninsula, we use shipborne observations of NO, NO2, O3, OH, HO2, HCHO, the actinic flux, water vapor, pressure and temperature obtained during the summer 2017 Air Quality and Climate in the Arabian Basin (AQABA) campaign, and we compare them to simulation results from the ECHAM-MESSy Atmospheric Chemistry (EMAC) general circulation model. Net O3 production rates (NOPRs) were greatest over both the Gulf of Oman and the northern Red Sea (16 ppbv d−1) and over the Arabian Gulf (32 ppbv d−1). The NOPR over the Mediterranean, the southern Red Sea and the Arabian Sea did not significantly deviate from zero; however, the results for the Arabian Sea indicated weak net O3 production of 5 ppbv d−1 as well as net O3 destruction over the Mediterranean and the southern Red Sea with values of −1 and −4 ppbv d−1, respectively. Constrained by HCHO∕NO2 ratios, our photochemistry calculations show that net O3 production in the MBL around the Arabian Peninsula mostly occurs in NOx-limited regimes with a significant share of O3 production occurring in the transition regime between NOx limitation and VOC limitation over the Mediterranean and more significantly over the northern Red Sea and Oman Gulf.
- Article
(5262 KB) - Full-text XML
-
Supplement
(2199 KB) - BibTeX
- EndNote


Revenue from the exploitation of the great oil reserves in the states of and around the Arabian Peninsula has propelled remarkable economic development associated with industrialization and urbanization. Strong population growth and the anthropogenic emission of gases and particulates over the last few decades have resulted in the Middle East becoming a hot spot for air pollution and the associated health effects; it is also one of the regions worldwide where climate change is particularly rapid (Lelieveld et al., 2016a). Unique meteorological conditions, such as intense solar radiation, high temperatures and aridity, as well as strong anthropogenic emissions of volatile organic compounds (VOCs) and nitrogen oxides () from on- and offshore petrochemical industries, dense ship traffic, fossil energy production for air conditioning and desalination, and urban development are expected to further intensify in the future and contribute to photochemical ozone (O3) production (Lelieveld et al., 2009; Krotkov et al., 2016; Pfannerstill et al., 2019). Thus, understanding the sources and sinks of NOx and other O3 precursors on and around the Arabian Peninsula is of major importance for atmospheric chemistry studies, including the investigation of net O3 production rates (NOPRs; Monks et al., 2015; Reed et al., 2016; Bozem et al., 2017).
NOx plays a central role in atmospheric photochemistry (Nakamura et al., 2003; Tuzson et al., 2013; Reed et al., 2016). It is the primary precursor for tropospheric O3, secondary organic aerosols and photochemical smog in urban areas (Hollaway et al., 2012; Javed et al., 2019). The main ground-based sources of NO and NO2 are fossil fuel combustion and, to a lesser extent, bacterial processes in soils, whereas both lightning and aircraft emissions are sources of these species in the upper troposphere (Nakamura et al., 2003; Miyazaki et al., 2017; Javed et al., 2019). The transport of NOx in the atmosphere is relatively limited due to its short lifetime of a few hours (Reed et al., 2016). It is removed from the troposphere mainly by conversion to HNO3 (via reaction with OH) during the day or by the formation of N2O5 (via the reaction of NO2 with NO3) at nighttime, which also leads to the formation of nitric acid by heterogeneous hydrolysis on aerosol surfaces (Crutzen, 1973; Liu et al., 2016; Reed et al., 2016). Ultimately, the deposition of HNO3 constitutes the major loss process of NOx from the atmosphere.
Ozone is a secondary pollutant that is photochemically formed in the troposphere from its precursors NOx and VOCs (Bozem et al., 2017; Jaffe et al., 2018). It is an important greenhouse gas, an atmospheric oxidant and the most important primary precursor for OH (Lelieveld et al., 2004; Monks et al., 2015; Bozem et al., 2017). O3 in the planetary boundary layer causes health damage, notably respiratory diseases, and reduces crop yields (Monks et al., 2015; Jaffe et al., 2018).
NOx and O3 mixing ratios in the troposphere vary from less than 20 pptv and 10 ppbv, respectively, for pristine conditions such as the remote marine boundary layer (MBL) to mixing ratios of several hundreds of parts per billion by volume (ppbv) in regions with heavy automobile traffic and in international shipping lanes (for NOx) and downwind of urbanized areas (for O3) (Reed et al., 2016; Jaffe et al., 2018). Low-NOx environments such as the clean MBL and the lower free troposphere are considered net O3 destruction regimes, whereas the upper troposphere and areas with anthropogenic emissions of O3 precursors are considered regions of net O3 production (Klonecki and Levy, 1997; Bozem et al., 2017). Measurements performed in the Houston Ship Channel revealed NOPRs of the order of several tens of part per billion per hour (Chen et al., 2010; Mao et al., 2010; Ren et al., 2013).
Over the last decade, much effort has been successfully devoted to the mitigation of NOx emissions over Europe and America, and levels of reactive nitrogen trace gases have decreased (Miyazaki et al., 2017). However, in Asia, India and the Middle East, NOx emissions have substantially increased during the last decade so that the global NOx burden has essentially remained constant (Miyazaki et al., 2017). NOx emissions from ocean-going vessels have attracted considerable attention, as they are reported to account for 15 % of the global NOx emission burden (Celik et al., 2020). Model calculations suggest that the Arabian Gulf, with an estimated annual NOx emission density of about 1 ton km−2 from ship traffic, is among the regions with the highest NOx emission densities worldwide (Johansson et al., 2017). Although NOx emissions in the Red Sea and Arabian Sea areas have been reported to be 3 and 5 times smaller than for the Arabian Gulf, respectively, these values are still 50–100 times larger than the emission density reported for areas such as the South Pacific Ocean (Johansson et al., 2017).
In the present study, we characterize photochemical NOPRs in the MBL around the Arabian Peninsula. In Sect. 2, descriptions of the campaign, the instruments, the data processing and the methods used in this study are presented. In Sect. 3, mixing ratios of NOx and O3 around the Arabian Peninsula are reported. Based on concurrent measurements of HOx, the actinic flux, temperature and pressure, noontime (HO2+RO2) mixing ratios are estimated and used to calculate NOPRs in the different regions around the Arabian Peninsula. Observation-based analysis of the HCHO∕NO2 ratios will be used to distinguish between NOx- and VOC-limited chemistry in the particular regions. A comparison of the results with data retrieved from the EMAC 3-D global circulation model is also included.
2.1 AQABA campaign
The AQABA (Air Quality and Climate in the Arabian Basin) ship campaign investigated the chemical composition of the MBL around the Arabian Peninsula. From late June to early September 2017, the Kommandor Iona research and survey vessel sailed from Toulon (France) to Kuwait and back in order to perform gas-phase and particle measurements in the region. The gas-phase and aerosol measurement instrumentation was housed in five laboratory containers on the front deck. A 6 m high, 20 cm diameter cylindrical stainless steel common inlet was installed on the front deck of the vessel to sample air at a total mass flow rate of 10 000 SLM (standard liters per minute). NO and NO2 chemiluminescence measurements were obtained at a total bypass flow rate of 28.5 SLM sampling air from the common inlet with a residence time in the tubing of ∼3 s. HCHO, NO2 cavity ring-down spectroscopy and O3 measurements were obtained with similar bypass systems sampling air from the common inlet. H2O vapor was measured on the top of the ship mast at the front of the ship. The OH and HO2 detection units were placed on the prow to allow for inlets with residence times of less than 10 ms.
The Kommandor Iona left Malta in late June 2017, traversing the Mediterranean Basin, the Suez Canal and the northern Red Sea. A 3 d stopover was made at KAUST University (Saudi Arabia) from 11 to 13 July 2017 before the vessel passed the southern Red Sea area. On 17 July 2017, the vessel briefly stopped at the Port of Djibouti before passing the Gulf of Aden, the Arabian Sea and the Gulf of Oman. Kuwait, at the northern end of the Arabian Gulf, marked the turning point of the ship cruise, and the scientific staff was exchanged there during a second 3 d stopover. The Kommandor Iona started the second leg of the cruise on 3 August 2017, arriving in Toulon (France) in early September 2017 without any further stops. Figure 1 shows the ship's route subdivided into six different regimes.
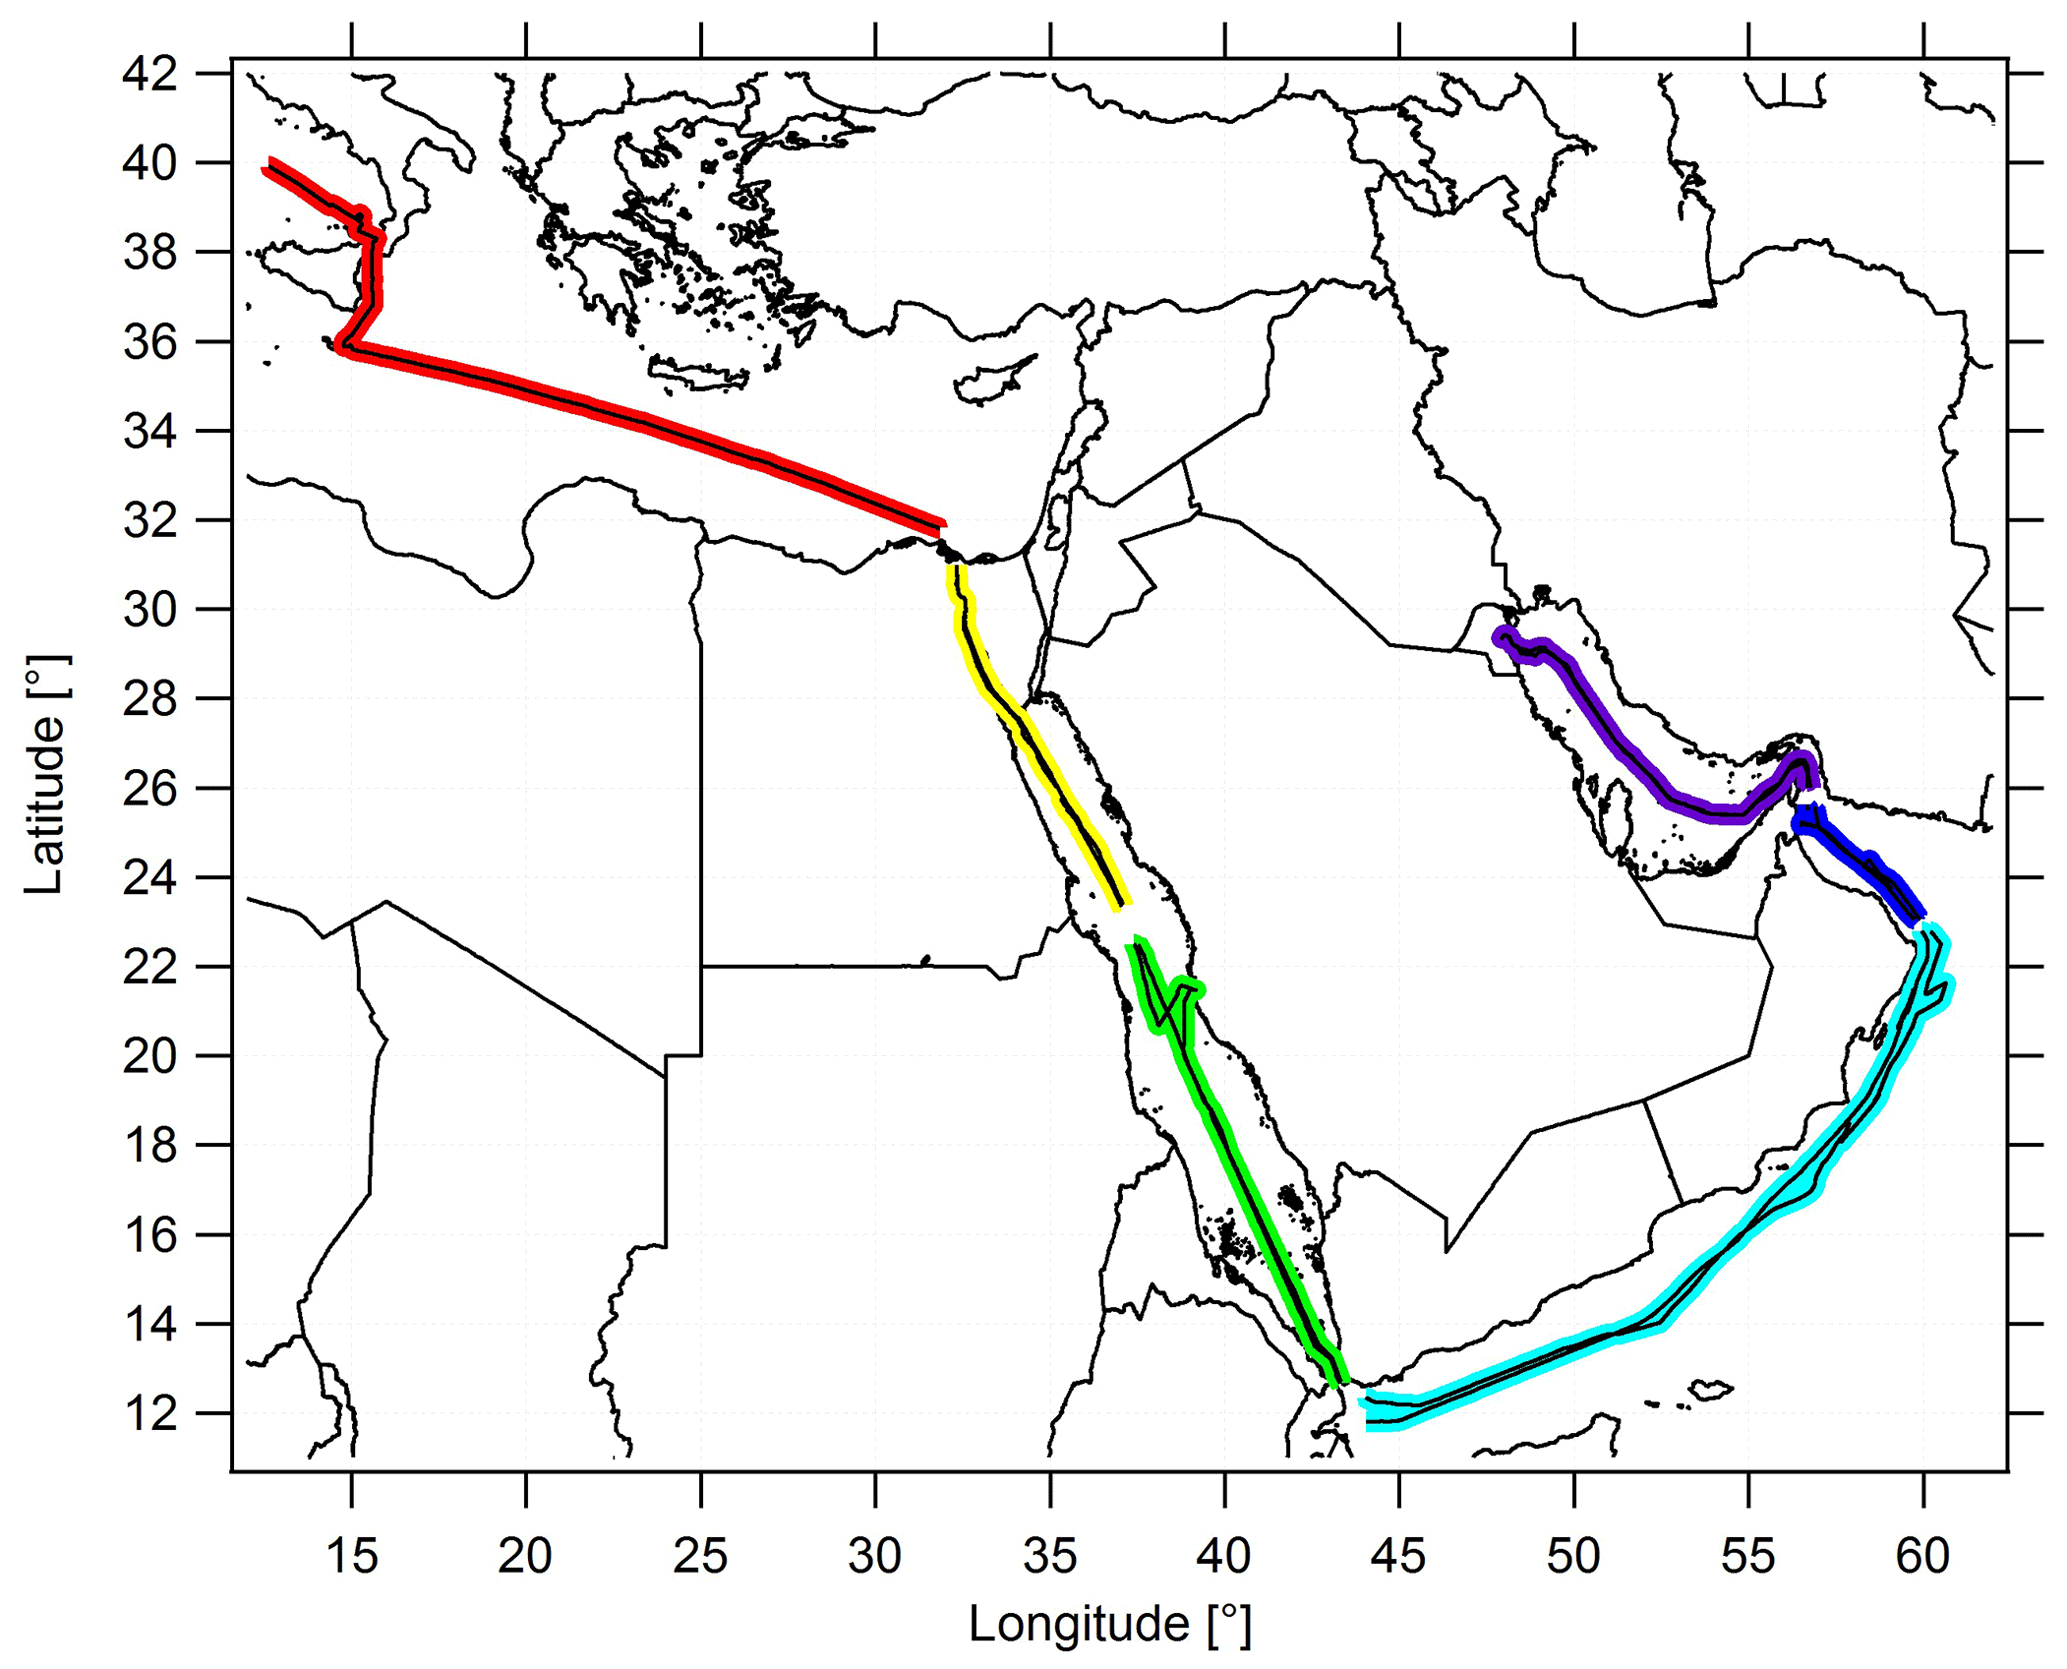
Figure 1The ship cruise during both legs, and the color-coded subdivision of the ship's route into six different regimes. The following abbreviations are used throughout the paper to refer to the subdivisions: AG for the Arabian Gulf (purple), OG for the Oman Gulf (dark blue), AS for the Arabian Sea (blue), SRS for the southern Red Sea (green), NRS for the northern Red Sea (yellow) and M for the Mediterranean (red).
To enhance the statistical significance of our results and due to the comparable signatures of the NOx and O3 measurements in the northern part of the Red Sea, the Suez Gulf and the Suez Canal, we combined these regions and refer to them throughout the paper as the “northern Red Sea” (NRS). For the same reasons, we merged the Gulf of Aden with the Arabian Sea (AS). See Table S1 in the Supplement for the range of latitudinal and longitudinal coordinates of the different regions and Table S2 for a detailed day-to-day description of the route.
2.2 Measurements of NOx during AQABA
Chemiluminescent detection of NO and NO2 is a widely applied method to quantify mixing ratios from parts per million by volume down to the low parts per trillion by volume range (Nakamura et al., 2003; Pollack et al., 2011; Hosaynali Beygi et al., 2011; Reed et al., 2016). During AQABA, we deployed a compact, robust and commercially available two-channel chemiluminescence detector CLD 790 SR (ECO Physics AG, Dürnten, Switzerland) that had been optimized for in situ field measurements over the last decade (Hosaynali Beygi et al., 2011). The measurement principle of the CLD is based on the addition of O3 to NO to produce stoichiometric quantities of excited-state that will emit an infrared photon (λ>600 nm), forming the chemiluminescent detection principle for NO (Drummond et al., 1985; Reed et al., 2016). Both channels feature an identical layout and were operated at a mass flow of 1.5 SLM during AQABA. One channel of the CLD (the NOc channel) was additionally equipped with a LED solid-state photolytic converter (Droplet Measurement Technologies, Boulder, Colorado) installed upstream of the O3 addition to selectively photolyze NO2 to NO, which is subsequently measured. In this section, we will concentrate on modifications made prior to the campaign and especially on the operational conditions of the photolytic converter during the campaign. Further details on the measurement principle are described elsewhere (Pollack et al., 2011; Hosaynali Beygi et al., 2011; Reed et al., 2016).
During AQABA, the cylindrical photolytic converter (length 14 cm, volume ∼0.079 L) was operated at a constant pressure of 95 hPa, yielding a residence time of ∼0.3 s. The photolytic NO2 converter features a set of 200 UV LED units attached to each end of the converter. The emission profile of the UV LED units was characterized in laboratory measurements to peak at 398 nm with a full width at half maximum (FWHM) of 16 nm. The UV-induced positive bias in the NO2 measurement due to the photolysis of BrONO2, HONO, NO3 and ClNO2 to produce NO was estimated at 6.1 %, 2.8 %, 2.7 % and 1.2 %, respectively, based on the absorption cross sections from the MPI-Mainz UV/VIS Spectral Atlas of Gaseous Molecules (Keller-Rudek et al., 2013). These values represent upper limits for the interference of the respective NOy compound, as the respective molecular quantum yield was estimated conservatively at one. Note that the values represent percent interferences if the interferent has the same concentration as NO2. Due to the low daytime concentrations of these molecules in the MBL, a UV-induced bias was neglected for the observations in this study. To limit wall loss of NO2, the inner cavity surface was made of PTFE (polytetrafluoroethylene), which may potentially provide a reservoir (via surface adsorption) for NOy that can thermally dissociate to increase the background signal of the NO2 measurement (Reed et al., 2016). The conversion efficiency (Ke) of the photolytic NO2 conversion was estimated by gas-phase titration (SYCOS K-GPT-DLR, ANSYCO, Karlsruhe, Germany) several times before, during and after the campaign at 29.4 ±0.9 % allowing for the calculation of NO2 concentrations as follows: . To avoid chemical interferences due to adding O3 in excess during a gas-phase titration, a small but nonzero amount of NO was always left unoxidized during gas-phase titrations.
During AQABA, regular dry zero-air measurements as well as NO and NO2 calibrations were performed autonomously over a 10 min period every 6 h to accurately quantify the instrumental background and to correct for sensitivity drifts. An autonomous cycle of “2 min zero-air measurements – 2 min NO calibration – 2 min zero-air measurement – 2 min NO2 calibration – 2 min zero-air measurement” was implemented. Continuous flows of NO and NO2 calibration gases were added to the synthetic airflow or directed to a pump by switching solenoid valves. The NO calibration standard (1.954±0.039 ppmv NO in N2, Air Liquide, Germany) used during the campaign was compared to a primary standard (5.004±0.025 ppmv; NPL, Teddington, UK) after the campaign yielding an effective NO mixing ratio of 2.060±0.057 ppmv in the NO calibration gas. Zero-air measurements and NO calibrations were performed with a total flow of 3.44 SLM, achieving an overflow of 0.44 SLM to guarantee ambient air free standard measurements. The calibration gas was added at 4.5 sccm to the zero-air flow. During AQABA, NO calibrations at 2.5 ppbv were achieved. During the first leg of the campaign, zero air was sampled from a bottle (Westfalen AG, Germany), whereas during the second leg zero air was generated from a zero-air generator (Air Purifier CAP 180, acuraLine). Zero-air measurements generated with the zero-air generator were statistically not significantly different from those achieved using a bottle. To correctly account for the photomultiplier background and chemical interferences due to reactions of O3 with ambient alkenes, additional pre-chamber measurements were performed every 5 min as well as at the beginning of zero-air measurements and calibrations for 25 s, respectively. This correction removes a large fraction of the interference signal from alkenes. However, in regions where alkene concentrations strongly vary in time and magnitude, the CLD is prone to enhanced backgrounds due to the interference of alkenes with O3 in the instrument. A schematic setup of the two-channel CLD instrument is given in Fig. 2.

Figure 2Schematic setup of the two channel CLD instrument in the configuration used during AQABA. NO and NO2 calibration gases were running continuously and were added to the zero-air flow by switching the respective solenoid valves.
The total measurement uncertainty (TMU) in NO was calculated as 6 % at an integration time of 5 min and a confidence level of 1σ by adding the precision (5 %) and the error of the calibration gas mixture (3 %) in quadrature: . Note that the precision is calculated from the reproducibility of all in-field calibrations, which is mainly determined by drifts in the detector sensitivity rather than by the statistical Poisson noise of the measured signal. The limit of detection of 9 pptv at a 5 min integration time and a confidence level of 1σ in the NO channel was estimated as the full width at half maximum of the frequency distribution of all zero-air measurements obtained during the campaign. The TMU for NO2 has been estimated as the largest error possible for the statistically dependent variables NO and NOc:
Note that the total measurement uncertainty of the NOc channel data has also been calculated at 6 % at an integration time of 5 min and a confidence level of 1σ by adding the precision and the error of the calibration gas mixture in quadrature. Over the course of the campaign, the median and the average relative uncertainty of NO2 were 13 % and 23 %, respectively. The relative uncertainty in NO2 was estimated as a conservative upper limit at 23 % as the average of the relative uncertainties of all data points obtained during AQABA. As the zero-air measurements in the NO2 channel produced an increased background affected by memory effects after exposure to high NOx levels, e.g., during measurements of stack emissions, the NO2 raw data were initially processed without converter background subtraction. Therefore, as we expect the CLD NO2 data to be offset due to not being initially background corrected, the converter background was estimated at 112 pptv from the center of a Gaussian fit representing the difference of 1 min averaged CLD NO2 and concurrent cavity ring-down spectroscopy (CRDS) NO2 measurements for data points below 10 ppbv. Setting the threshold for calculating the difference of the two concurrent data sets to 10 ppbv is somewhat arbitrary; however, changing this limit to 5 or 20 ppbv does not significantly vary the estimated offset of the CLD NO2 data. The offset correction of 112 pptv was taken as the ultimate absolute measurement uncertainty of the CLD NO2 measurement. Further corrections to the final CLD data include residence time corrections as well as corrections for NO and O3 losses and the subsequent formation of NO2 in the sampling line (Ryerson et al., 2000). Both NO and NO2 CLD data have also been corrected for nonlinearities for concentrations higher than 55 ppbv, as experienced during probing of stack emissions.
2.3 Further measurements used in this study
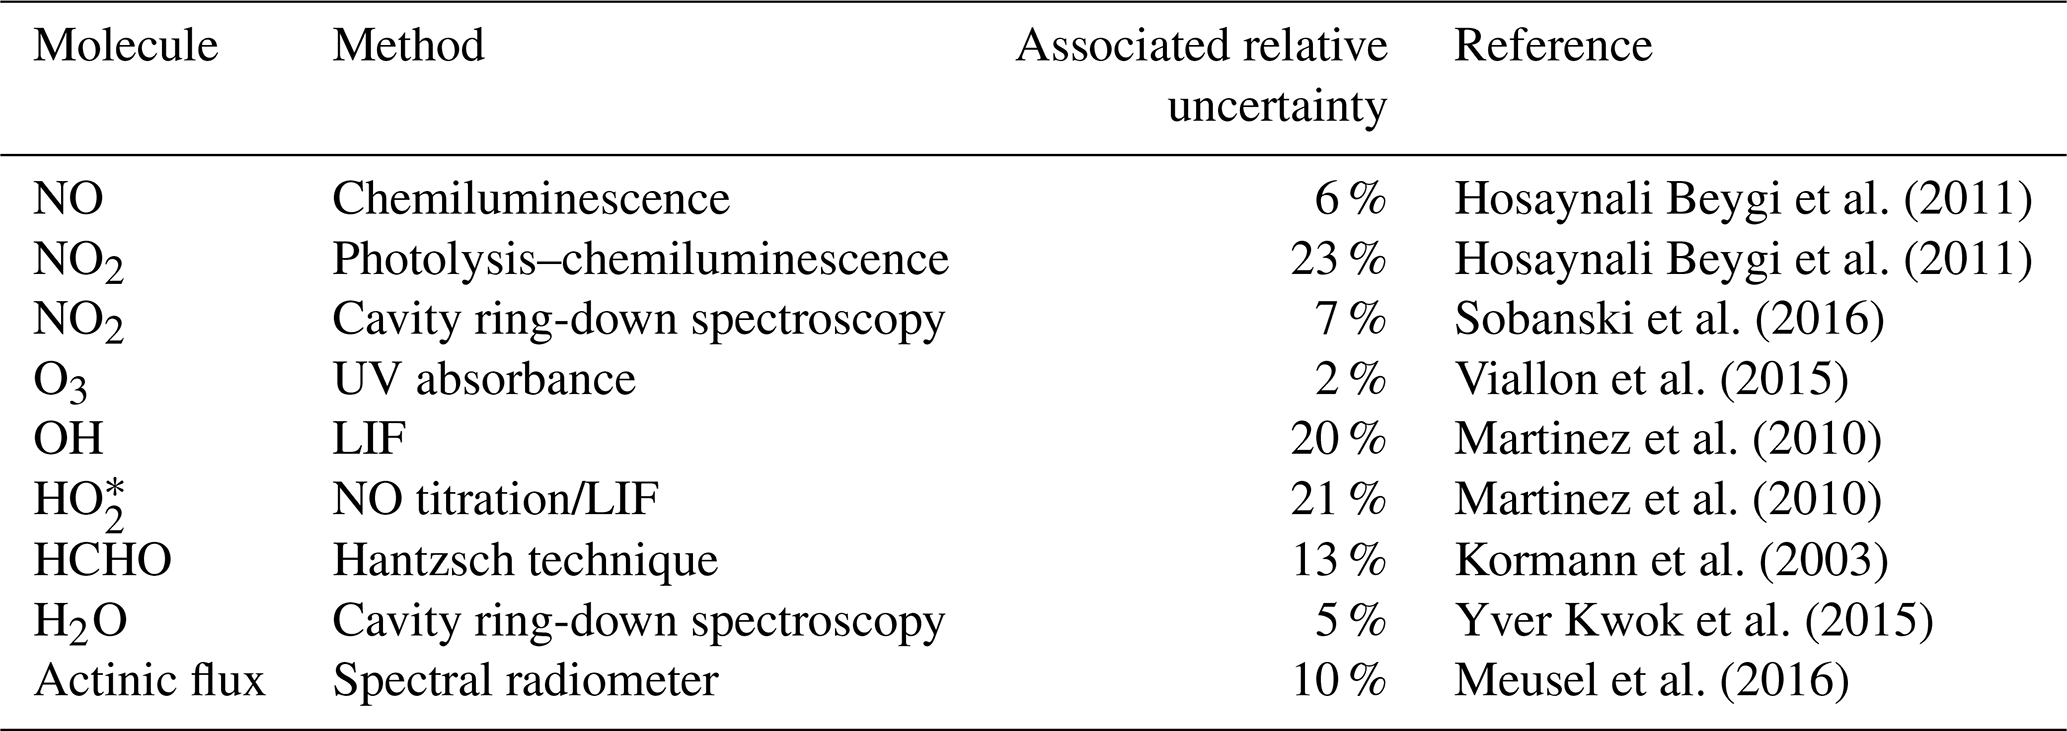
An extensive set of concurrent measurements providing mixing ratios of O3, NO2, HCHO, OH, HO2, absolute humidity and the actinic flux, temperature and pressure data obtained during AQABA was used in this study. Ozone was measured with an absorption photometer (Model 202 Ozone Monitor, 2B Technologies, Boulder, Colorado) based on the well-established absorption of the mercury line in the Hartley band at 254 nm (Viallon et al., 2015). Eliminating water and particle interferences during sampling was achieved by sampling through a Nafion tube and a Teflon filter. The ozone monitor was zeroed 10 times during the campaign. NO2 was further measured by cavity ring-down spectroscopy (Sobanski et al., 2016) and used to correct the instrumental background of the CLD NO2 data, as described above (the correction was taken as the ultimate absolute measurement uncertainty in the CLD NO2 data). Note that we use the NO2 CLD data rather than the NO2 CRDS data in this study, as the temporal coverage of the CLD NO2 data over the course of the campaign is about 60 % compared with about 35 % for the cavity ring-down measurements. Formaldehyde (HCHO) was measured with an AL 4021 HCHO analyzer (AERO-LASER GmbH, Garmisch-Partenkirchen, Germany), which is a fully automatized monitor based on the Hantzsch technique (Kormann et al., 2003). H2O measurements were obtained using a cavity ring-down spectroscopy monitor (Picarro G2401, Santa Clara, California) supervised by Laboratoire des Sciences du Climat et de l'Environnement (LSCE; Yver Kwok et al., 2015). Measurements of OH and HO2 were performed with the custom-built Hydroxyl Radical measurement Unit based on fluorescence Spectroscopy (HORUS) instrument based on laser-induced fluorescence (LIF) spectroscopy of the OH molecule and NO titration of HO2 to OH followed by LIF spectroscopy detection of the OH molecule (Martinez et al., 2010; Regelin et al., 2013). HO2 data used in this study are still preliminary due to the currently uncorrected interference of organic peroxy radicals (RO2). The largest uncertainty due to the interference from RO2 is 7 % or 3 pptv, whichever is higher. The 1σ accuracy of both OH and HO2 is 20 %. The uncertainty in the OH data is estimated here as the 1σ accuracy of the data set at 20 %, whereas the uncertainty in HO2 is estimated as . As HO2 data are preliminary in this study, they will be referred to as . The wavelength-resolved down-welling actinic flux was measured with a spectral radiometer (Metcon GmbH) with a 512 pixel CCD array. The j values for NO2 and O3 were not corrected for upwelling UV radiation and were estimated to have a ∼10 % measurement uncertainty (Meusel et al., 2016). The radiometer was installed 10 m a.s.l. and 5 m above the front deck surface. Decreases in sensitivity due to sensor contamination with, e.g., sea spray, were corrected using a linear interpolation between two (daily) cleaning events. Temperature and pressure measurements were performed with the shipborne European Common Automatic Weather Station (EUCAWS), which is a weather station specifically designed for ships. The weather station incorporates sensors, processing units, satellite positioning and communication systems into one device and is implemented and coordinated by the European National Meteorological Service (EUMETNET). Table 1 lists the measurement methods and the TMU for each observation.
Table 1List of observations and gas-phase measurements during AQABA. The relative uncertainty associated with each data set is also given. Note that the relative uncertainty for OH and is estimated as the 1σ accuracy (and the 7 % interference of RO2 in the case of data). In addition, a reference is given regarding the practical use of each method.
Whenever possible, the Kommandor Iona research and survey vessel sailed with the wind coming from the bow in order to avoid contamination from stack emissions. However, based on the relative wind direction, the variability in NO and the temporal evolution of NOx, SO2 and O3, sections of data in which the air mass was contaminated by the ship's stack were identified. All data used here to calculate (HO2+RO2) and NOPRs were filtered to remove contaminated air masses. In total, 21 % of the sampling time was potentially contaminated by the ship's exhaust – 87 % of these contaminated periods occurred during the first leg of the cruise. During the second leg, the ship sailed against the wind, and most of the data were free of stack contamination. Our analysis is based on a 5 min running mean for each data set, whereby only averages that were calculated at a temporal coverage greater than 30 % were used. A time series of the NO, NO2 (both CLD), O3, OH, HO2* and j(NO2) measurements is given in Figs. S2 and S3.
NO and NO2 were measured from 3 July to 31 August 2017, O3 was measured from 22 June to 1 September 2017, HCHO was measured from 1 July to 31 August 2017, and OH and HO2* were measured from 18 July to 31 August 2017. For the analysis of peroxy radicals (RO2) and NOPRs around the Arabian Peninsula we removed data measured during the stopovers in Jeddah (11 to 13 July) and Kuwait (31 July to 3 August) as well as during bunkering at Fujairah City (6 August, 07:00–15:00 UTC). Due to the fact that HOx data were available from 18 July 2017 onward, we have limited the net O3 production analysis to the period after this date.
2.4 Methods
The so-called NOx–O3 null cycle represents a rapid daytime cycling between NO, NO2 and O3. Solar UV radiation photolyzes NO2 to NO and O(3P) (Reaction R1) which reforms O3 in the subsequent reaction with molecular oxygen O2 (Reaction R2; Leighton, 1961). NO and O3 react to form NO2 and O2 (Reaction R3). Reactions (R1), (R2) and (R3) constitute a so-called null cycle which establishes photostationary steady state (PSS) for both NOx and O3 at midlatitudes during noontime on a timescale of ∼100 s (Thornton et al., 2002; Mannschreck et al., 2004).
Under the assumption of PSS, the Leighton ratio φ is unity (Leighton, 1961):
where j(NO2) is the NO2 photolysis rate (s−1). In low-NOx environments (<100 pptv) previous studies have indicated that further NO oxidizing trace gases such as peroxy radicals (HO2, RO2) and halogen monoxides (XO) may result in a deviation from unity (Nakamura et al., 2003; Hosaynali Beygi et al., 2011; Reed et al., 2016).
Deviations from expected NO∕NO2 ratios at low NOx generally refer to missing oxidants converting NO to NO2 (Hosaynali Beygi et al., 2011; Reed et al., 2016) or to a measurement error due to an instrumental background or a positive interference from a thermal labile NOx reservoir species (Reed et al., 2016; Silvern et al., 2018). In the present study, we include HO2 and RiO2 into the production term for NO2.
RiO2 refers to a particular peroxy radical. Assuming that the temperature-dependent rate coefficient for the reaction of each particular peroxy radical RiO2 with NO equals the rate for Reaction (R4) (Hauglustaine et al., 1996; Cantrell et al., 1997; Thornton et al., 2002), we can combine the sum of all organic peroxy radicals RiO2 to the entity RO2. The sum of HO2 and RO2 can be estimated using the following steady-state equation:
However, the steady-state assumption is not valid if the sampled air parcel is affected by fresh emissions or fast changes in the actinic flux (Thornton et al., 2002). After sampling a fresh emission, e.g., a ship plume, for which NOx typically increased to values of several tens of parts per billion by volume with simultaneous titration in O3, we assume that PSS is re-established on a timescale of 2 min (Thornton et al., 2002; Mannschreck et al., 2004). To best approximate PSS in our analysis, we have restricted the estimation of RO2 on time frames of ±2 h around noontime for which we expect the smallest relative changes in the actinic flux. Noontime for each day was determined as the center of a Gaussian fit that was applied to the actinic flux data. We applied a Gaussian fit to the actinic flux data as this fitting method is sufficient to estimate the center of the diurnal actinic flux. To further limit the effect of periods during which PSS is not fulfilled, we use the median instead of the average, which is often disproportionately biased by strong NOx sources nearby. See Tables S3, S5 and S7 for detailed statistics and further information on regional averages and median values. See Fig. S1 for a detailed illustration of the calculation of the fraction of the noontime integral.
A further part of the analysis will be the investigation of NOPRs. Ozone production is initiated by reactions that produce HOx, for which primary production is from the photolysis of O3, formaldehyde, nitrous acid (HONO) and hydrogen peroxide (H2O2) (Thornton et al., 2002; Lu et al., 2010; Hens et al., 2014; Mallik et al., 2018). The production of O3 can be approximated by the rate of oxidation of NO with HO2 and RO2 to form NO2, which will rapidly form O3 (Reactions R1–R2; Parrish et al., 1986; Thornton et al., 2002; Bozem et al., 2017).
Here, we assume that all NO2 formed via Reactions (R4) and (R5) is photolyzed and converted to O3. This is justified by the finding that the noontime ratio varied between 0 % and 1 % (average of 0.5 % and standard deviation of 0.4 %) during AQABA, inferring that an insignificant amount of NO2 was lost by conversion to HNO3 and most NO2 was converted to O3 during the campaign. Photochemical O3 loss is mainly due to photolysis (λ<340 nm) in the presence of water vapor and the reactions of O3 with OH and HO2 (Bozem et al., 2017).
α represents the fraction of O(1D) that reacts with H2O, and it is calculated as follows:
α was 10.6±2.2 % during AQABA with a quasi-linear dependence on water concentrations. The error in α is mainly determined by the error of H2O at 5 %. Furthermore, O3 is lost due to reactions with alkenes (Reaction R10) and halogen radicals (Reaction R11):
We find that the loss rate is dominated by the photolysis of O3 and the subsequent reaction of O(1D) with H2O, which comprised 60 %–80 % of the total loss rate, followed by the reaction of O3 with HO2, which made up 10 %–30 % of the total loss rate (note that the uncertainty in the HO2 radical concentrations mentioned above has no significant influence on the total O3 loss rate, due to its small contribution). The remaining fraction (10 %–30 %) is due to the reaction of O3 with OH. The reaction of O3 with ethene is 0.005–0.01 ppbv h−1 on average and, therefore, is generally less than 2 % of the total O3 loss rate (Bourtsoukidis et al., 2019). Thus, the reaction of O3 with all alkenes will be neglected in the following. Halogen radicals were not measured during AQABA and will not be incorporated into our study. Based on oxidative pairs, Bourtsoukidis et al. (2019) classified the majority of their samples collected during AQABA using an OH∕Cl ratio of 200:1. As measured daytime OH concentrations were of the order of 5×10⁶ molecule cm−3, the estimate would yield a Cl concentration of 2.5×10⁴ molecule cm−3, which would decrease the estimated diurnal net O3 production rates by roughly 0.2 ppbv d−1 over the Arabian Sea and by a maximum of 0.6 ppbv d−1 over the other regions, which does not substantially alter the results presented here. The noontime chemical O3 loss rate can be summarized by
The NOPR presented in this study is finally calculated as the difference between Eqs. (4) and (6):
Under the assumption of a constant chemical composition for a given day, the NOPR is expected to have a diel cycle following the measured actinic flux. Hence, integrating the estimated NOPR over the course of a day based on the particular fractional noontime integral of j(NO2) will yield a diurnal value for the NOPR. A detailed calculation of the diurnal fractional integrals is given in Fig. S1. Note that all reaction rate constants used are from the IUPAC Task Force on Atmospheric Chemistry Chemical Kinetic Data Evaluation (Atkinson et al., 2004). Indications on whether a chemical regime is NOx- or VOC-limited can be derived from the ratio of HCHO to NO2. Former studies have derived HCHO∕NO2 ratios from satellite measurements to establish whether O3 production is NOx- or VOC-limited. The results indicate NOx limitation for HCHO∕NO2>2 and prevailing VOC limitation for HCHO∕NO2<1 (Duncan et al., 2010).
2.5 The ECHAM/MESSy Atmospheric Chemistry (EMAC) model
EMAC is a 3-D general circulation model that includes a variety of sub-models to describe numerous processes in the troposphere as well as their interaction with oceans and land surfaces and to incorporate anthropogenic influences. Here we use the second development cycle of the Modular Earth Submodel System (MESSy2; Jöckel et al., 2010) and ECHAM5 (Röckner et al., 2006), which is the fifth-generation European Centre Hamburg general circulation model in the T106L31 resolution (corresponding to a quadratic grid of roughly 1.1 and 1.1∘). The model has 31 vertical pressure levels and involves the MOM (Mainz Organic Mechanism) complex organic chemistry mechanism as presented by Sander et al. (2019), which includes further developments of the version used by Lelieveld et al. (2016b). Here, we use the lowest pressure level in a terrain following coordinates (equivalent to the surface level) and simulations of NO, NO2, O3, OH, HO2, j(NO2) and j(O1D). The sum of peroxy radicals was estimated as the sum of all radicals RiO2 with less than four carbon atoms. Net O3 production based on data retrieved from EMAC was estimated as
A list of all of the peroxy radicals RiO2 included for the reaction with NO is given in Table S10.
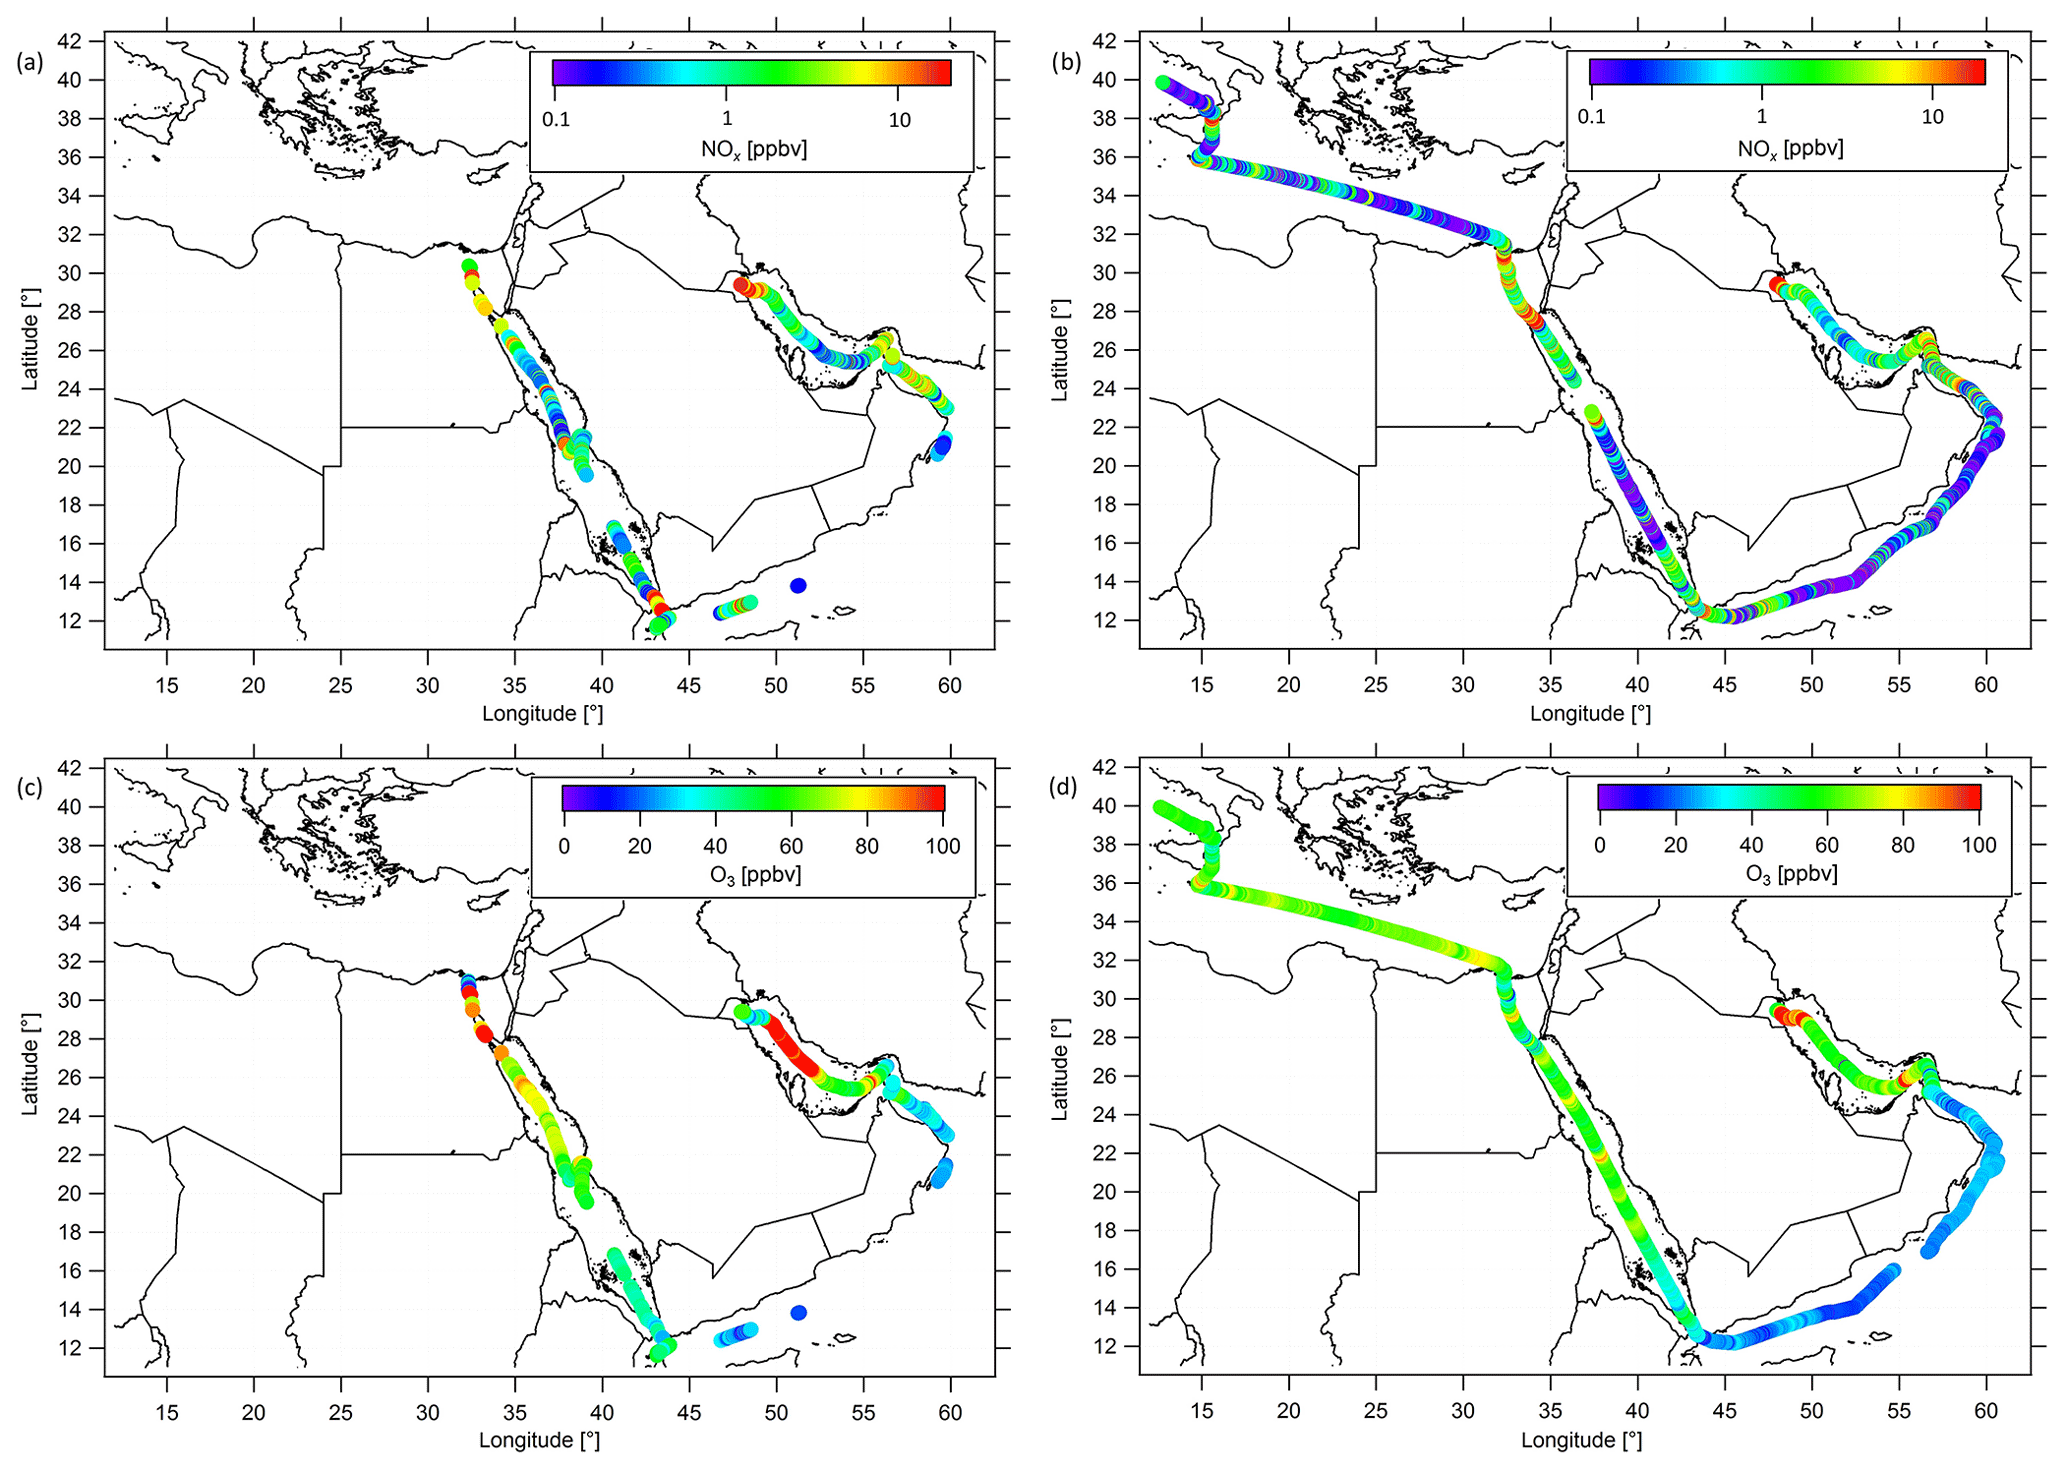
Figure 3Ship cruises with color-scaled NOx mixing ratios (logarithmic scale) during (a) the first and (b) the second leg, and color-scaled O3 mixing ratios (linear scale) during (c) the first and (d) the second leg. Note that both NOx and O3 have been filtered for contamination from the ship's stack.
3.1 NOx and O3 in the MBL around the Arabian Peninsula
During AQABA, the NOx mixing ratios varied over 3 orders of magnitude with the lowest values of less than 50 pptv observed in relatively pristine regions and the highest values of more than 10 ppbv found in the vicinity of areas with a strong anthropogenic influence or nearby passing ships. Ozone mixing ratios ranged from values of less than 20 ppbv, detected over the Arabian Sea, to more than 150 ppbv during episodes of severe pollution. Figure 3a and b show the distributions of NOx measured during the first and second legs of the campaign (ranging from 0.1 to 20 ppbv), while Fig. 3c and d show the corresponding O3 mixing ratios covering a range from 20 to 100 ppbv, respectively. A classification of the different regions based on box and whiskers plots, including the 25th–75th percentile interval (box) and the 10th–90th percentile interval (whiskers), is shown in Figs. 4 and 5 for NOx and O3, respectively. As average NOx is often influenced by fresh, localized emissions, we have included the median (black bar) instead of the mean in the box and whiskers plot for NOx, which is less sensitive to extreme values. For O3, although the difference between the median and mean is mostly negligible, we also use the median in Fig. 5. The NOx and O3 means, medians, standard deviations, 1st and 3rd quantiles, and the number of data points quantified per region are given in Table S3. See Fig. S4 for the OH and mixing ratios around the Arabian Peninsula. Figure S5 shows that the absolute humidity observed during AQABA ranges from the lowest values of less than 1 % observed in the Suez Golf during the first leg to about 3 % observed during both legs in the southeastern part of the Arabian Gulf and in the Strait of Hormuz. Although the highest absolute humidity was observed in the southeastern part of the Arabian Gulf during both legs of the cruise, the absolute humidity was very low during the first leg near Kuwait (about 1 %). These air masses were brought from the Kuwait/Iraq area into the MBL of the Arabian Gulf during the first leg, whereas a change in the wind direction during the second leg resulted in winds coming from the Iran region that were carrying moister air. For the rest of the cruise, the absolute humidity mixing ratio was about 1.5 % with variations generally being less than 0.5 %.
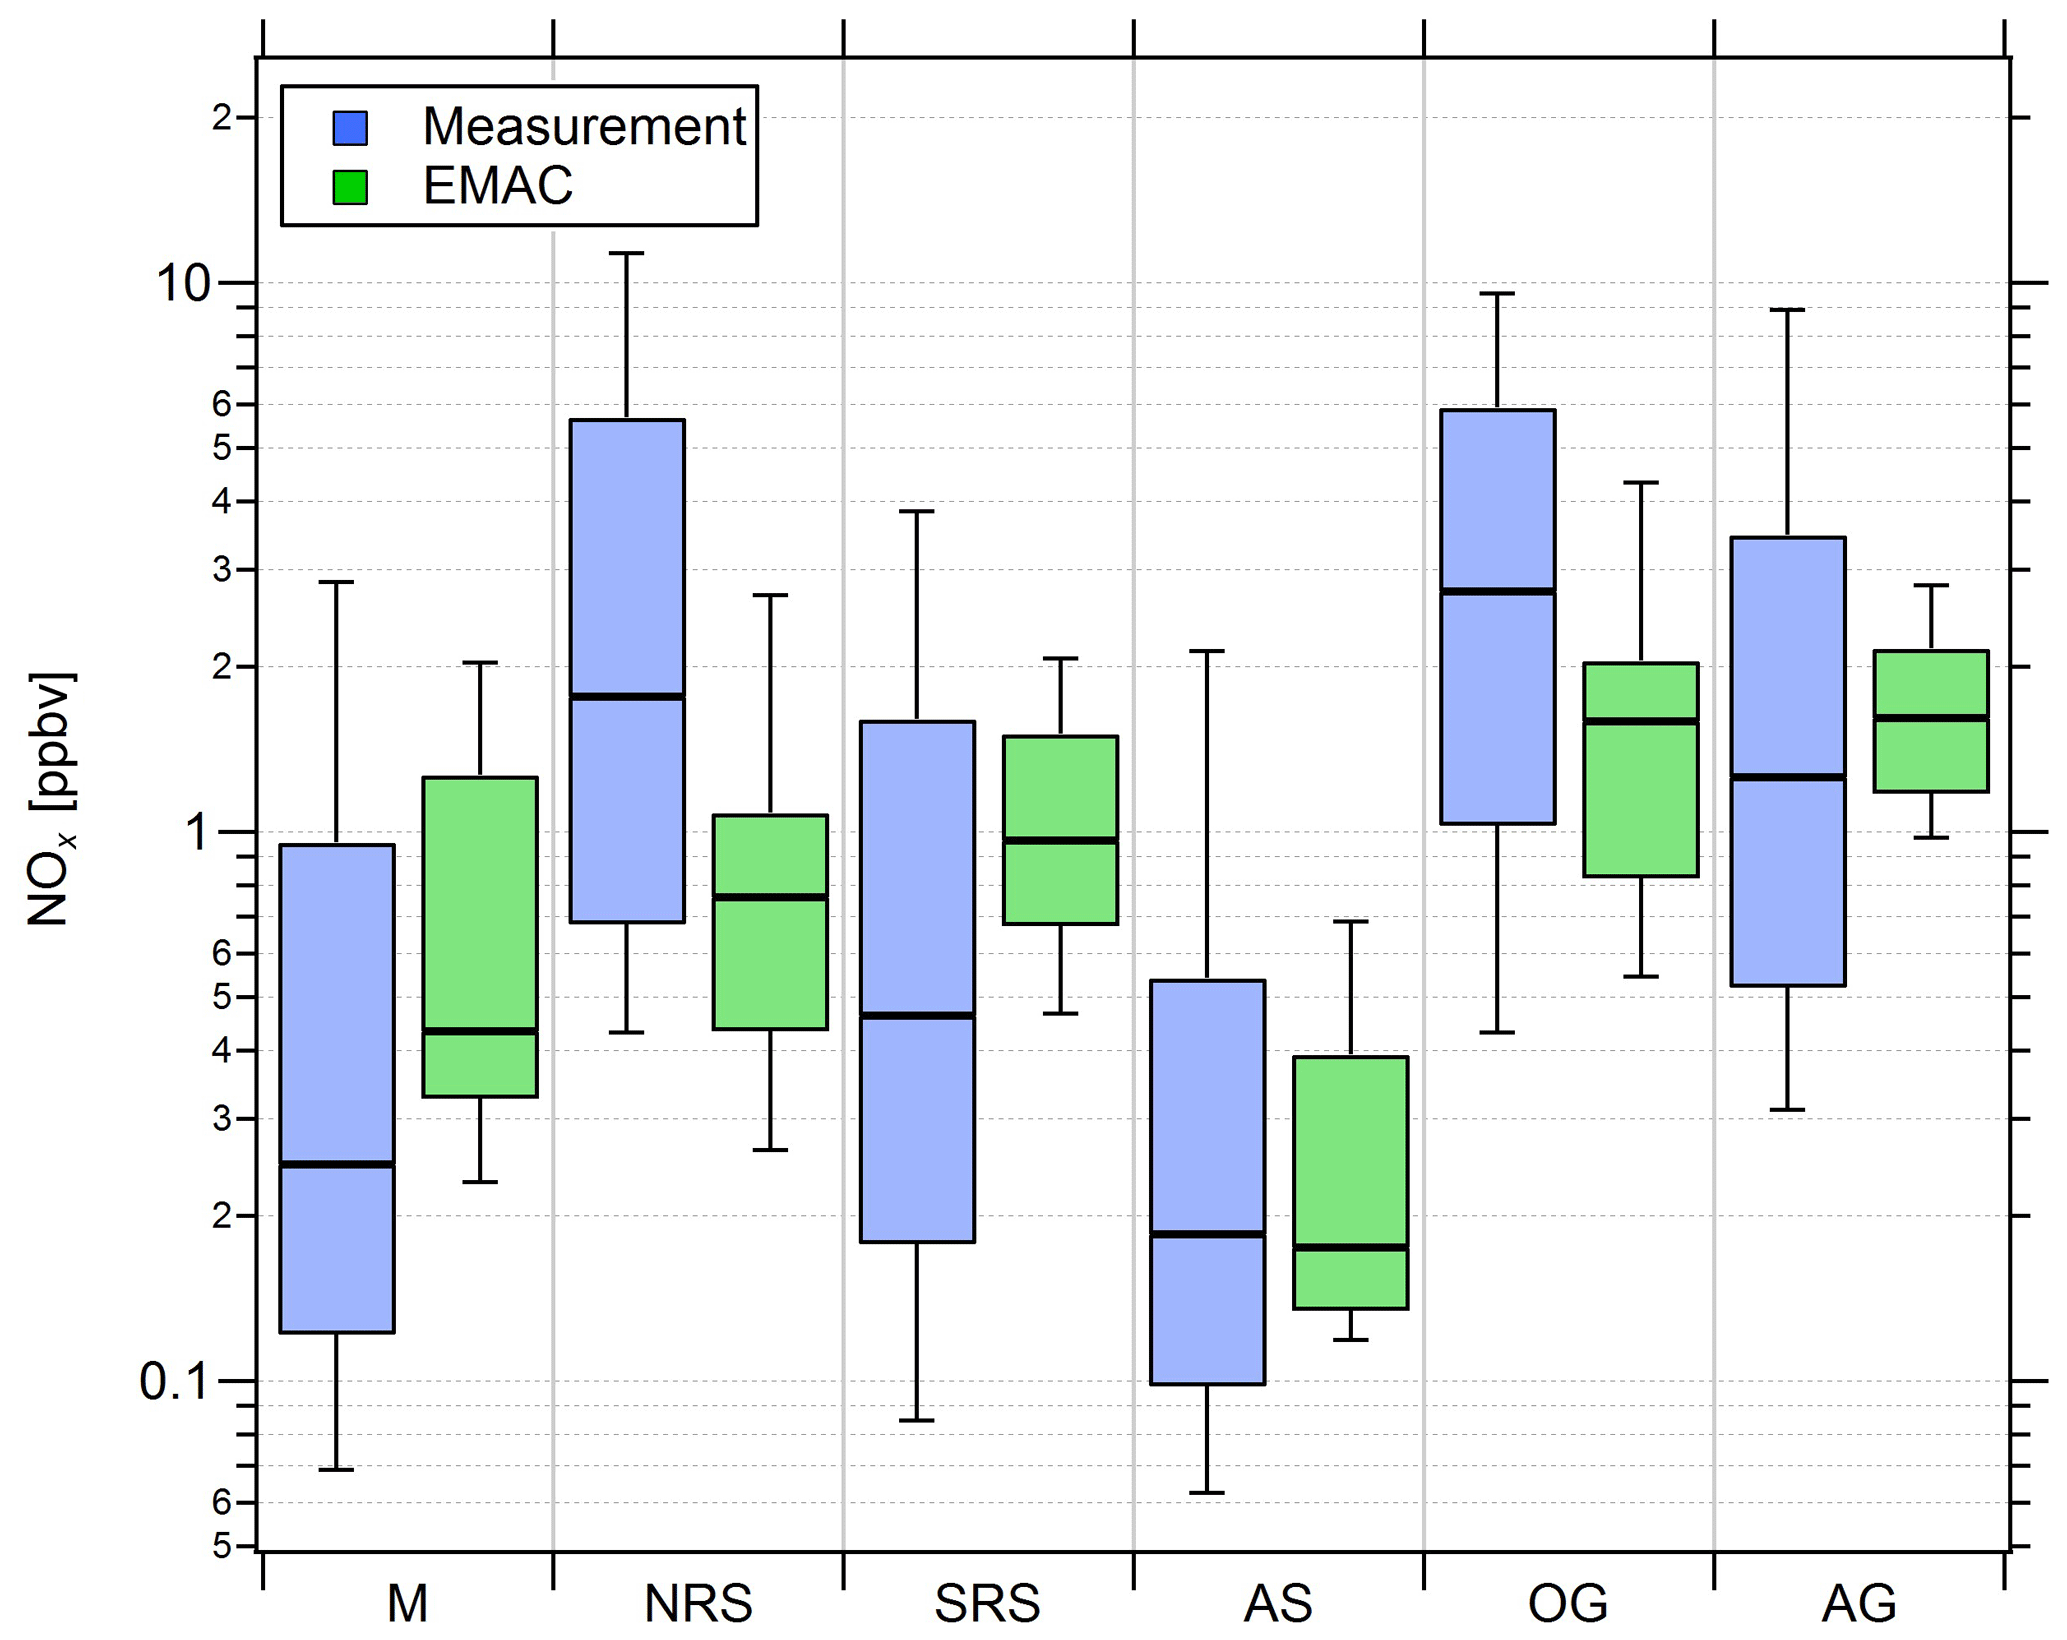
Figure 4Comparison of measured (blue) and simulated (green) NOx mixing ratios in the six different regions investigated during AQABA. The horizontal black bar indicates the median value, the box shows the 25th and 75th percentiles, and the whiskers show the 10th and 90th percentiles.
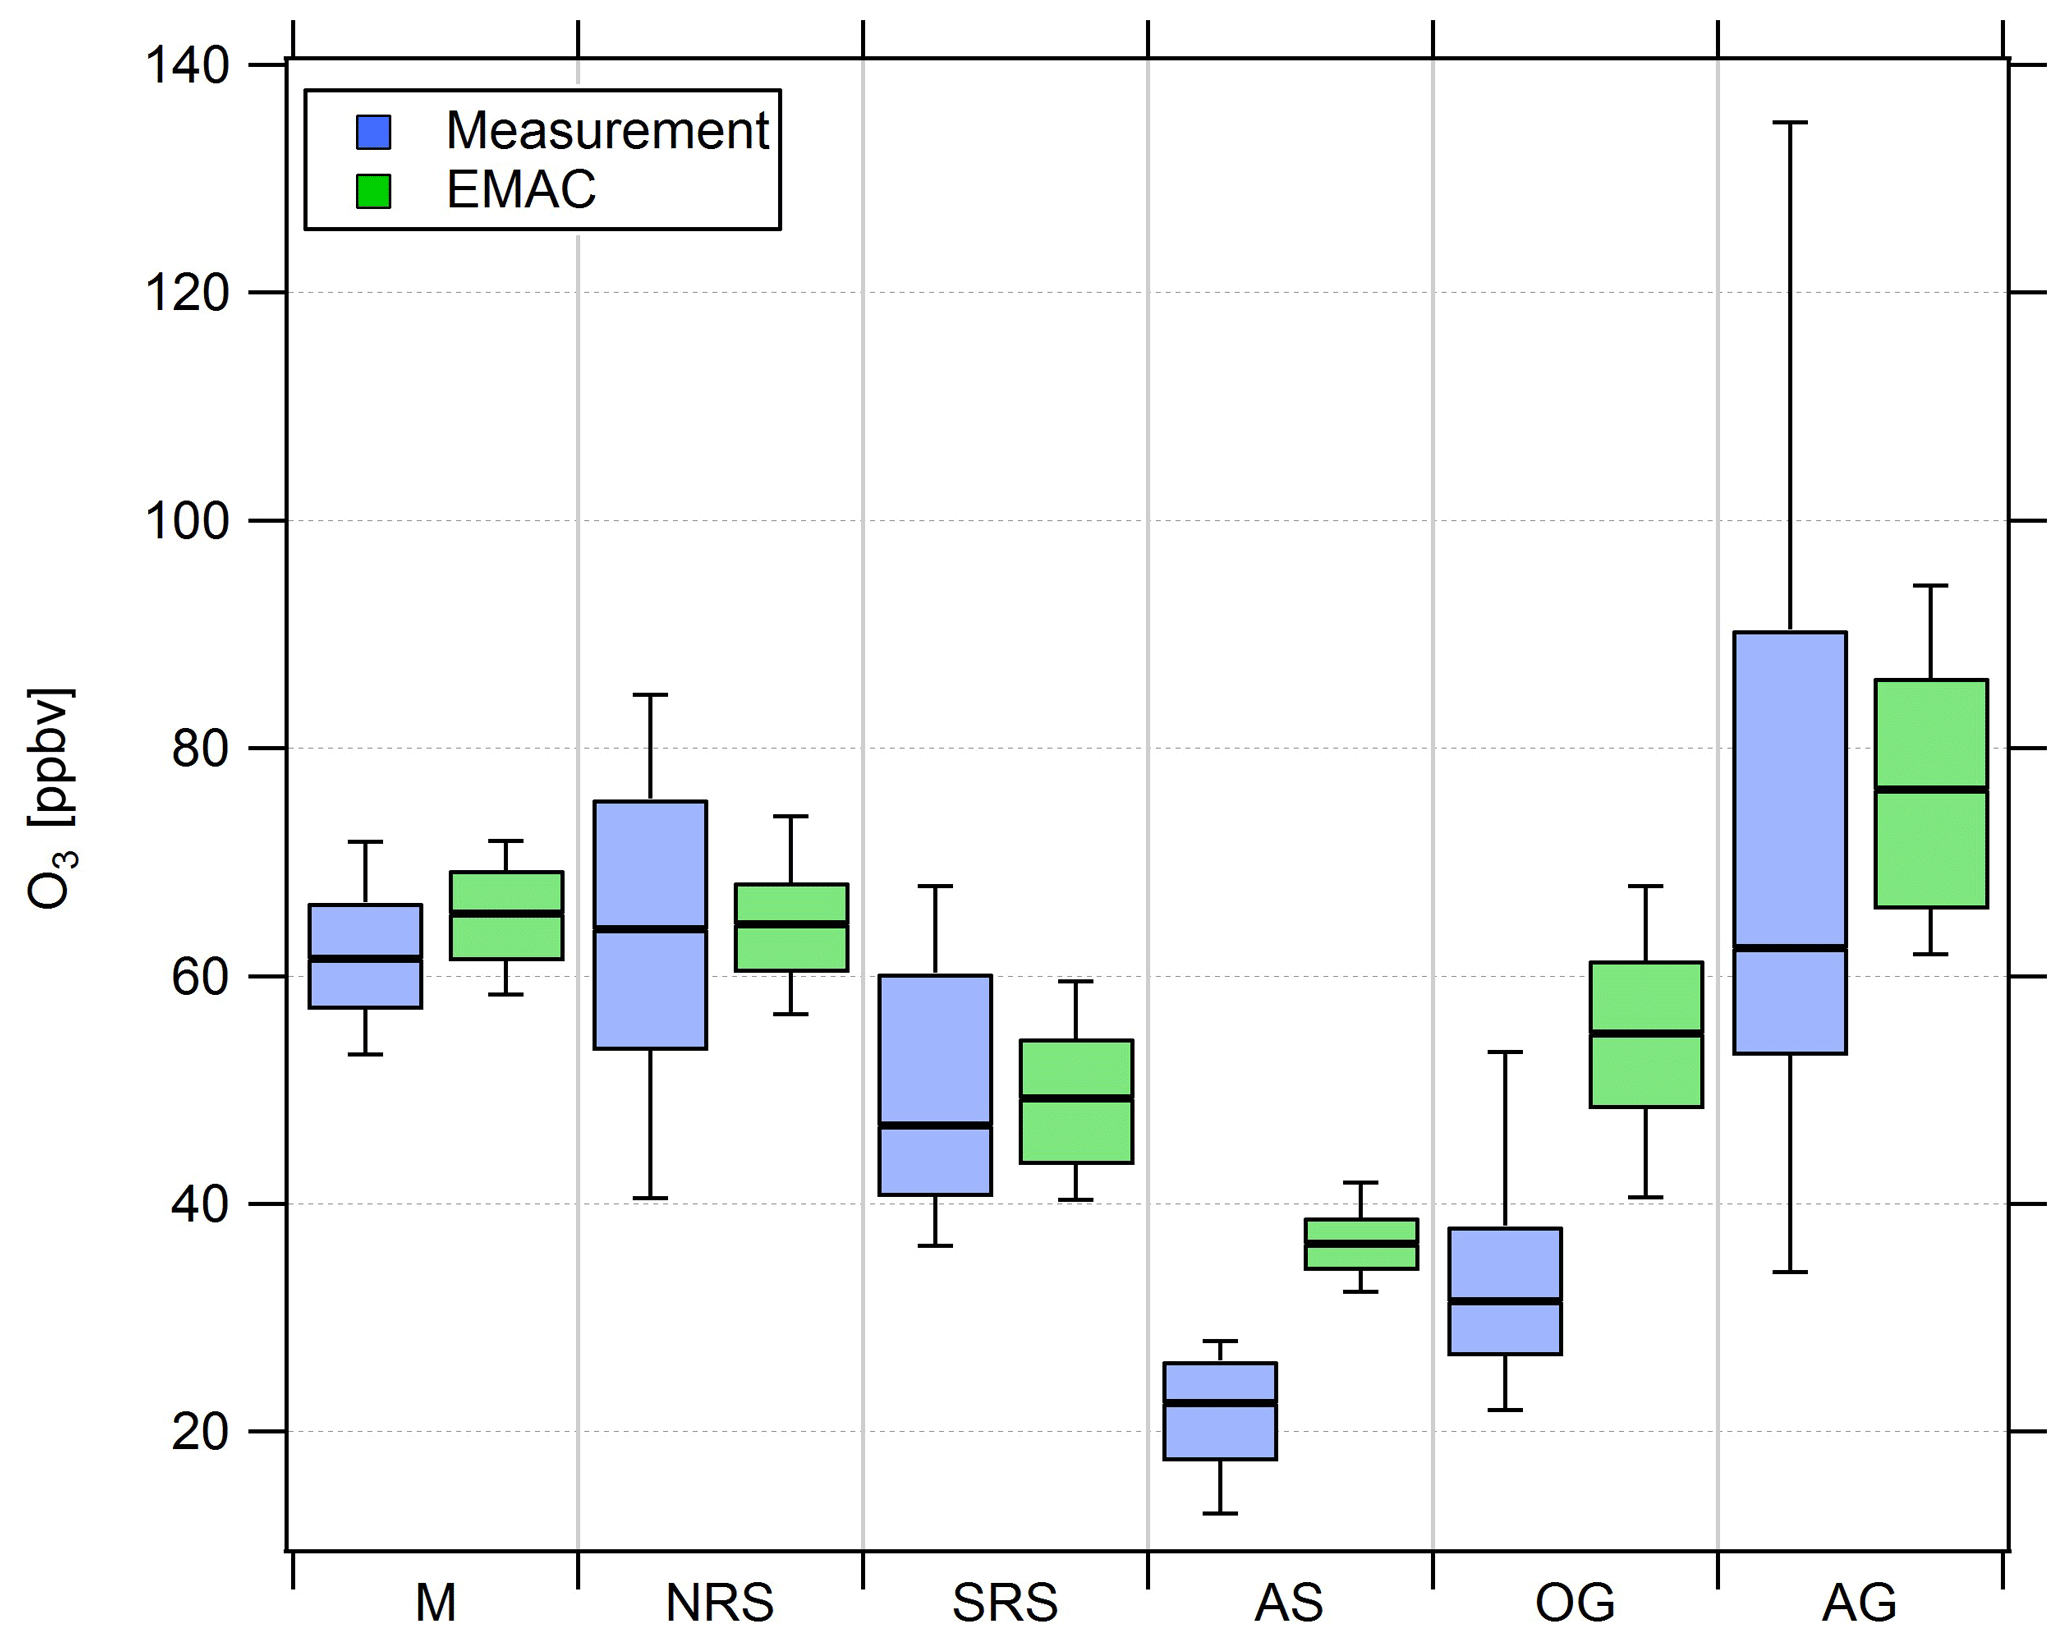
Figure 5Comparison of measured (blue) and simulated (green) O3 mixing ratios in the six different regions investigated during AQABA. The horizontal black bar indicates the median value, the box shows the 25th and 75th percentiles, and the whiskers show the 10th and 90th percentiles.
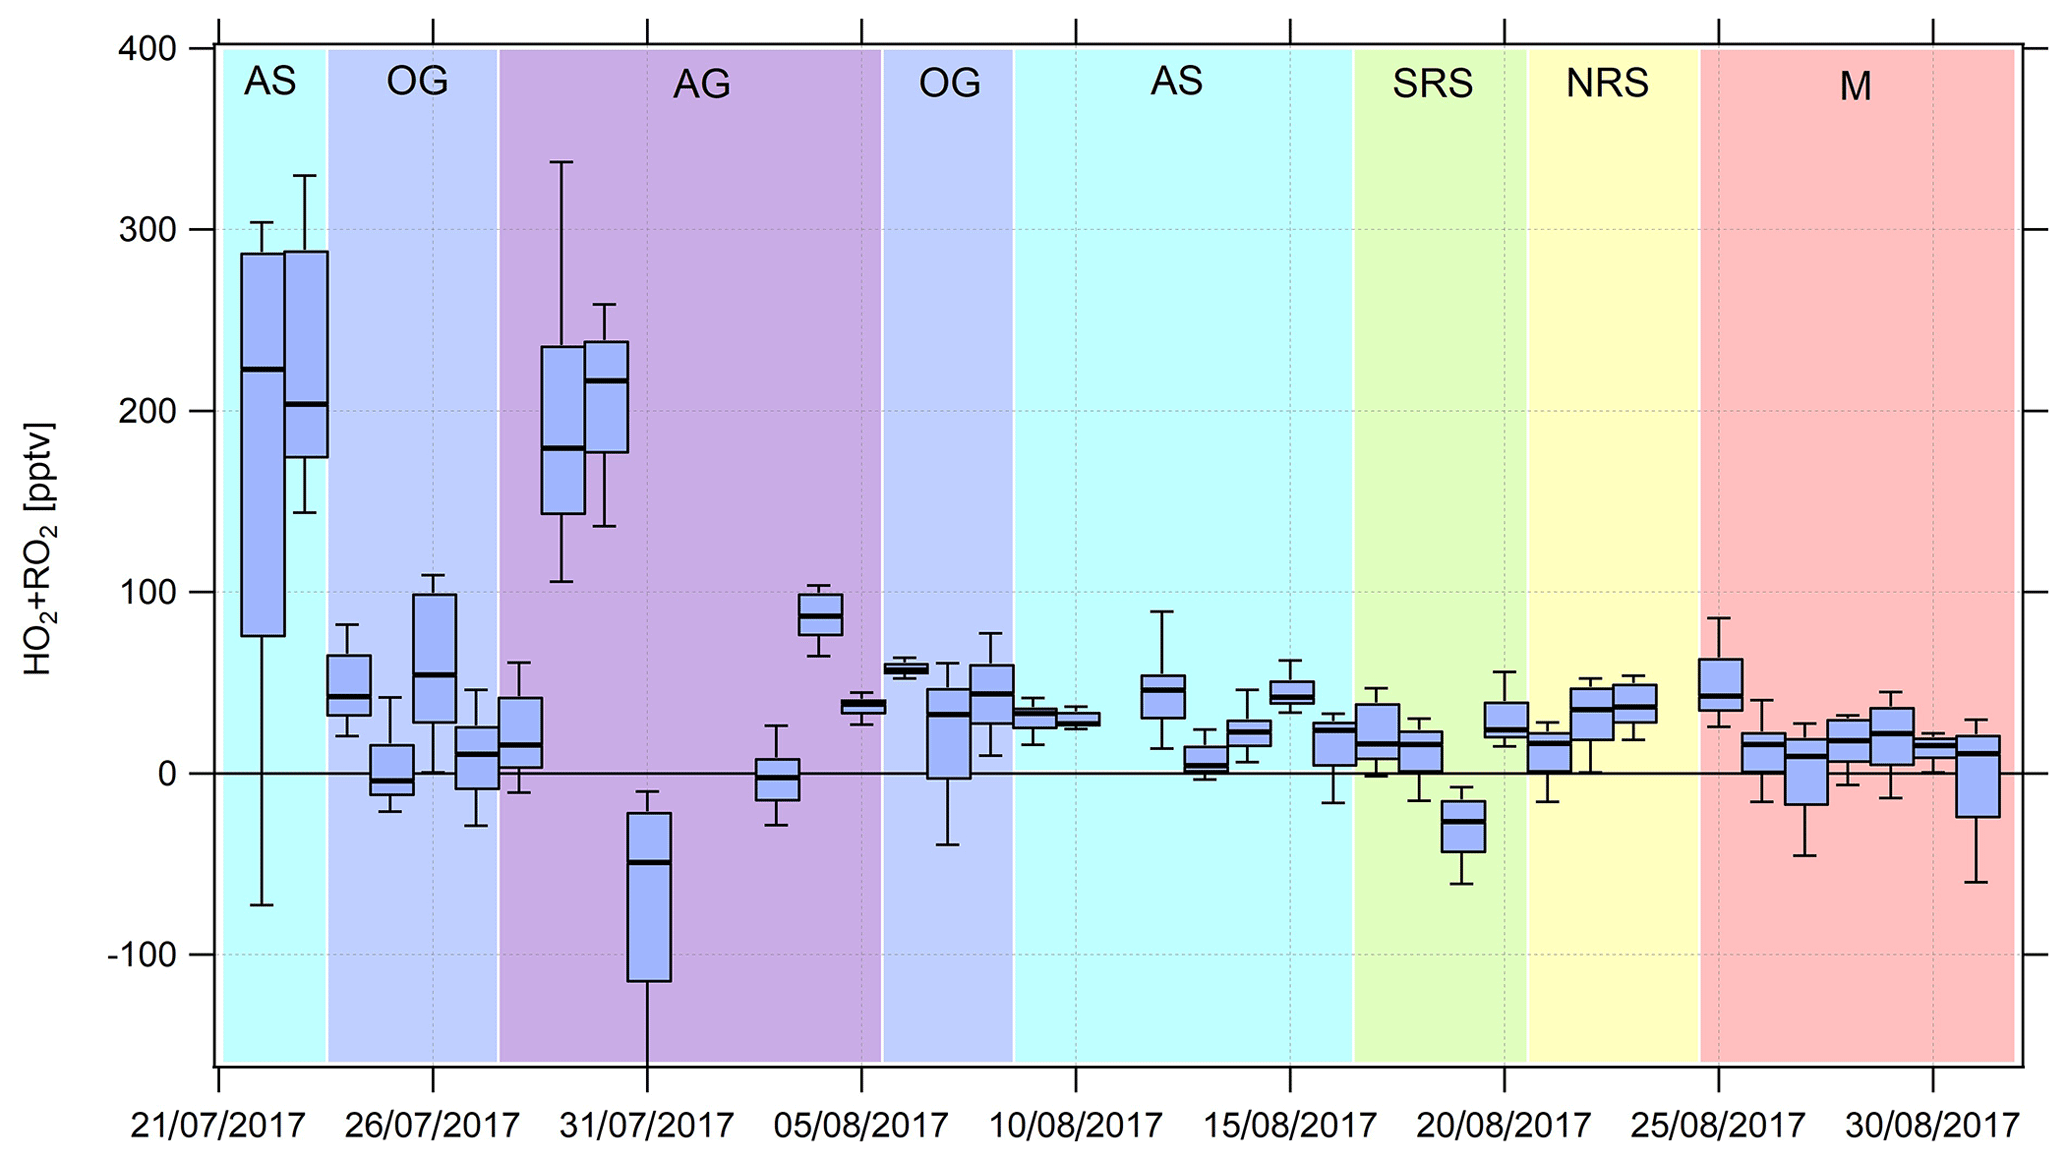
Figure 6Timeline of the median (HO2+RO2) noontime estimates from 22 July to 31 August 2017. Due to contamination from the ship's exhaust, there are no data from 18 to 21 July 2017. See Appendix A and the text for a list of the abbreviations used and a classification of the different regions, respectively.
Overall, we find that NOx mixing ratios over the northern Red Sea, the Gulf of Oman and the Arabian Gulf are approximately 1 order of magnitude higher than in the other three regions (the southern Red Sea, the Arabian Sea and the Mediterranean). The NOx medians over the Arabian Gulf, the northern Red Sea and the Gulf of Oman are 1.26, 1.76 and 2.74 ppbv, respectively. Lower median NOx mixing ratios were measured over the southern Red Sea (0.46 ppbv), the Mediterranean (0.25 ppbv) and the Arabian Sea (0.19 ppbv). With respect to observed O3 mixing ratios, the Arabian Sea is the only region that represents remote MBL conditions with the lowest median and mean O3 of 21.5 and 22.5 ppbv, respectively, followed by the Gulf of Oman where the median and mean O3 were 31.5 and 34 ppbv, respectively. The low O3 mixing ratios over the Arabian Sea were accompanied by the smallest variability (whisker interval of 15.1 ppbv). Although the highest NOx values were observed over the Oman Gulf, O3 observed over the Oman Gulf was amongst the lowest detected during the campaign, which can partly be explained by the fact that high NOx eventually leads to O3 destruction. The immediate vicinity of point sources in this region, which leads to higher NOx (before it is lost by reaction with OH and deposition to the surface) and titration of O3 (note the relatively low regional O3 median of 31.5 ppbv), may partly explain why NOx was highest over the Gulf of Oman. However, a significantly larger whisker interval (31.4 ppbv) for observed O3 over the Gulf of Oman indicates increasing amounts of pollution and advection from the Arabian Gulf, where extreme O3 events were observed several times during the campaign with maximum mixing ratios of up to 170 ppbv when the wind was coming from Kuwait/Iraq. Please note that the wind was coming from Iran during the second leg of the cruise (Pfannerstill et al., 2019). The whisker interval over the Arabian Gulf was 100.9 ppbv, which was more than 6 times higher than that over the Arabian Sea. The reasons for the large variations in both NOx and O3 over the Arabian Gulf were a multitude of point sources as well as a change in the observed wind direction, with air masses coming from the Iraq/Kuwait area during the first leg and air masses coming from Iran during the second leg (Pfannerstill et al., 2019). Over the Mediterranean, the northern Red Sea and the southern Red Sea, median O3 was 61.5, 64.2 and 46.9 ppbv, respectively. The whisker intervals over the northern Red Sea and the southern Red Sea were 44.2 and 31.6 ppbv, respectively. Air masses over the Mediterranean were characterized as photochemically aged due to the impact of northerly winds (etesians) which bring processed/oxidized air from eastern Europe (Turkey and Greece) to the Mediterranean area (Derstroff et al., 2017; Pfannerstill et al., 2019). This photochemical aging/oxidation over the Mediterranean leads to a rather small whisker interval of 18.7 ppbv for O3. In summary, the median NOx over the Oman Gulf was 56 % and 117 % higher than over the northern Red Sea and the Arabian Gulf, respectively. However, the highest NOx average of 4.69 ppbv was measured over the northern Red Sea and was similar to the values observed over the Oman Gulf (4.16 ppbv) and the Arabian Gulf (3.65 ppbv). Note that highest NOx mixing ratios over the Oman Gulf and over the northern Red Sea are not always associated with high O3 mixing ratios. We find that average O3 was highest over the Arabian Gulf (74 ppbv) followed by the northern Red Sea region (63.4 ppbv). The average O3 mixing ratio over the Oman Gulf was 34 ppbv, which corresponds to 46 % of the value observed over the Arabian Gulf. Photochemically aged air masses over the Mediterranean Basin show an O3 average of 61.6 ppbv, and air masses encountered over the northern Red Sea (O3 median of 64.2 ppbv and O3 mean of 63.4 ppbv) are comparable to the Arabian Gulf.
Due to a number of large pollution sources in the region around the Arabian Peninsula, such as passing ships, highly urbanized areas, and on- and offshore petrochemical processing, NOx levels were rarely as low as those found in remote locations, such as over the South Atlantic (Fischer et al., 2015), where NOx levels may be under 20 pptv. Apart from a few occasions where NOx was below 50 pptv for short periods (the Arabian Sea, the southern Red Sea and the Mediterranean), NOx levels during AQABA generally ranged from 100 pptv to several parts per billion by volume. The campaign NOx median of 0.65 ppbv and the mean value of 2.51±5.84 ppbv is comparable to urban sites (Kleinman et al., 2005). A detailed emission density analysis performed by Johansson et al. (2017) showed that NOx emissions on and around the Arabian Peninsula are amongst the highest worldwide, which could explain the rather high NOx level in the MBL around the peninsula (Johansson et al., 2017; Pfannerstill et al., 2019). O3 mixing ratios measured during AQABA were also very variable with O3 mixing ratios ranging between less than 20 ppbv in the remote MBL (Fischer et al., 2015) to 60–70 ppbv in the Mediterranean (which are values consistent with previous ship-based measurements in the region; Kouvarakis et al., 2002) and as high as 150 ppbv measured over the Arabian Gulf region. The latter value is consistent with O3 mixing ratios reported from regions influenced by oil and gas processing (Pfannerstill et al., 2019) and shipping lanes such as the Houston Ship Channel (Mazzuca et al., 2016).
Figure 4 also shows that the general trend of NOx mixing ratios in the different regions is widely reproduced by the EMAC model. We find that the median NOx(model) ∕ NOx(measurement) ratio of all 5 min averaged data points for the whole campaign is 0.91, indicating that the model underestimates NOx by roughly 10 %. The average ratio and its standard deviation are significantly larger at 2.57 and 5.71, respectively, indicating that single modeled data points strongly exceed the measurements, especially during periods of low in situ NOx (see Fig. S6). Particularly over the Arabian Sea and the southern Red Sea, the model generally simulates NOx mixing ratios higher than 100 and 200 pptv, respectively, whereas the measurements indicate mixing ratios of less than 50 pptv for certain periods. Furthermore, as expected, the model is not able to reproduce point sources, such as passing ships, for which we observe a significant underestimation of the measured NOx. For O3, we find that the median O3(model) ∕ O3(measurement) ratio throughout the campaign is 1.23, indicating that the model overestimates O3 by about 23 % over the course of the campaign. This could partly be related to the same limitation, i.e., the inability of the model to resolve point sources in which O3 is locally reduced due to titration by NO. While the model is in rather good agreement with the measurements over the Mediterranean, the northern Red Sea and southern Red Sea, large deviations are found over the Arabian Sea and the Oman Gulf, where the model overestimation with respect to the regional median is 63 % and 75 %, respectively. A possible explanation for the overestimation of both O3 and NOx in pristine regions, such as over the Arabian Sea and the Oman Gulf, could be related to the model resolution. Interpolation of model simulations along the Kommandor Iona ship track close to the coast at this resolution will most likely incorporate contributions from nearby land areas that are affected by anthropogenic emissions. See Tables S3 and S4 for further information and Figs. S6 and S7 for additional scatterplots of measured and simulated regional median NOx and O3, respectively.
3.2 Estimation of (HO2+RO2) around the Arabian Peninsula
Noontime (HO2+RO2) was estimated based on Eq. (3). As the steady-state assumption will not hold for air masses that originate from fresh emissions (the times to acquire steady state estimated from the inverse sum of the loss and production terms for NO2 typically ranged from 1 to 2 min during AQABA) and for fast changes in the actinic flux, we calculated box and whiskers plots for ±2 h around noontime for which we expect relatively minor changes in the actinic flux (Fig. 6). Noontime of each day was approximated by applying a Gaussian fit routine to the measured j(NO2) values, whereas j(NO2) values less than 10−3 s−1 were neglected. Due to the availability of OH and data from 18 July 2017 onwards, we limited the analysis to this period. Note that there are no noontime (HO2+RO2) estimates from 18 to 21 July due to contamination from the ship's exhaust and on 24 August 2017 due to missing data. The black bar in Fig. 6 indicates the median value, the box intervals mark the 25th and 75th percentiles, and the whiskers show the 10th and 90th percentiles. Figure 7 shows the summarized regional trends of the (HO2+RO2) estimates for measured and simulated data.

Figure 7Comparison of box and whiskers plots of the regional estimated noontime (HO2+RO2) median based on measured data and simulated (HO2+RO2) data for the period from 18 July 2017 onwards.
The relative uncertainty R([HO2]+[RO2]) associated with the (HO2+RO2) estimate was calculated by the error propagation of Eq. (3).
Over the course of the campaign, the median relative (HO2+RO2) uncertainty was 74 %. The average was 176 %, it was heavily biased by single data outliers, and was consequently not representative. Hence, the relative error associated with the (HO2+RO2) calculation is estimated to be 74 %. Note that our calculation assumes that errors in the rate coefficients used are negligible.
We find median noontime (HO2+RO2) mixing ratios over the Mediterranean, the northern Red Sea, the southern Red Sea, the Arabian Sea and Oman Gulf of 16, 28, 15, 33 and 22 pptv, respectively, with each respective 75th percentile RO2 being equal to or less than 54 pptv. Only over the Arabian Gulf, the RO2 estimate yields a median noontime mixing ratio of 73 pptv which is accompanied by the largest variations in the box interval of the whole campaign. While the box interval of the (HO2+RO2) estimate in the other regions is 25–57 pptv, the box interval over the Arabian Gulf is significantly higher at 165 pptv. Negative values for all regions are regularly found in the vicinity of fresh emissions and air masses not in photochemical equilibrium. The elevated 90th percentile over the Arabian Sea is due to high (HO2+RO2) estimates during the first leg on 22 and 23 July.
Estimated (HO2+RO2) mixing ratios based on measured tracer data are in general agreement with previous studies performed in MBL environments which report maximum mixing ratios between 30 and 55 pptv around noontime (Hernandez et al., 2001). As peroxy radicals are short-lived molecules generated from the oxidation of VOCs, enhanced (HO2+RO2) concentrations observed over the Arabian Gulf are most likely due to high VOC emissions from intense oil and gas activities in the region (Bourtsoukidis et al., 2019; Pfannerstill et al., 2019). However, high HO2 and RO2 can also occur in aged air masses with low NOx and VOC concentration but significant O3 concentrations (and perhaps HCHO whose photolysis would then yield peroxy radicals). Bourtsoukidis et al. (2019) reported that spatial volume mixing ratios of ethane and propane over the Arabian Gulf were about a factor of 10–15 times higher than over the Arabian Sea and the southern Red Sea. We find that the median noontime (HO2+RO2)(measurement estimate) ∕ HO2(measurement) ratio throughout the whole campaign is 1.88. Note that HO2 may be higher than the (HO2+RO2) estimate on single days, which is within the uncertainty of the (HO2+RO2) estimate.
EMAC modeled, median noontime (HO2+RO2) mixing ratios estimated as the sum of simulated HO2 and all simulated peroxy radicals with less than four carbon molecules are 41, 46, 38, 41, 50 and 49 pptv over the Mediterranean, the northern Red Sea, the southern Red Sea, the Arabian Sea, the Oman Gulf and the Arabian Gulf, respectively. The observation-based (HO2+RO2) estimate yields 16, 28, 15, 33, 22 and 73 pptv, respectively. We find that the median point-by-point (HO2+RO2)(model) ∕ (HO2+RO2) (measurement estimate) ratio from 18 July onward is 1.05 so that, on average, the model overestimates the measurement by 5 %. Please note that the observational variability is much higher than the modeled variability and that the median of 1.05 is accompanied by a larger average (1.84) and a large variability (42.51). See Tables S5 and S6 for further information and Fig. S8 for an additional scatterplot of measured and simulated regional median (HO2+RO2).
3.3 Net O3 production rates around the Arabian Peninsula
In the following, net O3 production rates (at noon) are calculated based on Eq. (7) for the different regions. These noontime values are scaled to diurnal production rates (Fig. 8). As photochemical net O3 destruction is in good linear approximation with the actinic flux j(NO2), and as 46.1±2.8 % of the total j(NO2) occurred ±2 h around noon on average, the median noontime NOPR estimate was multiplied by to obtain a diurnal value. The error in the total actinic flux located ±2 h around noon is estimated from the standard deviation of the best estimate of 0.461 at Δs≈6 %. Due to contamination from the ship's exhaust and due to the limited availability of OH and data (only from 18 July 2017 onwards), we limited the analysis to the period from 22 July to 31 August 2017. A comparison of the NOPRs estimated based on measured and simulated data for the different regions is shown in Fig. 9. A breakdown of the different terms of Eq. (7) in the six regions is included in Figs. S10–S13.

Figure 8Timeline of the diurnal NOPR from 22 July to 31 August 2017. NOPR calculations are limited to the time period from 22 July onwards due to missing HOx data and contamination from the ship's exhaust before this period. See Appendix A and the text for a list of the abbreviations used and a classification of the different regions, respectively.
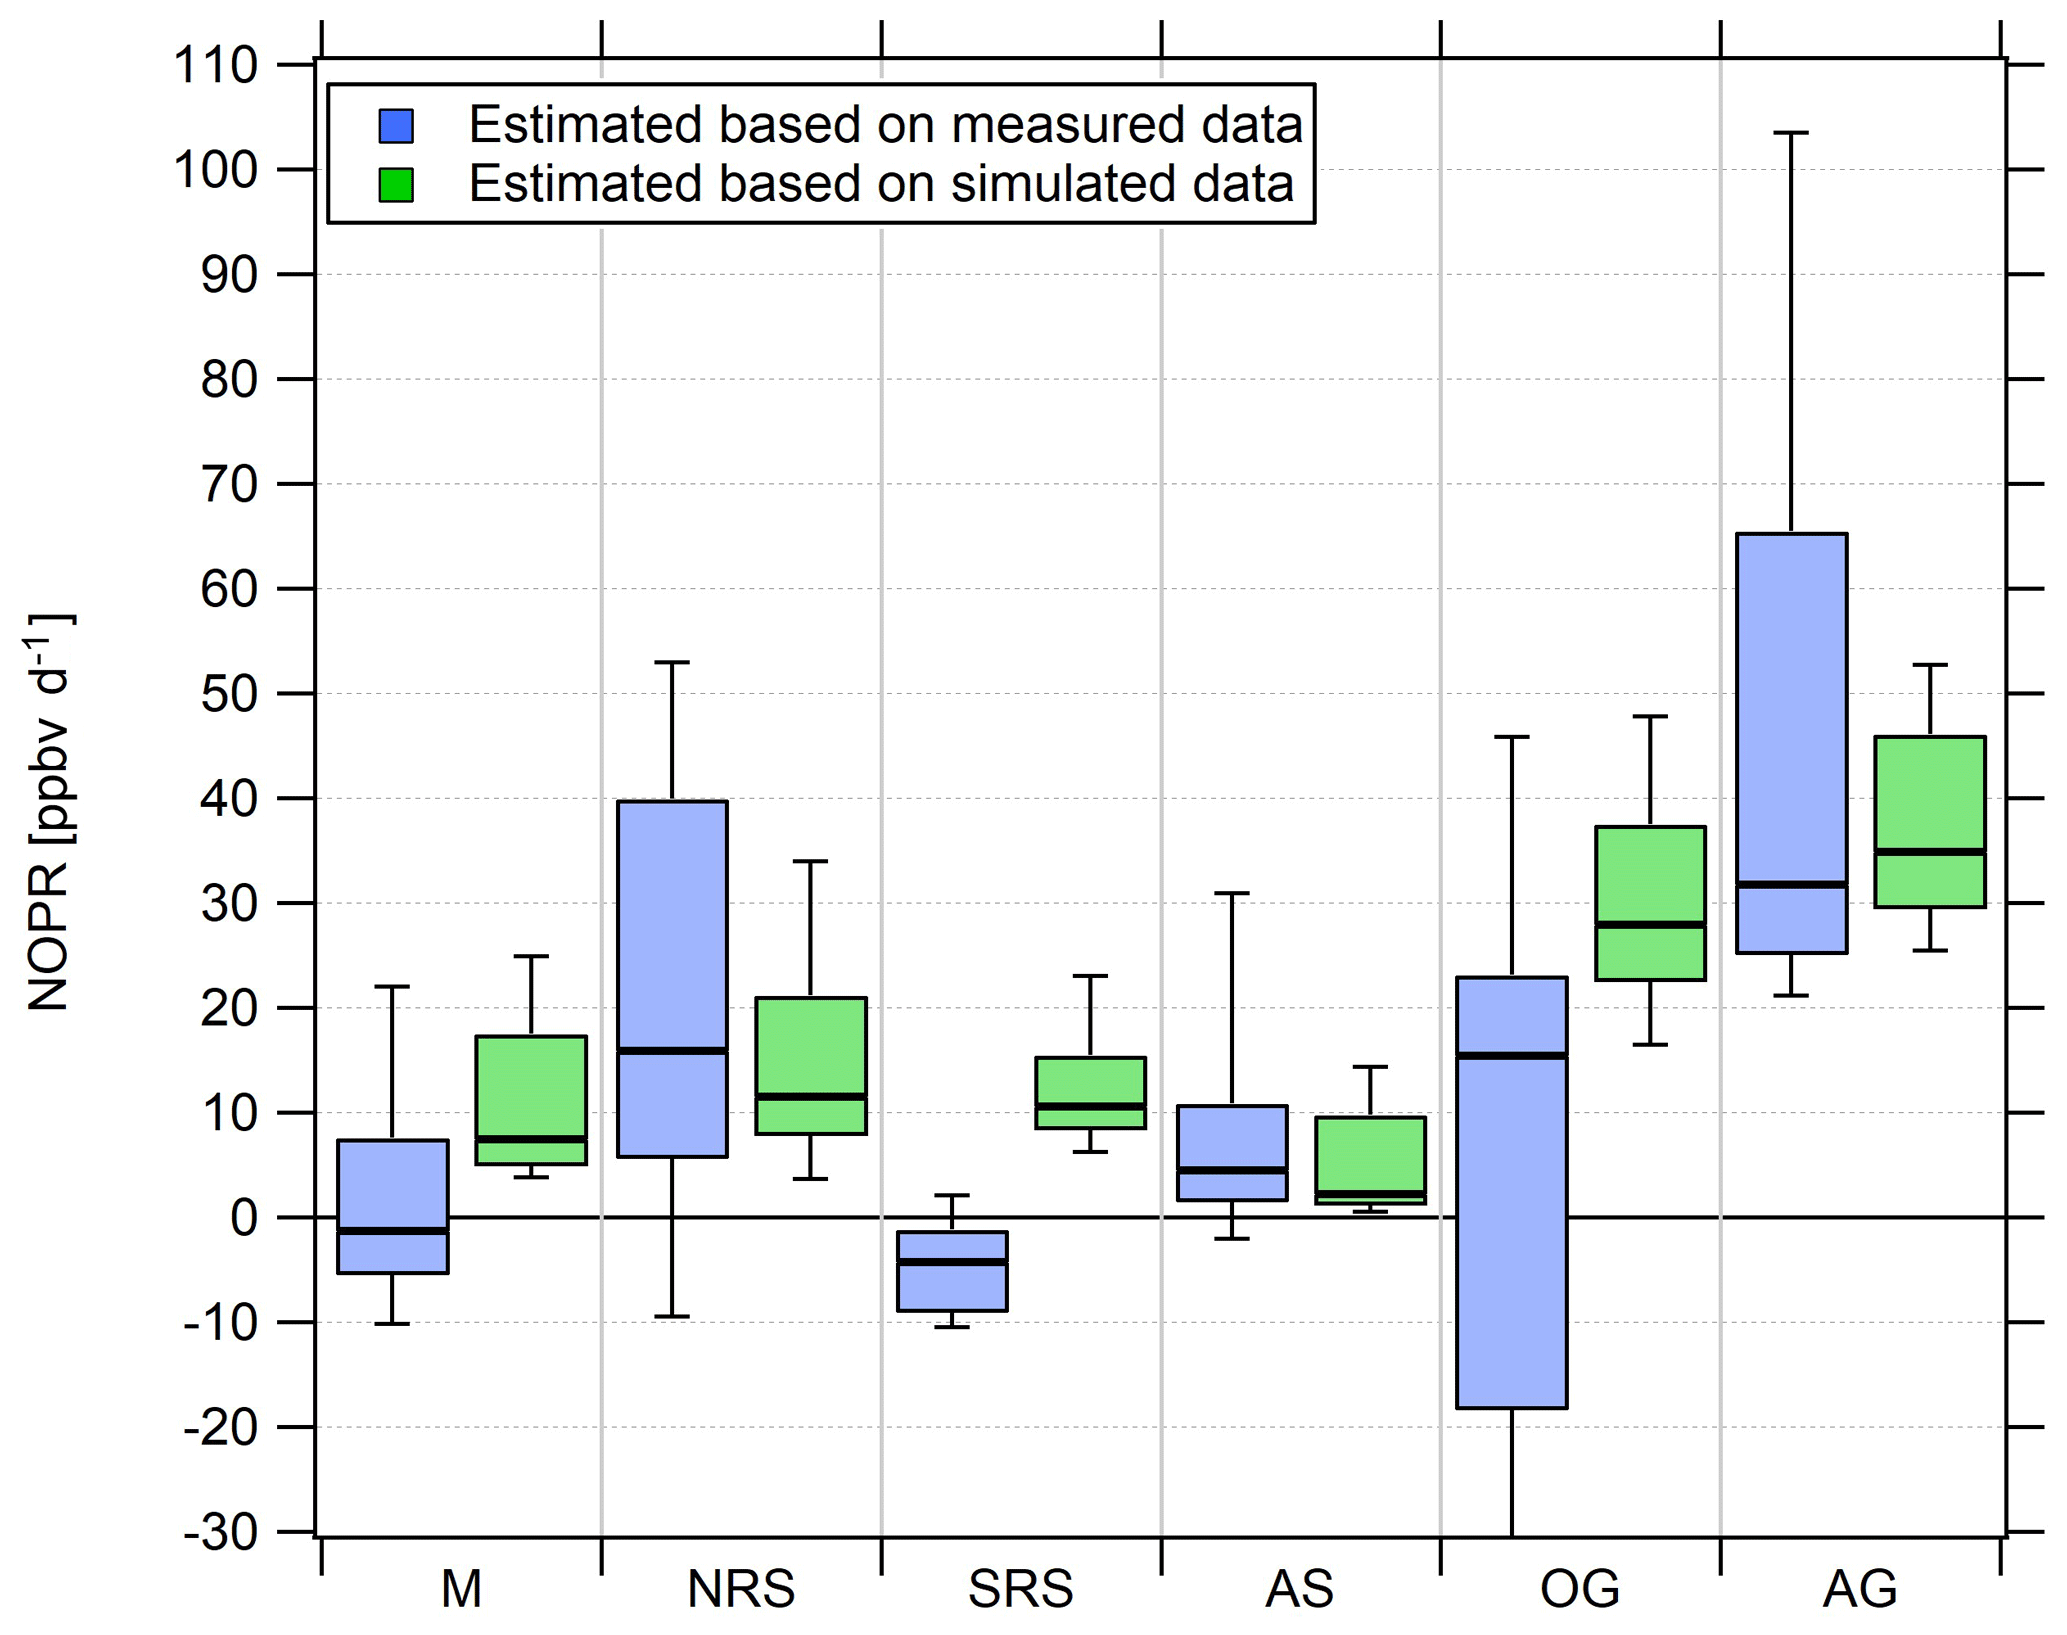
Figure 9Diurnal net O3 production rates in the different regions. Due to the magnitude of the pollution sources, the lower whisker of the NOPR estimate over the Oman Gulf is −324 ppb d−1.
The relative uncertainty associated with the NOPR estimate has been calculated by the error propagation of Eq. (7).
Incorporating a relative error of 74 % associated with (HO2+RO2), the median of the relative NOPR error of all data points obtained during AQABA is 91 %. The average relative uncertainty of the NOPR is 21 %, and it is strongly biased by single data outliers that are, in the case of the NOPR, significantly negative (due to fresh emissions and titration of O3 by NO). Again, the median is a more representative measure for the general uncertainty associated with the NOPR calculations. Hence, the relative error associated with the NOPR estimates based on measured data is estimated at 91 %.
Over the Mediterranean and the southern Red Sea, NOPR values do not significantly deviate from zero (production equals loss) within the atmospheric variability. The best estimate indicates slight net O3 destruction for the Mediterranean (−1 ppb d−1) and southern Red Sea (−4 ppb d−1) and slight net production for the Arabian Sea (5 ppb d−1), which is significantly positive within the variability of the box interval. Variations in NOPR calculated as the width of the 25th–75th percentile box yield comparable values of 9–11 ppb d−1 for these three regions. Substantial net O3 production was inferred over the Oman Gulf, the northern Red Sea and the Arabian Gulf with median values of 16, 16 and 32 ppb d−1, respectively. Especially over the Red Sea, we find a strong latitudinal gradient in net O3 production rates with higher values towards the northern end, whereas slight net O3 destruction of −4 ppb d−1 is reported over the southern part.
NOPR estimates for the Oman Gulf, the northern Red Sea and the Arabian Gulf are comparable to results reported for dense traffic shipping routes, such as the Houston Ship Channel, with NOPRs of a few tens of parts per billion per hour for periods of severe pollution (Zhou et al., 2014). Similar net O3 production rates were reported for regions of Beijing in summer in 2006 (Lu et al., 2010). For regions with low anthropogenic influence, such as the southern Red Sea and the Arabian Sea, we estimate net O3 production that does not differ significantly from zero. This is due to the rather low NOx mixing ratios in the clean MBL (Bozem et al., 2017). Note that we calculated net O3 destruction for only a few days over the southern Red Sea and the Arabian Sea, indicating that the marine boundary layer around the Arabian Peninsula is rarely free from anthropogenic influence owing to the multitude of on- and offshore anthropogenic activities.
We find that model-calculated estimates of the NOPR reproduce the trends observed for the NOPR calculated from in situ measurements except over the Mediterranean and the southern Red Sea. Although EMAC predicts high O3 levels over the Arabian Sea, it also reports the lowest NOPR in this region. Conversely, the large overestimation of the model-calculated NOPR value against that based on measured tracer data over the Mediterranean and over the southern Red Sea could be linked to NOx being overestimated in the model in these regions. In the model, pollution emissions, especially over the Oman Gulf and the Arabian Gulf, seem to be averaged over a large (1.1∘ grid size) region. Hence, high background concentrations of O3 precursors contribute to net O3 production rates that compare to conditions observed in the Houston case (Zhou et al., 2014). Even in more pristine regions, such as over the southern Red Sea and the Arabian Sea, the model is not able to reproduce net O3 destruction, which is consistent with the fact that the O3 is generally too high and that NOx levels below 0.1 ppbv are not found in the model. See Tables S7 and S8 for further information and Fig. S9 for an additional scatterplot of measured and simulated regional NOPR.
Measured OH and as well as (HO2+RO2) estimated based on measured data generally underestimate the associated simulated data. Speaking in terms of absolute amounts, we find that the breakdown loss and productions terms of Eq. (7) (the NOPR) based on measured data generally underestimate the results based on simulated data. The deviations between measurements and the model basically represent the differences observed in the noontime concentrations of the tracers mentioned. The largest deviations of the breakdown loss terms, associated with the reactions of O3 with OH and HO2, are found over the OG and AG, where OH and HO2 are also significantly overestimated in the model. In the case of , a slight overestimation of the value based on the simulated data compared with the value based on measured data is observed. This is due to simulated absolute humidity being slightly higher than the concurrent measured data. Moreover, we find that the breakdown production term estimated based on the simulated data is generally larger than the estimate based on measured data. This basically reflects that noontime (HO2+RO2) is overestimated in the model by a factor of 2, except for the Arabian Gulf where fair agreement is found.
3.4 VOC and NOx sensitivity
Ozone is photochemically formed when its precursors NOx and VOCs are abundant in the presence of sunlight (Bozem et al., 2017; Jaffe et al., 2018). In order to determine whether a chemical system is NOx- or VOC-limited or in a transition between those two regimes, one has to estimate the total amount of OH reactivity towards VOCs and towards NOx. Therefore the VOC ∕ NOx ratio is an important indicator of the behavior of NOx, VOCs and O3 in a system. Since it is not feasible to precisely define all ambient VOCs (there could be thousands), formaldehyde mixing ratios have been used as a proxy for the OH reactivity towards VOCs, as it is a short-lived oxidation product of many VOCs that is often positively correlated with peroxy radicals (Sillman et al., 1995; Duncan et al., 2010). Sillman et al. (1995) first used afternoon concentrations of indicator species such as HCHO and total reactive nitrogen (NOy) to determine the sensitivity of O3 production to VOCs or NOx. Their approach was later successfully transferred to space-based satellite observations by using the ratio of tropospheric columns of HCHO and NO2 to determine the sensitivity of O3 production to precursors (Martin et al., 2004). Here, we use HCHO ∕ NO2 ratios (referred to here as “Ratio”) deduced by Duncan et al. (2010) as indicators for the sensitivity of O3 production to NOx limitations and VOC limitations in megacities in the United States that have large amounts of anthropogenic NOx and VOC emissions. Ratio is an indicator of surface photochemistry as most of the atmospheric column of HCHO and NO2 is located in the planetary boundary layer (Duncan et al., 2010). Duncan et al. (2010) have derived NOx-limited O3 production regimes for HCHO ∕ NO2 >2 and VOC-limited O3 production for HCHO ∕ NO2 <1. For 1<HCHO∕NO2<2, both NOx and VOC emission reductions may lead to a reduction in O3. Figure 10 shows the box and whiskers plot classification of the HCHO∕NO2 ratio of the different regions during noontime.
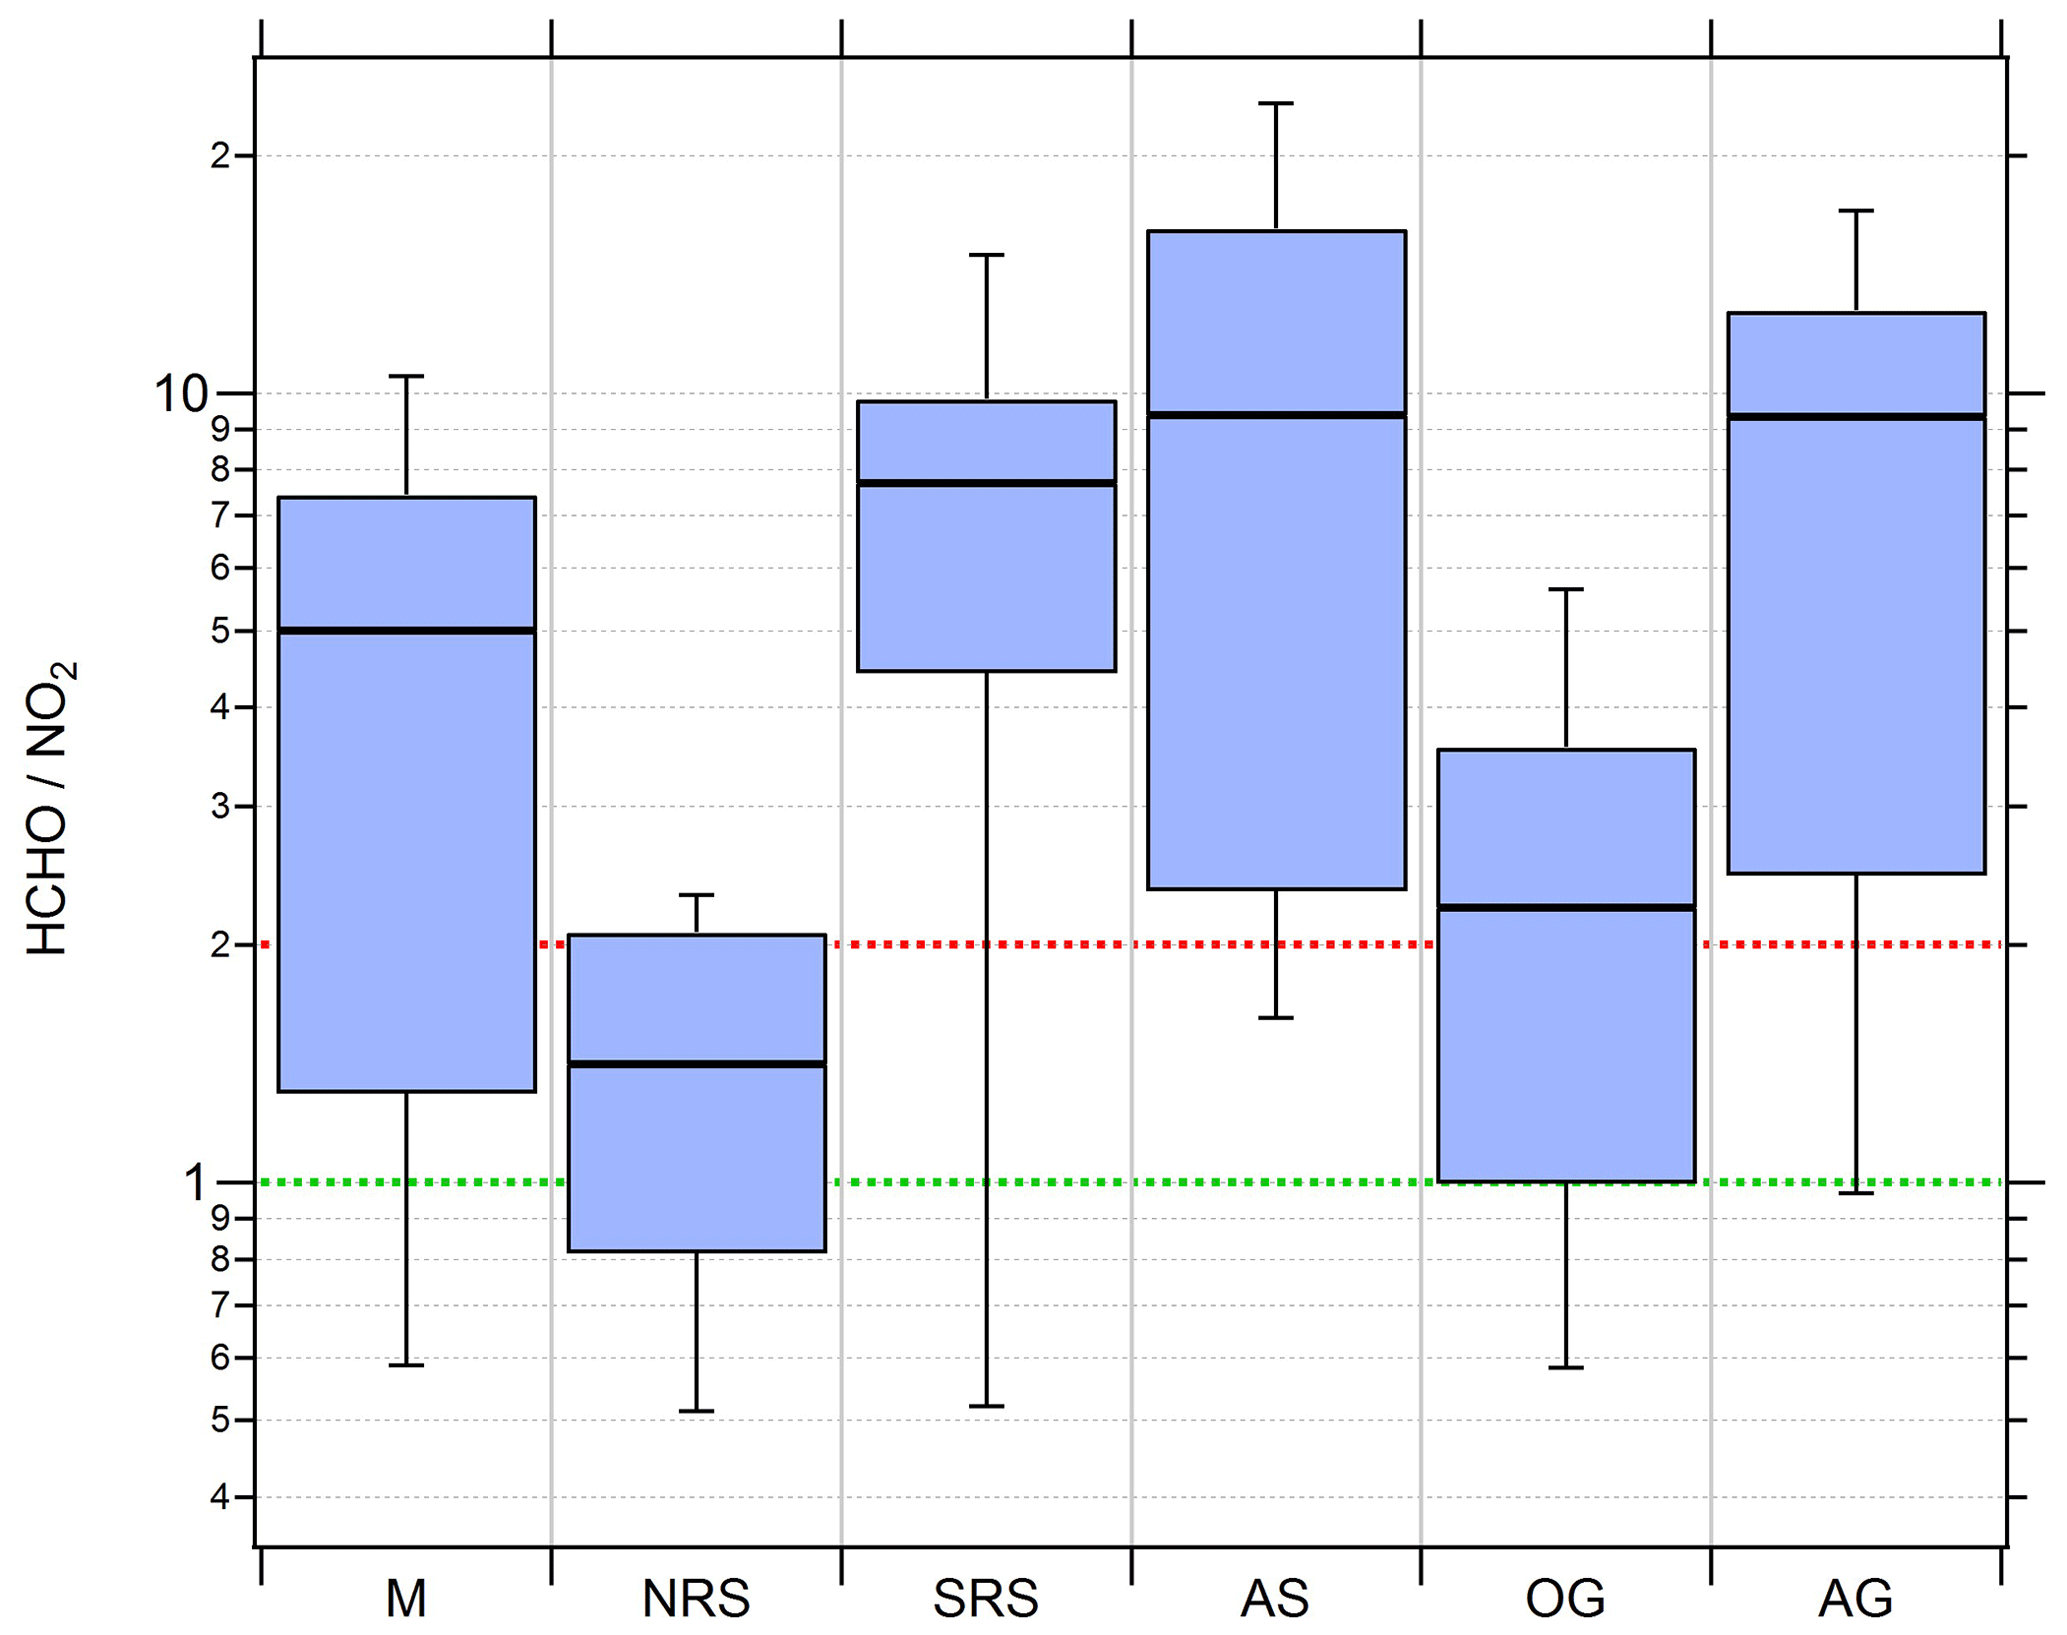
Figure 10Box and whiskers plots of the HCHO ∕ NO2 ratio for the different regions with the black bar indicating the median value. Red (ratio of 2) and green (ratio of 1) lines indicate the limits for HCHO∕NO2 deduced by Duncan et al. (2010) for NOx limitation and VOC limitation, respectively.
Median HCHO ∕ NO2 ratios of 5, 7.7, 9.4 and 9.3 over the Mediterranean, the southern Red Sea, the Arabian Sea and the Arabian Gulf, respectively, indicate tendencies towards NOx-limited regimes. In a previous study based on measured OH reactivity, Pfannerstill et al. (2019) classified these regions as being mostly in a transition between NOx limitation and VOC limitation, with a tendency towards NOx limitation. Median HCHO∕NO2 ratios of 1.4 and 2.2 estimated over the northern Red Sea and the Oman Gulf, respectively, signify tendencies towards VOC limitation. However, none of the medians of the six regions fall below the VOC limit deduced by Duncan et al. (2010).
Over the Red Sea, we find a latitudinal gradient in the HCHO∕NO2 ratio that is similar to the gradients for NOx and the NOPR. Due to very low NOx over the southern Red Sea, O3 production is NOx limited, changing into a more VOC-limited regime over the northern Red Sea. Ozone production over the Mediterranean was classified as rather NOx limited; however, it is partly in the transition regime between NOx limitation and VOC limitation, which can be explained by a multitude of (NOx) emissions from nearby situated vessels during measurements obtained on 29 August 2017 when at anchor off Malta. Average noontime NOx on that particular day was about 3 times as large as the regional average noontime NOx observed over the whole Mediterranean area. NOx limitation is also inferred for the relatively clean Arabian Sea and the polluted Arabian Gulf atmosphere. Note that a further increase in NOx emissions from shipping in the Arabian Gulf may initially lead to higher O3 production. However, a further increase in NOx might eventually lead to a change from NOx sensitivity to VOC sensitivity and a decrease in O3 production for this region, as observed for the Oman Gulf (median HCHO∕NO2 ratio of 2.2 and average O3 of 34 ppbv). See Table S9 for detailed statistics on regional HCHO∕NO2 ratios.
In situ observations of NO, NO2, O3, HCHO, OH, HO2, absolute humidity, the actinic flux, temperature and pressure were carried out in the MBL around the Arabian Peninsula during the AQABA ship campaign from late June to early September 2017. Concentration ranges of both NOx and O3 clearly showed anthropogenic influence in the MBL. NOx was highest over the Arabian Gulf, the northern Red Sea and the Oman Gulf. The lowest NOx values were observed over the Arabian Sea and over the southern Red Sea during the second leg of the cruise. O3 mixing ratios were highest over the Arabian Gulf. We observed a latitudinal gradient in O3 concentrations with higher values towards the northern part of the Red Sea. Although comparable O3 averages were measured over the northern Red Sea and over the Mediterranean, lower variability over the Mediterranean towards the end of August 2017 indicates photochemically more extensively aged air masses. The lowest regional O3 mixing ratio average was detected over the Arabian Sea, which is broadly comparable to remote MBL conditions in the Northern Hemisphere.
Noontime (HO2+RO2) estimates based on deviations from the Leighton ratio yield median values around the Arabian Peninsula of 15–33 pptv for all regions except over the Arabian Gulf where the median is 73 pptv. The uncertainty due to the missing upwelling actinic flux portion is expected to be insignificant. Furthermore, we estimated noontime and diurnal NOPR based on Eq. (6) and the integral over the actinic flux. The highest diurnal NOPRs were observed over the Oman Gulf, the northern Red Sea and the Arabian Gulf with median values of 16, 16 and 32 ppbv d−1, respectively, which is in agreement with previous studies that predicted net photochemical O3 formation conditions in the region. Net O3 destruction was only observed for a few days with clean conditions over the Arabian Sea and the southern Red Sea. Based on HCHO∕NO2 ratios, our analysis suggests tendencies towards NOx limitation over the Mediterranean, the southern Red Sea, the Arabian Sea and the Arabian Gulf and VOC limitation over the northern Red Sea and the Oman Gulf, which reproduces the trends observed by Pfannerstill et al. (2019).
NOx results from the EMAC general circulation model underestimate the measurement data by 10 %, whereas median modeled O3 overestimates the measurement by 23 %, with the latter being related to limitations in the model resolution in proximity to the coast and shipping lanes. Although EMAC generally reproduces regional NOx and O3 medians, the scatter when comparing both data sets is large. NOx is generally too low for polluted regions as it does not resolve local point sources and too high for clean regions. The lowest NOx value of less than 0.1 ppbv found in the in situ measurements is not reproduced by the model as emissions are averaged over a large area (1.1∘). Median noontime (HO2+RO2) values retrieved from the EMAC model are ∼5 % higher than (HO2+RO2) estimates based on measurement data; however, (HO2+RO2) deduced from EMAC is sometimes about a factor of 2 higher than the regional (HO2+RO2) estimate based on the Leighton ratio and measured tracer data. NOPR estimates based on modeled data reproduce the tendencies derived from the measurements very well. Nevertheless, the model does not reproduce observed net O3 destruction along some clean parts of the ship cruise.
Data used in this study are available to all scientists who agree to the AQABA protocol at https://doi.org/10.5281/zenodo.3693988 (Tadic and Fischer, 2019).
The supplement related to this article is available online at: https://doi.org/10.5194/acp-20-6769-2020-supplement.
IT, HF and JL designed the study. UP and IT performed the CLD NO and NO2 measurements and processed the data; JNC and PE performed the O3 measurements; JS performed the actinic flux measurements; JS performed the cavity ring-down spectroscopy measurements of NO2; DD and BH performed the HCHO measurements; HH, MM, RR, ST performed the OH and HO2 measurements; and JDP was responsible for the H2O measurements. Model simulations were carried out by AP. All authors contributed to writing this paper
The authors declare that they have no conflict of interest.
We acknowledge collaborations with the King Abdullah University of Science and Technology (KAUST), The Cyprus Institute (CyI) and the Kuwait Institute for Scientific Research (KISR). We would like to thank Marcel Dorf and Claus Koeppel for the organization of the campaign. We are grateful to Hays Ships Ltd. and the Kommandor Iona's crew for caring about the physical well-being of the scientific participants and for an unforgettable time on board. Last but not least, we would like to thank the whole AQABA community for a successful campaign.
The article processing charges for this open-access publication were covered by the Max Planck Society.
This paper was edited by Andreas Hofzumahaus and reviewed by two anonymous referees.
| General | |
| AQABA | Air Quality and Climate in the Arabian Basin campaign |
| CyI | The Cyprus Institute |
| KAUST | King Abdullah University of Science and Technology |
| KISR | Kuwait Institute for Scientific Research |
| Regions | |
| AG | Arabian Gulf |
| AS | Arabian Sea |
| M | Mediterranean Sea |
| NRS | Northern Red Sea |
| OG | Oman Gulf |
| SRS | Southern Red Sea |
| Scientific | |
| CLD | Chemiluminescence detector |
| CRDS | Cavity ring-down spectroscopy |
| ECHAM5 | Fifth-generation European Centre Hamburg general circulation model |
| EMAC | ECHAM/MESSy Atmospheric Chemistry model |
| FWHM | Full width at half maximum |
| HORUS | Hydroxyl Radical measurement Unit based on fluorescence Spectroscopy instrument |
| HOx | OH+HO2 |
| LED | Light-emitting diode |
| LIF | Laser-induced fluorescence |
| MBL | Marine boundary layer |
| MESSy | Modular Earth Submodel System |
| NOPR | Net ozone production rate |
| NOx | NO+NO2 |
| PFA | Perfluoroalkoxy |
| PSS | Photostationary steady state |
| PTFE | Polytetrafluoroethylene |
| SLM | Standard liter per minute |
| STEAM3 | Ship Traffic Emission Assessment Model 3 |
| TMU | Total measurement uncertainty |
| VOC | Volatile organic compounds |
| UV | Ultraviolet |
Atkinson, R., Baulch, D. L., Cox, R. A., Crowley, J. N., Hampson, R. F., Hynes, R. G., Jenkin, M. E., Rossi, M. J., and Troe, J.: Evaluated kinetic and photochemical data for atmospheric chemistry: Volume I – gas phase reactions of Ox, HOx, NOx and SOx species, Atmos. Chem. Phys., 4, 1461–1738, https://doi.org/10.5194/acp-4-1461-2004, 2004.
Bourtsoukidis, E., Ernle, L., Crowley, J. N., Lelieveld, J., Paris, J.-D., Pozzer, A., Walter, D., and Williams, J.: Non-methane hydrocarbon (C2–C8) sources and sinks around the Arabian Peninsula, Atmos. Chem. Phys., 19, 7209–7232, https://doi.org/10.5194/acp-19-7209-2019, 2019.
Bozem, H., Butler, T. M., Lawrence, M. G., Harder, H., Martinez, M., Kubistin, D., Lelieveld, J., and Fischer, H.: Chemical processes related to net ozone tendencies in the free troposphere, Atmos. Chem. Phys., 17, 10565–10582, https://doi.org/10.5194/acp-17-10565-2017, 2017.
Cantrell, C. A., Shetter, R. E., Calvert, J. G., Eisele, F. L., Williams, E., Baumann, K., William, H. B., Stevens, P. S., and Mather, J., H.: Peroxy radicals from photostationary state deviations and steady state calculations during the Tropospheric OH Photochemistry Experiment at Idaho Hill, Colorado, 1993, J. Geophys. Res., 102, 6369–6378, 1997.
Celik, S., Drewnick, F., Fachinger, F., Brooks, J., Darbyshire, E., Coe, H., Paris, J.-D., Eger, P. G., Schuladen, J., Tadic, I., Friedrich, N., Dienhart, D., Hottmann, B., Fischer, H., Crowley, J. N., Harder, H., and Borrmann, S.: Influence of vessel characteristics and atmospheric processes on the gas and particle phase of ship emission plumes: in situ measurements in the Mediterranean Sea and around the Arabian Peninsula, Atmos. Chem. Phys., 20, 4713–4734, https://doi.org/10.5194/acp-20-4713-2020, 2020.
Chen, S., Ren, X., Mao, J., Chen, Z., Brune, W. H., Lefer, B., Rappenglück, B., Flynn, J., Olson, J., and Crawford, J. H.: A comparison of chemical mechanisms based on TRAMP-2006 field data, Atmos. Environ., 44, 4116–4125, https://doi.org/10.1016/j.atmosenv.2009.05.027, 2010.
Crutzen, P. J.: Photochemical reactions initiated by and influencing ozone in unpolluted tropospheric air, Tellus, 26, 47–57, https://doi.org/10.1111/j.2153-3490.1974.tb01951.x, 1973.
Derstroff, B., Hüser, I., Bourtsoukidis, E., Crowley, J. N., Fischer, H., Gromov, S., Harder, H., Janssen, R. H. H., Kesselmeier, J., Lelieveld, J., Mallik, C., Martinez, M., Novelli, A., Parchatka, U., Phillips, G. J., Sander, R., Sauvage, C., Schuladen, J., Stönner, C., Tomsche, L., and Williams, J.: Volatile organic compounds (VOCs) in photochemically aged air from the eastern and western Mediterranean, Atmos. Chem. Phys., 17, 9547–9566, https://doi.org/10.5194/acp-17-9547-2017, 2017.
Duncan, B. N., Yoshida, Y., Olson, J. R., Sillman, S., Martin, R. V., Lamsal, L., Hu, Y., Pickering, K. E., Retscher, C., Allen, D. J., and Crawford, J. H.: Application of OMI observations to a space-based indicator of NOx and VOC controls on surface ozone formation, J. Atmos. Env., 44, 2213–2223, https://doi.org/10.1016/j.atmosenv.2010.03.010, 2010.
Drummond, J. W., Volz, A., and Ehhalt, D. H.: An optimized chemiluminescence detector for tropospheric NO measurements, J. Atmos. Chem., 2, 287–306, https://doi.org/10.1007/BF00051078, 1985.
Fischer, H., Pozzer, A., Schmitt, T., Jöckel, P., Klippel, T., Taraborrelli, D., and Lelieveld, J.: Hydrogen peroxide in the marine boundary layer over the South Atlantic during the OOMPH cruise in March 2007, Atmos. Chem. Phys., 15, 6971–6980, https://doi.org/10.5194/acp-15-6971-2015, 2015.
Hauglustaine, D. A., Madronich, S., Ridley, B. A., Walega, J. G., Cantrell, C. A., and Shetter, R. E.: Observed and model-calculated photostationary state at Mauna Loa Observatory during MLOPEX 2, J. Geophys. Res., 101, 14681–14696, https://doi.org/10.1029/95JD03612, 1996.
Hens, K., Novelli, A., Martinez, M., Auld, J., Axinte, R., Bohn, B., Fischer, H., Keronen, P., Kubistin, D., Nölscher, A. C., Oswald, R., Paasonen, P., Petäjä, T., Regelin, E., Sander, R., Sinha, V., Sipilä, M., Taraborrelli, D., Tatum Ernest, C., Williams, J., Lelieveld, J., and Harder, H.: Observation and modelling of HOx radicals in a boreal forest, Atmos. Chem. Phys., 14, 8723–8747, https://doi.org/10.5194/acp-14-8723-2014, 2014.
Hernandez, M. D. A., Burkert, J., Reichert, L., Stöbener, D., Meyer-Arnek, J., and Burrows, J. P.: Marine boundary layer peroxy radical chemistry during the AEROSOLS99 campaign: Measurements and analysis, J. Geophys. Res., 106, 20833–20846, https://doi.org/10.1029/2001JD900113, 2001.
Hollaway, M. J., Arnold, S. R., Challinor, A. J., and Emberson, L. D.: Intercontinental trans-boundary contributions to ozone-induced crop yield losses in the Northern Hemisphere, Biogeosciences, 9, 271–292, https://doi.org/10.5194/bg-9-271-2012, 2012.
Hosaynali Beygi, Z., Fischer, H., Harder, H. D., Martinez, M., Sander, R., Williams, J., Brookes, D. M., Monks, P. S., and Lelieveld, J.: Oxidation photochemistry in the Southern Atlantic boundary layer: unexpected deviations of photochemical steady state, Atmos. Chem. Phys., 11, 8497–8513, https://doi.org/10.5194/acp-11-8497-2011, 2011.
Jaffe, D. A., Cooper, O. R., Fiore, A. M., Henderson, B. H., Tonnesen, G. S., Russell, A. G., Henze, D. K., Langford, A. O., Lin, M., and Moore, T.: Scientific assessment of background ozone over the U.S.: Implications for air quality management, Elem. Sci. Anth., 6, 56, https://doi.org/10.1525/elementa.309, 2018.
Javed, U., Kubistin, D., Martinez, M., Pollmann, J., Rudolf, M., Parchatka, U., Reiffs, A., Thieser, J., Schuster, G., Horbanski, M., Pöhler, D., Crowley, J. N., Fischer, H., Lelieveld, J., and Harder, H.: Laser-induced fluorescence-based detection of atmospheric nitrogen dioxide and comparison of different techniques during the PARADE 2011 field campaign, Atmos. Meas. Tech., 12, 1461–1481, https://doi.org/10.5194/amt-12-1461-2019, 2019.
Jöckel, P., Kerkweg, A., Pozzer, A., Sander, R., Tost, H., Riede, H., Baumgaertner, A., Gromov, S., and Kern, B.: Development cycle 2 of the Modular Earth Submodel System (MESSy2), Geosci. Model Dev., 3, 717–752, https://doi.org/10.5194/gmd-3-717-2010, 2010.
Johansson, L., Jalkanen, J.-P., and Kukkonen, J.: Global assessment of shipping emissions in 2015 on a high spatial a temporal resolution, J. Atmos. Env., 167, 403–415, https://doi.org/10.1016/j.atmosenv.2017.08.042, 2017.
Keller-Rudek, H., Moortgat, G. K., Sander, R., and Sörensen, R.: The MPI-Mainz UV/VIS Spectral Atlas of Gaseous Molecules of Atmospheric Interest, Earth Syst. Sci. Data, 5, 365–373, https://doi.org/10.5194/essd-5-365-2013, 2013.
Kleinman, L. I., Daum, P. H., Lee, Y.-N., Nunnermacker, L. J., Springston, S. R. Weinstein-Lloyd, J., and Rudolph, J.: A comparative study of ozone production in five U.S. metropolitan areas, J. Geophys. Res.-Atmos., 110, D02301, https://doi.org/10.1029/2004jd005096, 2005.
Klonecki, A. and Levy, H.: Tropospheric chemical ozone tendencies in system: Their sensitivity to variations in environmental parameters and their application to a global chemistry transport model study, J. Geophys. Res., 102, 21221–21237, https://doi.org/10.1029/97JD01805, 1997.
Kormann, R., Fischer, H., de Reus, M., Lawrence, M., Brühl, Ch., von Kuhlmann, R., Holzinger, R., Williams, J., Lelieveld, J., Warneke, C., de Gouw, J., Heland, J., Ziereis, H., and Schlager, H.: Formaldehyde over the eastern Mediterranean during MINOS: Comparison of airborne in-situ measurements with 3D-model results, Atmos. Chem. Phys., 3, 851–861, https://doi.org/10.5194/acp-3-851-2003, 2003.
Kouvarakis, G., Vrekoussis, M., Mihailopoulos, N., Kourtidis, K., Rappenglueck, B., Gerasopoulos, E., and Zerefos, C.: Spatial and temporal variability of tropospheric ozone (O3) in the boundary layer above the Aegean Sea (eastern Mediterranean), J. Geophys. Res., 107, 8137, https://doi.org/10.1029/2000JD000081, 2002.
Krotkov, N. A., McLinden, C. A., Li, C., Lamsal, L. N., Celarier, E. A., Marchenko, S. V., Swartz, W. H., Bucsela, E. J., Joiner, J., Duncan, B. N., Boersma, K. F., Veefkind, J. P., Levelt, P. F., Fioletov, V. E., Dickerson, R. R., He, H., Lu, Z., and Streets, D. G.: Aura OMI observations of regional SO2 and NO2 pollution changes from 2005 to 2015, Atmos. Chem. Phys., 16, 4605–4629, https://doi.org/10.5194/acp-16-4605-2016, 2016.
Leighton, P. A.: Photochemistry of air pollution, Phys. Chem., 9, 130–131, 1961.
Lelieveld, J.: Strongly increasing heat extremes in the Middle East and North Africa (MENA) in the 21st century, Clim. Change, 137, 245–260, https://doi.org/10.1007/s10584-016-1665-6, 2016a.
Lelieveld, J., Dentener, F. J., Peters, W., and Krol, M. C.: On the role of hydroxyl radicals in the self-cleansing capacity of the troposphere, Atmos. Chem. Phys., 4, 2337–2344, https://doi.org/10.5194/acp-4-2337-2004, 2004.
Lelieveld, J., Hoor, P., Jöckel, P., Pozzer, A., Hadjinicolaou, P., Cammas, J.-P., and Beirle, S.: Severe ozone air pollution in the Persian Gulf region, Atmos. Chem. Phys., 9, 1393–1406, https://doi.org/10.5194/acp-9-1393-2009, 2009.
Lelieveld, J., Gromov, S., Pozzer, A., and Taraborrelli, D.: Global tropospheric hydroxyl distribution, budget and reactivity, Atmos. Chem. Phys., 16, 12477–12493, https://doi.org/10.5194/acp-16-12477-2016, 2016b.
Liu, F., Beirle, S., Zhang, Q., Dörner, S., He, K., and Wagner, T.: NOx lifetimes and emissions of cities and power plants in polluted background estimated by satellite observations, Atmos. Chem. Phys., 16, 5283–5298, https://doi.org/10.5194/acp-16-5283-2016, 2016.
Lu, K., Zhang, Y., Su, H., Brauers, T., Chou, C., Hofzumahaus, A., Liu, S., Kita, K., Kondo, K., Shao, M., Wahner, A., Wang, J., Wang, X., and Zhu, T.: Oxidant (O3+NO2) production processes and formation in regimes in Beijing, J. Geophys. Res., 115, D07303, https://doi.org/10.1029/2009JD012714, 2010.
Mallik, C., Tomsche, L., Bourtsoukidis, E., Crowley, J. N., Derstroff, B., Fischer, H., Hafermann, S., Hüser, I., Javed, U., Keßel, S., Lelieveld, J., Martinez, M., Meusel, H., Novelli, A., Phillips, G. J., Pozzer, A., Reiffs, A., Sander, R., Taraborrelli, D., Sauvage, C., Schuladen, J., Su, H., Williams, J., and Harder, H.: Oxidation processes in the eastern Mediterranean atmosphere: evidence from the modelling of HOx measurements over Cyprus, Atmos. Chem. Phys., 18, 10825–10847, https://doi.org/10.5194/acp-18-10825-2018, 2018.
Mannschreck, K., Gilge, S., Plass-Duelmer, C., Fricke, W., and Berresheim, H.: Assessment of the applicability of photostationary state to long-term measurements at the Hohenpeissenberg GAW Station, Germany, Atmos. Chem. Phys., 4, 1265–1277, https://doi.org/10.5194/acp-4-1265-2004, 2004.
Mao, J., Ren, X., Chen, S., Brune, W. H., Chen, Z., Martinez, M., Harder, H., Lefer, B., Rappenglück, B., Flynn, J., and Leuchner, M.: Atmospheric oxidation capacity in the summer of Houston 2006: Comparison with summer measurements in the metropolitan studies, Atmos. Environ., 44, 4107–4115, https://doi.org/10.1016/j.atmosenv.2009.01.013, 2010.
Martin, R., Fiore, A., and Van Donkelaar, A.: Space-based diagnosis of surface ozone sensitivity to anthropogogenic emissions, Geophys. Res. Lett., 31, L06120, https://doi.org/10.1029/2004GL019416, 2004.
Martinez, M., Harder, H., Kubistin, D., Rudolf, M., Bozem, H., Eerdekens, G., Fischer, H., Klüpfel, T., Gurk, C., Königstedt, R., Parchatka, U., Schiller, C. L., Stickler, A., Williams, J., and Lelieveld, J.: Hydroxyl radicals in the tropical troposphere over the Suriname rainforest: airborne measurements, Atmos. Chem. Phys., 10, 3759–3773, https://doi.org/10.5194/acp-10-3759-2010, 2010.
Mazzuca, G. M., Ren, X., Loughner, C. P., Estes, M., Crawford, J. H., Pickering, K. E., Weinheimer, A. J., and Dickerson, R. R.: Ozone production and its sensitivity to NOx and VOCs: results from the DISCOVER-AQ field experiment, Houston 2013, Atmos. Chem. Phys., 16, 14463–14474, https://doi.org/10.5194/acp-16-14463-2016, 2016.
Meusel, H., Kuhn, U., Reiffs, A., Mallik, C., Harder, H., Martinez, M., Schuladen, J., Bohn, B., Parchatka, U., Crowley, J. N., Fischer, H., Tomsche, L., Novelli, A., Hoffmann, T., Janssen, R. H. H., Hartogensis, O., Pikridas, M., Vrekoussis, M., Bourtsoukidis, E., Weber, B., Lelieveld, J., Williams, J., Pöschl, U., Cheng, Y., and Su, H.: Daytime formation of nitrous acid at a coastal remote site in Cyprus indicating a common ground source of atmospheric HONO and NO, Atmos. Chem. Phys., 16, 14475–14493, https://doi.org/10.5194/acp-16-14475-2016, 2016.
Miyazaki, K., Eskes, H., Sudo, K., Boersma, K. F., Bowman, K., and Kanaya, Y.: Decadal changes in global surface NOx emissions from multi-constituent satellite data assimilation, Atmos. Chem. Phys., 17, 807–837, https://doi.org/10.5194/acp-17-807-2017, 2017.
Monks, P. S., Archibald, A. T., Colette, A., Cooper, O., Coyle, M., Derwent, R., Fowler, D., Granier, C., Law, K. S., Mills, G. E., Stevenson, D. S., Tarasova, O., Thouret, V., von Schneidemesser, E., Sommariva, R., Wild, O., and Williams, M. L.: Tropospheric ozone and its precursors from the urban to the global scale from air quality to short-lived climate forcer, Atmos. Chem. Phys., 15, 8889–8973, https://doi.org/10.5194/acp-15-8889-2015, 2015.
Nakamura, K., Kondo, Y., Chen, G., Crawford, J. H., Takegawa, N., Koike, M., Kita, K., Miyazaki, Y., Shetter, R. E., Lefer, B. L., Avery, M., and Matsumoto J.: Measurement of NO2 by the photolysis conversion technique during the Transport and Chemical Evolution Over the Pacific (TRACE-P) campaign, J. Geophys. Res., 108, 4752, https://doi.org/10.1029/2003JD003712, 2003.
Parrish, D. D., Trainer, M., Williams, E. J., Fahey, D. W., Hübler, G., Eubank, C. S., Liu, S. C., Murphy, P. C., Albritton, D. L., and Fehsenfeld, F. C.: Measurements of the NOx-O3-photostationary steady state at Niwot Ridge, Colorado, J. Geophys. Res., 91, 5361–5370, https://doi.org/10.1029/JD091iD05p05361, 1986.
Pfannerstill, E. Y., Wang, N., Edtbauer, A., Bourtsoukidis, E., Crowley, J. N., Dienhart, D., Eger, P. G., Ernle, L., Fischer, H., Hottmann, B., Paris, J.-D., Stönner, C., Tadic, I., Walter, D., Lelieveld, J., and Williams, J.: Shipborne measurements of total OH reactivity around the Arabian Peninsula and its role in ozone chemistry, Atmos. Chem. Phys., 19, 11501–11523, https://doi.org/10.5194/acp-19-11501-2019, 2019.
Pollack, I. B., Lerner, B. M., and Ryerson, T. B.: Evaluation of ultraviolet light-emitting diodes for detection of atmospheric NO2 by photolysis – chemiluminescence, J. Atmos. Chem., 65, 111–125, https://doi.org/10.1007/s10874-011-9184-3, 2011.
Reed, C., Evans, M. J., Di Carlo, P., Lee, J. D., and Carpenter, L. J.: Interferences in photolytic NO2 measurements: explanation for an apparent missing oxidant?, Atmos. Chem. Phys., 16, 4707–4724, https://doi.org/10.5194/acp-16-4707-2016, 2016.
Regelin, E., Harder, H., Martinez, M., Kubistin, D., Tatum Ernest, C., Bozem, H., Klippel, T., Hosaynali-Beygi, Z., Fischer, H., Sander, R., Jöckel, P., Königstedt, R., and Lelieveld, J.: HOx measurements in the summertime upper troposphere over Europe: a comparison of observations to a box model and a 3-D model, Atmos. Chem. Phys., 13, 10703–10720, https://doi.org/10.5194/acp-13-10703-2013, 2013.
Ren, X., van Duin, D., Cazorla, M., Chen, S., Mao, J., Zhang, L., Brune, W. H., Flynn, J. H., Grossberg, N., Lefer, B. L., Rappenglück, B., Wong, K. W., Tsai, C., Stutz, J., Dibb, J. E., Jobson, B. T., Luke, W. T., and Kelley, P.: Atmospheric oxidation chemistry and ozone production: Results from SHARP 2009 in Houston, Texas, J. Geophys. Res., 118, 5570–5780, https://doi.org/10.1002/jgrd.50342, 2013.
Roeckner, E., Brokopf, R., Esch, M., Giorgetta, M., Hagemann, S., Kornblueh, L., Manzini, E., Schlese, U., and Schulzweida, U.: Sensitivity of Simulated Climate to Horizontal and Vertical Resolution in the ECHAM5 Atmosphere Model, J. Climate, 19, 3771–3791, https://doi.org/10.1175/JCLI3824.1, 2006.
Ryerson, T. B., Williams, E. J., and Fehsenfeld, F. C.: An efficient photolysis system for fast-response NO2 measurements, J. Geophys. Res., 105, 26447–26461, https://doi.org/10.1029/2000JD900389, 2000.
Sander, R., Baumgaertner, A., Cabrera-Perez, D., Frank, F., Gromov, S., Grooß, J.-U., Harder, H., Huijnen, V., Jöckel, P., Karydis, V. A., Niemeyer, K. E., Pozzer, A., Riede, H., Schultz, M. G., Taraborrelli, D., and Tauer, S.: The community atmospheric chemistry box model CAABA/MECCA-4.0, Geosci. Model Dev., 12, 1365–1385, https://doi.org/10.5194/gmd-12-1365-2019, 2019.
Sillman, S., Al-Wali, K., Marsik, F. J., Nowacki, P., Samson, P. J., Rodgers, M. O., Garland, L. J., Martinez, J. E., Stoneking, C., Imhoff, R., Lee, J. H., Newman, L., Weinstein-Lloyd, J., and Aneja, V.: Photochemistry of ozone formation in Atlanta, GA - models and measurements, Atmos. Environ., 29, 3055–3066., https://doi.org/10.1016/1352-2310(95)00217-M, 1995.
Silvern, R. F., Jacob, D. J., Travis, K. R., Sherwen, T., Evans, M. J., Cohen, R. C., Laughner, J. L., Hall, S. R., Ullmann, K., Crounse, J. D., Wennberg, P. O., Peischl, J., and Pollack, I. B.: Observed NO∕NO2 ratios in the upper troposphere imply errors in cycling kinetics or an unaccounted NOx reservoir, Geophys. Res. Lett., 45, 4466–4474, https://doi.org/10.1029/2018GL077728, 2018.
Sobanski, N., Schuladen, J., Schuster, G., Lelieveld, J., and Crowley, J. N.: A five-channel cavity ring-down spectrometer for the detection of NO2, NO3, N2O5, total peroxy nitrates and total alkyl nitrates, Atmos. Meas. Tech., 9, 5103–5118, https://doi.org/10.5194/amt-9-5103-2016, 2016.
Tadic, I. and Fischer, H.: Net ozone production and its relationship to NOx and VOCs in the marine boundary layer around the Arabian Peninsula, Data set, Zenodo, https://doi.org/10.5281/zenodo.3693988, 2019.
Thornton, J. A., Wooldridge, P. J., Cohen, R. C., Martinez, M., Harder, H., Brune, W. H., Williams, E. J., Roberts, J. M., Fehsenfeld, F. C., Hall, S. R., Shetter, R. E., Wert, B. P., and Fried, A.: Ozone production rates as a function of NOx abundances and HOx production rates in the Nashville urban plume, J. Geophys. Res., 107, https://doi.org/10.1029/2001JD000932, 2002.
Tuzson, B., Zeyer, K., Steinbacher, M., McManus, J. B., Nelson, D. D., Zahniser, M. S., and Emmenegger, L.: Selective measurements of NO, NO2 and NOy in the free troposphere using quantum cascade laser spectroscopy, Atmos. Meas. Tech., 6, 927–936, https://doi.org/10.5194/amt-6-927-2013, 2013.
Viallon, J., Lee, S., Moussay, P., Tworek, K., Petersen, M., and Wielgosz, R. I.: Accurate measurements of ozone absorption cross-sections in the Hartley band, Atmos. Meas. Tech., 8, 1245–1257, https://doi.org/10.5194/amt-8-1245-2015, 2015.
Yver Kwok, C., Laurent, O., Guemri, A., Philippon, C., Wastine, B., Rella, C. W., Vuillemin, C., Truong, F., Delmotte, M., Kazan, V., Darding, M., Lebègue, B., Kaiser, C., Xueref-Rémy, I., and Ramonet, M.: Comprehensive laboratory and field testing of cavity ring-down spectroscopy analyzers measuring H2O, CO2, CH4 and CO, Atmos. Meas. Tech., 8, 3867–3892, https://doi.org/10.5194/amt-8-3867-2015, 2015.
Zhou, W., Cohan, D. S., and Henderson, B. H.: Slower ozone production in Houston, Texas following emission reductions: evidence from Texas Air Quality Studies in 2000 and 2006, Atmos. Chem. Phys., 14, 2777–2788, https://doi.org/10.5194/acp-14-2777-2014, 2014.