the Creative Commons Attribution 4.0 License.
the Creative Commons Attribution 4.0 License.
 | 05 Jun 2020
On the forcings of the unusual Quasi-Biennial Oscillation structure in February 2016
Robin Pilch Kedzierski
Katja Matthes
The westerly phase of the stratospheric Quasi-Biennial Oscillation (QBO) was reversed during Northern Hemisphere winter 2015/2016 for the first time since records began in 1953. Recent studies proposed that Rossby waves propagating from the extratropics played an important role during the reversal event in 2015/2016. Building upon these studies, we separated the extratropical Rossby waves into different wavenumbers and timescales by analyzing the combined ERA-40 and ERA-Interim reanalysis zonal wind, meridional wind, vertical velocity, and potential vorticity daily mean data from 1958 to 2017. We find that both synoptic and quasi-stationary Rossby waves are dominant contributors to the reversal event in 2015/2016 in the tropical lower stratosphere. By comparing the results for 2015/2016 with two additional events (1959/1960 and 2010/2011), we find that the largest differences in Rossby wave momentum fluxes are related to synoptic-scale Rossby waves of periods from 5 to 20 d. We demonstrate for the first time, that these enhanced synoptic Rossby waves at 40 hPa in the tropics in February 2016 originate from the extratropics as well as from local wave generation. The strong Rossby wave activity in 2016 in the tropics happened at a time with weak westerly zonal winds. This coincidence of anomalous factors did not happen in any of the previous events.
In addition to the anomalous behavior in the tropical lower stratosphere in 2015/2016, we explored the forcing of the unusually long-lasting westerly zonal wind phase in the middle stratosphere (at 20 hPa). Our results reveal that mainly enhanced Kelvin wave activity contributed to this feature. This was in close relation with the strong El Niño event in 2015/2016, which forced more Kelvin waves in the equatorial troposphere. The easterly or very weak westerly zonal winds present around 30–70 hPa allowed these Kelvin waves to propagate vertically and deposit their momentum around 20 hPa, maintaining the westerlies there.
- Article
(27896 KB) - Full-text XML
-
Supplement
(2596 KB) - BibTeX
- EndNote


The variability of zonal winds in the tropical lower stratosphere (100 to 10 hPa) is dominated by the Quasi-Biennial Oscillation (QBO) with descending easterly and westerly zonal wind regimes and a varying period from 22 to 36 months (Baldwin et al., 2001). The QBO was discovered by Reed et al. (1961) and Ebdon (1960) independently and its characteristics have been observed for many decades (Lindzen and Holton, 1968; Holton and Lindzen, 1972; Kawatani and Hamilton, 2013). The tropical QBO not only influences the tropical stratosphere but also impacts the tropical troposphere, for example the Hadley circulation (Gray et al., 1992) and the Madden–Julian oscillation (Yoo and Son, 2016). Furthermore, the QBO impacts the extratropical stratosphere by modulating the strength of the stratospheric polar vortex (Baldwin et al., 2001; Holton and Austin, 1991; Holton and Tan, 1980; Gray et al., 2004). If the mean flow in the tropical stratosphere is westerly, it generally favors the penetration of planetary waves into the tropical regions even across the Equator without encountering a critical limit. The wave-mean flow interaction theory proposed that vertically propagating equatorial waves are the main forcing mechanism for the QBO through the selective filtering by the background wind (Lindzen and Holton, 1968; Holton and Lindzen, 1972). The vertically propagating equatorial waves deposit their momentum into the regions where the background zonal wind is equal to the wave phase speed. This mechanism explains the descent of the wind regimes alternating the QBO phase. The responsible equatorial waves include Kelvin waves, equatorial Rossby waves, and smaller-scale gravity waves (Lindzen and Holton, 1968; Holton and Lindzen, 1972).
Kelvin waves are excited by tropospheric convection and propagate upward and eastward (Lindzen and Holton, 1968; Holton and Lindzen, 1972; Baldwin et al., 2001). The eastward-propagating Kelvin waves and small-scale gravity waves provide the main eastward acceleration for the initiation of the QBO westerly phase, while the westward-propagating Rossby waves and small-scale gravity waves provide the main westward acceleration for the initiation of the QBO easterly phase (Ern and Preusse, 2009; Ern et al., 2014; Garcia and Richter, 2019). The period of the stratospheric QBO depends on the amount of vertically propagating equatorial waves (Baldwin et al., 2001).
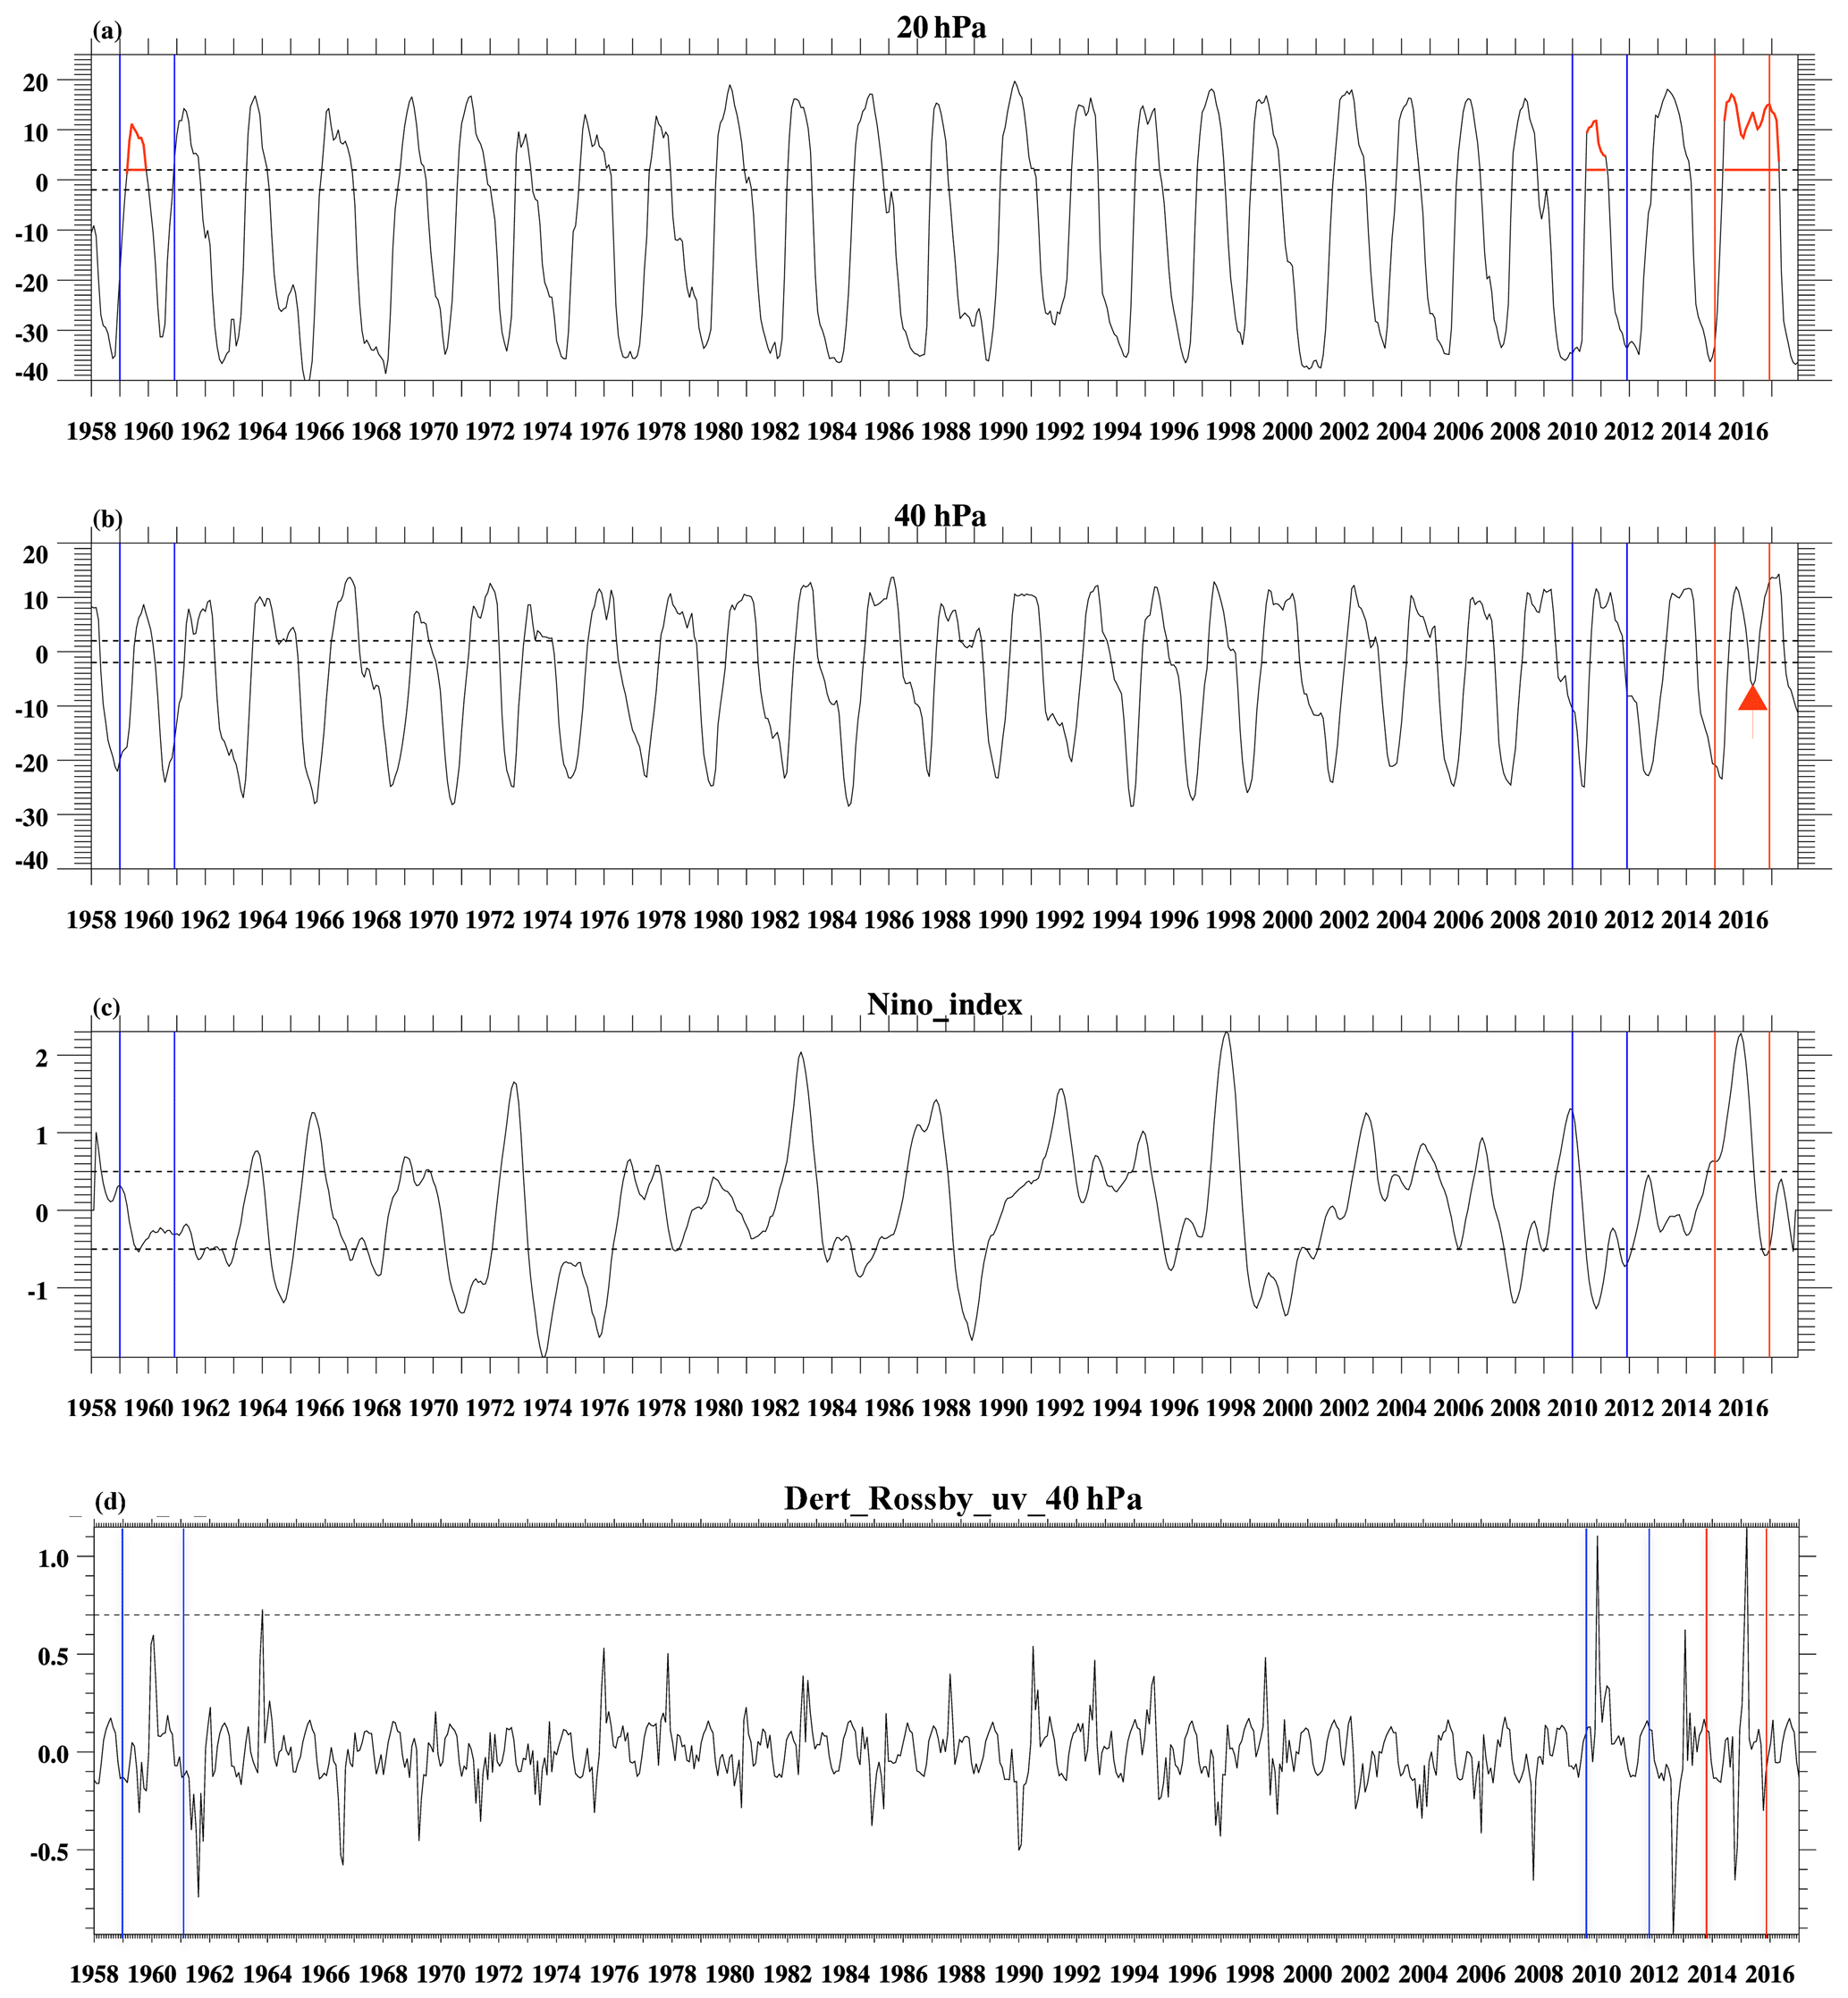
Figure 1Zonal mean zonal wind at (a) 20 hPa and (b) 40 hPa; (c) ENSO index in the Niño 3.4 region. Panel (d) denotes the time series of the horizontal Rossby wave momentum flux anomaly with respect to the monthly climatology averaged over the tropics (from 10∘ S to 10∘ N) at 40 hPa from 1958 to 2017 (unit is m2 s−2). The horizontal dashed lines denote the speeds of 2 and −2 m s−1 in panels (a) and (b). In panel (c) the horizontal dashed lines denote 0.5 and −0.5 K, respectively. The horizontal dashed line denotes the value of 0.7 m2 s−2 in panel (d). The vertical red lines denote the time period of 2015/2016, and the vertical blue lines denote the periods of 1959/1960 and 2010/2011. In panel (a) the horizontal red lines denote the westerly phase periods during 1959/1960, 2010/2011, and 2015/2016 at 20 hPa. In panel (b) the red triangle denotes the reversed westerly zonal wind in 2015/2016 at 40 hPa.
In February 2016, the regular descent of the QBO westerly phase was interrupted and reversed near 40 hPa. The reversed westerly zonal mean zonal wind at 40 hPa (shown in Fig. 1b) is named “reversal event” in the following. This reversal event occurred for the first time in 2016 since the QBO has been recorded (Naujokat, 1986). Several studies tried to explore the possible reasons for the anomalous QBO behavior (Osprey et al., 2016; Dunkerton, 2016; Coy et al., 2017; Tweedy et al., 2017; Barton and McCormack, 2017; Lin et al., 2019). Their results showed that Rossby waves propagating from the extratropical Northern Hemisphere might have been the most likely cause of the reversed westerly zonal wind at 40 hPa. Coy et al. (2017) also found high amounts of momentum flux divergence present in the tropical lower stratosphere in 1987/1988 and 2010/2011, but the westerly zonal wind at the Equator did not reverse as a consequence of this extratropical Rossby wave activity. Another possibility for the enhanced Rossby wave activity in the equatorial stratosphere is local wave generation from instability within the QBO westerlies. Coy et al. (2017) calculated the meridional gradient of the potential vorticity field (; Andrews et al., 1987) during the anomalous QBO reversal event. Regions with negative indicate the presence of barotropic shear instability associated with the QBO winds. Coy et al. (2017) found that was positive during the reversal event in 2015/2016, implying an unlikely instability of the large-scale flow. However, in the model study by Hitchcock et al. (2018) it is suggested that the distribution present in February 2016 favored wave flux convergence over a narrow region, providing a dynamical feedback, not the source of the wave forcing. One goal of our study is to investigate the responsible waves for the reversal event in the lower stratosphere in February 2016 by separating the contributions of individual wavenumbers and different timescales.
As highlighted in previous studies, the stratospheric QBO can interact with other large-scale oscillations. El Niño–Southern Oscillation (ENSO) events influence tropical convection. The ENSO warm phase (El Niño) enhances the tropical tropospheric convection and the ENSO cold phase (La Niña) decreases the tropical tropospheric convection (Maury et al., 2013; Yang and Hoskins, 2013). Through modulating the tropospheric convection, ENSO could affect the equatorial wave behavior and hence the forcing of the QBO (Maury et al., 2013; Yang and Hoskins, 2013; Schirber, 2015; Hansen et al., 2016; Christiansen et al., 2016; Kang et al., 2018). Based on this mechanism, many studies investigated the interaction between ENSO and the QBO. Taguchi (2010) and Yuan et al. (2014) revealed that the QBO has a weaker amplitude and faster phase speed during El Niño conditions by investigating radiosonde data from 1953 through 2008. Recently, some studies (Barton and McCormack, 2017; Hirota et al., 2018) highlighted the potential role of the exceptionally strong El Niño conditions on the reversed QBO westerlies in 2015/2016. Their results agree with a modeling study by Calvo et al. (2010), which found that the subtropical zonal wind has a westerly tendency in the Northern Hemisphere in conjunction with a strong El Niño in winter (NDJ). Newman et al. (2016) reported that the QBO westerlies propagated upward instead of the regular downward propagation above 30 hPa in 2015/2016. The upward migration of QBO westerlies above 30 hPa caused the westerly zonal winds to last unusually long at 20 hPa in 2015/2016. Another goal of our study is to explore the responsible waves and the role of the strong El Niño event for the upward migration and unusually long westerly zonal mean zonal wind regime at 20 hPa.
The remaining parts of this paper are organized as follows. In Sect. 2, the data and methods used in our study are described. The possible reasons for the reversed westerly zonal wind at 40 hPa are explored in Sect. 3.1. The Rossby waves are divided into quasi-stationary Rossby waves and faster Rossby waves. Their contributions and sources (propagating from the extratropics or generated locally in the tropics) during the QBO westerly phase reversal event are investigated in Sect. 3.1.1 and 3.1.2, respectively. We explore possible mechanisms for local Rossby wave generation during the reversal event in Sect. 3.1.3. Section 3.2 will analyze the unusual behavior of Kelvin waves and the influence of the strong El Niño event during the long-lasting westerly zonal mean zonal wind phase at 20 hPa. The summary and conclusions are given in Sect. 4.
For this study, we use the combined European Centre for Medium-Range Weather Forecasts (ECMWF) ERA-40 and ERA-Interim reanalysis data sets (Uppala et al., 2005; Dee et al., 2011), which extend from 1958 to 2017. This was done to use the longest time series up to the 2016 QBO reversal to cover as many QBO cycles and ENSO events as possible, instead of starting from 1979 with ERA-Interim alone. We use daily averaged pressure level data including zonal wind, meridional wind, vertical velocity, and potential vorticity with a horizontal resolution of 2.5∘ longitude × 2.5∘ latitude. The ERA-40 and ERA-Interim reanalysis data sets have 23 and 37 pressure levels in the vertical direction, respectively, from 1000 to 1 hPa. We use a merged data set of ERA-40 and ERA-Interim on the 23 pressure levels they have in common (Blume et al., 2012). The NOAA Extended Reconstructed Sea Surface Temperature (SST) V4 was used to calculate the ENSO index. Furthermore, we also used the monthly outgoing long-wave radiation (OLR) data to represent the amount of convective activity from https://www.esrl.noaa.gov/psd/data/gridded/data.interp_OLR.html (last access: 30 December 2019).
2.1 Index definitions
We define the QBO phase using the monthly zonal mean zonal wind at 40 hPa (averaged from 50 to 30 hPa since the 40 hPa level is not available in ERA-40 or ERA-Interim) and averaged over 2.5∘ S–2.5∘ N (U40) (following Hansen et al., 2016). The westerly QBO phase (QBOW) is defined when U40 is greater than 2 m s−1 and the easterly QBO phase (QBOE) is defined when the U40 is less than −2 m s−1 (shown in Fig. 1b) following Hansen et al. (2016). To examine the reliability of the QBO index, we compared the ERA-40 and ERA-Interim reanalysis data with the monthly zonal mean zonal wind at 40 hPa from the Free University of Berlin (FUB) data set (FU40) (Naujokat, 1986). The amplitude of the QBO index is only slightly larger in FU40 compared with U40 (not shown). The index of FU40 is an average of three stations (Canton Island station (1953–1967); Gan, Maldives station (1968–1975); and Singapore station (1976–present)), all of them at a similar latitude around the Equator (Naujokat, 1986). Note that, the result of U40 comes from the zonal mean and averaged from 2.5∘ S to 2.5∘ N. The U40 and FU40 agree well in the duration and phase of zonal wind regimes, suggesting that the result of U40 is robust and the differences between U40 and FU40 are negligible. We therefore use the ERA-reanalysis data set for the rest of this study. Similar to U40, we also defined the direction of zonal wind at 20 hPa (U20). Both ERA-40 and ERA-Interim provide the 20 hPa level, so no averaging is needed. The westerly zonal wind was defined when U20 is greater than 2 m s−1, and when U20 is less than −2 m s−1, it is defined as easterly zonal wind (as shown in Fig. 1a).
The ENSO index is obtained as deviations from the monthly climatology, with 5 months' running average in the Niño 3.4 region (5∘ S–5∘ N, 70–120∘ W)(Hansen et al., 2016). An El Niño event is defined when the ENSO index is greater than 0.5 K, and a La Niña event is defined when the ENSO index is less than −0.5 K (shown in Fig. 1c).
2.2 Wave filtering
In order to explore the roles of tropical and extratropical waves during the unexpected QBO reversal event in 2015/2016, we extracted Rossby and Kelvin wave perturbations in the wavenumber-frequency domain by applying the “kf-filter” function (a two-dimensional fast Fourier transform in longitude and time; Schreck, 2009) on horizontal winds and vertical velocity.
The “kf-filter” function enables defining the filtered wavenumber-frequency domain with its boundaries following the dispersion curves of the different equatorial wave modes, as introduced by Wheeler and Kiladis (1999). In our study we use this feature to extract Kelvin wave anomalies in the tropics.
The “kf filter” also has the option of defining a simple box in the wavenumber-frequency domain, bounded by a wavenumber and period range, without following any dispersion curve. This has proven to be useful for wave filtering in the extratropics (Pilch Kedzierski et al., 2017), where the propagation of waves is highly affected by the background winds through Doppler shifting, and thus a single Rossby wave mode can occupy different regions in the wavenumber-frequency domain depending on the background wind condition. This option of the “kf filter” will be used to filter Rossby waves from 60∘ N to 60∘ S, as our study wants to diagnose extratropical waves that propagated into the equatorial region during the 2016 QBO reversal, as reported by Osprey et al. (2016), Newman et al. (2016), and Coy et al. (2017). This filtering technique does not distinguish equatorial from extratropical Rossby wave modes, but their origin and propagation will be tracked by separating different wavenumbers and timescales and using time–height and time–latitude sections. The detailed information about the different filter boundaries used in our study is shown in Table 1. The filter boundaries for Rossby waves are −0.5 and −3.5: negative wavenumbers indicate westward-propagating waves.
Table 1Exact boundaries of the Rossby wave and Kelvin wave filters.
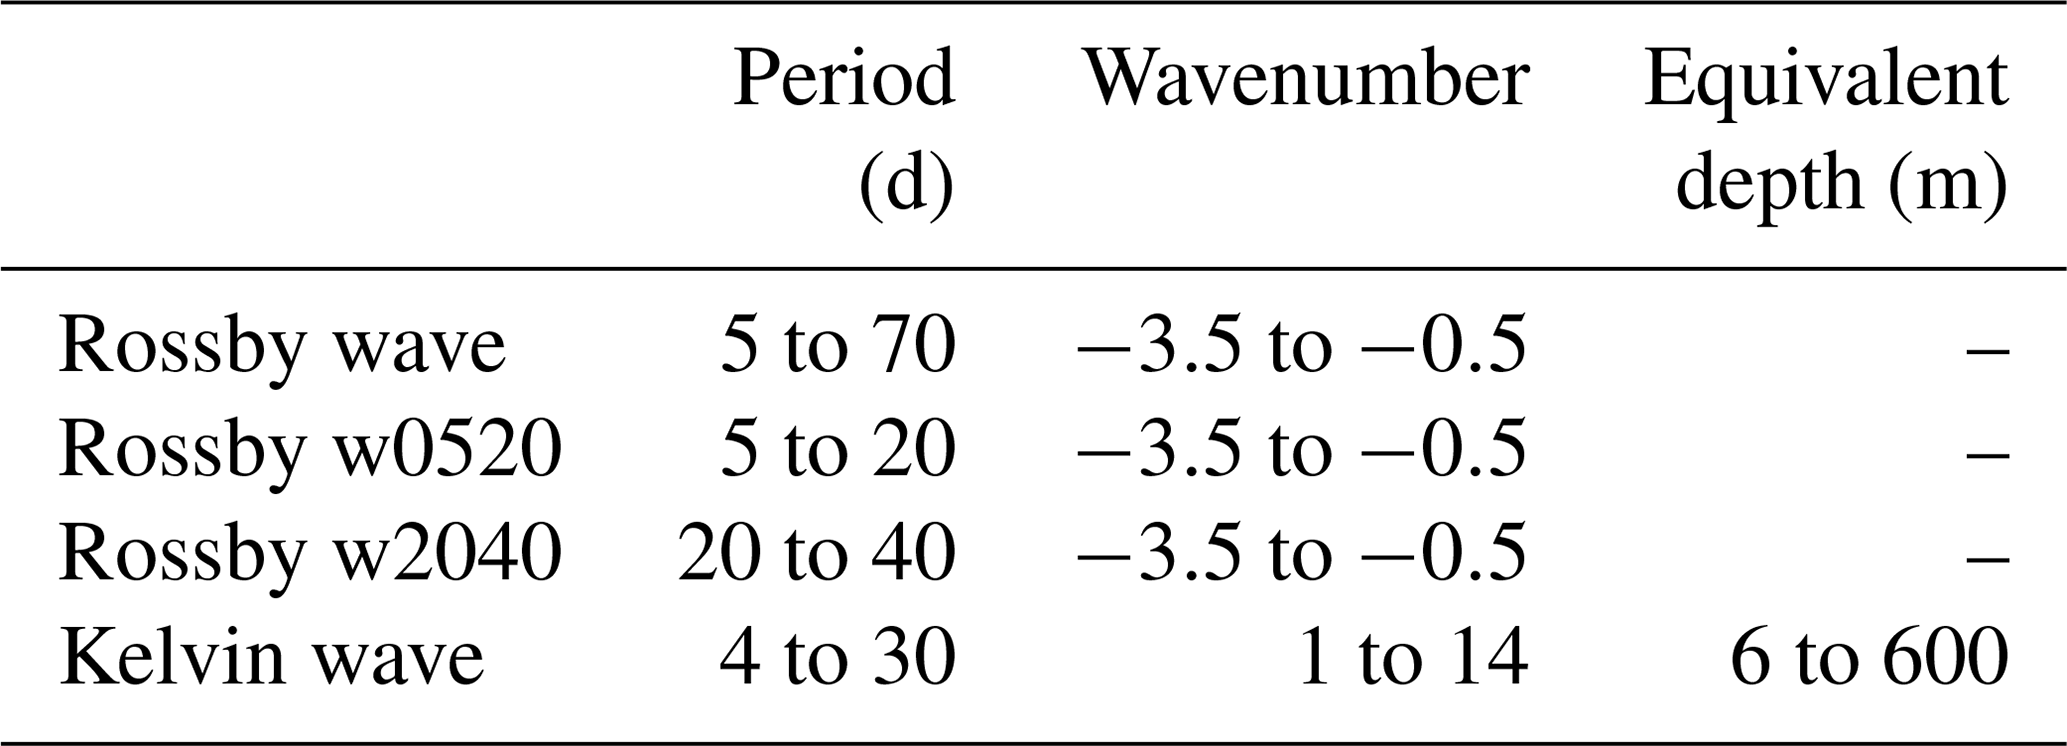
Extratropical Rossby waves can also propagate eastward relative to the ground with strong westerly mean zonal winds, but their activity and fluxes are limited to the winter stratospheric polar vortex, therefore not affecting tropical regions. We confirm that momentum flux anomalies of relevance for tropical regions only originate from westward-propagating waves (see and compare Figs. 3 and S1 from the Supplement), and thus the eastward-propagating Rossby waves are not included in our study. The westward-propagating Rossby waves produce a westward acceleration of the background zonal wind and hence weaken the westerly zonal wind in the extratropics during Northern Hemisphere (NH) winter. First, the total amount of Rossby wave activity (periods of 5–70 d) is presented in Sect. 3.1. Since we found that very slow waves (40–70 d periods) show very little activity, we focus on the two dominant timescales: quasi-stationary (20–40 d) and faster (5–20 d) Rossby waves in Sect. 3.1.1 and 3.1.2, respectively. To explore their sources and contributions during the 2015/2016 reversal event, for each timescale we further separate the filtered Rossby waves into individual wavenumbers 1, 2, and 3. We also study the Kelvin wave activity (wavenumbers 1 to 14, periods of 4–30 d; see Table 1) in Sect. 3.2.
Please note that the output of the filter near the temporal ends (years 1958 and 2017) of the data set in our analysis is neglected because the amplitude of the filtered waves is underestimated there. The monthly climatology is calculated from January 1959 through December 2014 to avoid any influence of the unique structure of the stratospheric QBO in 2015/2016.
2.3 Momentum flux calculation
The contribution of each wave type defined in Sect. 2.2 during the 2015/2016 QBO reversal event is estimated by calculating the horizontal (Mfh) and vertical (Mfv) momentum fluxes:
u′, v′, and w′ denote the perturbations (waves) in the zonal wind, meridional wind, and vertical velocity. The overbar denotes the zonal mean.
Vertical momentum flux calculations will be used only for Kelvin waves in our study, since no relevant contribution from Rossby waves was detected in the tropics (see and compare Figs. 14a and S2). Kelvin waves do not propagate meridionally; therefore Mfv, as part of the vertical component of the Eliassen–Palm (EP) flux, represents their propagation well.
Regarding Rossby waves, EP flux analyses of the 2016 QBO reversal showed that, around 40 hPa, wave propagation in the tropics and subtropics was mainly meridional, with little vertical component (Osprey et al., 2016; Lin et al., 2019). Vertical EP flux components were of importance in the extratropics.
Rather than showing the full latitude-height path of the extratropical Rossby waves that propagated into the tropics, our study aims at confirming extratropical or local origin of the different wavenumbers of quasi-stationary and faster Rossby waves present in the tropics during the 2016 QBO reversal and to compare their amounts (see Sect. 3.1). For the purposes of our study, the simplified use of Mfh is sufficient. Our approach is equivalent to the quasi-geostrophic approximation of the EP flux by Matthias and Ern (2018), and even though ageostrophy holds near the Equator, we found no discontinuities in time–latitude sections of Rossby wave activity crossing into the SH (see e.g., Figs. 3 and 10).
Another limitation of our method is that with Mfh and Mfv alone, the interaction of the waves with the mean flow cannot be diagnosed as done with the full EP flux divergence in, e.g., (Lin et al., 2019), but this is not the goal of our study, and in any case increased momentum fluxes tend to cause stronger EP flux divergences.
2.4 Barotropic and baroclinic instability calculation
Shuckburgh et al. (2001) revealed that barotropic instability in tropical regions could be associated with QBO westerlies. Coy et al. (2017) later studied both barotropic and baroclinic instability following Andrews et al. (1987). We use a similar approach calculating the meridional gradient of potential vorticity in 2015/2016 from 70 to 10 hPa following Andrews et al. (1987) and Coy et al. (2017).
where Ω is the Earth's rotation frequency, a is the Earth's radius, denotes the zonal and time-averaged zonal wind, ρ0 is the basic state density, z is the log pressure vertical coordinate, ϕ is the latitude, and N2 denotes the Brunt–Väisälä frequency squared. A negative meridional potential vorticity gradient is indicative of barotropic–baroclinic instability and hence is used as a condition for local Rossby wave generation in Sect. 3.1.3.
This section on results is divided into two parts. First, the interruption of the westerly zonal wind in the lower stratosphere (40 hPa) in February 2016 and possible reasons are investigated (Sect. 3.1). Then, the reasons for the unusually long-lasting westerly zonal winds in the middle stratosphere (20 hPa) are investigated in more detail. Figure 1b shows the reversal of the westerly zonal wind regime and the onset of easterlies around 40 hPa in February 2016. A weakening of westerly zonal winds occurred in several earlier winters, for example, in winter 1959/1960 and 2010/2011 (Coy et al., 2017), but so far no other winter has resulted in a reversal of the wind. This is exceptional to the winter of 2015/2016 and resulted in a number of publications. We will add significant new aspects to the existing literature. As shown in Fig. 1a, the westerly zonal wind around 20 hPa lasted for an unusually long time in 2015/2016. Newman et al. (2016) and Kumar et al. (2018) noticed the unusual behavior of westerly zonal wind above 30 hPa but none of them explored it in detail. The goal of this study is to investigate the unusual behavior of the QBO in winter 2015/2016 in the lower and middle stratosphere in more detail than earlier studies.
3.1 Interruption of the westerly zonal wind at 40 hPa
Figure 1a–b shows that the amplitude of westerly zonal wind was weaker in a number years (e.g., 1959/1960, 2010/2011) but the westerly zonal wind only reversed its direction in the winter of 2015/2016 at 40 hPa. Prior to 2016, many events show weakened westerlies either at 40 or 20 hPa (Fig. 1a–b), but only 1959/1960 and 2010/2011 had large Rossby wave momentum flux anomalies comparable to 2016 (Fig. 1d). Previous studies (Osprey et al., 2016; Newman et al., 2016; Coy et al., 2017) reported that the reversal event in winter 2015/2016 at 40 hPa was caused by enhanced Rossby wave activity in the tropical stratosphere, mainly of extratropical origin. Based on these studies, we investigate the Rossby wave activity in the tropical stratosphere during the reversal event in more detail by looking not only at wavenumbers 1–3 but also by separating quasi-stationary Rossby waves (20–40 d) and faster Rossby waves (5–20 d).
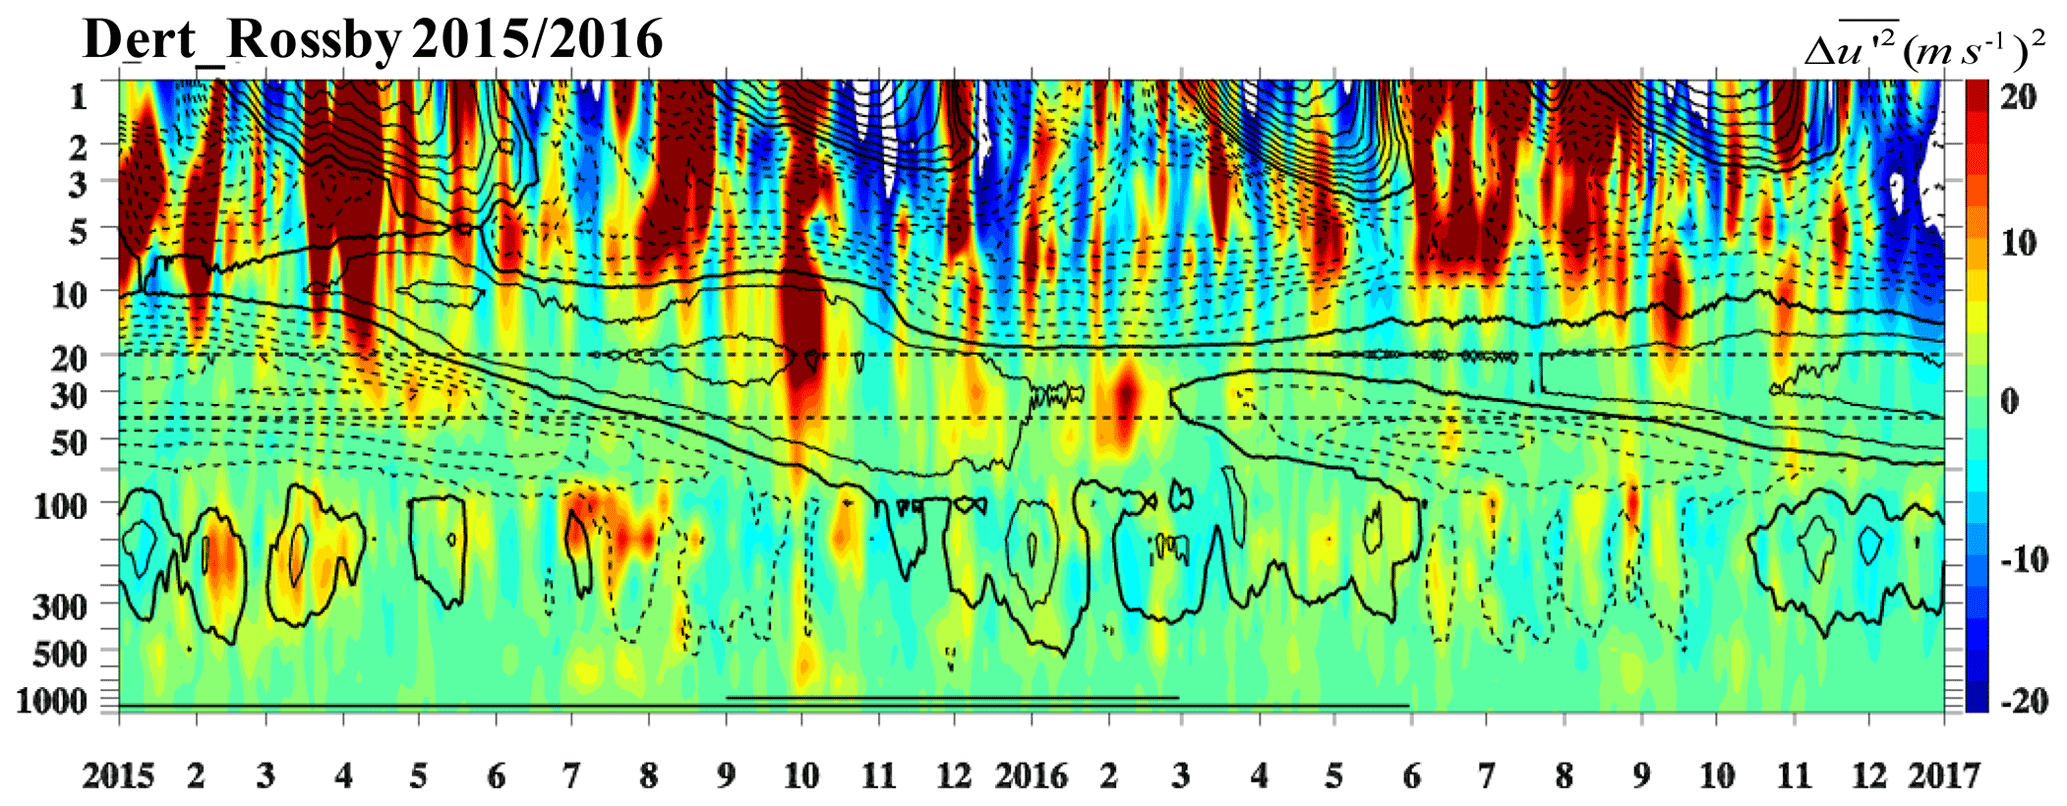
Figure 2Temporal evolution of Rossby wave activity as squared zonal wind anomalies averaged over 10∘ S–10∘ N in the vertical direction. Color shading denotes the anomalies with respect to the monthly climatology (the unit is m2 s−2). The zonal mean zonal wind is overlaid in black contours with contour interval of 5 m s−1. The solid and dotted black contours denote westerly and easterly winds, respectively. The thick contours represent the zero wind line. The horizontal dashed lines denote the altitudes of 20 and 40 hPa. The horizontal solid lines denote the El Niño (single line) and strong El Niño periods (double line) in the bottom.
First, to show the total amount of Rossby wave activity, we extracted all Rossby waves with periods of 5–70 d and with wavenumbers from 1 to 3. Figure 2 illustrates the time–height cross section of the squared Rossby wave anomalies in zonal wind averaged over the tropics (10∘ S–10∘ N) with respect to the monthly climatology (1959–2014). As shown in Fig. 2, the Rossby wave activity was enhanced in the tropics before the westerly zonal wind reversed near 40 hPa in February 2016. Since enhanced Rossby wave behavior does not extend to lower and higher levels in February 2016, the observed signal less likely originated from vertical propagation. Besides vertical propagation, Rossby waves can propagate in the meridional direction (O'Sullivan, 1997; Osprey et al., 2016). We choose two additional cases to compare the results with the 2015/2016 case: 1959/1960 and 2010/2011. Both have increased horizontal Rossby wave momentum fluxes (Fig. 1d). We investigated the role of meridionally propagating Rossby waves during the reversal event as in previous studies (Osprey et al., 2016; Newman et al., 2016; Coy et al., 2017; Tweedy et al., 2017).
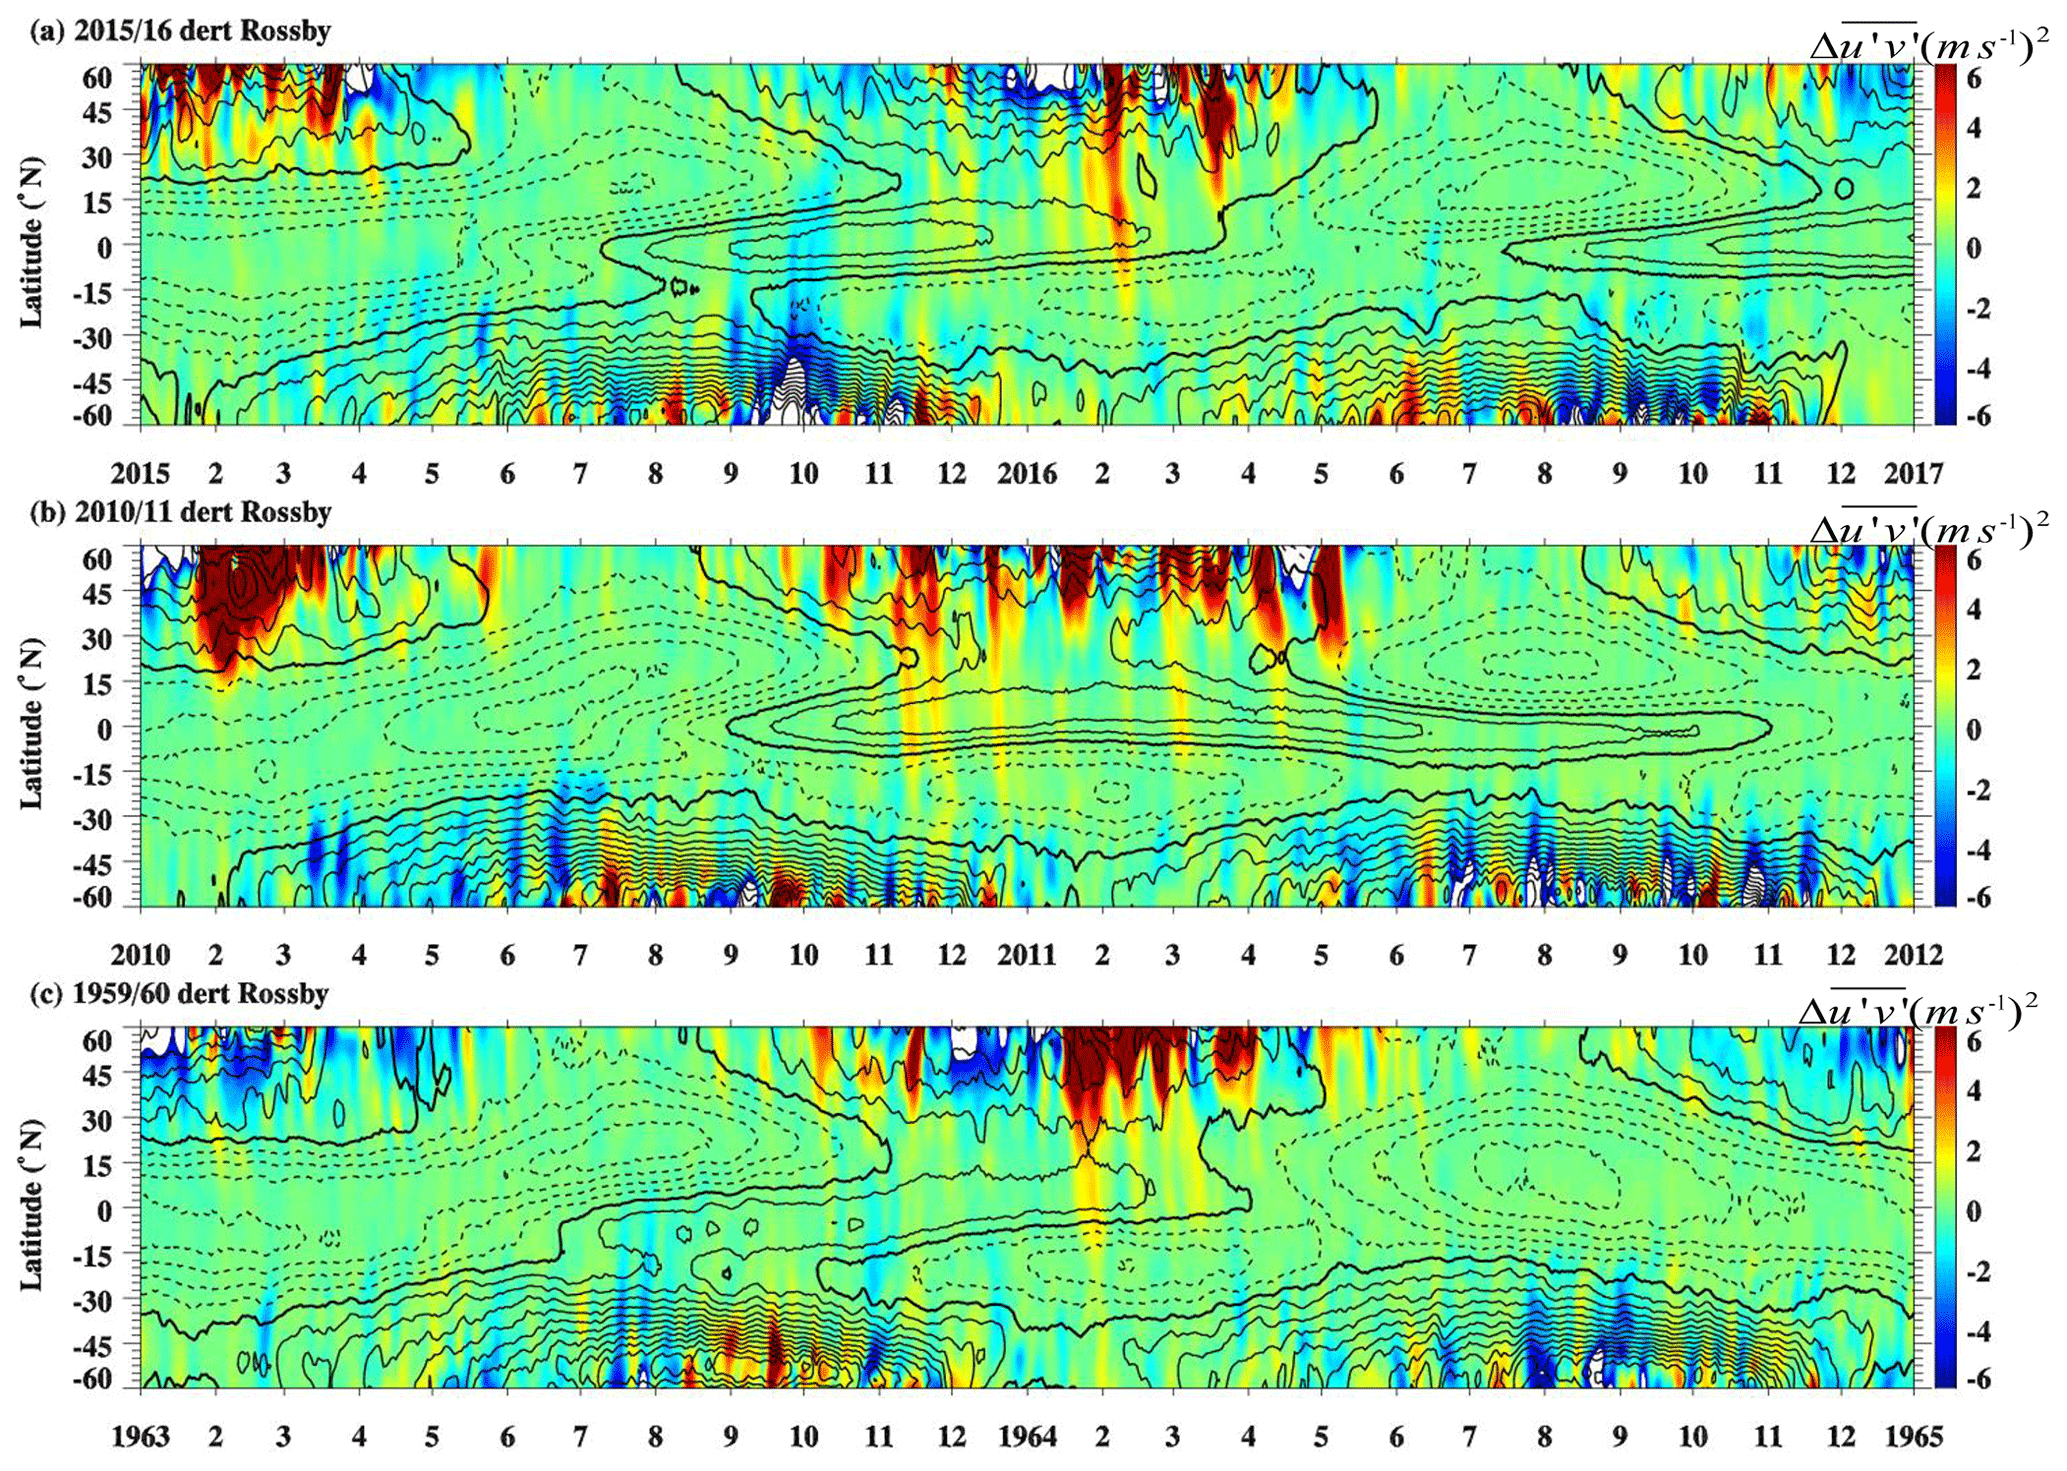
Figure 3Temporal evolution of meridional propagation of westward-propagating Rossby waves (with period of 5–70 d) horizontal momentum flux anomaly in (a) 2015/2016, (b) 2010/2011, and (c) 1959/1960 at 40 hPa. Color shadings denote the anomalies with respect to the monthly climatology (unit is m2 s−2). The zonal mean zonal wind is overlaid in black contours with contour interval of 5 m s−1. The solid and dotted black contours denote westerly and easterly winds, respectively. The thick contours represent the zero wind line.
Figure 3 shows the time–latitude cross section of Rossby wave horizontal momentum flux anomalies during three related cases (marked as blue and red vertical lines in Fig. 1b). The result is in agreement with the findings of Barton and McCormack (2017) which found that westerly subtropical zonal winds favor extratropical Rossby waves to propagate into the tropics. Rossby wave horizontal momentum flux anomalies maximize in the extratropics and the magnitude generally decreases with decreasing latitude. Equatorward propagation of Rossby waves is observed in all three example winters (Fig. 3) in agreement with Osprey et al. (2016) and Coy et al. (2017). However, the specific timescales and wavenumbers of the responsible Rossby waves have not been explored before. While previous studies have discussed the extratropical Rossby wave origin, a tropical origin of the enhanced Rossby waves in February 2016 is still unclear and will be explored in more detail in Sect. 3.1.3.
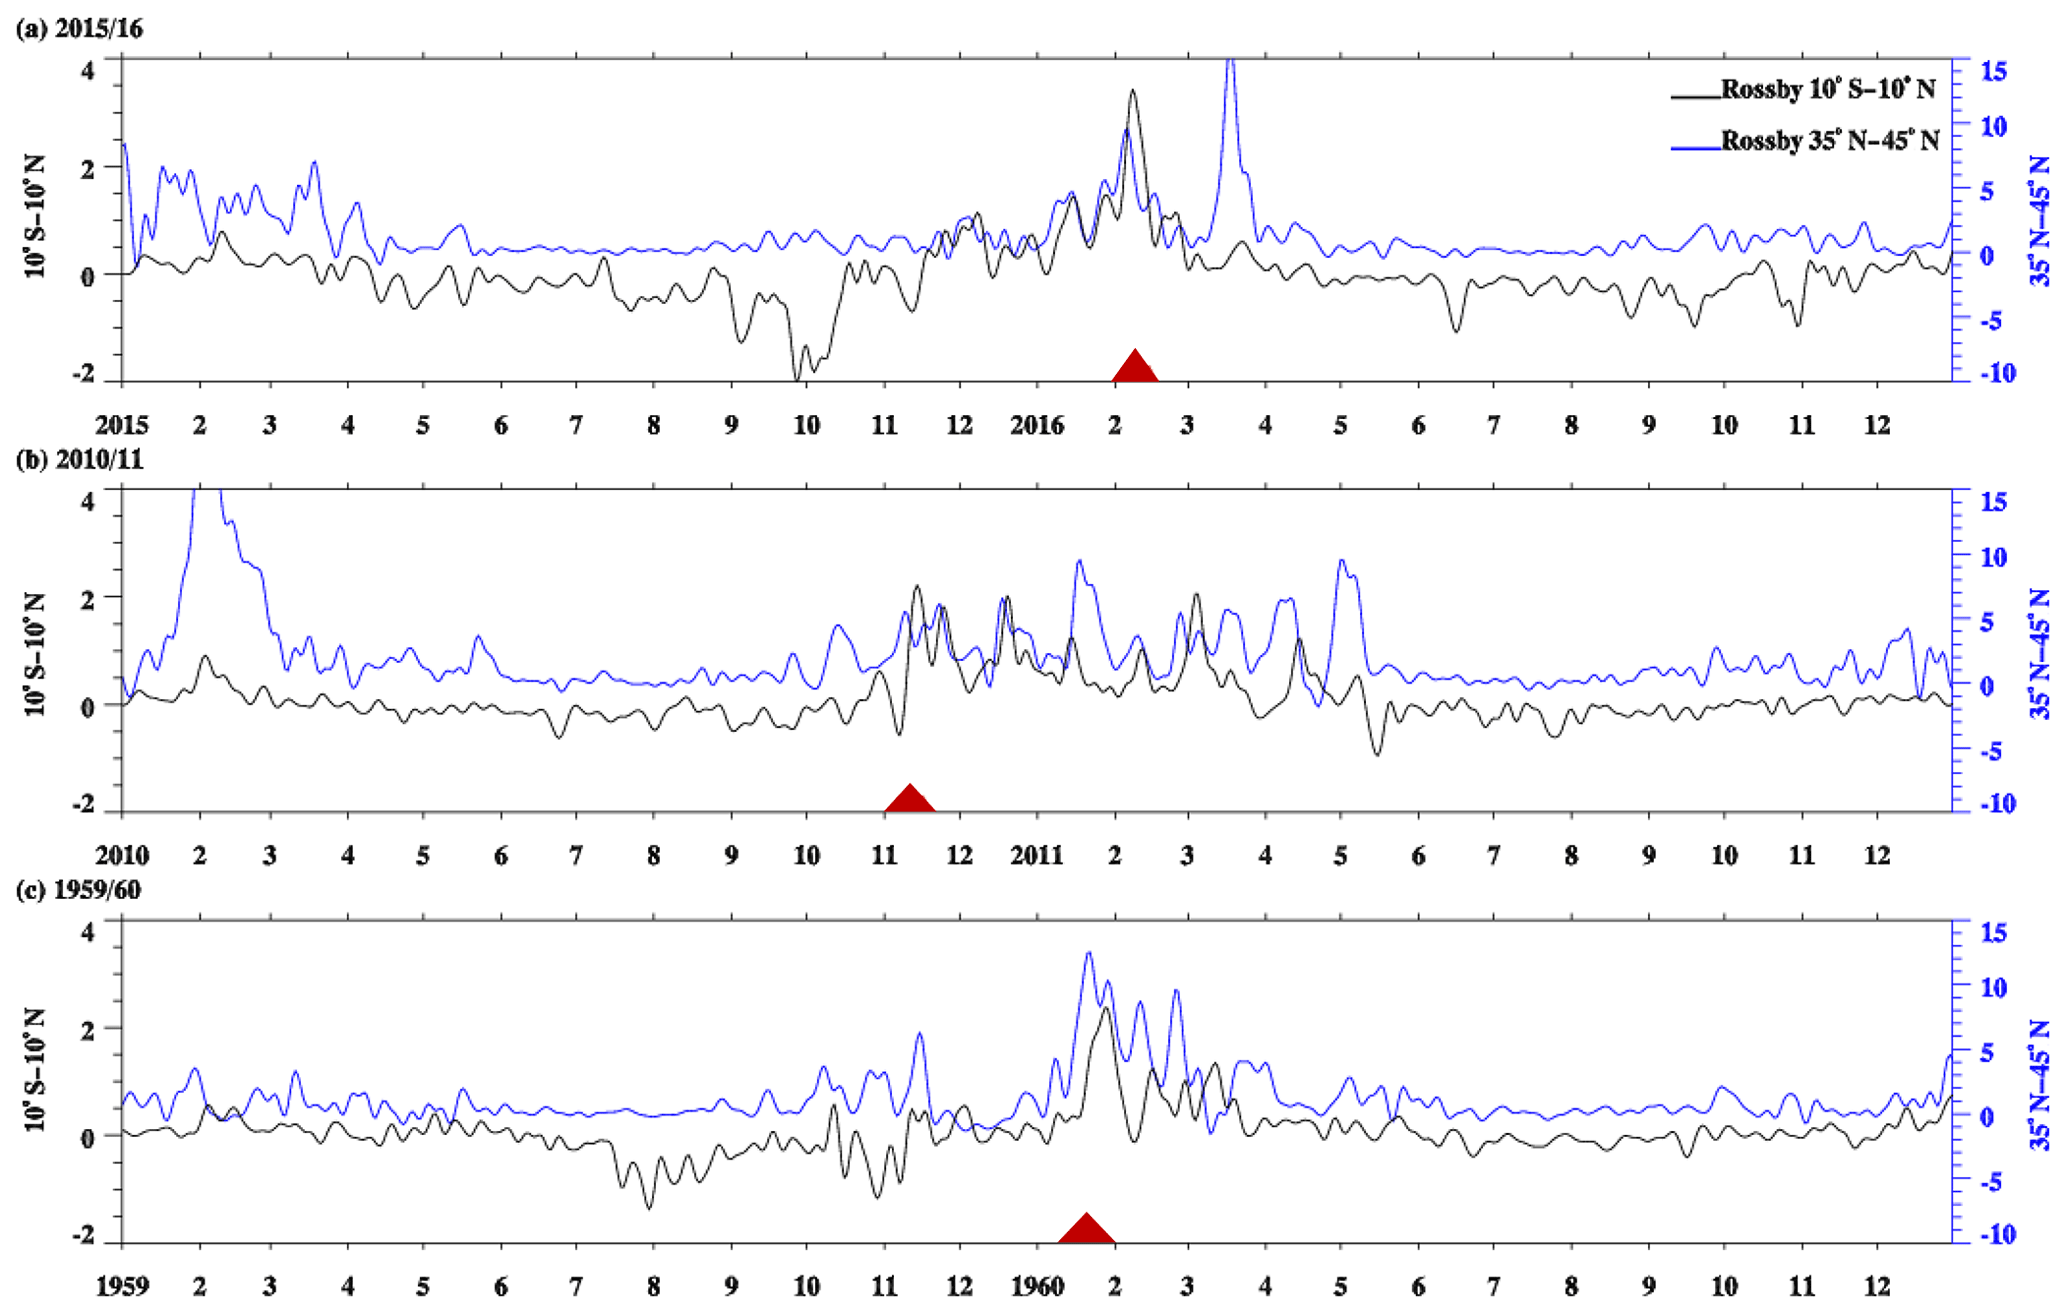
Figure 4Temporal evolution of horizontal Rossby wave (with period of 5–70 d) momentum flux anomaly averaged over 10∘ S–10∘ N (black lines) and 35–45∘ N (blue lines) during (a) 2015/2016, (b) 2010/2011, and (c) 1959/1960 at 40 hPa. Red triangles in panels (a), (b), and (c) denote February 2016, November 2010, and January 1960, respectively.
Our filtered Rossby waves in the tropics include Rossby waves generated in the tropics and in the extratropics. In order to detect where the Rossby waves were generated, we analyzed the time series of the mean Rossby wave horizontal momentum flux anomaly separately in the tropics (10∘ S–10∘ N) and extratropics (35–45∘ N), for the three selected winters: 1959/1960, 2010/2011, and 2015/2016 (Fig. 4).
As expected, the horizontal Rossby wave momentum flux anomalies peak in the extratropics, but some also peak in the tropics. For example, the extratropical momentum flux anomalies in February 2015 and 2010 do not coincide with any wave activity in the tropics. The horizontal Rossby wave momentum flux anomalies were not able to propagate into the tropics due to the prevailing easterly background zonal wind in the subtropics around 20∘ N (see Fig. 3). Figure 4 suggests that the peaks of the horizontal Rossby wave momentum flux anomaly in the tropics in January 1960, November 2010, and February 2016 are related to extratropical Rossby waves (highlighted with red triangles in Fig. 4), since there is a few days' lag between the peaks in the tropics and extratropics. This implies that they need some days to propagate from the extratropics into the tropics, which can easily be seen in Fig. 3.
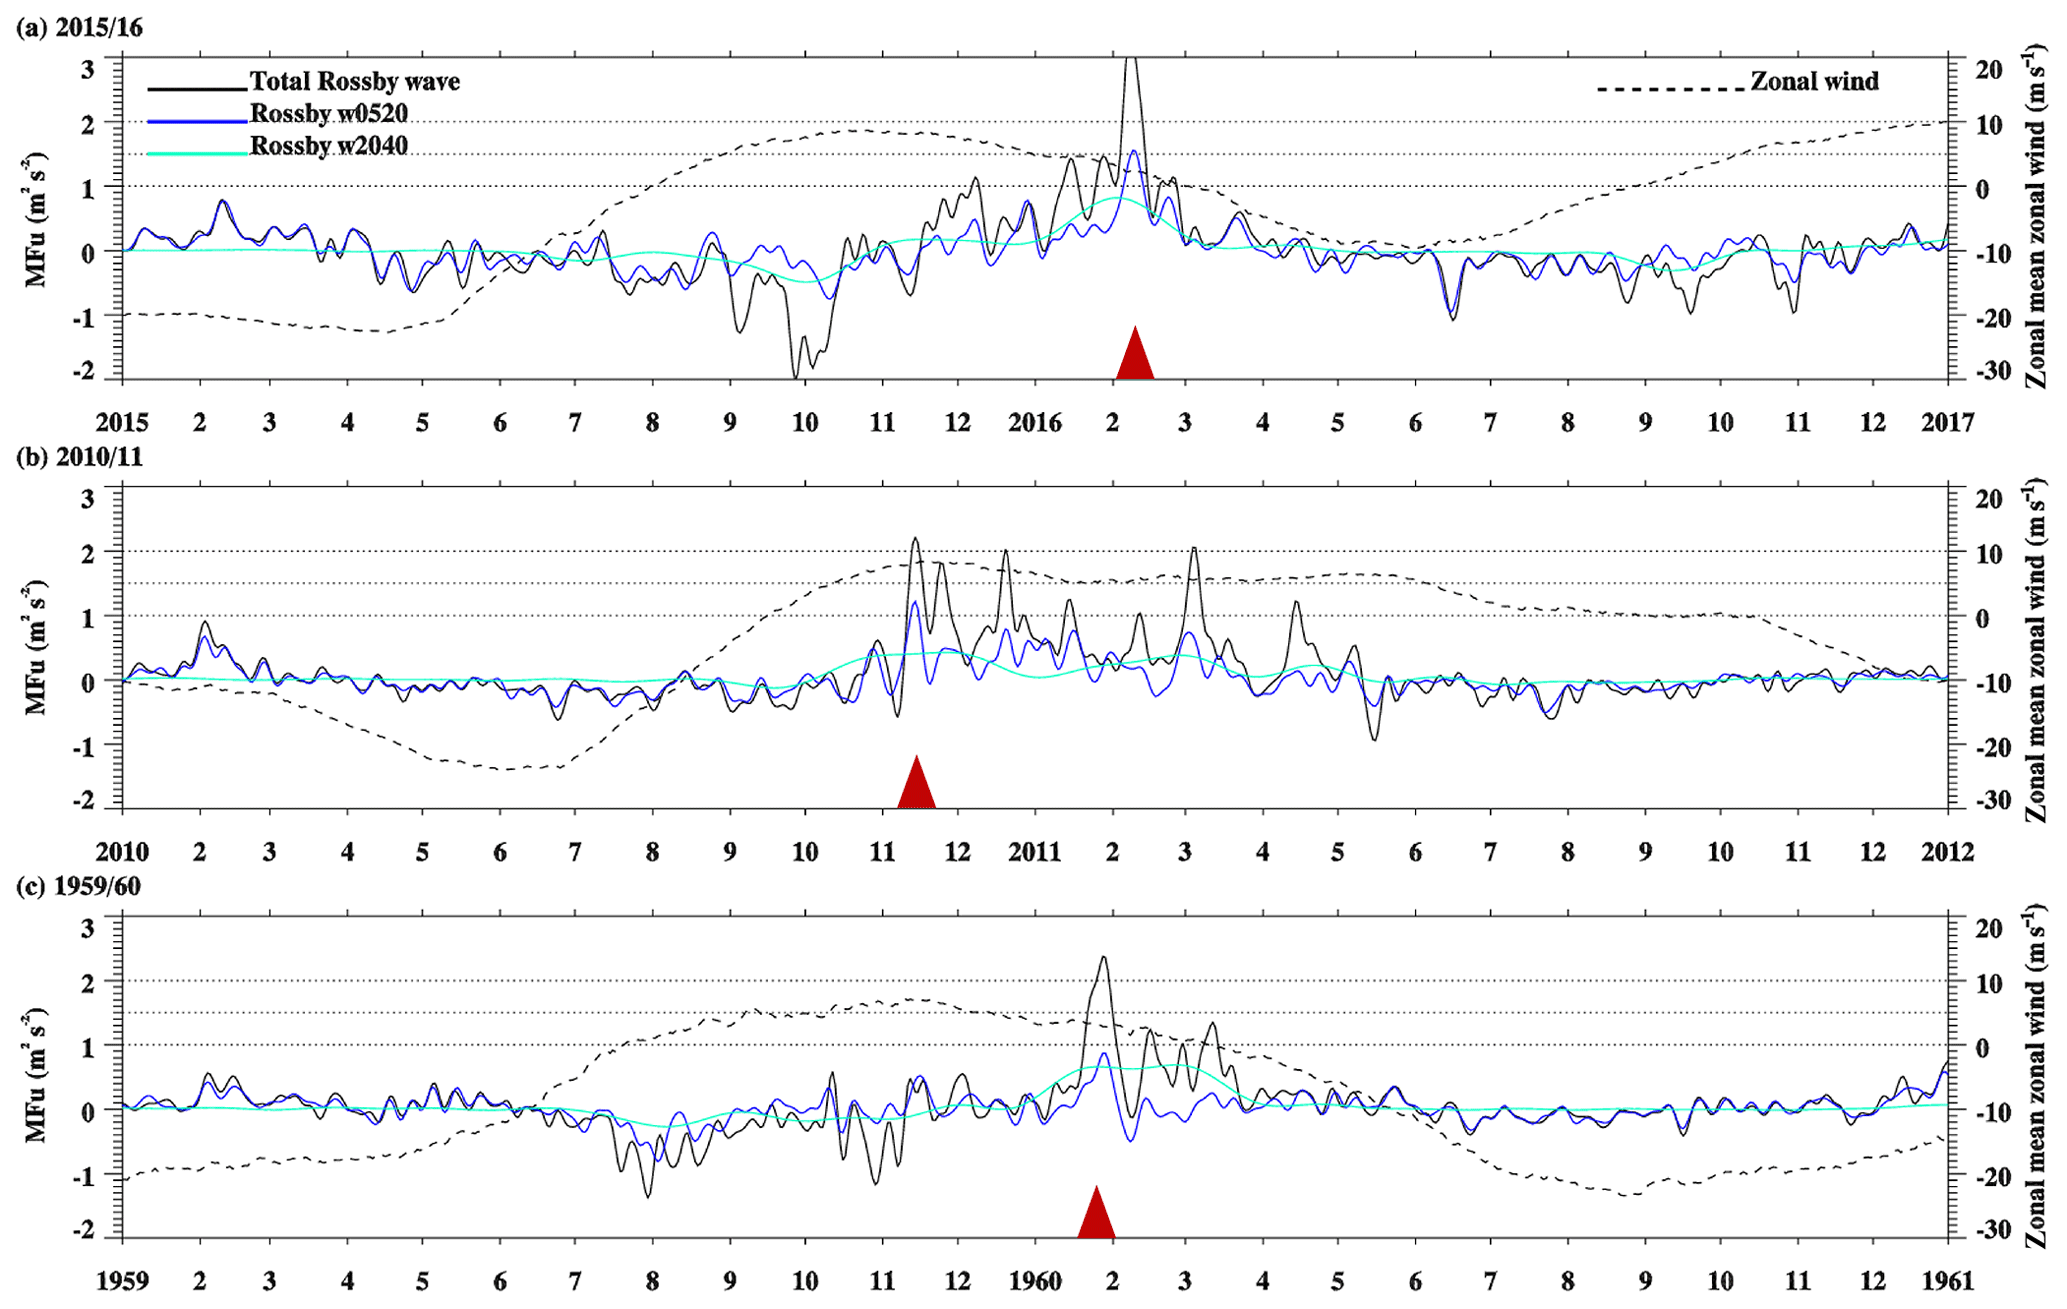
Figure 5Temporal evolution of horizontal Rossby wave momentum flux anomalies over the tropics (10∘ S–10∘ N) during (a) 2015/2016, (b) 2010/2011, and (c) 1959/1960 at 40 hPa. The horizontal dotted lines denote the values of horizontal momentum flux anomaly of Rossby waves of 1, 1.5, and 2 m2 s−2. The black, dark blue, and light blue solid lines denote the horizontal momentum flux anomaly of total Rossby wave (corresponding to Rossby w0570), Rossby w0520, and Rossby w2040, respectively. The dashed lines denote the background zonal wind during each case. Red triangles in panels (a), (b), and (c) denote February 2016, November 2010, and January 1960, respectively.
We now focus on faster Rossby waves (5–20 d, w0520) and quasi-stationary Rossby waves (20–40 d, w2040) as described in Sect. 2.2. The mean horizontal momentum flux anomaly for the total as well as the contribution from fast and quasi-stationary Rossby waves in the tropics is shown in Fig. 5. The maximum amplitude of the horizontal Rossby wave momentum flux anomalies occurred in February 2016 (3.43 m2 s−2). In addition, the Rossby w0520 horizontal momentum flux anomaly was stronger during January 1960, November 2010, and February 2016 than Rossby w2040, which had similar values in all three cases. This suggests a dominant contribution from faster Rossby waves (w0520) during the QBO reversal event, which was not noted in previous studies (Osprey et al., 2016; Newman et al., 2016; Coy et al., 2017).
From Fig. 5 we conclude that quasi-stationary Rossby waves contribute significantly to the observed momentum flux anomalies in the tropics, in a fairly similar way in all three cases. Faster Rossby waves (w0520) are responsible for most of the case-to-case variability, being especially dominant in February 2016. It is worth analyzing the contributions from individual wavenumbers for Rossby waves of both timescales, which also enables tracing their origins more precisely. Such a detailed analysis of the wave forcings of the QBO reversal event in February 2016 has not been performed yet and may lead to results of high interest. Lin et al. (2019) reported an important contribution to the 2016 QBO disruption made by a single wave packet, with dominating wavenumbers 1–3 in its wave spectrum. Their study was performed at a similar vertical level as ours (35.8 and 40 hPa, respectively), and our analysis will describe the evolution of the Rossby waves with wavenumber 1, 2, and 3, independently. The following Sect. 3.1.1 and 3.1.2 will focus on the behavior of quasi-stationary and faster Rossby waves, respectively, whereas Sect. 3.1.3 will explore possible mechanisms for an observed locally generated wave whose contribution was important and only present in February 2016.
3.1.1 The role of quasi-stationary Rossby waves
Firstly, we discuss the contribution of quasi-stationary Rossby waves (Rossby w2040; light blue lines in Fig. 5). The Rossby waves w2040 were enhanced in January 1960, November 2010, and February 2016 (red triangles in Fig. 5) with the horizontal momentum flux anomaly having maximum values of about 0.78 m2 s−2 in February 2016 in the tropics at 40 hPa. In November 2010 and January 1960, the Rossby w2040 waves' horizontal momentum flux anomaly was 0.41 and 0.66 m2 s−2, respectively, close to the values in February 2016. To explore the sources of quasi-stationary Rossby waves, Figs. 6 and 7 show the horizontal momentum flux anomaly from Rossby waves w2040 with wavenumber 1 and 2, respectively. The contribution of Rossby waves w2040 with wavenumber 1 and 2 was weaker in November 2010, while January 1960 and February 2016 were characterized by a strong Rossby wave w2040 with wavenumber 1. However, the total contribution of quasi-stationary Rossby waves was similar in all cases as shown in Fig. 5. In order to highlight the latitudinal variation in the Rossby waves w2040 with wavenumber 1, we analyzed its horizontal momentum flux anomaly at the Equator, 10, 20, and 30∘ N during each case, as shown in Fig. 8. The peaks of Rossby waves w2040 (with wavenumber 1) in the extratropics occurred earlier at higher latitudes, propagating and peaking later near the Equator, which is especially clear in January 1960, November–December 2010, and January–February 2016. Figures 5, 6, and 7 reveal that quasi-stationary Rossby waves have an important contribution to the enhanced Rossby wave activity in the tropics, mainly by wavenumber 1 (and 2 to a lesser degree) of extratropical origin.
Figure 6The time–latitude cross section of Rossby waves (with periods of 20–40 d and with wavenumber 1) horizontal momentum flux anomaly in (a) 2015/2016, (b) 2010/2011, and (c) 1959/1960 at 40 hPa. Color shadings denote the anomalies with respect to the monthly climatology (0 m2 s−2). The zonal mean zonal wind is overlaid in black contours with contour interval of 5 m s−1. The solid and dotted black contours denote westerly and easterly winds, respectively. The thick contours represent the zero wind line.
Figure 7The latitude–time cross section of Rossby wave w2040 (with wavenumber 2) horizontal momentum flux anomalies in (a) 2015/2016, (b) 2010/2011, and (c) 1959/1960 at 40 hPa. Color shadings denote the anomalies with respect to the monthly climatology. The zonal mean zonal wind is overlaid in black contours with contour interval of 5 m s−1. The solid and dotted black contours denote westerly and easterly winds, respectively. The thick contours represent the zero wind line.
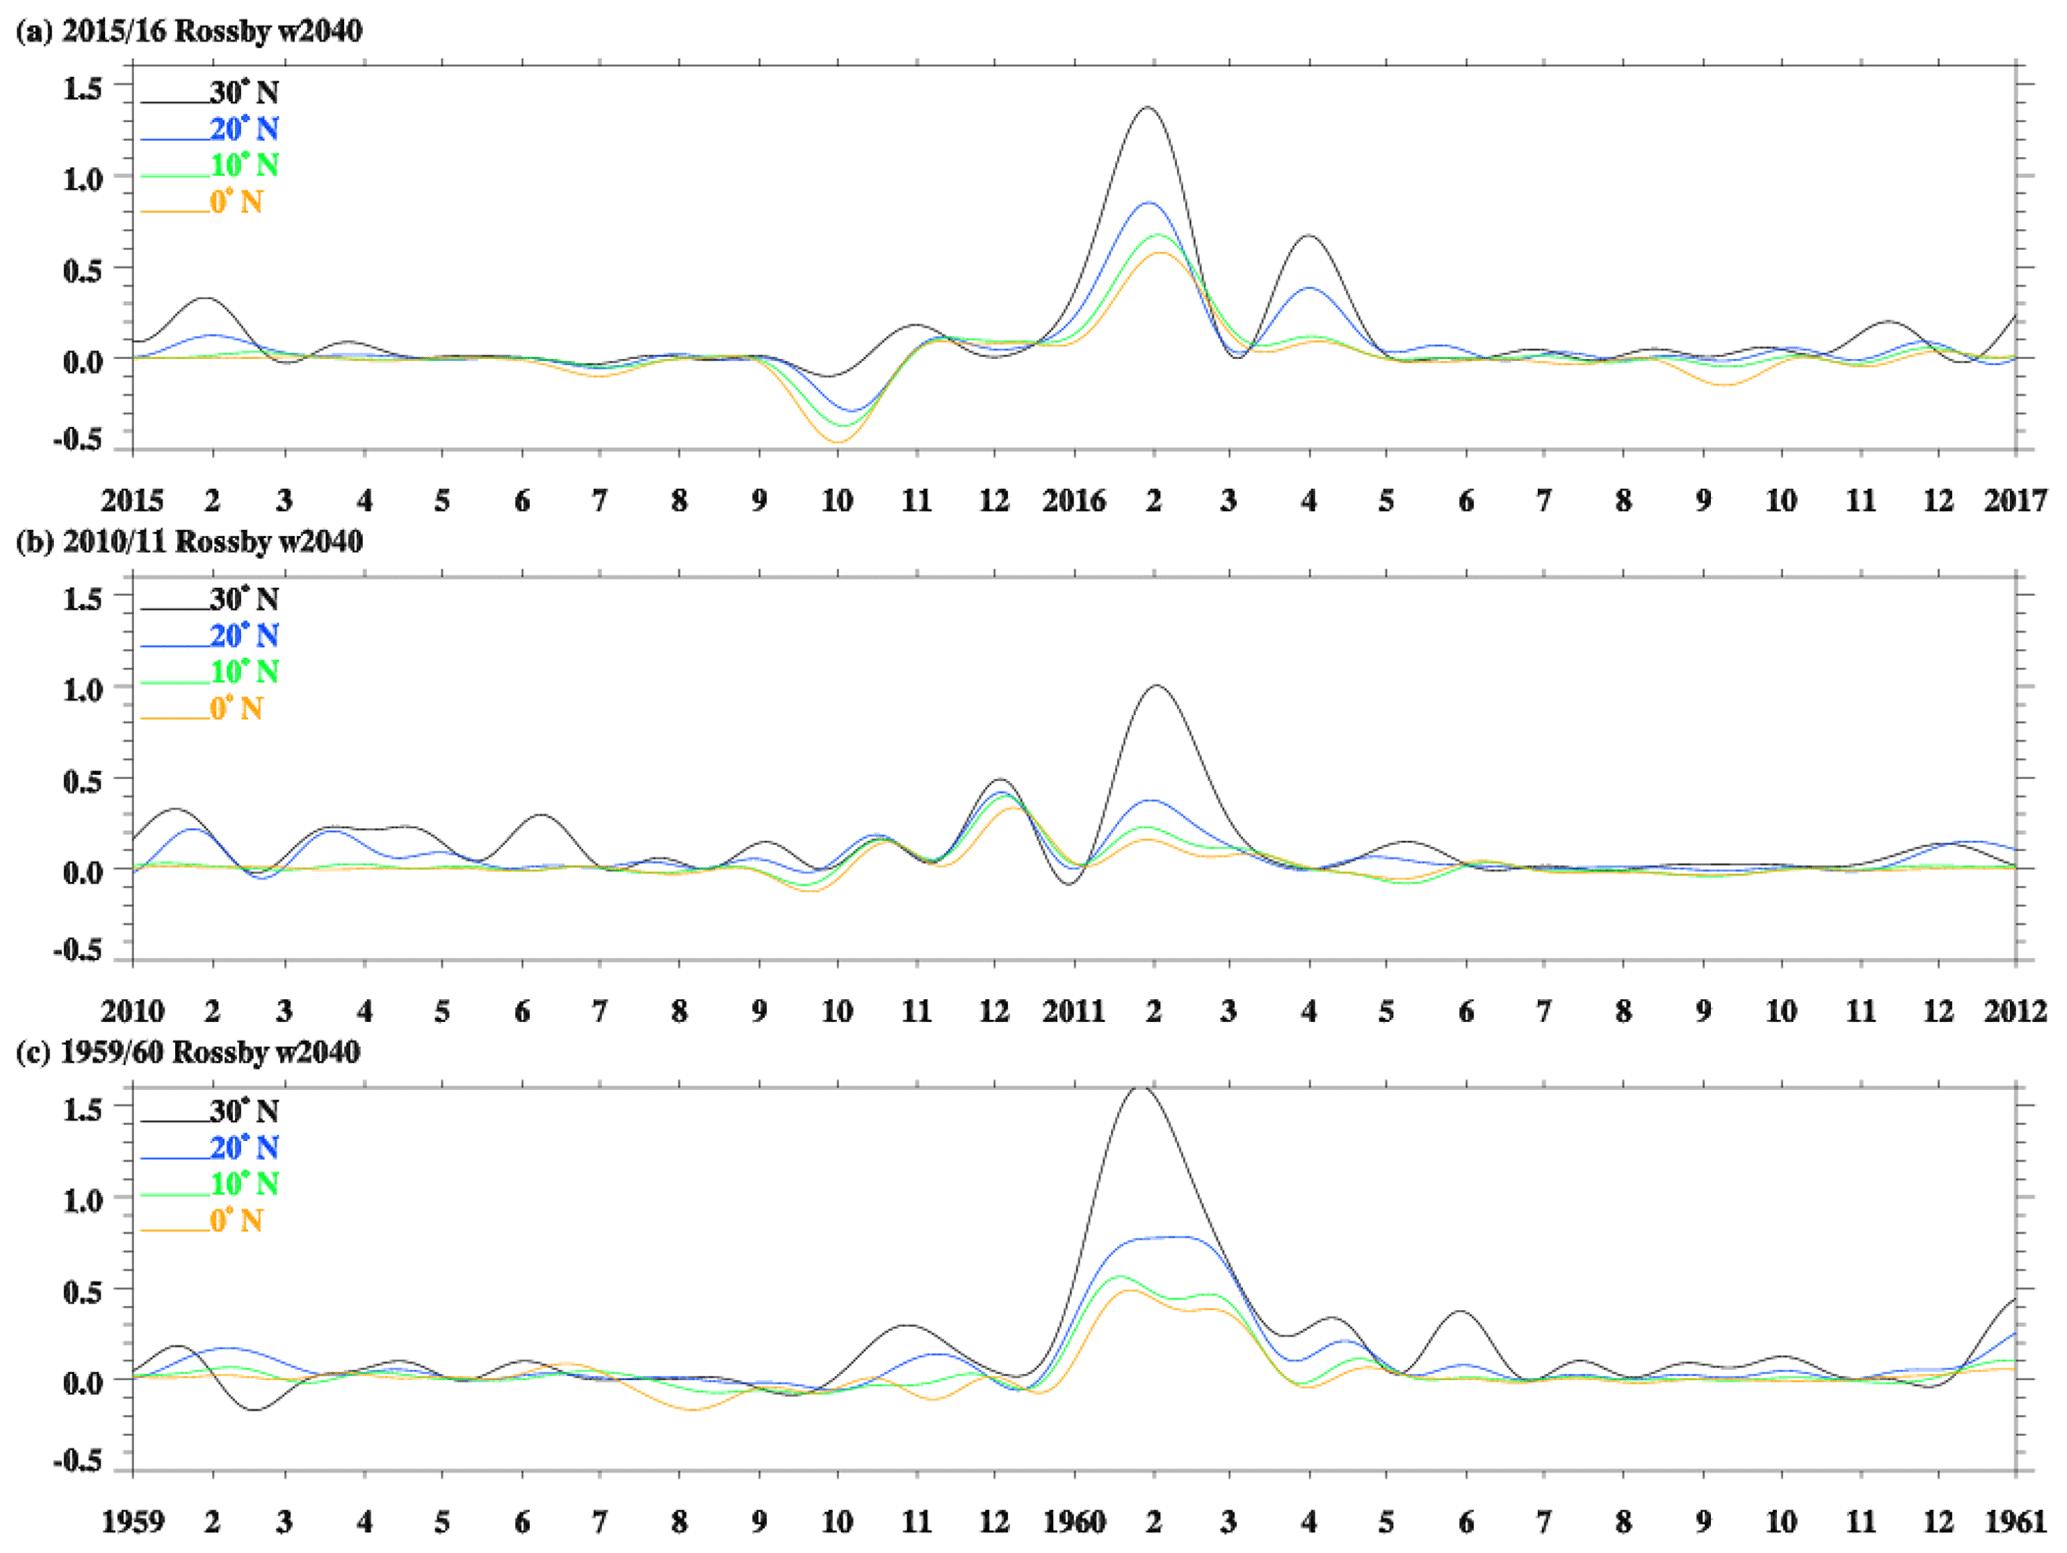
Figure 8The temporal variation in Rossby w2040 (with wavenumber 1) horizontal momentum flux anomaly at 0∘ N (orange lines), 10∘ N (green lines), 20∘ N (blue lines), and 30∘ N (black lines) in 2015/2016, 2010/2011, and 1959/1960 at 40 hPa.
3.1.2 The role of faster Rossby waves
Lin et al. (2019) reported that the low-frequency waves (with periods above 6 d) with wavenumbers 1–3 were important contributors to the reversal event in February 2016. This category would include the faster and quasi-stationary Rossby waves from our analysis. In the previous sections we demonstrated that the case-to-case differences are mostly due to the faster wave type (5–20 d periods), which will be explored in this section.
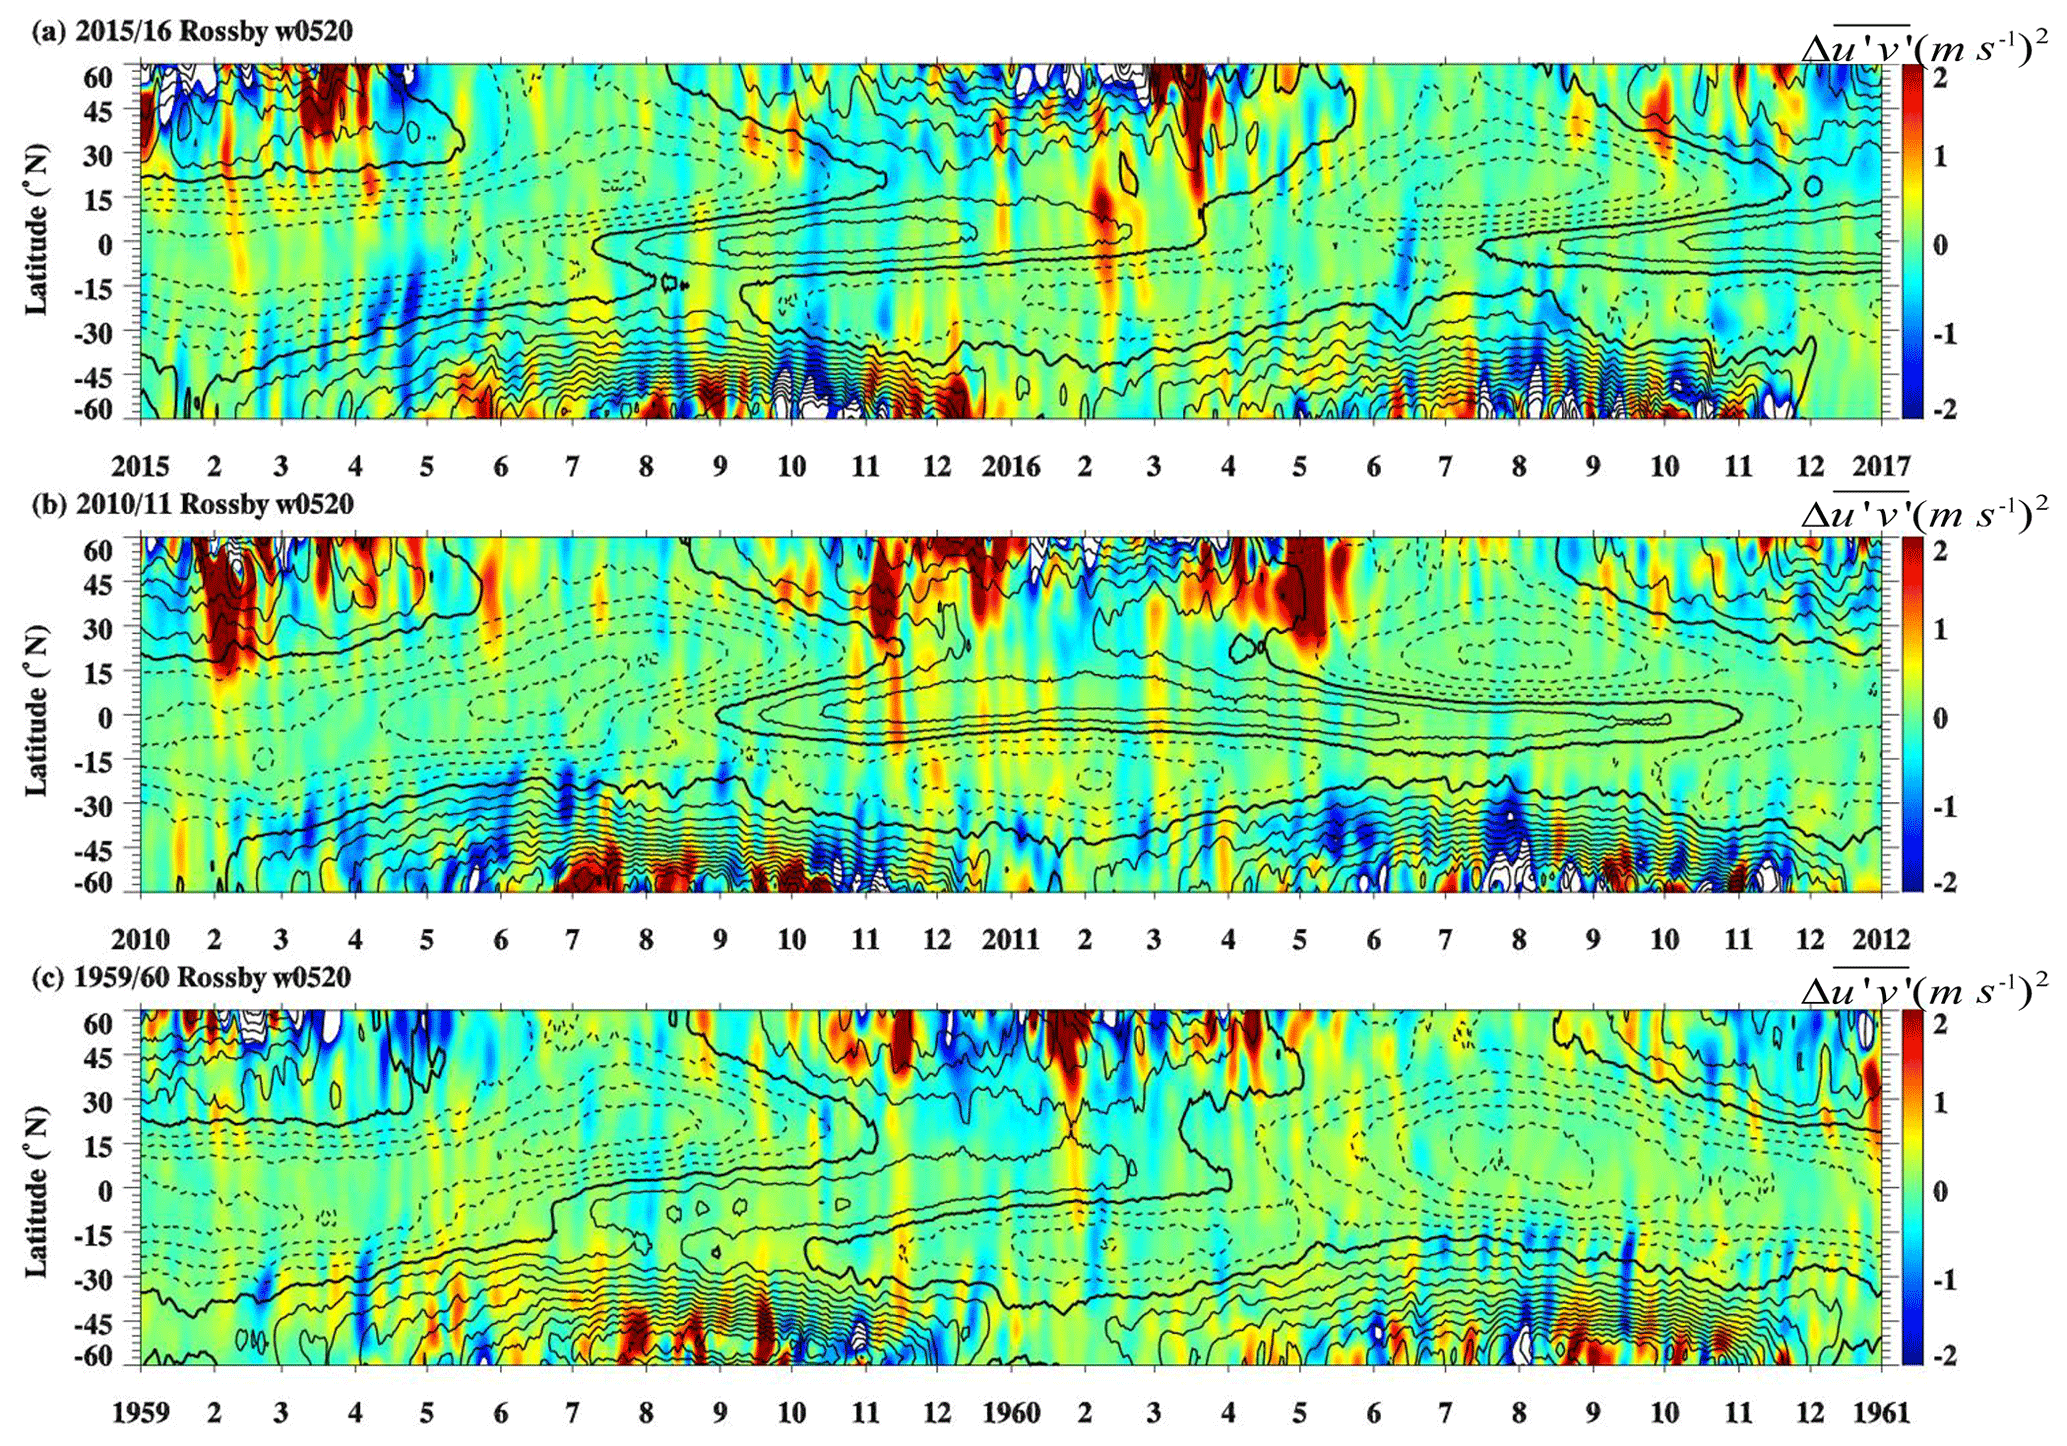
Figure 9The time–latitude cross section of the Rossby waves (with periods of 5–20 d) in (a) 2015/2016, (b) 2010/2011, and (c) 1959/1960 at 40 hPa. Color shadings denote the anomalies with respect to the monthly climatology (0 m2 s−2). The zonal mean zonal wind is overlaid in black contours with contour interval of 5 m s−1. The solid and dotted black contours denote westerly and easterly winds, respectively. The thick contours represent the zero wind line.
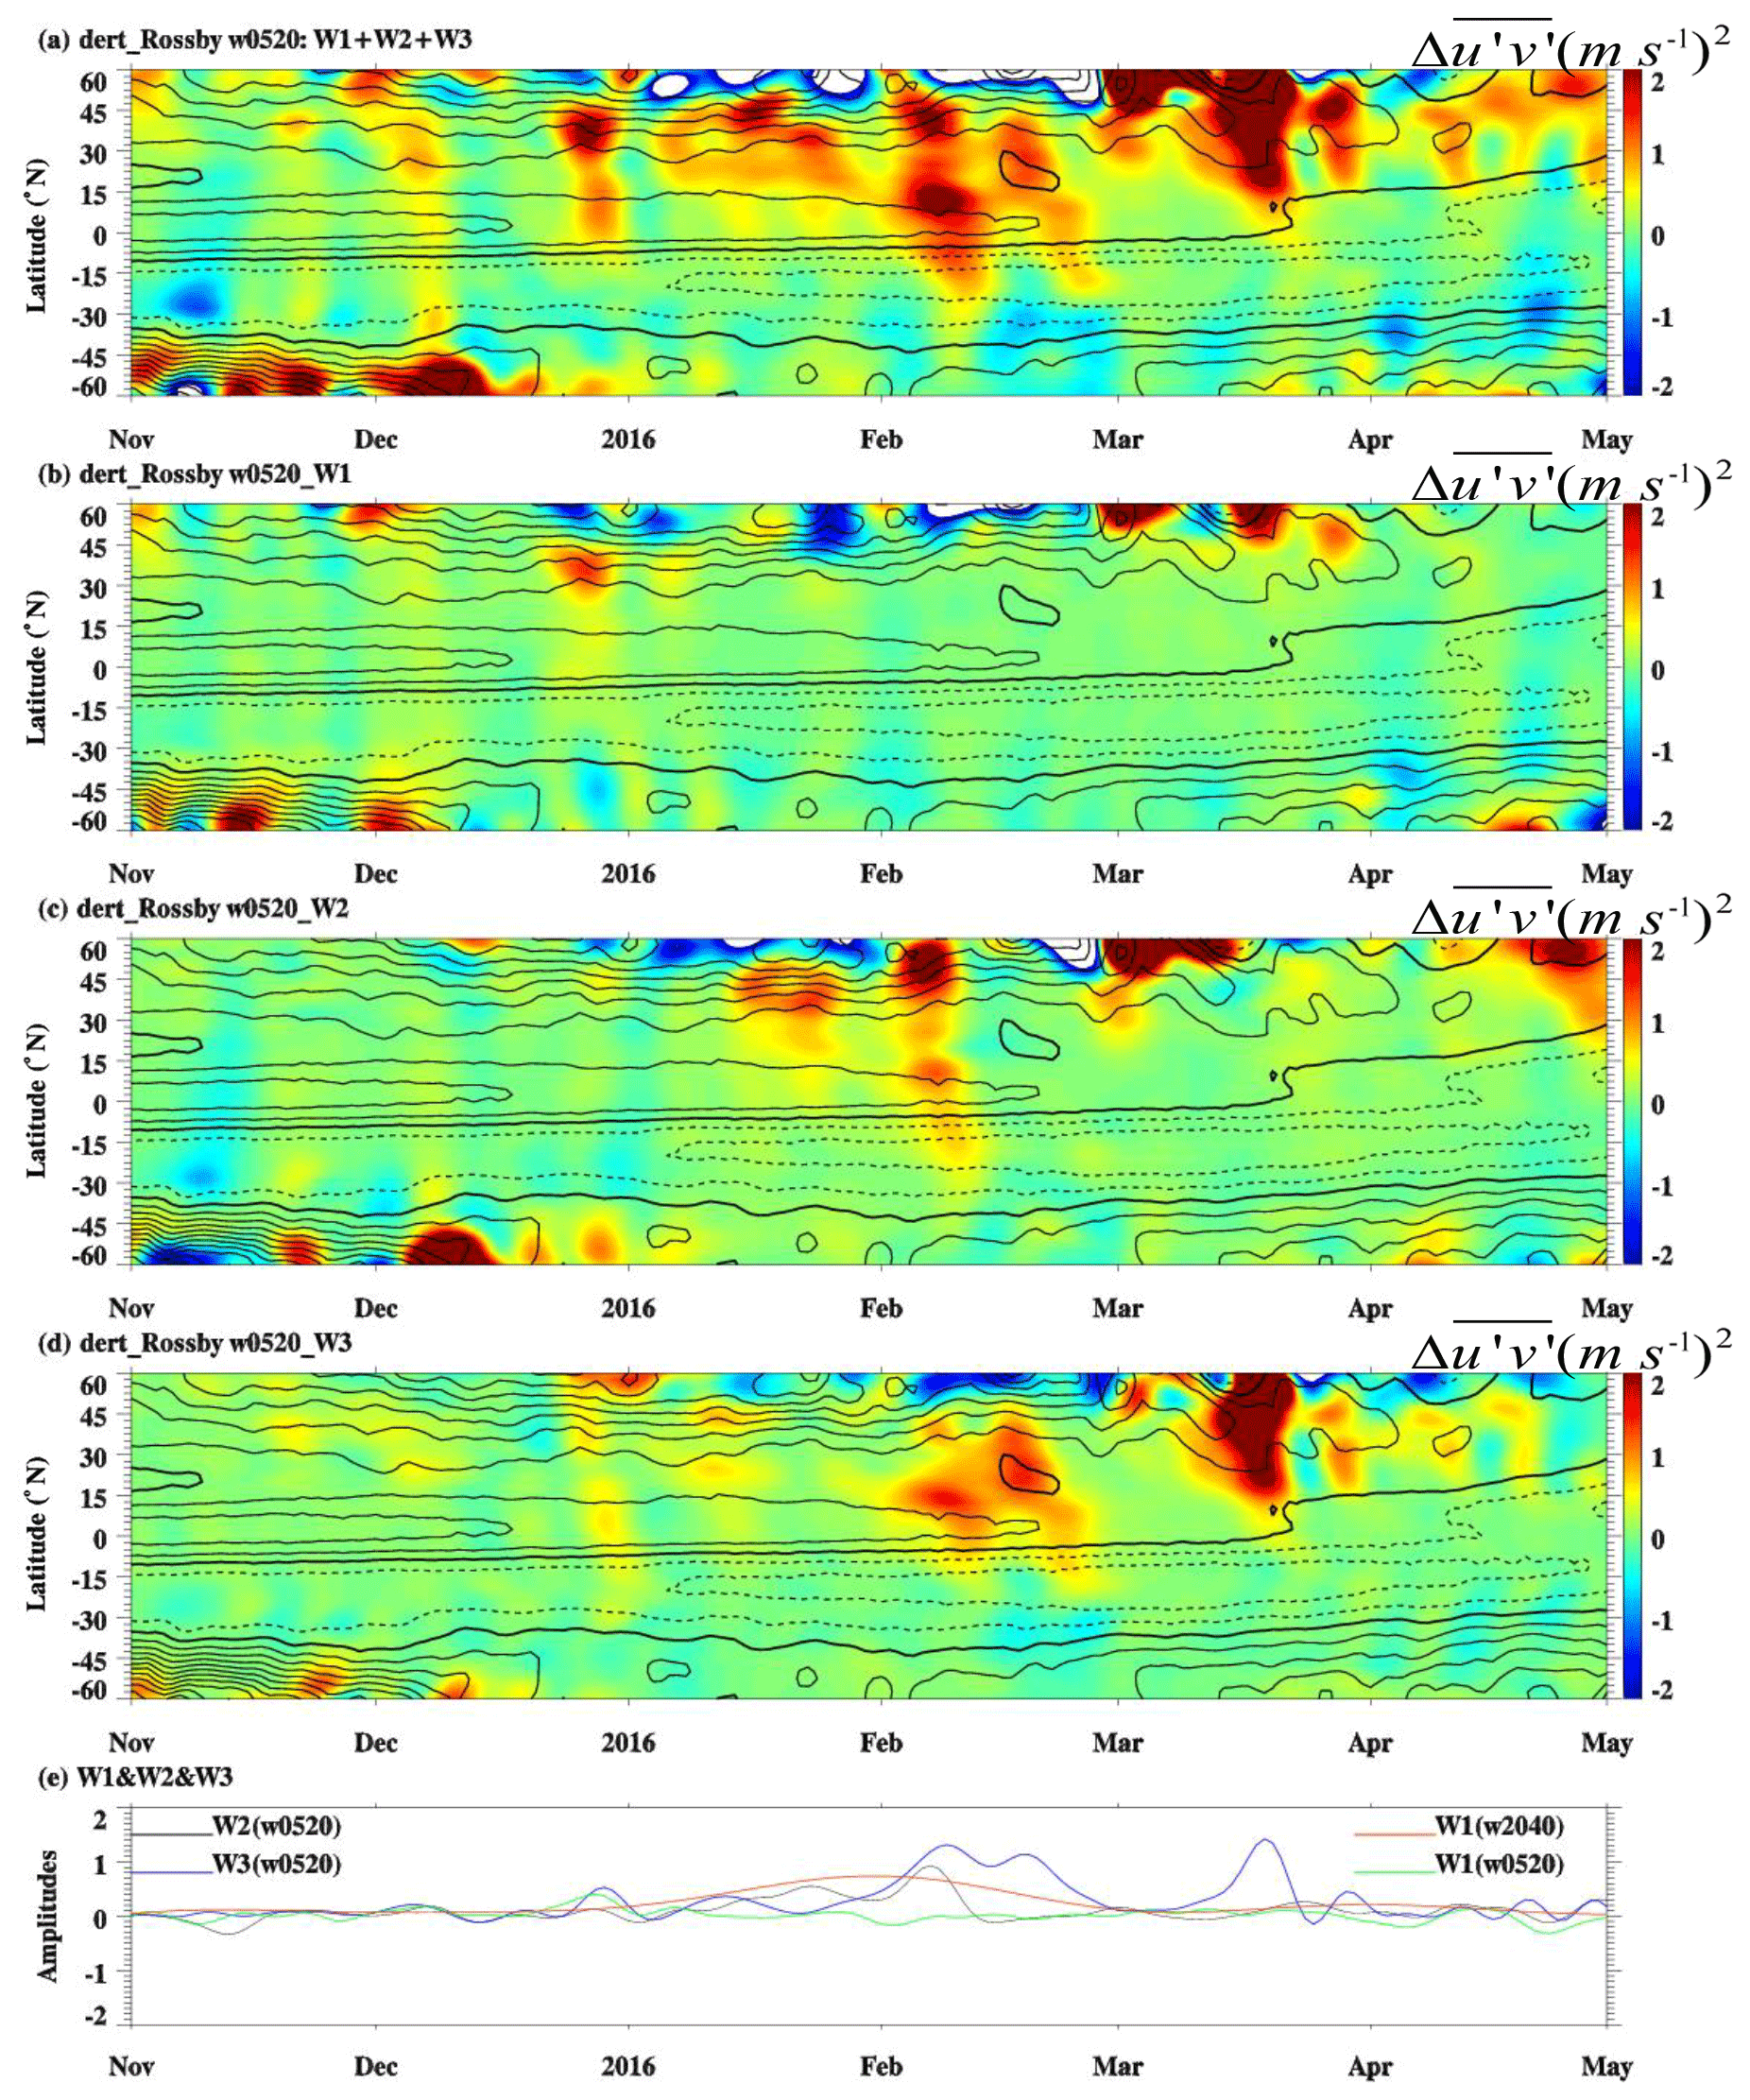
Figure 10The time–latitude cross section of Rossby w0520 horizontal momentum flux anomalies (a) W1 + W2 + W3, (b) W1, (c) W2, and (d) W3 from November 2015 to April 2016. Color shadings denote the anomalies with respect to the monthly climatology (0 m2 s−2). The zonal mean zonal wind is overlaid in black contours with contour interval of 5 m s−1. The solid and dotted black contours denote westerly and easterly winds, respectively. The thick contours represent the zero wind line. W1, W2, and W3 denote the Rossby w0520 with wavenumber 1, 2, and 3, respectively. Panel (e) shows the horizontal momentum flux anomaly of W1, W2, W3, and Rossby w2040 (with wavenumber 1) at 40 hPa averaged from 10 to 20∘ N.
We explored the activity of faster Rossby waves (Rossby w0520; dark blue lines in Fig. 5), separating wavenumbers 1, 2, and 3, which will be referred to as W1, W2, and W3 in the following. The time–latitude structure of the horizontal Rossby waves w0520 momentum flux anomaly for each case is shown in Fig. 9. In the tropics, the largest anomaly of Rossby waves w0520 is found in February. Figure 9 shows that the amplitude of the horizontal Rossby wave w0520 momentum flux anomaly was stronger in the extratropics in January 1960 and November 2010, while there were two peaks in February 2016 around 40 and 15∘ N. We therefore focus now on the contributions of W1, W2, and W3 separately during the 2016 reversal event by analyzing the time–latitude cross section of their horizontal momentum flux anomaly from November 2015 to April 2016 at 40 hPa (Fig. 10). The activity of W2 and W3 was enhanced in 2015/2016 but the activity due to W1 was very weak. The maximum horizontal momentum flux anomaly of W2 occurred around 40∘ N in early February 2016 (Fig. 10c) and propagated equatorward since early February 2016. Although it is difficult to distinguish in Fig. 10, W2 activity shows with some days' lag between 40 and 15∘ N (see Fig. S4), indicating its extratropical origin and equatorward propagation.
The peak of W3 occurs in early February 2016, around 15∘ N (as shown in Fig. 10d). Furthermore, as shown in Fig. 2, the enhanced Rossby wave activity was concentrated on the lower stratosphere (from 50 to 30 hPa). Figures 2 and 10d suggest that the W3 peak does not originate from the extratropics or the vertical propagation; therefore the remaining possibility is local wave generation. The record high horizontal momentum flux anomaly from Rossby waves in February 2016 at 40 hPa seems to be the combination of a quasi-stationary W1 (Rossby waves w2040), a faster W2 generated in the extratropics, as well as a possibly locally generated W3. Figure 10e reveals that the peaks of W1 (Rossby waves w2040) and W2 occurred earlier compared to the peak of the W3 in early February 2016. This result implies that not all components of the wave packet described by Lin et al. (2019) were of extratropical origin. Strictly speaking, the wavenumber composition of a traveling Rossby wave packet should remain similar during its lifetime: the dominant wavenumber does not change. Our analysis shows that this is not the case with W3, which becomes dominant. The amplitudes of W1 (Rossby waves w2040), W2, and W3 are 0.74, 0.931, and 1.312 m2 s−2, and hence W3 was stronger than W2 and W1 (Rossby waves w2040). The locally generated W3 only occurred in February 2016, and we do not find such behavior in other cases, whose Rossby wave contributions are exclusively of extratropical origin (see Figs. S5 and S6 for comparison with Fig. 10).
3.1.3 The possible source of local Rossby wave generation
Figure 10e demonstrates that the quasi-stationary W1 (Rossby waves w2040) and the faster W2 and W3 have stronger horizontal momentum flux anomalies in February 2016 at 40 hPa around 15∘ N. This suggests that the possibly locally generated W3 was as important as the Rossby waves which propagated from the extratropics during the reversal event in 2015/2016. Therefore it is important to investigate the possible source of the locally generated Rossby waves. As demonstrated in the previous section, the W3 generated in early February 2016 is not related to vertical or meridional propagation. In this section we will discuss two possible generation mechanisms: barotropic and baroclinic instability and nonlinear interactions.
We analyzed the barotropic and baroclinic instability in the lower stratosphere with the meridional gradient of potential vorticity at 40 hPa in February 2016 similar to Coy et al. (2017). The meridional gradient of potential vorticity was calculated at 70, 50, 40, 30, 20, and 10 hPa from January 2015 to December 2016 (as shown in Fig. S7). Figure S7 reveals that the meridional gradient of potential vorticity was greater than zero in February 2016 at 40 hPa and at lower altitudes, meaning that the atmosphere was stable during our analysis period at pressures below 40 hPa. At 40 hPa the meridional gradient starts to be negative in late March 2016, which indicates barotropic and/or baroclinic instability (see Sect. 2.4.) In this study, W3 maximizes 1 month prior to March 2016. Our result is consistent with Coy et al. (2017), who showed that was positive during the reversal event in 2015/2016, implying that instability of the large-scale flow was unlikely. Hitchcock et al. (2018) also suggested that the distribution of the could have directed and concentrated wave fluxes to this narrow region.
Another possible mechanism for the local generation of W3 is the nonlinear interaction between several different Rossby waves. Previous studies (Reznik et al., 1993; Huang et al., 2009; Tamarin et al., 2015) pointed out that nonlinear coupling processes could occur between different waves. Based on the wave interaction theory (Reznik et al., 1993; Huang et al., 2009), two waves could force a third wave if the first two waves satisfy the resonant interaction condition:
where ω and k are the frequency and wavenumber of the Rossby waves.
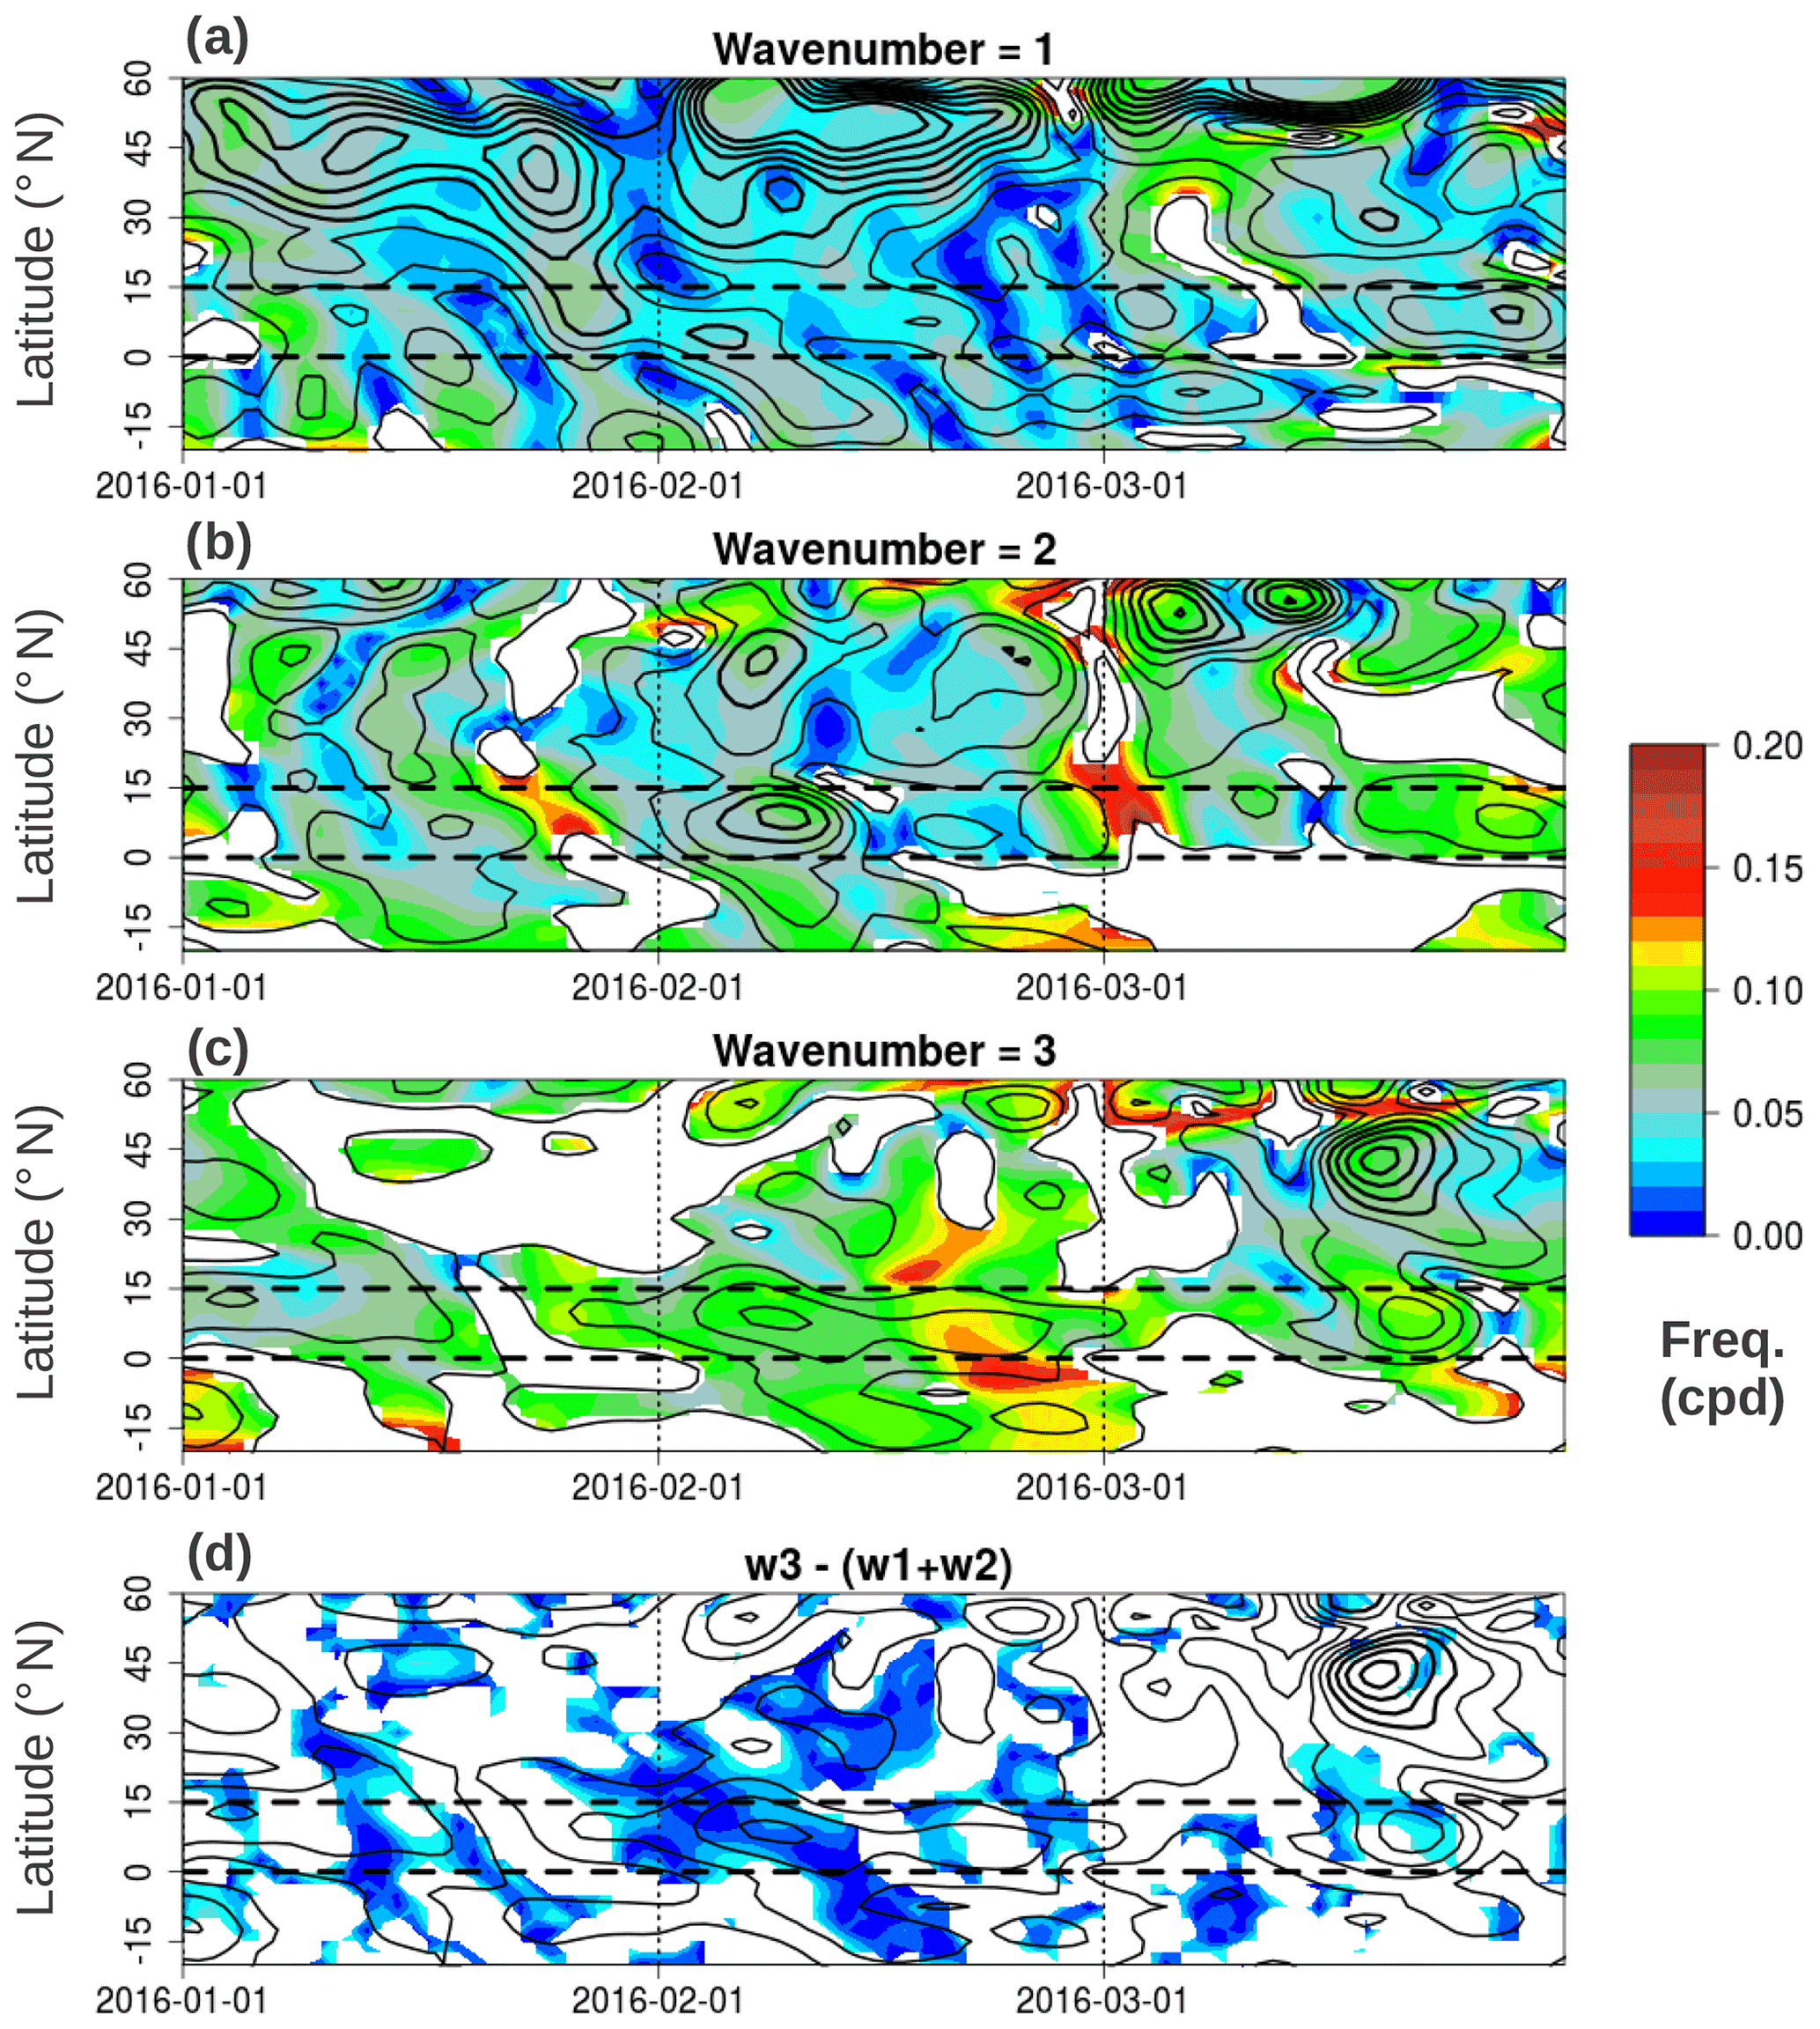
Figure 11Time–latitude cross sections of 30 hPa Rossby w0540 wave frequencies as color shadings for January–March 2016: (a) W1, (b) W2, and (c) W3. In panel (d) the absolute difference in frequency of W3 − (W1 + W2) is shown, indicating the deviation from resonant conditions. Black contours indicate amplitudes of the corresponding wavenumbers in panels (a)–(c), starting at 1 m s−1 with that same interval. In panel (d) the black contours repeat W3 amplitudes. In panels (a), (b), and (c), frequencies of waves with very low amplitude (below 1 m s−1) are masked out. In panel (d), frequency differences above 0.04 cpd (i.e., far from resonant condition) are masked out for better visibility. Wave properties were obtained using zonal winds.
We analyze the frequency behavior of W1, W2, and W3 by using the phase position of the filtered Rossby w0540 of each wavenumber to calculate their phase speeds and transform them into frequencies at a daily resolution. This analysis is very sensitive to the wave's phase position; therefore it is applied directly to the standard 30 hPa level without any interpolation and using only zonal winds. W1, W2, and W3 frequencies for January–March 2016 at 30 hPa are presented in Fig. 11a–c. We also repeated the same analysis also at the 50 hPa level, obtaining similar results (see Fig. S8).
It can be observed in Fig. 11a–c that during periods of increased wave activity, all wavenumbers' frequencies do not remain constant: they accelerate and slow down many times during January–March 2016. During the end of January and February 2016, W1 frequency (Fig. 11a) in the subtropics and Equator varies around 0.02 and 0.04 cycles per day (cpd, i.e., periods above 20 d), in agreement with the previously diagnosed quasi-stationary W1 from an extratropical origin. W2 (Fig. 11b) in the end of January 2016 at 15–30∘ N has frequencies around 0.03 cpd (∼30 d period, also in the quasi-stationary range) while having relatively low amplitude and showing signs of equatorward propagation. At the beginning of February, W2 can be seen accelerating while it amplifies, reaching frequencies of 0.07 cpd coinciding with its maximum amplitude near 10∘ N, then quickly losing amplitude and frequency by mid-February. W3 (Fig. 11c) in late January shows no activity or very low amplitudes throughout the extratropics, starting to gain amplitude within the NH tropics with frequencies around 0.06–0.09 cpd. Between the beginning and middle of February, W3 maximizes its amplitude and seems to propagate outward from the tropics, with a similar frequency range. In the second half of February 2016, W3 starts to slowly decay in amplitude while occupying a large area from 20∘ S to about 40∘ N, with markedly higher frequencies of around 0.09–0.14 cpd. W3 has nearly dissipated by March.
According to Eq. (4), to satisfy the resonance mechanism, the frequency of W3 minus the sum of W1 and W2 needs to be close to zero. Figure 11d highlights where this happens by only showing where the absolute value of in terms of frequency is below 0.04 cpd (blue colors; the rest is masked out). In Fig. 11d dark blue colors, or values close to resonance, rarely last more than a couple of days or they tend to have significant amounts of lighter blue colors. Only by the end of January and the first half of February are the values close to resonance (less than 0.02; dark blue in Fig. 11d) for about 2 weeks in a row, a fair amount of time for a resonant wave to build up. This coincides with the amplification of w3 and its expansion outward from the tropics in Fig. 11c, as well as the large W3 momentum flux anomalies in Fig. 10d.
In mid-February there is a break in the resonance condition, depicted by the absence of blue color in Fig. 11d. It can be noted that W2 has nearly dissipated near 15∘ N by this time (Fig. 11b), and interestingly this is immediately followed by a sudden acceleration of W3, with higher frequencies as yellow and red colors in Fig. 11c. Perhaps this is an indicator that the W3, in the absence of forcing (no resonance of W1 and W2 as the latter dissipated), starts a transition into a faster and decaying free mode in the second half of February 2016.
It was noted by Reznik et al. (1993) that this wave resonance mechanism generally works in the shortwave domain, with resonant interaction at planetary scales happening only in exceptional cases. The reasons for this special behavior and the exact timing and location of the waves would need further work and is beyond the scope of this paper.
Both W2 and W3 had important contributions to the enhanced Rossby wave horizontal momentum flux anomaly in the tropics (Fig. 10). Our results from Figs. 10 and 11 indicate that the mechanism for the local generation of W3 at 15∘ N, 40 hPa, was nonlinear interaction and resonance between a quasi-stationary Rossby wave W1 and a faster Rossby wave W2 of extratropical origin. Coy et al. (2017) noted that the horizontal momentum flux anomalies were very concentrated at a specific height range and latitude during the QBO reversal of the winter of 2015/2016, which is in agreement with our result. The very rare origin of W3 at 15∘ N and its important contribution to these momentum fluxes could explain why it was so localized, since the conditions for nonlinear interaction and resonance must have been very localized too.
In summary, we explored the Rossby wave horizontal momentum flux anomaly in the extratropics as well as in the tropics for three different cases (1959/1960, 2010/2011, and 2015/2016). The results show that the Rossby wave horizontal momentum flux anomaly in the tropics is dominated by a quasi-stationary Rossby wave W1 originating from the extratropics, as well as enhanced activity of faster Rossby waves, which amount to the largest case-to-case differences (e.g., an equatorward-propagating extratropical Rossby wave W2 and the locally generated Rossby wave W3 in the 2015/2016 case). During the 2015/2016 reversal event at 40 hPa, the locally generated Rossby wave W3 had the largest and most localized contribution (among faster Rossby waves) to the record horizontal momentum flux anomalies in the tropics.
Whereas the total structure from W1, W2, and W3 around 15∘ N resembles that of a wave packet as described by Lin et al. (2019), our results suggest that only the W1 and W2 components are of extratropical origin. The W3 component seems to originate later from the resonant interaction between W1 and W2.
The reversal event not only depends on the enhanced Rossby wave activity in the tropics but also on the different background zonal winds. The peaks of the Rossby wave horizontal momentum flux anomaly almost correspond to the strongest westerly zonal wind (greater than 10 m s−1) in November 2010 (see Fig. 5). Meanwhile, in January 1960 and February 2016 the peaks of the Rossby wave horizontal momentum flux anomalies correspond to a weaker zonal wind (less than 5 m s−1). Through a comparison of the results in January 1960 and February 2016 when the background zonal winds were similar (see Figs. 9a and 9c), we found that the enhanced Rossby wave activity is an important factor for the reversal event in 2015/2016. The stronger Rossby wave horizontal momentum flux anomaly together with the weaker westerly zonal mean zonal wind both played significant roles for the reversed westerly zonal wind at 40 hPa in February 2016. Lin et al. (2019) pointed out that the westerly flow was decelerated by mixed Rossby gravity wave momentum fluxes (MRG, with ∼6–2 d periods: mostly faster waves than those analyzed in our study) prior to the appearance of the low-frequency waves, i.e., the W1–3 wave packet.
3.2 Reasons for the unusually long westerly zonal wind at 20 hPa
This subsection will focus on the behavior of Kelvin waves during the unusually long westerly zonal wind at 20 hPa in 2015/2016. The possible role of the strong El Niño event during the long-lasting westerly zonal wind will be also explored. As shown in Fig. 1a the westerly zonal mean zonal wind lasted for an unusually long time in 2015/2016 at 20 hPa. Previous research mainly focused on the interruption of the westerly zonal wind near 40 hPa in 2015/2016, and only a few other studies (Newman et al., 2016; Coy et al., 2017; Kumar et al., 2018) noticed the unusual behavior of the zonal mean zonal winds above 30 hPa. We found that the average period of westerly zonal mean zonal wind at 20 hPa is 10.6 months between 1958 to 2014 (Fig. 12). However, in 2015/2016 the westerly zonal wind lasted 23 months (from May 2015 to March 2017) which is much longer than the maximum period (16 months) from 1958 to 2014. No similar westerly zonal wind period has ever been observed.

Figure 12The minimum, average, and maximum periods (triangles) of the westerly zonal wind at 20 hPa from 1958 to 2014. The star signal denotes the period of westerly zonal wind at 20 hPa in 2015/2016.
Newman et al. (2016) noticed that the westerly zonal wind started to migrate upward instead of downward from November 2015 to April 2016 above 30 hPa. The extended westerly zonal wind and the upward-propagating westerly zonal wind above 30 hPa could result from wave-mean flow interaction. Since Kelvin waves are generated in the troposphere and propagate upward to the lower stratosphere where they initiate an eastward acceleration of the zonal mean zonal wind (Baldwin et al., 2001), they might play a role in the extended westerly zonal winds.

Figure 13Temporal evolution of Kelvin wave activity as squared zonal wind anomalies averaged over 10∘ S–10∘ N in the vertical direction. Color shading denotes the anomalies with respect to the monthly climatology (0 m2 s−2). The horizontal dashed lines denote the altitudes of 20 and 40 hPa. The zonal mean zonal wind is overlaid in black contours with contour interval of 5 m s−1. The solid and dotted black contours denote westerly and easterly winds, respectively. The thick contours represent the zero wind line. The horizontal solid lines denote the El Niño (single line) and strong El Niño periods (double line) in the bottom.
Figure 13 shows a predominance of above-average Kelvin wave squared perturbations in zonal wind (mostly red and yellow shading and absence of blue) in the upper troposphere around 200 and 100 hPa throughout 2015 and early 2016. The upper-tropospheric Kelvin waves can be seen propagating upward within easterly winds most of the time. Also, from December 2015 to April 2016, vertical propagation of Kelvin waves can be observed within weak westerly winds between 50 and 20 hPa, which will be discussed in more detail below. Since the vertical momentum flux from westward-propagating Rossby waves (Fig. S2) is very weak during this time, we will focus only on vertical momentum flux anomalies from Kelvin waves in the following (Fig. 14).
.
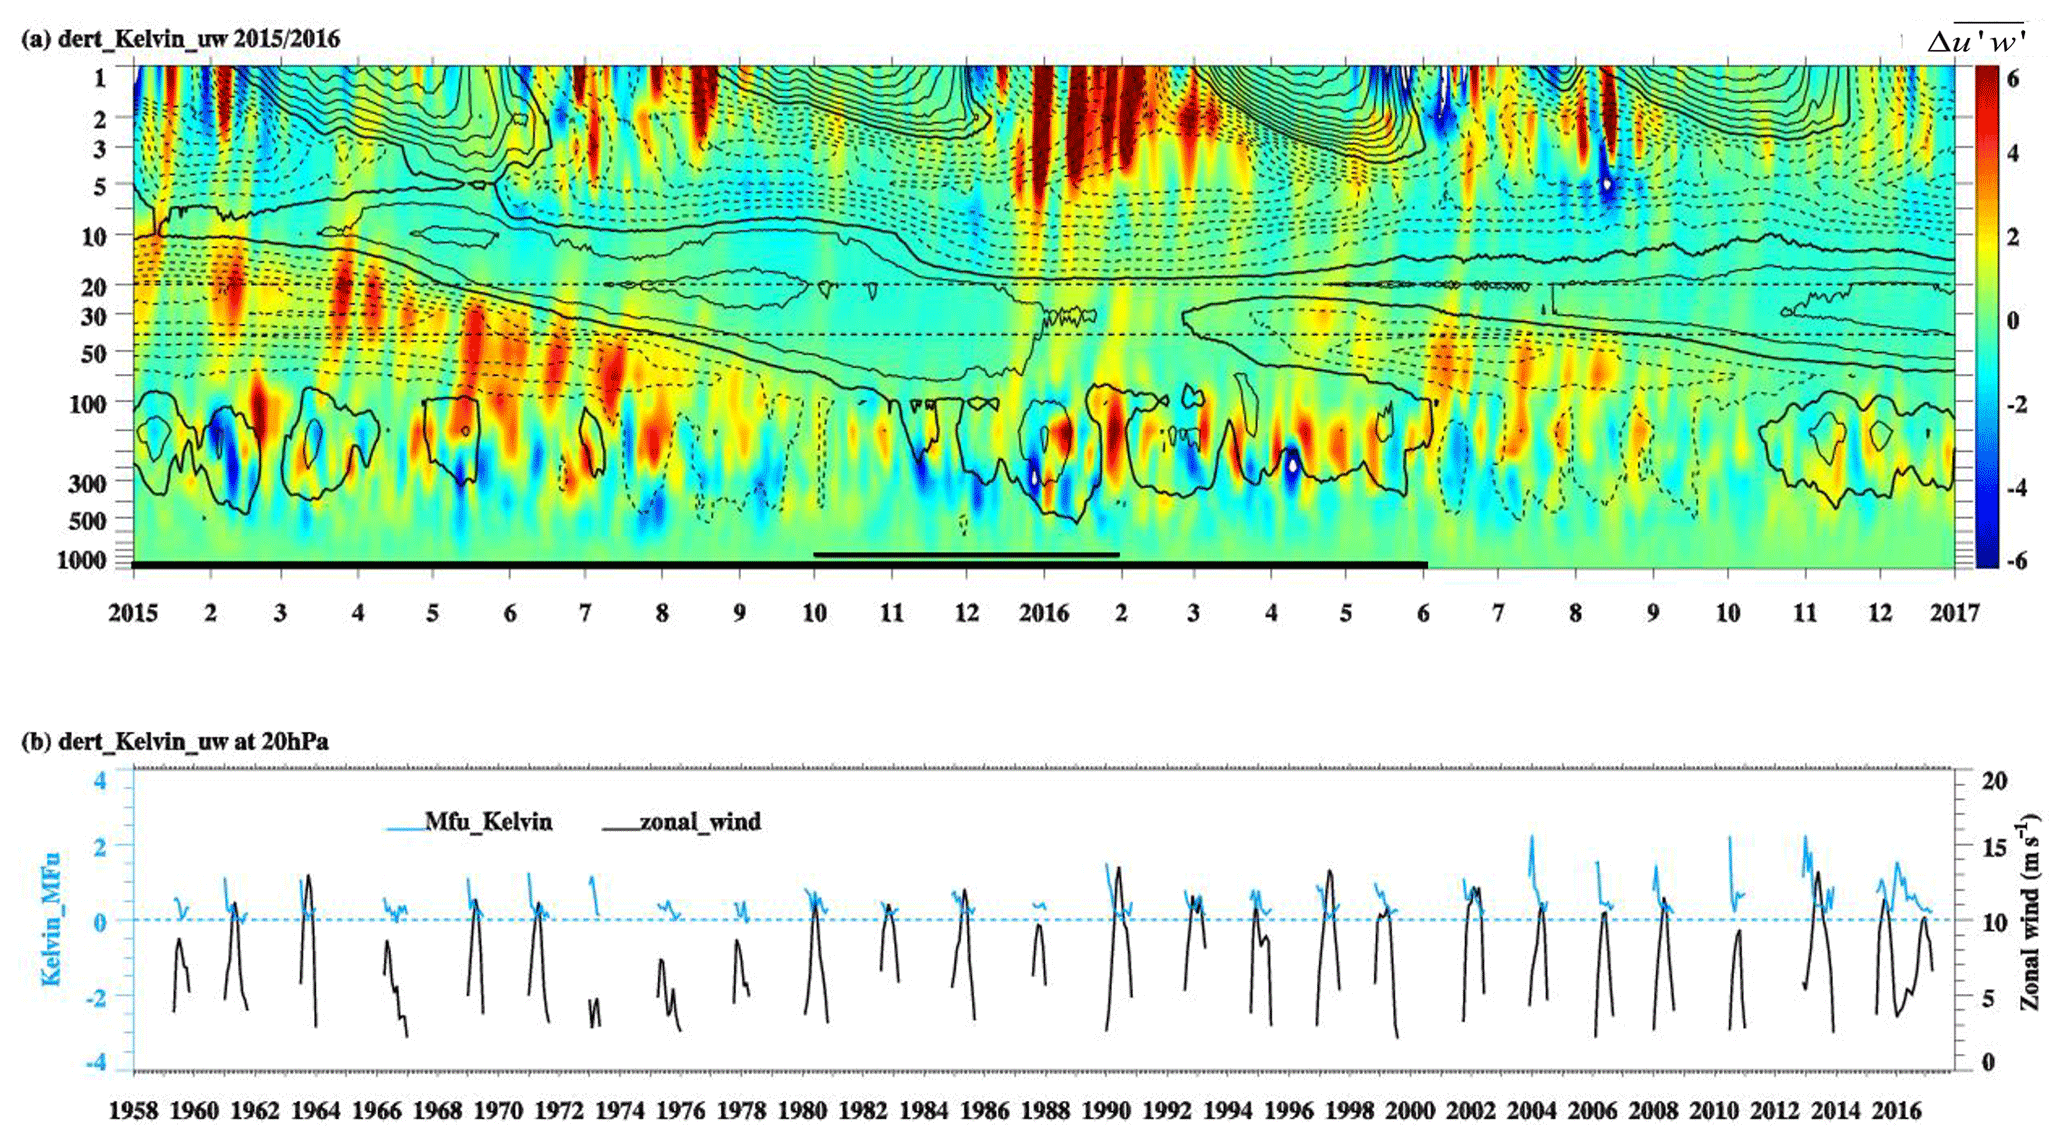
Figure 14Temporal evolution of Kelvin wave vertical momentum flux anomalies averaged over 10∘ S–10∘ N. Panel (a) shows the daily time-altitude cross section from 2015 to 2016. Color shading denotes the anomalies with respect to the monthly climatology (unit is 10−3 m2 s−2). The zonal mean zonal wind is overlaid in black contours with contour interval of 5 m s−1. The solid and dotted black contours denote westerly and easterly winds, respectively. The thick contours represent the zero wind line. In panel (a), the horizontal dashed lines denote the altitudes of 20 and 40 hPa, respectively. The horizontal solid lines denote the El Niño period (single line) and strong El Niño period (double line) in the bottom. Panel (b) shows the monthly mean Kelvin wave vertical momentum flux anomalies (blue line) and the westerly background zonal wind (black line) at 20 hPa from 1958 to 2017, exclusively during the westerly QBO phase. In panel (b), the dashed line denotes the vertical Kelvin wave momentum flux anomaly value of 0 m2 s−2
Figure 14a demonstrates that the vertical momentum flux anomaly from Kelvin waves was strong during most of the easterly zonal wind condition from the troposphere to the stratosphere in 2015. Furthermore, the vertical momentum flux anomaly from Kelvin waves was also above-average from December 2015 to April 2016 from 50 to 20 hPa which agrees with the increased squared zonal wind perturbations of Kelvin waves (Fig. 13). It should be noted that from December 2015 to around April 2016 near 20 hPa the background zonal mean zonal wind is westerly. Also in the levels down to 300 hPa, from December 2015 until February 2016, the mean zonal winds are weak westerlies or around zero. Kelvin waves were propagating upward at the time, while in theory they do this within easterlies. Also, if the Kelvin wave's phase speed exceeds that of the westerly flow, it is possible that the Kelvin wave propagates upward within weak westerlies as reported by Ern et al. (2008).
We analyzed the vertical momentum flux anomaly from Kelvin waves during the westerly zonal wind conditions at 20 hPa from 1958 to 2016 (Fig. 14b). The result shows that the maximum vertical momentum flux anomaly from Kelvin waves corresponds to the beginning of the westerly zonal wind phase in general (Fig. 14b). The vertical Kelvin wave momentum flux anomaly becomes weaker when the westerly zonal wind gets stronger. The westerly zonal wind starts in May 2015 (around 3 m s−1). Meanwhile the vertical Kelvin wave momentum flux anomaly was around ( m2 s−2). From late 2015 to early 2016 the amplitude of the background zonal wind was similar to the background zonal wind in May 2015, but the vertical momentum flux anomaly from Kelvin waves was much stronger. The amplitudes of the vertical Kelvin wave momentum flux anomaly in December 2015 and January, February, March, and April 2016 are 0.88, 1.54, 1.31, 0.872, and () m2 s−2, respectively. They are much larger than the average values ( m2 s−2) in westerly zonal wind conditions from 1958 to 2014. The vertical momentum flux anomaly from Kelvin waves started to increase from December 2015 and ended in April 2016, which corresponds to the upward-propagating westerly zonal winds (Fig. 2) reported in Newman et al. (2016). The unusually large vertical momentum flux anomaly from Kelvin waves from December 2015 to April 2016 was deposited in the westerly zonal wind and resulted in additional eastward momentum and hence a prolongation of the westerly winds at 20 hPa.Typically, Kelvin wave momentum deposition promotes downward propagation of the QBO westerly phase, since the waves encounter westerly shear and a rather narrow region below the critical level near the bottom of the QBO westerlies where the Kelvin wave momentum is deposited. This is not the case in early 2016, with weak westerlies (weak easterlies later on), low shear between 100 and 20 hPa, and easterly shear above. These sub-critical conditions make the height range for Kelvin wave momentum deposition quite a lot broader than usual, thereby enabling a prolongation and even upward propagation of the westerly QBO phase. This interpretation would be in agreement with Das and Pan (2015), who found a faster-descending QBO westerly phase only when the lower-stratospheric winds favored Kelvin wave upward propagation (not the case in early 2016).
We also analyzed the temporal variation in the ENSO index and the convective activity in the tropics (Fig. S9). The ENSO index was larger than 2 K (strong El Niño event) from October 2015 to January 2016. Tropospheric convective activity is represented by the Outgoing Long-wave Radiation (OLR). The deviations of zonal mean OLR from the monthly climatology had minimum values in February 2016, which corresponds to enhanced convective activity and at the same time to the enhanced Kelvin wave activity at 20 hPa (Fig. S9). Moreover, the convective activity and the vertical momentum flux anomaly from Kelvin waves at 20 hPa have much stronger values in January, February, March, and April 2016 which corresponds to the reversal event at 40 hPa (Fig. 14). We also calculated the squared perturbations in zonal wind for Kelvin waves as deviation from the monthly climatology at 200 hPa during La Niña, neutral, and El Niño conditions (Fig. 15). This indicates that Kelvin wave activity is suppressed during La Niña and enhanced during El Niño conditions, in agreement with previous studies that linked increased Kelvin wave activity to El Niño (Yang and Hoskins, 2013; Das and Pan, 2015; Rakhman et al., 2017). The enhanced vertical Kelvin wave momentum flux anomaly is excited by enhanced convective activity in the troposphere caused by the strong El Niño event. The wind structure below 20 hPa that combined weak westerly and easterly zonal winds allowed Kelvin waves to propagate vertically. Moreover, as shown in Fig. 14a, the westerly zonal wind was very weak in January and February 2016. In March and April 2016 the zonal wind was in its easterly phase below 30 hPa and weak westerly around 20 hPa. This condition allowed the Kelvin waves to reach 20 hPa and deposit their vertical momentum in the background wind.
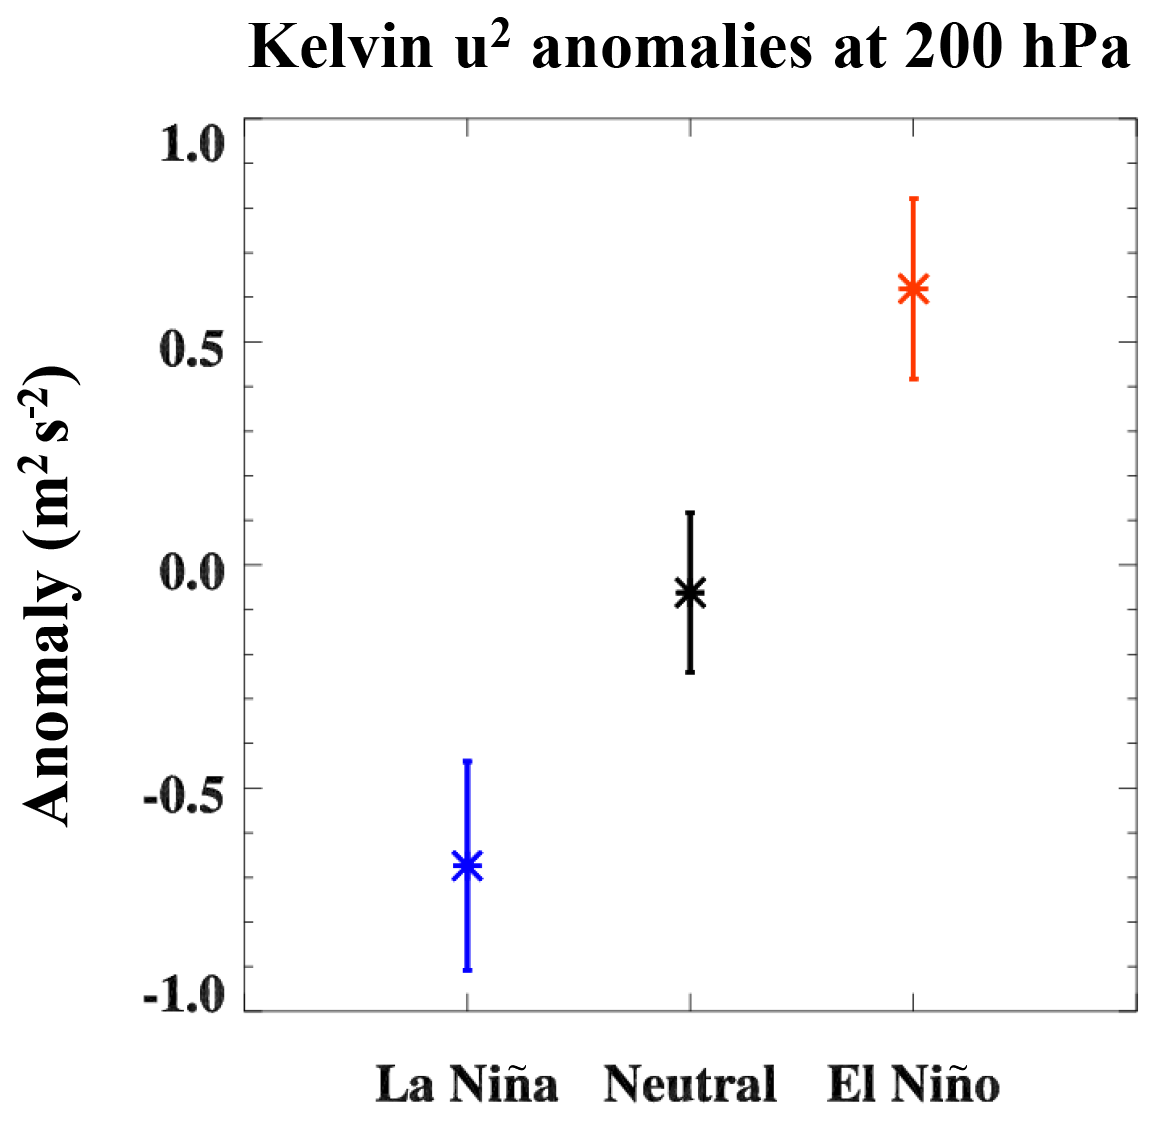
Figure 15The squared perturbations in zonal mean zonal wind for Kelvin waves averaged over 10∘ S–10∘ N at 200 hPa for La Niña (blue star), neutral (black star), and El Niño (red star) conditions. The error bars denote ±1 standard deviation of the mean values.
From our investigation, the extended westerly zonal wind near 20 hPa was possibly caused by enhanced Kelvin wave activity in 2015/2016. The above-average Kelvin wave activity (Fig. 13) and related vertical momentum flux anomalies (Fig. 14a) correspond to a strong El Niño event in 2015/2016. Although it is known that climatologically El Niño events enhance Kelvin wave activity (Yang and Hoskins, 2013; Das and Pan, 2015; Rakhman et al., 2017; Fig. 15), the 2015/2016 El Niño is one of the strongest on record (Fig. 1c). The strong Kelvin waves in the troposphere together with the unusual wind structure around 20 hPa finally lead to the extended westerly zonal winds at 20 hPa.
The QBO westerly phase was reversed by an unexpected easterly jet near 40 hPa and the westerly zonal wind lasted for an unusually long time at 20 hPa during NH winter 2015/2016. By analyzing the horizontal momentum flux anomaly from Rossby waves in the extratropics and tropics we find that Rossby waves propagating from the northern extratropics were important contributors to the easterly jet around 40 hPa, in agreement with previous studies (Osprey et al., 2016; Newman et al., 2016; Coy et al., 2017). We additionally explored different timescales and wavenumbers of the Rossby waves and concluded that quasi-stationary Rossby W1 and faster Rossby W2 waves which propagated from the extratropics had important contributions to the reversed westerly zonal wind at 40 hPa in 2015/2016 (Figs. 6 and 10). Furthermore, we find that during the reversal event a locally generated Rossby wave W3 around 15∘ N with a period of 5–20 d also played an important role (Fig. 10). We explored two possible generation mechanisms for this locally generated Rossby wave: barotropic–baroclinic instability and nonlinear wave–wave interaction. The locally generated Rossby wave w0520 with W3 in the tropics was unlikely caused by large-scale instability (Figs. 2 and 3). Our results imply that nonlinear interactions between the quasi-stationary Rossby wave W1 and faster Rossby wave W2 of extratropical origin generated the local Rossby wave W3 around 15∘ N (Fig. 11). The reasons for the special behavior and the exact timing and location of the waves is beyond the scope of this paper. In addition to the extratropical horizontal Rossby wave momentum flux anomalies and the locally generated Rossby waves in the tropics, the weaker background winds as compared to two similar winters in 1959/1960 and 2010/2011 helped to favor this unusual reversal event in February 2016. Three important and novel take-home messages result from Sect. 3.1 of our study:
-
The largest differences in horizontal Rossby wave momentum flux anomalies among all three investigated cases are related to faster Rossby waves (periods of 5–20 d) of extratropical origin.
-
The February 2016 case is unique, in the sense that it shows a local generation (in latitude and height) of a Rossby wave W3, which is not observed in any other case and has the largest and most localized contribution to the observed horizontal momentum flux anomalies.
-
We relate local generation of the aforementioned W3 to a resonant interaction between quasi-stationary Rossby wave W1 and a faster Rossby wave W2 of extratropical origin that were present at 15∘ N.
Lin et al. (2019) reported that the reversal event of the QBOW in February 2016 had a dominant contribution from a wave packet at 35.8 hPa. They also proposed that MRG played an important role for preconditioning this event. Hitchcock et al. (2018) revealed that the influence of nonlinear feedbacks of the structure is important for the disruption of the QBOW in February 2016. Our results, studying the components of the abovementioned wave packets in more detail, are consistent with previous studies while highlighting the responsible mechanisms (local W3 generation from resonant interaction).
Besides the upward propagation of westerly zonal wind regime at 20 hPa in the winter of 2015/2016 (Newman et al., 2016), we find that the westerly zonal wind lasted for an unusually long time (Figs. 12 and 13). Our results suggest that the upward-propagating and prolonged westerly zonal winds at 20 hPa could be caused by enhanced Kelvin wave activity (Figs. 13 and 14). The enhanced Kelvin wave activity could be related to strong convective activity. Indeed, the strong El Niño event in 2015/2016 favored strong convective activity, which in turn excited stronger Kelvin wave activity. Under La Niña conditions Kelvin wave activity is suppressed (Fig. 15). The weaker zonal winds in the troposphere and lower stratosphere (related to the combination of anomalous factors around 40 hPa as summarized above) favored the upward propagation of Kelvin waves. The increased Kelvin wave activity then produced more eastward and upward acceleration of the zonal mean zonal winds and led to the unusual westerly zonal wind structure at 20 hPa in 2015/2016.
The combined European Centre for Medium-Range Weather Forecasts (ECMWF) ERA-40 and ERA-interim reanalysis data sets used in our study can be downloaded from the website https://www.ecmwf.int/en/forecasts/datasets/browse-reanalysis-datasets (Uppala et al., 2005; Dee et al., 2011). The ENSO index is calculated from the NOAA Extended Reconstructed Sea Surface Temperature (SST) V4, available here https://psl.noaa.gov/data/gridded/data.noaa.ersst.html (NOAA et al., 2019). The monthly outgoing long-wave radiation (OLR) data can be accessed from the website https://www.esrl.noaa.gov/psd/data/gridded/data.interp_OLR.html (Liebmann and Smith, 1996).
The supplement related to this article is available online at: https://doi.org/10.5194/acp-20-6541-2020-supplement.
HL performed the analysis, produced most figures, and wrote the paper. RPK assisted in the methodology development, performed the wave resonance analysis for the revised manuscript, produced Fig. 11, and rewrote parts of the paper. KM motivated the study, supervised its development, and rewrote parts of the paper.
The authors declare that they have no conflict of interest.
We thank the European Centre for Medium-Range Weather Forecasts (ECMWF) for the freely available ERA-40 and ERA-Interim data, and the Free University of Berlin for the provision of the QBO data. We thank NOAA for the freely available Sea Surface Temperature data and OLR data. This work was carried out during a stay of Haiyan Li as a joint training PhD student with funding provided from the Chinese Scholarship Council at GEOMAR in Kiel (Germany). We thank Sebastian Wahl for his help with processing the ECMWF, OLR, and SST data and Wenjuan Huo for help with the figures. The authors would like to thank three anonymous reviewers whose comments and suggestions substantially improved the quality of the paper.
This research has been supported by the National Key R&D Program of China (grant no. 2019YFC1510400), the Fundamental Research Funds for the Central Universities from Sun Yat-Sen University (grant no. 20lgpy23), and the China Postdoctoral Science Foundation Grant (grant no. 2019M663204).
The article processing charges for this open-access
publication were covered by a Research
Centre of the Helmholtz Association.
This paper was edited by Timothy J. Dunkerton and reviewed by three anonymous referees.
Andrews, D. G., Holton, R. J., and Leovy, C. B.: Middle Atmosphere Dnamics, International Geophysics, 40, 1–489, 1987. a, b, c
Baldwin, M. P., Gray, L. J., Dunkerton, T. J., Hamilton, K., Haynes, P. H., Holton, J. R., Alexander, M. J., Hirota, I., Horinouchi, T., Jones, D. B. A., Marquardt, C., Sato, K., and Takahashi, M.: The quasi-biennial oscillation, Rev. Geophys., 39, 179–229, https://doi.org/10.1029/1999RG000073, 2001. a, b, c, d, e
Barton, C. A. and McCormack, J. P.: Origin of the 2016 QBO Disruption and Its Relationship to Extreme El Niño Events, Geophys. Res. Lett., 44, 11150–11157, https://doi.org/10.1002/2017GL075576, 2017. a, b, c
Blume, C., Matthes, K., and Horenko, I.: Supervised Learning Approaches to Classify Sudden Stratospheric Warming Events, J. Atmos. Sci., 69, 1824–1840, https://doi.org/10.1175/JAS-D-11-0194.1, 2012. a
Calvo, N., Garcia, R. R., Randel, W. J., and Marsh, D. R.: Dynamical Mechanism for the Increase in Tropical Upwelling in the Lowermost Tropical Stratosphere during Warm ENSO Events, J. Atmos. Sci., 67, 2331–2340, https://doi.org/10.1175/2010JAS3433.1, 2010. a
Christiansen, B., Yang, S., and Madsen, M. S.: Do strong warm ENSO events control the phase of the stratospheric QBO?, Geophys. Res. Lett., 43, 10489–10495, https://doi.org/10.1002/2016GL070751, 2016. a
Coy, L., Newman, P. A., Pawson, S., and Lait, L. R.: Dynamics of the disrupted 2015/16 quasi-biennial oscillation, J. Climate, 30, 5661–5674, https://doi.org/10.1175/JCLI-D-16-0663.1, 2017. a, b, c, d, e, f, g, h, i, j, k, l, m, n, o, p, q
Das, U. and Pan, C.: Equatorial atmospheric Kelvin waves during El Nino episodes and their effect on stratospheric QBO, Sci. Total Environ., 544, 908–918, https://doi.org/10.1016/j.scitotenv.2015.12.009, 2015. a, b, c
Dee, D. P., Uppala, S. M., Simmons, A. J., Berrisford, P., Poli, P., Kobayashi, S., Andrae, U., Balmaseda, M. A., Balsamo, G., Bauer, P., Bechtold, P., Beljaars, A. C. M., van de Berg, L., Bidlot, J., Bormann, N., Delsol, C., Dragani, R., Fuentes, M., Geer, A. J., Haimberger, L., Healy, S. B., Hersbach, H., Holm, E. V., Isaksen, L., Kallberg, P., Kohler, M., Matricardi, M., McNally, A. P., Monge-Sanz, B. M., Morcrette, J.-J., Park, B.-K., Peubey, C., de Rosnay, P., Tavolato, C., Thepaut, J.-N., and Vitart F.: The ERA-Interim reanalysis: Configuration and performance of the data assimilation system, Q. J. Roy. Meteor. Soc., 137, 553–579, https://doi.org/10.1002/qj.828, 2011. a, b
Dunkerton, T. J.: The quasi‐biennial oscillation of 2015–2016: Hiccup or death spiral?, Geophys. Res. Lett., 43, 10547–10552, https://doi.org/10.1002/2016GL070921, 2016. a
Ebdon, R. A.: Notes on the wind flow at 50 mb in tropical and subtropical regions in January 1957 and January 1958, Q. J. Roy. Meteor. Soc., 86, 540–542, https://doi.org/10.1002/qj.49708637011, 1960. a
Ern, M. and Preusse, P.: Quantification of the contribution of equatorial Kelvin waves to the QBO wind reversal in the stratosphere, Geophys. Res. Lett., 36, L21801, https://doi.org/10.1029/2009GL040493, 2009. a
Ern, M., Preusse, P., Krebsbach, M., Mlynczak, M. G., and Russell III, J. M.: Equatorial wave analysis from SABER and ECMWF temperatures, Atmos. Chem. Phys., 8, 845–869, https://doi.org/10.5194/acp-8-845-2008, 2008. a
Ern, M., Ploeger, F., Preusse, P., Gille, J. C., Gray, L. J., Kalisch, S., Mlynczak, M. G., Russell III, J. M., and Riese, M.: Interaction of gravity waves with the QBO: A satellite perspective, J. Geophys. Res.-Atmos., 119, 2329–2355, https://doi.org/10.1002/2013JD020731, 2014. a
Garcia, R. R. and Richter, J. H.: On the Momentum Budget of the Quasi-Biennial Oscillation in the Whole Atmosphere Community Climate Model, J. Atmos. Sci., 76, 69–87, https://doi.org/10.1175/JAS-D-18-0088.1, 2019. a
Gray, L. J., Crooks, S., Pascoe, C., Sparrow, S., and Palmer, M.: Solar and QBO Influences on the Timing of Stratospheric Sudden Warmings, J. Atmos. Sci., 61, 2777–2796, https://doi.org/10.1175/JAS-3297.1, 2004. a
Gray, W. M., Sheaffer, J. D., and Knaff, J. A.: Hypothesized mechanism for stratospheric QBO influence on ENSO variability, J. Geophys. Res., 19, 107–110, https://doi.org/10.1029/91GL02950, 1992. a
Hansen, F., Matthes, K., and Wahl, S.: Tropospheric QBO-ENSO interactions and differences between the atlantic and pacific, J. Climate, 29, 1353–1368, https://doi.org/10.1175/JCLI-D-15-0164.1, 2016. a, b, c, d
Hirota, N., Shiogama, H., Akiyoshi, H., Ogura, T., Takahashi, M., Kawatani, Y., Kimoto, M., and Mori, M.: The influences of El Nino and Arctic sea-ice on the QBO disruption in February 2016, npj Clim. Atmos. Sci., 1, 10, https://doi.org/10.1038/s41612-018-0020-1, 2018. a
Hitchcock, P., Haynes, P. H., Randel, W. J., and Birner, T.: The Emergence of Shallow Easterly Jets within QBO Westerlies, J. Atmos. Sci., 75, 21–40, https://doi.org/10.1175/JAS-D-17-0108.1, 2018. a, b, c
Holton, J. R. and Austin, J.: The Influence of the Equatorial QBO on Sudden Stratospheric Warmings, J. Atmos. Sci., 48, 607–618, https://doi.org/10.1175/1520-0469(1991)048<0607:TIOTEQ>2.0.CO;2, 1991. a
Holton, J. R. and Lindzen, R. S.: An Updated Theory for the Quasi-Biennial Cycle of the Tropical Stratosphere, J. Atmos. Sci., 29, 1076–1080, https://doi.org/10.1175/1520-0469(1972)029<1076:AUTFTQ>2.0.CO;2, 1972. a, b, c, d
Holton, J. R. and Tan, H.-C.: The Influence of the Equatorial Quasi-Biennial Oscillation on the Global Circulation at 50 mb, J. Atmos. Sci., 37, 2200–2208, https://doi.org/10.1175/1520-0469(1980)037<2200:TIOTEQ>2.0.CO;2, 1980. a
Huang, K. M., Zhang, S. D., and Yi, F.: Gravity wave excitation through resonant interaction in a compressible atmosphere, Geophys. Res. Lett., 36, 1–5, https://doi.org/10.1029/2008GL035575, 2009. a, b
Kang, M.-J., Chun, H.-Y., Kim, Y.-H., Preusse, P., and Ern, M.: Momentum Flux of Convective Gravity Waves Derived from an Offline Gravity Wave Parameterization. Part II: Impacts on the Quasi-Biennial Oscillation, J. Atmos. Sci., 75, 3753–3775, https://doi.org/10.1175/JAS-D-18-0094.1, 2018. a
Kawatani, Y. and Hamilton, K.: Weakened stratospheric quasibiennial oscillation driven by increased tropical mean upwelling, Nature, 497, 478–481, https://doi.org/10.1038/nature12140, 2013. a
Kumar, K. K., Mathew, S. S., and Subrahmanyam, K. V.: Anomalous tropical planetary wave activity during 2015/2016 quasi biennial oscillation disruption, J. Atmos. Sol.-Terr. Phy., 167, 184–189, https://doi.org/10.1016/j.jastp.2017.12.004, 2018. a, b
Liebmann, B. and Smith, C. A.: Description of a Complete (Interpolated) Outgoing Longwave Radiation Dataset, B. Am. Meteorol. Soc., 77, 1275–1277, available at: https://www.jstor.org/stable/26233278 (last access: 30 December 2019), 1996 (data available at: https://www.esrl.noaa.gov/psd/data/gridded/data.interp_OLR.html, last access: 30 December 2019). a
Lin, P., Held, I., and Ming, Y.: The Early Development of the 2015/16 Quasi-Biennial Oscillation Disruption, J. Atmos. Sci., 76, 821–836, https://doi.org/10.1175/JAS-D-18-0292.1, 2019. a, b, c, d, e, f, g, h, i
Lindzen, R. S. and Holton, J. R.: A Theory of the Quasi-Biennial Oscillation, J. Atmos. Sci., 25, 1095–1107, https://doi.org/10.1175/1520-0469(1968)025<1095:ATOTQB>2.0.CO;2, 1968. a, b, c, d
Matthias, V. and Ern, M.: On the origin of the mesospheric quasi-stationary planetary waves in the unusual Arctic winter 2015/2016, Atmos. Chem. Phys., 18, 4803–4815, https://doi.org/10.5194/acp-18-4803-2018, 2018. a
Maury, P., Lott, F., Guez, L., and Duvel, J. P.: Tropical variability and stratospheric equatorial waves in the IPSLCM5 model, Clim. Dynam., 40, 2331–2344, https://doi.org/10.1007/s00382-011-1273-0, 2013. a, b
Naujokat, B.: An Update of the Observed Quasi-Biennial Oscillation of the Stratospheric Winds over the Tropics, J. Atmos. Sci., 43, 1873–1877, https://doi.org/10.1175/1520-0469(1986)043<1873:AUOTOQ>2.0.CO;2, 1986. a, b, c
Newman, P. A., Coy, L., Pawson, S., and Lait, L. R.: The anomalous change in the QBO in 2015–2016, Geophys. Res. Lett., 43, 8791–8797, https://doi.org/10.1002/2016GL070373, 2016. a, b, c, d, e, f, g, h, i, j, k
NOAA, OAR, ESRL, and PSL: NOAA Extended Reconstructed Sea Surface Temperature (SST) V4, available at: https://psl.noaa.gov/data/gridded/data.noaa.ersst.html, last access: 30 December 2019. a
Osprey, S. M., Butchart, N., Knight, J. R., Scaife, A. A., Hamilton, K., Anstey, J. A., and Zhang, C.: An unexpected disruption of the atmospheric quasi- biennial oscillation, Science, 4156, 441–444, 2016. a, b, c, d, e, f, g, h, i
O'Sullivan, D.: Interaction of extratropical Rossby waves with westerly quasi-biennial oscillation winds, J. Geophys. Res., 102, 19461–19469, https://doi.org/10.1029/97JD01524, 1997. a
Pilch Kedzierski, R., Matthes, K., and Bumke, K.: Wave modulation of the extratropical tropopause inversion layer, Atmos. Chem. Phys., 17, 4093–4114, https://doi.org/10.5194/acp-17-4093-2017, 2017. a
Rakhman, S., Lubis, S. W., and Setiawan, S.: Impact of ENSO on seasonal variations of Kelvin Waves and mixed Rossby-Gravity Waves, IOP Conf. Ser. Earth Environ. Sci., 54, 012035, https://doi.org/10.1088/1755-1315/54/1/012035, 2017. a, b
Reed, R. J., Campbell, W. J., Rasmussen, L. A., and Rogers, D. G.: Evidence of a downward-propagating, annual wind reversal in the quatorial stratosphere, J. Geophys. Res., 66, 813–818, https://doi.org/10.1029/JZ066i003p00813, 1961. a
Reznik, G. M., Piterbarg, L. I., and Kartashova, E. A.: Nonlinear interactions of spherical Rossby modes, Dyn. Atmos. Ocean., 18, 235–252, https://doi.org/10.1016/0377-0265(93)90011-U, 1993. a, b, c
Schirber, S.: Influence of ENSO on the QBO: Results from an ensemble of idealized simulations, J. Geophys. Res., 120, 1109–1122, https://doi.org/10.1002/2014JD022460, 2015. a
Schreck, C.: Extract equatorial waves by filtering in the Wheeler-Kiladis wavenumber-frequency domain, available at: https://www.ncl.ucar.edu/Document/Functions/User_contributed/kf_filter.shtml (last access: 30 May 2020), 2009. a
Shuckburgh, E., Norton, W., Iwi, A., and Haynes, P.: Influence of the quasi-biennial oscillation on isentropic transport and mixing in the tropics ans stutropics, J. Geophys. Res., 106, 327–337, 2001. a
Taguchi, M.: Observed connection of the stratospheric quasi-biennial oscillation with El Niño-Southern Oscillation in radiosonde data, J. Geophys. Res.-Atmos., 115, 1–12, https://doi.org/10.1029/2010JD014325, 2010. a
Tamarin, T., Heifetz, E., Umurhan, O. M., and Yellin, R.: On the nonnormal–nonlinear interaction mechanism between counter-propagating Rossby waves, Theor. Comput. Fluid Dyn., 29, 205–224, https://doi.org/10.1007/s00162-015-0346-9, 2015. a
Tweedy, O. V., Kramarova, N. A., Strahan, S. E., Newman, P. A., Coy, L., Randel, W. J., Park, M., Waugh, D. W., and Frith, S. M.: Response of trace gases to the disrupted 2015–2016 quasi-biennial oscillation, Atmos. Chem. Phys., 17, 6813–6823, https://doi.org/10.5194/acp-17-6813-2017, 2017. a, b
Uppala, S. M., Kållberg, P. W., Simmons, A. J., Andrae, U., Costa Bechtold, V. D., Fiorino, M., Gibson, J. K., Haseler, J., Hernandez, A., Kelly, G. A., Li, X., Onogi, K., Saarinen, S., Sokka, N., Allan, R. P., Andersson, E., Arpe, K., Balmaseda, M. A., Beljaars, A. C. M., Van, L., Berg, D., Bidlot, J., Bormann, N., Caires, S., Chevallier, F., Dethof, A., Dragosavac, M., Fisher, M., Fuentes, M., Hagemann, S., Hólm, E., Hoskins, B. J., Isaksen, L., Janssen, P. A. E. M., Jenne, R., Mcnally, A. P., Mahfouf, J., Morcrette, J., Rayner, N. A., Saunders, R. W., Simon, P., Sterl, A., Trenberth, K. E., Untch, A., Vasiljevic, D., Viterbo, P., and Woollen, J.: The ERA-40 re-analysis, Q. J. Roy. Meteor. Soc., 131, 2961–3012, https://doi.org/10.1256/qj.04.176, 2005 (data available at: https://www.ecmwf.int/en/forecasts/datasets/browse-reanalysis-datasets, last access: 30 December 2019). a, b
Wheeler, M. and Kiladis, G. N.: Convectively Coupled Equatorial Waves: Analysis of Clouds and Temperature in the Wavenumber–Frequency Domain, J. Atmos. Sci., 56, 374–399, https://doi.org/10.1175/1520-0469(1999)056<0374:CCEWAO>2.0.CO;2, 1999. a
Yang, G.-Y. and Hoskins, B.: ENSO Impact on Kelvin Waves and Associated Tropical Convection, J. Atmos. Sci., 70, 3513–3532, https://doi.org/10.1175/JAS-D-13-081.1, 2013. a, b, c, d
Yoo, C. and Son, S. W.: Modulation of the boreal wintertime Madden-Julian oscillation by the stratospheric quasi-biennial oscillation, Geophys. Res. Lett., 43, 1392–1398, https://doi.org/10.1002/2016GL067762, 2016. a
Yuan, W., Geller, M. A., and Love, P. T.: ENSO influence on QBO modulations of the tropical tropopause, Q. J. Roy. Meteor. Soc., 140, 1670–1676, https://doi.org/10.1002/qj.2247, 2014. a