the Creative Commons Attribution 4.0 License.
the Creative Commons Attribution 4.0 License.
 | 05 Jun 2020
The potential impacts of a sulfur- and halogen-rich supereruption such as Los Chocoyos on the atmosphere and climate
Hans Brenna
Steffen Kutterolf
Michael J. Mills
The supereruption of Los Chocoyos (14.6∘ N, 91.2∘ W) in Guatemala ∼84 kyr ago was one of the largest volcanic events of the past 100 000 years. Recent petrologic data show that the eruption released very large amounts of climate-relevant sulfur and ozone-destroying chlorine and bromine gases (523±94 Mt sulfur, 1200±156 Mt chlorine, and 2±0.46 Mt bromine). Using the Earth system model (ESM) of the Community Earth System Model version 2 (CESM2) coupled with the Whole Atmosphere Community Climate Model version 6 (WACCM6), we simulated the impacts of the sulfur- and halogen-rich Los Chocoyos eruption on the preindustrial Earth system.
Our simulations show that elevated sulfate burden and aerosol optical depth (AOD) persists for 5 years in the model, while the volcanic halogens stay elevated for nearly 15 years. As a consequence, the eruption leads to a collapse of the ozone layer with global mean column ozone values dropping to 50 DU (80 % decrease) and leading to a 550 % increase in surface UV over the first 5 years, with potential impacts on the biosphere. The volcanic eruption shows an asymmetric-hemispheric response with enhanced aerosol, ozone, UV, and climate signals over the Northern Hemisphere. Surface climate is impacted globally due to peak AOD of >6, which leads to a maximum surface cooling of >6 K, precipitation and terrestrial net primary production decrease of >25 %, and sea ice area increases of 40 % in the first 3 years. Locally, a wetting (>100 %) and strong increase in net primary production (NPP) (>700 %) over northern Africa is simulated in the first 5 years and related to a southward shift of the Intertropical Convergence Zone (ITCZ) to the southern tropics. The ocean responds with pronounced El Niño conditions in the first 3 years that shift to the southern tropics and are coherent with the ITCZ change.
Recovery to pre-eruption ozone levels and climate takes 15 years and 30 years, respectively. The long-lasting surface cooling is sustained by an immediate increase in the Arctic sea ice area, followed by a decrease in poleward ocean heat transport at 60∘ N which lasts up to 20 years.
In contrast, when simulating Los Chocoyos conventionally by including sulfur and neglecting halogens, we simulate a larger sulfate burden and AOD, more pronounced surface climate changes, and an increase in column ozone. By comparing our aerosol chemistry ESM results to other supereruption simulations with aerosol climate models, we find a higher surface climate impact per injected sulfur amount than previous studies for our different sets of model experiments, since the CESM2(WACCM6) creates smaller aerosols with a longer lifetime, partly due to the interactive aerosol chemistry. As the model uncertainties for the climate response to supereruptions are very large, observational evidence from paleo archives and a coordinated model intercomparison would help to improve our understanding of the climate and environment response.
- Article
(8859 KB) - Full-text XML
-
Supplement
(9162 KB) - BibTeX
- EndNote


The Los Chocoyos (LCY, 14.6∘ N, 91.2∘ W) supereruption (Kutterolf et al., 2016) of M=8 (calculated by Pyle, 2013), dated to ∼84 kyr before the present (Rose et al., 1999), is known to be one of the largest volcanic eruptions of the past 100 000 years (Drexler et al., 1980). The eruption formed the current stage of the large Atitlán caldera in present-day Guatemala. LCY released more than ∼1100 km3 of tephra, and the eruption is used as a widespread key stratigraphic marker during that time (Cisneros et al., 2020; Kutterolf et al., 2016). The ash layers can be found in marine deposits from offshore Ecuador to Florida over an area of more than 107 km2 (Kutterolf et al., 2016). Hardly anything is known about the climate impacts of this eruption from proxy records, but LCY emitted large amounts of climate-relevant and environmentally relevant gases including sulfur, chlorine, and bromine compounds (Krüger et al., 2015; Kutterolf et al., 2015, 2016; Metzner et al., 2014).
The sulfur gases emitted by volcanoes have a strong direct climate impact through the formation of sulfuric acid aerosols, which block incoming sunlight and cool the surface (Robock, 2000). Halogen compounds, such as chlorine and bromine, contribute to catalytic ozone depletion in the stratosphere (Brasseur and Solomon, 2005; Solomon, 1999). There is well-documented petrological evidence that volcanic supereruptions have emitted environmentally significant amounts of chlorine and bromine (Cadoux et al., 2015, 2018; Krüger et al., 2015; Kutterolf et al., 2013, 2015; Vidal et al., 2016). Furthermore, recent atmospheric observations revealed that even relatively small volcanic eruptions can inject significant amounts of halogen compounds in the stratosphere (for review and overview discussions, see von Glasow et al., 2009; Krüger et al., 2015; WMO, 2018). This means that a sulfur- and halogen-rich eruption is expected to cool the Earth's surface and potentially damage the stratospheric ozone layer, with further impacts on the surface environment through the change in the atmosphere's transparency to harmful ultraviolet (UV), particularly shortwave UVB, radiation (i.e., Brenna et al., 2019). Potential volcanic iodine injections to the stratosphere (Schönhardt et al., 2017) would have even a larger ozone depletion potential than chlorine and bromine (Solomon et al., 1994). However, no direct iodine erupted mass measurements are available for the LCY eruption.
Metzner et al. (2014) used the general circulation model (GCM) MAECHAM5-HAM coupled with a modal aerosol microphysics scheme, together with the CLIMBER-2 (an Earth system model of intermediate complexity) to study the climate impact of LCY. Based on the former published mass estimate of 687 Mt SO2 (343.5 Mt S), they simulated a peak cooling of 3.1 ∘C from their LCY eruption scenario. Toohey et al. (2011, 2013) investigated the atmospheric physical processes of LCY, using 700 Mt SO2 (350 Mt S) injections with the model MAECHAM5-HAM, and revealed the important effects of the different seasons of that eruption on the aerosol evolution, transport, and deposition of sulfate to the ice cores and then compared them to weaker eruptions strengths.
Even though there is little literature about LCY, the climate impact of supereruptions has been discussed in the scientific literature since at least the early 1990s. Early studies argued that the eruption of Toba (73 kyr ago) could have initiated a glacial period (Rampino and Self, 1992, 1993; Zielinski et al., 1996). In addition, there is evidence that human populations went through a genetic bottleneck (i.e., most of the population died) at approximately the same time as the eruption of Toba (Ambrose, 1998; Haslam and Petraglia, 2010; Williams et al., 2009), but this is now considered unlikely (Timmreck et al., 2010, 2012).
A thorough investigation of the climatic and environmental impacts of extremely large to supervolcanic eruptions (M: 7–8) requires the use of a global climate model or, ideally, an Earth system model (ESM). There are several studies published with different model complexities that mostly focus on the Toba eruption and its sulfur impact on the atmosphere and climate.
Bekki et al. (1996) used a two-dimensional chemistry transport model with internally generated atmospheric circulation to study the Toba eruption impact on the atmosphere. Their simulations indicate that Toba could have caused a long-lasting atmospheric response due to the interactions between chemistry and aerosol microphysics.
Later, Jones et al. (2005) used a coupled atmosphere–ocean general circulation model (AOGCM) to study the Toba eruption impact on climate. In this study, they forced the model by linearly scaling the observed aerosol optical depth (AOD) from the 1991 eruption of Pinatubo by a factor of 100, resulting in peak cooling of ∼11 K in the second post-eruption year, followed by an initial recovery that took a decade. Surface cooling larger than 1 K persisted for more than 20 years. The volcanic aerosol forcing only lasted 5 years, so the response needed to be maintained by feedback in other components of the Earth system through, e.g., sea ice–ocean feedback sustaining the short atmospheric forcing to longer (decadal to centennial) timescales (Miller et al., 2012; Stenchikov et al., 2009; Zhong et al., 2011).
In a similar study, Robock et al. (2009) used three different AOGCMs to study the Toba eruption's effect on climate and ozone. In their study, both the linear scaling AOD approach and directly injecting sulfur into a model with an interactive bulk aerosol module were utilized. The resulting magnitude and length of the cooling was similar to what was published by Jones et al. (2005) across the different model versions and forcing methods. The scenarios representing a 100-times Pinatubo forcing resulted in ∼12 K peak cooling with multidecadal recovery times. In a 300-times Pinatubo scenario simulation including atmospheric chemistry effects, Robock et al. (2009) found slightly stronger (∼1 K) and much more long-lasting surface cooling (length of >10 K cooling extended by ∼5 years) compared to the similar forcing scenario without chemistry, due to the depletion of atmospheric hydroxyl (OH) that limits the speed of aerosol formation, which leads to a longer-lasting forcing. In addition, they simulated an increase in global column ozone, which attributed to the reduction of reactive hydrogen oxides in the atmosphere.
Another model study of Toba, presented in Timmreck et al. (2010, 2012) and Zanchettin et al. (2014), simulated a smaller climate impact with peak cooling of 3.5 K that lasted up to 10 years from the injected sulfur compared to the analogous simulations in Robock et al. (2009). A key difference between Timmreck et al. (2010) and previous AOGCM simulations of Toba is the inclusion of online aerosol microphysics in a modal aerosol scheme and the OH limitation mechanism, which leads to larger aerosol sizes, lower peak AOD (∼4) values, and thus lower climate impacts in Timmreck et al. (2010). The inclusion of interactive OH chemistry in the formation of aerosol is important because the availability of OH controls the speed of SO2 oxidation into sulfate (Bekki, 1995).
Concentrating on the atmospheric processes, English et al. (2013) used a sectional aerosol microphysics model coupled with a chemistry climate model with prescribed sea surface temperatures (SSTs) to study the aerosols and atmospheric impacts of the Toba eruption. In their model setup, by neglecting aerosol radiative effects, they simulate even lower peak AOD values (∼2.6) due to the fact that their sectional aerosol module creates larger aerosols compared to Timmreck et al. (2010).
In the climate modeling literature on the Toba supereruption, there is a progression from larger to smaller climate (and environmental) impacts as model complexity develops over time. In the more recent climate models one key reason seems to be that climate effects are self-limiting for larger eruptions due to an increase in aerosol growth, which reduces peak AOD (English et al., 2013; Pinto et al., 1989; Timmreck et al., 2010). In addition, the role of atmospheric chemistry and OH limitation on sulfuric acid aerosols is continuously under discussion in the literature (Bekki, 1995; Mills et al., 2017; Niemeier et al., 2019; Robock et al., 2009; Timmreck et al., 2003).
Investigating the effects of the Toba eruption on the Earth system, such as hydrology and terrestrial net primary production, reveals a substantial reduction of precipitation globally, which leads to the reduction of tree cover, increase in grass cover, and decreased net primary production (NPP) but with large regional and intermodel variability (Robock et al., 2009; Timmreck et al., 2010, 2012). While tropical deciduous trees and broadleaf evergreen trees virtually disappear in the simulations of Robock et al. (2009), Timmreck et al. (2012) find much more muted impacts on tree cover, particularly in the tropics. Timmreck et al. (2012) even simulate an increase in NPP in the tropical rain forest regions of South America and Africa.
Recent studies proposed a sea ice–ocean mechanism, which prolongs the volcanic-induced short, abrupt surface cooling and sea ice increase due to longer timescales (decadal), with the ocean sustaining the signal by buffering and transporting the cooling poleward (Miller et al., 2012; Zhong et al., 2011). In addition, Zanchettin et al. (2014) simulated an interhemispheric response to different volcanic forcings with Pinatubo to Toba strength by using Arctic sea ice expansion for all cases and only using an Antarctic sea ice expansion and subsequent contraction for the supereruptions.
We are not aware of studies of the supersized eruption effects on the El Niño–Southern Oscillation (ENSO), whereas the effects of large to very large (M: 5–6) volcanic eruptions have been widely discussed in the literature. There is an ongoing debate (Stevenson et al., 2017) about whether tropical volcanic eruptions can lead to La Niña-like responses in the same year (Anchukaitis et al., 2010; Li et al., 2013) or the (5) following years (Zanchettin et al., 2012) or to El Niño-like responses in up to the 2 following years (e.g., Adams et al., 2003; Handler, 1984; Khodri et al., 2017; Ohba et al., 2013; Predybaylo et al., 2017; Stevenson et al., 2016). Discussions include the significance and mechanism of the results as well as the eruption characteristics, latitude, season, and strength.
Simulations of halogen-rich (and sulfur-rich) eruptions show that these can have serious, long-lasting impacts on the ozone layer, with implications for the surface environment through the increase in surface ultraviolet radiation. In a 2D chemical transport model (CTM) study of the late Bronze Age eruption of Santorini (M=7), Cadoux et al. (2015) simulated the decadal ozone depletion, mainly in the Northern Hemisphere, with a peak depletion of 20 %–90 % depending on the degassing budget. In another study using a 2D CTM (Klobas et al., 2017), (hypothetical) volcanic halogens were included with the sulfur injection of Pinatubo, showing the ozone depletion of 20 % lasting a few years under different future emission scenarios. Using the Community Earth System Model version 1 (CESM1) coupled with the Whole Atmosphere Community Climate Model (WACCM) and a comprehensive coupled chemistry–climate model (CCM) with prescribed volcanic aerosols and SSTs, Brenna et al. (2019) simulated an average Central American volcanic arc (CAVA) eruption with M=6.4. They found ozone depletion up to 20 % globally and lasting up to 10 years, which was most pronounced over the Northern Hemisphere (NH) and dropped to below present-day ozone hole conditions over Antarctica and the tropics. Consequently, surface UV radiation increased by >80 % over the 2 years, with potential impacts on human health, agriculture, and marine life.
We are not aware of supereruption studies taking the combined effect of sulfur and halogen injections in a fully coupled aerosol–chemistry–climate model ESM into account.
In this study we use the recently released CESM2 coupled with WACCM6 as the atmospheric component, which allows us to newly investigate the coupling and the feedback between volcanic aerosols, chemistry, radiation, climate, and the Earth system after a sulfur- and halogen-rich supervolcanic eruption. The primary goal of this paper is to investigate the combined effect of the sulfur- and halogen-rich LCY supereruption on climate and environment. In particular, we study the impacts of LCY by varying the eruption composition and size on the following: (i) atmospheric burden of volcanic gases and aerosols; (ii) ozone and UV; (iii) climate and environment; and (iv) ENSO. Finally, we compare our findings with other model studies before we give a summary and conclusion. In a forthcoming paper, we will investigate the impacts on stratospheric circulation in the tropics.
2.1 Los Chocoyos eruption volatile estimates
Using the recently published total erupted mass estimate for the LCY eruption (Kutterolf et al., 2016) and the previously published petrologic estimates of volatile concentrations for sulfur, chlorine, and bromine (Metzner et al., 2014; Kutterolf et al., 2013, 2015), we calculate a new mass of erupted volatiles for LCY as a starting point for defining the stratospheric injections in our model simulations. The erupted volatile masses were calculated using these estimates (± uncertainties) as follows: 523±94 Mt sulfur (S), 1200±156 Mt chlorine (Cl), and 2±0.46 Mt bromine (Br).
The determination of the volatile injection into the stratosphere during the LCY eruption is based on a two-step approach. The first step is the determination of the erupted magma mass. LCY fall deposits are well exposed on land and within sediment and lacustrine cores on the Pacific seafloor as well as Lake Petén Itzá to create isopach (thickness) maps (Kutterolf et al., 2008a, 2016; Cisneros et al., 2020). These maps serve as a basis for determining the total volume of erupted tephra by fitting straight lines to data on plots of ln (isopach thickness) versus square root (isopach area) following Pyle (1989) and Fierstein and Nathenson (1992) and integrating to infinity, as described in Kutterolf et al. (2016, 2008b, 2007). Additionally, outcrops identified in the field, in satellite images, and in Google Earth have been used to document regional thickness variations and, finally, to determine the volume of the flow deposits by integrating the results of different calculation methods (Cisneros et al., 2020). We then converted the tephra volume to magma mass by following the procedure of Kutterolf et al. (2008b, 2016) and using variable tephra densities from proximal to distal deposits.
The second step is the measurement of volatile contents in both melt inclusion and matrix glasses (see Metzner et al., 2014; Kutterolf et al., 2015). Applying the petrological method (Devine et al., 1984), matrix glass represents the degassed melt after the eruption, and melt-inclusion glass represents the volatile content prior to the eruption. The concentration difference between melt-inclusion glasses and matrix glasses yields the volatile fraction degassed during an eruption, and multiplication with the erupted magma mass gives the mass of the emitted volatiles (e.g., Kutterolf et al., 2015).
Both procedure steps are taken into account in the maximum combined uncertainty for the volatile budget of each volatile, which is ±13 % for chlorine, ±18 % for sulfur, and ±23 % for bromine (see also Brenna et al., 2019).
Finally, the petrological method might underestimate the volcanic emission due to pre-eruptive magma fluid partitioning by a factor of 10 for sulfur (Self and King, 1996) and a factor of 2 or more for halogens (Kutterolf et al., 2015) as discussed earlier (Metzner et al., 2014; Krüger et al., 2015; Brenna et al., 2019).
2.2 CESM2(WACCM6)
In this study we use the Community Earth System Model version 2 (CESM2) (Danabasoglu et al., 2020) coupled with the whole atmosphere community climate model version 6 (WACCM6) (Gettelman et al., 2019) as the atmospheric component. The CESM2(WACCM6) is a comprehensive numerical model spanning the whole atmosphere from the surface to the lower thermosphere, with the model top at ∼ 140 km altitude. The chemistry module includes the SOx, Ox, NOx, HOx, ClOx and BrOx chemical families, implementing 98 compounds and ∼300 reactions. It covers gas-phase, photolytic, and heterogeneous reactions on three types of aerosols, including polar stratospheric clouds, which form interactively in the model. Stratospheric sulfuric acid aerosols are formed interactively from sulfur compounds and modeled by the modal aerosol model (MAM4; Liu et al., 2016), which has been adapted and extended for the stratosphere (Mills et al., 2016). CESM2(WACCM6), as a coupled CCM, allows us to explore the coupling between radiation, temperature, circulation, chemistry, and composition in the atmosphere. The horizontal resolution is 0.95∘ longitude by 1.25∘ latitude, with 70 hybrid sigma–pressure layers from the surface to hPa (approximately 140 km altitude). The quasi-biennial oscillation (QBO) is internally generated and has a period of ∼27 months, which is close to the observations (Gettelman et al., 2019). However, the QBO amplitude is too weak and the oscillation does not extend into the lowermost stratosphere, which can impact the QBO teleconnections to the extratropics.
The ocean model of CESM2(WACCM6) is the Parallel Ocean Program version 2 (POP2) model running at ∼1∘ × 1∘ horizontal resolution, with 60 layers in the vertical. CICE5 is the Los Alamos sea ice model for CESM2(WACCM6) (Bailey et al., 2018), which is running on the same grid as POP2. The land surface model in CESM2(WACCM6) is the community land model version 5 (CLM5) set up under 1850 conditions with dynamic vegetation, interactive biogeochemistry (carbon, nitrogen, methane), and prognostic crops (Fisher et al., 2019).
2.3 Model experiments
To model the impact of the LCY eruption on the atmosphere, we use the petrological estimate for erupted sulfur and halogen masses as input. We inject all 523 Mt of the erupted sulfur mass as 1046 Mt of SO2. For the volcanic halogens, we inject only 10 % of the estimated erupted halogen mass into the stratosphere as HCl and HBr and assume that the rest is removed before reaching the stratosphere. We consider this a reasonably conservative estimate for halogen injection efficiency based on observations and simulations of volcanic plumes, which yield ranges from 2 % to 25 % (see further discussions in Brenna et al., 2019, and Krüger et al., 2015). The volcanic volatiles are injected into the model grid boxes at 14.6∘ N and between 80 and 97.5∘ W, at a 24 km altitude. The eruption date is set to January, since the eruption season is not known. Injecting this huge amount of mass over one time step in a single grid box was not possible due to model stability. Thus, spreading the injection over longitude (80–97.5∘ W) and time (1–6 January) was done as a model experiment compromise. We run the LCY Atitlán supereruption model experiments under 1850 preindustrial conditions, which is the closest available model setup for paleoclimate conditions.
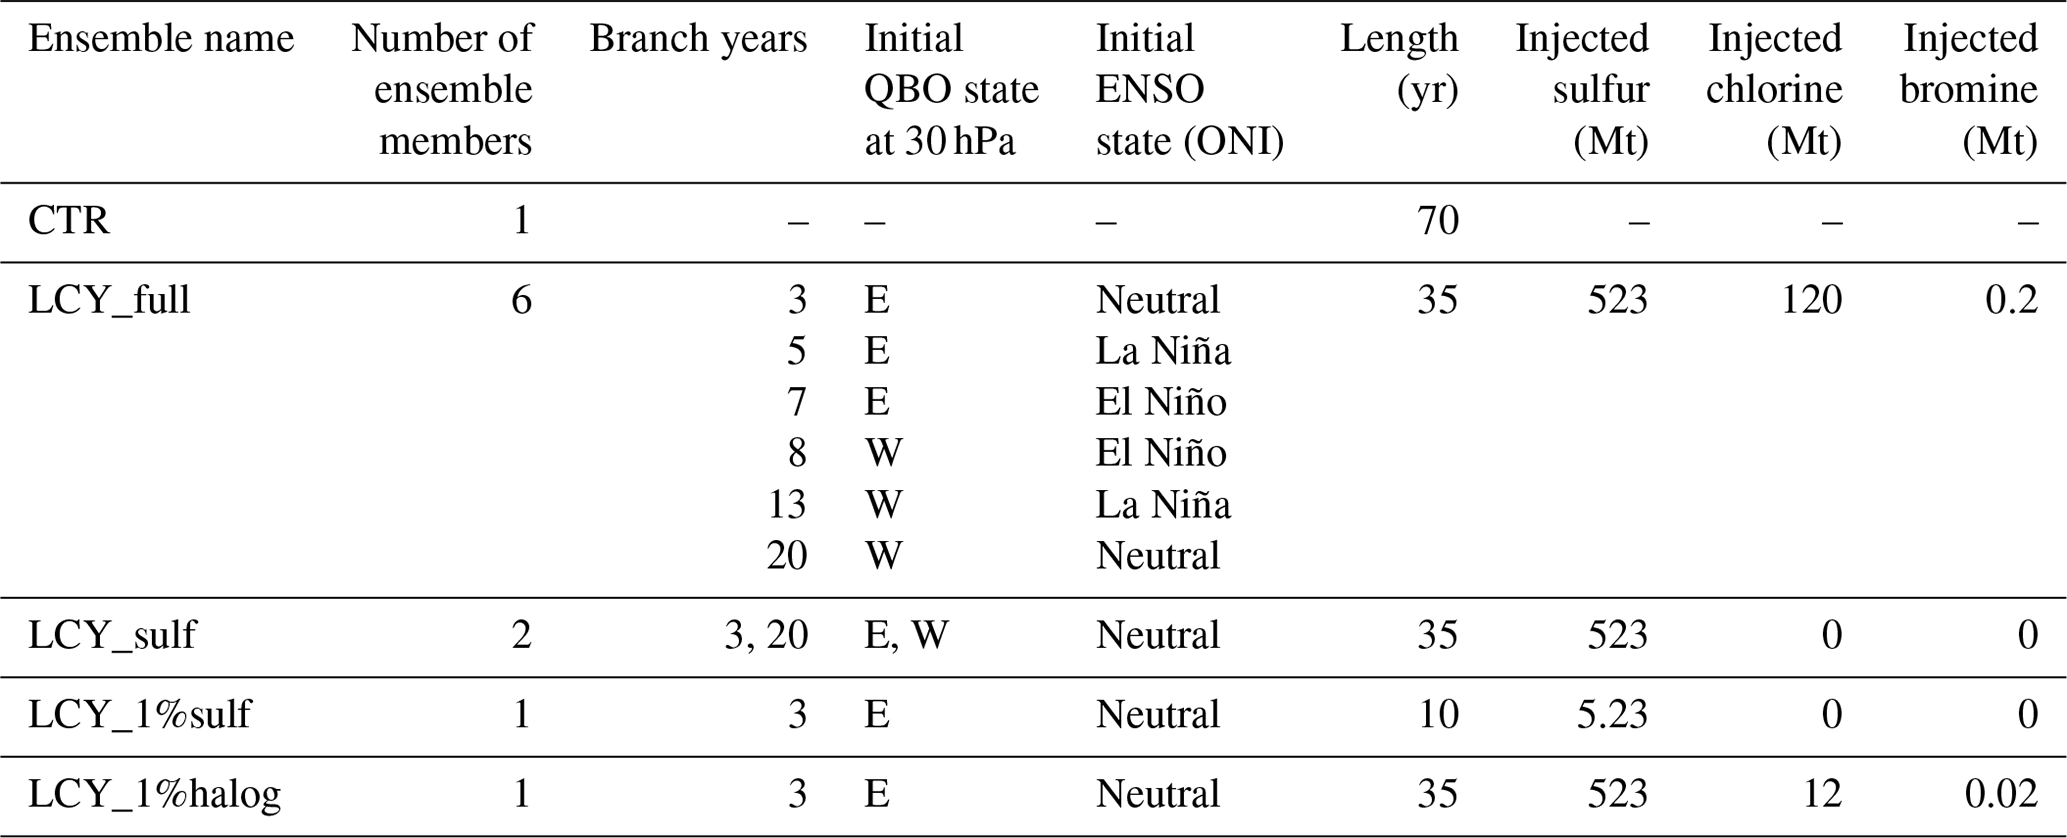
We run an ensemble of six simulations for the combined sulfur and halogen forcings (LCY_full), starting from different ENSO (positive, negative, and neutral) and QBO (easterly and westerly) states of the control simulation (Ctr), which is a single 70-year simulation with constant 1850 forcings. In addition, we perform two simulations (QBO easterly and westerly, ENSO neutral, branching from the same Ctr years as for LCY_full) with only the sulfur forcing (LCY_sulf) to explore the differences in response between the forcing scenarios. All ensemble members last 35 years. In all simulations, background stratospheric concentrations of chlorine and bromine are 0.45 ppbv and 10.2 pptv at the 10 hPa level, respectively, which is consistent with preindustrial estimates (WMO, 2014). In addition to these main experiments, we have performed two sensitivity simulations: one with a sulfur injection reduced by a factor of 100 (LCY_1%sulf) and one with full sulfur injection and 1 % halogen injection efficiency instead of 10 % (LCY_1%halog). The experiments are summarized in Table 1.
Table 1Summary of model experiments. The injected volatile mass to the stratosphere is based on the total erupted masses of 523 Mt sulfur, 1200 Mt chlorine, and 2 Mt bromine by applying different injection efficiencies (see Sect. 2 “Methods”).
2.4 Surface UV calculations
We calculate the UV radiation at the surface using the tropospheric ultraviolet and visible (TUV) radiation transport model (Madronich and Flocke, 1997) using similar methods as seen in Brenna et al. (2019). In our setup, the TUV solves the radiative transfer equations given the following parameters: date of the year, position, time of day, column ozone values, and total AOD at 550 nm while taking aerosol scattering into account. We run the TUV model offline for each point in latitude and longitude and use an hourly temporal resolution to acquire a representation of the variations in UV throughout the year. As input to the TUV model, we give the averages of column ozone and AOD over the first 5 years after the eruption for LCY_full and LCY_sulf as well as for the control run to generate UV fields for the eruption scenarios and for the control-run climatology.
2.5 Oceanic Niño Index (ONI)
To select the initial conditions for the setup of the ensembles and to quantify the impact of the volcanic eruptions on the ENSO, we calculate the Oceanic Niño Index (ONI) from the model output. The ONI index is used operationally by the National Oceanic and Atmospheric Administration (NOAA) to analyze the ENSO state (https://origin.cpc.ncep.noaa.gov/products/analysis_monitoring/ensostuff/ONI_v5.php, last access: 13 May 2020). To calculate the index, the average SST anomalies in the NINO3.4 region (5∘ N–5∘ S, 120–170∘ W) are filtered using a 3-month running mean based on centered 30-year periods. If this index is above or below 0.5 K for at least 5 consecutive months, we have an El Niño or La Niña, respectively.
For our study we used the full control simulation as the baseline. As the large temperature response caused by the simulated LCY eruption masks the ENSO response initiated by the eruption, we have used relative sea surface temperature anomalies (RSSTAs) instead of the SST anomalies following Khodri et al. (2017). The RSSTA is calculated by removing the tropical mean (20∘ S–20∘ N) SST anomaly from the SST anomaly at every point. This quantity better isolates the intrinsic ENSO signal than standard SST anomalies (Khodri et al. 2017).
3.1 Atmospheric burdens of volcanic gases and aerosols
Using our modeling approach results in the atmospheric burdens of volcanic gases and aerosol as summarized in Fig. 1. To compare the decay time of the volcanic perturbations of sulfur and halogens between the different eruption scenarios, we calculated the normalized burden anomalies in addition to the standard anomalies. For this calculation, we divided the burden anomalies in each scenario with the maximum burden anomalies in that scenario by providing normalized values between 1 and 0. The normalized total sulfur burden after the simulated eruptions has an e-folding time (reduction by 1∕e) of a little more than 2 years (Fig. 1b). There is first a plateau for ∼1 year before the decay starts. The following e-folding times (1∕e2 and 1∕e3) are shorter, at a bit less than 1 year. After ∼5 years nearly all of the sulfur has been removed from the atmosphere. The total sulfur burden lifetimes are remarkably similar for all four injection scenarios, even when the injection amounts differ by a factor of 100. In contrast, the halogens have a longer first e-folding time of approximately 3 years, but the following e-folding times are ∼1 year, which is similar to what we simulated for the total sulfur. After ∼15 years nearly all of the halogens have been removed from the atmosphere (not shown here).
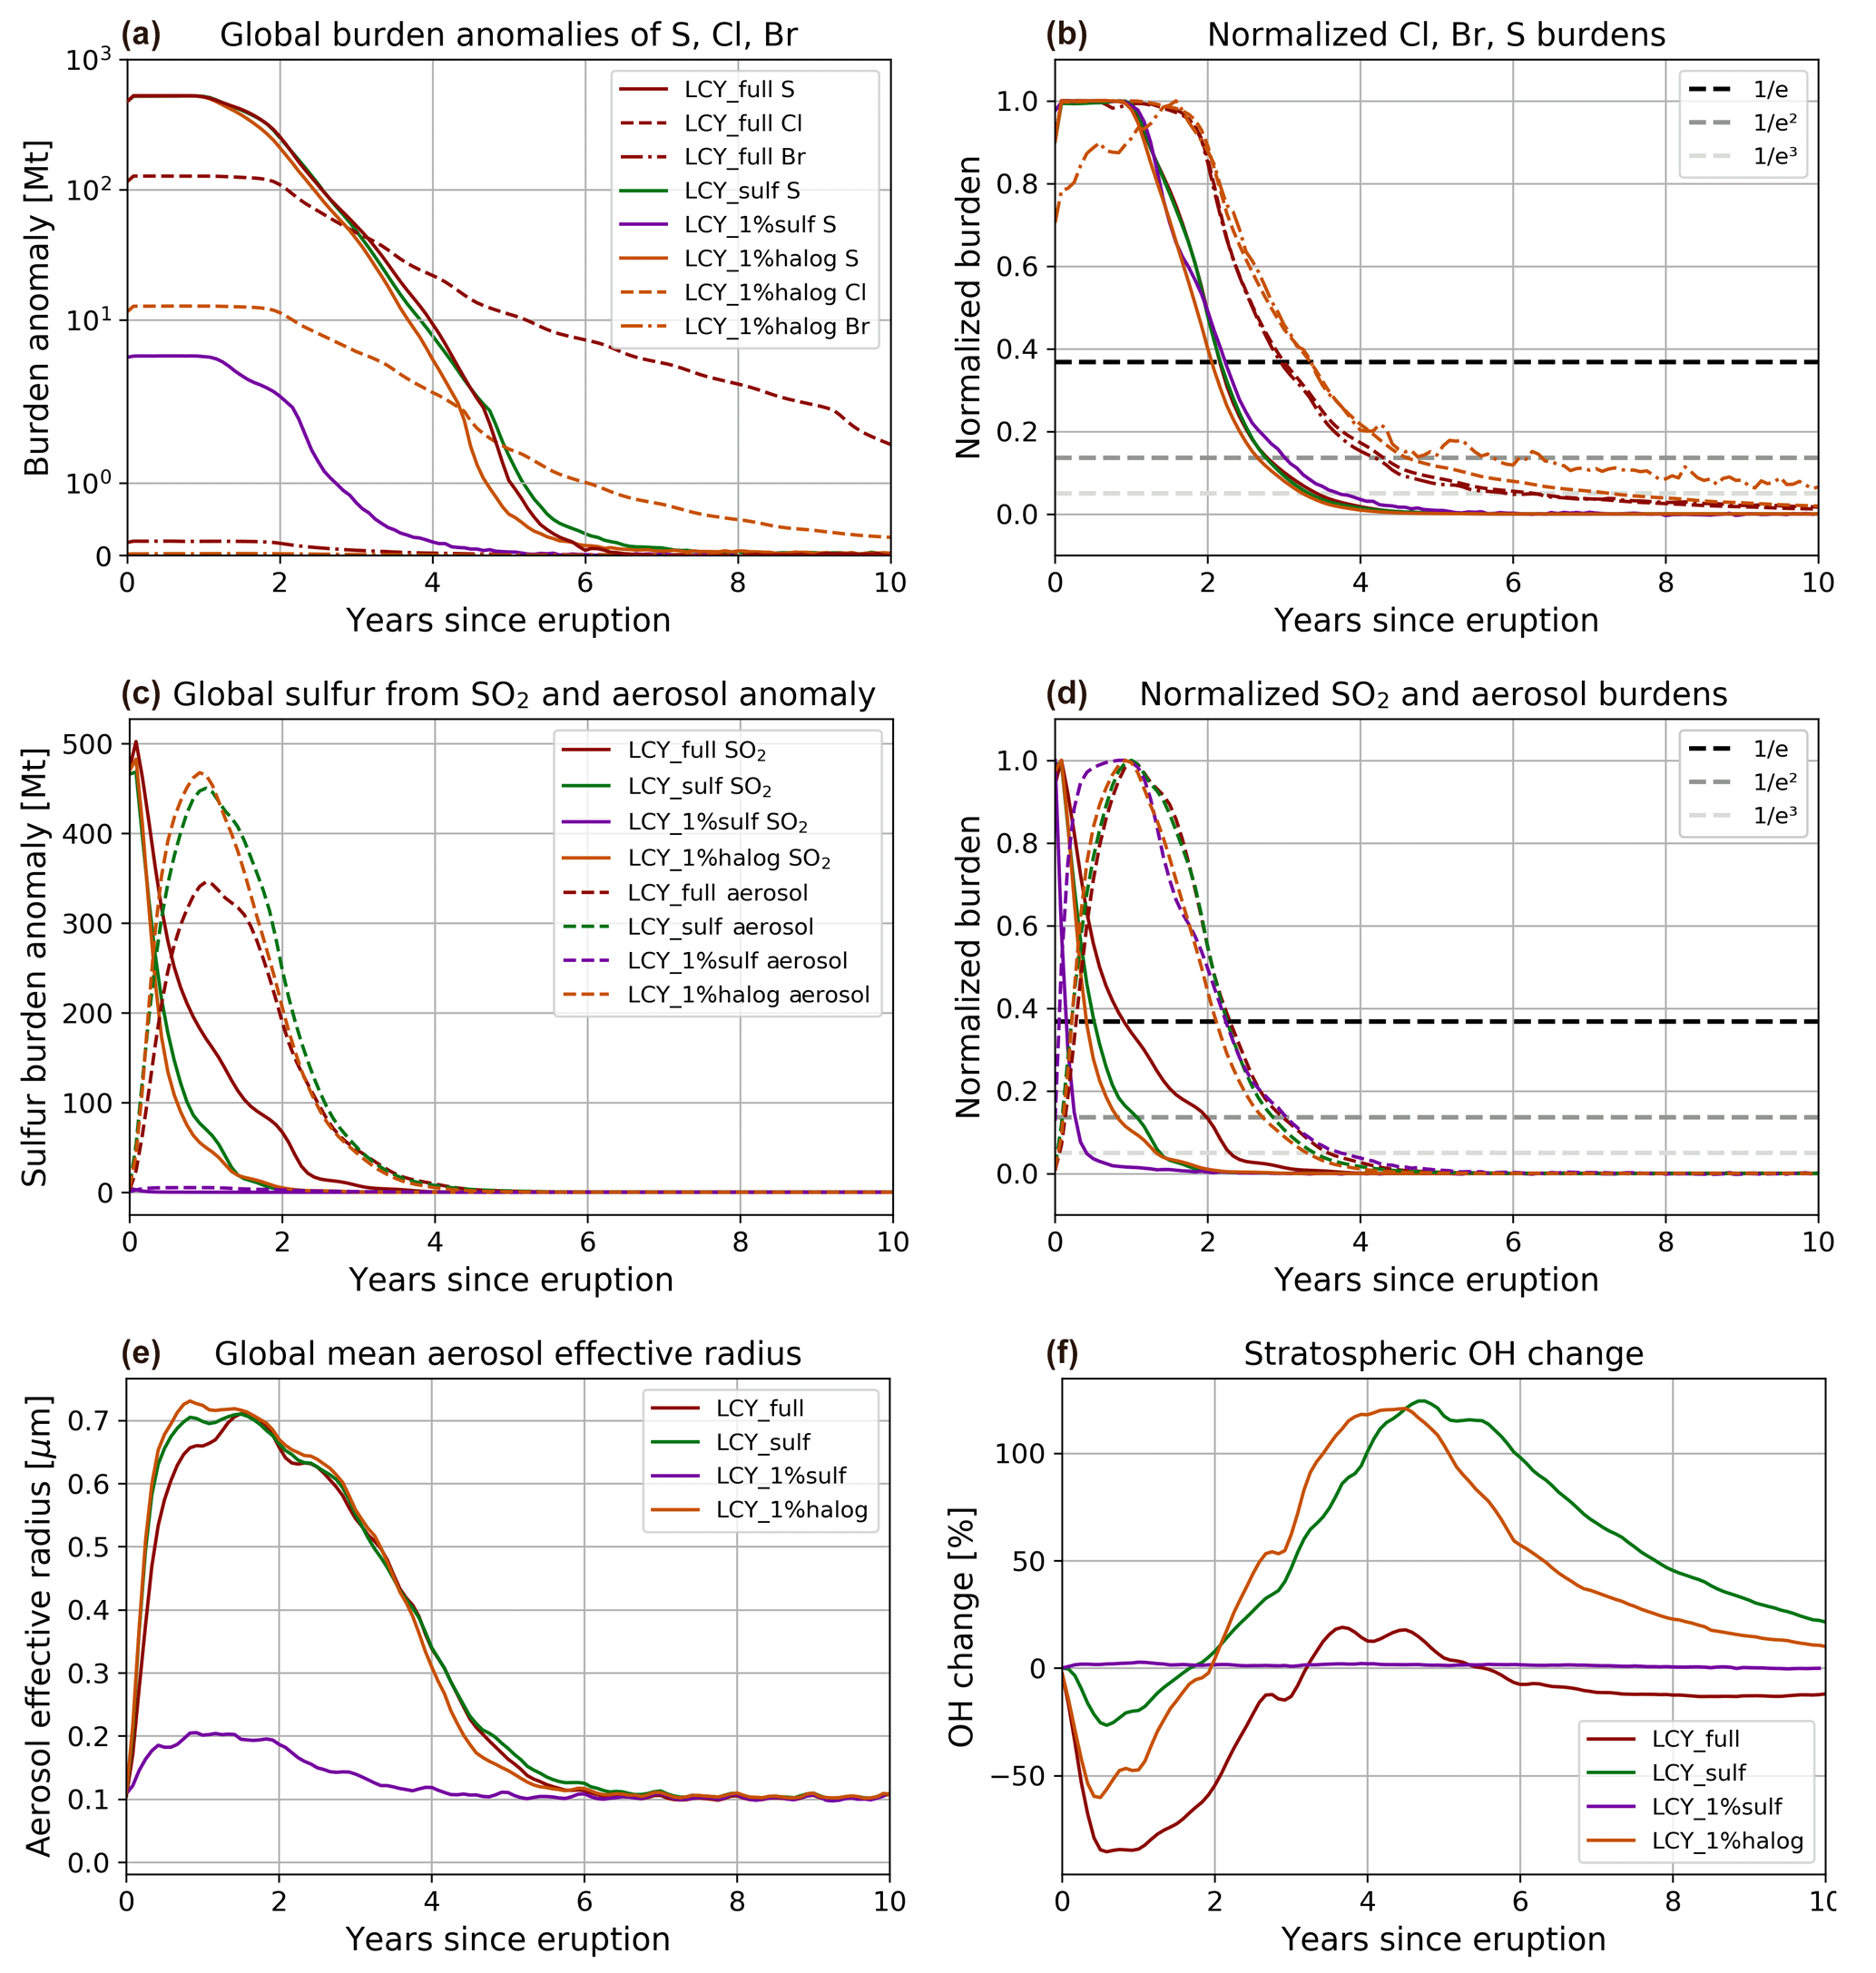
Figure 1Global evolution of sulfur, halogens, aerosols, and OH for the Los Chocoyos simulations. (a) Total sulfur and halogen burden anomalies. (b) Normalized sulfur and halogen burdens. (c) SO2 and sulfate aerosols burdens. (d) Same as (b) but for SO2 and sulfate aerosol burdens. (e) Global mean aerosol effective radius. (f) Time evolution of stratospheric OH change relative to CTR. Dashed horizontal lines in (b) and (d) represent 1∕e, 1∕e2 and 1∕e3.
The conversion of injected SO2 into sulfuric acid aerosol is significantly slowed down in the LCY_sulf, LCY_full, and LCY_1%halog scenarios when compared to the LCY_1%sulf, into which we only injected 1 % of the sulfur (Fig. 1d). The e-folding time of the SO2 burden increases from ∼3 to ∼ 6 months when the injected SO2 mass is increased by a factor of 100. There is an additional increase in lifetime to ∼1 year when halogens are injected in addition to SO2. This increase in the SO2 lifetime is caused by the limited oxidizing capacity of the atmosphere (see also Bekki, 1995). The main compound responsible for oxidizing SO2 to sulfuric acid is OH. When the SO2 burden increases, the availability of OH is limited and oxidation slows down. In addition, when halogens are injected the reactions involving halogens also consume OH (Fig. 1f), which further limits the OH available for SO2 oxidation, and thus further increases the SO2 lifetime (Fig. 1d). This OH-depletion effect may be partly offset by an increase in water vapor and hence HOx in the stratosphere due to the volcanic aerosol heating of the tropical tropopause. However, as the tropical tropopause layer is warmed from 6 months up to 3 years after the eruption (not shown here), we evaluate that these effects play a minor role during the first half year after the eruption when the SO2 conversion mainly takes place.
The peak aerosol mass, when the sulfur burden is the same, depends on the conversion time of SO2 into aerosol. Thus, the peak aerosol mass is lower in the LCY_full scenario when compared to the LCY_sulf (Fig. 1c). Even though the peak burdens are different, the lifetime of the aerosol mass perturbation is very similar in the two cases (Fig. 1d), which indicates that the removal mechanisms in these scenarios are very similar. The global mean weighted aerosol effective radius is very similar in these two scenarios, while in the LCY_1%sulf the aerosols have much smaller effective radii (factor ∼3.5 smaller) (Fig. 1e), as expected when the injection is smaller (English et al., 2013; Pinto et al., 1989; Timmreck et al., 2010). After the eruption of Pinatubo, the aerosol radii were estimated to be approximately 0.5 µm (Russel et al., 1996), compared to 0.2 µm for our LCY_1%sulf scenario and 0.7 µm for the other scenarios, which might indicate that the aerosols are too small in our model. Even though the aerosols are smaller in the LCY_1%sulf simulation, the removal timescale for the aerosols is similar to the two other scenarios. This indicates that gravitational settling is playing a minor role as a removal mechanism for the aerosol mass in this model and that removal processes are happening on the transport timescale of the stratosphere.
Since the maximum aerosol mass in the LCY_sulf is ∼ 25 % larger compared to the maximum mass in LCY_full while the aerosol sizes are approximately the same, we find that the peak AOD at 550 nm is larger in the LCY_sulf (>8) when compared to the LCY_full scenario (∼6) (Fig. 2a). This translates into a larger energy imbalance at the top of the model in LCY_sulf (Fig. 2b). The maximum radiative imbalance at the top of the model is approximately −50 W m−2 in the LCY_sulf and −40 W m−2 in the LCY_full scenario. In both cases, an initial strong negative net imbalance is followed by a small positive net imbalance after ∼3.5 years, and throughout the climate recovery period.
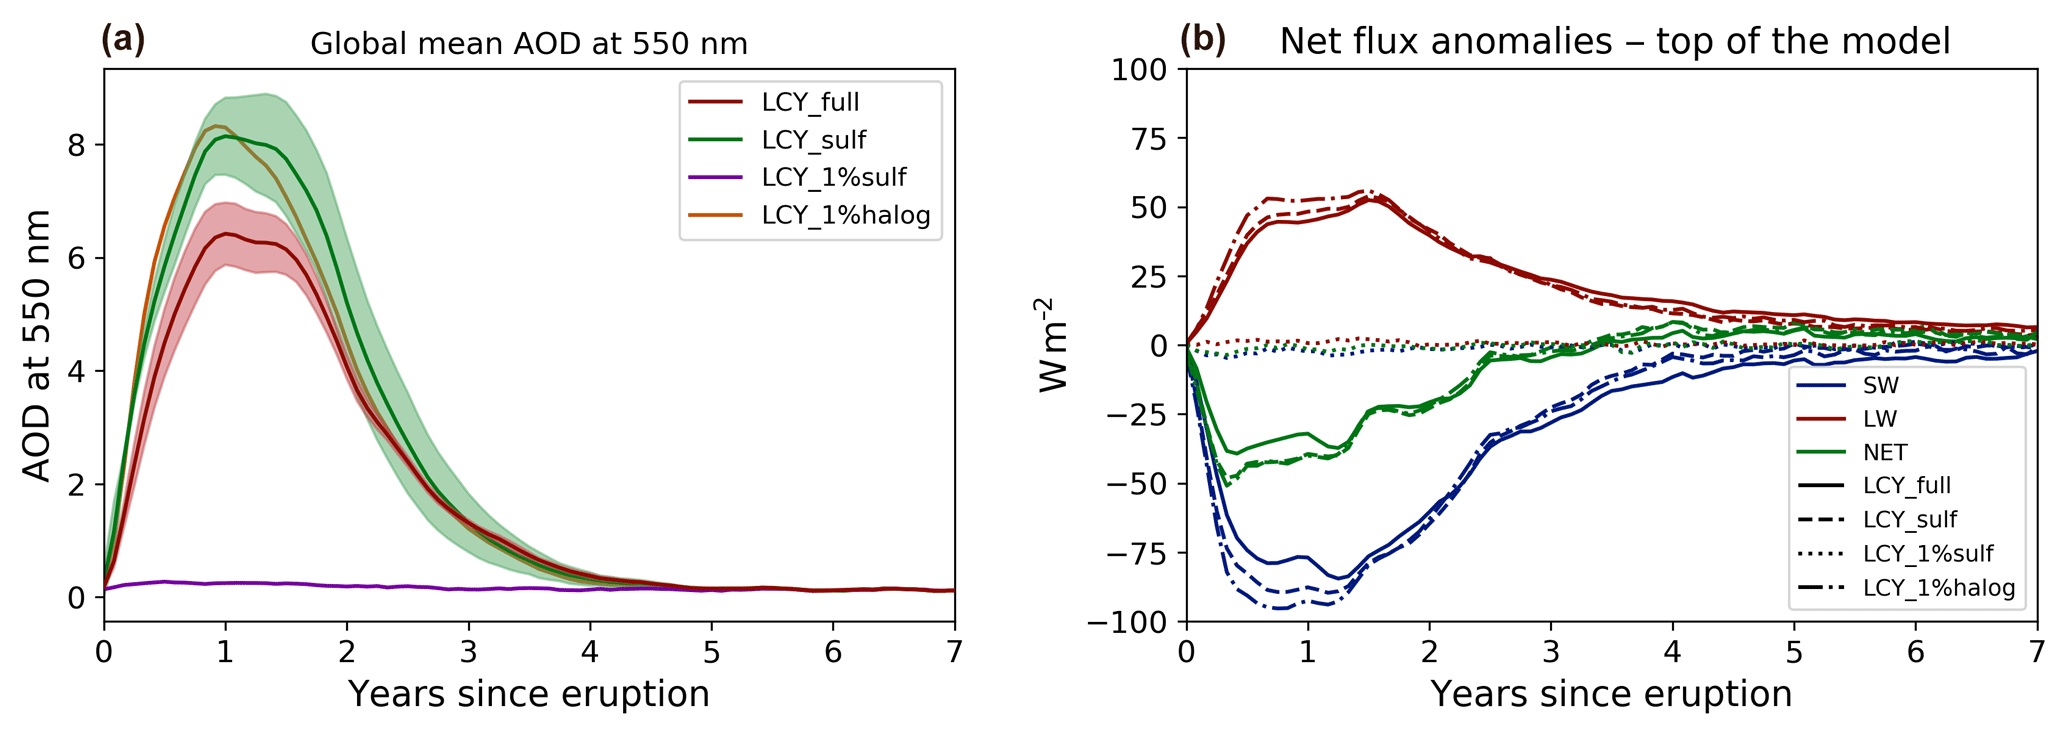
Figure 2Total aerosol optical depth (AOD) at 550 nm and net radiative flux anomalies at the top of the model in the four LCY eruption scenarios.
3.2 Ozone and UV response
Global ozone collapses after the eruption in the LCY_full scenario, with whole-column values decreasing by >80 % to a global mean value of 50 DU during years 2 to 3 after the eruption (Fig. 3a). Ozone levels lower than present-day Antarctic ozone hole conditions (<220 DU) persist for 8 years over the whole globe (Figs. 3a, S1 in the Supplement). Depletion shows a bimodal distribution in the stratosphere, with maximum depletion in the upper (∼4 hPa) and lower (∼30 hPa) stratosphere (Fig. S2). In the lower stratosphere, where most of the ozone mass is located, >70 % of ozone is destroyed after 1 year, and this level of depletion persists for 7 years (not shown). Peak depletion in the lower stratosphere is >95 %. Significant global mean ozone column reduction lasts for ∼12 years. In the Antarctic, ozone hole conditions continue reoccurring annually for 15 years (Fig. S1b). Compared to LCY_full, the ozone response in LCY_1%halog is smaller but reveals a similar response. There was a substantial decrease in global mean column values of ∼150 DU and a recovery after about 10 years; moreover, a larger and longer-lasting ozone response was simulated for an average CAVA eruption with a M=6 and a 10 % halogen injection efficiency (Brenna et al., 2019).
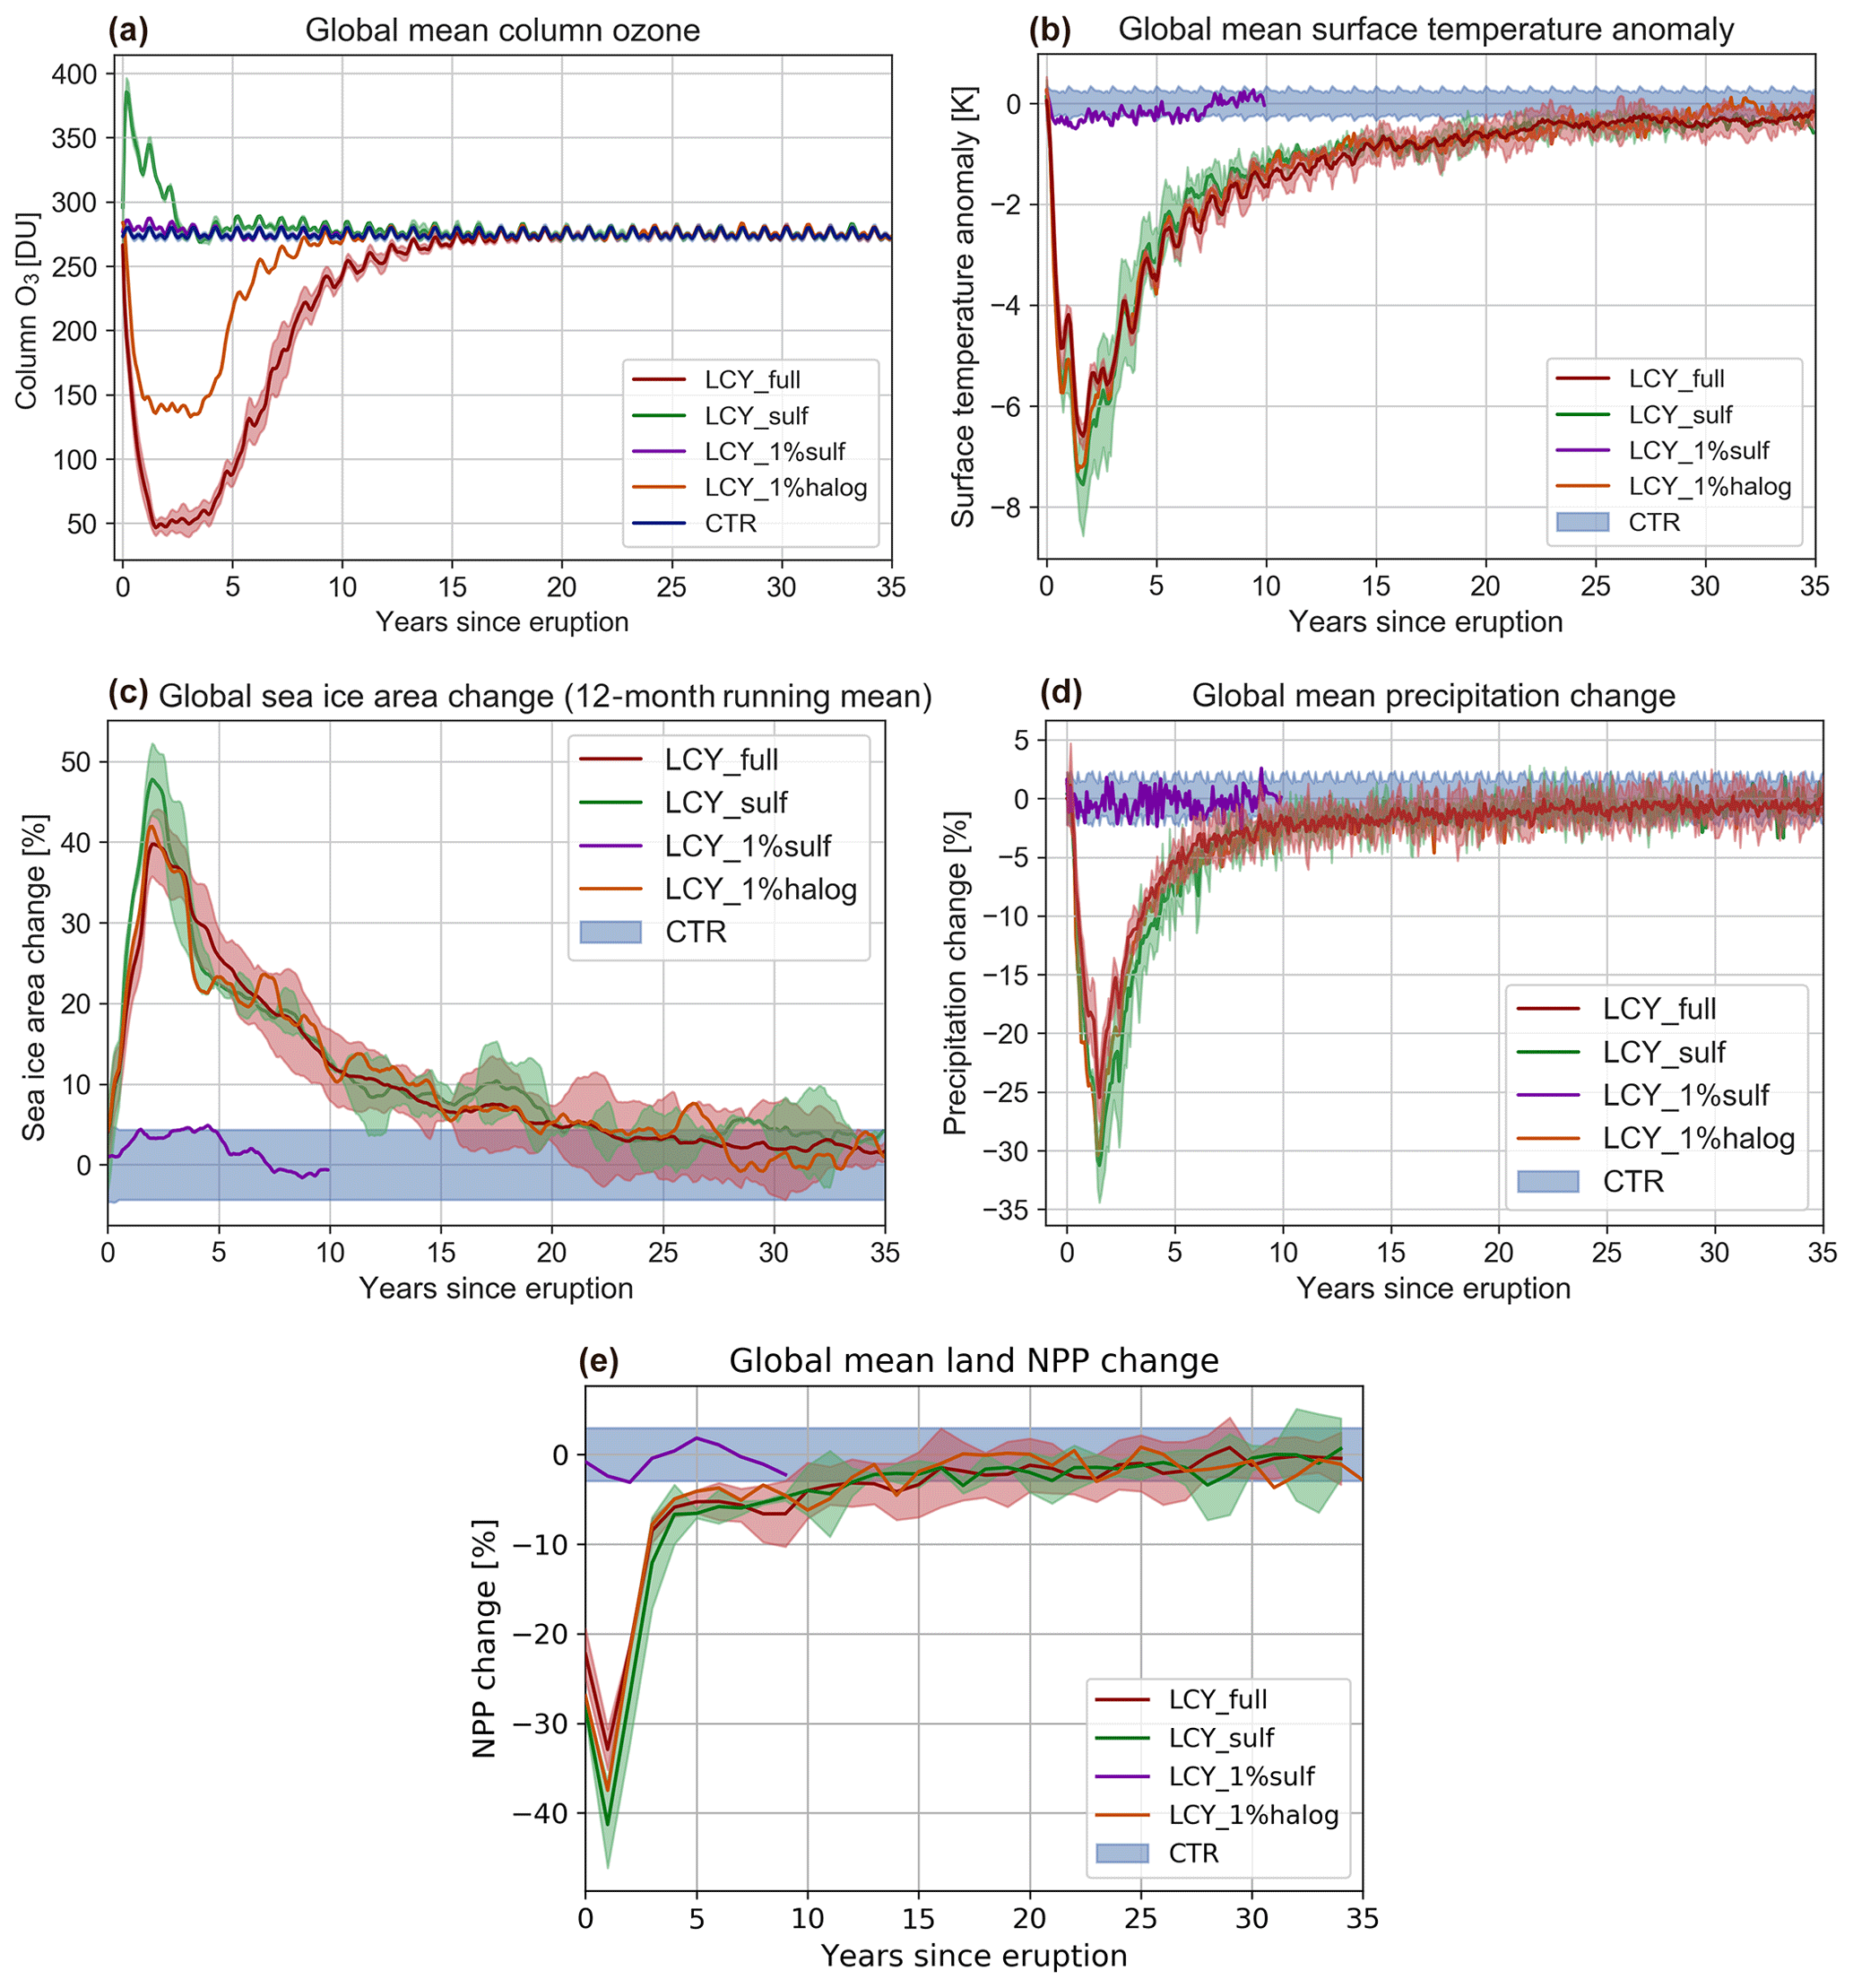
Figure 3Global mean time series of column ozone (a) surface temperature anomalies (b), sea ice area change (c), precipitation change (d), and annual mean net primary production (NPP) change (e) in the LCY simulation scenarios.
In contrast, in the LCY_sulf scenario, the column ozone increases by more than 100 DU in the first year after the eruption (Fig. 3a). This is caused by the increase in heterogeneous chemistry taking place on the sulfate aerosols, which reduces the concentrations of ozone-destroying NOx (Tie and Brasseur, 1995), and was modeled for very large and supervolcanic eruptions injecting sulfur into a preindustrial stratosphere with low chlorine background levels (Muthers et al., 2015; Robock et al., 2009). The ozone increase decays in about 3 years and is only slightly elevated after that until post-eruption year 10 (Fig. 3a). The increase in ozone is concentrated in the mid to high latitudes and mostly in the NH (Fig. S1c).
In Fig. 4 we present global maps of total AOD (panels a, b), the anomalies and the climatologies for column ozone, and surface UV (panels g, h) averaged over the first 5 years (referred to as pentadal) after the eruption for both the LCY_full and LCY_sulf scenarios. The spatial pattern in AOD is similar between the LCY_full and LCY_sulf scenarios, with larger AOD anomalies in the extratropics compared to a band of low AOD in the Southern Hemisphere (SH) tropics, and the largest impacts in the NH (Fig. 4a, b). In LCY_full, AODs are smaller over Antarctica than at lower latitudes. This might be because transport to the Antarctic region is suppressed by the strengthening of the westerlies winds surrounding the southern polar vortex (not shown here), which acts as a transport barrier for very large eruptions (Toohey et al., 2013). In LCY_sulf the global mean AOD is larger (cf. Fig. 2a), which holds for the local distribution over the globe as well (Fig. 4a, b).
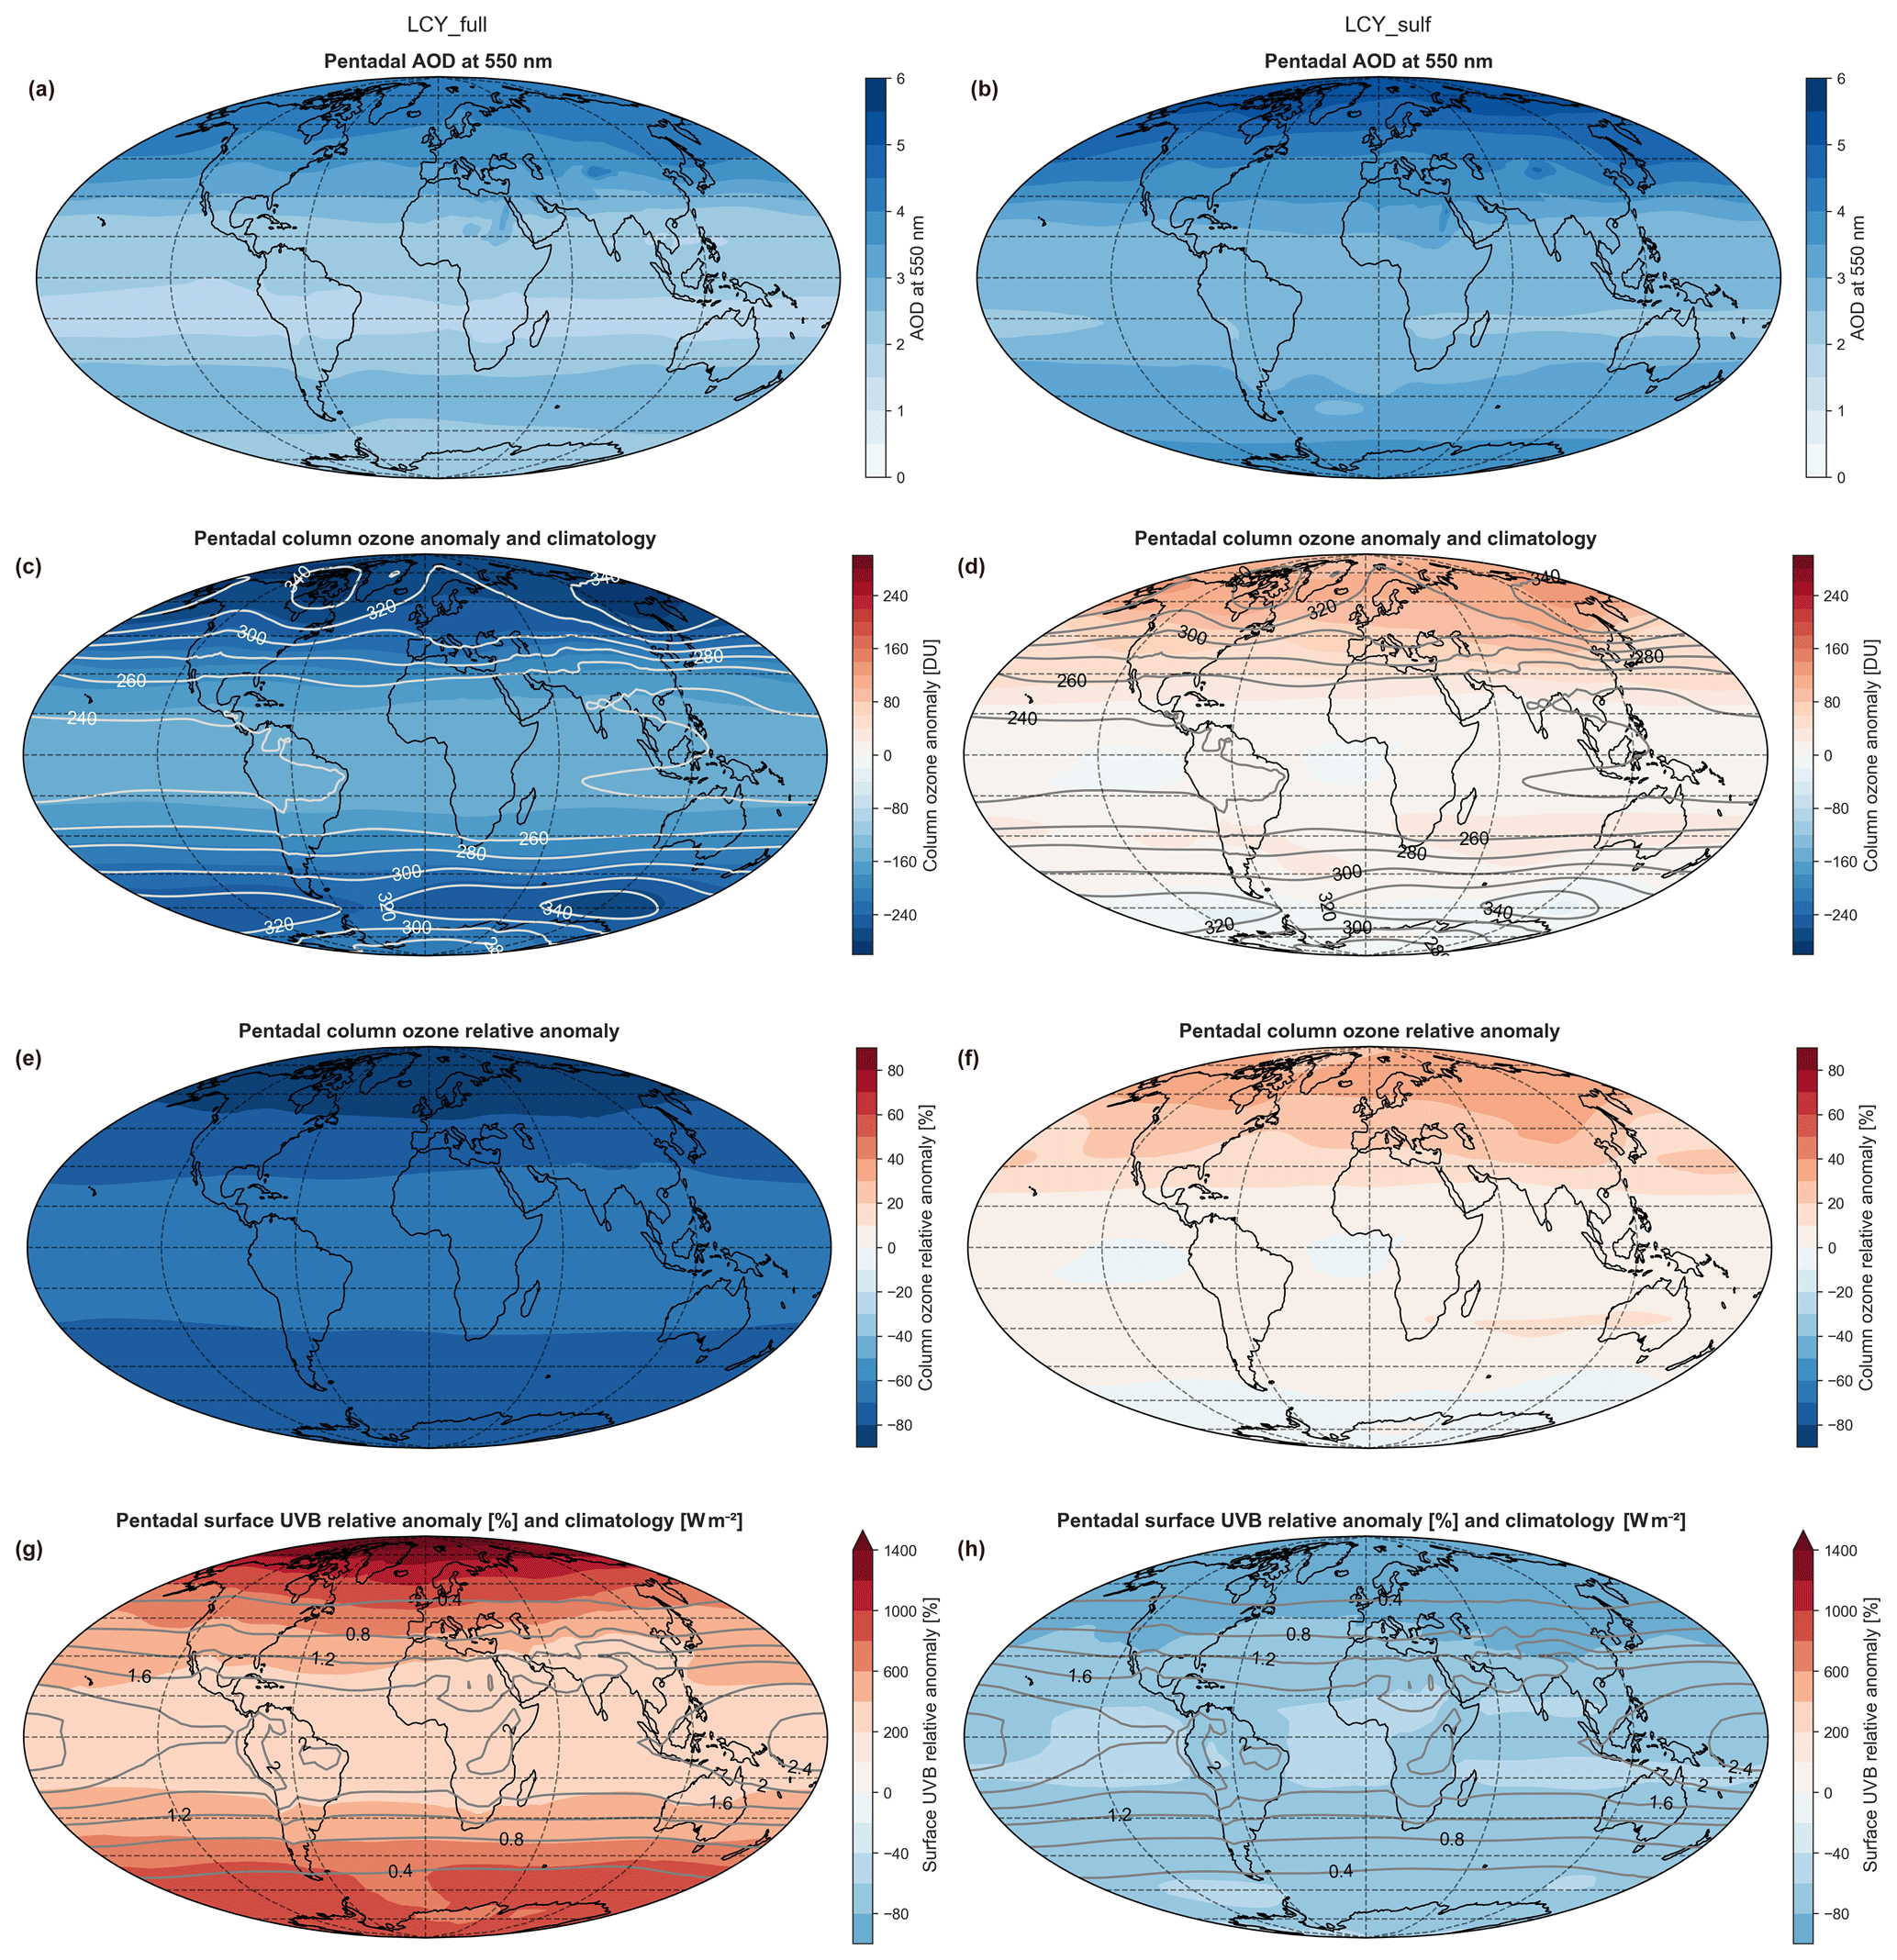
Figure 4Maps of post-eruption 5-year (pentadal) means: AOD (a, b), ozone anomaly and climatology (c, d), ozone change (e, f) and surface UVB weighted for DNA damage change and climatology (g, h) for left side LCY_full (a, c, e, g) and right side LCY_sulf (b, d, f, h).
Figure 4 (panel g and h) shows the calculated change in the amount of surface ultraviolet radiation (UVB) weighted for DNA damage calculated by using the radiation transport model TUV (see Methods). Taking into account both the change in AOD and the change in column ozone in the TUV calculations, we find very large but opposite signals in the two eruption scenarios. In the LCY_full scenario, the largest increases in surface UV are more than 1400 % in the Arctic and more than 1000 % in the Antarctic. Changes are generally smaller towards the Equator, but no part of the planet experiences less than a 200 % increase. The global average UV increase over the 5-year period is 545 %. By contrast, in the LCY_sulf scenario the UVB decreases by more than 80 % in the mid-to-high latitudes of the NH and by >60 % over most of the rest of the planet (Fig. 4g, h). The UV response in our calculations is impacted by the ozone levels and the AOD (Fig. 4a–f), and in LCY_full the AOD and ozone effects are opposing each other with the ozone effects being strongest, while in LCY_sulf they are both contributing to a decrease in surface UV.
3.3 Climate and environmental response
3.3.1 Global surface temperature decreases for 30 years
The time series of global mean surface temperatures are shown in Fig. 3b. For both scenarios, global mean surface temperature decreases more than 6 K and returns to the climatological background after approximately 30 years. The peak cooling in year 2 for LCY_sulf is more than 1 K greater than that of LCY_full. If the aerosol response from the sulfur injection (which is the same in these two scenarios) were the same, we would expect the temperature response to be very similar. Instead, we interpret this difference in surface temperature response due to the large difference in peak AOD (Fig. 2a).
In Fig. 5a and b we show maps of surface temperature anomalies averaged over the first 5 post-eruption years for the scenario LCY_full and the difference with LCY_sulf; LCY_sulf is added to the Supplement (Fig. S3a). Higher surface temperatures in LCY_full than LCY_sulf cover almost the whole globe except for polar regions, which might be slightly cooler since ozone depletion in the stratosphere is a negative radiative forcing on the global climate system (Myhre et al., 2013). Temperature anomaly patterns are relatively similar between the scenarios with surface cooling almost globally and largest anomalies in the NH and over the continents. The magnitudes are large (larger in LCY_sulf, cf. Fig. 3b), even in a 5-year mean, with most continental areas experiencing at least 4 K cooling, and locally dropping to <10 K over central Asia (Figs. 5a, b; S3a).
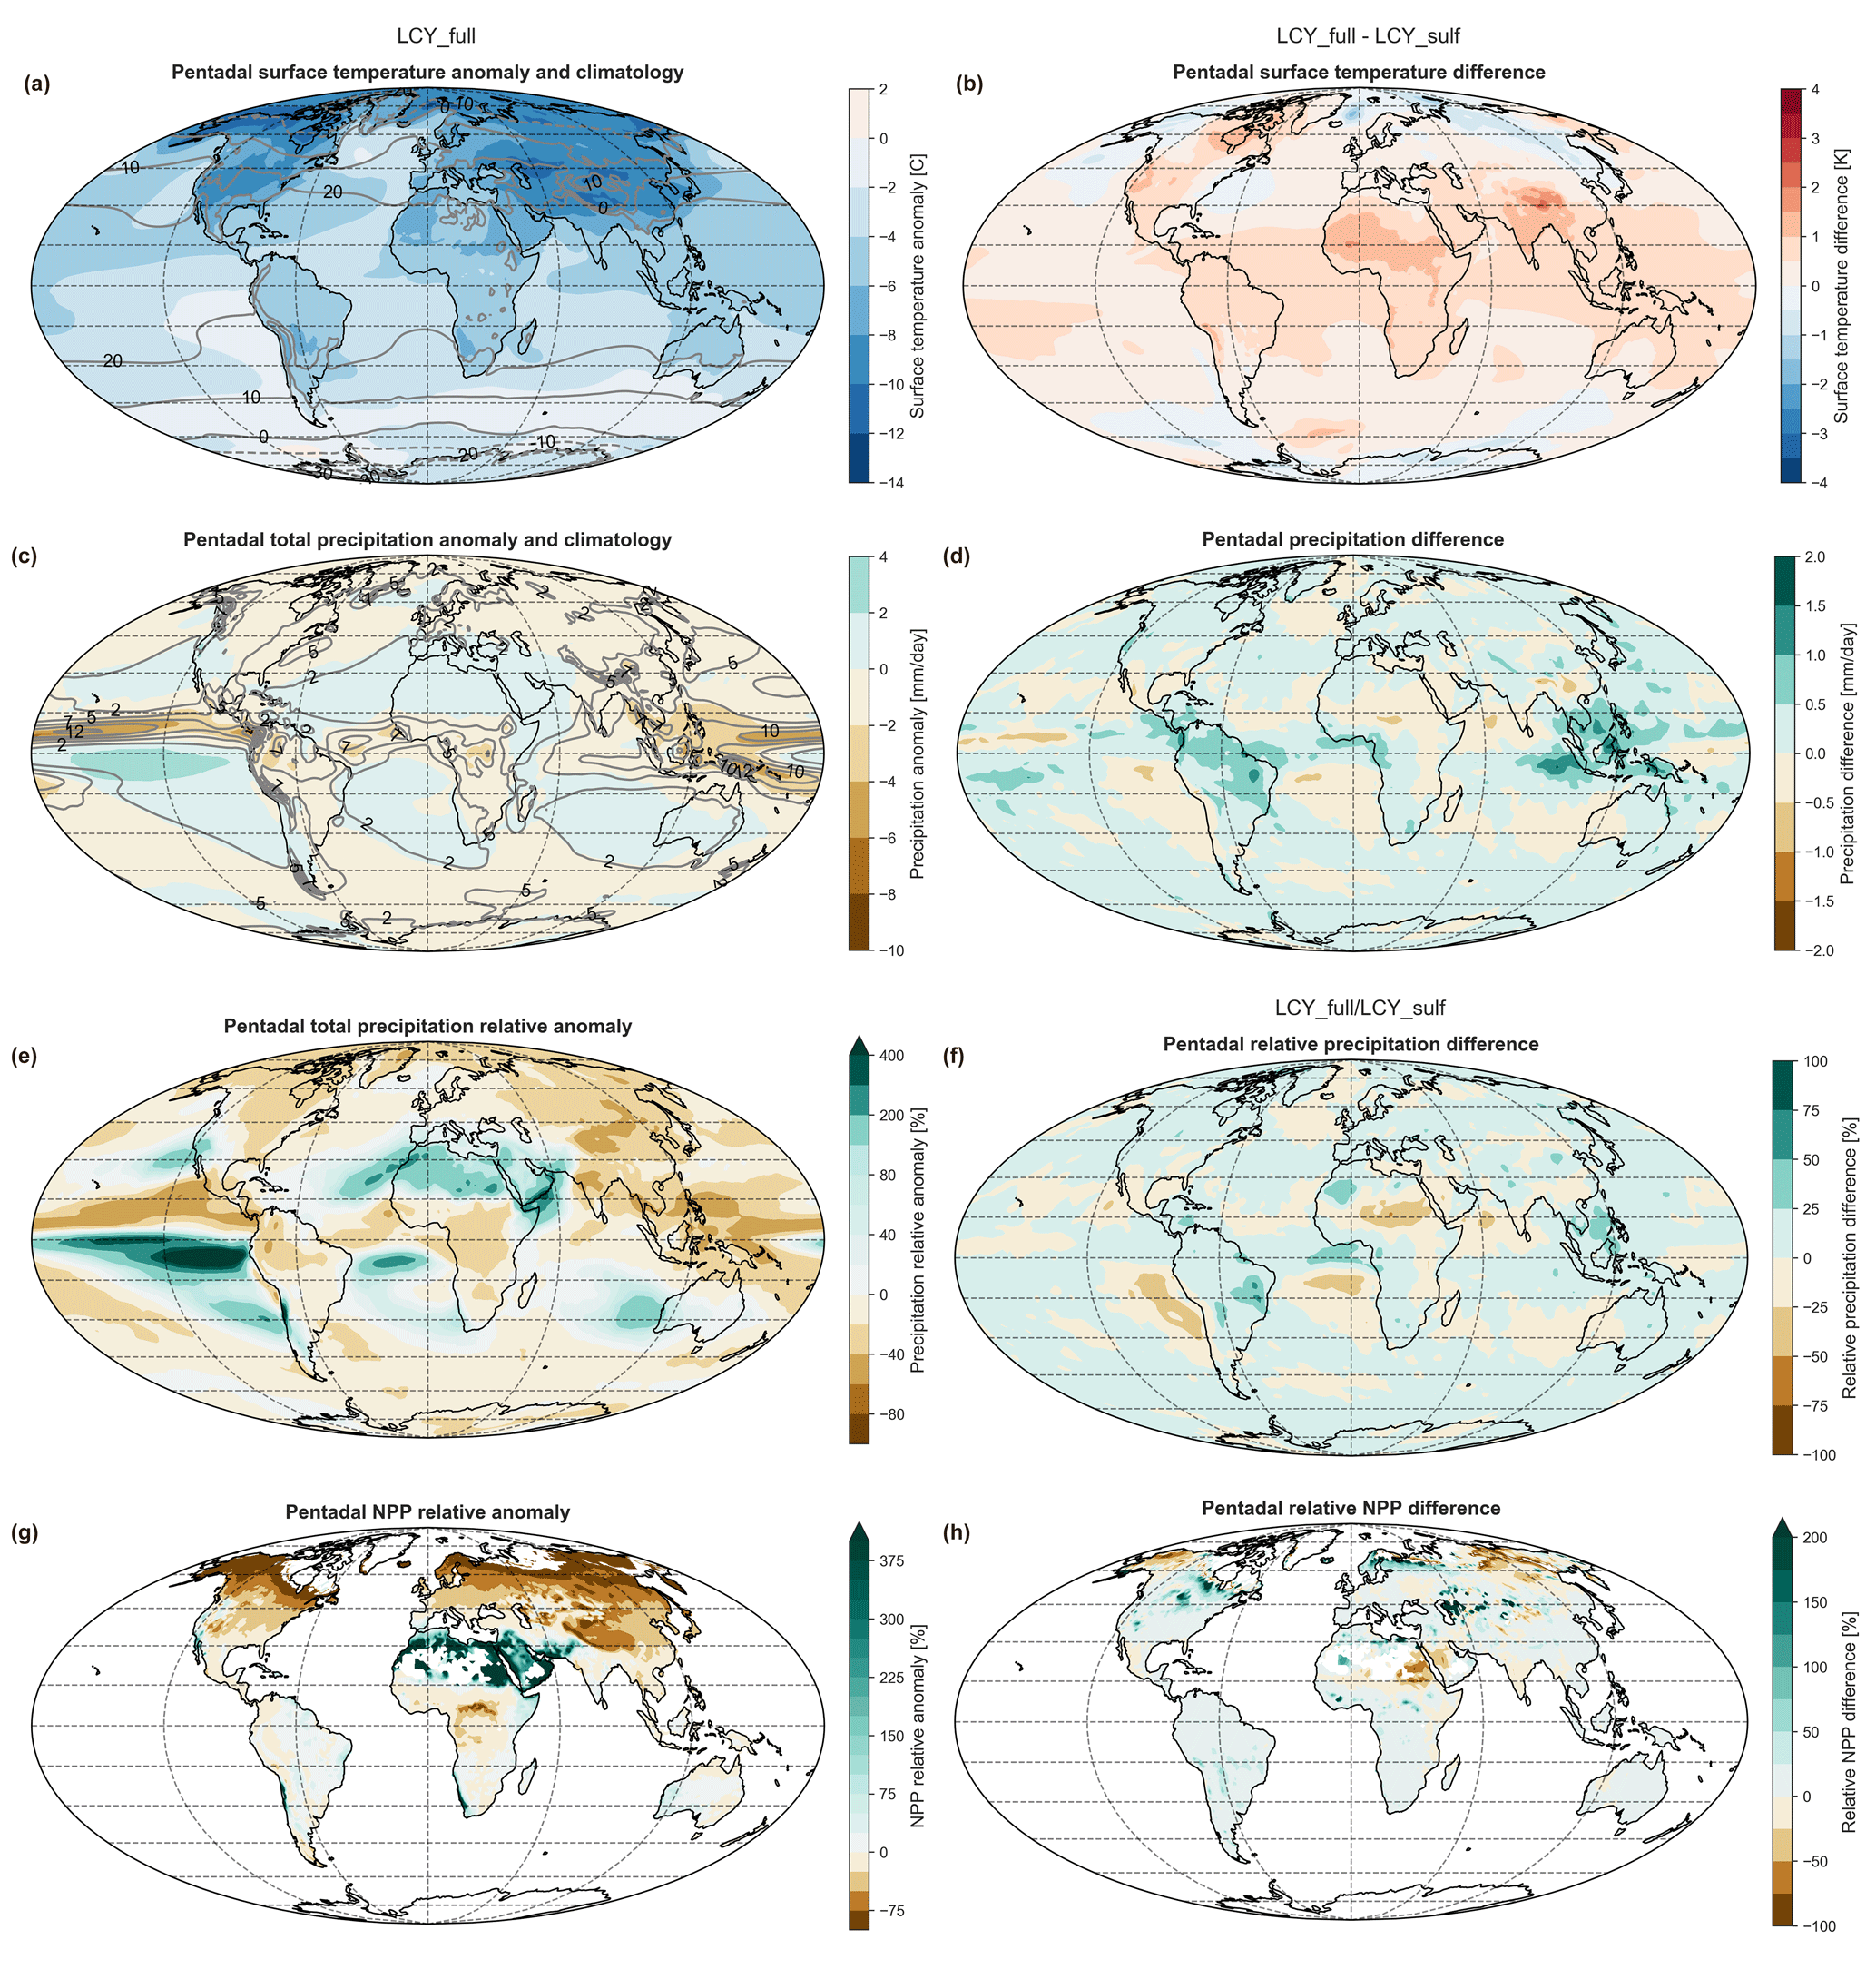
Figure 5Maps of post-eruption 5-year (pentadal) means for LCY_full with climatology (a, c, e, g) and the differences between LCY_full and LCY_sulf (b, d, f, h) as follows: surface temperature anomaly (a, b), precipitation anomaly (c, d), relative precipitation anomaly (e, f), and relative net primary production (NPP) anomaly (g, h). White areas on the NPP maps indicate invalid values.
3.3.2 Sea ice–ocean changes for 20 years
The long-lasting global cooling response cannot be explained by the direct radiative forcing from the volcanic aerosols, since the aerosols have mostly disappeared after 5 years. In Fig. 3c we show the 12-month running mean change in global mean sea ice area. Sea ice immediately responds to the eruption-induced surface cooling with a peak increase in sea ice area globally up to 40 % in LCY_full and up to 50 % in LCY_sulf. Global sea ice area in the model experiments is not back to the climatological values until at least 20 years after the eruption. When inspecting NH sea ice and ocean changes more in detail (Fig. S4) we find that the Arctic sea ice area is increased immediately after the eruption and for more than 20 years with a maximum of 7×10⁶ km2 (not shown), with a 104 % increase in the second post-eruption year. This change is accompanied by a reduction in ocean heat content (not shown) and a decrease in poleward ocean heat transport at 60∘ N after the eruption, lasting from post-eruption year 3 up to 20, with a maximum decrease of up to 0.1 PW (20 %) in post-eruption year 5 (Fig. S4). Thus, abrupt surface cooling and decrease in upper ocean heat content in the NH leads to an immediate increase in Arctic sea ice area in the first years. The reduced poleward ocean heat transport that occurred at northern midlatitudes for up to 20 years sustains the sea ice and climate surface cooling signal for more than 20 years in the NH and also globally. Antarctic sea ice area reveals an interhemispheric-asymmetric response with a slightly later and shorter-lasting increase from post-eruption years 1 to 5, and in contrast to Zanchettin et al. (2014) no subsequent contraction occurs. The poleward ocean heat transport at 60∘ S is much more variable than in the NH and does not show significant changes over longer time periods in our simulations. This may be due to the later supply of AOD to the Southern Hemisphere (SH) (Fig. S1). Thus, there is later radiative forcing and smaller AOD and hence weaker surface climate response in the SH compared to the NH (Figs. 4 and 5). For a tropical January eruption, AOD is first distributed in the tropical belt in the first few weeks before being transported poleward to the NH winter–spring season and then to the SH in the following months (Fig. S1; see also Toohey et al., 2011), which reflects the pathways and seasonality of the Brewer–Dobson circulation (Plumb, 2002). Atmospheric circulation changes are expected to be significant for the LCY eruption as was shown by Toohey et al. (2011, 2013).
3.3.3 Large impacts on precipitation and vegetation
A strong cooling of the atmosphere, like from an explosive volcanic eruption, leads to decreased precipitation (Robock and Liu, 1994). In our simulations, global mean precipitation (Fig. 3d) decreases ∼25 % (∼0.8 mm d−1) in the LCY_full scenario and more than ∼30 % (1 mm d−1) in the LCY_sulf scenario. The LCY_sulf simulation is outside the 2 standard deviation range of the LCY_full ensemble. The return to background climatological precipitation takes more than 10 years in both scenarios. The minimum precipitation is found between 2 and 3 years after the eruption, which closely follows the drop in the temperature signal.
Post-eruption pentadal precipitation patterns are shown in Fig. 5c–f for LCY_full and the difference compared to LCY_sulf; LCY_sulf is added to the Supplement (Fig. S3b, c). Pentadal precipitation patterns are similar in both scenarios, with drying over approximately two-thirds of the planet, a distinct southward shift of the Intertropical Convergence Zone (ITCZ) in the Pacific and Atlantic to the SH tropics, and wetting on the subtropical east sides of the oceanic basins. In addition, there is a pronounced wetting signal (>100 %) throughout the tropical east Atlantic, northern Africa, Middle East, and the Arabian Peninsula. These are relatively dry regions, so an absolute increase in precipitation (<1 mm d−1) corresponds to more than a doubling of rainfall over large parts of this region. Comparing LCY_full and LCY_sulf, the impacts are generally weaker for the first scenario in which we find both drying and wetting.
The strong AOD increase, global surface cooling, and decrease in precipitation together result in a decrease in land plant productivity NPP of >30 % during the first 3 years after the eruption, followed by suppressed production during the next ∼15 years in both scenarios (Fig. 3e). NPP is especially reduced over the NH land with peak decrease >75 % over high latitudes and a gradual weakening of this signal towards lower latitudes (Figs. 5g, h, S3d, S5). However, over northern Africa and the surrounding areas, where precipitation increases significantly due to the southward shift of the ITCZ, we find a corresponding enhancement in land plant productivity as shown by a strong increase in NPP in this region. This is by far the strongest signal we detect in NPP, with more than 400 % gain in some areas. Comparing LCY_full and LCY_sulf, the NPP decrease is generally weaker for the first scenario for the global mean and also for most of the globe locally.
3.4 El Niño conditions
The ENSO response of the simulations is shown in Fig. 6. Even though the initial conditions of the experimental setup span different ENSO states, there is a rapid convergence to a robust response in the LCY_full eruption scenario. The ONI-RSSTA values increase above 2 K during the first 3 years after the eruption. The model ensemble spread is suppressed for 5 years after the eruption before beginning to diverge again. The ONI values exceed the range of natural variability in the control simulation with two distinct maxima during post-eruption year 0 (September to November) and 1 (November to January). The LCY_sulf and LCY_1%halog simulations reveal an even longer lasting strong El Niño response lasting into year 2 in accordance with the longer-lasting volcanic forcing (Fig. 2).

Figure 6ENSO response to the simulated Los Chocoyos eruption and control run (CTR). (a) Ocean Niño Index (ONI) time series based on relative sea surface temperature anomalies (RSSTA) for the LCY_full ensemble, LCY_sulf and LCY_1%sulf (see legend) in full color. The corresponding model years of the CTR without an eruption (see branch years in Table 1) are indicated with pale colors. (b) Averaged RSSTA over the equatorial Pacific for the first 3 post-eruption years as indicated by the gray box in (a).
The maps of RSSTA (Fig. 6b) for LCY_full (and LCY_sulf not shown) depict a strong El Niño response shifted to the SH and maximizing at 12∘ S, which is coherent with the southward shift of the ITCZ (Fig. 5).
This clearly shows that the simulated LCY eruption leads to pronounced El Niño conditions that shifted to the SH tropics during the first 3 post-eruption years.
Our simulations reveal very large climate impacts from the LCY sulfur- and halogen-rich supereruption, which are larger than other recent simulation studies of supereruptions. In Fig. 7 we show scatterplots comparing our simulations of LCY to other simulations of supervolcanic eruptions using sulfur-only injections (English et al., 2013; Jones et al., 2005; Metzner et al., 2014; Robock et al., 2009; Timmreck et al., 2010).
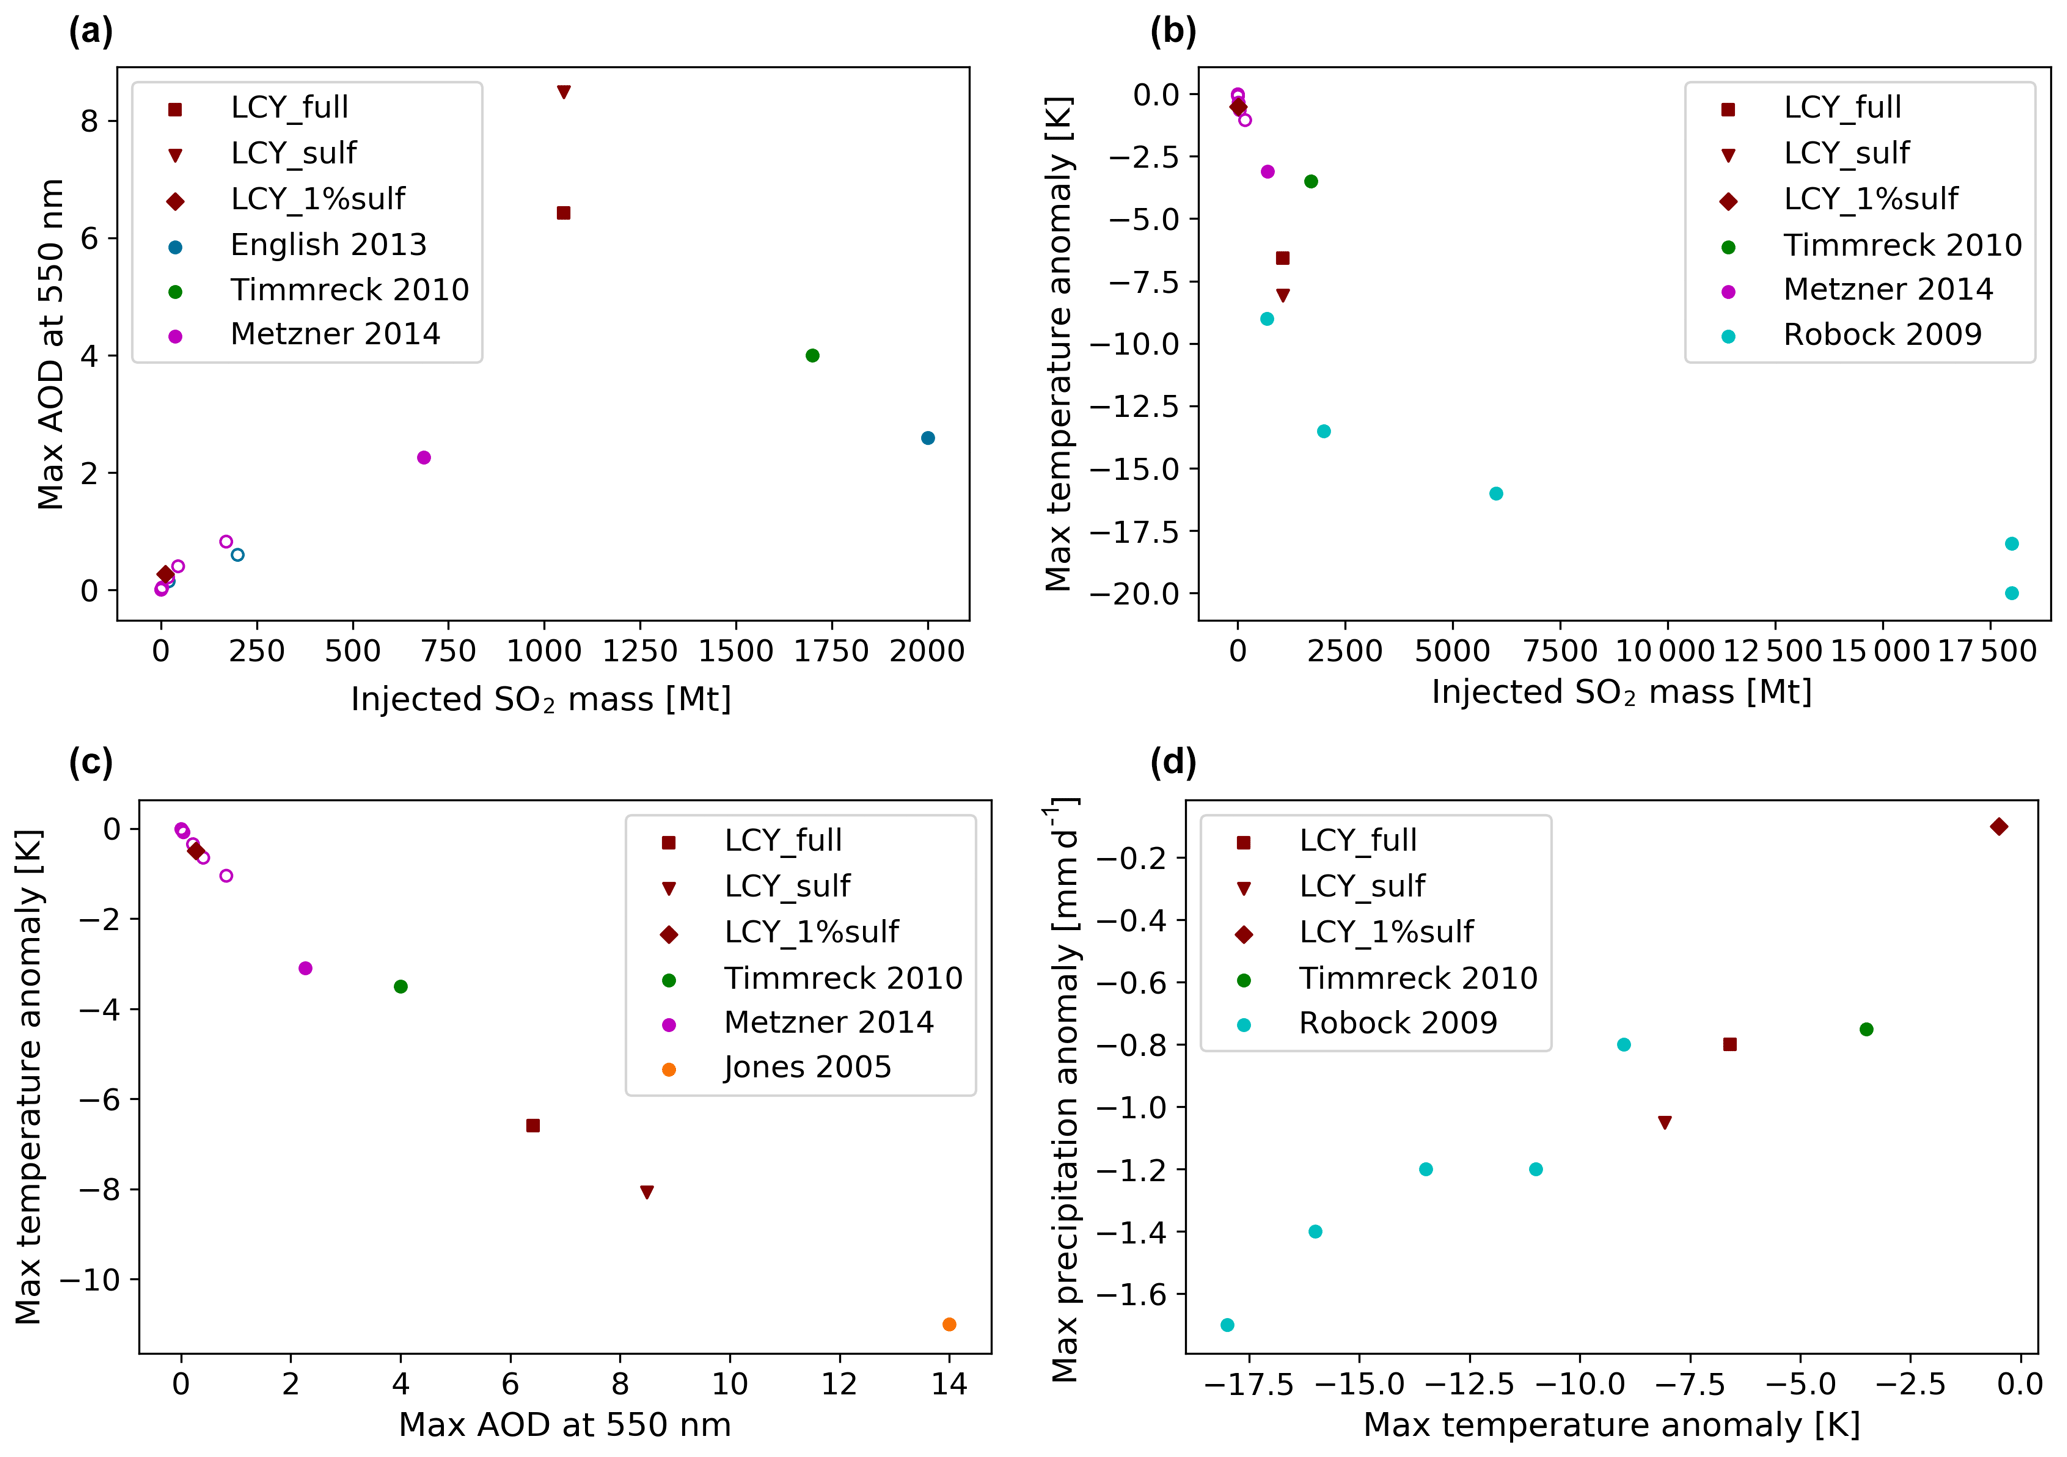
Figure 7Scatterplots comparing our Los Chocoyos simulations to other supersized volcanic eruption simulations from Jones et al. (2005), Robock et al. (2009), Timmreck et al. (2010), English et al. (2013) and Metzner et al. (2014). Large to extremely large explosive eruptions not classified as supereruptions are marked with open circles.
Compared to other model studies with interactive aerosols of volcanic eruptions of M>7, our simulations show very large maximum AODs and thus maximum surface climate impacts for a given sulfur injection (Fig. 7a, b). The largest climate cooling for a supereruption is achieved when using linearly scaled AOD values based on Pinatubo (Jones et al., 2005; Robock et al., 2009), but this approach is simplified since there are several feedbacks (i.e., self-limiting, scattering, and removal of aerosols) that make the relationship between sulfur injection, aerosols, radiative forcing, and climate highly nonlinear (i.e., Bekki, 1995; Metzner et al., 2014; Pinto et al., 1989).
Limiting our comparison to model studies that use sulfur injection to generate self-consistent AOD estimates, we see that our model experiments show longer aerosol lifetime, larger radiative impacts, and larger surface cooling per injected sulfur mass to the stratosphere than those studies (English et al., 2013; Metzner et al., 2014; Timmreck et al., 2010). A model intercomparison for the Tambora eruption revealed that version 5 of WACCM also has the longest aerosol lifetime among compared models (Marshall et al., 2018). The differences (Fig. 7) could be caused by different model top levels, aerosol microphysics (bulk vs. modal vs. sectional modules), radiation, advection, and depositions schemes (see discussions by English et al., 2013; Marshall et al., 2018), as well as atmospheric chemistry (OH, ozone, H2O) and climate/ESM model differences (coupling, resolution, clouds). Our comparison is limited by the fact that the simulations were not part of a coordinated model intercomparison yet; thus, the model experiments are all different when related to eruption strength, date, location, and injection altitude. Volcanic aerosol climate model intercomparisons are in progress now (see Timmreck et al., 2018; Zanchettin et al., 2016) and should include extremely large to supersized eruptions, where the model spread is even larger (Fig. 7) but observational evidence is lacking.
Even though the halogen injection efficiency for a supereruption like LCY is highly uncertain, we expect that the effects of injected halogens would similarly be qualitatively independent of the magnitude of the injection as our model results for 10 % and 1 % halogen injections reveal. Injecting additional volcanic halogens into the stratosphere leads to ozone depletion (this study; Brenna et al., 2019), and the interaction with the OH availability impacts the aerosol formation which leads to smaller maximum AOD and hence weaker surface cooling. Including the volcanic release of halogens as well as sulfur should be part of future model intercomparisons focusing on volcanic impacts on climate and ozone.
Figure 7c shows a clear, nearly linear relationship between peak surface cooling and peak AOD. This is consistent with previous studies (Hansen et al., 1980; Metzner et al., 2014; Timmreck et al., 2012).
When atmospheric temperatures drop after a volcanic eruption, changes in the energy balance of the climate system lead to decreased global mean precipitation (Iles et al., 2013; Robock and Liu, 1994). The global mean precipitation response to the supervolcanic eruptions follows a nearly linear relation with temperature (Fig. 7d) because larger cooling leads to larger negative precipitation anomalies through a weakening of the global hydrological cycle, since lower temperatures leads to lower relative humidity in the troposphere. Our modeled southward shift of the ITCZ towards the southern tropics is accompanied by increased precipitation across northern Africa and the Middle East, which is also partly simulated in Robock et al. (2009) and Timmreck et al. (2010, 2012), but the area experiencing wetting is larger in our simulations. The wetting of northern Africa and the Middle East in our simulations leads to a strong increase in NPP in this area, which likely leads to a greening of the Sahara. Timmreck et al. (2012), with only half the volcanic forcing that we simulate, show NPP maps (vegetation impacts are simulated using an offline vegetation model), and here there is very little change over the first 3 post-eruption years throughout this region. While we cannot compare our NPP field directly to the changes in the vegetation types presented in Robock et al. (2009), we note that they simulate an increase in grass cover throughout northern Africa and parts of the Middle East where there is very low vegetation cover in their control run, which would imply an increase in NPP in this region as well.
We simulate pronounced El Niño conditions in our LCY supereruption during the first 3 post-eruption years, which is superposed on a strong surface cooling signal. El Niño conditions may be favored as discussed in more detail by Emile-Geay et al. (2008) due to the uniform solar dimming that leads to a thermostat mechanism (Clement et al., 1996) initiating air–sea interaction in the equatorial Pacific. Our simulations of the sulfur- and halogen-rich LCY supereruption in the northern tropics (14.6∘ N) during January add another puzzle piece to the ongoing discussion of volcanic eruption impacts on ENSO (see Introduction). A coordinated model intercomparison study would help to shed more light on the different model response and mechanism.
Atmospheric circulation changes at high latitudes (i.e., stratospheric polar vortices, annular modes) are expected to be significant as was investigated by Toohey et al. (2011, 2013). A follow-up LCY paper will investigate the impacts on the stratospheric circulation in the tropics, the QBO, in more detail.
Using a fully coupled ESM with interactive aerosols and atmospheric chemistry is currently the best possible way to simulate the impacts of supervolcanoes on the Earth system. Our model setup takes into account the interactive coupling between most of the components of the Earth system, including ocean, sea ice, biogeochemistry, land surface and vegetation interactions. In addition, the inclusion of interactive aerosols and atmospheric chemistry is crucial to correctly simulate the feedback between the chemical composition of the atmosphere, aerosols and radiation. That said, there is still considerable uncertainty in the impacts of volcanic sulfur injections, particularly in the conversion of SO2 into sulfate aerosol, aerosol size and the lifetime of the radiative perturbation. The uncertainty in the Earth system's reaction to a given volcanic aerosol radiative forcing seems to be smaller (cf. Fig. 7c). Two recent studies suggest that LCY might have been the eruption of the last 100 kyr with the largest climate impact. Cisneros et al. (2020) report a new and higher sulfur-mass estimate for LCY. Meanwhile, Toba is estimated to be less sulfur-rich than previously assumed (Chesner and Luhr, 2010). In order to compare these two supereruptions and petrological estimates, other archives such as ice core records would be needed. However, no tephra has been identified in Greenland and Antarctica ice cores for both eruptions up to now (Abbott et al., 2012; Svensson et al., 2013). This model study together with a new examination of the LCY eruption date and a higher mass estimate (Cisneros et al., 2020) will hopefully stimulate upcoming studies finding corresponding paleoproxies in ice cores, climate, and archeological archives with high temporal resolution and precision.
We simulated the Los Chocoyos (LCY) eruption of Atitlán under 1850 preindustrial conditions with 523 Mt sulfur, 1200 Mt chlorine, and 2 Mt bromine emissions and assumed 10 % stratospheric injection efficiency for the halogens. The model results may have been similar for LCY 84 000 years ago, as we did not set up the simulations with observed initial conditions and there are uncertainties in the volcanic emissions. As expected, if there are large halogen emissions, the climate and environment response is different than if the volcano only emits sulfur into the stratosphere. Overall, we evaluate our model results to show a lower estimate of the possible climate and environment response given the likely low estimates for our petrologically derived volcanic emissions.
Our comprehensive aerosol chemistry Earth system model (ESM) study shows that a sulfur- and halogen-rich tropical supereruption like LCY has massive impacts on global climate and the environment that last at least 20 to 30 years.
In the model, enhanced volcanic sulfate burdens and aerosol optical depth (AOD) persists for 5 years, while the halogens stay elevated for ∼14 years. Under preindustrial conditions, the eruption leads to a global collapse of the ozone layer (80 % decrease) with global mean values of 50 DU and increasing surface UVB by 550 % globally over the first 5 years after the eruption. (In high latitudes the increase is >1000 %.) The ozone layer takes 15 years to recover. The simulated volcanic eruption, at 14.6∘ N in January, shows an asymmetric-hemispheric response with enhanced AOD, ozone, UV, and climate signals over the Northern Hemisphere (NH).
The eruption cools the global climate, which lasts more than 30 years with the peak AOD of >6 that leads to surface cooling >6 K, and precipitation and terrestrial net primary production decrease up to 30 % in the first 2 years. Locally, a wetting (>100 %) and strong increase in NPP (>400 %) over northern Africa that is simulated in the first 5 years is also related to a southward shift of the ITCZ to the southern tropics. The global sea ice area almost doubles, and the long-lasting surface cooling is sustained by an increase in Arctic ice area, followed by a decrease of poleward ocean heat transport at 60∘ N from year 3. Both changes last up to 20 years. The ocean responds with pronounced El Niño conditions in the first 3 years by maximizing at 12∘ S, which is coherent with the southward shift of the ITCZ.
In contrast, simulations of LCY including sulfur, but neglecting halogens, reveal a larger sulfate burden and maximum AOD (∼8); hence, there is a larger radiative forcing with more pronounced surface climate cooling (>7 K) and reduced precipitation (25 %) globally, even though spatial patterns of changes are similar to the simulations including volcanic sulfur and halogens. The environmental impacts reveal the opposite signal with a short-lived increase in column ozone of 100 DU (>30 %) and decrease in UV (>60 %) that lasts up to 3 years.
LCY is one of the largest volcanic eruptions over the past 100 kyr, and we predict large impacts on the biosphere and thus any human populations at that time. Finding paleoproxies that show the impact of LCY on climate and the environment should be possible, given the large long-lasting impact from our ESM simulations, but it will require high (subdecadal) temporal-resolution archives that use the eruption as a time marker.
All simulation data will be archived in the Norwegian National e-Infrastructure for Research Data (NIRD) Archive. The model output is available from the corresponding author upon request. Post-processing and visualization of data was performed with Python. The scripts and the post-processed data files are available on request from the corresponding author.
The supplement related to this article is available online at: https://doi.org/10.5194/acp-20-6521-2020-supplement.
HB performed the simulations, data analysis, and produced the figures. HB, KK, and SK interpreted the results. MJM provided the CESM2(WACCM6) model and supported HB in performing the simulations. HB wrote the manuscript with contributions from all the coauthors.
The authors declare that they have no conflict of interest.
This article is part of the special issue of “The Model Intercomparison Project on the climatic response to Volcanic forcing (VolMIP) (ESD/ACP/CP/GMD inter-journal SI)”. It is not associated with a conference.
The authors wish to thank the CESM model team at NCAR for providing the CESM2(WACCM6) model code and for their technical support. The simulations for this study were performed with resources provided by the Uninett Sigma2 AS, as part of the national infrastructure for high-performance computing and data storage in Norway. The authors also wish to thank Slimane Bekki, Alan Robock, and the two anonymous reviewers for the helpful comments that improved this paper.
The publication of this article is funded by the European Geosciences Union (EGU) through the Atmospheric Sciences 2018 Outstanding Student Poster and PICO (OSPP) Award for Hans Brenna.
This paper was edited by Slimane Bekki and reviewed by Alan Robock and two anonymous referees.
Abbott, P. M., Davies, S. M., Steffensen, J. P., Pearce, N. J. G., Bigler, M., Johnsen, S. J., Seierstad, I. K., Svensson, A., and Wastegård, S.: A detailed framework of Marine Isotope Stages 4 and 5 volcanic events recorded in two Greenland ice-cores, Quaternary Sci. Rev., 36, 59–77, https://doi.org/10.1016/j.quascirev.2011.05.001, 2012.
Adams, J. B., Mann, M. E., and Ammann, C. M.: Proxy evidence for an El Niño-like response to volcanic forcing, Nature, 426, 274–278, https://doi.org/10.1038/nature02101, 2003.
Ambrose, S. H.: Late Pleistocene human population bottlenecks, volcanic winter, and differentiation of modern humans, J. Hum. Evol., 34, 623–651, https://doi.org/10.1006/jhev.1998.0219, 1998.
Anchukaitis, K. J., Buckley, B. M., Cook, E. R., Cook, B. I., D'Arrigo, R. D., and Ammann, C. M.: Influence of volcanic eruptions on the climate of the Asian monsoon region, Geophys. Res. Lett., 37, L22703, https://doi.org/10.1029/2010GL044843, 2010.
Bailey, D., Hunke, E., DuVivier, A., Lipscomb, B., Bitz, C., Holland, M., Briegleb, B., and Schramm, J.: CESM CICE5 Users Guide, available at: https://buildmedia.readthedocs.org/media/pdf/cesmcice/latest/cesmcice.pdf (last access: 13 May 2020), 2018.
Bekki, S.: Oxidation of volcanic SO2: A sink for stratospheric OH and H2O, Geophys. Res. Lett., 22, 913–916, https://doi.org/10.1029/95GL00534, 1995.
Bekki, S., Pyle, J. A., Zhong, W., Toumi, R., Haigh, J. D., and Pyle, D. M.: The role of microphysical and chemical processes in prolonging the climate forcing of the Toba Eruption, Geophys. Res. Lett., 23, 2669–2672, https://doi.org/10.1029/96GL02088, 1996.
Brasseur, G. P. and Solomon, S.: Aeronomy of the middle atmosphere: Chemistry and physics of the stratosphere and mesosphere, Planet. Space Sci., 33, https://doi.org/10.1016/0032-0633(85)90091-1, 2005.
Brenna, H., Kutterolf, S., and Krüger, K.: Global ozone depletion and increase of UV radiation caused by pre-industrial tropical volcanic eruptions, Sci. Rep.-UK, 9, 1–14, https://doi.org/10.1038/s41598-019-45630-0, 2019.
Cadoux, A., Scaillet, B., Bekki, S., Oppenheimer, C., and Druitt, T. H.: Stratospheric Ozone destruction by the Bronze-Age Minoan eruption (Santorini Volcano, Greece), Sci. Rep.-UK, 5, 12243, https://doi.org/10.1038/srep12243, 2015.
Cadoux, A., Iacono-Marziano, G., Scaillet, B., Aiuppa, A., Mather, T. A., Pyle, D. M., Deloule, E., Gennaro, E., and Paonita, A.: The role of melt composition on aqueous fluid vs. silicate melt partitioning of bromine in magmas, Earth Planet. Sc. Lett., 498, 450–463, https://doi.org/10.1016/j.epsl.2018.06.038, 2018.
Chesner, C. A. and Luhr, J. F.: A melt inclusion study of the Toba Tuffs, Sumatra, Indonesia, J. Volcanol. Geoth. Res., 197, 259–278, https://doi.org/10.1016/j.jvolgeores.2010.06.001, 2010.
Cisneros de León, A., Schindlbeck-Belo, J. C., Kutterolf, S., Danišík, M., Schmitt, A., Freundt, A., and Pérez, W.: A history of violence: magma incubation, timing, and tephra distribution of the Los Chocoyos super-eruption (Atitlán Caldera, Guatemala), J. Quat. Sci., in review, 2020.
Clement, A. C., Seager, R., Cane, M. A., and Zebiak, S. E.: An ocean dynamical thermostat, J. Climate, 9, 2190–2196, https://doi.org/10.1175/1520-0442(1996)009<2190:AODT>2.0.CO;2, 1996.
Danabasoglu, G., Lamarque, J. F., Bacmeister, J., Bailey, D. A., DuVivier, A. K., Edwards, J., Emmons, L. K., Fasullo, J., Garcia, R., Gettelman, A., Hannay, C., Holland, M. M., Large, W. G., Lauritzen, P. H., Lawrence, D. M., Lenaerts, J. T. M., Lindsay, K., Lipscomb, W. H., Mills, M. J., Neale, R., Oleson, K. W., Otto-Bliesner, B., Phillips, A. S., Sacks, W., Tilmes, S., van Kampenhout, L., Vertenstein, M., Bertini, A., Dennis, J., Deser, C., Fischer, C., Fox-Kemper, B., Kay, J. E., Kinnison, D., Kushner, P. J., Larson, V. E., Long, M. C., Mickelson, S., Moore, J. K., Nienhouse, E., Polvani, L., Rasch, P. J., and Strand, W. G.: The Community Earth System Model Version 2 (CESM2), J. Adv. Model. Earth Syst., 12, 1–35, https://doi.org/10.1029/2019MS001916, 2020.
Devine, J. D., Sigurdsson, H., Davis, A. N., and Self, S.: Estimates of sulfur and chlorine yield to the atmosphere from volcanic eruptions and potential climatic effects, J. Geophys. Res.-Sol Ea., 89, 6309–6325, https://doi.org/10.1029/JB089iB07p06309, 1984.
Drexler, J. W., Rose, W. I., Sparks, R. S. J., and Ledbetter, M. T.: The Los Chocoyos Ash, guatemala: A major stratigraphic marker in middle America and in three ocean basins, Quaternary Res., 13, 327–345, https://doi.org/10.1016/0033-5894(80)90061-7, 1980.
Emile-Geay, J., Seager, R., Cane, M. A., Cook, E. R., and Haug, G. H.: Volcanoes and ENSO over the past millennium, J. Climate, 21, 3134–3148, https://doi.org/10.1175/2007JCLI1884.1, 2008.
English, J. M., Toon, O. B., and Mills, M. J.: Microphysical simulations of large volcanic eruptions: Pinatubo and Toba, J. Geophys. Res.-Atmos., 118, 1880–1895, https://doi.org/10.1002/jgrd.50196, 2013.
Fierstein, J. and Nathenson, M.: Another look at the calculation of fallout tephra volumes, Bull. Volcanol., 54, 156–167, https://doi.org/10.1007/BF00278005, 1992.
Fisher, R. A., Wieder, W. R., Sanderson, B. M., Koven, C. D., Oleson, K. W., Xu, C., Fisher, J. B., Shi, M., Walker, A. P., and Lawrence, D. M.: Parametric Controls on Vegetation Responses to Biogeochemical Forcing in the CLM5, J. Adv. Model. Earth Syst., 11, 2879–2895, https://doi.org/10.1029/2019MS001609, 2019.
Gettelman, A., Mills, M. J., Kinnison, D. E., Garcia, R. R., Smith, A. K., Marsh, D. R., Tilmes, S., Vitt, F., Bardeen, C. G., McInerney, J., Liu, H.-L., Solomon, S. C., Polvani, L. M., Emmons, L. K., Lamarque, J.-F., Richter, J. H., Glanville, A. S., Bacmeister, J. T., Phillips, A. S., Neale, R. B., Simpson, I. R., DuVivier, A. K., Hodzic, A., and Randel, W. J.: The Whole Atmosphere Community Climate Model Version 6 (WACCM6), J. Geophys. Res.-Atmos., 124, 12380–12403, https://doi.org/10.1029/2019jd030943, 2019.
Handler, P.: Possible association of stratospheric aerosols and El Nino type events, Geophys. Res. Lett., 11, 1121–1124, https://doi.org/10.1029/GL011i011p01121, 1984.
Hansen, J. E., Lacis, A. A., Lee, P., and Wang, W. C.: Climatic Effects of Atmospheric Aerosols, Ann. NY Acad. Sci., 338, 575–587, https://doi.org/10.1111/j.1749-6632.1980.tb17151.x, 1980.
Haslam, M. and Petraglia, M.: Comment on “Environmental impact of the 73 ka Toba super-eruption in South Asia” by M. A. J. Williams et al., Palaeogeogr. Palaeocl., 296, 199–203, https://doi.org/10.1016/j.palaeo.2010.03.057, 2010.
Iles, C. E., Hegerl, G. C., Schurer, A. P., and Zhang, X.: The effect of volcanic eruptions on global precipitation, J. Geophys. Res.-Atmos., 118, 8770–8786, https://doi.org/10.1002/jgrd.50678, 2013.
Jones, G. S., Gregory, J. M., Stott, P. A., Tett, S. F. B., and Thorpe, R. B.: An AOGCM simulation of the climate response to a volcanic super-eruption, Clim. Dynam., 25, 725–738, https://doi.org/10.1007/s00382-005-0066-8, 2005.
Khodri, M., Izumo, T., Vialard, J., Janicot, S., Cassou, C., Lengaigne, M., Mignot, J., Gastineau, G., Guilyardi, E., Lebas, N., Robock, A., and McPhaden, M. J.: Tropical explosive volcanic eruptions can trigger El Niño by cooling tropical Africa, Nat. Commun., 8, 778, https://doi.org/10.1038/s41467-017-00755-6, 2017.
Klobas, J. E., Wilmouth, D. M., Weisenstein, D. K., Anderson, J. G., and Salawitch, R. J.: Ozone depletion following future volcanic eruptions, Geophys. Res. Lett., 44, 7490–7499, https://doi.org/10.1002/2017GL073972, 2017.
Krüger, K., Kutterolf, S., and Hansteen, T. H.: Halogen release from Plinian eruptions and depletion of stratospheric ozone, in: Volcanism and Global Environmental Change, edited by: Schmidt, A., Fristad, K. E., and Elkins-Tanton, L. T., 244–259, Cambridge University Press, Cambridge, 2015.
Kutterolf, S., Freundt, A., Pérez, W., Wehrmann, H., and Schmincke, H.-U.: Late Pleistocene to Holocene temporal succession and magnitudes of highly-explosive volcanic eruptions in west-central Nicaragua, J. Volcanol. Geoth. Res., 163, 55–82, https://doi.org/10.1016/J.JVOLGEORES.2007.02.006, 2007.
Kutterolf, S., Freundt, A., Peréz, W., Mörz, T., Schacht, U., Wehrmann, H., and Schmincke, H.-U.: Pacific offshore record of plinian arc volcanism in Central America: 1. Along-arc correlations, Geochem. Geophy. Geosy., 9, Q02S01, https://doi.org/10.1029/2007GC001631, 2008a.
Kutterolf, S., Freundt, A., and Peréz, W.: Pacific offshore record of plinian arc volcanism in Central America: 2. Tephra volumes and erupted masses, Geochem. Geophy. Geosy., 9, Q02S02, https://doi.org/10.1029/2007GC001791, 2008b.
Kutterolf, S., Hansteen, T. H., Appel, K., Freundt, A., Kruger, K., Perez, W., and Wehrmann, H.: Combined bromine and chlorine release from large explosive volcanic eruptions: A threat to stratospheric ozone?, Geology, 41, 707–710, https://doi.org/10.1130/G34044.1, 2013.
Kutterolf, S., Hansteen, T. H., Freundt, A., Wehrmann, H., Appel, K., Krüger, K., and Pérez, W.: Bromine and chlorine emissions from Plinian eruptions along the Central American Volcanic Arc: From source to atmosphere, Earth Planet. Sc. Lett., 429, 234–246, https://doi.org/10.1016/j.epsl.2015.07.064, 2015.
Kutterolf, S., Schindlbeck, J. C., Anselmetti, F. S., Ariztegui, D., Brenner, M., Curtis, J., Schmid, D., Hodell, D. A., Mueller, A., Pérez, L., Pérez, W., Schwalb, A., Frische, M., and Wang, K.-L.: A 400-ka tephrochronological framework for Central America from Lake Petén Itzá (Guatemala) sediments, Quaternary Sci. Rev., 150, 200–220, https://doi.org/10.1016/J.QUASCIREV.2016.08.023, 2016.
Li, J., Xie, S. P., Cook, E. R., Morales, M. S., Christie, D. A., Johnson, N. C., Chen, F., D'Arrigo, R., Fowler, A. M., Gou, X., and Fang, K.: El Niño modulations over the past seven centuries, Nat. Clim. Chang., 3, 822–826, https://doi.org/10.1038/nclimate1936, 2013.
Liu, X., Ma, P.-L., Wang, H., Tilmes, S., Singh, B., Easter, R. C., Ghan, S. J., and Rasch, P. J.: Description and evaluation of a new four-mode version of the Modal Aerosol Module (MAM4) within version 5.3 of the Community Atmosphere Model, Geosci. Model Dev., 9, 505–522, https://doi.org/10.5194/gmd-9-505-2016, 2016.
Madronich, S. and Flocke, S.: Theoretical Estimation of Biologically Effective UV Radiation at the Earth's Surface, in: Solar Ultraviolet Radiation, edited by: Zerefos, C. S. and Bais, A. F., 23–48, Springer Berlin Heidelberg, Berlin, Heidelberg, 1997.
Marshall, L., Schmidt, A., Toohey, M., Carslaw, K. S., Mann, G. W., Sigl, M., Khodri, M., Timmreck, C., Zanchettin, D., Ball, W. T., Bekki, S., Brooke, J. S. A., Dhomse, S., Johnson, C., Lamarque, J.-F., LeGrande, A. N., Mills, M. J., Niemeier, U., Pope, J. O., Poulain, V., Robock, A., Rozanov, E., Stenke, A., Sukhodolov, T., Tilmes, S., Tsigaridis, K., and Tummon, F.: Multi-model comparison of the volcanic sulfate deposition from the 1815 eruption of Mt. Tambora, Atmos. Chem. Phys., 18, 2307–2328, https://doi.org/10.5194/acp-18-2307-2018, 2018.
Metzner, D., Kutterolf, S., Toohey, M., Timmreck, C., Niemeier, U., Freundt, A., and Krüger, K.: Radiative forcing and climate impact resulting from SO2 injections based on a 200,000-year record of Plinian eruptions along the Central American Volcanic Arc, Int. J. Earth Sci., 103, 2063–2079, https://doi.org/10.1007/s00531-012-0814-z, 2014.
Miller, G. H., Geirsdóttir, Á., Zhong, Y., Larsen, D. J., Otto-Bliesner, B. L., Holland, M. M., Bailey, D. A., Refsnider, K. A., Lehman, S. J., Southon, J. R., Anderson, C., Björnsson, H., and Thordarson, T.: Abrupt onset of the Little Ice Age triggered by volcanism and sustained by sea-ice/ocean feedbacks, Geophys. Res. Lett., 39, https://doi.org/10.1029/2011GL050168, 2012.
Mills, M. J., Schmidt, A., Easter, R., Solomon, S., Kinnison, D. E., Ghan, S. J., Neely, R. R., Marsh, D. R., Conley, A., Bardeen, C. G., and Gettelman, A.: Global volcanic aerosol properties derived from emissions, 1990–2014, using CESM1(WACCM), J. Geophys. Res.-Atmos., 121, 2332–2348, https://doi.org/10.1002/2015JD024290, 2016.
Mills, M. J., Richter, J. H., Tilmes, S., Kravitz, B., MacMartin, D. G., Glanville, A. A., Tribbia, J. J., Lamarque, J.-F., Vitt, F., Schmidt, A., Gettelman, A., Hannay, C., Bacmeister, J. T., and Kinnison, D. E.: Radiative and Chemical Response to Interactive Stratospheric Sulfate Aerosols in Fully Coupled CESM1(WACCM), J. Geophys. Res.-Atmos., 122, 13061–13078, https://doi.org/10.1002/2017JD027006, 2017.
Muthers, S., Arfeuille, F., Raible, C. C., and Rozanov, E.: The impacts of volcanic aerosol on stratospheric ozone and the Northern Hemisphere polar vortex: separating radiative-dynamical changes from direct effects due to enhanced aerosol heterogeneous chemistry, Atmos. Chem. Phys., 15, 11461–11476, https://doi.org/10.5194/acp-15-11461-2015, 2015.
Myhre, G., Shindell, D., Bréon, F.-M., Collins, W. D., Fuglestvedt, J., Huang, J., Koch, D., Lamarque, J.-F., Lee, D., Mendoza, B., Nakajima, T., Robock, A., Stephens, G., Takemura, T., and Zhan, H.: Anthropogenic and natural radiative forcing, in: Climate Change 2013 the Physical Science Basis: Working Group I Contribution to the Fifth Assessment Report of the Intergovernmental Panel on Climate Change, Vol. 9781107057, 659–740, Cambridge University Press, Cambridge, 2013.
Niemeier, U., Timmreck, C., and Krüger, K.: Revisiting the Agung 1963 volcanic forcing – impact of one or two eruptions, Atmos. Chem. Phys., 19, 10379–10390, https://doi.org/10.5194/acp-19-10379-2019, 2019.
Ohba, M., Shiogama, H., Yokohata, T., and Watanabe, M.: Impact of Strong Tropical Volcanic Eruptions on ENSO Simulated in a Coupled GCM, J. Climate, 26, 5169–5182, https://doi.org/10.1175/JCLI-D-12-00471.1, 2013.
Pinto, J. P., Turco, R. P., and Toon, O. B.: Self-limiting physical and chemical effects in volcanic eruption clouds, J. Geophys. Res., 94, 11165, https://doi.org/10.1029/JD094iD08p11165, 1989.
Plumb, R. A.: Stratospheric Transport, J. Meteorol. Soc. Jpn. Ser. II, 80, 793–809, https://doi.org/10.2151/jmsj.80.793, 2002.
Predybaylo, E., Stenchikov, G. L., Wittenberg, A. T., and Zeng, F.: Impacts of a pinatubo-size volcanic eruption on ENSO, J. Geophys. Res., 122, 925–947, https://doi.org/10.1002/2016JD025796, 2017.
Pyle, D. M.: The thickness, volume and grainsize of tephra fall deposits, B. Volcanol., 51, 1–15, https://doi.org/10.1007/BF01086757, 1989.
Pyle, D. M.: Sizes of Volcanic Eruptions, in: The Encyclopedia of Volcanoes, edited by: Sigurdsson, H., 263–269, Academic Press, 2013.
Rampino, M. R. and Self, S.: Volcanic winter and accelerated glaciation following the Toba super-eruption, Nature, 359, 50–52, https://doi.org/10.1038/359050a0, 1992.
Rampino, M. R. and Self, S.: Climate-volcanism feedback and the toba eruption of ∼ 74,000 years ago, Quaternary Res., 40, 269–280, https://doi.org/10.1006/qres.1993.1081, 1993.
Robock, A.: Volcanic eruptions and climate, Rev. Geophys., 38, 191–219, https://doi.org/10.1029/1998RG000054, 2000.
Robock, A. and Liu, Y.: The Volcanic Signal in Goddard Institute for Space Studies Three-Dimensional Model Simulations, J. Climate, 7, 44–55, https://doi.org/10.1175/1520-0442(1994)007<0044:TVSIGI>2.0.CO;2, 1994.
Robock, A., Ammann, C. M., Oman, L., Shindell, D., Levis, S., and Stenchikov, G.: Did the Toba volcanic eruption of ∼74 ka B.P. produce widespread glaciation?, J. Geophys. Res.-Atmos., 114, D10107, https://doi.org/10.1029/2008JD011652, 2009.
Rose, W. I., Conway, F. M., Pullinger, C. R., Deino, A., and McIntosh, W. C.: An improved age framework for late Quaternary silicic eruptions in northern Central America, B. Volcanol., 61, 106–120, https://doi.org/10.1007/s004450050266, 1999.
Russell, P. B., Livingston, J. M., Pueschel, R. F., Bauman, J. J., Pollack, J. B., Brooks, S. L., Hamill, P., Thomason, L. W., Stowe, L. L., Deshler, T., Dutton, E. G., and Bergstrom, R. W.: Global to microscale evolution of the Pinatubo volcanic aerosol derived from diverse measurements and analyses, J. Geophys. Res.-Atmos., 101, 18745–18763, https://doi.org/10.1029/96JD01162, 1996.
Schönhardt, A., Richter, A., Theys, N., and Burrows, J. P.: Space-based observation of volcanic iodine monoxide, Atmos. Chem. Phys., 17, 4857–4870, https://doi.org/10.5194/acp-17-4857-2017, 2017.
Self, S. and King, A. J.: Petrology and sulfur and chlorine emissions of the 1963 eruption of Gunung Agung, Bali, Indonesia, B. Volcanol., 58, 263–285, https://doi.org/10.1007/s004450050139, 1996.
Solomon, S.: Stratospheric ozone depletion: A review of concepts and history, Rev. Geophys., 37, 275, https://doi.org/10.1029/1999RG900008, 1999.
Solomon, S., Garcia, R. R., and Ravishankara, A. R.: On the role of iodine in ozone depletion, J. Geophys. Res., 99, 20491, https://doi.org/10.1029/94JD02028, 1994.
Stenchikov, G., Delworth, T. L., Ramaswamy, V., Stouffer, R. J., Wittenberg, A., and Zeng, F.: Volcanic signals in oceans, J. Geophys. Res., 114, D16104, https://doi.org/10.1029/2008JD011673, 2009.
Stevenson, S., Otto-Bliesner, B., Fasullo, J., and Brady, E.: “El Niño Like” hydroclimate responses to last millennium volcanic eruptions, J. Climate, 29, 2907–2921, https://doi.org/10.1175/JCLI-D-15-0239.1, 2016.
Stevenson, S., Fasullo, J. T., Otto-Bliesner, B. L., Tomas, R. A., and Gao, C.: Role of eruption season in reconciling model and proxy responses to tropical volcanism, P. Natl. Acad. Sci. USA, 114, 1822–1826, https://doi.org/10.1073/pnas.1612505114, 2017.
Svensson, A., Bigler, M., Blunier, T., Clausen, H. B., Dahl-Jensen, D., Fischer, H., Fujita, S., Goto-Azuma, K., Johnsen, S. J., Kawamura, K., Kipfstuhl, S., Kohno, M., Parrenin, F., Popp, T., Rasmussen, S. O., Schwander, J., Seierstad, I., Severi, M., Steffensen, J. P., Udisti, R., Uemura, R., Vallelonga, P., Vinther, B. M., Wegner, A., Wilhelms, F., and Winstrup, M.: Direct linking of Greenland and Antarctic ice cores at the Toba eruption (74 ka BP), Clim. Past, 9, 749–766, https://doi.org/10.5194/cp-9-749-2013, 2013.
Tie, X. X. and Brasseur, G.: The response of stratospheric ozone to volcanic eruptions: Sensitivity to atmospheric chlorine loading, Geophys. Res. Lett., 22, 3035–3038, https://doi.org/10.1029/95GL03057, 1995.
Timmreck, C., Graf, H.-F. F., and Steil, B.: Aerosol Chemistry Interactions After the Mt. Pinatubo Eruption, in: Volcanism and the Earth's Atmosphere, Vol. 139, 213–225, American Geophysical Union (AGU), Washington DC, 2003.
Timmreck, C., Graf, H.-F., Lorenz, S. J., Niemeier, U., Zanchettin, D., Matei, D., Jungclaus, J. H., and Crowley, T. J.: Aerosol size confines climate response to volcanic super-eruptions, Geophys. Res. Lett., 37, L24705, https://doi.org/10.1029/2010GL045464, 2010.
Timmreck, C., Graf, H. F., Zanchettin, D., Hagemann, S., Kleinen, T., and Krüger, K.: Climate response to the Toba super-eruption: Regional changes, Quaternary Int., 258, 30–44, https://doi.org/10.1016/j.quaint.2011.10.008, 2012.
Timmreck, C., Mann, G. W., Aquila, V., Hommel, R., Lee, L. A., Schmidt, A., Brühl, C., Carn, S., Chin, M., Dhomse, S. S., Diehl, T., English, J. M., Mills, M. J., Neely, R., Sheng, J., Toohey, M., and Weisenstein, D.: The Interactive Stratospheric Aerosol Model Intercomparison Project (ISA-MIP): motivation and experimental design, Geosci. Model Dev., 11, 2581–2608, https://doi.org/10.5194/gmd-11-2581-2018, 2018.
Toohey, M., Krüger, K., Niemeier, U., and Timmreck, C.: The influence of eruption season on the global aerosol evolution and radiative impact of tropical volcanic eruptions, Atmos. Chem. Phys., 11, 12351–12367, https://doi.org/10.5194/acp-11-12351-2011, 2011.
Toohey, M., Krüger, K., and Timmreck, C.: Volcanic sulfate deposition to Greenland and Antarctica: A modeling sensitivity study, J. Geophys. Res.-Atmos., 118, 4788–4800, https://doi.org/10.1002/jgrd.50428, 2013.
Vidal, C. M., Métrich, N., Komorowski, J.-C., Pratomo, I., Michel, A., Kartadinata, N., Robert, V., and Lavigne, F.: The 1257 Samalas eruption (Lombok, Indonesia): the single greatest stratospheric gas release of the Common Era, Sci. Rep.-UK, 6, 34868, https://doi.org/10.1038/srep34868, 2016.
von Glasow, R., Bobrowski, N., and Kern, C.: The effects of volcanic eruptions on atmospheric chemistry, Chem. Geol., 263, 131–142, https://doi.org/10.1016/j.chemgeo.2008.08.020, 2009.
Williams, M. A. J., Ambrose, S. H., van der Kaars, S., Ruehlemann, C., Chattopadhyaya, U., Pal, J., and Chauhan, P. R.: Environmental impact of the 73 ka Toba super-eruption in South Asia, Palaeogeogr. Palaeocl., 284, 295–314, https://doi.org/10.1016/j.palaeo.2009.10.009, 2009.
WMO: Scientific Assessment of Ozone Depletion: 2014, Geneva, Switzerland, 2014.
WMO: Scientific Assessment of Ozone Depletion: 2018, Geneva, Switzerland, 2018.
Zanchettin, D., Timmreck, C., Graf, H. F., Rubino, A., Lorenz, S., Lohmann, K., Krüger, K., and Jungclaus, J. H.: Bi-decadal variability excited in the coupled ocean-atmosphere system by strong tropical volcanic eruptions, Clim. Dynam., 39, 419–444, https://doi.org/10.1007/s00382-011-1167-1, 2012.
Zanchettin, D., Bothe, O., Timmreck, C., Bader, J., Beitsch, A., Graf, H.-F., Notz, D., and Jungclaus, J. H.: Inter-hemispheric asymmetry in the sea-ice response to volcanic forcing simulated by MPI-ESM (COSMOS-Mill), Earth Syst. Dynam., 5, 223–242, https://doi.org/10.5194/esd-5-223-2014, 2014.
Zanchettin, D., Khodri, M., Timmreck, C., Toohey, M., Schmidt, A., Gerber, E. P., Hegerl, G., Robock, A., Pausata, F. S. R., Ball, W. T., Bauer, S. E., Bekki, S., Dhomse, S. S., LeGrande, A. N., Mann, G. W., Marshall, L., Mills, M., Marchand, M., Niemeier, U., Poulain, V., Rozanov, E., Rubino, A., Stenke, A., Tsigaridis, K., and Tummon, F.: The Model Intercomparison Project on the climatic response to Volcanic forcing (VolMIP): experimental design and forcing input data for CMIP6, Geosci. Model Dev., 9, 2701–2719, https://doi.org/10.5194/gmd-9-2701-2016, 2016.
Zhong, Y., Miller, G. H., Otto-Bliesner, B. L., Holland, M. M., Bailey, D. A., Schneider, D. P., and Geirsdottir, A.: Centennial-scale climate change from decadally-paced explosive volcanism: a coupled sea ice-ocean mechanism, Clim. Dynam., 37, 2373–2387, https://doi.org/10.1007/s00382-010-0967-z, 2011.
Zielinski, G. A., Mayewski, P. A., Meeker, L. D., Whitlow, S., Twickler, M. S., and Taylor, K.: Potential atmospheric impact of the Toba mega-eruption ∼ 71,000 years ago, Geophys. Res. Lett., 23, 837–840, https://doi.org/10.1029/96GL00706, 1996.