the Creative Commons Attribution 4.0 License.
the Creative Commons Attribution 4.0 License.
 | 20 Jan 2020
Experimental investigation into the volatilities of highly oxygenated organic molecules (HOMs)
Matthieu Riva
Liine Heikkinen
Lauriane Quéléver
Pontus Roldin
Secondary organic aerosol (SOA) forms a major part of the tropospheric submicron aerosol. Still, the exact formation mechanisms of SOA have remained elusive. Recently, a newly discovered group of oxidation products of volatile organic compounds (VOCs), highly oxygenated organic molecules (HOMs), have been proposed to be responsible for a large fraction of SOA formation. To assess the potential of HOMs to form SOA and to even take part in new particle formation, knowledge of their exact volatilities is essential. However, due to their exotic, and partially unknown, structures, estimating their volatility is challenging. In this study, we performed a set of continuous flow chamber experiments, supported by box modelling, to study the volatilities of HOMs, along with some less oxygenated compounds, formed in the ozonolysis of α-pinene, an abundant VOC emitted by boreal forests. Along with gaseous precursors, we periodically injected inorganic seed aerosol into the chamber to vary the condensation sink (CS) of low-volatility vapours. We monitored the decrease of oxidation products in the gas phase in response to increasing CS, and were able to relate the responses to the volatilities of the compounds. We found that HOM monomers are mainly of low volatility, with a small fraction being semi-volatile. HOM dimers were all at least low volatility, but probably extremely low volatility; however, our method is not directly able to distinguish between the two. We were able to model the volatility of the oxidation products in terms of their carbon, hydrogen, oxygen and nitrogen numbers. We found that increasing levels of oxygenation correspond to lower volatilities, as expected, but that the decrease is less steep than would be expected based on many existing models for volatility, such as SIMPOL. The hydrogen number of a compound also predicted its volatility, independently of the carbon number, with higher hydrogen numbers corresponding to lower volatilities. This can be explained in terms of the functional groups making up a molecule: high hydrogen numbers are associated with, e.g. hydroxy groups, which lower volatility more than, e.g. carbonyls, which are associated with a lower hydrogen number. The method presented should be applicable to systems other than α-pinene ozonolysis, and with different organic loadings, in order to study different volatility ranges.
- Article
(2911 KB) - Full-text XML
- BibTeX
- EndNote


Secondary organic aerosol (SOA) makes up a major fraction of the tropospheric submicron aerosol world-wide (Zhang et al., 2007; Jimenez et al., 2009). Despite its importance and much research effort, our fundamental understanding of the formation of SOA remains lacking (Hallquist et al., 2009; Shrivastava et al., 2017). Recently, a new group of oxidation products of volatile organic compounds (VOCs), highly oxygenated organic molecules (HOMs; Ehn et al., 2014, 2017; Bianchi et al., 2019), has been proposed to be the source of a major fraction of tropospheric submicron SOA (Ehn et al., 2014). Important sources of HOMs include many monoterpenes, the most abundant group of biogenic VOCs emitted by boreal forests.
Most VOCs form organic peroxy (RO2) radicals upon oxidation. HOMs form through the autoxidation of these organic peroxy radicals, a process only recently discovered to be important in atmospheric oxidation (Crounse et al., 2013; Ehn et al., 2014). An extensive description of HOM formation can be found in Bianchi et al. (2019). Briefly, in autoxidation, RO2 radicals undergo intramolecular hydrogen abstractions, followed by the addition of molecular oxygen on the resulting carbon-centred radical. This results in a new RO2 radical, with an additional hydroperoxy group. This process can repeat multiple times. The radical reaction chain can be terminated unimolecularly, through the loss of an OH radical from the RO2 radical, resulting in a closed shell oxidation product. It can also be terminated bimolecularly, for example through the reaction with another RO2 radical, or nitric oxide (NO). The termination mechanism is important in determining which types of HOMs form in the reaction. As an example, bimolecular termination with another RO2 radical can very efficiently lead to the formation of molecular dimers of extremely low volatility (Berndt et al., 2018a, b), and the termination with NO can lead to the formation of organic nitrates. Due to the fast autoxidation process, combined with different termination mechanisms, products can rapidly acquire high oxygen content, with those having at least six oxygen atoms counted as HOMs (Bianchi et al., 2019). The oxygen appears in the form of many functional groups, including carbonyl, hydroperoxy, hydroxy, peroxy acid and carboxylic acid groups (e.g. Mentel et al., 2015).
Due to the high level of functionalization, HOMs are thought to be of low volatility (Bianchi et al., 2019). This is supported by observations that HOMs are efficient in forming SOA, and even able to take part in the very first steps of new particle formation (NPF; Ehn et al., 2014; Kirkby et al., 2016). To determine exactly to what extent HOMs can impact NPF and SOA formation, the knowledge of their vapour pressures is essential (Bianchi et al., 2019). Still, determining the vapour pressures of HOMs remains challenging. Most of the species have not been isolated, hampering experimental characterization (Bianchi et al., 2019). Due to the high numbers of functional groups, estimating the vapour pressures with commonly used functional group contribution methods is not sufficient, and different computational approaches give estimates of the vapour pressures spanning many orders of magnitude (Kurtén et al., 2016). In order to investigate the volatility of HOMs formed in the ozonolysis of α-pinene, Ehn et al. (2014) used injections of inorganic seed aerosol to increase the condensation sink in a chamber experiment. They observed the behaviour of HOMs to be consistent with kinetically limited condensation and extremely low volatilities, but only looked at the sum of HOMs, not focusing on individual compounds. Thus, and also based on existing composition–volatility relationships, HOMs were initially classified as extremely low-volatility organic compounds (ELVOCs, according to the definitions by Donahue et al., 2012). Theoretical work by Kurtén et al. (2016) later suggested that most HOMs, especially monomers, might not be ELVOCs, but low-volatility organic compounds or even semi-volatile organic compounds (LVOCs and SVOCs respectively, again according to Donahue et al., 2012). Thus, detailed information on HOM volatility is still lacking, which presents a key obstacle for assessing their impact on particle formation (Bianchi et al., 2019).
Here, we investigate the volatility of HOMs, along with some less oxygenated compounds, experimentally, in a manner similar to Ehn et al. (2014), but on a molecular level. We produce HOMs in the ozonolysis of α-pinene in a continuous flow smog chamber, and measure them in the gas phase with the nitrate chemical ionization atmospheric pressure interface time-of-flight mass spectrometer (CI-APi-TOF; Jokinen et al., 2012). We inject inorganic seed aerosol into the chamber, and monitor how the gas-phase concentrations of the oxidation products change. We show that we can gain valuable and detailed information about the volatility of the oxidation products using this method. Further, we develop a parameterization describing the volatility of HOMs formed in the ozonolysis of α-pinene, especially the monomers, in terms of their composition, and compare the results to existing parameterizations and estimates on HOM volatility.
2.1 Chamber set-up
In order to investigate the volatility of HOMs formed in the gas phase in a controlled manner, we conducted a series of laboratory experiments in the newly constructed COALA chamber at the University of Helsinki, previously presented by Riva et al. (2019). The chamber is a 2 m3 bag, made of teflon (FEP) foil with dimensions of (L × W × H) and 0.125 mm thickness, supplied by Vector Foiltec (Bremen, Germany). The chamber is contained in a rigid enclosure with 400 nm LED lights to photolyse nitrogen dioxide (NO2) to NO, and is stirred with a teflon fan to ensure homogeneous mixing of the air inside. The chamber was operated in a continuous flow mode, with a residence time of 50 min, attained by setting the inflow to the chamber to 40 L min−1. In the continuous flow mode the total flow out of the chamber was the same as the inflow. The instrumentation (Sect. 2.2) sampled the majority of the flow out of the chamber. The chamber was maintained at a slight overpressure, resulting in the rest of the flow being flushed to an exhaust line.
We injected dry air purified with a clean air generator (AADCO model 737-14, Ohio, USA) into the chamber, along with gaseous reactants α-pinene, O3 and, in some of the experiments, NO2. Ozone was generated by injecting purified air through an ozone generator (Dasibi 1008-PC), while α-pinene and NO2 were from gas bottles. The injections were controlled with a range of mass flow controllers (MKS, G-Series, 0.05–50 L min−1, Andover, MA, USA). We controlled the relative humidity in the chamber to be either <1 % or 40 %: this was done by bubbling the dry clean air through a bubbler filled with purified (Milli-Q) water.
In addition to the gaseous reactants, we injected size selected, 80 nm inorganic seed particles, consisting of either ammonium sulfate (AS) or ammonium bisulfate (ABS), into the chamber. ABS was used in order to promote acidity-dependent particle-phase reactions: the effect of these on the particle phase has been presented by Riva et al. (2019). The particles were produced by atomizing a solution consisting of Milli-Q water and AS or Milli-Q water and ABS, after which the seed particles were dried for size selection. After size selection, the particles were either injected into the chamber dry, or subjected to a relative humidity of over 80 % to attain deliquescence before injection. In the <1 % RH experiments, we only used the dried particles, while in the 40 % RH experiments, both types were used.
2.2 Instrumentation
We monitored the chamber with a suite of online instruments measuring both gas and particle phases. For measuring the responses of HOMs and other oxidation products of α-pinene to the seed injections, we used the nitrate CI-APi-TOF (TOFWERK AG, Aerodyne; Jokinen et al., 2012), equipped with a long time-of-flight (LTOF) mass analyser for a resolving power of over 13 000 in the HOM mass range (300–650 Da). The instrument can detect highly oxygenated compounds as clusters with the nitrate ion (). It allows for the determination of the molecular formulae of the detected clusters due to its high mass resolution. Along with closed shell products, the CI-APi-TOF can detect certain highly oxidized RO2 radicals as well. As the method is based on the soft clustering of the analyte molecules with the nitrate anion, we assume that any multiple charging effects are negligible. Thus, the charge that the detected ions carry is always assumed to be -e, and the measured mass-to-charge ratios to directly correspond to masses. We express the masses in daltons (Da).
We used a proton transfer reaction time-of-Flight mass spectrometer (PTR-TOF 8000, Ionicon; Graus et al., 2010) to measure the concentration of the reactant α-pinene, and a UV photometric ozone monitor (Model 49p, Thermo Environmental Instruments) for the ozone concentration. For measuring the NOx concentration we used a chemiluminescence NO–NO2–NOx analyser (Model 42i, Thermo Fisher Scientific), and for the NO concentration the more sensitive Ecophysics CLD 780 TR.
For the particle-phase measurements, we used a differential mobility particle sizer (DMPS; Aalto et al., 2001) and a high-resolution aerosol mass spectrometer (HR-AMS; DeCarlo et al., 2006), also equipped with a LTOF analyser. We used the DMPS for the determination of the dry aerosol size distribution in the chamber between 10 and 400 nm, and the AMS for the chemical composition of the dried particles.
From the DMPS size distribution, we also calculated the dry condensation sink (CS), describing the ability of a particle size distribution to remove low-volatility vapours from the gas phase (Dal Maso et al., 2005). CS depends on the molecular diffusion coefficient and mean molecular speed of a compound: thus, the value of CS is compound dependent. Instead of the often-used values for sulfuric acid, we calculated the condensation sink specifically for HOM. The molecular diffusion coefficient was calculated using Fuller's method (Tang et al., 2015), and the mean molecular speed was calculated using kinetic theory. Both the molecular diffusion coefficient and speed depend on molecular composition and on the absolute temperature during the experiments. The values presented for the condensation sink are calculated for the compound C10H16O7, and are around 40 % lower than for sulfuric acid. In comparison, the CS calculated for the largest molecules (i.e. HOM dimers) were approximately 30 % lower than for C10H16O7. We did not correct for hygroscopic growth of the particles, so in humid cases the calculated condensation sink is an underestimate; however, this should not have any notable effect on the conclusions.
2.3 Overview of experiments
In a typical experiment, we first continuously injected only gaseous precursors α-pinene, O3, and in some of the experiments, NO2, into the dry or humidified chamber. In the experiments with NO2, we also used 400 nm LED lights to photolyse NO2 to NO. We used two intensities for the LED lights: these corresponded to steady state NO concentrations of around 100 and 200 ppt with around 30 ppb of NO2. During the injection of gaseous precursors, we observed particle formation. The injection was continued until a steady state had been reached with respect to both the gas phase and the particle phase. After sampling the steady state chamber for a number of hours, we started injecting either AS or ABS particles, either dried or deliquesced. The injection was continued until a new steady state had been reached, and been sampled for a number of hours. The duration of a typical experiment was 8 h without the inorganic seed, and 8 h of seed injection. The temperature during the experiments was around 302 K. An overview of experimental condition is presented in Table A1.
2.4 Continuous flow chamber dynamics
The time evolution of the gas-phase concentration of a compound in the chamber is determined by its sinks (S) and sources (Q). The sources of a compound to the gas phase consist of its injection into the chamber, its chemical production in the gas phase in the chamber and its evaporation from chamber walls and aerosol particles. Its sinks, on the other hand, consist of its flush-out from the chamber, its loss to chemical reactions and its condensation onto walls and aerosol particles. In an actively mixed chamber, such as the one used, the concentration of compounds is homogeneous across the chamber. Thus, the effect of sources and sinks on the concentration of a compound X in the chamber can be expressed as follows:
In a continuous flow chamber, given that the inflow of reactants is kept constant, a steady state is eventually reached. In a steady state, the sources and sinks of a compound are equal, and thus its time derivative in Eq. (1) goes to 0 and its concentration stays constant. The time required for the formation of a steady state varies between components in the chamber. In the following section we present some limiting cases of gas-phase compounds and the steady states formed between their sources and sinks.
2.4.1 Effect of volatility on the behaviour of compounds in the gas phase
The volatility of a gas-phase compound affects the type of steady state it forms in the chamber. Next we will qualitatively outline which terms in Eq. (1) are important for different types of compounds, and how those affect the types of steady states, as well as the sensitivities of those steady states to seed injections to the chamber.
For volatile reactants like α-pinene (AP in equations), the loss by condensation to either chamber walls or aerosol particles is negligible. In other words, condensation will be followed by prompt evaporation back to the gas phase. In this case, the condensation and evaporation terms in Eq. (1) can be omitted. Furthermore, α-pinene is not chemically produced in the gas phase, but injected into the chamber. Thus, the injection is the only source term remaining, while the loss terms are the chemical loss and flush-out of the chamber. In a steady state, we can write Eq. (1) for α-pinene as follows:
The injection rate of α-pinene is kept constant, independently of the concentration in the chamber. In contrast, the rate at which α-pinene is flushed out of the chamber is directly proportional to its concentration in the air leaving the chamber, which is the same as the concentration in the chamber. The chemical sink is caused by the oxidation of α-pinene, and is dependent on the concentrations of both α-pinene and its oxidants. In this study, we injected ozone into the chamber to oxidize α-pinene. In the ozonolysis reactions of alkenes, hydroxyl (OH) radicals are also produced: for α-pinene, the yield is close to 1 (Atkinson et al., 1992; Paulson and Orlando, 1996). OH goes on to react with α-pinene. Further, in the experiments with NO2 injected, some nitrate (NO3) radicals are produced, which also react with α-pinene. We can thus expand Eq. (2):
where SS refers to steady state conditions, and kflush-out is the reciprocal of the chamber turnover time, 50 min. QAP represents the injection rate of α-pinene into the chamber, which is kept constant throughout the experiment. Thus, the steady state α-pinene concentration is determined by its input to the chamber, the steady state concentrations of the oxidants and the turnover time.
Similarly to α-pinene, oxidation products of relatively high volatility, such as intermediate-volatility organic compounds (IVOCs; Donahue et al., 2012), do not readily condense on aerosol particles with the loadings used in our experiment (Table A1). However, it is possible that some of the compounds partition onto the chamber walls. This is due to the observation that, with respect to the partitioning of organic vapours, Teflon walls of smog chambers behave in a manner similar to a very high organic aerosol loading (e.g. Matsunaga and Ziemann, 2010; Krechmer et al., 2016). The extent of the partitioning of the compounds to the walls varies depending on, e.g. their volatility. Thus, the evaporation and condensation terms related to aerosol particles in Eq. (1) can be assumed negligible, but the corresponding terms for wall interactions not.
The oxidation products of α-pinene generally lose their carbon–carbon double bond upon the initial oxidation reaction. This means that they are unreactive towards ozone, but can still be oxidized by the OH and NO3 radicals formed in the chamber. Thus, the sinks of gas-phase IVOCs in the chamber include their potentially reversible loss to chamber walls, flush-out of the chamber and chemical sink to reactions with radicals. As the oxidation products are not directly injected into the chamber, but produced in the oxidation of α-pinene, the sources include their chemical production and evaporation from walls. Therefore, we can express their steady state concentration as follows:
where the kIVOC, walls is the wall loss rate coefficient for IVOCs, and evaporation from walls is expressed in terms of the wall source. Here the sink of the IVOC is thus independent of the condensational aerosol surface area in the chamber. This means that the volatility of the compound is high enough that there is no net condensation in the timescale of the chamber turnover. It is important to note that the wall source for IVOCs is not necessarily constant, but may depend on temperature, humidity and chamber history through the accumulation of IVOCs on the chamber walls.
Like IVOCs, oxidation products of low volatility, such as ELVOCs, are not directly injected into the chamber, but produced from α-pinene oxidation in the gas phase. Because of their extremely low volatility, their evaporation into the gas phase from either aerosol particles or chamber walls is negligible. Instead, they are lost by irreversible condensation to the particles and walls. In addition, they are flushed out of the chamber, and lost by oxidation reactions with radicals. In a steady state, the sources and sinks are equal and we can write
where CSELVOC is the condensation sink for ELVOCs, caused by aerosol particles, and kELVOC, walls is the wall loss rate. The sinks together determine the average lifetime of an ELVOC molecule in the gas phase, and Eq. (5) can also be written in terms of the lifetime, τELVOC:
We do not know the exact reaction rate coefficients between ELVOC species and OH, or the OH concentration in the chamber. To get an upper limit for the chemical loss, we can assume a collision limited reaction similarly to Bianchi et al. (2019), and production of OH from every ozone-α-pinene reaction, with α-pinene acting as the main OH sink. With these assumptions, we estimate the lifetime of ELVOCs towards OH radical reactions to be on the order of 2000 s. Using similar reasoning, the contribution of reactions with the nitrate radical should be at maximum comparable to the OH reactions, but probably much smaller. A typical condensation sink caused by particles formed in the chamber in the absence of inorganic seed was s−1 (Table A1), corresponding to a lifetime of 500 s with respect to the loss to particle surfaces. When adding seed particles, the typical condensation sink was s−1. This corresponds to a lifetime of only 100 s with respect to the condensation to particle surfaces. Thus, the losses to condensation on aerosol particles are, to a first approximation, an order of magnitude faster than either the chemical sink or flush-out. We do not have a direct measurement of the wall loss lifetime in the chamber. However, we can estimate it from the behaviour of ELVOCs upon seed addition. Without any wall loss, the sink term of ELVOCs would increase roughly fivefold, reflecting directly on the gas-phase concentrations. However, the observed decrease in concentrations is smaller. A wall loss lifetime of 400 s explains the observed decrease in ELVOCs well: this number is consistent across experiments. This was also a free parameter in the ADCHAM model, which yielded identical results. This means that without seed addition, the majority of ELVOCs are lost to condensation onto chamber walls (Fig. 1). By introducing inorganic seed aerosol, we can change the dominating loss term of ELVOCs from their condensation to the chamber walls to their condensation to aerosol surfaces, and at the same time decrease their lifetime in the gas phase by around 60 % (Fig. 1). Assuming that the source term remains unchanged, the decreased steady state lifetimes are directly reflected in the gas-phase concentrations of the ELVOCs (Eq. 6). This drop of around 60 % corresponds to a case when there is only negligible evaporation of the oxidation products back from the particle phase on the timescale of the chamber lifetime. In addition to ELVOCs, this may include LVOCs from the lower end of their volatility spectrum. Thus, their net loss by condensation is limited by their molecular diffusion to the particle and wall surfaces, not equilibrium partitioning. If the source term of a given compound is unchanged, this represents an upper limit for how much the seed addition can drop the gas-phase signal. The exact magnitude of this drop varies from experiment to experiment, since there is some variability in the condensation sink both with and without seed aerosol (Table A1).
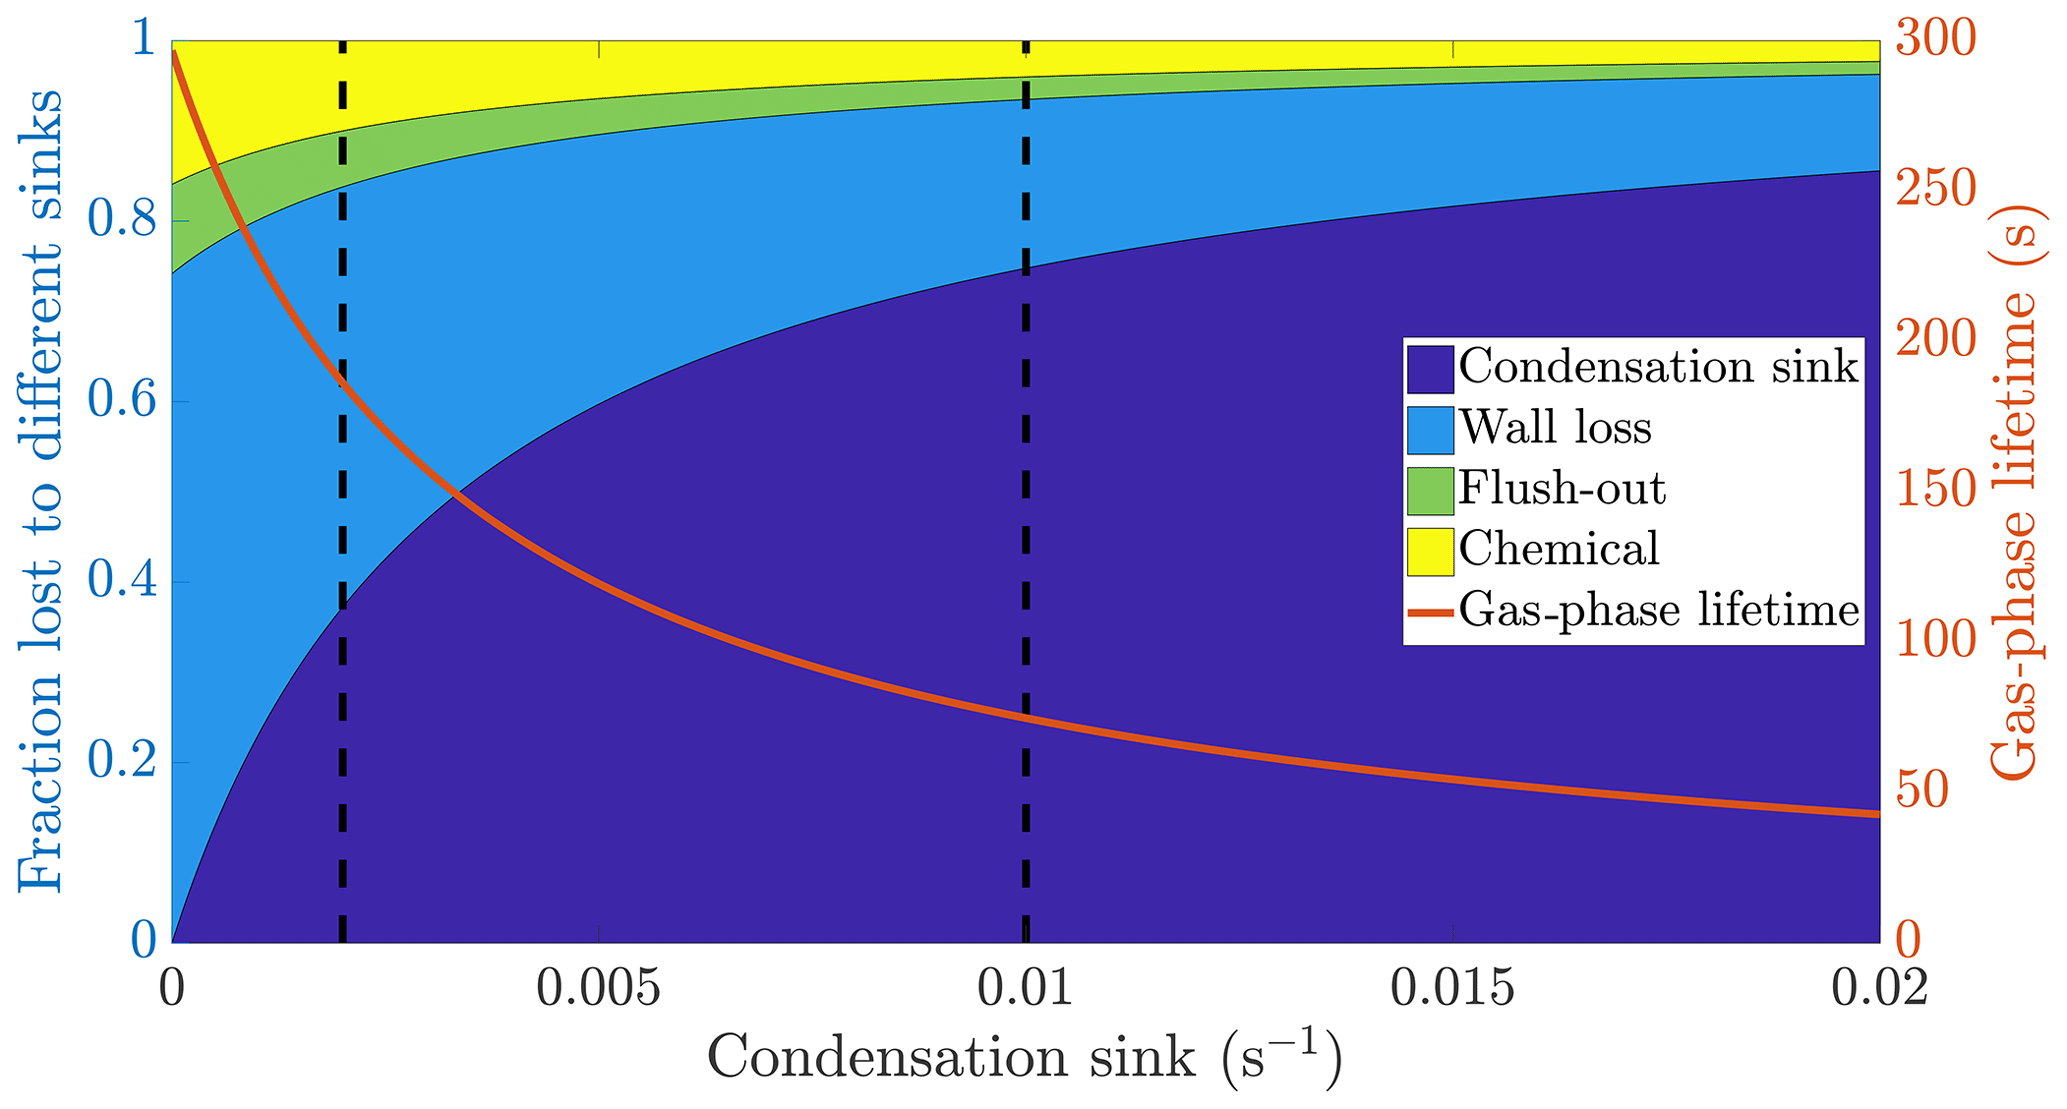
Figure 1The calculated fraction of ELVOC lost to different sinks, and their total lifetime in the gas phase as a function of the condensation sink caused by aerosol particles in the chamber. The wall loss lifetime of ELVOC is estimated to be 400 s. The chemical loss is an upper limit estimate, based on an OH concentration of around 0.1 ppt and collision limited reaction with ELVOC. The vertical broken lines at 0.002 and 0.01 s−1 represent a typical situation without seed particles and with seed particles respectively (Table A1).
Based on the example cases of IVOCs and ELVOCs, we can outline how seed injections affect oxidation products of different volatilities. In the case of IVOCs, the volatility of the product is high enough that there is negligible net condensation. Thus, the sink of the compound is unchanged upon seed addition. Assuming that the source of the compound stays constant, the seed injection has no effect on the gas-phase concentration of the compound. For ELVOCs, the gas-to-particle conversion is irreversible. Upon a typical seed injection experiment, the condensation sink increases from around to around s−1, and condensation onto aerosol particles becomes the main sink of ELVOCs. This leads to the decrease of the gas-phase lifetime of ELVOCs by around 60 % (Fig. 1). If the ELVOC source remains constant, this decrease of the lifetime results in a 60 % drop in the gas-phase concentration of ELVOCs. For compounds with volatilities between these extremes, such as SVOCs, the gas-phase concentration can be affected, but not as much as for ELVOCs. In order to assess the exact effect of the volatility of an oxidation product on its behaviour upon seed injection, we performed model simulations with the ADCHAM model, explained in more detail in Sect. 2.5.
Above, we have assumed that the source term of oxidation products stays constant upon seed injection. In the following section, we will present two important cases when this assumption does not hold, and discuss their effect on the method and the results. The first case is related to the loss of RO2 radicals, important intermediates in the α-pinene oxidation, to seed surfaces. The second case is related to the production of compounds on the chamber walls or in aerosol particles, and their subsequent evaporation to the gas phase.
2.4.2 Dynamics of organic peroxy radicals in the chamber
An important class of intermediates in the formation of HOM from the ozonolysis of α-pinene are organic peroxy radicals (RO2). These compounds are reactive, both towards other RO2 and radicals such as NO and HO2, as well as through unimolecular decomposition (e.g. Ehn et al., 2014; Jokinen et al., 2014). Upon contact with seed particles or chamber walls, similarly to ELVOCs, the highly oxidized RO2 can be expected to be lost from the gas phase. However, this only becomes an important sink for them if their chemical lifetime is long enough to allow for non-negligible condensation. If this is the case, seed addition may influence their concentration. This is an important consideration for our study. With the injections of inorganic seed aerosol, we wish to alter the sink of non-volatile oxidation products, without affecting their source. Under the conditions in our chamber, and using the reaction rate coefficients used by Ehn et al. (2014) to describe HOM formation, a lifetime of the RO2 radicals of around 10 s can be expected. With such a chemical lifetime, the condensation of RO2 on aerosol particle surfaces becomes a non-negligible, but minor, sink. During a typical seed injection, the gas-phase lifetime of RO2, and thus their concentration, are expected to drop by less than 10 % (Fig. A1). This would in turn decrease the source term for all closed shell oxidation products formed in the reactions of the RO2 radical. However, compared to the 60 % reduction in the gas-phase lifetime of the oxidation products upon seed addition (Fig. 1), the reduction in the source rate would be a minor effect. Still, it is important to keep in mind that any changes observed in the concentrations of gas-phase oxidation products during seed injections can be caused by changes to their sources, their sink or a combination of both.
2.4.3 A note on multi-generation oxidation
We have so far considered oxidation products originating directly from VOC oxidation, through short-lived RO2 intermediates. In the case of HOMs from α-pinene, this is a good approximation (Bianchi et al., 2019). In contrast, in some systems, oxidation products may undergo repeated oxidation by, e.g. hydroxyl radicals, leading to production of more oxidized products. This is observed in the case of aromatics (Garmash et al., 2019). In this case, both the HOMs formed in the repeated oxidation, and the precursor, itself an oxidation product, may condense on seed particles. Garmash et al. (2019) observed some compounds dropping more than expected upon seed addition, and explained this in terms of multi-generation oxidation. This is a clear example where the decrease of a gas-phase compound upon seed addition does not only depend on its volatility, but on the volatility of its precursors as well. However, in the case of α-pinene the vast majority of HOMs form directly from the oxidation of α-pinene, and thus this effect should be minor (Bianchi et al., 2019).
2.4.4 Effect of heterogeneous chemistry on the gas phase
So far we have only explicitly considered the formation of compounds in the gas-phase oxidation. However, particle-phase processes can potentially affect the gas-phase concentrations of compounds as well. A compound X, after condensation, can be chemically transformed in the particle phase. If the resulting product, Y, is sufficiently volatile, it can evaporate back to the gas phase:
This process can affect the gas-phase concentrations in two ways. First, the concentration of compound Y can increase during a seed injection due to the process. Secondly, in addition to the effect of volatility, there is a chemical sink for compound X in the particle phase. This results in less evaporation back to the gas phase than would be expected based on volatility alone, and a larger decrease in gas-phase concentration. This would in turn be interpreted as a lower-than-actual volatility. We cannot readily distinguish between chemical reaction driven uptake and physical condensation due to low saturation vapour pressures. However, in the experiments with crystalline ammonium sulfate particles, we assume particle-phase reactions to be very slow. In contrast, the use of ammonium bisulfate and deliquesced seed particles were in part motivated by particle-phase reaction enhancement (e.g. Riva et al., 2019). Thus, by comparing the different experiment types, we can gain insight into the different uptake mechanisms. Still, we cannot fully exclude the effect of particle-phase processes on the response of HOMs to seed addition.
2.5 Modelling the behaviour of HOMs in the chamber upon seed injection
In order to quantitatively relate the volatilities of the formed oxidation products to the behaviour of their gas-phase concentrations under the seed injection, we performed a series of simulations using the ADCHAM model (Roldin et al., 2014). The gas-phase chemistry in ADCHAM was simulated using the Master Chemical Mechanism v3.3.1 α-pinene chemistry (Jenkin et al., 1997; Saunders et al., 2003) and the recently developed peroxy radical autoxidation mechanism (PRAM; Roldin et al., 2019). In short, we used the measured temperature, relative humidity, concentration of ozone and α-pinene and chamber flow rates as input to the model. The inorganic seed aerosol was represented by a particle number size distribution similar to the one used in the experiments. Further, the modelled AS or ABS particle mass concentration was kept identical to the one measured with the AMS. This was achieved by, for every model time step, adding new seed particles to the chamber in an amount equal to the concentration difference between the modelled dry seed particle mass, from the previous time step, and the measured mass, from the present time step. The modelled steady state particle number size distribution, without seed particles, was evaluated against the DMPS observations and optimized by tuning the new particle formation rate of particles with an initial diameter of 1.5 nm. The SOA formation in the model was represented by treating all organic vapours with a saturation concentration (C*) <103 µg m−3 as potentially condensable. The pure-liquid saturation vapour pressures (p0) of the organic vapours were calculated using the SIMPOL functional group contribution method (Pankow and Asher, 2008). In addition to the condensable vapours from the gas-phase mechanism, we also introduced 15 oxidation products of predetermined C* in the range 104 to 10−3 µg m−3, all having a fixed Qchemical equal to 10−5 molec. cm−3 s−1. By tracking the behaviour of the relative concentration drop of these model compounds, before and after the seed injections, we could connect this to representative C*, for conditions similar to the actual chamber experiment.
The reversible wall losses of the condensable vapours were modelled using the method proposed by Matsunaga and Ziemann (2010). In this method, the vapour loss rate to the chamber walls and the evaporation of the same vapours from the walls back to the gas phase are represented by two different first order rate coefficients kwall and kwall,back. For each individual condensable organic compound (i), kwall was estimated using Eq. (8) and kwall,back with Eq. (9):
The Teflon walls are treated as a large organic aerosol concentration (Cwall), which absorb the organic vapour molecules that hit the walls. We used a Cwall equal to 100 µmol m−3, which is within the range of values reported by Matsunaga and Ziemann (2010). Di and in Eq. (8) are the molecular diffusion coefficients for compound i and the reference HOM molecule C10H16O7 respectively. R is the ideal gas constant (8.3145 J K−1 mol−1) and T is the temperature in Kelvin. The organic compound molecular diffusion coefficients were calculated with Fuller's method (Tang et al., 2015). Equation (8) takes into account that large organic molecules have a slower diffusion than small molecules and therefore lower kwall. As an example, for an HOM dimer with molecular formula C20H30O16 the first order wall loss rate becomes 1∕481 s−1 (17 % lower than for C10H16O7).
2.6 Interpretation of the CI-APi-TOF data
The vast majority of the ions detected with the CI-APi-TOF were clusters of analyte molecules with the nitrate ion, . However, a minor fraction appeared to be analyte molecules clustered with the dimer of nitric acid, (HNO3), as seen before by, e.g. Bianchi et al. (2016, supplementary information). Analyte molecules that do not contain nitrogen, clustered with the dimer of nitric acid, appear at exactly the same masses as some organic nitrates clustered with only the nitrate ion. However, they are seen even without nitrogen oxides (NOx) in the chamber, when no organic nitrates are formed. Further proof of their identity as non-nitrates clustered with the nitric acid dimer comes from the good correlation of their time behaviour with that of the corresponding peaks clustered only with the nitrate ion. Due to this, for the analyses during the experiments without NOx in the chamber, we excluded any peaks containing more than one nitrogen atom, i.e. the one from the nitrate ion. In the presence of NOx, we observed a large increase in the signals at these masses, attributed to the formation of organic nitrates appearing at the same masses. In these experiments, the organic nitrates probably contributed the clear majority to these signals, but there was a non-zero contribution from the dimer charging as well. This should be taken into account when interpreting the results. In general, we observed that the dimer clustering seemed to be more prominent with the LTOF instrument used here, compared to the older high-resolution APi-TOFs (HTOFs).
In addition to the analyte molecules charged with the nitrate ion or its dimer, some molecules are also detected as deprotonated anions. For simplicity, we excluded these peaks from the analyses.
RO2 radicals formed in the ozonolysis or OH oxidation of α-pinene, and organic nitrates containing one nitrate group, both have an odd number of hydrogen atoms, causing them to appear at odd masses in the spectra. Further, the difference in mass is often very small. This causes problems for the separation of the signals originating from RO2 radicals from those coming from organic nitrates (or non-nitrate compounds charged with the dimer of nitric acid, as noted above). The signals may not be unambiguously separated, and the signal attributed to one may have some contribution from the other. For this reason, we do not present detailed results on the behaviour of RO2 radicals during seed injection. Organic nitrates often have much higher signals as compared to RO2 radicals, which makes their fits more robust (Cubison and Jimenez, 2015). Due to this, we do present results on their behaviour. However, due to the overlap with some RO2 radicals, along with the dimer charging effect discussed above, these results should be interpreted with some caution.
2.7 Data processing
We processed the nitrate CI-APi-TOF data using tofTools (Junninen et al., 2010). After high-resolution peak fitting, we normalized the signal intensities by the sum of the reagent ion signals, taking into account the nitrate monomer, dimer and trimer signals. We then used these normalized signals in subsequent analysis. As the analysis focuses on relative changes in signal intensities, absolute concentration calibrations were not necessary.
In order to investigate the effect of seed injections on gas-phase concentrations of α-pinene oxidation products, we compared the signal levels during the seed injections to those during the steady state before the injection. For assessing the reliability of the signals, we calculated the mean signal level during the steady state before the seed injection, along with the standard deviation (SD) of the signal during this period. A high standard deviation in relation to the mean signal level can mean either a noisy signal, or an unstable one. For this reason, we excluded the compounds with a mean-to-SD ratio below 4 from further analyses.
3.1 General behaviour of HOM and organic aerosol upon seed injections
When injecting only gaseous precursors we observed formation of both HOM monomers and dimers, as expected. The HOM formation was accompanied by the formation of SOA. During the course of an experiment, both the HOM signals measured by the CI-APi-TOF and the organic mass measured by the AMS stayed stable, indicating they were in steady state (SS1 in Fig. 2). After sampling this steady state for several hours, we started injecting inorganic seed aerosol. The seed aerosol concentration reached a steady level after a few hours (SS2 in Fig. 2). This increase in the seed aerosol concentration resulted in an increased condensation sink, leading to enhanced condensation of HOMs, and a corresponding increase in the organic aerosol mass (Fig. 2). The behaviour of both gas-phase HOMs and SOAs were well captured with the ADCHAM model (Fig. A2).
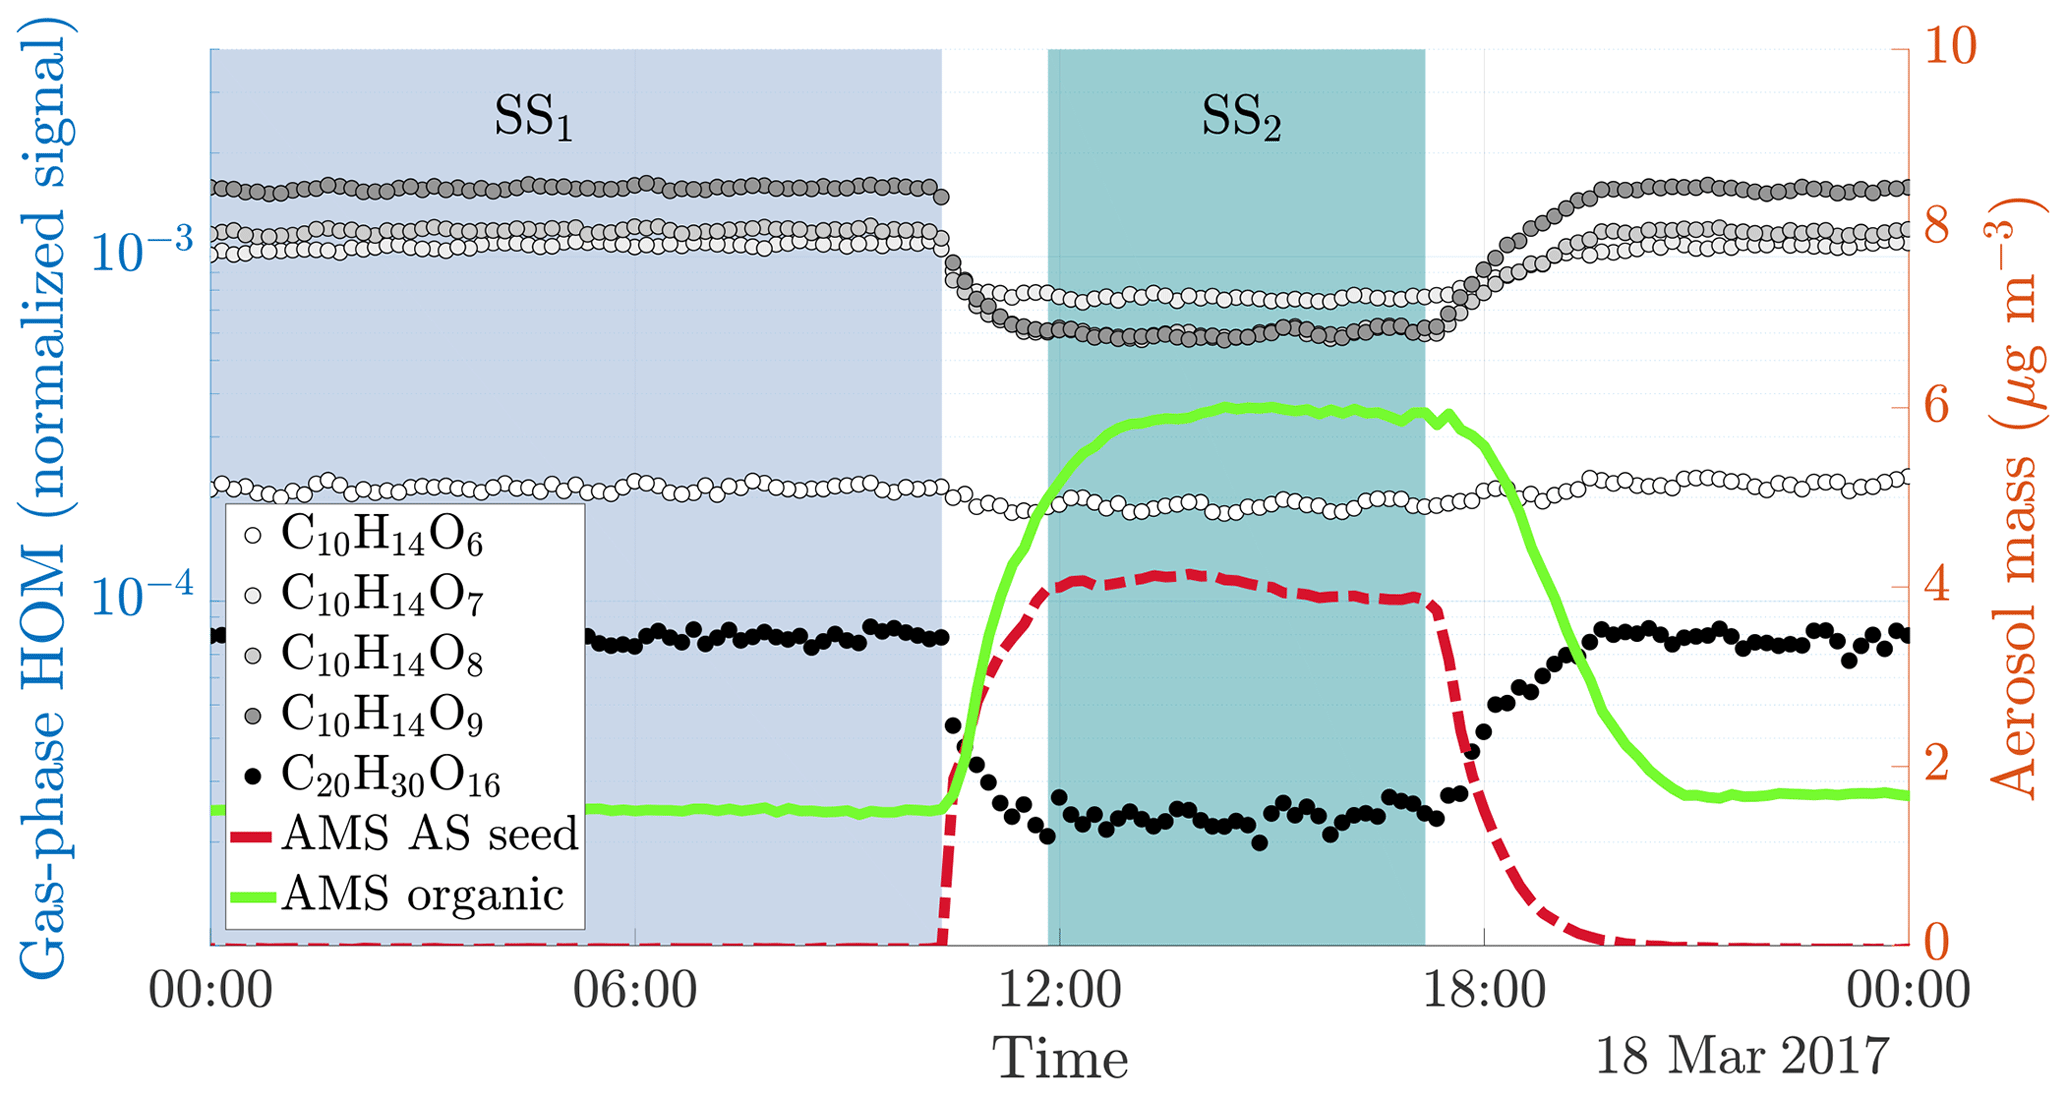
Figure 2Time series of both gas and particle-phase species during a typical seed injection (experiment 19, Table A1). The experiment starts with only gaseous precursors being injected into the chamber: these form HOMs (dotted lines, measured with the -CI-APi-TOF), which form SOA (solid green line, measured with the AMS). Both the HOMs and the SOA are in a steady state (SS1, blue shading). At around 10 o'clock, we start injecting ammonium sulfate seed aerosol (red dashed line). This results in an increased condensation sink, which causes an increase in the SOA mass, and a decrease in the gas-phase HOM signals. After a transition period, a new steady state is reached (SS2, turquoise shading). Upon stopping the seed injection, the SOA levels decrease again, and the HOM signals increase.
3.2 Expected relationship between vapour pressure and condensation behaviour of HOMs
Using the ADCHAM model, we found that in the conditions of the chamber, the gas-phase concentrations of oxidation products with a saturation concentration (C*) over 100 µg m−3 (in the volatile end of the SVOC range) are not expected to be affected by the seed additions due to fast evaporation. Thus, the experimental set-up cannot readily give precise information on the volatilities of compounds having saturation concentrations above this value. At the other extreme, products with saturation concentrations below 0.01 µg m−3 (within the LVOC range) are expected to all show a behaviour consistent with irreversible condensation. Between these limiting cases, there is a smooth transition across the SVOC and upper end of LVOC range: it is in this area that the method can give the most precise information on volatility (Fig. 3).

Figure 3Modelled fraction remaining vs. the logarithm of saturation concentration from the ADCHAM model for experiment number eight (Table A1). In addition to the discrete data points representing model compounds in ADCHAM (Sect. 2.5), a logistic fit to them, with the formula , is shown. Shading according to the volatility classes by Donahue et al. (2012).
The response of the HOMs to the seed injection was not uniform: some compounds showed a larger fractional decrease than others. As an example, only a small fraction of the original concentration of C10H14O9 remained in the gas phase, while the concentration of C10H14O6 was almost unaffected (Fig. 2). To better assess the exact magnitude of the decrease, we normalized the gas-phase signal of each identified compound in the CI-APi-TOF spectrum to its level during the steady state before the seed injection (Fig. 4). In the experiment shown, the gas-phase concentration of C10H14O6 decreased only by around 10 % (Fig. 4). This decrease can be explained by a saturation concentration of around 5 µg m−3, which lies well within the SVOC range. In contrast, the concentration of the more highly oxygenated C10H14O9 decreased by more than 60 %, indicating a saturation concentration of around 0.2 µg m−3, on the volatile end of LVOC range. The analogous compounds with seven and eight oxygen atoms exhibited behaviours between them, showing a progression towards larger decreases with increasing oxygen number. This progression is not unusual if we expect that the volatility of HOMs gradually decreases with increasing level of oxygenation. In comparison to the monomers, the decrease in the gas-phase concentration of C20H30O16, an example of an essentially non-volatile HOM dimer, was slightly greater in magnitude than the decrease of C10H14O9. This decrease of around 70 % is consistent with kinetically limited condensation, and behaviour expected of essentially non-volatile vapours. It also demonstrates the loss of sensitivity to large changes in volatility below around 0.3 µg m−3: the saturation concentration of C20H30O16 is presumably orders of magnitude smaller than that of C10H14O9, yet they differ only slightly in their condensation behaviour.
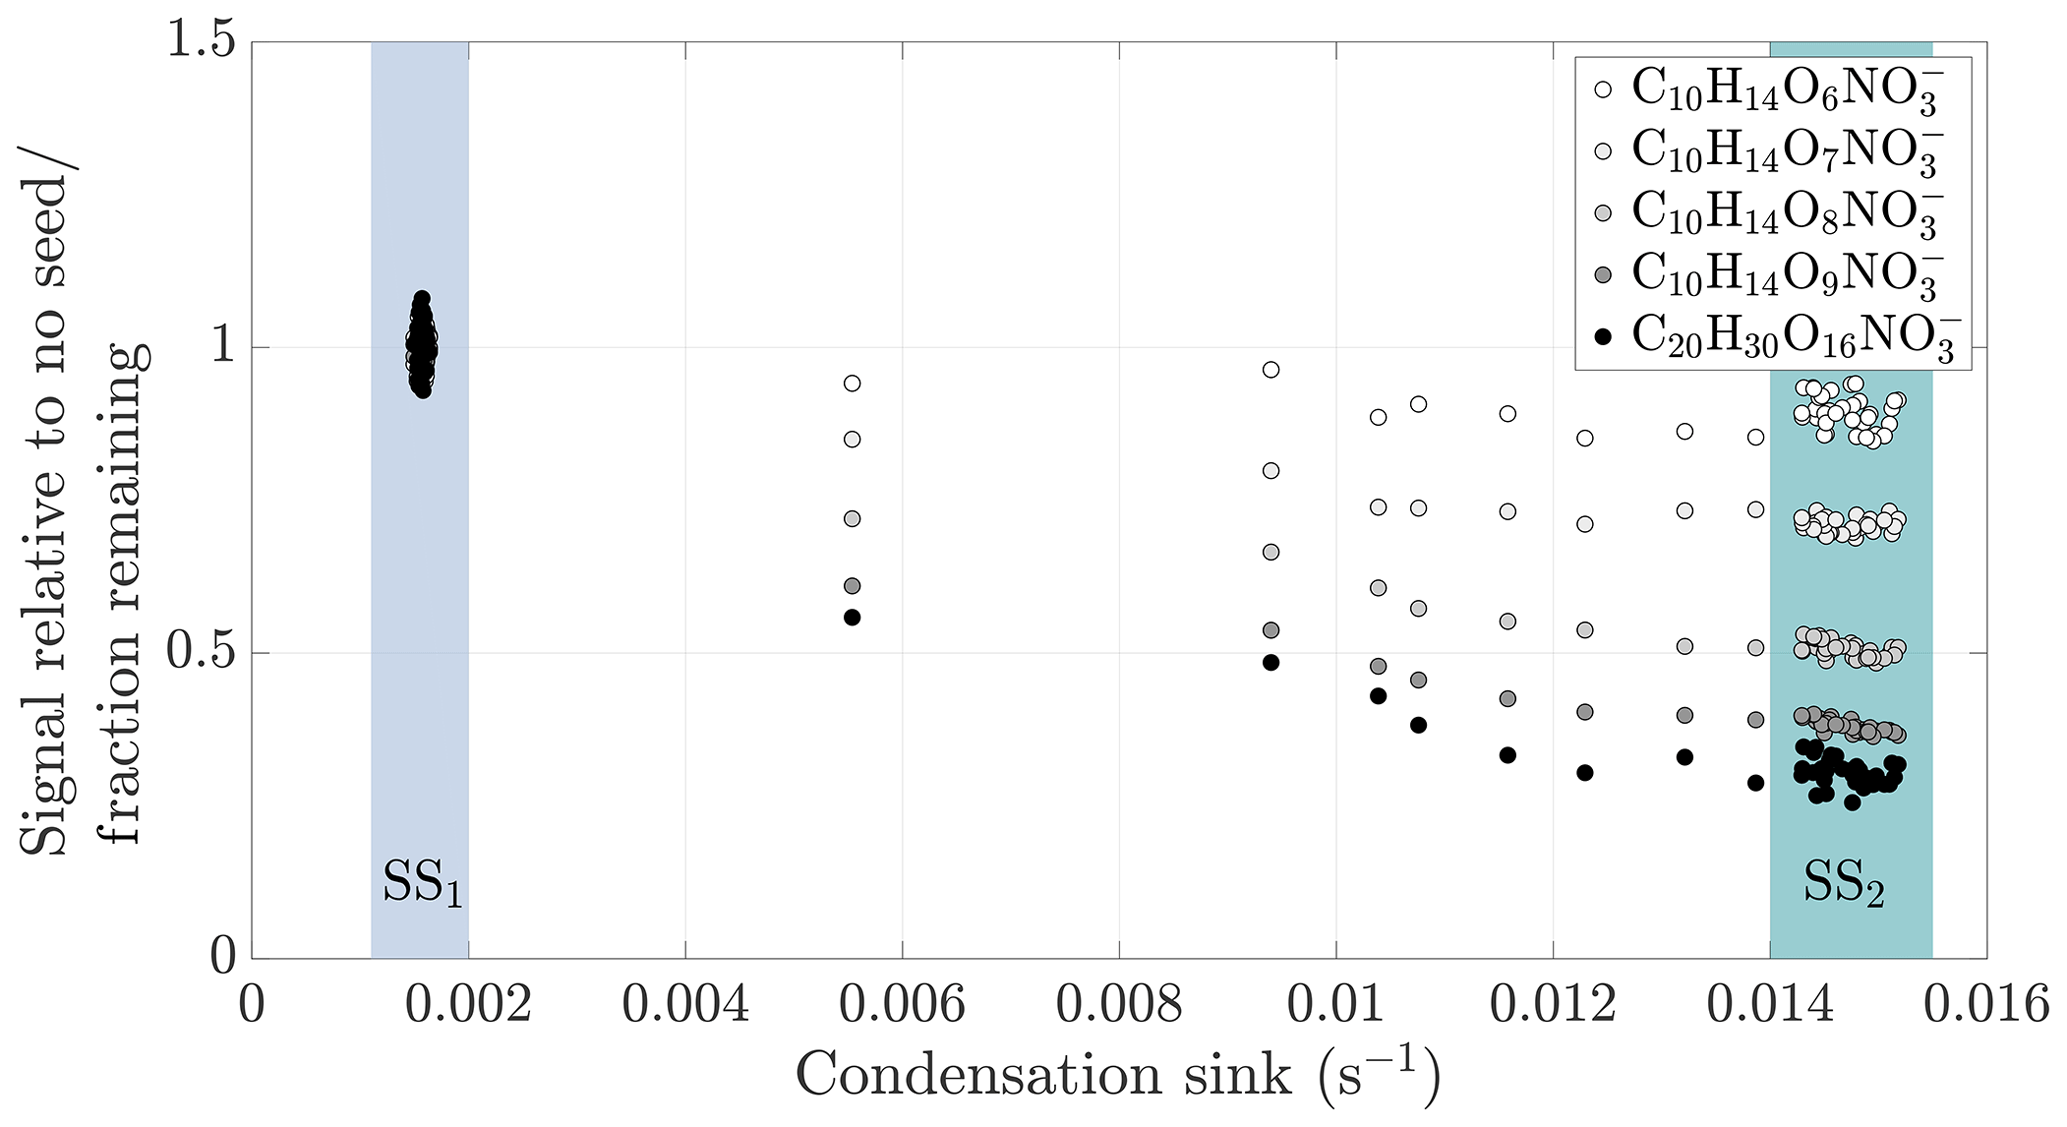
Figure 4Gas-phase HOM signal normalized to level before seed injection vs. condensation sink during a typical experiment (experiment 19, same as in Fig. 2). The steady state before seed injection (SS1) is visible as a cluster of points having a low condensation sink, and normalized gas-phase signals of around 1. The steady state formed during the seed injection (SS2) is seen as distinct clusters of points at a higher condensation sink: the transition between the steady states is visible between these clusters. For each compound separately, we averaged the values during the seed injection steady state, and used these average values in the subsequent analyses.
3.3 Condensation behaviour of HOMs as a function of molecular mass and composition
We will next analyse the behaviour of the measured gas-phase compounds in experiments conducted in a dry chamber, without NOx, using ammonium sulfate seed particles. We will then compare these results to those measured in the presence of NOx, in a humid chamber, and using ammonium bisulfate instead of ammonium sulfate. To facilitate the analysis, we averaged the values for the fraction remaining for each fitted compound during the seed injection steady state, as demonstrated in Fig. 4, for each experiment separately. We then used these steady state average values for the fraction remaining in subsequent analyses.

Figure 5Fraction remaining after seed injection vs. the molecular mass of the detected cluster. The area of the circles has been linearly scaled to the magnitude of the signal of each compound before the seed injection, capped at . The data are the average of experiments 1 and 11, with ammonium sulfate injection, dry chamber and no NOx in the chamber. Compounds with a signal-to-noise ratio, as defined in Sect. 2.7, below 4 have been excluded from the plot. Characteristic HOM monomer and dimer regions have been highlighted with grey and blue shading respectively.
Looking at the fraction remaining after seed injection as a function of the mass of the detected cluster, we generally observed values close to 1 for many of the lower mass compounds, up to 250 Da (including 62 Da from the charging nitrate ion; Fig. 5). This indicates that the volatilities of these compounds generally fall into the volatile end of the SVOC or IVOC range, or higher (Fig. 3). At the other end of the spectrum, we observed values around 0.3, indicating volatilities in the LVOC range or lower, for most high mass compounds starting from 350 Da (Fig. 5). Between the masses 250 and 350 Da there was a gradual, but consistent shift from the values close to 1 to values close to 0.3. This transition had a distinct sigmoidal shape, much like the transition of the expected fraction remaining with decreasing volatility, based on the ADCHAM model (Fig. 3). At the masses below 250 Da, we detect molecular fragments with a carbon skeleton shorter than that of the precursor α-pinene, and relatively few oxygen atoms. Due to their short carbon skeletons and low level of oxygenation, they are expected to be relatively volatile. On the other hand, on masses above 350 Da, we mainly detect the most oxidized HOM monomers with more than 10 oxygen atoms, along with HOM dimers. These compounds are expected to have low, or even extremely low, volatility (Ehn et al., 2014; Kurtén et al., 2016; Tröstl et al., 2016; Bianchi et al., 2019). Between these extremes the sigmoid-like transition of compounds is consistent with a gradual decrease of volatility with increasing mass, coinciding with increased levels of oxygenation of the compounds. This transition seems to be centred around 310 Da: around this mass, the highest signals seem to be around half way between the high- and low-volatility limits, i.e. with a saturation vapour concentration of around 1 µg m−3 (Fig. 3). The behaviour of the compounds during the seed injection thus seems consistent with what we would expect based on the presumed volatilities of the oxidation products. However, as stated in Sect. 2.4, we cannot exclude the possible role of a changed source term, or reactive uptake, for some of the compounds in determining the change in their gas-phase concentrations during the seed injection. Indeed, we observe some compounds with the values for the fraction remaining above 1, mainly at lower masses (Fig. 5): this implies an increased source term upon seed addition. Presumably these compounds are formed in the particle phase and are of high enough volatility to evaporate back to gas phase, as discussed in Sect. 2.4.4. However, the number of these compounds is small, and they lie mainly outside the HOM masses. So, while there are indications of some particle-phase processes taking place, we expect that the volatility of a compound is dominant in determining its behaviour for the vast majority of the detected compounds.
In addition to the closed shell products, we also investigated the effect of the seed additions on the highly oxidized RO2 radicals measured with the CI-APi-TOF. However, due to the limitations listed in Sect. 2.6, we will not go into detail regarding the behaviour of RO2. Nonetheless, we observed some decrease in the signals attributed to them during the seed injections, but these decreases generally did not exceed 20 % of their signal before the seed addition. This further supports the idea that the majority of the changes observed in the closed shell species upon seed addition are indeed caused by differences in their volatility, and not in their source terms. It seemed that the decrease in the concentrations of individual RO2 was not entirely uniform, potentially indicating differences in their lifetimes and/or formation dynamics. We are investigating this phenomenon, and its effect on the formation of closed shell HOMs, in more detail, and will publish these results separately.
3.4 Effect of NOx
Upon introduction of NOx in the chamber, we observed the formation of many oxidation products containing nitrogen (Fig. 6a). These compounds are expected to form when RO2 radicals are terminated by NO (Ehn et al., 2014), or when the oxidation is initiated by the nitrate radical (Yan et al., 2016): both result in oxidation products containing an organic nitrate functional group. Compared to the experiments without NOx, the behaviour of the non-nitrate oxidation products did not seem to change significantly (Fig. 6b). In contrast, compared to the oxidation products consisting of only carbon, hydrogen and oxygen, the organic nitrates seemed to transition to low volatilities at markedly higher masses, with the transition centred around 355 Da (Fig. 6a, again including 62 Da from the charging nitrate). This is around 45 Da higher than for the non-nitrates. This difference in mass for compounds of similar volatility is to be expected based on the functional groups making up these oxidation products. Non-nitrate HOMs are expected to contain carbonyl, hydroperoxide, hydroxide, peroxy and carboxylic acid groups, in agreement with known reaction pathways for peroxy radicals (Ehn et al., 2014). The organic nitrate HOMs contain the nitrate group as well, acquired in the radical termination reaction with NO (or the initiation of the oxidation with NO3). In the absence of NO, many termination pathways of RO2 radicals lead to the formation of a hydroxy group (Vereecken and Francisco, 2012). While the nitrate group has a mass of 62, the hydroxy has a mass of only 17 Da. Despite their mass difference, they are expected to lower the volatility of a compound by roughly the same amount (Kroll and Seinfeld, 2008; Pankow and Asher, 2008). Hence, for two otherwise identical compounds, one containing a hydroxy group and the other a nitrate group, a similar volatility can be expected, while the organic nitrate has a mass 45 Da higher. This is analogous with a situation where a peroxy radical gets terminated either through reaction with NO or with HO2, as an example: the resulting oxidation products show a large difference in mass, but have similar volatilities. Of course, these are not the only possibilities for the formation of organic nitrates and non-nitrates, but highlight that the mass difference for compounds of similar volatility is to be expected.
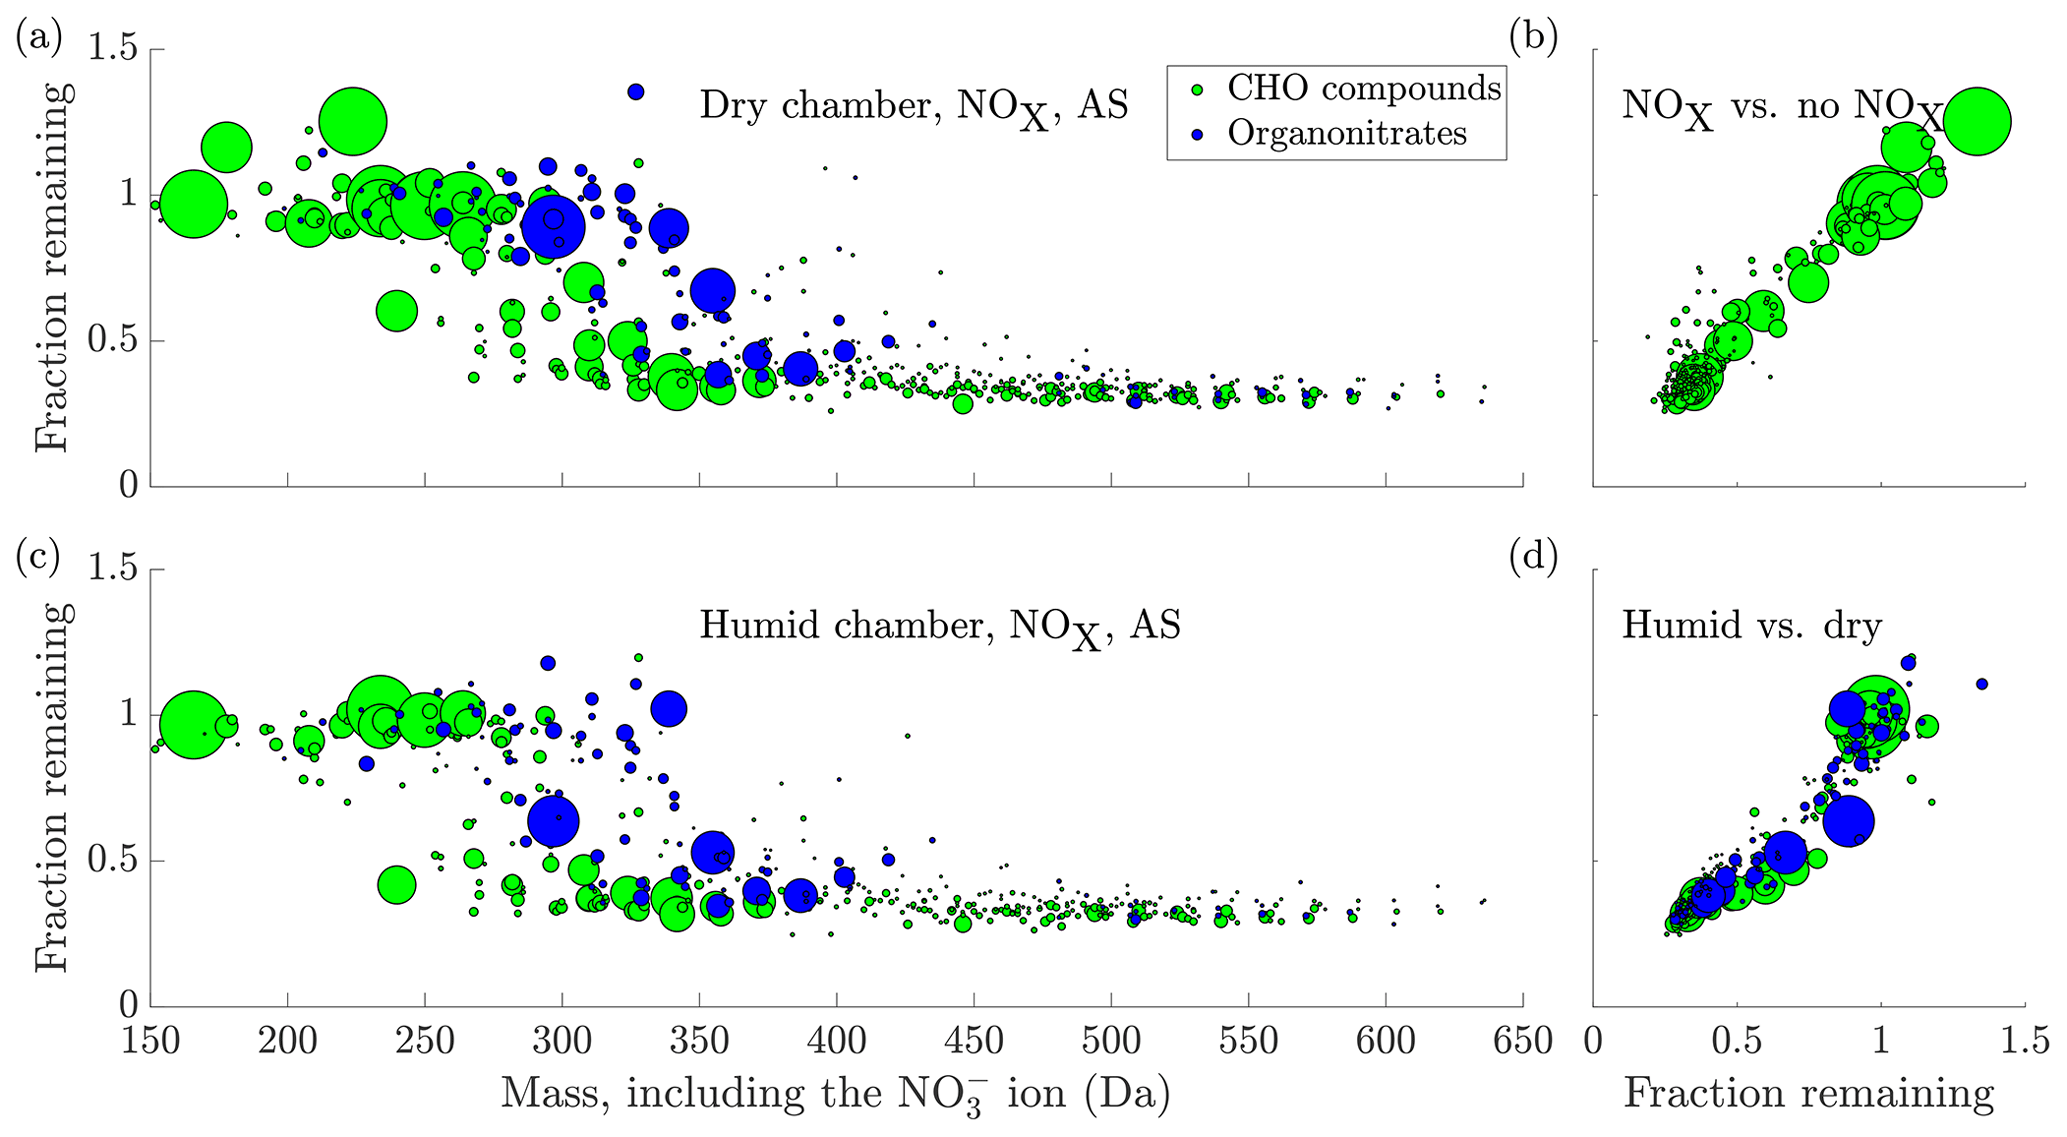
Figure 6(a) The fraction remaining after seed injection vs. the molecular mass of the detected cluster, including the charging ion. The area of the circles is scaled linearly to the magnitude of the signal of each compound before the seed injection, capped at . The data are the average of experiments 15 and 19, with ammonium sulfate injection to dry chamber, in the presence of NOx. Compounds with a signal-to-noise ratio, as defined in Sect. 2.7, below 4 have been excluded from the plot. (b) Comparison of the experiment in (a) to the no NOx case in Fig. 5. The y axis and circle size are the same as in (a), with the fraction remaining from Fig. 5 on the x axis. Only CHO compounds are plotted, as organonitrates are not formed in the experiments without NOx. There is a general linear agreement between the two experiment types, indicating that the addition of NOx did not significantly influence the behaviour of non-nitrates upon seed addition. (c) same as (a), but in humid conditions (experiment 18, 40 % RH and deliquesced seed). (d) the same as (b), but comparing the experiments in (a) and (c): (a) in the x axis and (c) in the y axis. The values for the fraction remaining for both organonitrates and CHO compounds are consistently lower in the humid case, indicating enhanced uptake in those conditions. In (c) and (d), the y axis has been cut at 1.5 for clarity, excluding the compound C5H6O6 at mass 224 with a fraction remaining of 2.27.
3.5 Effect of seed composition and chamber humidity on the condensation behaviour of HOM
Compared to the injections of ammonium sulfate, we did not find a large difference in the behaviour of the gas-phase oxidation products upon injections of the more acidic ammonium bisulfate. However, in the same set of experiments, Riva et al. (2019) found a high SOA enhancement on dry ABS seed particles. The lack of difference in the gas-phase HOM concentrations indicates that the increase in SOA did not come from enhanced HOM uptake, as measured by the -CI-APi-TOF. Indeed, Riva et al. (2019) observe a marked decrease of more volatile gas-phase oxidation products, including pinonaldehyde, upon ABS seed addition.
In contrast, we did observe a difference between the experiments conducted at <1 % RH with effloresced seed, and those at 40 % RH with deliquesced seed, with many compounds seeming to decrease more during seed addition in the humid chamber (Fig. 6c and d). It is plausible that this increased uptake of the oxidation products was caused by the formation of an aqueous phase on the particles, and solubility-driven or reactive uptake of the oxidation products to the aqueous phase.
3.6 Factors determining HOM volatility
To gain more insight into what determines the volatility of HOMs, we constructed a statistical model explaining their condensation behaviour, measured by the fraction remaining, in terms of their composition. From Fig. 6, it is already clear that the molecular mass of the compounds explains the volatility relatively well, with increasing mass decreasing the volatility. However, molecular mass cannot explain all the features of the curve, such as the different behaviour of nitrates and non-nitrates. Furthermore, the molecular mass is not by itself the causal explanation for the volatility: rather, low volatility is caused by intermolecular forces: thus, intermolecularly bonding functional groups lower the volatility of a compound (e.g. Kroll and Seinfeld, 2008). These are not directly measured by the mass spectrometric technique, but the composition of a compound gives some indication as to what functional groups it may contain. As an example, a hydroxy group will contribute, in addition to a hydrogen atom, one oxygen, while a hydroperoxide group will contribute two. In contrast, an aldehyde or a ketone group will contribute one oxygen, while reducing the number of hydrogen atoms bound to the carbon skeleton by one. Thus, all of these groups will contribute a different number of hydrogen and oxygen atoms. However, these contributions are not unique, as a compound with two hydroxy groups will have the same composition as that having one hydroperoxide group, everything else being equal. Still, the composition can provide an indication of the functionalities of a molecule as well.
3.6.1 Generalized linear model to explain HOM volatility
For the analysis, we chose to use the average of experiments 15 and 19 (Table A1, the same as presented in Fig. 6a), with AS seed injection, dry chamber and with NOx in the chamber. We chose these experiments in order to minimize the role of particle-phase processes in determining the fraction remaining (FR), and in order to be able to incorporate organic nitrates into our model. We linearly scaled the FR of HOMs to range from 0 to 1, with the upper branch of the sigmoid in Fig. 6a getting the value 1, and the lower branch, containing essentially non-volatile HOM dimers, the value 0. We used this scaled response (FRscaled) as the dependent variable, with the carbon, hydrogen, oxygen and nitrogen numbers of a molecule as the independent variables. With the dependent variable ranging from 0 to 1, and having a sigmoidal transition between the extremes, we chose to use a generalized linear model with a logit link function (i.e. the inverse of the logistic function).
Compounds with less than six carbon atoms, or with a signal-to-noise ratio below 10, were excluded from the model, in order to avoid the smallest fragments and unreliable signals respectively. In addition, any compounds with an FR value over 1.1 (meaning a 10 % increase upon seed addition) were excluded due to the influence of particle-phase processes on them. The model was weighted with the signal before seed addition, capped to the same value as in Fig. 6, in order to give more weight to the more abundant oxidation products.
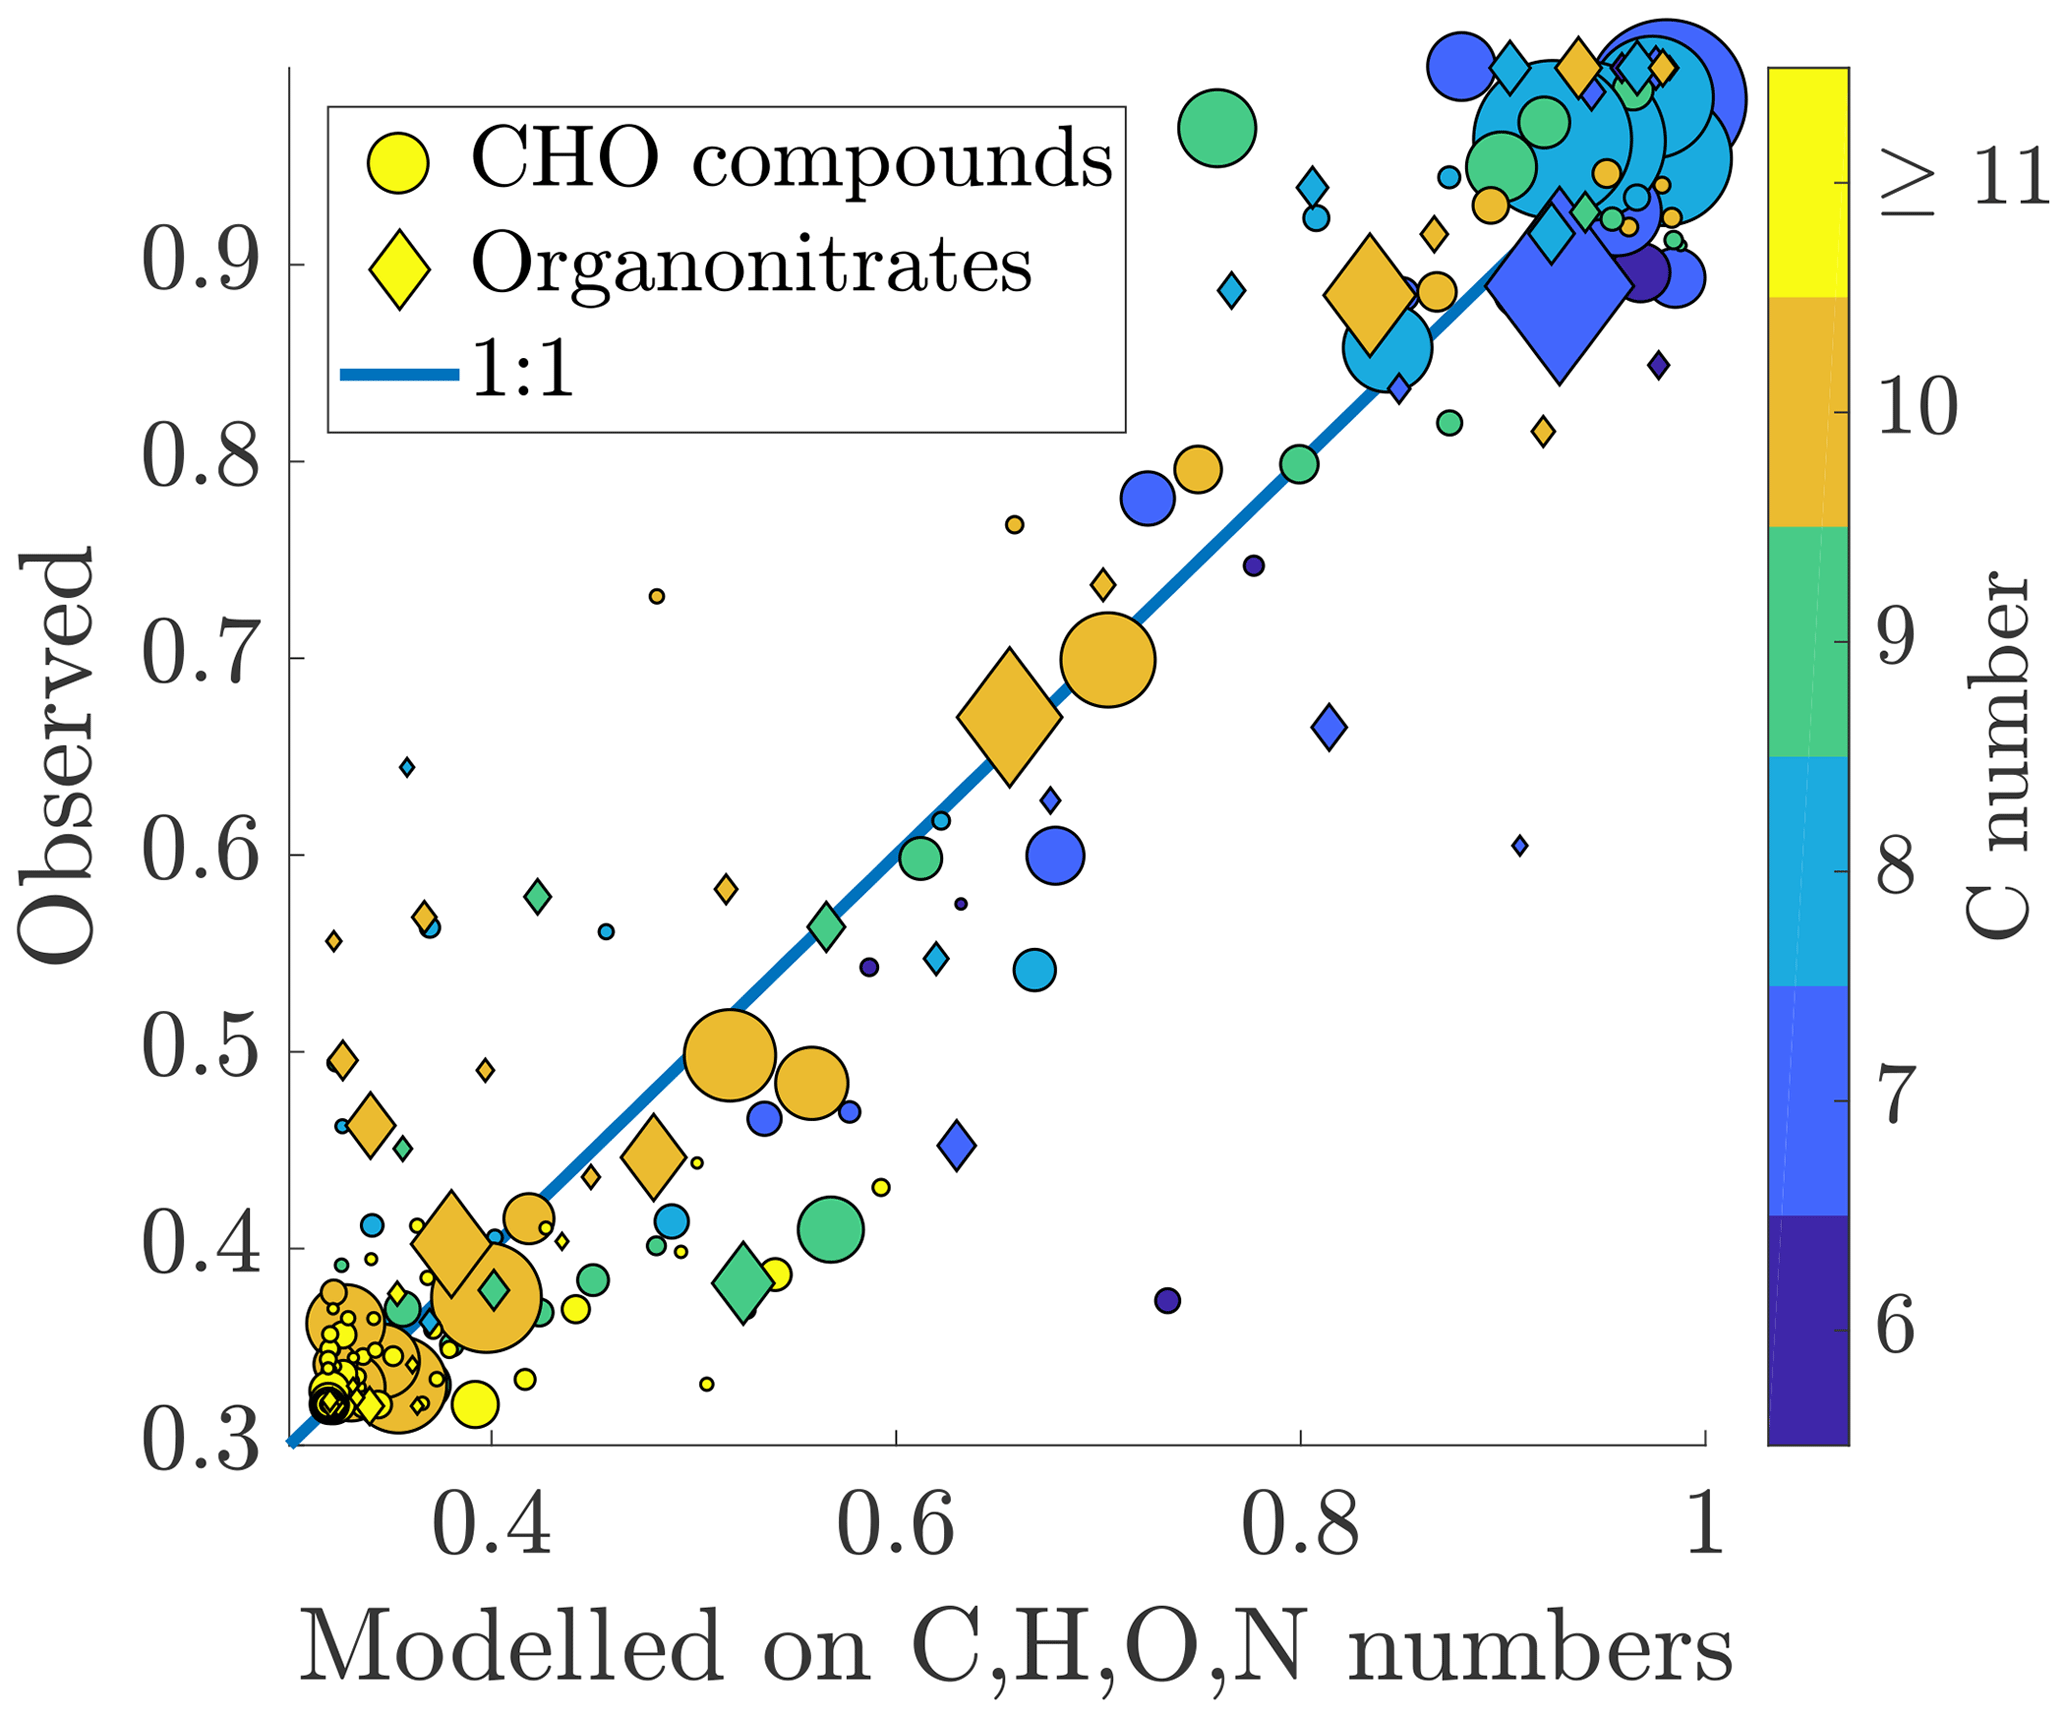
Figure 7Measured fraction remaining vs. fraction remaining modelled on the chemical composition. The colouring of the circles is based on the carbon number of the compound, and the area of the circles is scaled linearly to the signal intensity, as in Figs. 5 and 6. The formula for the model is presented in Eq. (10). Number of compounds used for the fit: n=232, Chi2 statistic vs. constant model: 1.74×10⁴, p value =0 (to machine precision). A good correspondence is found between the measured and fitted values, indicating that the volatility of a compound can be explained well in terms of its molecular formula. Larger deviances from the 1:1 line are mainly explained by carbon numbers lower than 10.
We found that the fraction remaining could be well explained using the composition (Fig. 7). Out of the monomers, the abundant C10 compounds are fitted the best, appearing close to the 1:1 line. The compounds deviating from this line mainly have a smaller carbon number: C9 compounds seem especially problematic for the model. This could be an indication that the dependence of the volatility on, e.g. the oxygen number is different for compounds with fewer than 10 carbon atoms. Both organic nitrates and non-nitrates seem to be fitted equally well. The formula for the fit is:
The coefficients for each of the terms in the model, including the intercept, were highly statistically significant, with all p values being smaller than 10−51. To convert the dependent variable to volatility, we used the logistic fit between the saturation concentration of a model compound, and its expected fraction remaining from Fig. 3. By combining that relationship with the logistic fit in Eq. (10), we can obtain an expression for the saturation vapour concentration in terms of the composition:
The addition of a carbon or a nitrogen atom to a molecule, with their positive coefficients in the model, would act as to increase the volatility. The addition of a hydrogen or an oxygen atom, on the other hand, would act as to decrease it. The positive coefficients of carbon and nitrogen seem counterintuitive at first. However, the addition or removal of a carbon or a nitrogen atom is not independent of other elements. In the case of HOMs formed here, the nitrogen most probably appears in the form of a nitrate functional group (NO3), and is thus accompanied by three oxygen atoms. Adding the coefficients of the nitrogen atom with three oxygen atoms results in a negative overall coefficient. The cumulative effect of adding a nitrate group would therefore act to reduce the fraction remaining, and thus volatility, in agreement with widely used group contribution methods, such as SIMPOL, developed by Pankow and Asher (2008). Similarly, addition or removal of a carbon atom, while keeping the structure of the molecule otherwise unchanged, would be accompanied by the corresponding gain or loss of two hydrogen atoms. The combined effect would still be to decrease the volatility with increasing carbon number, as expected. Even accounting for the carbon number in the model, the hydrogen number of a molecule also has a statistically significant coefficient. This indicates that the hydrogen number provides independent information on the volatility of a compound, with the volatility decreasing with increasing hydrogen number. The termination step of an RO2 radical formed in the ozonolysis of α-pinene determines the number of hydrogen atoms in the resulting molecule, with lower hydrogen numbers being accompanied by the formation of a carbonyl group, and higher numbers accompanied with a hydroxy group (Vereecken and Francisco, 2012). The hydroxy group is expected to lower the volatility of a compound more than the carbonyl group (Kroll and Seinfeld, 2008). Thus, the negative coefficient of hydrogen in our model, as well as the coefficients of other elements, are reasonable in the light of molecular considerations for the determination of volatility.
As before, any compounds with a saturation concentration higher than 100 µg m−3 (volatile end of SVOC range) are expected to behave in the same way, not being affected by the seed addition, and showing the values for the fraction remaining of around 1 (Fig. 3). Similarly, compounds with a saturation concentration below 0.01 µg m−3 (in the LVOC range) are all expected to behave as non-volatile. Thus, the model, similarly to the measured results, cannot distinguish between volatilities of compounds above and below these limits respectively. From this follows that the model is most reliably fit to the compounds in the transition region, in the SVOC to LVOC range. The relationship given in Eq. (11) may only hold for that range of volatilities. Thus, caution should be used in interpreting the modelled volatilities, especially outside the range of volatilities defined above. For example, HOM dimers, which all exhibit behaviour consistent with non-volatile vapours, are correctly fit in the very lowest edge of the volatility range, but any detailed information on their volatility is lost. For this reason, the relationship given in Eq. (11) may be better suited to HOM monomers. Also, the relationship presented in Eq. (11) may not hold for oxidation systems other than the one presented here, or indeed compounds formed in α-pinene oxidation, but not through autoxidation. Examples of products formed in the latter way include pinic (C9H14O4) and pinonic acids (C10H16O3). Equation (11) gives them saturation concentrations 15 and 27 µg m−3 respectively compared to literature values in the range of a couple of µg m−3 for pinic and from less than one to up to hundreds of µg m−3 for pinonic acid (Bilde and Pandis, 2001; Salo et al., 2010; Donahue et al., 2012). Especially for pinonic acid the spread in literature values is very large. Given that HOMs are chemically quite different from the two acids, the agreement is surprisingly good. Still, any generalizations should be drawn with caution. Finally, the possibility that the uptake of some compounds to particles is not driven by their volatility, but rather some particle-phase processes (as noted in Sect. 2.4.4) would affect the modelling as well. This would lead to artificially low volatility estimates. However, as noted above, we have tried to minimize this effect.
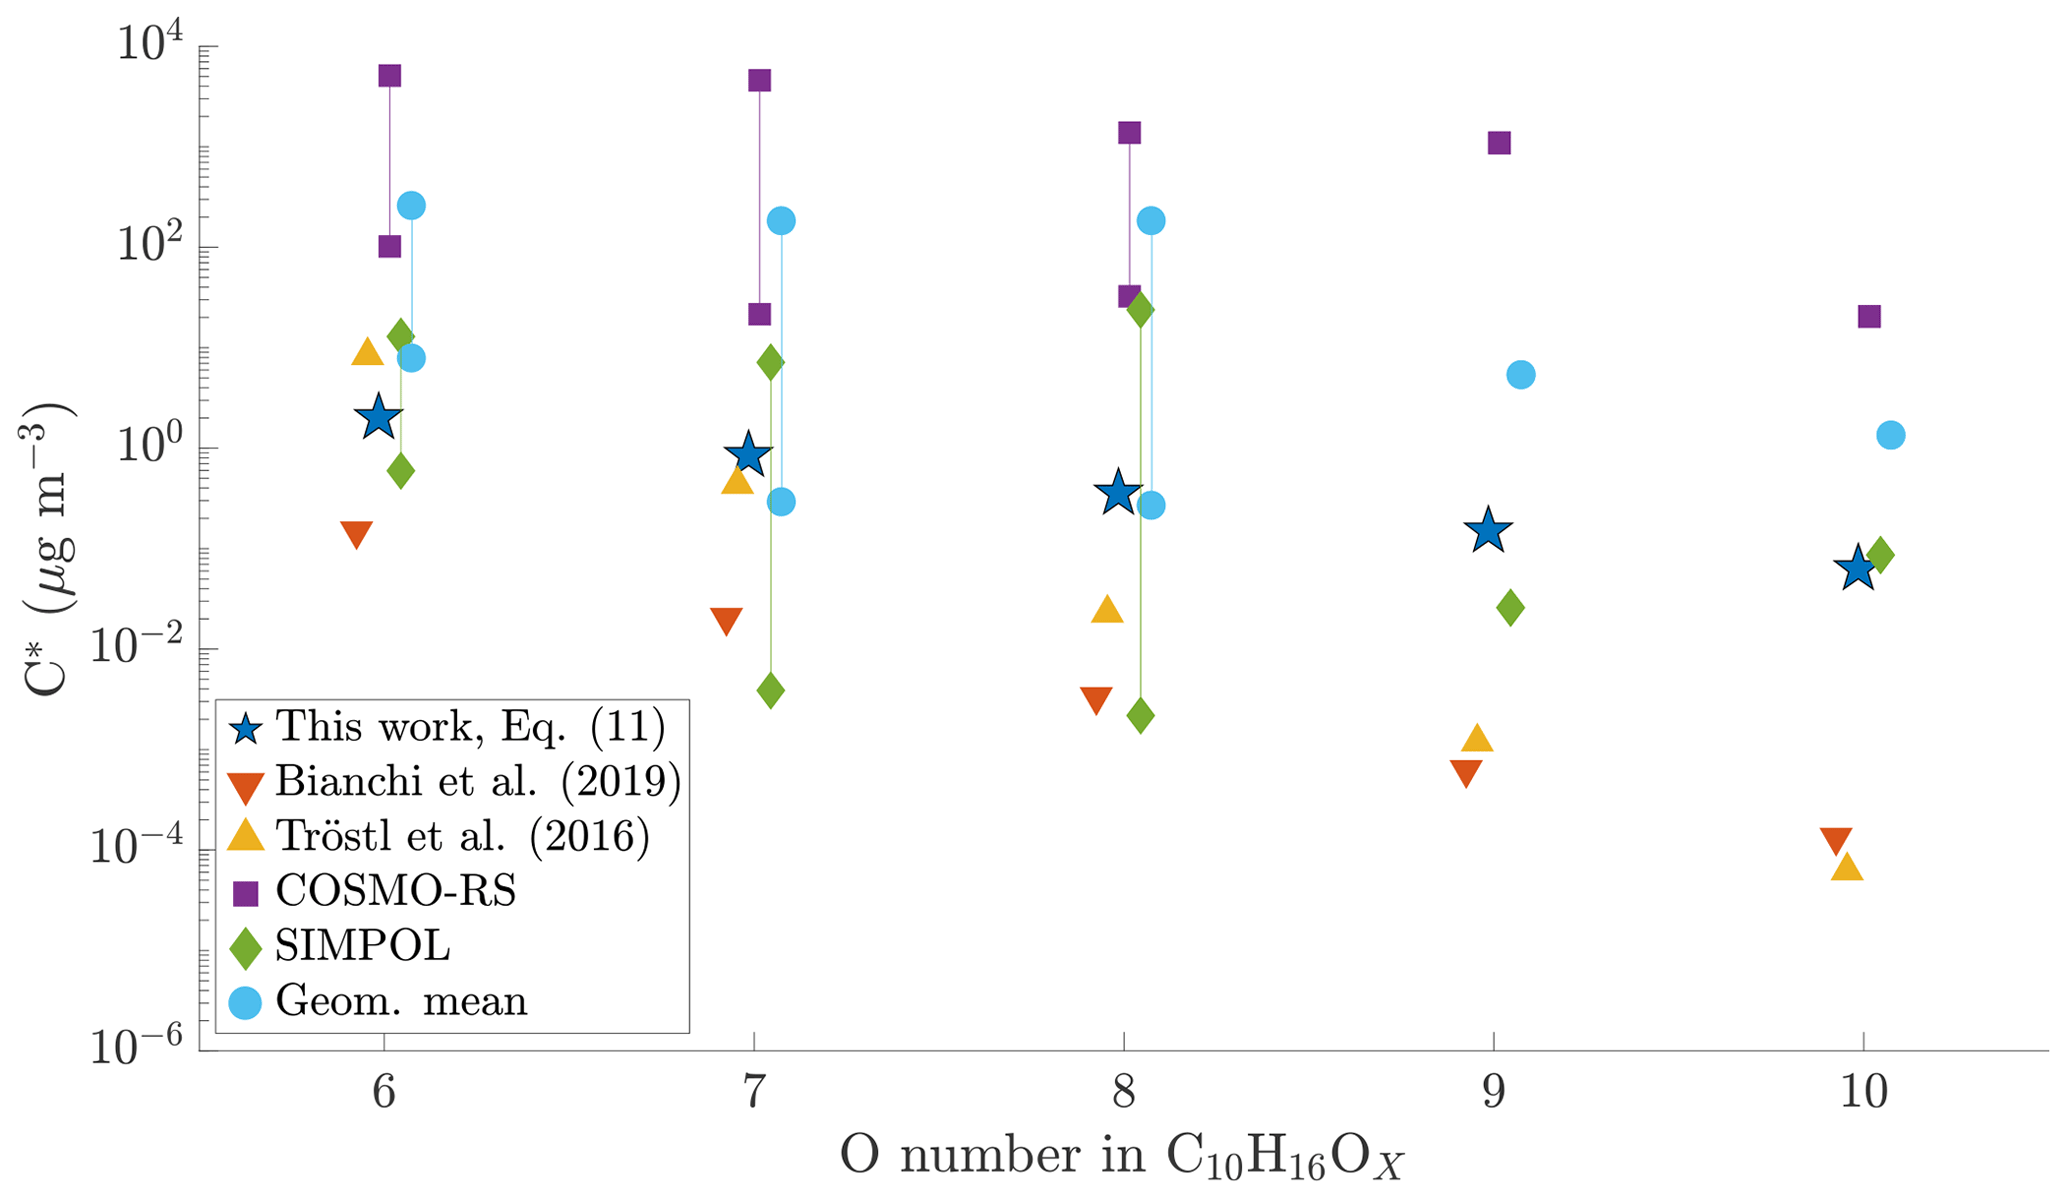
Figure 8Comparison of different volatility estimates and parameterizations. SIMPOL and COSMO-RS are from Kurtén et al. (2016): COSMO-RS is the geometric mean of their four different COSMO-RS estimates. Geom. mean is the geometric mean of SIMPOL and COSMO-RS as recommended by Kurtén et al. (2016). For compounds with six to eight oxygen atoms, Kurtén et al. (2016) used multiple candidate isomers: values are given both for that with the highest and for that with the lowest saturation concentration. For the parameterizations from Tröstl et al. (2016), Bianchi et al. (2019) and Eq. (11), all structural isomers get the same value, and thus only one is given. All values are saturation vapour concentrations in µg m−3. The values from Kurtén et al. (2016) are calculated at 298.15 K, Tröstl et al. (2016) at 293 K, Bianchi et al. (2019) at 300 K and Eq. (11) at chamber temperature, approx. 302 K.
3.6.2 Comparison to existing volatility parameterizations
There are numerous existing parameterizations for assessing the volatility of VOC oxidation products. Some, like the SIMPOL model by Pankow and Asher (2008), require as inputs the exact functional groups making up a molecule. Others, such as the ones presented by Bianchi et al. (2019) and Tröstl et al. (2016), only require the molecular formula, having some underlying structural assumptions. The former requires the carbon and oxygen numbers in the molecule. The presence of nitrogen is separately handled, by assuming it to exist in nitrate functional groups, assigning a constant effect to that nitrate group. The latter is based on the estimated SIMPOL volatilities for certain expected model HOM compounds, and fit based on their O:C ratios, separately for C10 monomers and C20 dimers, with each group getting their own relationship. As the exact structures of HOMs are not known (Bianchi et al., 2019), any method requiring structural information, such as SIMPOL, will include some uncertainty stemming from the choice of structure for a compound. Similarly, the SIMPOL-based parameterization by Tröstl et al. (2016), will include this uncertainty.
In the SIMPOL model, any addition of oxygen to the molecule decreases its volatility by almost an order of magnitude, at a minimum (for a ketone). A hydroxy or a hydroperoxy group both lower the volatility by over 2 orders of magnitude, as does a nitrate group. In our parameterization (Eq. 11), the coefficient for oxygen is −0.36. This means that with the addition of one oxygen atom, the volatility of a compound is reduced by only a bit more than a factor of 2. Thus, even for a hydroperoxy group, containing two oxygens, the reduction in volatility would be only fivefold. For a nitrate group, the corresponding decrease in volatility would be a factor of 2. Thus, our parameterization in Eq. (11) seems to predict much smaller sensitivities of the volatility of HOMs to different functional groups than what would be expected based on, e.g. SIMPOL.
Using quantum chemical calculations by the COSMO-RS model, Kurtén et al. (2016) found that intramolecular hydrogen bonding between the functional groups within an HOM molecule may inhibit the ability of the groups to take part in intermolecular bonding, and thus to reduce the volatility of the molecule. This would lead to the volatility being less sensitive to the addition of functional groups than would be expected based on, e.g. SIMPOL. As noted above, our results support this lower than expected sensitivity.
As a result of the lower sensitivity of the volatility to additional functional groups, Kurtén et al. (2016) hypothesized that the volatilities of HOMs may be higher than expected based on group contribution methods. As a best estimate, they suggested to use the geometric mean of the SIMPOL and COSMO-RS values for the volatility of HOMs. Additionally, Kurtén et al. (2016) found that for the same molecular formula, the volatility estimates by both the group contribution methods and by the COSMO-RS model varied up to 4 orders of magnitude depending on the exact structure chosen. To compare our results to those presented by Kurtén et al. (2016), as well as the parameterizations by Bianchi et al. (2019) and Tröstl et al. (2016), we took a set of model HOM compounds from Kurtén et al. (2016), and calculated the volatility estimates for them using both those parameterizations, as well as using Eq. (11).
For C10H16Ox, with x ranging from 6 to 10, we found that our parameterization generally gives lower volatilities than the geometric mean of COSMO-RS and SIMPOL estimates, especially for the higher oxygen numbers (Fig. 8). However, as noted above, both of those methods show a large variability depending on the exact structure of the molecule. Compared to the parameterizations by Bianchi et al. (2019) and Tröstl et al. (2016), and the lower end of SIMPOL estimates, our parameterization generally gives higher volatilities. Further, as noted above, our parameterization is much less sensitive to the addition of oxygen as compared to either Bianchi et al. (2019) or Tröstl et al. (2016). In this aspect, our parameterization is closer to COSMO-RS. However, the actual volatility estimates in our parameterization are much lower than those given by COSMO-RS. Our results thus fit in with the existing literature, in that the volatility of HOMs seems to be less sensitive to oxygen addition than expected from SIMPOL, as suggested by Kurtén et al. (2016). However, the absolute values of the volatility seem to be lower than those suggested by Kurtén et al. (2016) but still higher than from Bianchi et al. (2019). Again, as noted above, we cannot fully exclude the role of particle-phase processes in artificially lowering our HOM volatility estimates.
To investigate the volatility of HOMs formed in the ozonolysis of the monoterpene α-pinene, we used injections of inorganic seed aerosol to promote their condensation in a continuous flow chamber experiment. We found that, as expected, the general trend was that the higher the mass of the oxidation product, the more their gas-phase signal dropped during the seed injections, down to levels consistent with irreversible condensation. The observed changes were consistent with the lowering of the volatility of the compounds with increasing mass. The most highly oxidized HOM monomers, along with HOM dimers, were determined to be of low or extremely low volatility. Compared to non-nitrate oxidation products, we found that organic nitrates of comparable volatility had a higher mass, probably due to the relatively high mass of the nitrate group. The type of seed (ammonium sulfate, or the more acidic ammonium bisulfate) did not have a notable effect on the condensation behaviour of HOM, while in a humid chamber the uptake of many compounds was observed to be higher.
We found that the behaviour of the compounds upon seed injection, and thus their volatility, could be well explained in terms of their chemical composition. We found carbon, hydrogen, oxygen and nitrogen numbers all to be important in explaining the volatility, and the relationship could be connected to molecular properties of the compounds. Based on this relationship, we were able to develop a parameterization for the volatility of HOMs monomers generated in α-pinene ozonolysis. Future studies should evaluate the effect of the exact volatility parameterization used on new particle formation from HOM.
The results presented here are possibly specific to HOM from the ozonolysis of α-pinene, but the general methodology should be applicable to other conditions as well. These conditions may include other oxidant–VOC combinations, but also different loadings of organic aerosol to probe different volatility ranges. However, in investigations of volatility, care should be taken to affirm that the observed changes in gas-phase signals are in fact caused by volatility, and not by changes in gas-phase chemistry, for example.
The data used in the figures, as well as the time series of measured ozone, α-pinene, NOx and NO concentrations, condensation sink, temperature, relative humidity, aerosol mass concentration of organics, sulfate and ammonium, as well as the high-resolution fitted compounds and unit mass resolution sticks from the CI-APi-TOF, are available at https://doi.org/10.5281/zenodo.3545875 (Peräkylä, 2019). Codes for the analysis are available from OP upon request, and the ADCHAM model code is available from PR upon request.
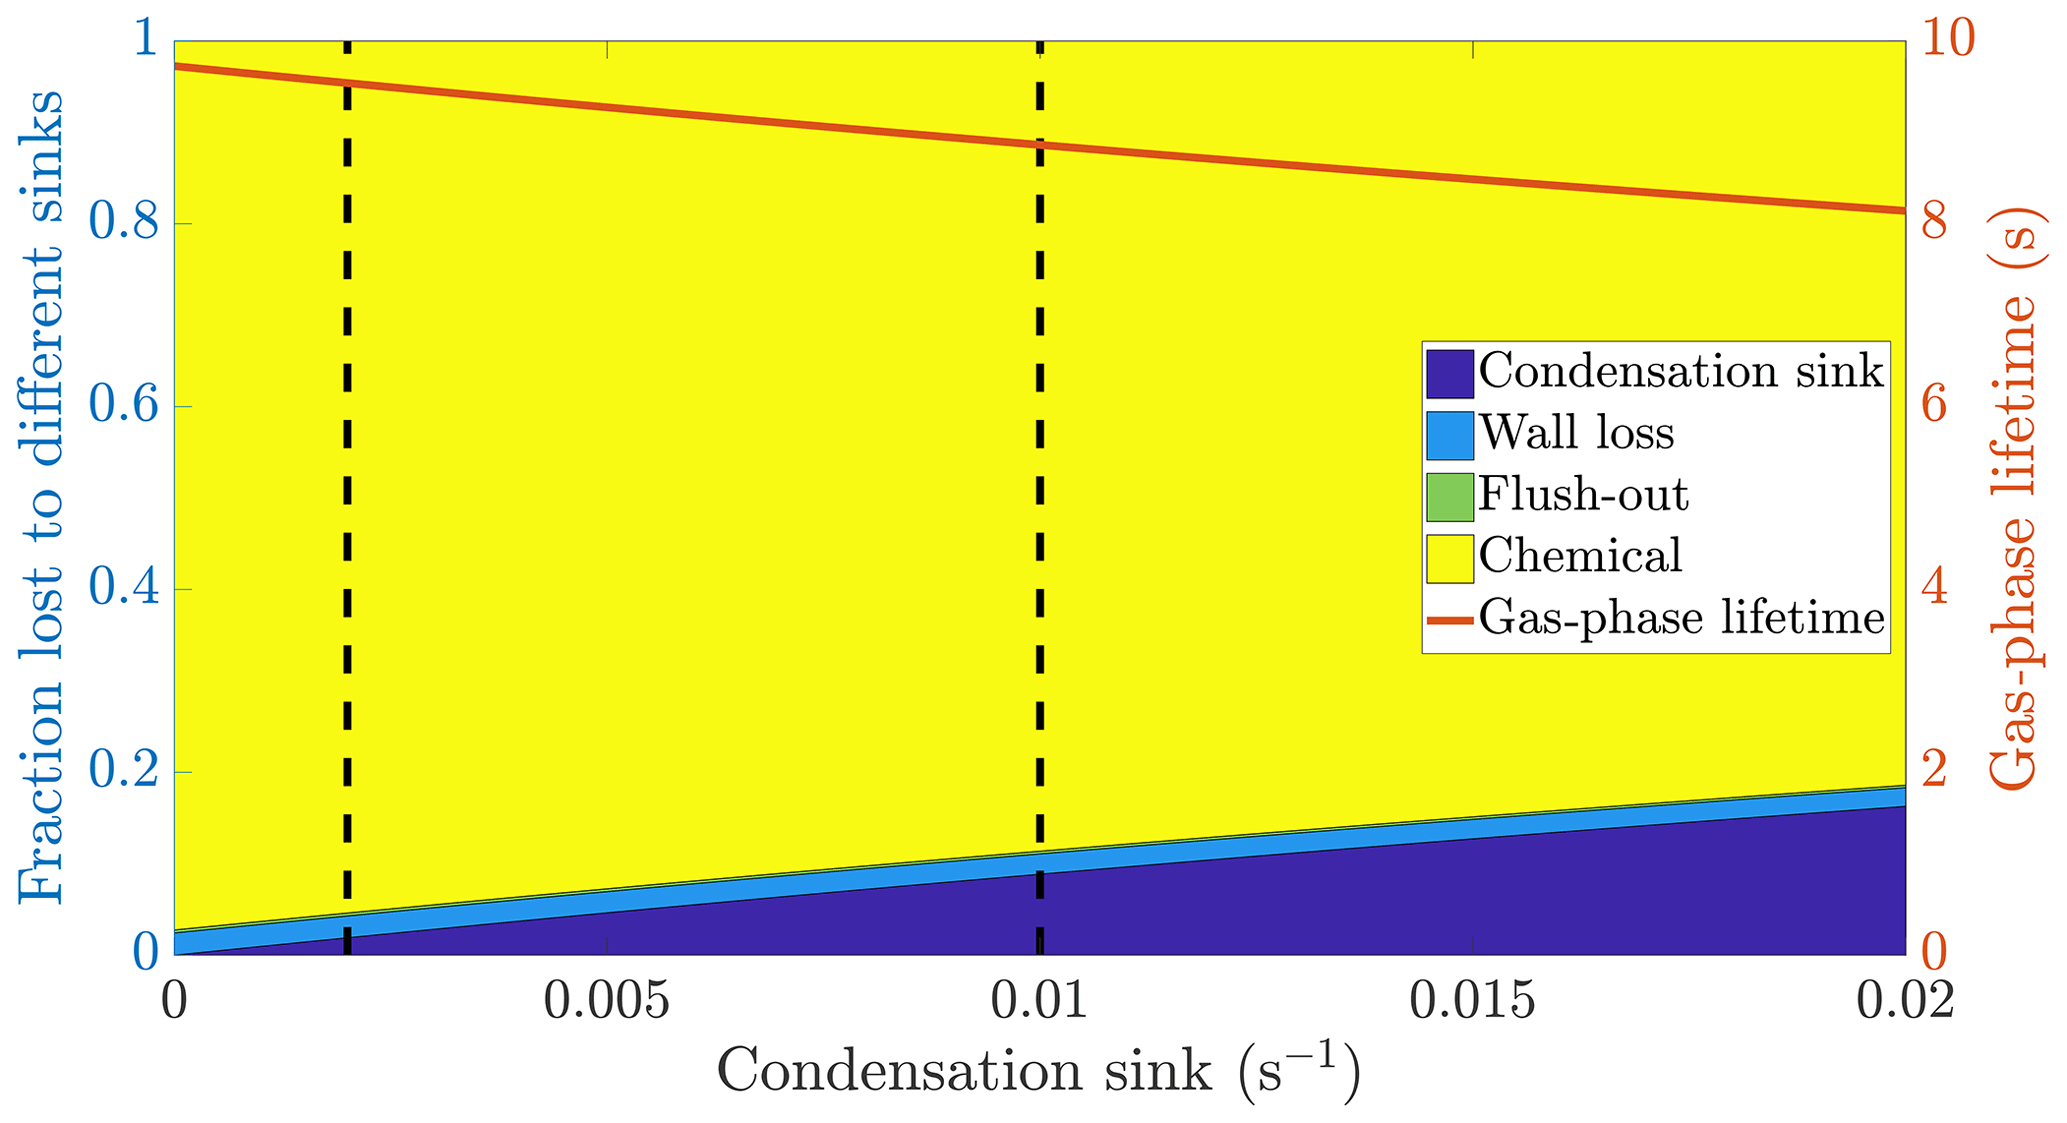
Figure A1The calculated fraction of RO2 radicals lost to different sinks, and their total lifetime in the gas phase as a function of the condensation sink caused by aerosol particles in the chamber. The chemical lifetime of RO2 is estimated to be 10 s, and the wall loss lifetime 400 s. The vertical broken lines at 0.002 and 0.01 s−1 represent a typical situation without seed particles and with seed particles respectively.
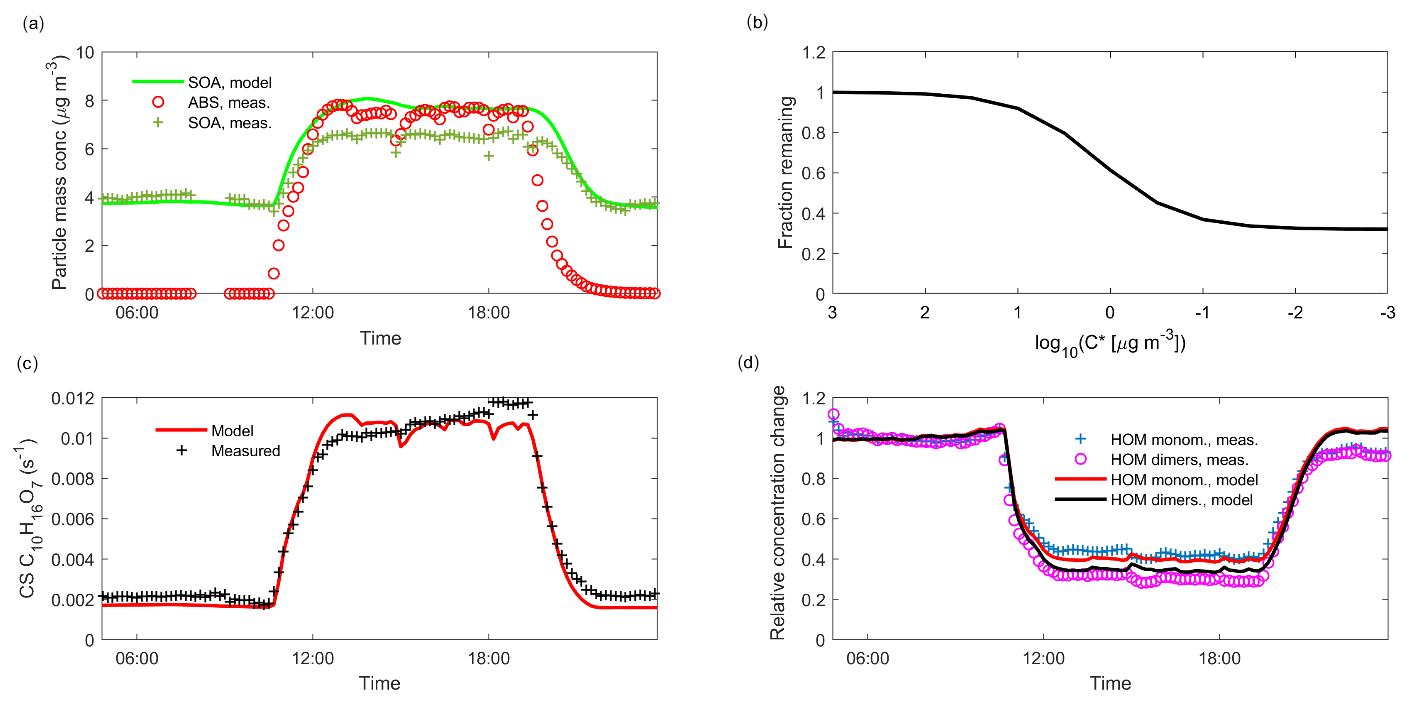
Figure A2Experiment 3 modelled with ADCHAM. (a) the measured and modelled ABS and organic aerosol concentrations. (b) the modelled fraction remaining as a function of saturation vapour concentration. (c) modelled and measured CS for a compound with molecular formula C10H16O7. (d) modelled and measured relative change in the concentration of HOM monomers and dimers. The measured HOM monomers and dimer are represented by the total concentration of molecules in the mass range 290–450 and 452–600 Da (including the ion).
Table A1Overview of experimental conditions. AS: ammonium sulfate; ABS: ammonium bisulfate; eff: effloresced seed; and deli: deliquesced seed. Condensation sinks are calculated for C10H16O7 from the dry size distribution, and listed separately for the steady states before (SS1) and during (SS2) seed injection. For the beginning of experiment 6, the DMPS was malfunctioning and CS is thus not given.

NA – not available
OP, MR and ME designed the study (conceptualization). OP performed the main data analysis and PR the analysis of the ADCHAM model results (formal analysis). ME acquired the funding for the project and OP acquired funding for himself. OP, MR, LH, LQ and ME performed the measurements (investigation). OP, MR and ME came up with the experimental set-up and related analyses, while PR designed the ADCHAM model (methodology). PR developed the ADCHAM model (software). ME supervised the project (supervision). OP verified that the results are consistent across experiments (validation). OP conceptualized and plotted the main text figures (visualization). OP wrote the original draft (writing – original draft). All coauthors read and commented on the manuscript (writing – review and editing).
The authors declare that they have no conflict of interest.
We would like to thank Olga Garmash and Chao Yan for helpful discussions, and Simon Schallhart for help in interpreting the PTR-TOF data. We thank the tofTools team for providing tools for mass spectrometry data analysis.
This research has been supported by the European Research Council (COALA (grant no. 638703)), the Academy of Finland (grant nos. 317380 and 320094), the Svenska Forskningsrådet Formas (grant no. 2018-1745), and the Vilho, Yrjö and Kalle Väisälä Foundation.
Open access funding provided by Helsinki University Library.
This paper was edited by Jacqui Hamilton and reviewed by two anonymous referees.
Aalto, P., Hämeri, K., Becker, E., Weber, R., Salm, J., Mäkelä, J., Hoell, C., O'Dowd, C., Karlsson, H., Hansson, H., Väkevä, M., Koponen, I., Buzorius, G., and Kulmala, M.: Physical characterization of aerosol particles during nucleation events, Tellus Ser. B, 53, 344–358, https://doi.org/10.1034/j.1600-0889.2001.530403.x, 2001. a
Atkinson, R., Aschmann, S. M., Arey, J., and Shorees, B.: Formation of OH radicals in the gas phase reactions of O3 with a series of terpenes, J. Geophys. Res.-Atmos., 97, 6065–6073, https://doi.org/10.1029/92JD00062, 1992. a
Berndt, T., Mentler, B., Scholz, W., Fischer, L., Herrmann, H., Kulmala, M., and Hansel, A.: Accretion Product Formation from Ozonolysis and OH Radical Reaction of α-Pinene: Mechanistic Insight and the Influence of Isoprene and Ethylene, Environ. Sci. Technol., 52, 11069–11077, https://doi.org/10.1021/acs.est.8b02210, 2018a. a
Berndt, T., Scholz, W., Mentler, B., Fischer, L., Herrmann, H., Kulmala, M., and Hansel, A.: Accretion Product Formation from Self- and Cross-Reactions of RO2 Radicals in the Atmosphere, Angew. Chem. Int. Edit, 57, 14, https://doi.org/10.1002/anie.201710989, 2018b. a
Bianchi, F., Tröstl, J., Junninen, H., Frege, C., Henne, S., Hoyle, C. R., Molteni, U., Herrmann, E., Adamov, A., Bukowiecki, N., Chen, X., Duplissy, J., Gysel, M., Hutterli, M., Kangasluoma, J., Kontkanen, J., Kürten, A., Manninen, H. E., Münch, S., Peräkylä, O., Petäjä, T., Rondo, L., Williamson, C., Weingartner, E., Curtius, J., Worsnop, D. R., Kulmala, M., Dommen, J., and Baltensperger, U.: New particle formation in the free troposphere: A question of chemistry and timing, Science, 352, 1109–1112, https://doi.org/10.1126/science.aad5456, 2016. a
Bianchi, F., Kurtén, T., Riva, M., Mohr, C., Rissanen, M. P., Roldin, P., Berndt, T., Crounse, J. D., Wennberg, P. O., Mentel, T. F., Wildt, J., Junninen, H., Jokinen, T., Kulmala, M., Worsnop, D. R., Thornton, J. A., Donahue, N., Kjaergaard, H. G., and Ehn, M.: Highly Oxygenated Organic Molecules (HOM) from Gas-Phase Autoxidation Involving Peroxy Radicals: A Key Contributor to Atmospheric Aerosol, Chem. Rev., 119, 6, https://doi.org/10.1021/acs.chemrev.8b00395, 2019. a, b, c, d, e, f, g, h, i, j, k, l, m, n, o, p, q, r, s
Bilde, M. and Pandis, S. N.: Evaporation Rates and Vapor Pressures of Individual Aerosol Species Formed in the Atmospheric Oxidation of α- and β-Pinene, Environ. Sci. Technol., 35, 3344–3349, https://doi.org/10.1021/es001946b, pMID: 11529575, 2001. a
Crounse, J. D., Nielsen, L. B., Jørgensen, S., Kjaergaard, H. G., and Wennberg, P. O.: Autoxidation of organic compounds in the atmosphere, The J. Phys. Chem. Lett., 4, 3513–3520, https://doi.org/10.1021/jz4019207, 2013. a
Cubison, M. J. and Jimenez, J. L.: Statistical precision of the intensities retrieved from constrained fitting of overlapping peaks in high-resolution mass spectra, Atmos. Meas. Tech., 8, 2333–2345, https://doi.org/10.5194/amt-8-2333-2015, 2015. a
Dal Maso, M., Kulmala, M., Riipinen, I., Wagner, R., Hussein, T., Aalto, P., and Lehtinen, K.: Formation and growth of fresh atmospheric aerosols: eight years of aerosol size distribution data from SMEAR II, Hyytiala, Finland, Boreal Environ. Res., 10, 323–336, 2005. a
DeCarlo, P. F., Kimmel, J. R., Trimborn, A., Northway, M. J., Jayne, J. T., Aiken, A. C., Gonin, M., Fuhrer, K., Horvath, T., Docherty, K. S., Worsnop, D. R., and Jimenez, J. L.: Field-Deployable, High-Resolution, Time-of-Flight Aerosol Mass Spectrometer, Anal. Chem., 78, 8281–8289, https://doi.org/10.1021/ac061249n, 2006. a
Donahue, N. M., Kroll, J. H., Pandis, S. N., and Robinson, A. L.: A two-dimensional volatility basis set – Part 2: Diagnostics of organic-aerosol evolution, Atmos. Chem. Phys., 12, 615–634, https://doi.org/10.5194/acp-12-615-2012, 2012. a, b, c, d, e
Ehn, M., Thornton, J. A., Kleist, E., Sipilä, M., Junninen, H., Pullinen, I., Springer, M., Rubach, F., Tillmann, R., Lee, B., Lopez-Hilfiker, F., Andres, S., Acir, I.-H., Rissanen, M., Jokinen, T., Schobesberger, S., Kangasluoma, J., Kontkanen, J., Nieminen, T., Kurtén, T., Nielsen, L. B., Jørgensen, S., Kjaergaard, H. G., Canagaratna, M., Dal Maso, M., Berndt, T., Petäjä, T., Wahner, A., Kerminen, V.-M., Kulmala, M., Worsnop, D. R., Wildt, J., and Mentel, T. F.: A large source of low-volatility secondary organic aerosol, Nature, 506, 476–479, https://doi.org/10.1038/nature13032, 2014. a, b, c, d, e, f, g, h, i, j, k
Ehn, M., Berndt, T., Wildt, J., and Mentel, T.: Highly Oxygenated Molecules from Atmospheric Autoxidation of Hydrocarbons: A Prominent Challenge for Chemical Kinetics Studies, Int. J. Chem. Kinet., 49, 821–831, https://doi.org/10.1002/kin.21130, 2017. a
Garmash, O., Rissanen, M. P., Pullinen, I., Schmitt, S., Kausiala, O., Tillmann, R., Percival, C., Bannan, T. J., Priestley, M., Hallquist, Å. M., Kleist, E., Kiendler-Scharr, A., Hallquist, M., Berndt, T., McFiggans, G., Wildt, J., Mentel, T., and Ehn, M.: Multi-generation OH oxidation as a source for highly oxygenated organic molecules from aromatics, Atmos. Chem. Phys. Discuss., https://doi.org/10.5194/acp-2019-582, in review, 2019. a, b
Graus, M., Müller, M., and Hansel, A.: High Resolution PTR-TOF: Quantification and Formula Confirmation of VOC in Real Time, J. Am. Soc. Mass Spectr., 21, 1037–1044, https://doi.org/10.1016/j.jasms.2010.02.006, 2010. a
Hallquist, M., Wenger, J. C., Baltensperger, U., Rudich, Y., Simpson, D., Claeys, M., Dommen, J., Donahue, N. M., George, C., Goldstein, A. H., Hamilton, J. F., Herrmann, H., Hoffmann, T., Iinuma, Y., Jang, M., Jenkin, M. E., Jimenez, J. L., Kiendler-Scharr, A., Maenhaut, W., McFiggans, G., Mentel, Th. F., Monod, A., Prévôt, A. S. H., Seinfeld, J. H., Surratt, J. D., Szmigielski, R., and Wildt, J.: The formation, properties and impact of secondary organic aerosol: current and emerging issues, Atmos. Chem. Phys., 9, 5155–5236, https://doi.org/10.5194/acp-9-5155-2009, 2009. a
Jenkin, M. E., Saunders, S. M., and Pilling, M. J.: The tropospheric degradation of volatile organic compounds: a protocol for mechanism development, Atmos. Environ., 31, 81–104, https://doi.org/10.1016/S1352-2310(96)00105-7, 1997. a
Jimenez, J., Canagaratna, M., Donahue, N., Prevot, A., Zhang, Q., Kroll, J., P., D., Allan, J., Coe, H., Ng, N., Aiken, A., Docherty, K., Ulbrich, I., Grieshop, A., Robinson, A., Duplissy, J., Smith, J., Wilson, K., Lanz, V., Hueglin, C., Sun, Y., Tian, J., Laaksonen, A., Raatikainen, T., Rautiainen, J., Vaattovaara, P., Ehn, M., Kulmala, M., Tomlinson, J., Collins, D., Cubison, M., E., E., Dunlea, J., Huffman, J., Onasch, T., Alfarra, M., Williams, P., Bower, K., Kondo, Y., Schneider, J., Drewnick, F., Borrmann, S., Weimer, S., Demerjian, K., Salcedo, D., Cottrell, L., Griffin, R., Takami, A., Miyoshi, T., Hatakeyama, S., Shimono, A., Sun, J., Zhang, Y., Dzepina, K., Kimmel, J., Sueper, D., Jayne, J., Herndon, S., Trimborn, A., Williams, L., Wood, E., Middlebrook, A., Kolb, C., Baltensperger, U., and Worsnop, D.: Evolution of Organic Aerosols in the Atmosphere, Science, 326, 1525–1529, https://doi.org/10.1126/science.1180353, 2009. a
Jokinen, T., Sipilä, M., Junninen, H., Ehn, M., Lönn, G., Hakala, J., Petäjä, T., Mauldin III, R. L., Kulmala, M., and Worsnop, D. R.: Atmospheric sulphuric acid and neutral cluster measurements using CI-APi-TOF, Atmos. Chem. Phys., 12, 4117–4125, https://doi.org/10.5194/acp-12-4117-2012, 2012. a, b
Jokinen, T., Sipilä, M., Richters, S., Kerminen, V.-M., Paasonen, P., Stratmann, F., Worsnop, D., Kulmala, M., Ehn, M., Herrmann, H., and Berndt, T.: Rapid autoxidation forms highly oxidized RO2 radicals in the atmosphere, Angew. Chem. Int. Edit., 53, 14596–14600, https://doi.org/10.1002/anie.201408566, 2014. a
Junninen, H., Ehn, M., Petäjä, T., Luosujärvi, L., Kotiaho, T., Kostiainen, R., Rohner, U., Gonin, M., Fuhrer, K., Kulmala, M., and Worsnop, D. R.: A high-resolution mass spectrometer to measure atmospheric ion composition, Atmos. Meas. Tech., 3, 1039–1053, https://doi.org/10.5194/amt-3-1039-2010, 2010. a
Kirkby, J., Duplissy, J., Sengupta, K., Frege, C., Gordon, H., Williamson, C., Heinritzi, M., Simon, M., Yan, C., Almeida, J., Tröstl, J., Nieminen, T., Ortega, I. K., Wagner, R., Adamov, A., Amorim, A., Bernhammer, A.-K., Bianchi, F., Breitenlechner, M., Brilke, S., Chen, X., Craven, J., Dias, A., Ehrhart, S., Flagan, R. C., Franchin, A., Fuchs, C., Guida, R., Hakala, J., Hoyle, C. R., Jokinen, T., Junninen, H., Kangasluoma, J., Kim, J., Krapf, M., Kürten, A., Laaksonen, A., Lehtipalo, K., Makhmutov, V., Mathot, S., Molteni, U., Onnela, A., Peräkylä, O., Piel, F., Petäjä, T., Praplan, A. P., Pringle, K., Rap, A., Richards, N. A. D., Riipinen, I., Rissanen, M. P., Rondo, L., Sarnela, N., Schobesberger, S., Scott, C. E., Seinfeld, J. H., Sipilä, M., Steiner, G., Stozhkov, Y., Stratmann, F., Tomé, A., Virtanen, A., Vogel, A. L., Wagner, A. C., Wagner, P. E., Weingartner, E., Wimmer, D., Winkler, P. M., Ye, P., Zhang, X., Hansel, A., Dommen, J., Donahue, N. M., Worsnop, D. R., Baltensperger, U., Kulmala, M., Carslaw, K. S., and Curtius, J.: Ion-induced nucleation of pure biogenic particles, Nature, 533, 521–526, https://doi.org/10.1038/nature17953, 2016. a
Krechmer, J., Pagonis, D., Ziemann, P., and Jimenez, J.: Quantification of Gas-Wall Partitioning in Teflon Environmental Chambers Using Rapid Bursts of Low-Volatility Oxidized Species Generated in Situ, Environ. Sci. Technol., 50, 5757–5765, https://doi.org/10.1021/acs.est.6b00606, 2016. a
Kroll, J. H. and Seinfeld, J. H.: Chemistry of secondary organic aerosol: Formation and evolution of low-volatility organics in the atmosphere, Atmos. Environ., 42, 3593–3624, https://doi.org/10.1016/j.atmosenv.2008.01.003, 2008. a, b, c
Kurtén, T., Tiusanen, K., Roldin, P., Rissanen, M., Luy, J., Boy, M., Ehn, M., and Donahue, N.: α-Pinene Autoxidation Products May Not Have Extremely Low Saturation Vapor Pressures Despite High O:C Ratios, J. Phys. Chem., 120, 2569–2582, https://doi.org/10.1021/acs.jpca.6b02196, 2016. a, b, c, d, e, f, g, h, i, j, k, l, m, n
Matsunaga, A. and Ziemann, P. J.: Gas-Wall Partitioning of Organic Compounds in a Teflon Film Chamber and Potential Effects on Reaction Product and Aerosol Yield Measurements, Aerosol Sci. Tech., 44, 881–892, https://doi.org/10.1080/02786826.2010.501044, 2010. a, b, c
Mentel, T. F., Springer, M., Ehn, M., Kleist, E., Pullinen, I., Kurtén, T., Rissanen, M., Wahner, A., and Wildt, J.: Formation of highly oxidized multifunctional compounds: autoxidation of peroxy radicals formed in the ozonolysis of alkenes – deduced from structure–product relationships, Atmos. Chem. Phys., 15, 6745–6765, https://doi.org/10.5194/acp-15-6745-2015, 2015. a
Pankow, J. F. and Asher, W. E.: SIMPOL.1: a simple group contribution method for predicting vapor pressures and enthalpies of vaporization of multifunctional organic compounds, Atmos. Chem. Phys., 8, 2773–2796, https://doi.org/10.5194/acp-8-2773-2008, 2008. a, b, c, d
Paulson, S. E. and Orlando, J. J.: The reactions of ozone with alkenes: An important source of HOx in the boundary layer, Geophys. Res. Lett., 23, 3727–3730, https://doi.org/10.1029/96GL03477, 1996. a
Peräkylä, O: Data for “Experimental investigation into the volatilities of highly oxygenated organic molecules (HOM)” [Data set], Zenodo, https://doi.org/10.5281/zenodo.3545875, 2019. a
Riva, M., Heikkinen, L., Bell, D., Peräkylä, O., Zha, Q., Schallhart, S., Rissanen, M., Imre, D., Petäjä, T., Thornton, J., Zelenyuk, A., and Ehn, M.: Chemical transformations in monoterpene-derived organic aerosol enhanced by inorganic composition, Npj Clim. Atmospheric Sci., 2, 2, https://doi.org/10.1038/s41612-018-0058-0, 2019. a, b, c, d, e
Roldin, P., Eriksson, A. C., Nordin, E. Z., Hermansson, E., Mogensen, D., Rusanen, A., Boy, M., Swietlicki, E., Svenningsson, B., Zelenyuk, A., and Pagels, J.: Modelling non-equilibrium secondary organic aerosol formation and evaporation with the aerosol dynamics, gas- and particle-phase chemistry kinetic multilayer model ADCHAM, Atmos. Chem. Phys., 14, 7953–7993, https://doi.org/10.5194/acp-14-7953-2014, 2014. a
Roldin, P., Ehn, M., Kurtén, T., Olenius, T., Rissanen, M. P., Sarnela, N., Elm, J., Rantala, P., Hao, L., Hyttinen, N., Heikkinen, L., Worsnop, D. R., Pichelstorfer, L., Xavier, C., Clusius, P., Öström, E., Petäjä, T., Kulmala, M., Vehkamäki, H., Virtanen, A., Riipinen, I., and Boy, M.: The role of highly oxygenated organic molecules in the Boreal aerosol-cloud-climate system, Nat. Commun., 10, 4370, https://doi.org/10.1038/s41467-019-12338-8, 2019. a
Salo, K., Jonsson, Å. M., Andersson, P. U., and Hallquist, M.: Aerosol Volatility and Enthalpy of Sublimation of Carboxylic Acids, J. Phys. Chem. A, 114, 4586–4594, https://doi.org/10.1021/jp910105h, 2010. a
Saunders, S. M., Jenkin, M. E., Derwent, R. G., and Pilling, M. J.: Protocol for the development of the Master Chemical Mechanism, MCM v3 (Part A): tropospheric degradation of non-aromatic volatile organic compounds, Atmos. Chem. Phys., 3, 161–180, https://doi.org/10.5194/acp-3-161-2003, 2003. a
Shrivastava, M., Cappa, C. D., Fan, J., Goldstein, A. H., Guenther, A. B., Jimenez, J. L., Kuang, C., Laskin, A., Martin, S. T., Ng, N. L., Petäjä, T., Pierce, J. R., Rasch, P. J., Roldin, P., Seinfeld, J. H., Shilling, J., Smith, J. N., Thornton, J. A., Volkamer, R., Wang, J., Worsnop, D. R., Zaveri, R. A., Zelenyuk, A., and Zhang, Q.: Recent advances in understanding secondary organic aerosol: Implications for global climate forcing, Rev. Geophys., 55, 509–559, https://doi.org/10.1002/2016RG000540, 2017. a
Tang, M. J., Shiraiwa, M., Pöschl, U., Cox, R. A., and Kalberer, M.: Compilation and evaluation of gas phase diffusion coefficients of reactive trace gases in the atmosphere: Volume 2. Diffusivities of organic compounds, pressure-normalised mean free paths, and average Knudsen numbers for gas uptake calculations, Atmos. Chem. Phys., 15, 5585–5598, https://doi.org/10.5194/acp-15-5585-2015, 2015. a, b
Tröstl, J., Chuang, W. K., Gordon, H., Heinritzi, M., Yan, C., Molteni, U., Ahlm, L., Frege, C., Bianchi, F., Wagner, R., Simon, M., Lehtipalo, K., Williamson, C., Craven, J. S., Duplissy, J., Adamov, A., Almeida, J., Bernhammer, A.-K., Breitenlechner, M., Brilke, S., Dias, A., Ehrhart, S., Flagan, R. C., Franchin, A., Fuchs, C., Guida, R., Gysel, M., Hansel, A., Hoyle, C. R., Jokinen, T., Junninen, H., Kangasluoma, J., Keskinen, H., Kim, J., Krapf, M., Kürten, A., Laaksonen, A., Lawler, M., Leiminger, M., Mathot, S., Möhler, O., Nieminen, T., Onnela, A., Petäjä, T., Piel, F. M., Miettinen, P., Rissanen, M. P., Rondo, L., Sarnela, N., Schobesberger, S., Sengupta, K., Sipilä, M., Smith, J. N., Steiner, G., Tomè, A., Virtanen, A., Wagner, A. C., Weingartner, E., Wimmer, D., Winkler, P. M., Ye, P., Carslaw, K. S., Curtius, J., Dommen, J., Kirkby, J., Kulmala, M., Riipinen, I., Worsnop, D. R., Donahue, N. M., and Baltensperger, U.: The role of low-volatility organic compounds in initial particle growth in the atmosphere, Nature, 533, 527–531, https://doi.org/10.1038/nature18271, 2016. a, b, c, d, e, f, g, h
Vereecken, L. and Francisco, J.: Theoretical studies of atmospheric reaction mechanisms in the troposphere, Chem. Soc. Rev., 41, 6259–6293, https://doi.org/10.1039/c2cs35070j, 2012. a, b
Yan, C., Nie, W., Äijälä, M., Rissanen, M. P., Canagaratna, M. R., Massoli, P., Junninen, H., Jokinen, T., Sarnela, N., Häme, S. A. K., Schobesberger, S., Canonaco, F., Yao, L., Prévôt, A. S. H., Petäjä, T., Kulmala, M., Sipilä, M., Worsnop, D. R., and Ehn, M.: Source characterization of highly oxidized multifunctional compounds in a boreal forest environment using positive matrix factorization, Atmos. Chem. Phys., 16, 12715–12731, https://doi.org/10.5194/acp-16-12715-2016, 2016. a
Zhang, Q., Jimenez, J. L., Canagaratna, M. R., Allan, J. D., Coe, H., Ulbrich, I., Alfarra, M. R., Takami, A., Middlebrook, A. M., Sun, Y. L., Dzepina, K., Dunlea, E., Docherty, K., DeCarlo, P. F., Salcedo, D., Onasch, T., Jayne, J. T., Miyoshi, T., Shimono, A., Hatakeyama, S., Takegawa, N., Kondo, Y., Schneider, J., Drewnick, F., Borrmann, S., Weimer, S., Demerjian, K., Williams, P., Bower, K., Bahreini, R., Cottrell, L., Griffin, R. J., Rautiainen, J., Sun, J. Y., Zhang, Y. M., and Worsnop, D. R.: Ubiquity and dominance of oxygenated species in organic aerosols in anthropogenically-influenced Northern Hemisphere midlatitudes, Geophys. Res. Lett., 34, l13801, https://doi.org/10.1029/2007GL029979,2007. a