the Creative Commons Attribution 4.0 License.
the Creative Commons Attribution 4.0 License.
 | 05 Jun 2020
The mechanisms and seasonal differences of the impact of aerosols on daytime surface urban heat island effect
Wenchao Han
Fang Wu
Yuwei Zhang
Jianping Guo
Tianning Su
Maureen Cribb
Jiwen Fan
Tianmeng Chen
Seoung-Soo Lee
The urban heat island intensity (UHII) is the temperature difference between urban areas and their rural surroundings. It is commonly attributed to changes in the underlying surface structure caused by urbanization. Air pollution caused by aerosol particles can affect the UHII through changing (1) the surface energy balance by the aerosol radiative effect (ARE) and (2) planetary-boundary-layer (PBL) stability and airflow intensity by modifying thermodynamic structure, which is referred to as the aerosol dynamic effect (ADE). By analyzing satellite data and ground-based observations collected from 2001 to 2010 at 35 cities in China and using the WRF-Chem model, we find that the impact of aerosols on UHII differs considerably: reducing the UHII in summer but increasing the UHII in winter. This seasonal contrast is proposed to be caused by the different strengths of the ARE and ADE between summer and winter. In summer, the ARE on UHII is dominant over the ADE, cooling down surface temperature more strongly in urban areas than in rural areas because of much higher aerosol loading, and offsets the urban heating, therefore weakening UHII. In winter, however, the ADE is more dominant, because aerosols stabilize the PBL more in the polluted condition, weakening the near-surface heat transport over urban areas in both vertical and horizontal directions. This means that the heat accumulated in urban areas is dispersed less effectively, and thus the UHII is enhanced. These findings shed new light on the impact of the interaction between urbanization-induced surface changes and air pollution on urban climate.
- Article
(8593 KB) - Full-text XML
-
Supplement
(2358 KB) - BibTeX
- EndNote


The global population has been increasingly concentrated in cities (Heilig, 2012). Urbanization in China has dramatically increased from 26 % in 1990 to 60 % in 2018, resulting in a marked change in the landscape. It has a significant impact on the urban and rural climate and will continue to make an impact as cities continue to develop (Han et al., 2014; Ren, 2015). Urbanization leads to a dramatic change in the underlying surface structure, properties, and spatial distribution of a city, such as a reduction in green areas and a corresponding increase in urban impervious areas. These changes increase the temperature difference between urban and rural areas, known as the urban heat island (UHI) intensity (UHII) (e.g., Kalnay and Cai, 2003; Zhao et al., 2014, 2016; Zhou et al., 2016; Yang et al., 2017). While the UHI mainly involves surface and atmospheric UHIs, this study focuses on surface UHI. The UHI also affects the structure and movement of cloud systems (Changnon and Westcott, 2002; Kug and Ahn, 2013; Pinto et al., 2013). Many factors affect the diurnally and seasonally varying UHI, such as weather and climatic regimes, urban impervious surfaces, anthropogenic heat, air pollution, and urban 3-D structure (Oke, 1982; Morris and Simmonds, 2000; Kim and Baik, 2002; Gedzelman et al., 2003; Ryu and Baik, 2012; Ding et al., 2016; Y. Yang et al., 2019).
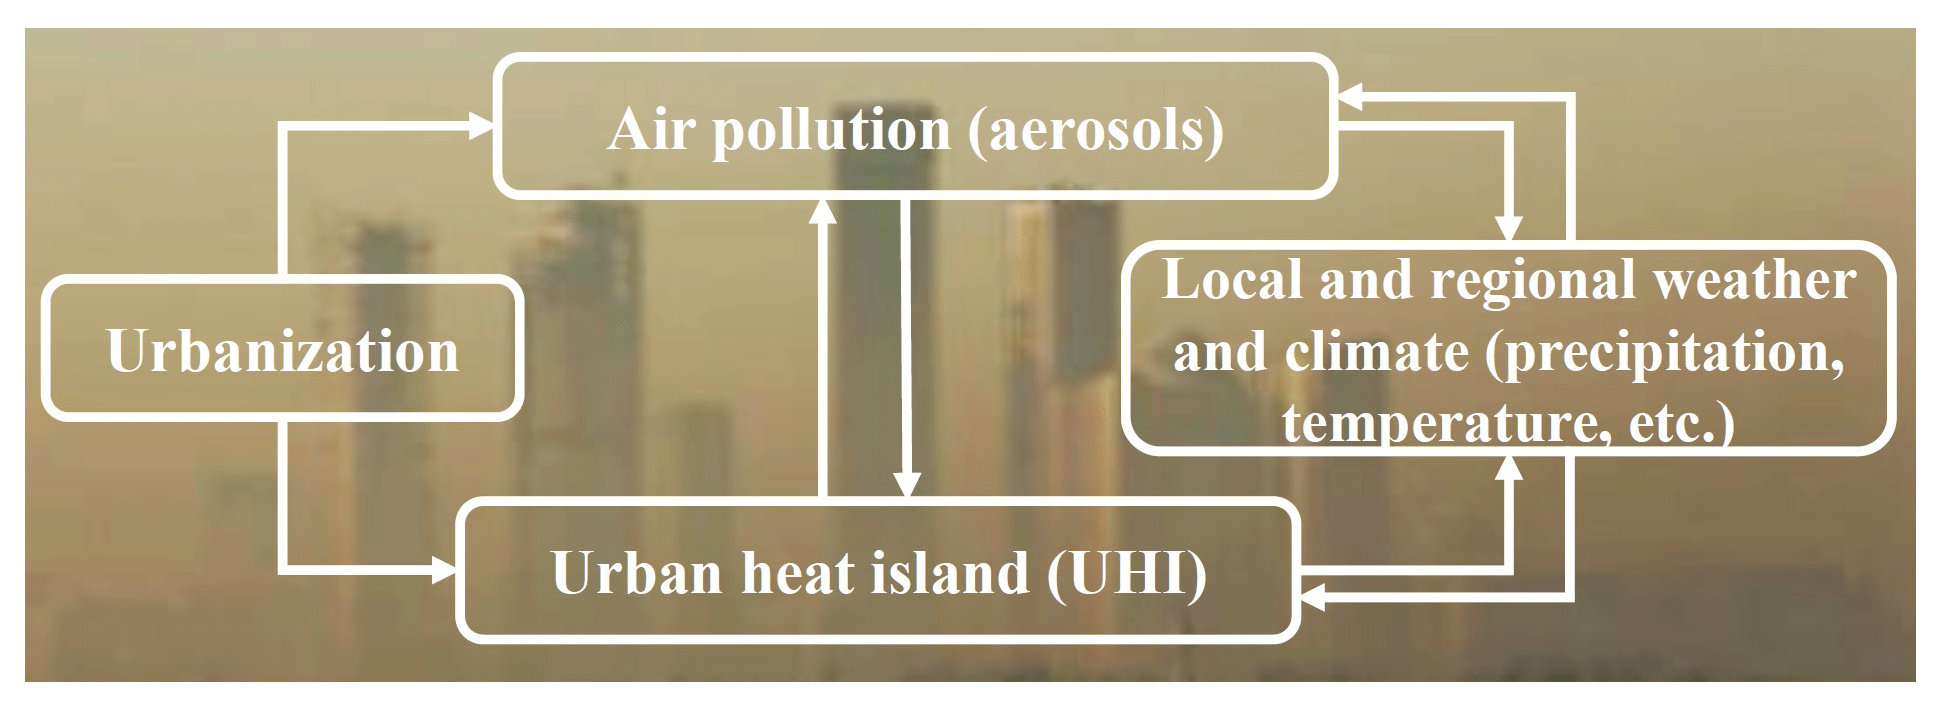
Figure 1Illustration of the relationship between urbanization, urban heat island, aerosols, local and regional weather, and climate. Solid arrows denote the effect.
It is well established that cities are the largest sources of anthropogenic heat emissions as by-products of industrial and human activities. Human activities can also generate large amounts of aerosols that can reduce air quality, change the physical and chemical properties of the atmosphere, and endanger human health (Sanap and Pandithurai, 2015; Cohen et al., 2017; Wei et al., 2019a, b, 2020). Aerosols can also alter the radiation balance of the climate system. Their thermodynamic effect reduces the amount of radiation reaching the ground, and their microphysical effect can influence cloud properties and precipitation regimes through their impacts on cloud microphysical and dynamic processes (Rosenfeld et al., 2008; Li et al., 2011, 2016, 2019; Fan et al., 2013; Guo et al., 2018; Liu et al., 2019). Aerosols can increase cloudiness and cloud thickness and thus change the stability of the planetary boundary layer (PBL). In humid regions, aerosols may reduce the frequency of light rain but increase heavy rainfall, while in dry areas, aerosols aggravate droughts. Aerosols can also intensify convection by delaying the occurrence of convection and enhancing gust fronts (Khain et al., 2005; Carrió et al., 2010; Carrió and Cotton, 2011; Wang et al., 2011; Han et al., 2012; Lee and Feingold, 2013; Guo et al., 2016a; Li et al., 2017b). The effect of urbanization on clouds and precipitation has also been the focus of many studies (Changnon et al., 1977; Ackerman et al., 1978; Changnon et al., 1991; Shepherd et al., 2002; Shepherd and Burian, 2003). With increasing urbanization in the future, cities are likely to influence local and regional weather and climate to greater and greater degrees.
UHI, surface roughness, and higher aerosol concentrations have been proposed to explain observed urban clouds and precipitation anomalies. Increased urban surface roughness likely does not play a major role in urban-area-induced precipitation. Rather, UHI and higher aerosol concentrations may play more important roles (Han et al., 2014). The UHI can alter the water vapor flux (accelerate evaporation), reduce horizontal wind speeds and enhance vertical turbulence, reduce the temperature difference between daytime and nighttime, increase the absorption rate of solar radiation by land, and change underlying surface characteristics (e.g., sensible heat dissipation, convection efficiency, evaporation and cooling, sunlight reflection, and anthropogenic heat transfer) (Jáuregui and Romales, 1996; Taha, 1997; Bornstein and Lin, 2000; Givati and Rosenfeld, 2004; Grimmond, 2007; Carrió et al., 2010; Zhao et al., 2014; Skougaard Kaspersen et al., 2015; B. Yang et al., 2019).
The UHI and aerosols may interact over cities. Aerosols generally reflect and absorb solar radiation and reduce the amount of shortwave radiation reaching the ground, i.e., the cooling effect of aerosols on ground temperature. Some numerical modeling studies have demonstrated that landscape changes reduce near-surface concentrations of particulate matter (PM2.5) and that the UHI effect can influence the dispersion of air pollutants (Liu et al., 2009; Liao et al., 2015; Tao et al., 2015; Zhong et al., 2017, 2018). Moreover, aerosols can enhance the UHI at night in semi-arid cities (by 0.7±0.3 K), and the UHI alters aerosol concentrations (Cao et al., 2016; Fallmann et al., 2016; Lai, 2016). Heavy pollution can reduce UHII in China, especially during the day (Wu et al., 2017; Zheng et al., 2018; Yang et al., 2020).
The Weather Research and Forecasting coupled with Chemistry (WRF-Chem) model has been used extensively in the simulation and prediction of air quality, the aerosol radiation effect, aerosol–cloud interactions, and changes in meteorological fields and regional climate (Grell et al., 2005; Chapman et al., 2009). Coupled with the urban-canopy model, WRF-Chem can account for the influences of aerosols and land surface changes on radiative processes if such parameters are fed to the model, e.g., aerosol loading and single-scattering albedo, surface albedo, thermal emissivity, and roughness, among others (Miao et al., 2009; Chen et al., 2011). Many pertinent studies done to date focused on annual effects without investigating any seasonal differences and the underlying mechanism. This study aims to fill this gap by analyzing the annual and seasonal effects of aerosols on UHII and proposing mechanisms that may explain the seasonal differences.
2.1 Data
Data used in this study include the Land Satellite Thematic Mapper and Enhanced Thematic Mapper (Landsat TM/ETM+) and Moderate Resolution Imaging Spectroradiometer (MODIS) products (including land surface temperature – LST – and aerosol optical depth – AOD), ground-based data from meteorological stations, PM2.5 concentrations, and sounding data.
Landsat data are used to identify and outline urban areas and urban contours. The spatial resolution is 30 m. Summertime (June, July, and August) images before or in 2000 and in 2015 were examined to ensure the accuracy and consistency of the results.
The MODIS LST product (MYD11A1/A2) at a 1 km spatial resolution was used to calculate urban and rural UHIIs. Since this study is mainly focused on the daytime UHI effect, only data (daily and 8 d clear-sky LST observations with a 1 km spatial resolution) at 13:30 Beijing time (BJT) for the period 2001–2015 were used. The MYD11A2 product uses the MODIS cloud mask product (MYD35) to filter out cloudy conditions. A generalized split-window algorithm is applied using MODIS data from two longwave bands in the atmospheric window to correct for atmospheric water vapor, haze effects, and the sensitivity to errors in the surface emissivity. Changes in surface emissivity have been taken into account to obtain the LST from brightness temperatures (Wan and Dozier, 1996; Snyder et al., 1998; Wang and Liang, 2009; Yu et al., 2011; Cao et al., 2016).
The MODIS Multi-Angle Implementation of Atmospheric Correction (MAIAC) AOD product, with a 1 km spatial resolution and global coverage, is used. This product was retrieved by virtue of a time series analysis and a combination of pixel- and image-based processing to improve the accuracies of cloud detection, aerosol retrievals, and atmospheric correction (Lyapustin et al., 2011a, b, 2012).
A large volume of meteorological data are analyzed, including visibility, surface wind speed, temperature, precipitation, and other parameters every 3 h, together with hourly PM2.5 data in urban and surrounding rural areas. Figure S1 in the Supplement shows the spatial distribution of the meteorological stations. For consistency with the satellite imaging time (13:30 BJT), meteorological data and PM2.5 data observed at 13:00 and 14:00 BJT were selected. Due to the lack of long-term records of aerosol concentration, visibility is frequently used as a proxy for aerosol loading (Wang et al., 2009; Wu et al., 2012; Yang et al., 2013).
Validation using Aerosol Robotic Network AOD retrievals shows that the MAIAC and MODIS aerosol retrieval algorithms have similar accuracies over dark and vegetated surfaces and that the MAIAC algorithm generally improves the accuracies of AOD retrievals over bright surfaces such as deserts and urban surfaces (Lyapustin et al., 2011a, b, 2012; Wei et al., 2019c; Zhang et al., 2019). Sounding data and PM2.5 measurements were available from 2013 to 2015. MAIAC AOD retrievals for each area were averaged to obtain the spatial distribution of AOD over each city; then the difference in AOD between urban and rural areas was calculated.
L-band sounding data were employed, acquired at the five radiosonde stations in Beijing, Chengdu, Nanjing, Shenyang, and Xi'an, operated by the China Meteorological Administration since 2006. They contain high-resolution profiles of temperature, pressure, relative humidity (RH), and wind speed and direction at 08:00 and 20:00 BJT (UTC+8) (Zhang et al., 2018; Lou et al., 2019). The data quality of radiosonde measurements has been well validated, making the data suitable for studying the UHI effect (Guo et al., 2016b).
2.2 Extracting urban impervious surfaces and urban contours
Indices commonly used to extract built-up areas include the difference built-up index (DBI), the index-based built-up index (IBI), and the normalized difference built-up index (NDBI). Another index, the soil-adjusted vegetation index (SAVI), is a modification of the normalized difference vegetation index that corrects for the influence of soil brightness when the vegetative cover is low (Huete, 1988; Qi et al., 1994; Rondeaux et al., 1996). After some tests, the difference NDBI − SAVI was used to extract urban impervious surfaces because of its ability to differentiate urban impervious surfaces from other land-use types:
where L is the soil adjustment factor whose value is 0.5, and ρn is the Landsat reflectance of band n. We then used different thresholds to extract urban impervious surfaces after calculating NDBI − SAVI. Results were verified by Google Earth and a land-use map with a 1 : 100 000 scale from the Data Center for Resources and Environmental Sciences of the Chinese Academy of Sciences.
Many previous studies have extracted urban areas from nighttime stable-light data. However, the spatial resolution of such data is low, so the extraction accuracy would be significantly affected in urban areas with uneven zoning and in regions with irregular urban development, as in most municipalities in China. The TM/ETM+ data were used to accurately extract the physical boundaries of urban areas. The difference in the underlying surfaces of urban and rural areas forms the basis of the urban physical-boundary extraction. Urban surfaces are generally covered by impervious materials, and rural surfaces are mainly covered by natural surfaces. The influence of the UHI is not only felt within the physical boundaries of urban areas but also beyond it. In terms of area, this influence can extend from 2 to 4 times the extent of an urban area. In terms of distance, the influence of the UHI can be felt as far as 3 to 6 km away from an urban physical boundary (Zhou et al., 2015).
For each city, nine research windows (6 km × 6 km each) were selected. The windows include one urban window, four suburban windows, and four rural windows. For the study period considered (2001–2015), the urban window represents an area that remained urban and developed during this time. The suburban windows represent areas that were vegetated before the study period. As cities expanded, these areas were gradually replaced by urban impervious surfaces from 2001 to 2015. The rural windows represent areas that remained vegetated during the study period. These windows were 10 km away from the urban physical boundary to ensure that these windows were not or were weakly affected by the UHI. The elevations of the areas covered by each window are within 100 m of each other for a given city based on DEM (digital elevation model) data. Water bodies are excluded. Figure S2 shows the spatial distribution of the nine research windows for a given city. The UHII is the temperature difference between the average temperature of the urban core window and the average temperature of rural windows, calculated as
where Tu is the average temperature of an urban area, and Tr is the average temperature of the neighboring rural area.
2.3 WRF-Chem model simulations
The model used in this study is WRF-Chem 3.9.1, coupled with a single-layer urban-canopy model. As shown in Fig. S7, the domain has a horizontal grid resolution of 3 km and 50 vertical levels from the surface to 50 hPa. To better characterize the PBL, 16 layers are set below 1 km, where the first layer extends from the surface to ∼47 m over Beijing. The National Centers for Environmental Prediction Final Analysis (NCEP-FNL) data provided meteorological fields with a 6 h temporal frequency and a 1∘ × 1∘ spatial resolution. The Goddard Earth Observing System Chemical model provided the chemical lateral boundary and initial conditions. The IGBP-Modified MODIS 20-category land-use category dataset derived the land cover. Monthly 0.25∘ × 0.25∘ anthropogenic emissions of aerosols and precursors were obtained from the Multi-resolution Emission Inventory for China (MEIC, 2012) (http://www.meicmodel.org, last access: 29 May 2020), providing monthly mean emission data of SO2, NOx, CO, NMVOC, NH3, BC, OC, PM2.5, PM10, and CO2. The Model of Emissions of Gases and Aerosols from Nature provided biogenic emission data (Guenther et al., 2006; Sakulyanontvittaya et al., 2008). The Fire INventory from NCAR model provided the biomass-burning emission data (Wiedinmyer et al., 2011). The Carbon Bond Mechanism version Z chemical mechanism and the Model for Simulating Aerosol Interactions and Chemistry were used in simulations (Zaveri and Peters, 1999; Zaveri et al., 2008). Table S1 in the Supplement summarizes other details of schemes used in the simulations. The simulations are initiated at 12:00 UTC on 30 June 2015 for summer and 12:00 UTC on 1 January 2015 for winter. The meteorological fields are reinitialized every 48 h. We conducted four sets of model experiments (Table S2) to investigate the aerosol radiative impact for both summer and winter: (a) A1Summer with the aerosol radiative effect turned on, (b) A0Summer with the aerosol radiative effect turned off, (c) A1Winter with the aerosol radiative effect turned on, and (d) A0Winter with the aerosol radiative effect turned off. To be consistent with the observation analysis, we select clear-day simulations as the analysis time period by excluding the first 3 d simulation for chemistry spin-up (Table S2).
Selected for the study were 35 large cities evenly distributed across China. Table S3 lists these cities of different sizes. They represent major and well-developed metropolitan regions in China. The population and urban areas of these cities have increased faster and/or more dramatically than those of other cities. We used the difference NDBI − SAVI to extract urban impervious surfaces and then determined urban contours based on the identification of impervious surfaces. Figure 2 shows the urban contours of all cities.
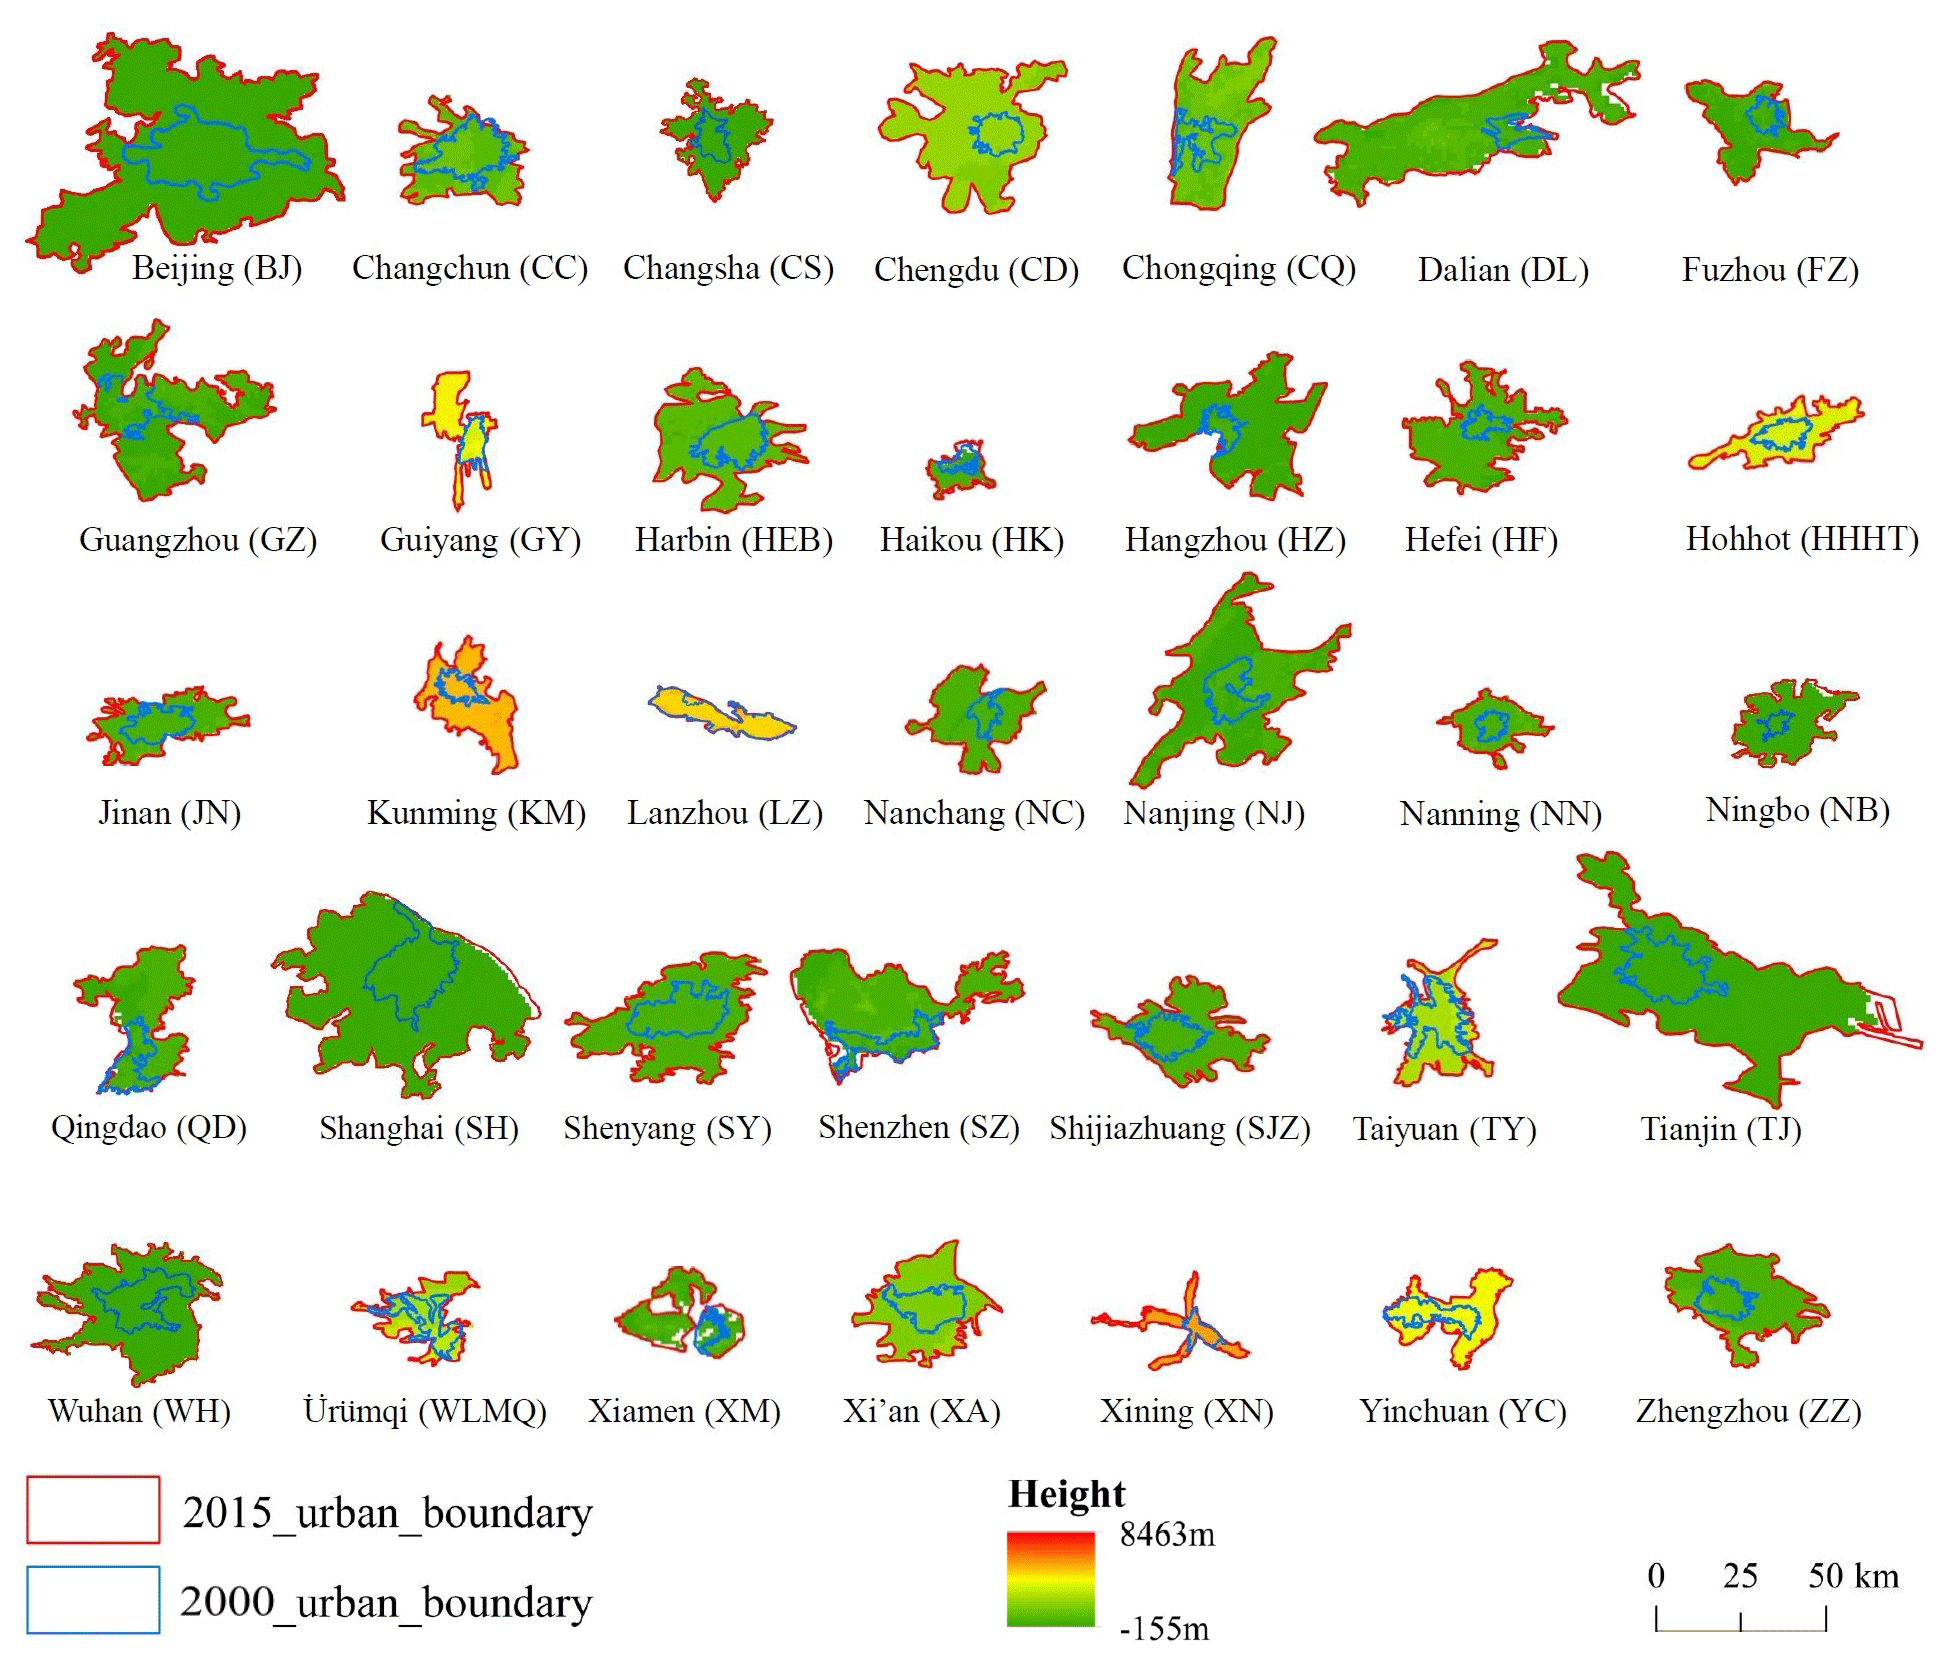
Figure 2Main urban contours of the 35 cities. Blue contours outline urban boundaries before or in 2000, and red contours outline urban boundaries in 2015. The surface height (in meters above sea level) is indicated by colored shading. The short names of all cities were shown in brackets.
Figure S3 shows UHII and visibility trends. UHII and visibility have similar trends in most cities before and after 2008. The trends, however, differ pre- and post-2008. Figure 3 shows the relationships between UHII and visibility based on their respective trends shown in Fig. S3. UHII and visibility are grossly positively correlated. Higher visibility means a lower aerosol concentration, leading to a higher UHII, and vice versa. On the other hand, the two may also change in opposite directions if the expansion of a city is more associated with heavy industry with strong emissions. In such a case, industrial expansion can produce both more aerosol particles, especially secondary aerosols converted from precursor gases, and stronger UHI, but they have no causal relation. This is likely a reason for the diverse relationships between the trends of the two variables. The complication originates from highly different pathways of city expansions among these cities. The overall positive relationships revealed in Fig. 3 attest to the causal relationship, implying that aerosol loading influences the UHII to varying degrees. Also analyzed was the relationship between RH and UHII. Figure 3b shows that there is a positive correlation between RH and UHII, but it is less significant than the correlation between UHII and visibility (p value of visibility > RH). Note that not only these two factors affect UHII. Many other factors affect UHII, but this study mainly focuses on the aerosol effect.

Figure 3(a) Clear-day visibility trend (unit: km yr−1) shown as a function of the UHII trend (K yr−1), and (b) clear-day visibility (unit: km) and relative humidity shown as a function of UHII (unit: K). The period is 2001–2015. The black and green lines are the linear best-fit line through the points. Sample numbers of (a) and (b) are 68 and 510, respectively. The least-squares regression equation is given in each panel. The coefficient correlation (R) and p value are also given, and all of them pass confidence test in 95 %.
To better investigate the effect of aerosols on the UHII, we calculated the UHII under severe air pollution conditions (i.e., visibility less than 8 km) and compared it with the average UHII. On an annual basis (Fig. S4), the UHII under severe air pollution conditions is lower than the average UHII, suggesting that a high aerosol loading will reduce the UHII. In summer (Fig. 4a), the UHI at 29 of the 35 cities is weaker under polluted conditions. In winter (Fig. 4b), however, the majority of cities (27 out of 35) have a stronger UHI under polluted conditions, suggesting that aerosols enhance the UHII in winter.
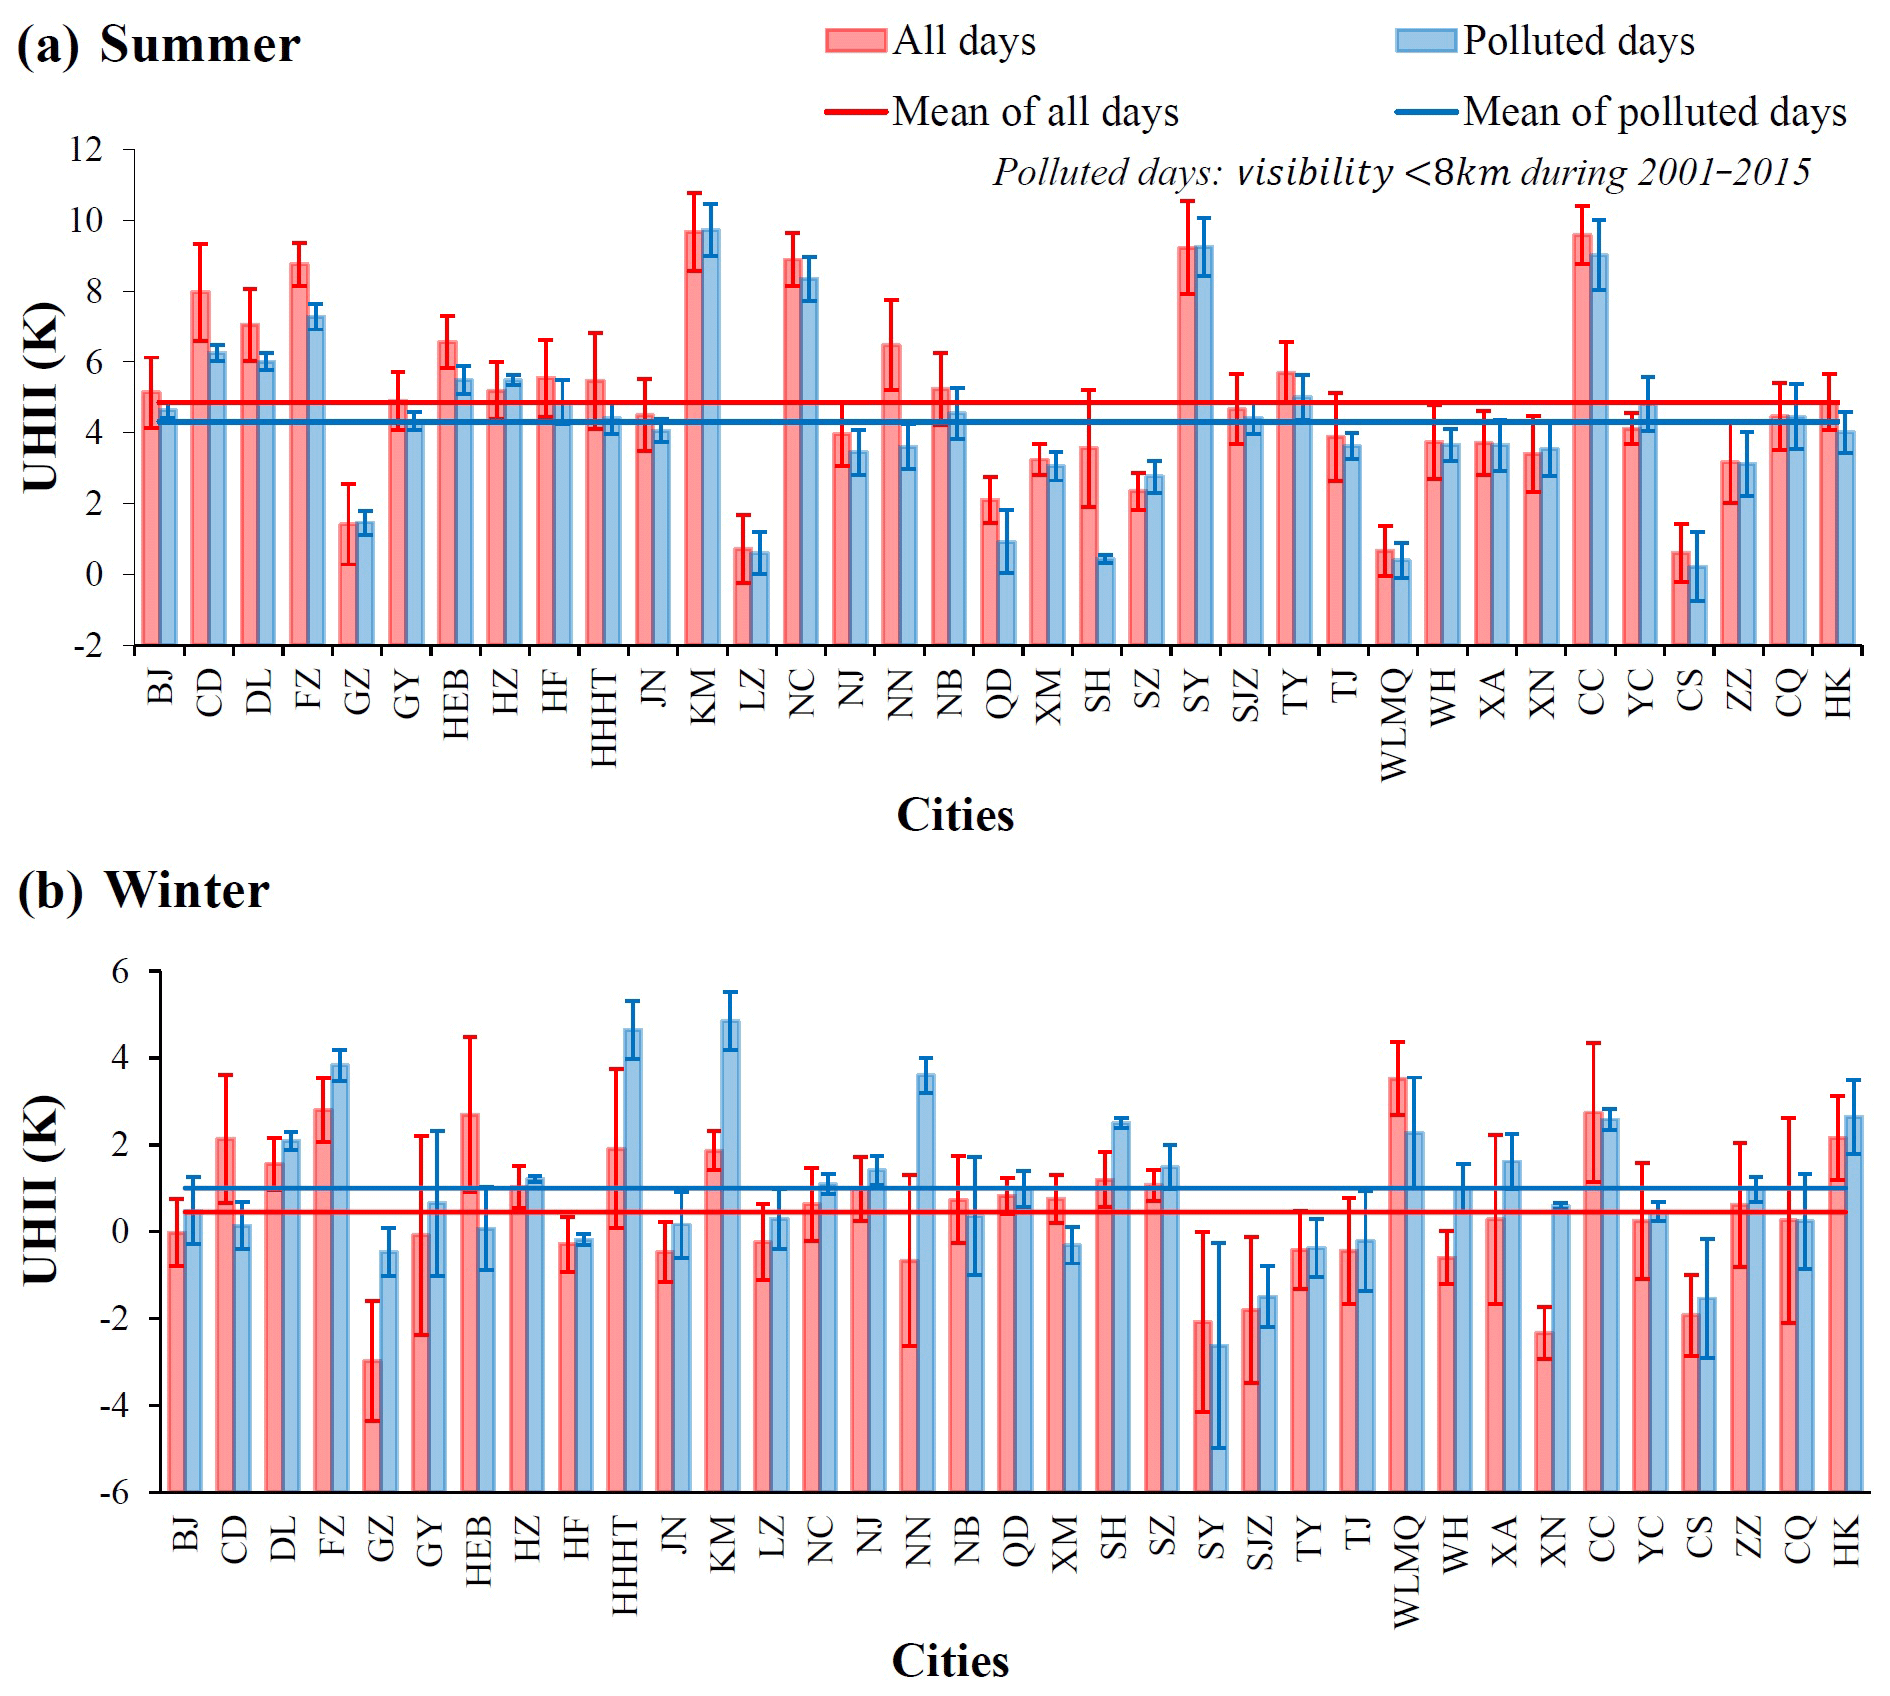
Figure 4The mean UHII (unit: K) at the 35 cities in (a) summer and (b) winter. Red and blue bars represent UHII calculated using data from all days and from polluted days only, respectively. The overall mean UHII calculated using data from all days and from polluted days only is shown as red and blue solid lines, respectively.
4.1 Mechanisms of the aerosol impact on the UHI
Aerosols alter the radiation budget by scattering and absorbing solar radiation (Chýlek and Coakley, 1974; Chýlek and Wong, 1995; Li, 1998). The aerosol radiative effect tends to cool down the surface, warm up the atmosphere, stabilize the PBL, and suppress the dispersion of pollutants in the PBL, incurring positive feedback (Li et al., 2017a). As illustrated in Fig. 5, the UHII may be influenced by both the aerosol radiative effect (ARE) and the suppressed vertical exchange of surface heat fluxes, denoted as the aerosol dynamic effect (ADE) because it is related to turbulent dynamics.
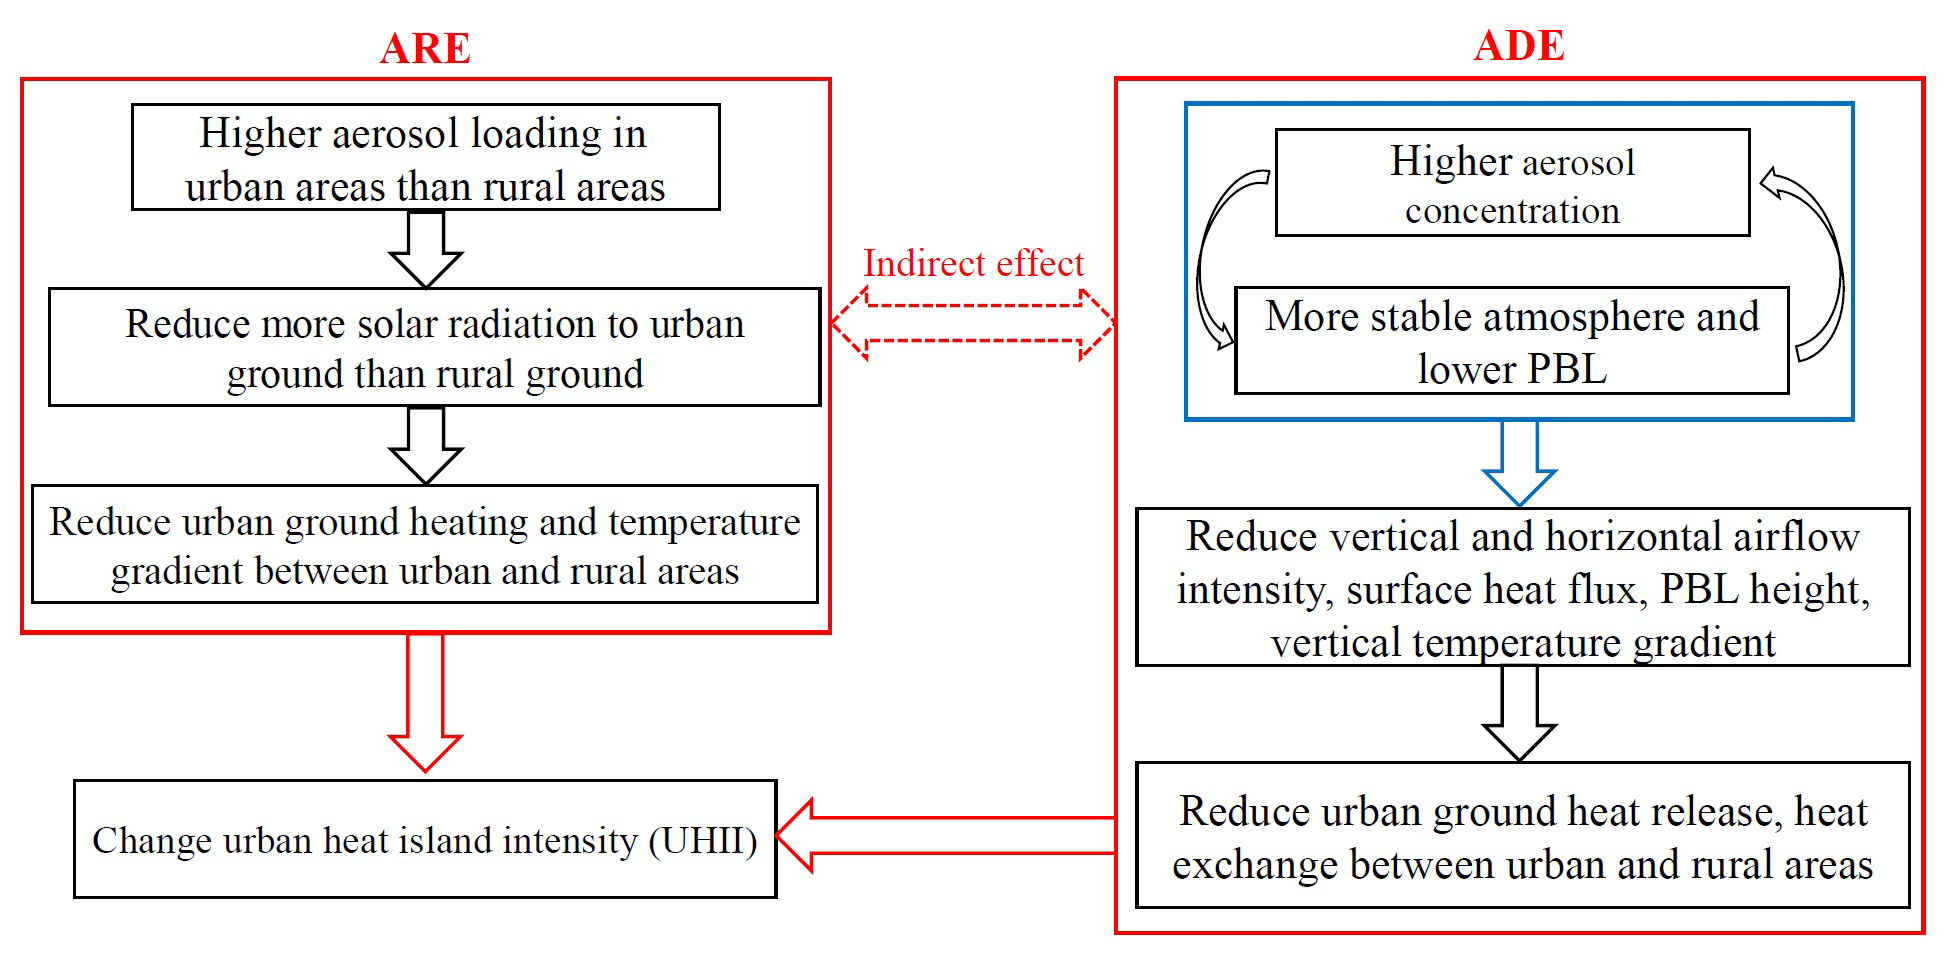
Figure 5Diagram of the mechanisms behind aerosol effects on the UHII. The blue frame contains the processes and interactions between aerosols and the PBL. Red frames contain the processes of the aerosol radiative effect (ARE) and the aerosol dynamic effect (ADE). Solid arrows denote direct effects, while the dashed arrow indicates the indirect effect.
The ARE. The increasing difference of aerosols between the urban and rural areas will reduce more solar radiation to urban ground than rural ground, which influences the rise of the LST because of different aerosol loading and properties between urban and rural areas. The above process reduces the temperature difference between urban and rural areas and thus reduces UHII. This process usually has a negative effect on UHII, and it belongs to aerosol directly radiative effect.
The ADE. On the other hand, an aerosol-induced temperature inversion (especially in winter) within the PBL (Zhang et al., 2014; Li et al., 2015, 2017a) renders a very stable PBL that inhibits vertical and horizontal airflows and surface heat fluxes (latent or sensible heat) between urban areas and rural areas (Petäjä et al., 2016). In addition to a temperature-inversion-induced stable PBL, air pollution is usually accompanied by low wind speeds (particularly < 2 m s−1), also favorable to both heat accumulation and storage. Urban surfaces can store more heat, which affects UHII. This process usually has a positive effect on UHII, and it affects heat exchange mainly through turbulence mixing.
Compared with rural areas, urban impervious surfaces have a low thermal capacity, so their temperatures are thus more sensitive to heat changes. Note that the ARE and ADE are not independent and that there is an indirect effect between them due to potential urban–rural circulations.
4.2 Analyses of influential factors
4.2.1 Analyses for the ARE
Urban–rural differences in air quality. Urban–rural differences in air quality were analyzed by calculating the spatial differences in PM2.5 and AOD under cloudless conditions between urban and rural areas. Their spatial differences between summer and winter were also analyzed.
Measurements of urban PM2.5 concentrations were divided into four categories, namely 0–50, 50–100, 100–150, and > 150 µg m−3, based on urban pollution levels. Figure 6 shows mean urban–rural differences in each PM2.5 concentration bin of all cities. On average, the spatial difference in summer is larger than in winter across all PM2.5 concentration bins. Five zones were selected based on the distance to the urban geometric center of all cities: Zone 1 – 0–10 km, Zone 2 – 11–20 km, Zone 3 – 21–30 km, Zone 4 – 31–40 km, and Zone 5 – 41–50 km. Then the average AOD for each zone was calculated. Figure 7 shows the variation trends of mean AOD as a function of distance from the urban geometrical center of each city in winter and summer. As the distance from the urban geometrical center increases, summertime AODs decrease more rapidly than wintertime AODs. Figures 6 and 7 indicate that the spatial difference in air pollution between urban and rural areas in summer is larger than that in winter. Moreover, in summer, urban pollution is often more serious than rural pollution. In winter, pollution in both urban and, in particular, rural areas is severe. Many factors (e.g., PM2.5 emissions, transportation, and diffusion) may cause the seasonal difference in urban–rural differences (Jiang et al., 2019).
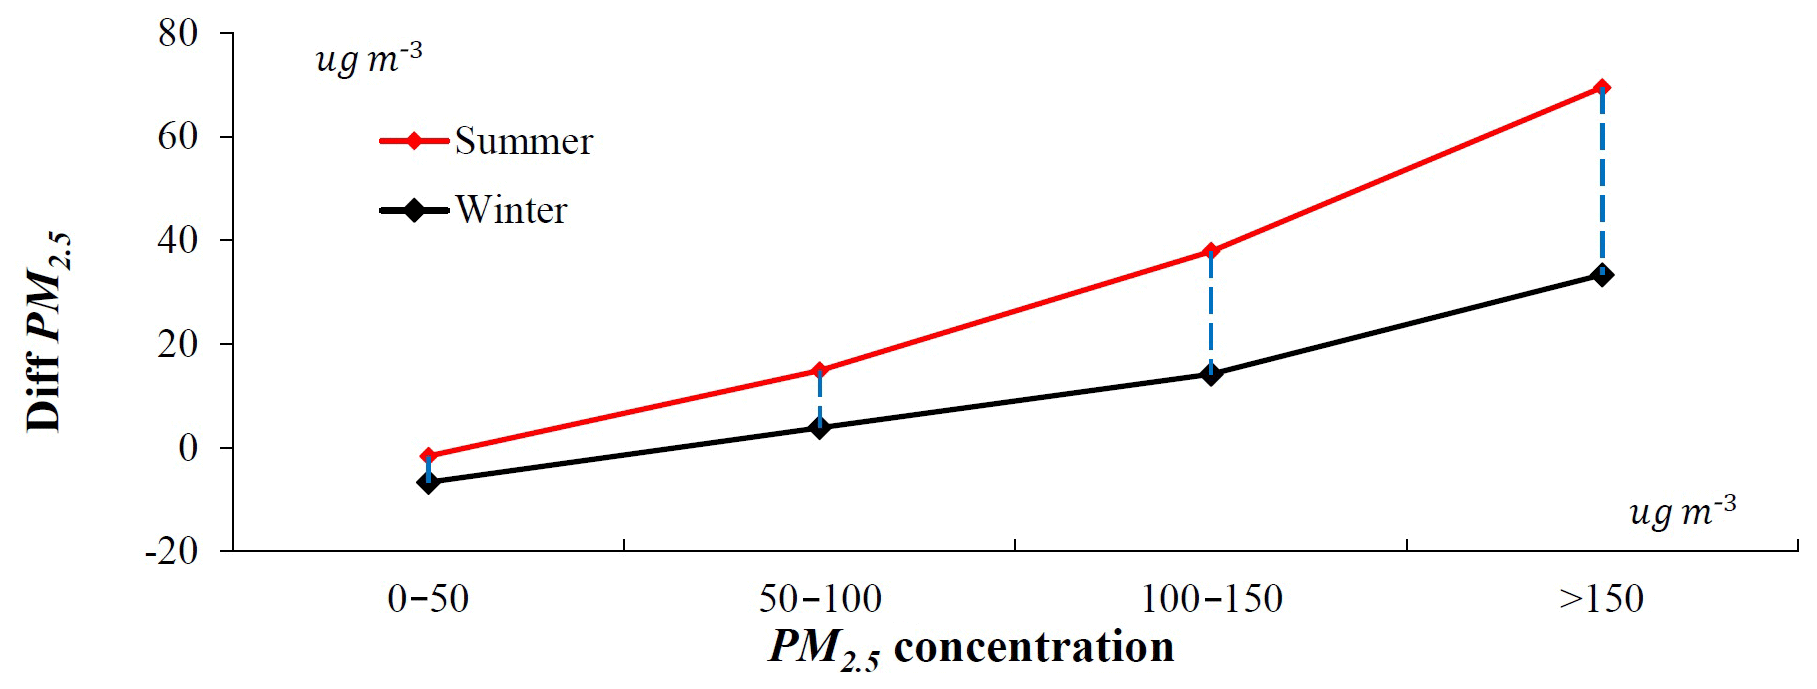
Figure 6Summertime (red curve) and wintertime (black curve) urban–rural PM2.5 concentration mean differences (unit: µg m−3) of all cities across four PM2.5 concentration bins: 0–50, 50–100, 100–150, and >150 µg m−3.
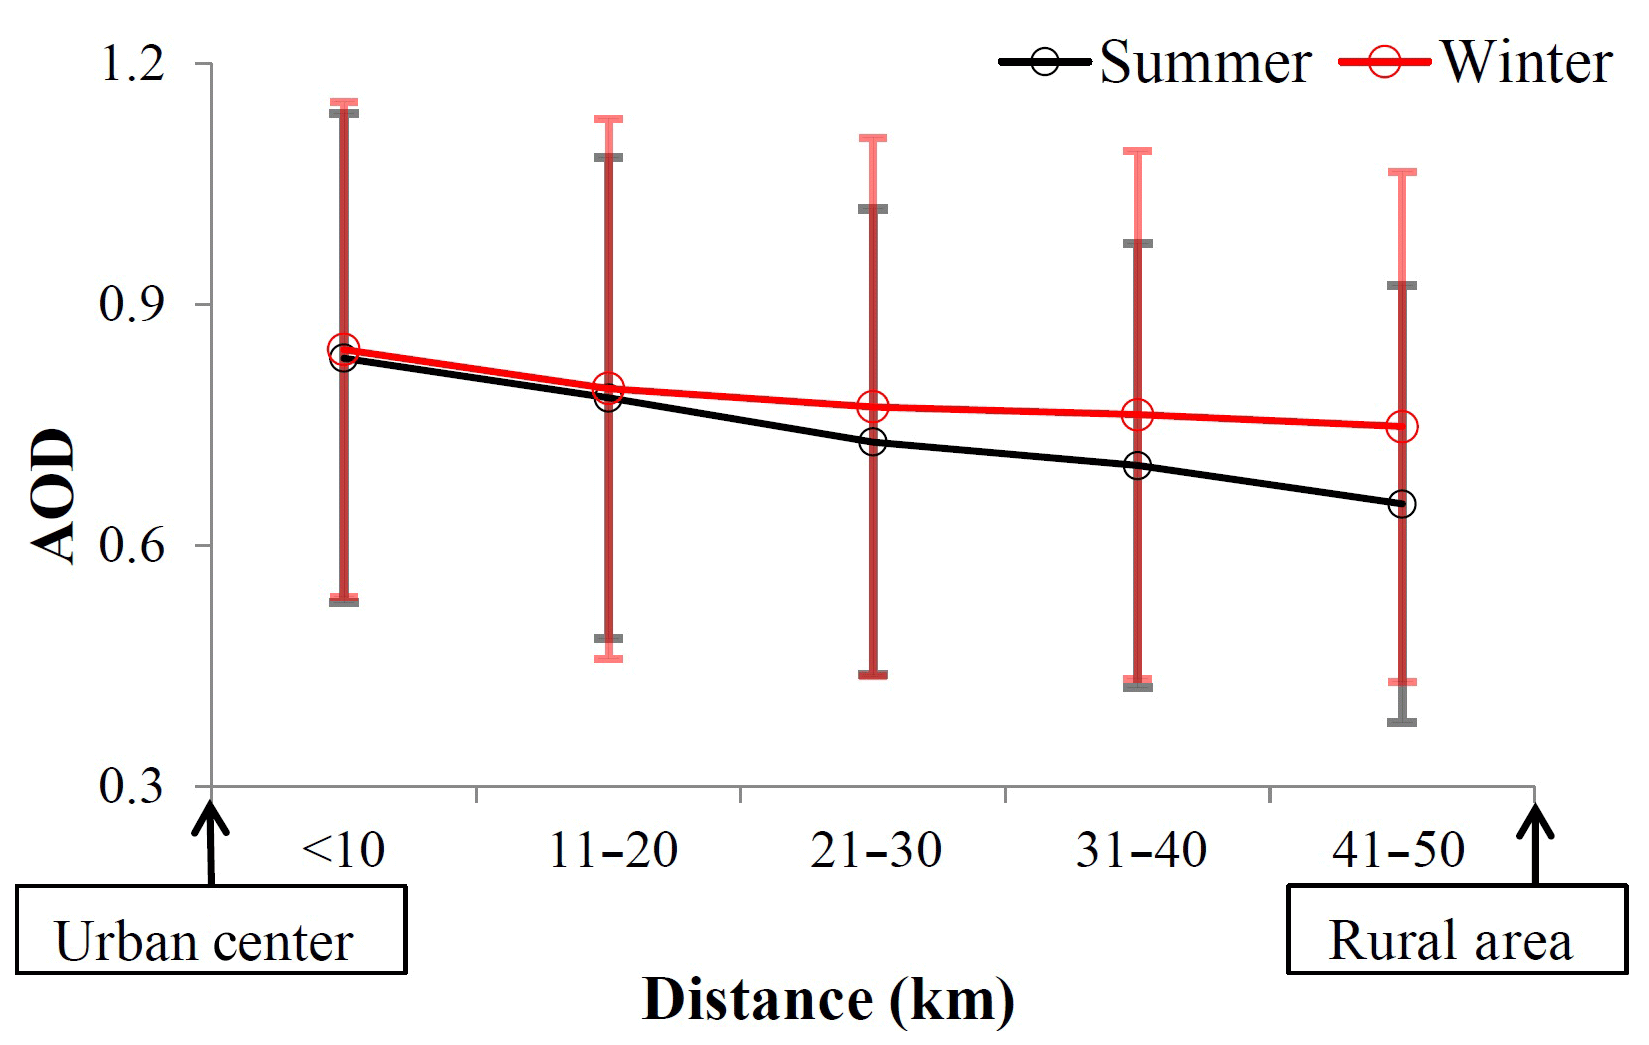
Figure 7Mean AOD as a function of distance from the urban geometrical center of all cities in winter (red curve with open circles) and summer (black curve with open circles). The distance ranges are <10, 11–20, 21–31, 31–40, and 41–50 km from the urban geometrical center. Error bars are shown.
UHII response to variation in visibility. Figure S5 shows the relationship between UHII and visibility difference. For most cities, a higher visibility difference causes smaller UHII in summer, while UHII barely changes as visibility difference changes in winter. This result indicates that UHII is more sensitive for visibility difference in summer than winter; namely, the ARE has an obvious effect in summer, but it is very weak in winter.
The results of Sect. 4.2.1 indicate that the ARE is more significant in summer than in winter.
4.2.2 Analyses for the ADE
Air stability within the PBL. Wind affects the heat exchange between urban and rural areas. Regardless of wind direction, high wind speeds favor the urban–rural heat exchange and reduce the UHII, while low wind speeds decrease the urban–rural heat exchange and enhance UHII. Mean wind speeds were computed in urban and rural areas in summer and winter, under polluted and clean conditions (Fig. 8 based on Fig. S6). As expected, the mean wind speed under polluted conditions is lower than that under clean conditions, especially in winter, when the difference is 1.1 m s−1, versus summer, when the difference is 0.6 m s−1. This suggests that the urban–rural exchange in summer is stronger than that in winter.
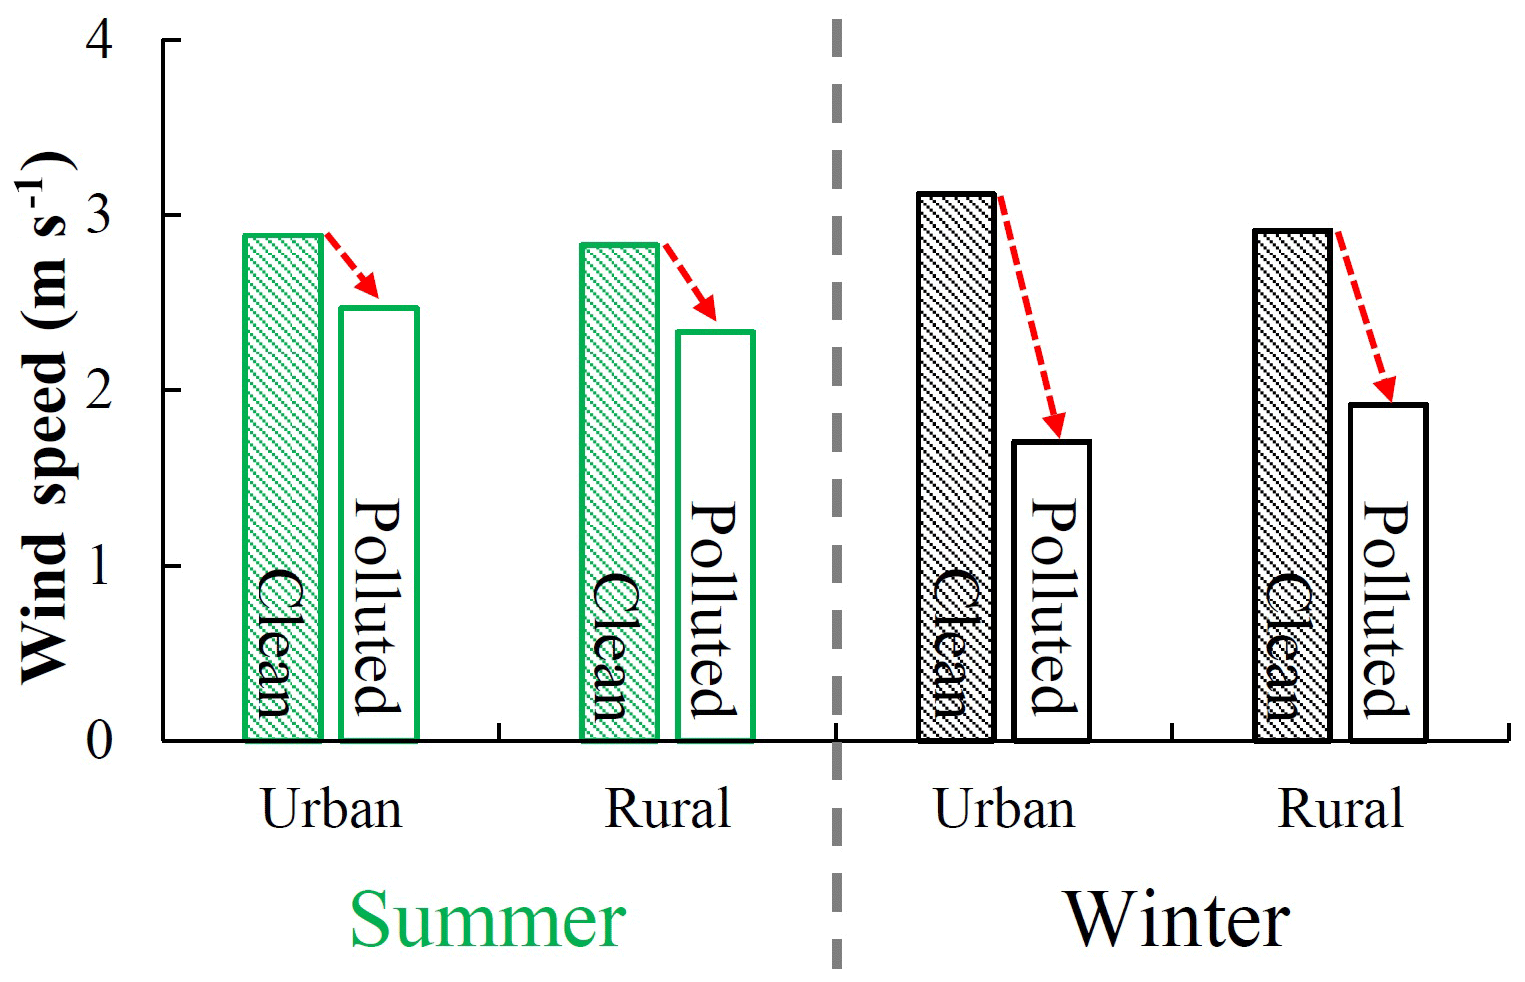
Figure 8Comparison of average wind speeds (unit: m s−1) of 35 cities between urban and rural areas under heavy air pollution (white bars) and clean conditions (hatched bars) in summer and winter.
Vertical temperature gradients affect the stability of the atmosphere, surface heat fluxes (especially sensible heat), and vertical turbulence. Figure 9 shows the vertical temperature profiles at five cities in different seasons under polluted and clean conditions. Note that there are fewer sounding stations than general surface meteorological stations in China. The vertical temperature gradient is weaker under polluted conditions than under clean conditions, so vertical mixing is weaker. This phenomenon is also more pronounced in winter than in summer. For Nanjing, both aerosols and meteorological conditions may affect the temperature gradient in winter because of the large difference of surface temperature between clean and polluted conditions. The temperature gradient within the PBL under polluted conditions generally decreases more sharply than under clean conditions, except at Chengdu, located in the Sichuan Basin. The temperature lapse rate is the smallest under polluted conditions in winter (Fig. 10). These results suggest that vertical airflow and surface heat release under polluted conditions are lessened more significantly in winter than in summer.

Figure 9Mean vertical temperature profiles (vertical curves; unit: ∘C) at five cities in different seasons under polluted (black) and clean (green) conditions. Mean PBL heights under polluted and clean conditions are also shown (black and green horizontal lines, respectively). Panels (a), (c), (e), (g), and (i) show summertime results, and panels (d), (f), (h), and (j) show wintertime results. Panels (k) and (l) show temperature reductions below 1.5 km (unit: K (100 m)−1) under polluted (hatched bars) and clean (white bars) conditions in summer and winter, respectively.
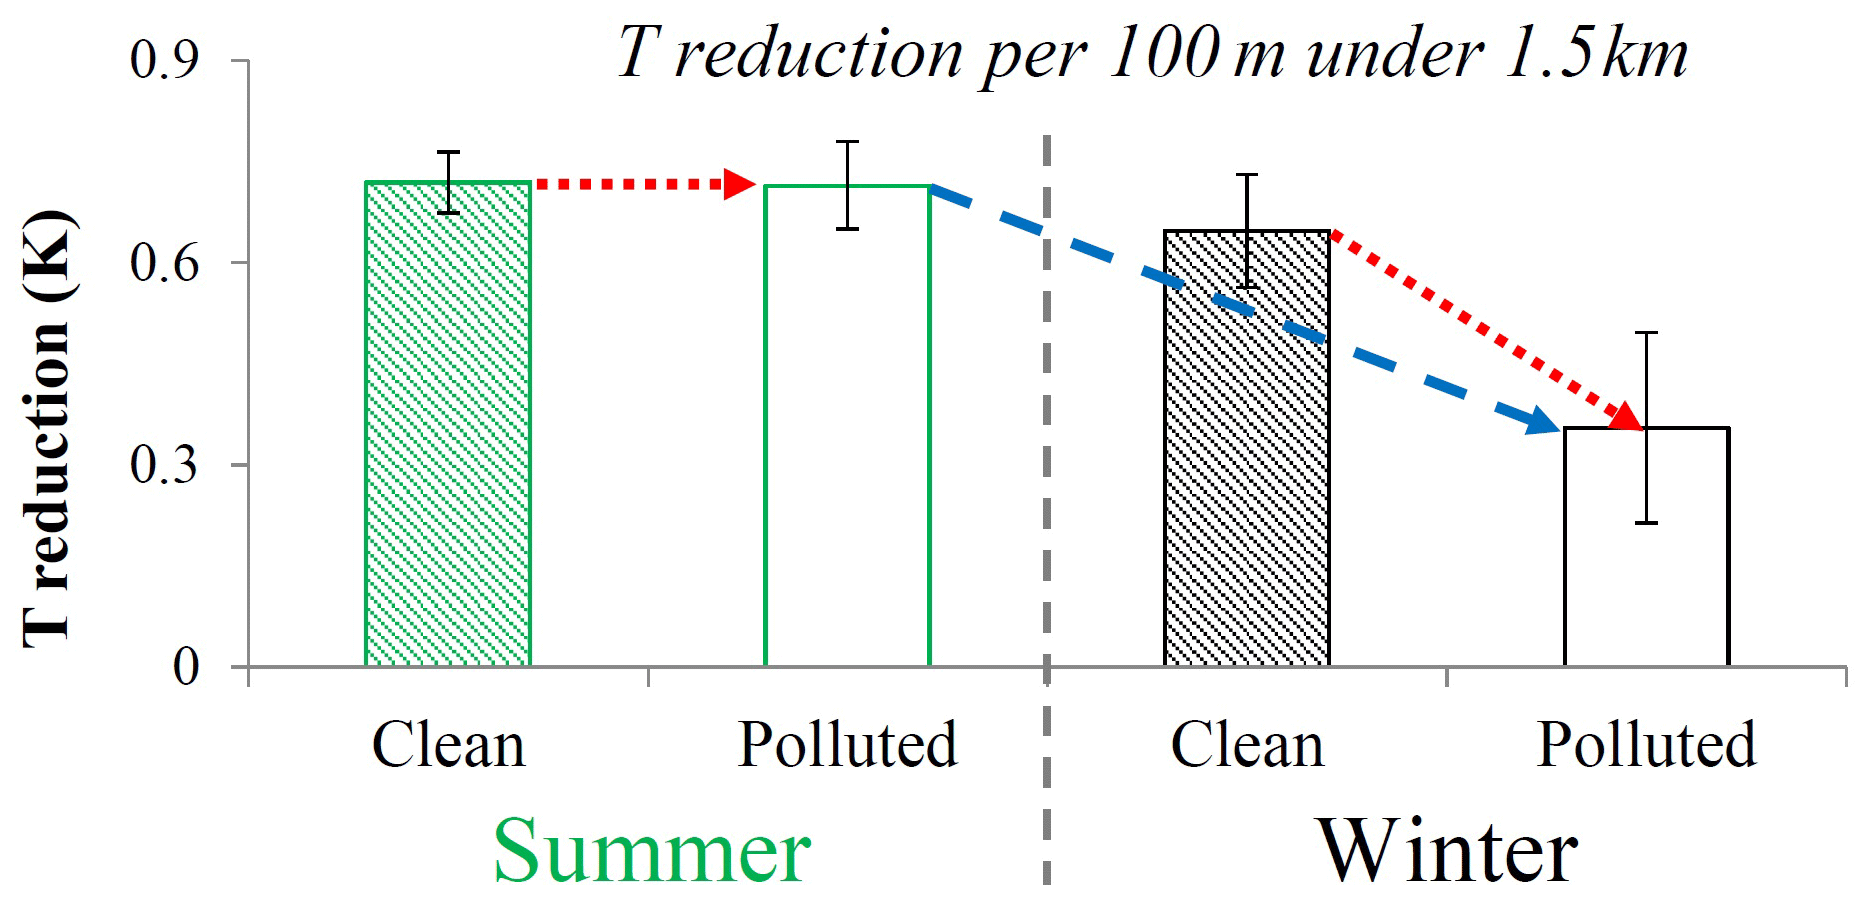
Figure 10Average temperature reductions below 1.5 km (unit: K (100 m)−1) from sounding observations at five cities under polluted (hatched bars) and clean (white bars) conditions in summer and winter. The red arrows show the change ranges from clean conditions to polluted conditions; the blue arrow shows the change range from polluted condition in summer to polluted condition in winter.
Seasonal differences in air stability in urban and rural areas may be summarized as follows. Under polluted conditions, both horizontal and vertical exchanges decrease inside the PBL, thus weakening the heat exchange and pollution dispersion. However, this effect is much stronger in winter than in summer. In winter, the airflow significantly weakens with increasing pollution, stabilizing the PBL and significantly decreasing heat exchanges within the PBL.
The results of Sect. 4.2.2 indicate that the ADE is more significant in winter than in summer.
In summary, the above analyses suggest that the two mechanisms behave differently in summer and winter. In summer, the ARE plays a more important role than the ADE in changing the UHII, while the importance of the two mechanisms is opposite in winter.
4.3 Testing the mechanisms through modeling
We evaluate simulated aerosol and meteorological properties with surface PM2.5 observations and sounding data (Figs. S7, S8, and 11). Figure S7 shows that simulated near-surface PM2.5 concentrations are highest in regions south and east of Beijing, in general agreement with observations. The temporal variations in simulated and observed PM2.5 concentrations have consistent trends at most stations (Fig. S8). The vertical profiles of temperature, RH, and wind speed also agree with sounding observations (Fig. 11). In general, the simulation results appear sound.
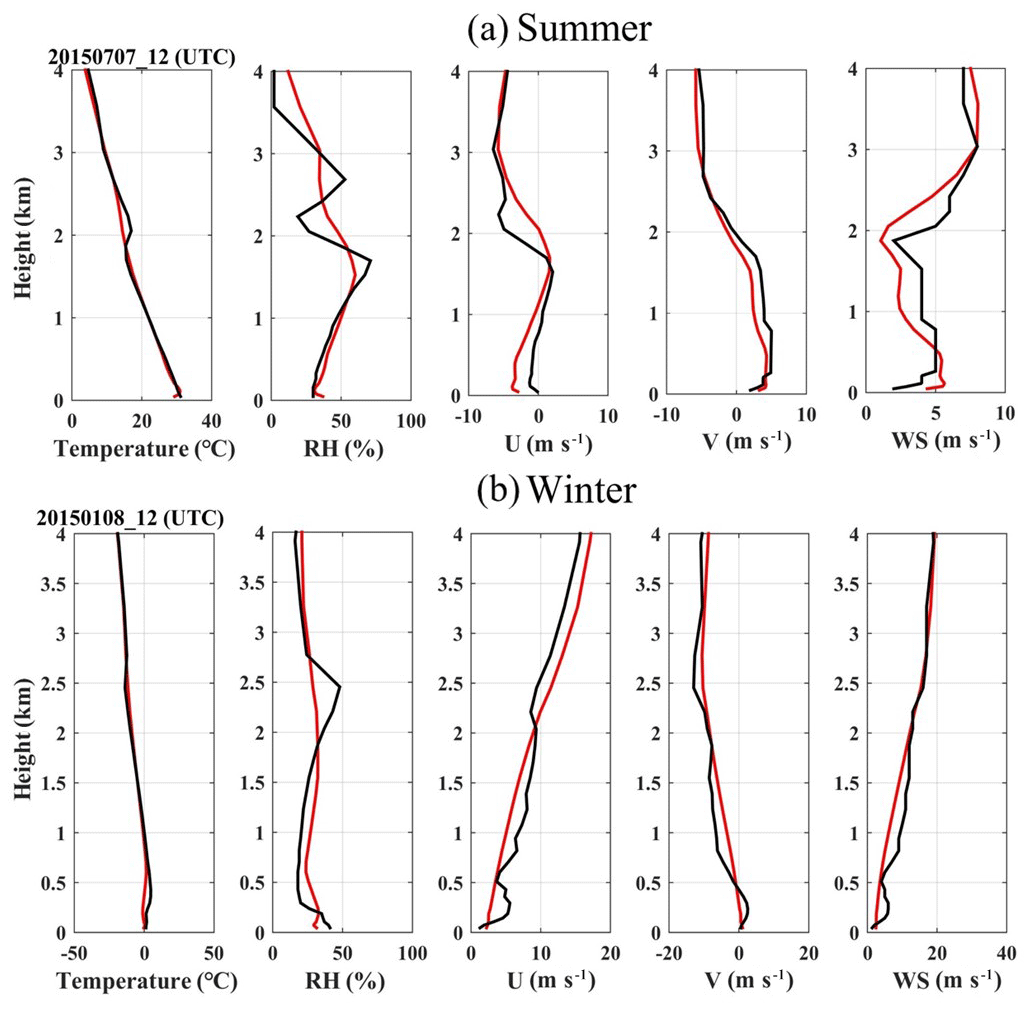
Figure 11Vertical profiles of temperature (unit: ∘C), RH (unit: %), U-wind speed (U; unit: m s−1), V-wind speed (V; unit: m s−1), and wind speed (WS; unit: m s−1) at (a) 12:00 UTC on 8 July 2015 and (b) 12:00 UTC on 7 January 2015. Red lines are simulation results, and black lines are observations.
Figure 12 depicts the averaged diurnal variations in UHII differences (ΔUHII) between UHII with the aerosol radiation effect (ARE) and UHII without the ARE, with negative values showing the reduction of UHII by aerosols and positive values showing the opposite. In summer (Fig. 12a), aerosols reduce UHII throughout all day, but in winter (Fig. 12b), aerosols enhance UHII in the afternoon. This shows the effect of aerosols on UHII on a daily scale, supporting Fig. 4. The averaged diurnal variation in downward shortwave radiation at the surface (SWDOWN) between urban and rural areas shows that the SWDOWN difference is larger than that in winter (Fig. S9). The results in Figs. S7 and S9 indicate that the spatial difference of air pollution in summer is larger than that in winter, and the wintertime pollution is more serious than summertime pollution, which is consistent with observational results shown in Figs. 6–7. Figure 13 shows that the ARE is more significant on the temperature lapse rate in winter than that in summer in both urban and rural areas. Moreover, the temperature lapse rate in summer is far larger than that in winter. This is also consistent with the observational results shown in Fig. 10.
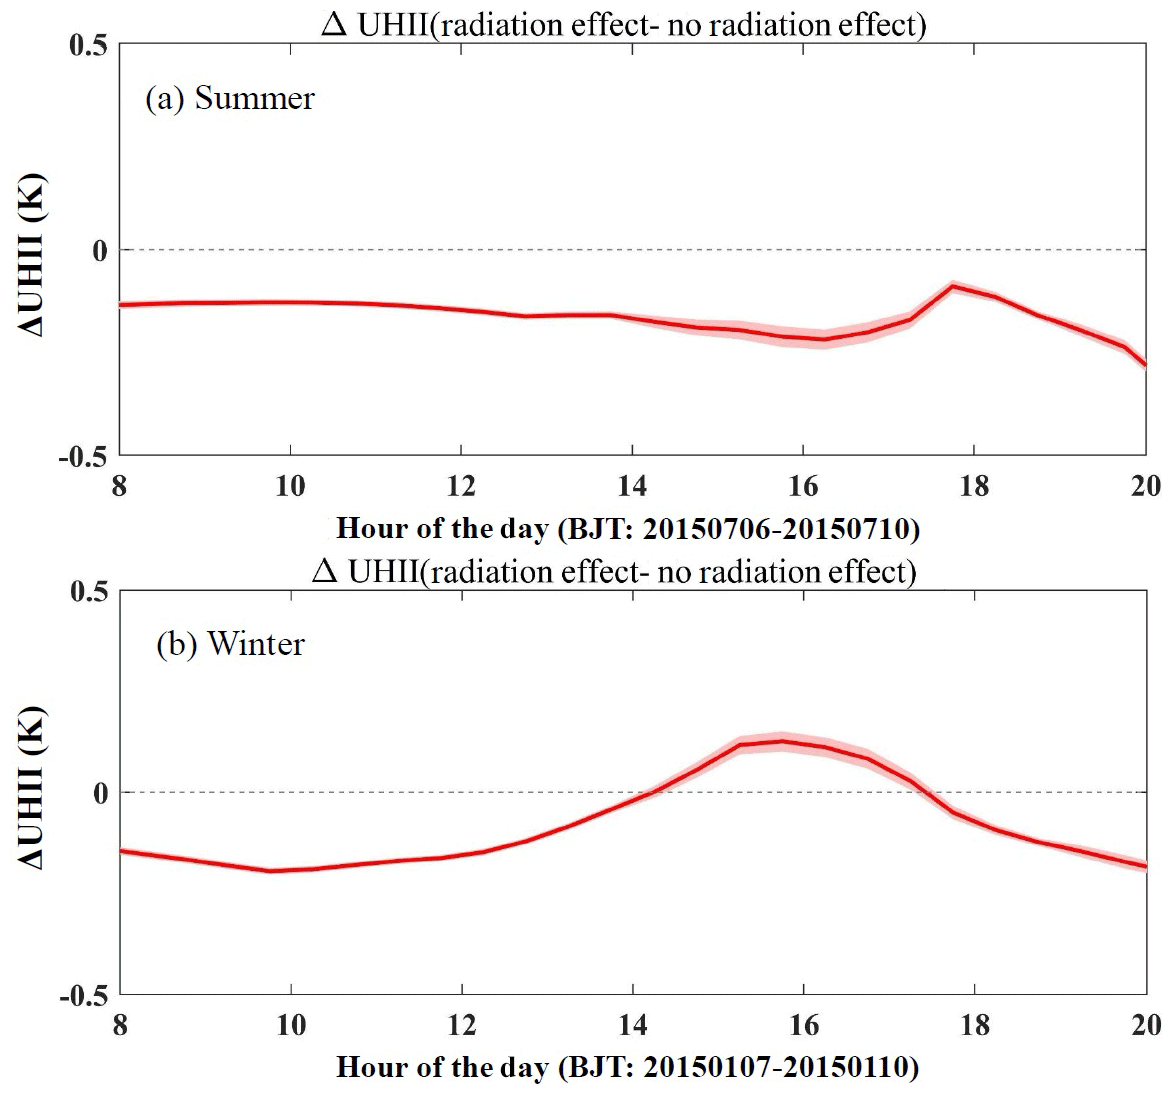
Figure 12Average diurnal variations in UHII differences (ΔUHII; unit: K) between UHII with and without including ARE for typical days in (a) summer (averaged over 6–10 July 2015) and (b) winter (averaged over 7–10 January 2015).
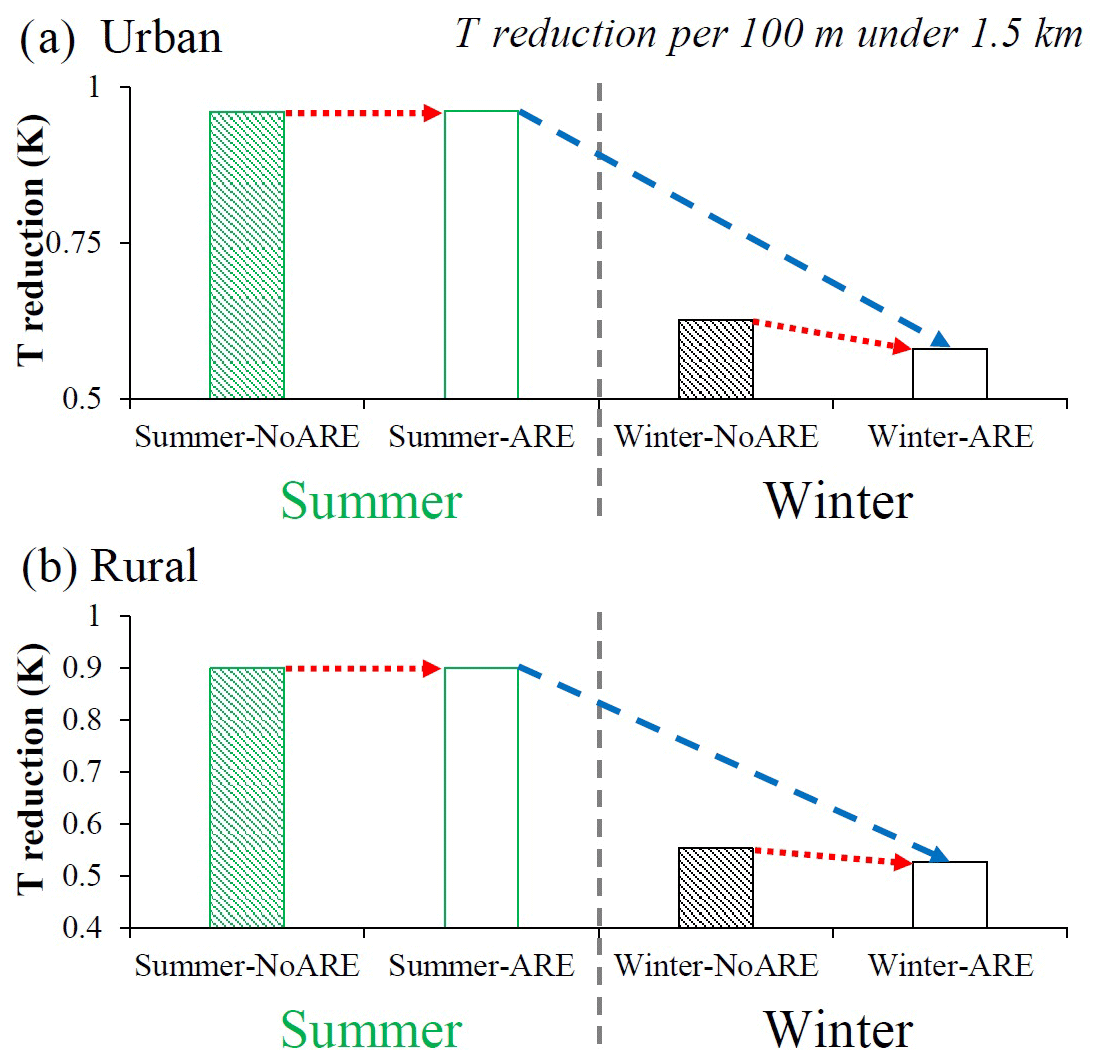
Figure 13Temperature reductions from model simulations below 1.5 km (unit: K (100 m)−1) without ARE (white bars) and with ARE (hatched bars) for typical days in summer (green) and winter (black) in (a) urban areas and (b) rural areas.
The urban heat island intensity (UHII) is investigated using long-term satellite, ground-based, and sounding data under different environmental conditions, from severely polluted to clean conditions, at 35 cities in China, aiming at understanding the impact of aerosols on the UHII. The impact is found to be opposite between summer and winter. On an annual basis, aerosols reduce the UHII, consistent with previous studies (Wu et al., 2017). Aerosols lessen the UHII in summer but strengthen it in winter. The opposite effects are explained by two distinct roles of aerosols, namely, the aerosol radiative effect (ARE) and aerosol dynamic effect (ADE) based on our analyses of extensive observational data from satellite and the ground, which is further reinforced by model simulations. The ARE refers to the reduction of surface solar radiation by aerosol which lowers surface temperature, whereas the ADE is concerned with the dispersion of heat associated with any change in airflow due to aerosol-induced changes in atmospheric stability.
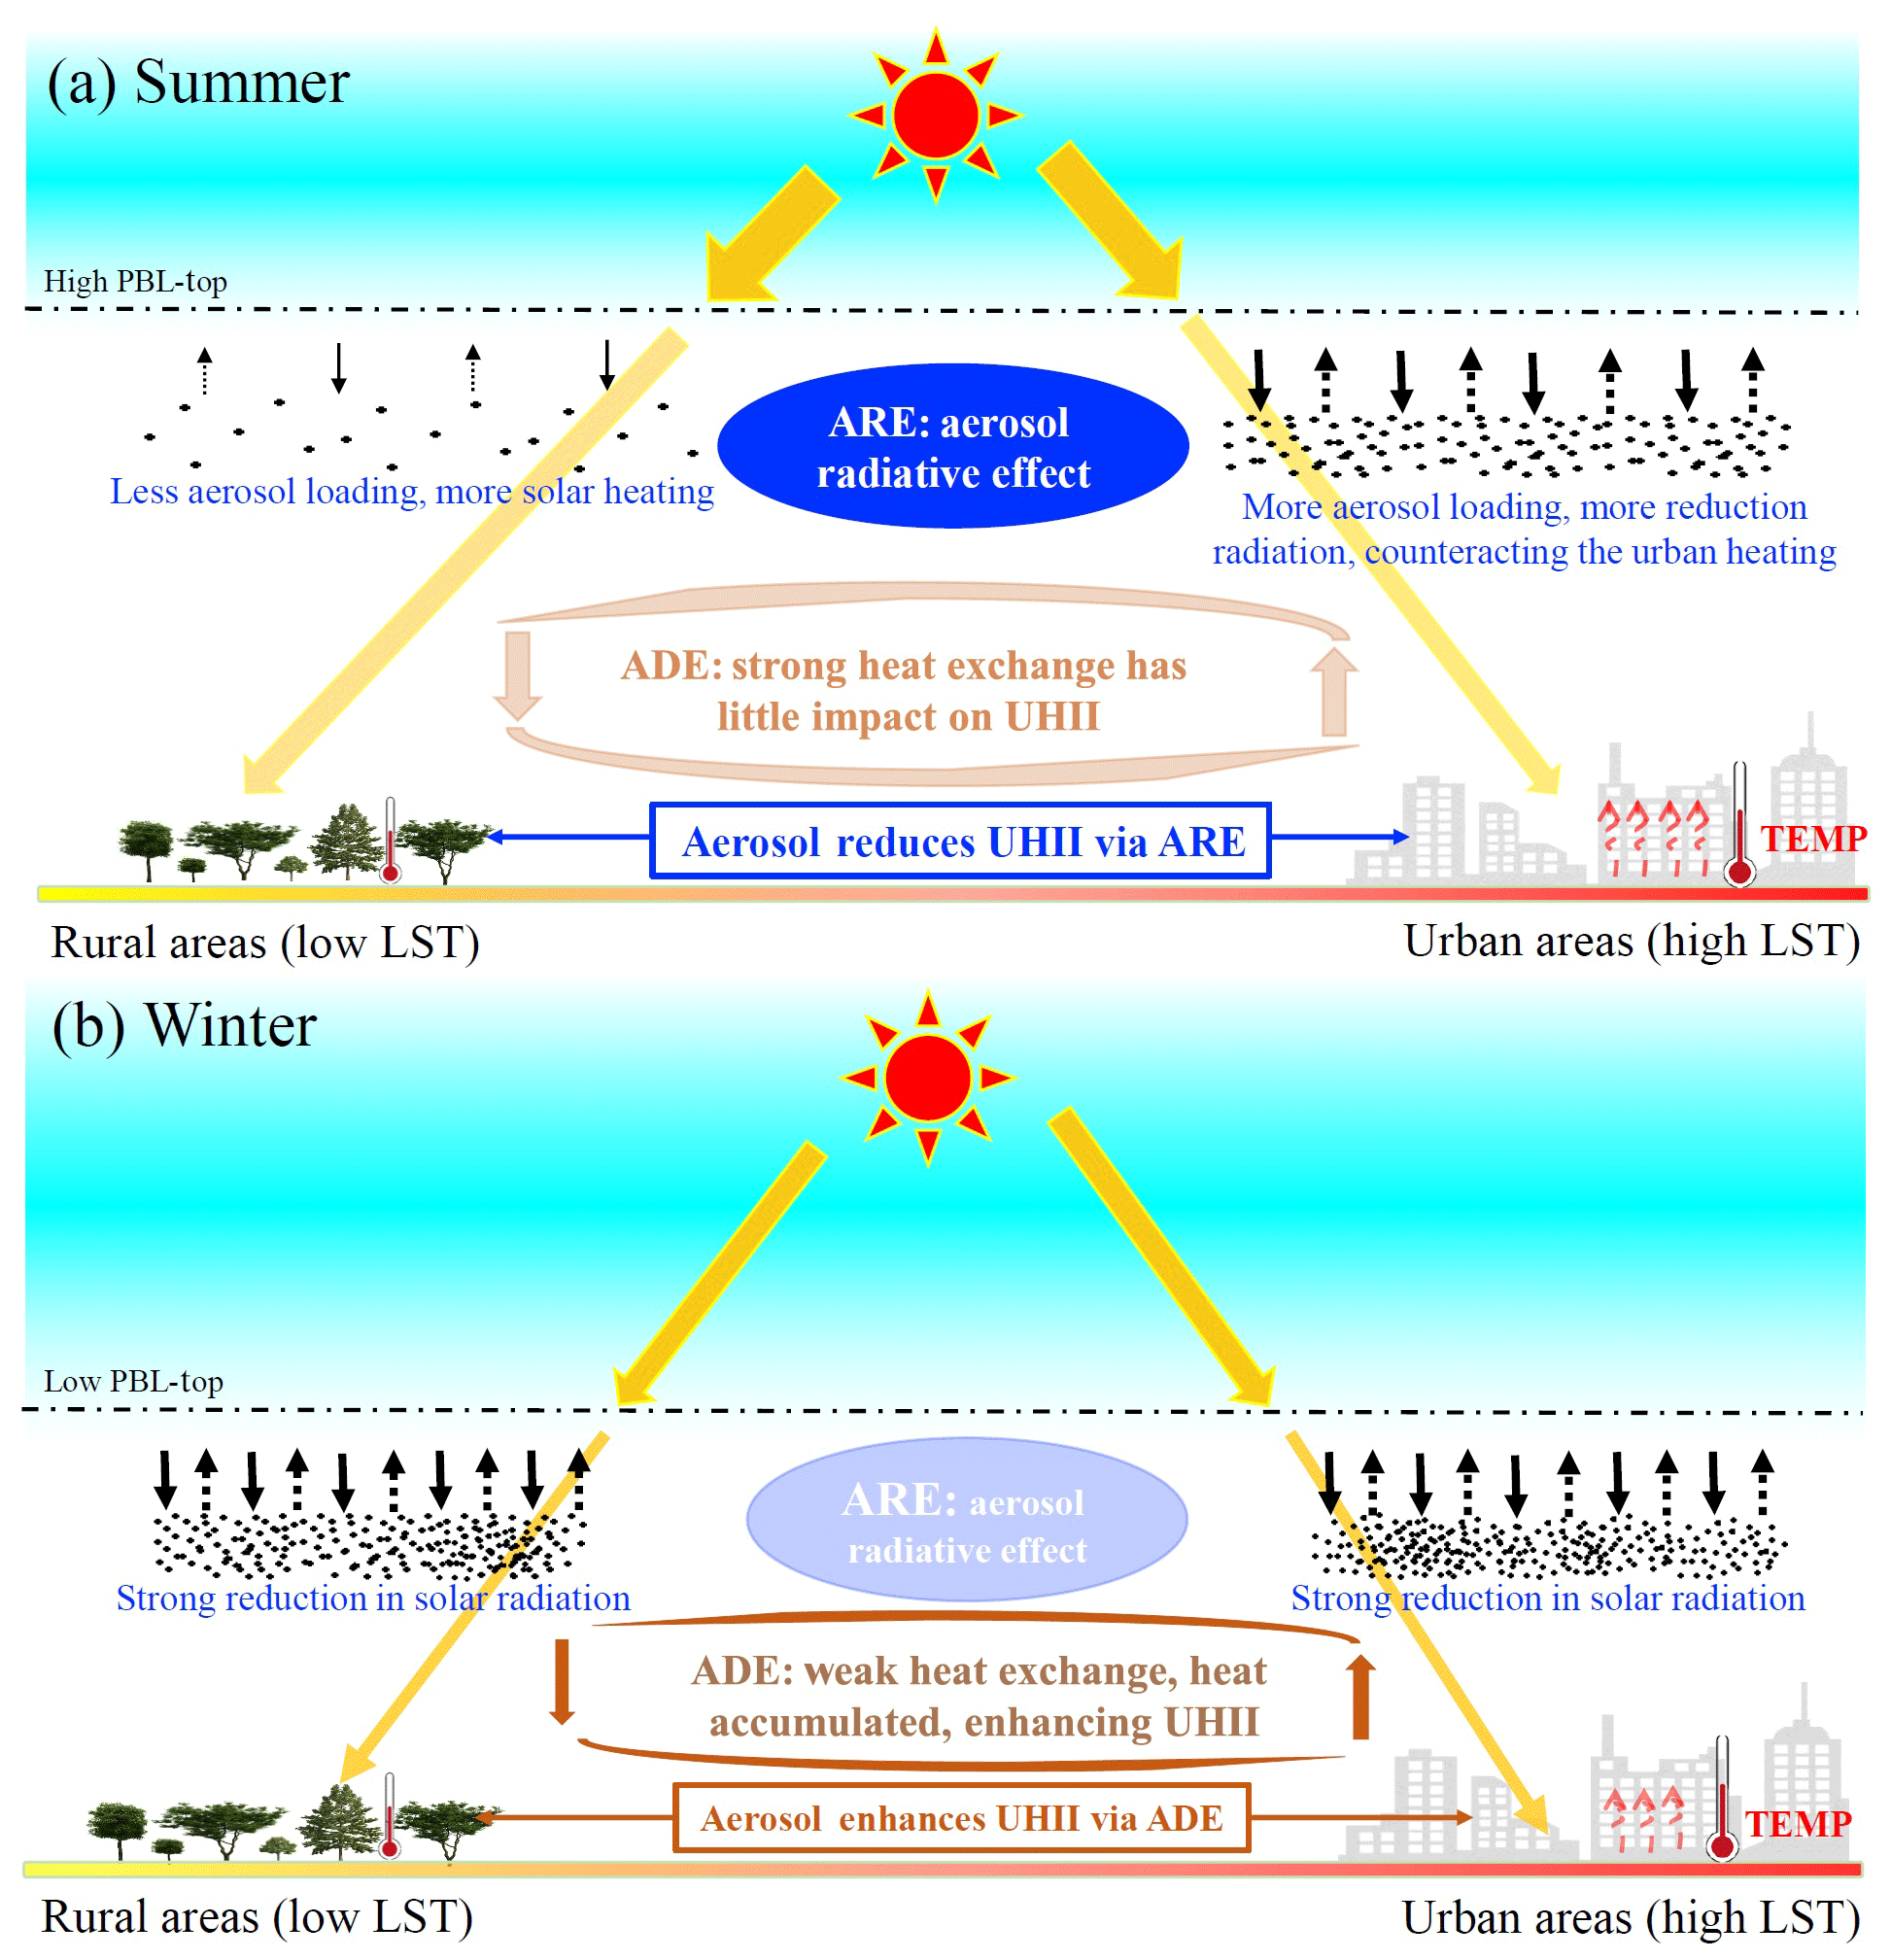
Figure 14The impact of the ARE and the ADE on UHII in summer (a) and winter (b) by altering radiation (yellow arrows) and heat exchange (brown arrows) on thermal contrast between urban and rural areas. Note the difference in aerosol loading between summer and winter and between urban and rural areas.
In summer, aerosols do not have much of an impact on airflow within the PBL in urban areas. There is a strong heat exchange between urban and rural areas in both polluted and clean conditions. As such, the ADE is weak in summer, but the ARE is strong because aerosol loadings are much higher in urban areas than in rural areas. The reductions of surface solar radiation and temperature are a lot more than those in rural areas, which helps lessen the UHII. Figure 14a shows a diagram of how aerosols influence the UHII in summer.
In winter, the aerosol effects on PBL stability are dominant over the ARE effect because the spatial difference in air pollution between urban and rural areas is small (i.e., the differences of ARE between urban and rural areas are similar from clean to polluted conditions). This means that urban and rural areas likely experience the same severe pollution, heating the atmosphere and reducing the solar radiation reaching the surfaces of the urban and rural areas by a similar amount. Whereas through the ADE, the PBL is more stabilized in polluted conditions, airflow intensity and temperature gradients significantly decrease, weakening the heat exchange in both vertical and horizontal directions. Heat is thus accumulated in urban areas, enhancing the UHII. Figure 14b illustrates how aerosols influence the UHII in winter.
Although this study comprehensively investigates some aerosol effects, other effects may exist, such as differences in aerosol properties (e.g., absorbing versus scattering aerosols) between urban and rural areas. This needs further examination but is infeasible at present due to a lack of observations between urban and rural regions. While the findings reported here are generally true in the majority of the 35 cities, they are not exclusively true for all cities due to their unique characteristics regarding their location, terrain, and climatic background, among other factors.
Landsat, MODIS LST, and MAIAC AOD data can be download from https://search.earthdata.nasa.gov/ (NASA, 2020). Hourly PM2.5 data are published in real time by the Ministry of Ecology and Environment of China (http://106.37.208.233:20035, Ministry of Ecology and Environment of China, 2020). Meteorological fields are available from the National Centers for Environmental Prediction FNL Operational Model Global Tropospheric Analyses, continuing from the July 1999 Research Data Archive at the National Center for Atmospheric Research Computational and Information Systems Laboratory (https://doi.org/10.5065/D6M043C6, NCEP, 2000).
The supplement related to this article is available online at: https://doi.org/10.5194/acp-20-6479-2020-supplement.
All authors made substantial contributions to this work. WH and ZL designed this research. WH conducted the analyses and wrote the draft under the supervision of ZL. ZL reviewed and edited this paper. WF and YZ conducted the WRF-Chem simulations and helped edit this paper. JG and TS provided some datasets and helped edit this paper. MC reviewed and edited this paper. JF gave many suggestions about this study. TC and JW provided some datasets. SSL gave many suggestions about model simulations.
The authors declare that they have no conflict of interest.
This study has been supported by the National Key R&D Program of China (2017YFC1501702) and the National Natural Science Foundation of China (91544217 and 41771399). Jiwen Fan is supported by DOE's Early Career Award Program. We are grateful for the provision of PM2.5 data by the Ministry of Environmental Protection of the People's Republic of China and for the provision of meteorological and radiosonde data by the China Meteorological Administration. We extend our sincerest thanks to the MEIC and NCEP teams for their datasets.
This research has been supported by the National Key R&D Program of China (grant no. 2017YFC1501702), the National Natural Science Foundation of China (grant nos. 91544217 and 41771399), and the National Research Foundation of Korea (NRF) grant funded by the South Korean government (MSIT) (grant no. NRF2020R1A2C1003215).
This paper was edited by Jianping Huang and reviewed by two anonymous referees.
Ackerman, B., Changnon, S., Dzurisin, G., Gatz, D. L., and Grosh, R. C.: Summary of METROMEX. Volume 2: Causes of precipitation anomalies, Illinois State Water Survey, Urbana, Bulletin 63, available at: https://www.isws.illinois.edu/pubdoc/B/ISWSB-63.pdf (last access: 30 May 2020), 1978.
Bornstein, R. and Lin, Q.: Urban heat islands and summertime convective thunderstorms in Atlanta: three case studies, Atmos. Environ., 34, 507–516, https://doi.org/10.1016/S1352-2310(99)00374-X, 2000.
Cao, C., Lee, X., Liu, S., Schultz, N., Xiao, W., Zhang, M., and Zhao, L.: Urban heat islands in China enhanced by haze pollution, Nat. Commun., 7, 1–7, https://doi.org/10.1038/ncomms12509, 2016.
Carrió, G. G. and Cotton, W.: Urban growth and aerosol effects on convection over Houston. Part II: Dependence of aerosol effects on instability, Atmos. Res., 102, 167–174, https://doi.org/10.1016/j.atmosres.2011.06.022, 2011.
Carrió, G. G., Cotton, W. R., and Cheng, W. Y. Y.: Urban growth and aerosol effects on convection over Houston. Part I: The August 2000 case, Atmos. Res., 96, 560–574, https://doi.org/10.1016/j.atmosres.2010.01.005, 2010.
Changnon, S. A. and Westcott, N. E.: Heavy rainstorms in Chicago: increasing frequency, altered impacts, and future implications, J. Am. Water Resour. As., 38, 1467–1475, https://doi.org/10.1111/j.1752-1688.2002.tb04359.x, 2002.
Changnon, S. A., Huff, F. A., Schickedanz, P. T., and Vogel, J. L.: Summary of METROMEX. Volume 1: Weather anomalies and impacts, Illinois State Water Survey, Urbana, Bulletin 62, available at: https://www.isws.illinois.edu/pubdoc/B/ISWSB-62.pdf (last access: 30 May 2020), 1977.
Changnon, S. A., Shealy, R. T., and Scott, R. W.: Precipitation changes in fall, winter, and spring caused by St. Louis, J. Appl. Meteorol., 30, 126–134, https://doi.org/10.1175/1520-0450(1991)030<0126:PCIFWA>2.0.CO;2, 1991.
Chapman, E. G., Gustafson Jr., W. I., Easter, R. C., Barnard, J. C., Ghan, S. J., Pekour, M. S., and Fast, J. D.: Coupling aerosol-cloud-radiative processes in the WRF-Chem model: Investigating the radiative impact of elevated point sources, Atmos. Chem. Phys., 9, 945–964, https://doi.org/10.5194/acp-9-945-2009, 2009.
Chen, F., Kusaka, H., Bornstein, R., Ching, J., Grimmond, C., Grossman-Clarke, S., Loridan, T., Manning, K. W., Martilli, A., and Miao, S.: The integrated WRF/urban modelling system: development, evaluation, and applications to urban environmental problems, Int. J. Climatol., 31, 273–288, https://doi.org/10.1002/joc.2158, 2011.
Chýlek, P. and Coakley, J. A.: Aerosols and climate, Science, 183, 75–77, https://doi.org/10.1126/science.183.4120.75, 1974.
Chýlek, P. and Wong, J.: Effect of absorbing aerosols on global radiation budget, Geophys. Res. Lett., 22, 929–931, https://doi.org/10.1029/95GL00800, 1995.
Cohen, A. J., Brauer, M., Burnett, R., Anderson, H. R., Frostad, J., Estep, K., Balakrishnan, K., Brunekreef, B., Dandona, L., Dandona, R., and Feigin, V.: Estimates and 25-year trends of the global burden of disease attributable to ambient air pollution: an analysis of data from the Global Burden of Diseases Study 2015, Lancet, 389, 1907–1918, https://doi.org/10.1016/S0140-6736(17)30505-6, 2017.
Ding, A. J., Huang, X., Nie, W., Sun, J. N., Kerminen, V. M., Petäjä, T., Su, H., Cheng, Y. F., Yang, X.‐Q., Wang, M. H., Chi, X. G., Wang, J. P., Virkkula, A., Guo, W. D., Yuan, J., Wang, S. Y., Zhang, R. J., Wu, Y. F., Song, Y., Zhu, T., Zilitinkevich, S., Kulmala, M., and Fu, C. B.: Enhanced haze pollution by black carbon in megacities in China, Geophys. Res. Lett., 43, 2873–2879, https://doi.org/10.1002/2016GL067745, 2016.
Fallmann, J., Forkel, R., and Emeis, S.: Secondary effects of urban heat island mitigation measures on air quality, Atmos. Environ., 125, 199–211, https://doi.org/10.1016/j.atmosenv.2015.10.094, 2016.
Fan, J., Leung, L. R., Rosenfeld, D., Chen, Q., Li, Z., Zhang, J., and Yan, H.: Microphysical effects determine macrophysical response for aerosol impacts on deep convective clouds, P. Natl. Acad. Sci. USA, 110, E4581–E4590, https://doi.org/10.1073/pnas.1316830110, 2013.
Gedzelman, S. D., Austin, S., Cermak, R., Stefano, N., Partridge, S., Quesenberry, S., and Robinson, D. A.: Mesoscale aspects of the urban heat island around New York City, Theor. Appl. Climatol., 75, 29–42, https://doi.org/10.1007/s00704-002-0724-2, 2003.
Givati, A. and Rosenfeld, D.: Quantifying precipitation suppression due to air pollution, J. Appl. Meteorol., 43, 1038–1056, https://doi.org/10.1175/1520-0450(2004)043<1038:QPSDTA>2.0.CO;2, 2004.
Grell, G. A., Peckham, S. E., Schmitz, R., McKeen, S. A., Frost, G., Skamarock, W. C., and Eder, B.: Fully coupled “online” chemistry within the WRF model, Atmos. Environ., 39, 6957–6975, https://doi.org/10.1016/j.atmosenv.2005.04.027, 2005.
Grimmond, S.: Urbanization and global environmental change: local effects of urban warming, Geogr. J., 173, 83–88, https://doi.org/10.1111/j.1475-4959.2007.232_3.x, 2007.
Guenther, A., Karl, T., Harley, P., Wiedinmyer, C., Palmer, P. I., and Geron, C.: Estimates of global terrestrial isoprene emissions using MEGAN (Model of Emissions of Gases and Aerosols from Nature), Atmos. Chem. Phys., 6, 3181–3210, https://doi.org/10.5194/acp-6-3181-2006, 2006.
Guo, J., Deng, M., Lee, S. S., Wang, F., Li, Z., Zhai, P., Liu, H., Lv, W., Yao, W., and Li, X.: Delaying precipitation and lightning by air pollution over the Pearl River Delta. Part I: Observational analyses, J. Geophys. Res.-Atmos., 121, 6472–6488, https://doi.org/10.1002/2015JD023257, 2016a.
Guo, J., Miao, Y., Zhang, Y., Liu, H., Li, Z., Zhang, W., He, J., Lou, M., Yan, Y., Bian, L., and Zhai, P.: The climatology of planetary boundary layer height in China derived from radiosonde and reanalysis data, Atmos. Chem. Phys., 16, 13309–13319, https://doi.org/10.5194/acp-16-13309-2016, 2016b.
Guo, J., Liu, H., Li, Z., Rosenfeld, D., Jiang, M., Xu, W., Jiang, J. H., He, J., Chen, D., Min, M., and Zhai, P.: Aerosol-induced changes in the vertical structure of precipitation: a perspective of TRMM precipitation radar, Atmos. Chem. Phys., 18, 13329–13343, https://doi.org/10.5194/acp-18-13329-2018, 2018.
Han, J. Y., Baik, J. J., and Khain, A. P.: A numerical study of urban aerosol impacts on clouds and precipitation, J. Atmos. Sci., 69, 504–520, https://doi.org/10.1175/JAS-D-11-071.1, 2012.
Han, J. Y., Baik, J. J., and Lee, H.: Urban impacts on precipitation, Asia-Pac. J. Atmos. Sci., 50, 17–30, https://doi.org/10.1007/s13143-014-0016-7, 2014.
Heilig, G. K.: World urbanization prospects: the 2011 revision, United Nations, Department of Economic and Social Affairs (DESA), Population Division, Population Estimates and Projections Section, New York, 2012.
Huete, A. R.: A soil-adjusted vegetation index (SAVI), Remote Sens. Environ., 25, 295–309, https://doi.org/10.1016/0034-4257(88)90106-x, 1988.
Jáuregui, E. and Romales, E.: Urban effects on convective precipitation in Mexico City, Atmos. Environ., 30, 3383–3389, https://doi.org/10.1016/1352-2310(96)00041-6, 1996.
Jiang, Y. C., Yang, Y. J., Wang, H., Li, Y. B., Gao, Z. Q., and Zhao, C.: Urban-rural differences in PM2.5 concentrations in the representative cities of China during 2015–2018, China Environ. Sci., 39, 4552–4560, https://doi.org/10.19674/j.cnki.issn1000-6923.2019.0530, 2019.
Kalnay, E. and Cai, M.: Impact of urbanization and land-use change on climate, Nature, 423, 528–531, https://doi.org/10.1038/nature01675, 2003.
Khain, A., Rosenfeld, D., and Pokrovsky, A.: Aerosol impact on the dynamics and microphysics of deep convective clouds, Q. J. Roy. Meteor. Soc., 131, 2639–2663, https://doi.org/10.1256/qj.04.62, 2005.
Kim, Y. H. and Baik, J. J.: Maximum urban heat island intensity in Seoul, J. Appl. Meteorol., 41, 651–659, https://doi.org/10.1175/1520-0450(2002)041<0651:MUHIII>2.0.CO;2, 2002.
Kug, J. S. and Ahn, M. S.: Impact of urbanization on recent temperature and precipitation trends in the Korean peninsula, Asia-Pac. J. Atmos. Sci., 49, 151–159, https://doi.org/10.1007/s13143-013-0016-z, 2013.
Lai, L.-W.: The influence of urban heat island phenomenon on PM concentration: an observation study during the summer half-year in metropolitan Taipei, Taiwan, Theor. Appl. Climatol., 131, 227–243, https://doi.org/10.1007/s00704-016-1975-7, 2016.
Lee, S.-S. and Feingold, G.: Aerosol effects on the cloud-field properties of tropical convective clouds, Atmos. Chem. Phys., 13, 6713–6726, https://doi.org/10.5194/acp-13-6713-2013, 2013.
Li, J., Chen, H., Li, Z., Wang, P., Cribb, M., and Fan, X.: Low-level temperature inversions and their effect on aerosol condensation nuclei concentrations under different large-scale synoptic circulations, Adv. Atmos. Sci., 32, 898–908, https://doi.org/10.1007/s00376-014-4150-z, 2015.
Li, Z.: Influence of absorbing aerosols on the inference of solar surface radiation budget and cloud absorption, J. Climate, 11, 5–17, https://doi.org/10.1175/1520-0442(1998)011<0005:IOAAOT>2.0.CO;2, 1998.
Li, Z., Niu, F., Fan, J., Liu, Y., Rosenfeld, D., and Ding, Y.: Long-term impacts of aerosols on the vertical development of clouds and precipitation, Nat. Geosci., 4, 888–894, https://doi.org/10.1038/ngeo1313, 2011.
Li, Z., Lau, W. M., Ramanathan, V., Wu, G., Ding, Y., Manoj, M. G., Liu, J., Qian, Y., Li, J., and Zhou, T., Fan, J., Rosenfeld, D., Ming, Y., Wang, Y., Huang, J., Wang, B., Xu, X., Lee, S. S., Cribb, M., Zhang, F., Yang, X., Zhao, C., Takemura, T., Wang, K., Xia, X., Yin, Y., Zhang, H., Guo, J., Zhai, P. M., Sugimoto, N., Babu, S. S., and Brasseur, G. P.: Aerosol and monsoon climate interactions over Asia, Rev. Geophys., 54, 866–929, https://doi.org/10.1002/2015RG000500, 2016.
Li, Z., Guo, J., Ding, A., Liao, H., Liu, J., Sun, Y., Wang, T., Xue, H., Zhang, H., and Zhu, B.: Aerosol and boundary-layer interactions and impact on air quality, Natl. Sci. Rev., 4, 810–833, https://doi.org/10.1093/nsr/nwx117, 2017a.
Li, Z., Rosenfeld, D., and Fan, J.: Aerosols and their impact on radiation, clouds, precipitation and severe weather events, Oxford Research Encyclopedia of Environmental Science, https://doi.org/10.1093/acrefore/9780199389414.013.126, 2017b.
Li, Z., Wang, Y., Guo, J., Zhao, C., Cribb, M., Dong, X., Fan, J., Gong, D., Huang, J., Jiang, M., Jiang, Y., Lee, S., Li, H., Li, J., Liu, J., Qian, Y., Rosenfeld, D., Shan, S., Sun, Y., Wang, H., Xin, J., Yan, X., Yang, X., Yang, X. Q., Zhang, F., and Zheng, Y.: East Asian Study of Tropospheric Aerosols and their Impact on Regional Clouds, Precipitation, and Climate (EAST-AIRCPC), J. Geophys. Res.-Atmos., 124, 13026–13054, https://doi.org/10.1029/2019JD030758, 2019.
Liao, J., Wang, T., Jiang, Z., Zhuang, B., Xie, M., Yin, C., Wang, X., Zhu, J., Fu, Y., and Zhang, Y.: WRF/Chem modeling of the impacts of urban expansion on regional climate and air pollutants in Yangtze River Delta, China, Atmos. Environ., 106, 204–214, https://doi.org/10.1016/j.atmosenv.2015.01.059, 2015.
Liu, H., Guo, J., Koren, I., Altaratz, O., Dagan, G., Wang, Y., Jiang, J. H., Zhai, P., and Yung, Y.: Non-monotonic aerosol effect on precipitation in convective clouds over tropical oceans, Sci. Rep.-UK, 9, 7809, https://doi.org/10.1038/s41598-019-44284-2, 2019.
Liu, S., Liu, Z., Li, J., Wang, Y., Ma, Y., Sheng, L., Liu, H., Liang, F., Xin, G., and Wang, J.: Numerical simulation for the coupling effect of local atmospheric circulations over the area of Beijing, Tianjin and Hebei Province, Sci. China Ser. D, 52, 382–392, https://doi.org/10.1007/s11430-009-0030-2, 2009.
Lou, M., Guo, J., Wang, L., Xu, H., Chen, D., Miao, Y., Lv, Y., Li, Y., Guo, X., Ma, S., and Li, J.: On the relationship between aerosol and boundary layer height in summer in China under different thermodynamic conditions, Earth Space Sci., 6, 887–901, https://doi.org/10.1029/2019EA000620, 2019.
Lyapustin, A., Martonchik, J., Wang, Y., Laszlo, I., and Korkin, S.: Multiangle implementation of atmospheric correction (MAIAC): 1. Radiative transfer basis and look-up tables, J. Geophys. Res.-Atmos., 116, D03210, https://doi.org/10.1029/2010JD014985, 2011a.
Lyapustin, A., Wang, Y., Laszlo, I., Kahn, R., Korkin, S., Remer, L., Levy, R., and Reid, J.: Multiangle implementation of atmospheric correction (MAIAC): 2. Aerosol algorithm, J. Geophys. Res.-Atmos., 116, D03211, https://doi.org/10.1029/2010JD014986, 2011b.
Lyapustin, A. I., Wang, Y., Laszlo, I., Hilker, T., Hall, F. G., Sellers, P. J., Tucker, C. J., and Korkin, S. V.: Multi-angle implementation of atmospheric correction for MODIS (MAIAC): 3. Atmospheric correction, Remote Sens. Environ., 127, 385–393, https://doi.org/10.1016/j.rse.2012.09.002, 2012.
Miao, S., Chen, F., LeMone, M. A., Tewari, M., Li, Q., and Wang, Y.: An observational and modeling study of characteristics of urban heat island and boundary layer structures in Beijing, J. Appl. Meteorol. Clim., 48, 484–501, https://doi.org/10.1175/2008JAMC1909.1, 2009.
Ministry of Ecology and Environment of China: Hourly PM2.5 data, available at: http://106.37.208.233:20035, last access: 31 May 2020.
Morris, C. J. G. and Simmonds, I.: Associations between varying magnitudes of the urban heat island and the synoptic climatology in Melbourne, Australia, Int. J. Climatol., 20, 1931–1954, https://doi.org/10.1002/1097-0088(200012)20:15<1931::AID-JOC578>3.0.CO;2-D, 2000.
NASA: EARTHDATA, available at: https://search.earthdata.nasa.gov/, last access: 31 May 2020.
NCEP: NCEP FNL Operational Model Global Tropospheric Analyses, continuing from July 1999, Research Data Archive at the National Center for Atmospheric Research, Computational and Information Systems Laboratory, https://doi.org/10.5065/D6M043C6, 2000.
Oke, T. R.: The energetic basis of the urban heat island, Q. J. Roy. Meteor. Soc., 108, 1–24, https://doi.org/10.1002/qj.49710845502, 1982.
Petäjä, T., Järvi, L., Kerminen, V. M., Ding, A. J., Sun, J. N., Nie, W., Kujansuu, J., Virkkula, A., Yang, X., and Fu, C.: Enhanced air pollution via aerosol-boundary layer feedback in China, Sci. Rep.-UK, 6, 18998, https://doi.org/10.1038/srep18998, 2016.
Pinto Jr., O., Pinto, I. R. C. A., and Ferro, M. A. S.: A study of the long-term variability of thunderstorm days in southeast Brazil, J. Geophys. Res.-Atmos., 118, 5231–5246, https://doi.org/10.1002/jgrd.50282, 2013.
Qi, J., Chehbouni, A., Huete, A. R., Kerr, Y. H., and Sorooshian, S.: A modified soil adjusted vegetation index, Remote Sens. Environ., 48, 119–126, https://doi.org/10.1016/0034-4257(94)90134-1, 1994.
Ren, G.: Urbanization as a major driver of urban climate change, Advances in Climate Change Research, 6, 1–6, https://doi.org/10.1016/j.accre.2015.08.003, 2015.
Rondeaux, G., Steven, M., and Baret, F.: Optimization of soil-adjusted vegetation indices, Remote Sens. Environ., 55, 95–107, https://doi.org/10.1016/0034-4257(95)00186-7, 1996.
Rosenfeld, D., Lohmann, U., Raga, G. B., O'Dowd, C. D., Kulmala, M., Fuzzi, S., Reissell, A., and Andreae M. O.: Flood or drought: How do aerosols affect precipitation?, Science, 321, 1309–1313, https://doi.org/10.1126/science.1160606, 2008.
Ryu, Y. H. and Baik, J. J.: Quantitative analysis of factors contributing to urban heat island intensity, J. Appl. Meteorol. Clim., 51, 842–854, https://doi.org/10.1175/JAMC-D-11-098.1, 2012.
Sakulyanontvittaya, T., Duhl, T., Wiedinmyer, C., Helmig, D., Matsunaga, S., Potosnak, M., Milford J., and Guenther, A.: Monoterpene and sesquiterpene emission estimates for the United States, Environ. Sci. Technol., 42, 1623–1629, https://doi.org/10.1021/es702274e, 2008.
Sanap, S. D. and Pandithurai, G.: Inter-annual variability of aerosols and its relationship with regional climate over Indian subcontinent, Int. J. Climatol., 35, 1041–1053, https://doi.org/10.1002/joc.4037, 2015.
Shepherd, J. M. and Burian, S. J.: Detection of urban-induced rainfall anomalies in a major coastal city, Earth Interact., 7, 1–17, https://doi.org/10.1175/1087-3562(2003)007<0001:DOUIRA>2.0.CO;2, 2003.
Shepherd, J. M., Pierce, H., and Negri, A. J.: Rainfall modification by major urban areas: observations from spaceborne rain radar on the TRMM satellite, J. Appl. Meteorol., 41, 689–701, https://doi.org/10.1175/1520-0450(2002)041<0689:RMBMUA>2.0.CO;2, 2002.
Skougaard Kaspersen, P., Høegh Ravn, N., Arnbjerg-Nielsen, K., Madsen, H., and Drews, M.: Influence of urban land cover changes and climate change for the exposure of European cities to flooding during high-intensity precipitation, Proc. IAHS, 370, 21–27, https://doi.org/10.5194/piahs-370-21-2015, 2015.
Snyder, W. C., Wan, Z., Zhang, Y., and Feng, Y. Z.: Classification-based emissivity for land surface temperature measurement from space, Int. J. Remote Sens., 19, 2753–2774, https://doi.org/10.1080/014311698214497, 1998.
Taha, H.: Urban climates and heat islands: albedo, evapotranspiration, and anthropogenic heat, Energ. Buildings, 25, 99–103, https://doi.org/10.1016/S0378-7788(96)00999-1, 1997.
Tao, W., Liu, J., Ban-Weiss, G. A., Hauglustaine, D. A., Zhang, L., Zhang, Q., Cheng, Y., Yu, Y., and Tao, S.: Effects of urban land expansion on the regional meteorology and air quality of eastern China, Atmos. Chem. Phys., 15, 8597–8614, https://doi.org/10.5194/acp-15-8597-2015, 2015.
Wan, Z. and Dozier, J.: A generalized split-window algorithm for retrieving land-surface temperature from space, IEEE T. Geosci. Remote, 34, 892–905, https://doi.org/10.1109/36.508406, 1996.
Wang, K. and Liang, S.: Evaluation of ASTER and MODIS land surface temperature and emissivity products using long-term surface longwave radiation observations at SURFRAD sites, Remote Sens. Environ., 113, 1556–1565, https://doi.org/10.1016/j.rse.2009.03.009, 2009.
Wang, K., Dickinson, R. E., and Liang, S.: Clear sky visibility has decreased over land globally from 1973 to 2007, Science, 323, 1468–1470, https://doi.org/10.1126/science.1167549, 2009.
Wang, Y., Wan, Q., Meng, W., Liao, F., Tan, H., and Zhang, R.: Long-term impacts of aerosols on precipitation and lightning over the Pearl River Delta megacity area in China, Atmos. Chem. Phys., 11, 12421–12436, https://doi.org/10.5194/acp-11-12421-2011, 2011.
Wei, J., Huang, W., Li, Z., Xue, W., Peng, Y., Sun, L., and Cribb, M.: Estimating 1-km-resolution PM2.5 concentrations across China using the space-time random forest approach, Remote Sens. Environ., 231, 111221, https://doi.org/10.1016/j.rse.2019.111221, 2019a.
Wei, J., Li, Z., Guo, J., Sun, L., Huang, W., Xue, W., Fan, T., and Cribb, M.: Satellite-derived 1-km-resolution PM1 concentrations from 2014 to 2018 across China, Environ. Sci. Technol., 53, 13265–13274, https://doi.org/10.1021/acs.est.9b03258, 2019b.
Wei, J., Li, Z., Peng, Y., Sun, L., and Yan, X.: A regionally robust high-spatial-resolution aerosol retrieval algorithm for MODIS images over Eastern China, IEEE T. Geosci. Remote, 57, 4748–4757, 2019c.
Wei, J., Li, Z., Cribb, M., Huang, W., Xue, W., Sun, L., Guo, J., Peng, Y., Li, J., Lyapustin, A., Liu, L., Wu, H., and Song, Y.: Improved 1 km resolution PM2.5 estimates across China using enhanced space–time extremely randomized trees, Atmos. Chem. Phys., 20, 3273–3289, https://doi.org/10.5194/acp-20-3273-2020, 2020.
Wiedinmyer, C., Akagi, S. K., Yokelson, R. J., Emmons, L. K., Al-Saadi, J. A., Orlando, J. J., and Soja, A. J.: The Fire INventory from NCAR (FINN): a high resolution global model to estimate the emissions from open burning, Geosci. Model Dev., 4, 625–641, https://doi.org/10.5194/gmd-4-625-2011, 2011.
Wu, H., Wang, T., Riemer, N., Chen, P., Li, M., and Li, S.: Urban heat island impacted by fine particles in Nanjing, China, Sci. Rep.-UK, 7, 11422, https://doi.org/10.1038/s41598-017-11705-z, 2017.
Wu, J., Fu, C., Zhang, L., and Tang, J.: Trends of visibility on sunny days in China in the recent 50 years, Atmos. Environ., 55, 339–346, https://doi.org/10.1016/j.atmosenv.2012.03.037, 2012.
Yang, B., Yang, X., Leung, L. R., Zhong, S., Qian, Y., Zhao, C., Chen, F., Zhang, Y., and Qi, J.: Modeling the impacts of urbanization on summer thermal comfort: the role of urban land use and anthropogenic heat, J. Geophys. Res.-Atmos., 124, 6681–6697, https://doi.org/10.1029/2018JD029829, 2019.
Yang, X., Ferrat, M., and Li, Z.: New evidence of orographic precipitation suppression by aerosols in central China, Meteorol. Atmos. Phys., 119, 17–29, https://doi.org/10.1007/s00703-012-0221-9, 2013.
Yang, X., Leung, L., Zhao, N., Zhao, C., Qian, Y., Hu, K., Liu, X., and Chen, B.: Contribution of urbanization to the increase of extreme heat events in an urban agglomeration in East China, Geophys. Res. Lett., 44, 6940–6950, https://doi.org/10.1002/2017GL074084, 2017.
Yang, Y., Gao, Z., Shi, T., Wang, H., Li, Y., Zhang, N., Zhang, H., and Huang, Y.: Assessment of urban surface thermal environment using MODIS with a population-weighted method: a case study, J. Spat. Sci., 64, 287–300, https://doi.org/10.1080/14498596.2017.1422155, 2019.
Yang, Y., Zheng, Z., Yim, S. Y., Roth, M., Ren, G., Gao, Z., Wang, T., Li, Q., Shi, C., Ning, G., and Li, Y.: PM2.5 pollution modulates wintertime urban heat island intensity in the Beijing-Tianjin-Hebei megalopolis, China, Geophys. Res. Lett., 47, e2019GL084288, https://doi.org/10.1029/2019GL084288, 2020.
Yu, W., Ma, M., Wang, X., Song, Y., and Tan, J.: Validation of MODIS land surface temperature products using ground measurements in the Heihe River Basin, China, Remote Sensing for Agriculture, Ecosystems, and Hydrology XIII (Vol. 8174, p. 817423), International Society for Optics and Photonics, https://doi.org/10.1117/12.897571, 2011.
Zaveri, R. A. and Peters, L. K.: A new lumped structure photochemical mechanism for large-scale applications, J. Geophys. Res.-Atmos., 104, 30387–30415, https://doi.org/10.1029/1999JD900876, 1999.
Zaveri, R. A., Easter, R. C., Fast, J. D., and Peters, L. K.: Model for simulating aerosol interactions and chemistry (MOSAIC), J. Geophys. Res.-Atmos., 113, D13204, https://doi.org/10.1029/2007JD008782, 2008.
Zhang, R., Li, Q., and Zhang, R.: Meteorological conditions for the persistent severe fog and haze event over eastern China in January 2013, Sci. China Earth Sci., 57, 26–35, https://doi.org/10.1007/s11430-013-4774-3, 2014.
Zhang, W., Guo, J., Miao, Y., Liu, H., Song, Y., Fang, Z., He, J., Lou, M., Yan, Y., Li, Y., and Zhai, P.: On the summertime planetary boundary layer with different thermodynamic stability in China: a radiosonde perspective, J. Climate, 31, 1451–1465, https://doi.org/10.1175/JCLI-D-17-0231.1, 2018.
Zhang, Z., Wu, W., Fan, M., Wei, J., Tan, Y., and Wang, Q.: Evaluation of MAIAC aerosol retrievals over China, Atmos. Environ., 202, 8–16, https://doi.org/10.1016/j.atmosenv.2019.01.013, 2019.
Zhao, L., Lee, X., Smith, R. B., and Oleson, K.: Strong contributions of local background climate to urban heat islands, Nature, 511, 216–219, https://doi.org/10.1038/nature13462, 2014.
Zhao, M., Cai, H., Qiao, Z., and Xu, X.: Influence of urban expansion on the urban heat island effect in Shanghai, Int. J. Geogr. Inf. Sci., 30, 2421–2441, https://doi.org/10.1080/13658816.2016.1178389, 2016.
Zheng, Z., Ren, G., Wang, H., Dou, J., Gao, Z., Duan, C., Li, Y., Ngarukiyimana, J., Zhao, C., Cao, C., Jiang, M., and Yang, Y.: Relationship between fine-particle pollution and the urban heat island in Beijing, China: observational evidence, Bound.-Lay. Meteorol., 169, 93–113, https://doi.org/10.1007/s10546-018-0362-6, 2018.
Zhong, S., Qian, Y., Zhao, C., Leung, R., Wang, H., Yang, B., Fan, J., Yan, H., Yang, X.-Q., and Liu, D.: Urbanization-induced urban heat island and aerosol effects on climate extremes in the Yangtze River Delta region of China, Atmos. Chem. Phys., 17, 5439–5457, https://doi.org/10.5194/acp-17-5439-2017, 2017.
Zhong, S., Qian, Y., Sarangi, C., Zhao, C., Leung, R., Wang, H., and Yang, B.: Urbanization effect on winter haze in the Yangtze River Delta region of China, Geophys. Res. Lett., 45, 6710–6718, https://doi.org/10.1029/2018GL077239, 2018.
Zhou, D., Zhao, S., Zhang, L., Sun, G., and Liu, Y.: The footprint of urban heat island effect in China, Sci. Rep.-UK, 5, 1–11, https://doi.org/10.1038/srep11160, 2015.
Zhou, D., Zhang, L., Hao, L., Sun, G., Liu, Y., and Zhu, C.: Spatiotemporal trends of urban heat island effect along the urban development intensity gradient in China, Sci. Total Environ., 544, 617–626, https://doi.org/10.1016/j.scitotenv.2015.11.168, 2016.