the Creative Commons Attribution 4.0 License.
the Creative Commons Attribution 4.0 License.
 | 04 Jun 2020
Understanding and improving model representation of aerosol optical properties for a Chinese haze event measured during KORUS-AQ
Zifeng Lu
Daniel L. Goldberg
David G. Streets
Jung-Hun Woo
Andreas Beyersdorf
Chelsea A. Corr
Kenneth L. Thornhill
Bruce Anderson
Johnathan W. Hair
Amin R. Nehrir
Glenn S. Diskin
Jose L. Jimenez
Benjamin A. Nault
Pedro Campuzano-Jost
Jack Dibb
Eric Heim
Kara D. Lamb
Joshua P. Schwarz
Anne E. Perring
Jhoon Kim
Myungje Choi
Brent Holben
Gabriele Pfister
Alma Hodzic
Gregory R. Carmichael
Louisa Emmons
James H. Crawford
KORUS-AQ was an international cooperative air quality field study in South Korea that measured local and remote sources of air pollution affecting the Korean Peninsula during May–June 2016. Some of the largest aerosol mass concentrations were measured during a Chinese haze transport event (24 May). Air quality forecasts using the WRF-Chem model with aerosol optical depth (AOD) data assimilation captured AOD during this pollution episode but overpredicted surface particulate matter concentrations in South Korea, especially PM2.5, often by a factor of 2 or larger. Analysis revealed multiple sources of model deficiency related to the calculation of optical properties from aerosol mass that explain these discrepancies. Using in situ observations of aerosol size and composition as inputs to the optical properties calculations showed that using a low-resolution size bin representation (four bins) underestimates the efficiency with which aerosols scatter and absorb light (mass extinction efficiency). Besides using finer-resolution size bins (8–16 bins), it was also necessary to increase the refractive indices and hygroscopicity of select aerosol species within the range of values reported in the literature to achieve better consistency with measured values of the mass extinction efficiency (6.7 m2 g−1 observed average) and light-scattering enhancement factor (f(RH)) due to aerosol hygroscopic growth (2.2 observed average). Furthermore, an evaluation of the optical properties obtained using modeled aerosol properties revealed the inability of sectional and modal aerosol representations in WRF-Chem to properly reproduce the observed size distribution, with the models displaying a much wider accumulation mode. Other model deficiencies included an underestimate of organic aerosol density (1.0 g cm−3 in the model vs. observed average of 1.5 g cm−3) and an overprediction of the fractional contribution of submicron inorganic aerosols other than sulfate, ammonium, nitrate, chloride, and sodium corresponding to mostly dust (17 %–28 % modeled vs. 12 % estimated from observations). These results illustrate the complexity of achieving an accurate model representation of optical properties and provide potential solutions that are relevant to multiple disciplines and applications such as air quality forecasts, health impact assessments, climate projections, solar power forecasts, and aerosol data assimilation.
- Article
(4369 KB) - Full-text XML
- BibTeX
- EndNote


Exposure to air pollutants is estimated to be the leading environmental risk affecting human health (Gakidou et al., 2017), and aerosols represent the leading pollutant responsible for these effects (Cohen et al., 2017). The estimates of aerosol impacts on human health generally involve the use of ground-based monitoring networks that are combined with aerosol optical depth (AOD) satellite retrievals and/or model estimates for regions not monitored to obtain global estimates (Liu et al., 2009; van Donkelaar et al., 2016; Goldberg et al., 2019a). The use of AOD to estimate surface concentrations often involves using atmospheric composition simulations able to “translate” a column-integrated measure of light extinction due to aerosols (AOD) into surface aerosol mass concentrations. Satellite AOD is also often used to improve air quality forecasts of surface particulate matter through data assimilation (Saide et al., 2013, 2014; Kumar et al., 2019; Benedetti et al., 2009). Aerosols also impact climate through aerosol–cloud–radiation interactions and represent one of the largest uncertainties in climate projections (Boucher et al., 2013). Chemistry–climate models estimate 3-D distributions of aerosols, which are used by a radiative transfer module to estimate aerosol radiative effects. Again, this translation of aerosol mass to optical properties is performed in these models, often showing large inter-model variability (Myhre et al., 2013; Stier et al., 2013; Kipling et al., 2016). Similarly, short-term predictions of solar power (Schroedter-Homscheidt et al., 2013; Jimenez et al., 2016) and visibility forecasts (Clark et al., 2008; Lee et al., 2017) also require the use of aerosol optical properties. Thus, evaluating the ability of models to properly translate aerosol mass and number concentrations into aerosol optical properties is key to providing confidence in model results supporting these disciplines.
Previous research has shown various degrees of consistency between model evaluations of surface aerosol mass concentrations and column-integrated aerosol properties. Lee et al. (2016) used satellite AOD to constrain surface PM10 (particulate matter with diameters below 10 µm) predictions and found large improvements against surface monitors regardless of the model used for aerosol optical properties. Their results also showed slight discrepancies in the PM10 and AOD when comparing models to observations, with some optical models showing larger biases in PM10 than AOD and some presenting the opposite behavior. Lennartson et al. (2018) also found discrepancies when comparing the ratio between PM2.5 and AOD for observations and WRF-Chem simulations; the modeled ratios were 30 %–50 % higher over South Korea during May–June 2016. Similar discrepancies were found by Mangold et al. (2011) when assessing model skill in predicting a regional pollution event over Europe driven by forest fire emissions and stagnation. Crippa et al. (2019) performed an ensemble of simulations to assess what combination of model inputs and configurations resulted in the best agreement with observations in the southeast US. They reported that simulations configured with a modal aerosol model performed the best against AOD observations, while a sectional aerosol approach showed the best agreement against surface PM2.5, and hypothesized that aerosol hygroscopic growth and optical properties calculations could play a role in this discrepancy. Palacios-Peña et al. (2019) evaluated the aerosol optical properties of an ensemble of models over Europe, finding that differences due to diversity in modeling systems were larger than when using different emission inventories or when turning aerosol radiative feedbacks on and off. Reddington et al. (2016) evaluated a global aerosol model in tropical regions affected by biomass burning. They found that the model underestimated AOD more than PM2.5, even when an upper-limit estimate of aerosol hygroscopicity was assumed for the aerosols. Reddington et al. (2019) found further inconsistencies, as the model showed a good representation of the observed vertical profile while underestimating AOD, and hypothesized it was due to uncertainties in the AOD computations. In another study, Zieger et al. (2013) compared observations of scattering enhancement due to hygroscopic growth against results from the Optical Properties of Aerosols and Clouds (OPAC) software module, showing a systematic overprediction. This overprediction could lead to mismatches between AOD and PM2.5 in models using this code. Curci et al. (2019) evaluated black carbon absorption for an ensemble of models over Europe and North America, finding that biases were driven by the mixing state assumptions in the optical properties computations.
The KORUS-AQ (Korea–United States Air Quality) campaign was an international cooperative air quality field study in South Korea that measured local and remote (e.g., anthropogenic, biomass burning, dust) sources of air pollution affecting the Korean Peninsula during May–June 2016. The objectives of the present study are to (1) evaluate one of the forecast systems used to support flight planning during the mission; (2) assess the degree of consistency between aerosol optical properties and mass concentrations for the forecasting and other configurations; and (3) explain the identified discrepancies. The results will provide guidance for future model development and we expect will motivate this type of analysis for other modeling systems and locations.
2.1 Regional modeling
Air quality forecasts were performed using the Weather Research and Forecasting model (Skamarock et al., 2008) coupled to Chemistry (WRF-Chem) (Grell et al., 2005) to support both KORUS-AQ flight planning and post-campaign analysis. The modeling domains are shown in Fig. 1, with a regional domain of 20 km resolution, covering major source regions of transboundary pollutants affecting the Korean Peninsula: anthropogenic pollution from eastern China, dust from inner China and Mongolia, and wildfires from Siberia (Saide et al., 2014). A 4 km resolution domain was nested to cover the Korean Peninsula and surroundings at higher resolution. This inner domain encompassed the region where the KORUS-AQ flights were planned and was able to better resolve local sources. The forecasts were performed once daily and used meteorological initial and boundary conditions from the National Centers for Environmental Prediction Global Forecast System (NCEP, 2007) and chemical boundary conditions from the Copernicus Atmosphere Monitoring Service (Inness et al., 2015). Initial conditions for gases and aerosols were obtained from the previous forecasting cycle. AOD data assimilation was implemented for the outer domain using data from low-earth-orbiting (GMAO Neural Network retrieval) and geostationary satellites (Geostationary Ocean Color Imager retrievals; Choi et al., 2016, 2018; Lee et al., 2010) as described in Saide et al. (2014). To our knowledge, this was the first near-real-time implementation of assimilating geostationary AOD. Each assimilation step modified aerosol mass, keeping the species distribution and size of each bin constant. Thus, the assimilation had the potential to change the bin-aggregated composition and size distribution when size bins with different compositions were scaled differently. Although there was no data assimilation performed on the inner domain, this domain was initialized 18 h after the outer domain and was thus influenced by data assimilation through initial and boundary conditions. The forecast configuration was based on WRF-Chem version 3.6.1 with modifications. The aerosol and gas chemistry packages corresponded to the four-size-bin Model for Simulating Aerosol Interactions and Chemistry (MOSAIC; Zaveri et al., 2008) and a simplified hydrocarbon chemical mechanism (Pfister et al., 2014), both selected to reduce computational costs compared to using the eight-size-bin MOSAIC configuration and more complex chemical mechanisms. Although detailed secondary organic aerosol (SOA) formation schemes have been implemented for the four-bin MOSAIC configuration (Shrivastava et al., 2013; Knote et al., 2015), it increases computational costs significantly. Thus, the simplified SOA formation scheme, proposed by Hodzic and Jimenez (2011) and verified to work well in multiple later studies (e.g., Hayes et al., 2015; Shah et al., 2019), was implemented to keep computational costs low. While this scheme included anthropogenic and biomass burning SOA, biogenic SOA was also modeled by using an SOA precursor surrogate derived from isoprene as described in Shrivastava et al. (2011). Aerosol–radiation interactions were included (Fast et al., 2006), while aerosol–cloud interactions were excluded to avoid the computational costs of tracking cloud-borne aerosols. Anthropogenic emissions were developed by Konkuk University for KORUS-AQ forecasting and are described in Choi et al. (2019a) and Goldberg et al. (2019b). Natural dust, sea spray, and biogenic emissions were computed online using the Goddard Aerosol Radiation and Transport (GOCART) scheme (Ginoux et al., 2001; Zhao et al., 2010), following Gong et al. (2002), and estimates from the Model of Emissions of Gases and Aerosol from Nature (MEGAN; Guenther et al., 2006), respectively. Biomass burning emission estimates were obtained from the Quick Fire Emissions Dataset (Darmenov and da Silva, 2015) and were added using the online plume-rise model implemented in WRF-Chem (Grell et al., 2011). Other modeling configurations related to meteorological parameterizations and analysis nudging are described in Saide et al. (2014).
Table 1Summary of WRF-Chem simulations. Refractive indices, hygroscopicity parameters, and size bins are defined in Tables 2 and 3. Refer to Sect. 3.2 and 3.3 for definitions of the base and updated configurations.
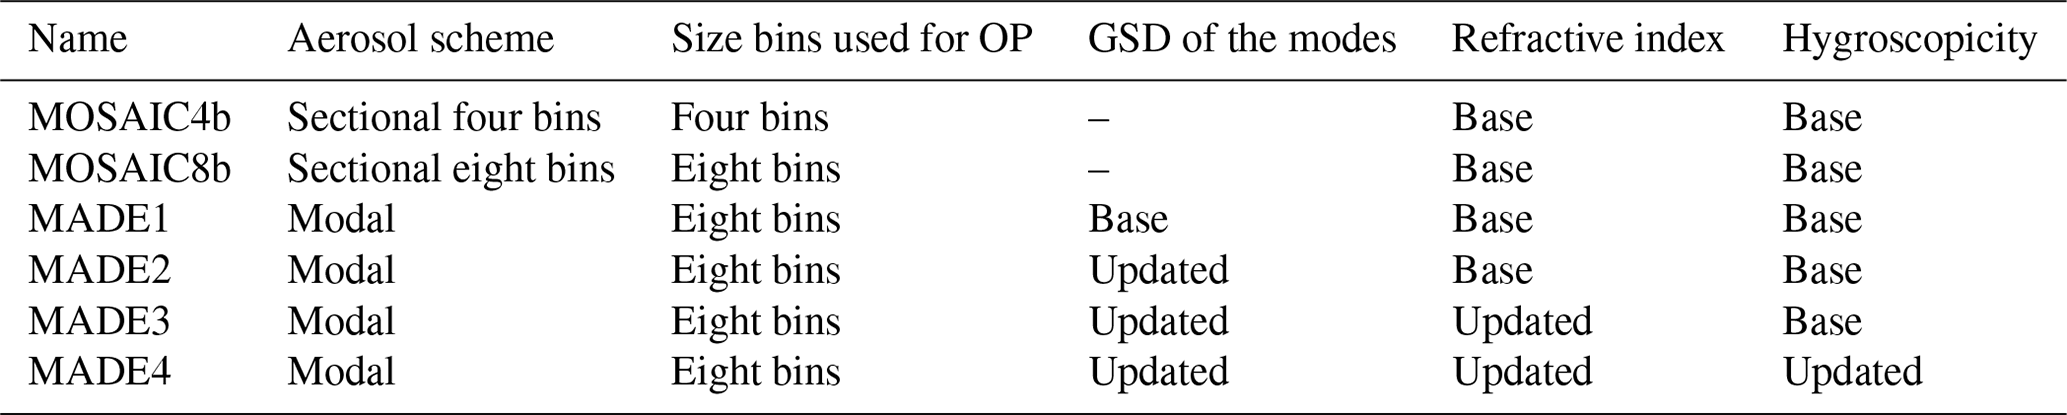

Figure 1Modeling domains for the forecast simulations. Only the outer domain is used for the retrospective simulations.
In addition to the forecasting results, we performed retrospective sensitivity simulations summarized in Table 1. We first used the same configuration as the forecast, which we labeled MOSAIC4b. To explore the model sensitivity to increasing the resolution of the aerosol size bins, we performed simulations using the MOSAIC eight-bin configuration coupled to the Carbon Bond Mechanism version Z (CBM-Z) chemical scheme (Zaveri and Peters, 1999) and labeled it MOSAIC8b. Some caveats of this sensitivity simulation are that it uses a different gas-phase chemistry scheme and does not include secondary organic aerosol formation; thus, this needs to be considered in the analysis when comparing it to the base configuration. WRF-Chem can also be configured with the Modal Aerosol Dynamics Model for Europe (MADE) model, whereby aerosol sizes are represented by lognormal modes (as opposed to sections as for MOSAIC). We used the configuration coupled to the updated Regional Atmospheric Chemistry Mechanism (RACM; Ahmadov et al., 2015), which contains secondary organic aerosol formation using the volatility basis set (Ahmadov et al., 2012) and aerosol optical properties calculations (Tuccella et al., 2015). We label these simulations as MADE plus a number, with the number going from 1 to 4 depending on changes to the parameters described in Table 1.
Simulations MOSAIC4b, MOSAIC8b and MADE1 are referred to as base configurations, while MADE2–4 are sensitivity simulations. All retrospective simulations were performed only for the 20 km resolution domain in this study, as we focus on a pollution event from long-range transport (24–26 May 2016). Also, no data assimilation was performed for these simulations. Unless otherwise noted, they use the same inputs and parameterizations as for the forecast simulations.
Table 2Real refractive indexes (dimensionless), hygroscopicity parameter (dimensionless), and aerosol density (g cm−3) used in the base and updated configurations. Values that changed in the updated configurations are noted in italics. Note that measured organic aerosol density was used in the closure studies.
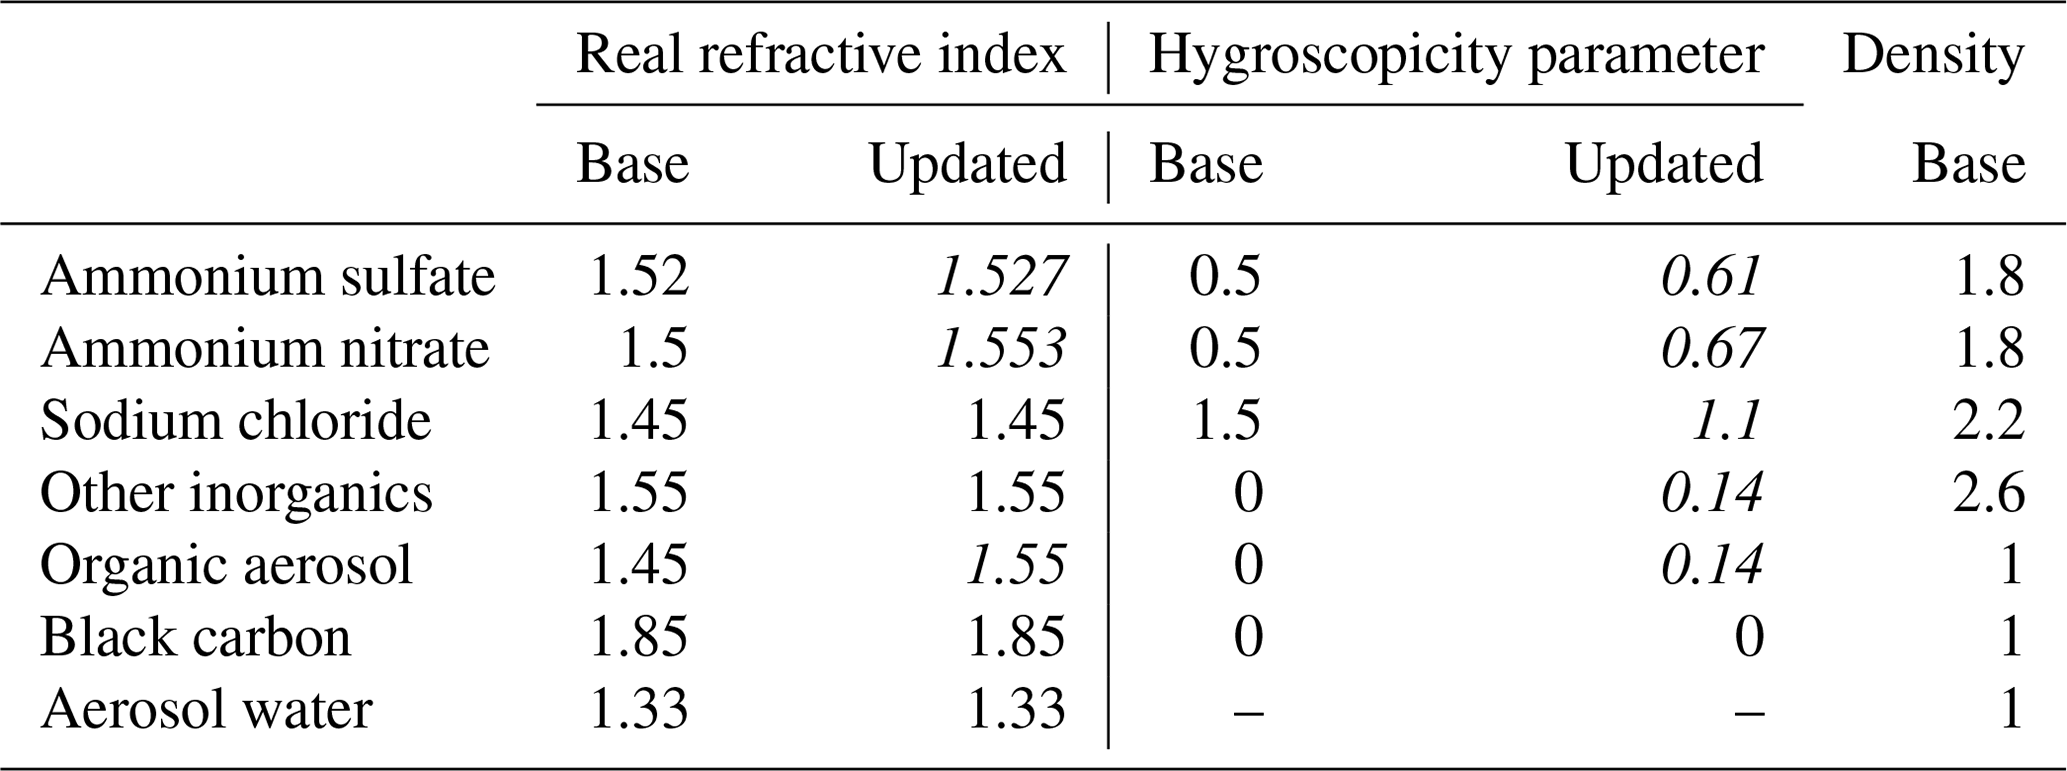
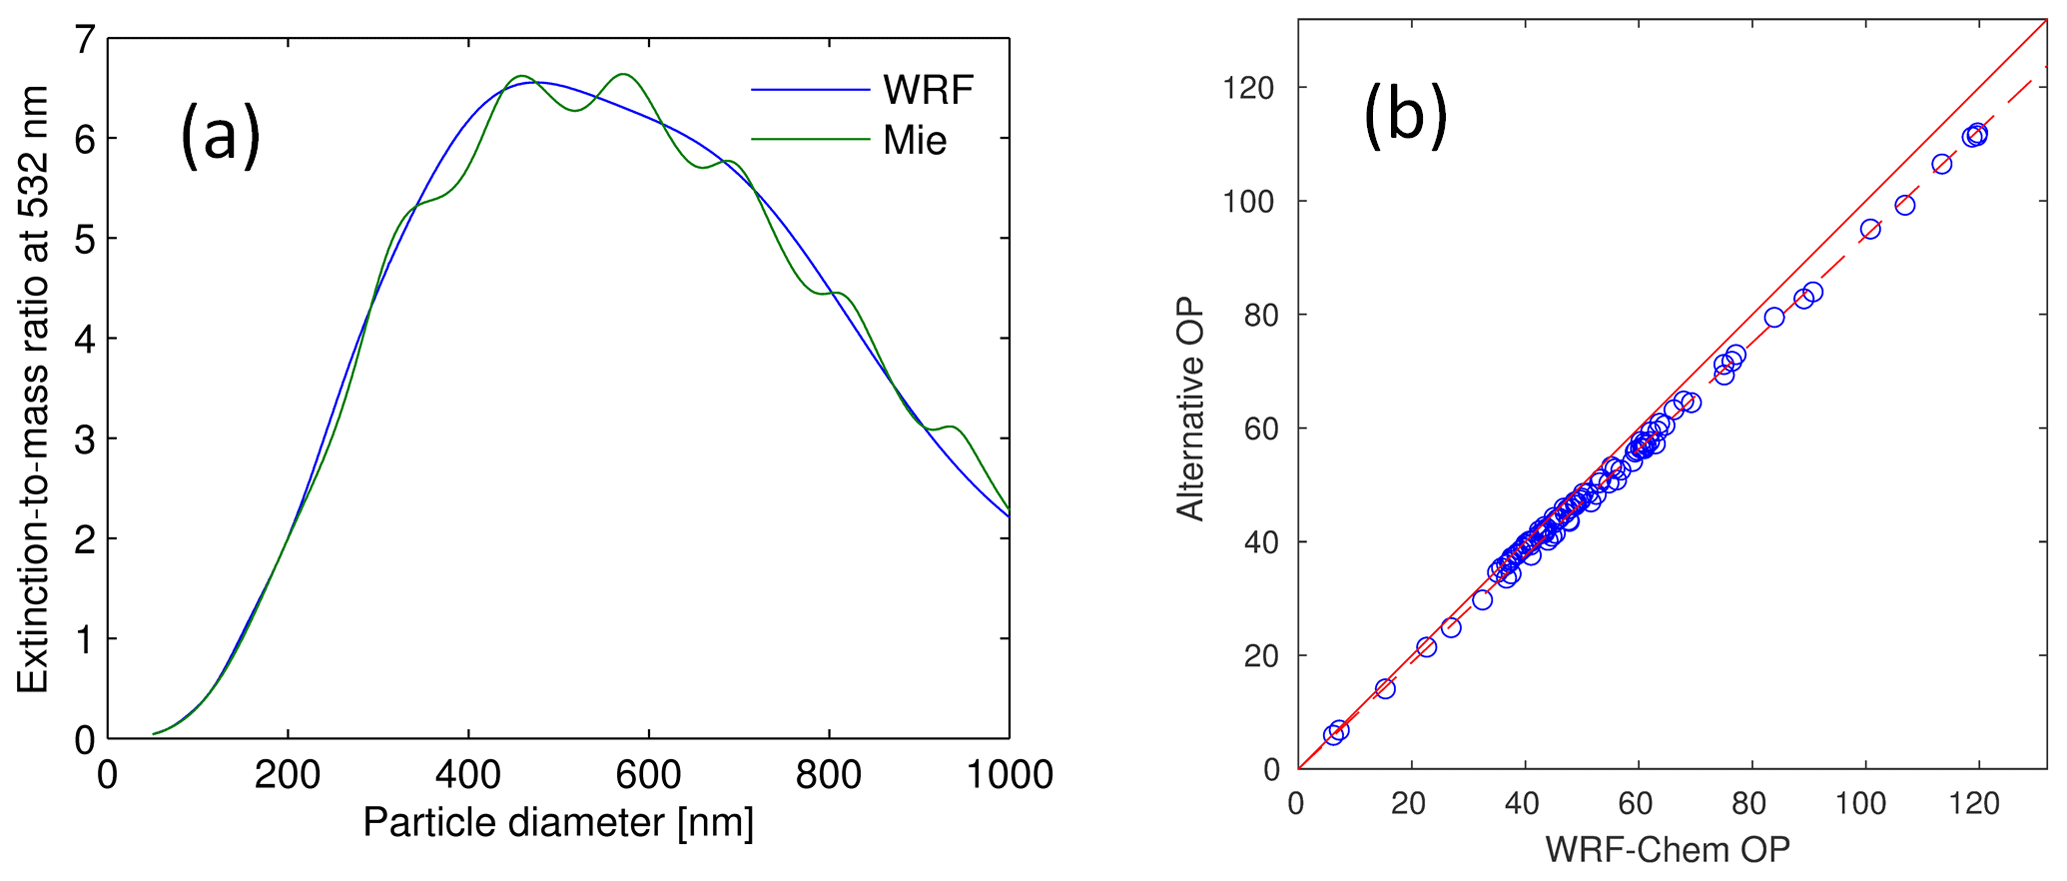
Figure 2(a) Extinction-to-mass ratio for dry conditions (20 % RH) as a function of dry particle diameter considering a monodisperse aerosol distribution of fixed aerosol composition equal to the mean of the data analyzed. Blue and green lines represent results using optical properties code from WRF-Chem and the alternative approach, respectively. (b) Scatterplot comparing aerosol water (µg m−3) estimated by WRF-Chem routines for the forecast simulations (MOSAIC four-bin) and using the alternative approach at 80 % RH during 02:00–05:00 UTC of the flight analyzed in this study. The solid red line indicates the 1:1, line and the dashed red line represents the regression line (slope of 0.94).
2.2 Optical properties calculation
Aerosol optical properties in WRF-Chem are computed using a Mie code and Chebyshev expansion coefficients for each size bin, assuming an internal mixture within the bin and a volume mixing rule (Fast et al., 2006). The refractive indices (real part) and density used for each species are defined in Table 2 under the base configuration column. Only black carbon and other inorganics (OINs; inorganic aerosols other than sulfate, ammonium, nitrate, chloride, and sodium) are considered to absorb solar radiation with an imaginary refractive index of 0.71 and 0.006, respectively. For the MOSAIC configurations, the size bins in the optical properties calculation correspond to those in the aerosol model (four and eight size bins, defined in Table 3), while for modal aerosols the modes are mapped to eight sectional bins (the same boundaries as the eight MOSAIC bins) before the calculation by computing the aerosol mass and number concentration included in each section. WRF-Chem computes optical properties for ambient conditions. Thus, the derivation of dry extinction and scattering enhancements due to hygroscopic growth at fixed relative humidity requires computations at the post-processing stage. These computations require the aerosol water to be recalculated for the specified relative humidity. Since both the MOSAIC and MADE aerosol models compute aerosol water based on aerosol thermodynamics, versions of these computations are needed at the post-processing stage. In order to simplify the process and add additional capabilities, an alternative optical properties code at the post-processing stage was developed that mimics the WRF-Chem one. This alternative approach uses Mie calculations from the Mätzler (2002) code, which is based on the Appendix of Bohren and Huffman (1983). Aerosol water uptake was parameterized using the method proposed by Petters and Kreidenweis (2007), which utilizes the hygroscopicity parameter (κ). Values for the hygroscopicity parameter representing the base configuration are obtained from the WRF-Chem code used to compute aerosol water for the Goddard Chemistry Aerosol Radiation and Transport (GOCART; Chin et al., 2002) model, which implements the κ approach and a volume mixing rule. Following this configuration κ is set to 0.5 for ammonium sulfate and ammonium nitrate. For sodium chloride κ is set to 1.5 (Zieger et al., 2017). For organic aerosol, black carbon, and dust, κ is set to zero as these aerosol types are currently not considered to be electrolytes in the MOSAIC and MADE thermodynamic models and thus do not contribute to water uptake in these frameworks (Fast et al., 2006). Ways to improve these simplifications will be discussed later in the text. Figure 2 shows an evaluation of the alternative approach against the WRF-Chem routines used in post-processing mode for the MOSAIC model that were developed as part of the data assimilation scheme (Saide et al., 2013). Under dry conditions, the alternative approach shows similar results as the WRF-Chem optical properties, with the extinction-to-mass ratio curves following each other for all sizes (Fig. 2a). The high-frequency oscillations shown by the Mie code of our alternative approach are smoothed in WRF-Chem due to the use of the Chebyshev expansion coefficients (Fast et al., 2006) and interpolation between wavelengths (optical properties at 400 and 600 nm are used to derive values at mid-visible wavelengths). Water uptake using the MOSAIC approach and the one described here provides similar results (Fig. 2b), with values ∼7 % lower in the alternative approach that will be taken into consideration when evaluating the optical properties code in the next sections. The alternative optical properties code provides flexibility to evaluate changes in configuration that would be difficult to implement in the WRF-Chem optical properties code. These include using more than eight bins to improve size resolution, using variable density for aerosol species, and altering κ to vary the extent to which different aerosol chemical species take up water.
2.3 Airborne observations
Airborne data used in this study were measured by instruments onboard the NASA DC-8 research aircraft as part of the KORUS-AQ campaign (Aknan and Chen, 2019) during the flight starting at 22:00 UTC on 24 May (25 May local Korean time) 2016. This flight focused on measurements over the Yellow Sea and sampled some of the highest aerosol mass concentrations of the deployment, originating mostly from anthropogenic pollution from China (Peterson et al., 2019; Nault et al., 2018). This flight was also chosen as it corresponds to a period of large model discrepancies (see the “Results and discussion” section). Measurements used in this study include numerous in situ chemical compositions, mass concentrations, and physical properties of the aerosol, as well as remote sensing physical properties of the aerosol. PM1, not including black carbon, was measured by the University of Colorado Boulder high-resolution time-of-flight aerosol mass spectrometer (HR-ToF-AMS, hereinafter AMS for short; DeCarlo et al., 2006; Nault et al., 2018). These measurements included the mass concentrations of sulfate, nitrate, ammonium, chloride, and organic aerosol, as well as the estimated aerosol density. The estimation of aerosol density is described in Nault et al. (2018) and DeCarlo et al. (2004). Refractory black carbon concentrations were measured by the NOAA Single Particle Soot Photometer (SP2; Lamb et al., 2018). Bulk water-soluble inorganic aerosol was measured by the University of New Hampshire using Teflon filters, followed by offline ion chromatography with an estimated aerodynamic diameter cutoff of ∼4 µm (SAGA; Dibb et al., 2000; McNaughton et al., 2007). The in situ physical aerosol properties were measured by the NASA Langley Aerosol Research Group (LARGE), which included dry aerosol scattering, extinction and single-scattering albedo, and scattering enhancements due to hygroscopic growth. These measurements were done with two TSI nephelometers (at 450, 550, and 700 nm wavelength) and a particle soot absorption photometer (at 470, 532, and 660 nm wavelength) as described in Ziemba et al. (2013). Aerosol size distributions were also measured by the LARGE suite using a scanning mobility particle sizer (SMPS, TSI model 3936), a laser aerosol spectrometer (LAS, TSI model 3340), and an aerodynamic particle sizer (APS, TSI model 3321). AMS and SP2 measure mostly submicron aerosols, while the LARGE inlet cutoff is at 5 µm aerodynamic diameter (McNaughton et al., 2007). Relative humidity was estimated using measurements of water vapor from the NASA Langley/Ames Diode Laser Hygrometer (Podolske et al., 2003). Finally, extinction curtains were measured using the Airborne Differential Absorption Lidar–High Spectral Resolution Lidar (DIAL–HSRL; Hair et al., 2008) from the NASA Langley lidar group. In situ data were obtained from the 1 s merges (version 3) and merged with the corresponding version of the data that was available through individual files (e.g., size distributions).
Table 3Lower and upper diameters (µm) for the 4, 8, and 16 size bin configurations.
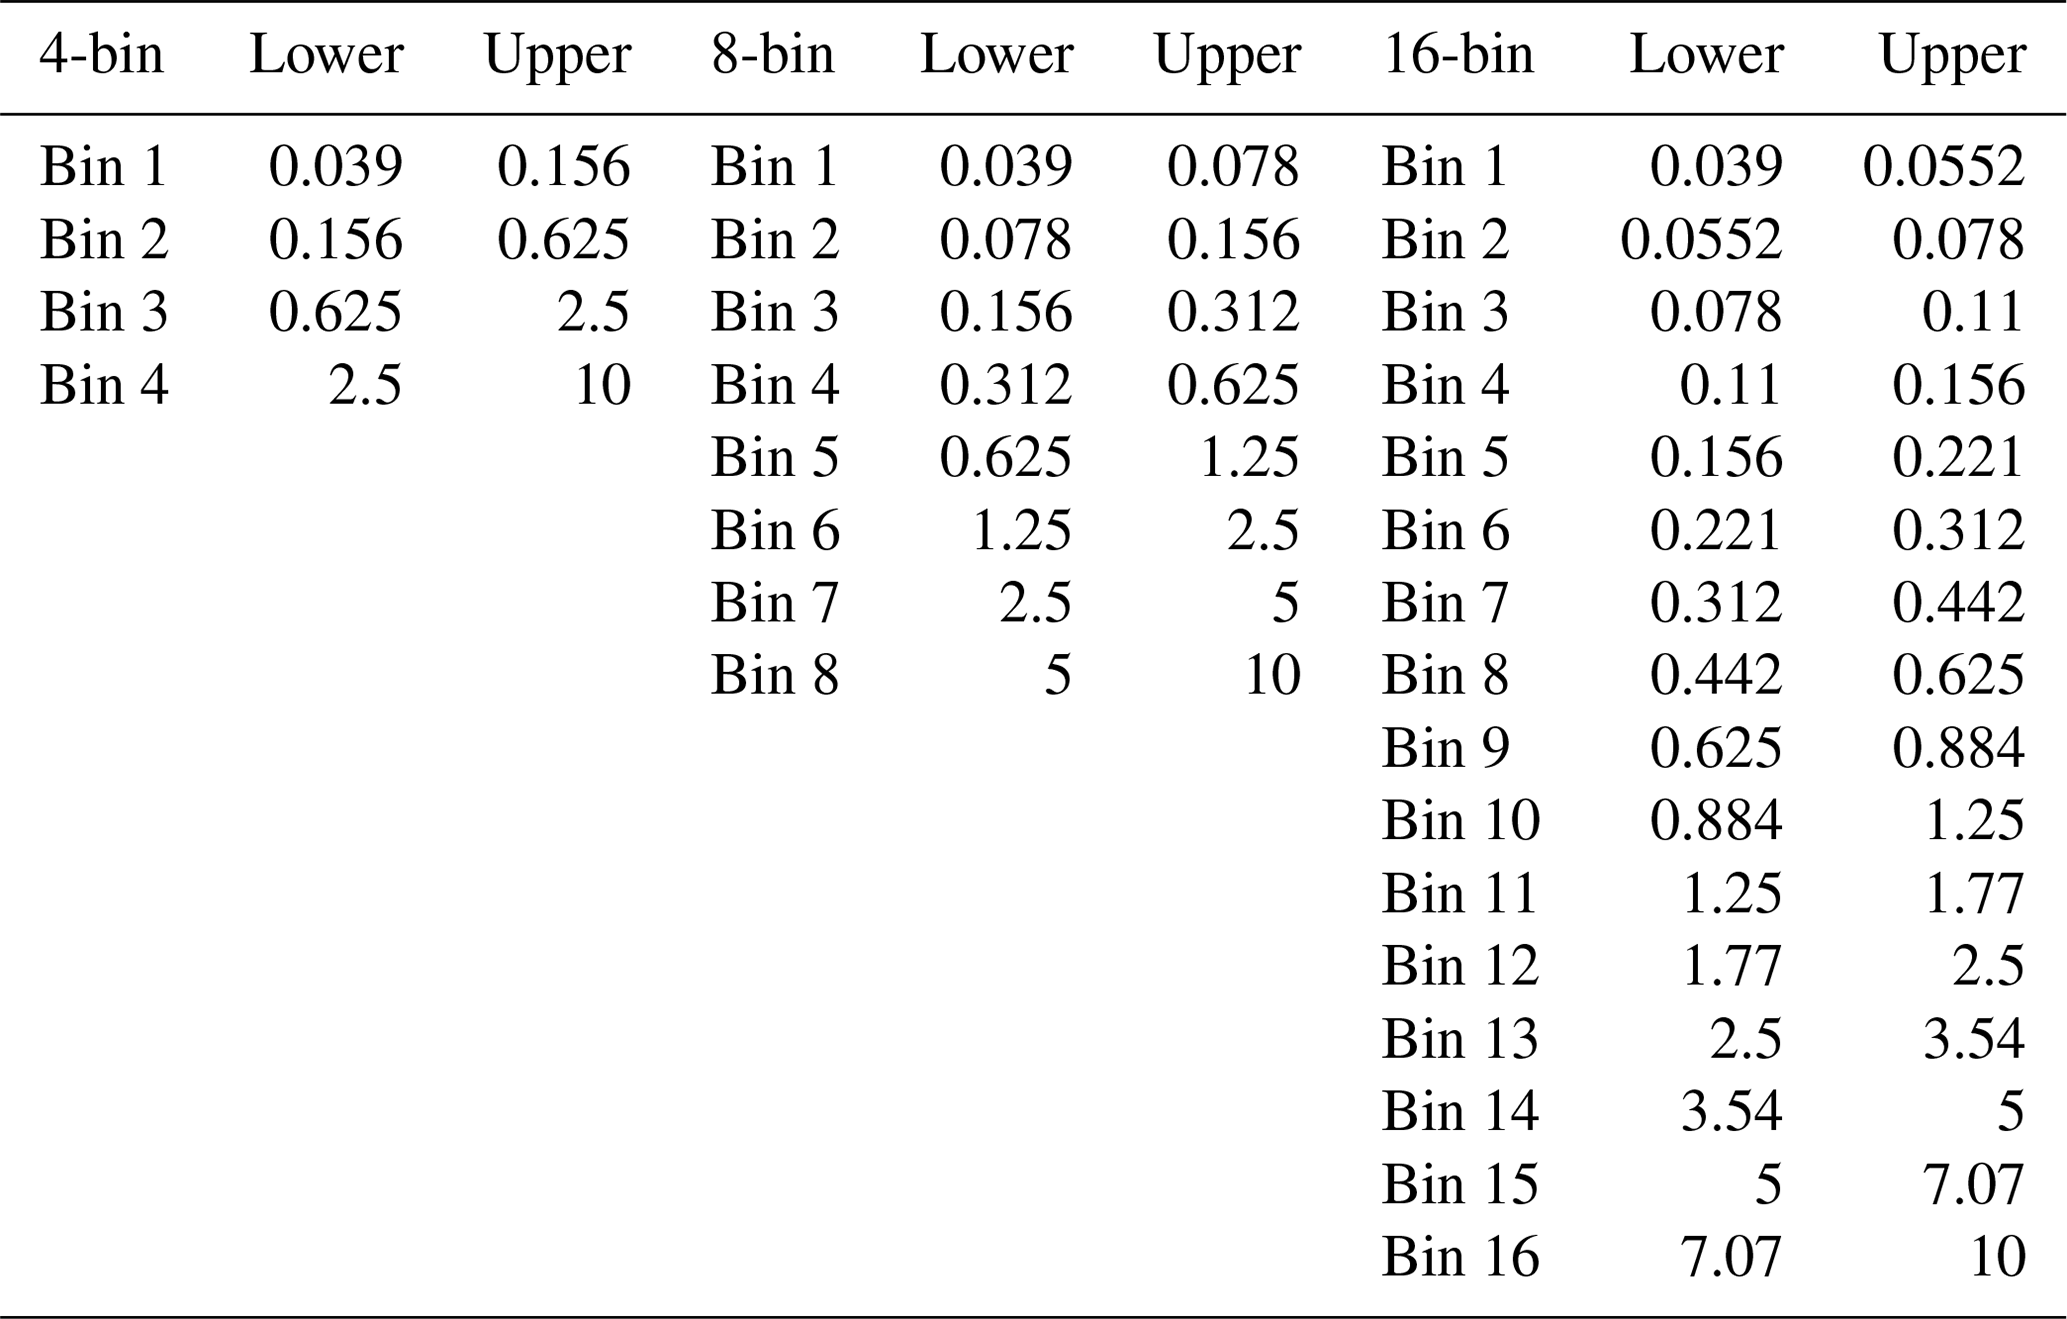
Though the instruments measuring size distributions overlap in some size bins, they use different sampling frequencies, and they use different sizing techniques based on different measures of aerosol diameters (e.g., geometric, optical, and aerodynamic). Thus, these measurements need to be homogenized and combined to obtain a single size distribution. A total of 32 size bins using a geometric diameter from a lower bound of 39 nm to an upper bound of 10 µm with a width (dlnD) of 0.1737 are used to re-bin the SMPS, LAS, and APS size distributions. These boundaries and the width are chosen so the distributions can be easily aggregated to the modeled size bins (Table 3). Data from the SMPS, LAS, and APS are used for bins 1–8 (39–156 nm), 9–18 (156–743 nm), and 19–32 (743 nm–10 µm), respectively. APS measures aerodynamic diameters, and thus these are converted to geometric diameters by multiplying the aerodynamic diameter by (valid in the continuum regime where most of the coarse-mode aerosol mass is in this study) and assuming a dynamic shape factor (X=1.6) and density (ρ=2.6 g cm−3) for dust aerosols, which we assume dominates the coarse-mode aerosol. This assumption is made as AMS and SAGA measured similar concentrations of inorganic species (Fig. 3a), and thus sulfate, ammonium, chloride, and nitrate were mostly not present in sizes covered by SAGA but not by AMS. But since the aerosol size distribution measurements do show aerosol presence in these coarse sizes, we assume it is dominated by dust. Although LAS measures geometric diameter when particles are spherical, it is calibrated with National Institute of Standards and Technology (NIST)-traceable polystyrene latex (PSL) spheres, which have a larger refractive index (1.595) than the mixtures measured during the flight. Thus, LAS diameters are multiplied by 1.115 to approximately correct for this difference (Nault et al., 2018). While LAS and APS results are reported at 1 Hz frequency, SMPS provides data every minute. Since most datasets used in this work are provided at 1 Hz, we use nearest-neighbor interpolation to assign SMPS values at 1 Hz resolution. This is likely to have a negligible impact on our results as there is little aerosol mass in the bins assigned from the SMPS and mass extinction efficiency is low at these sizes.
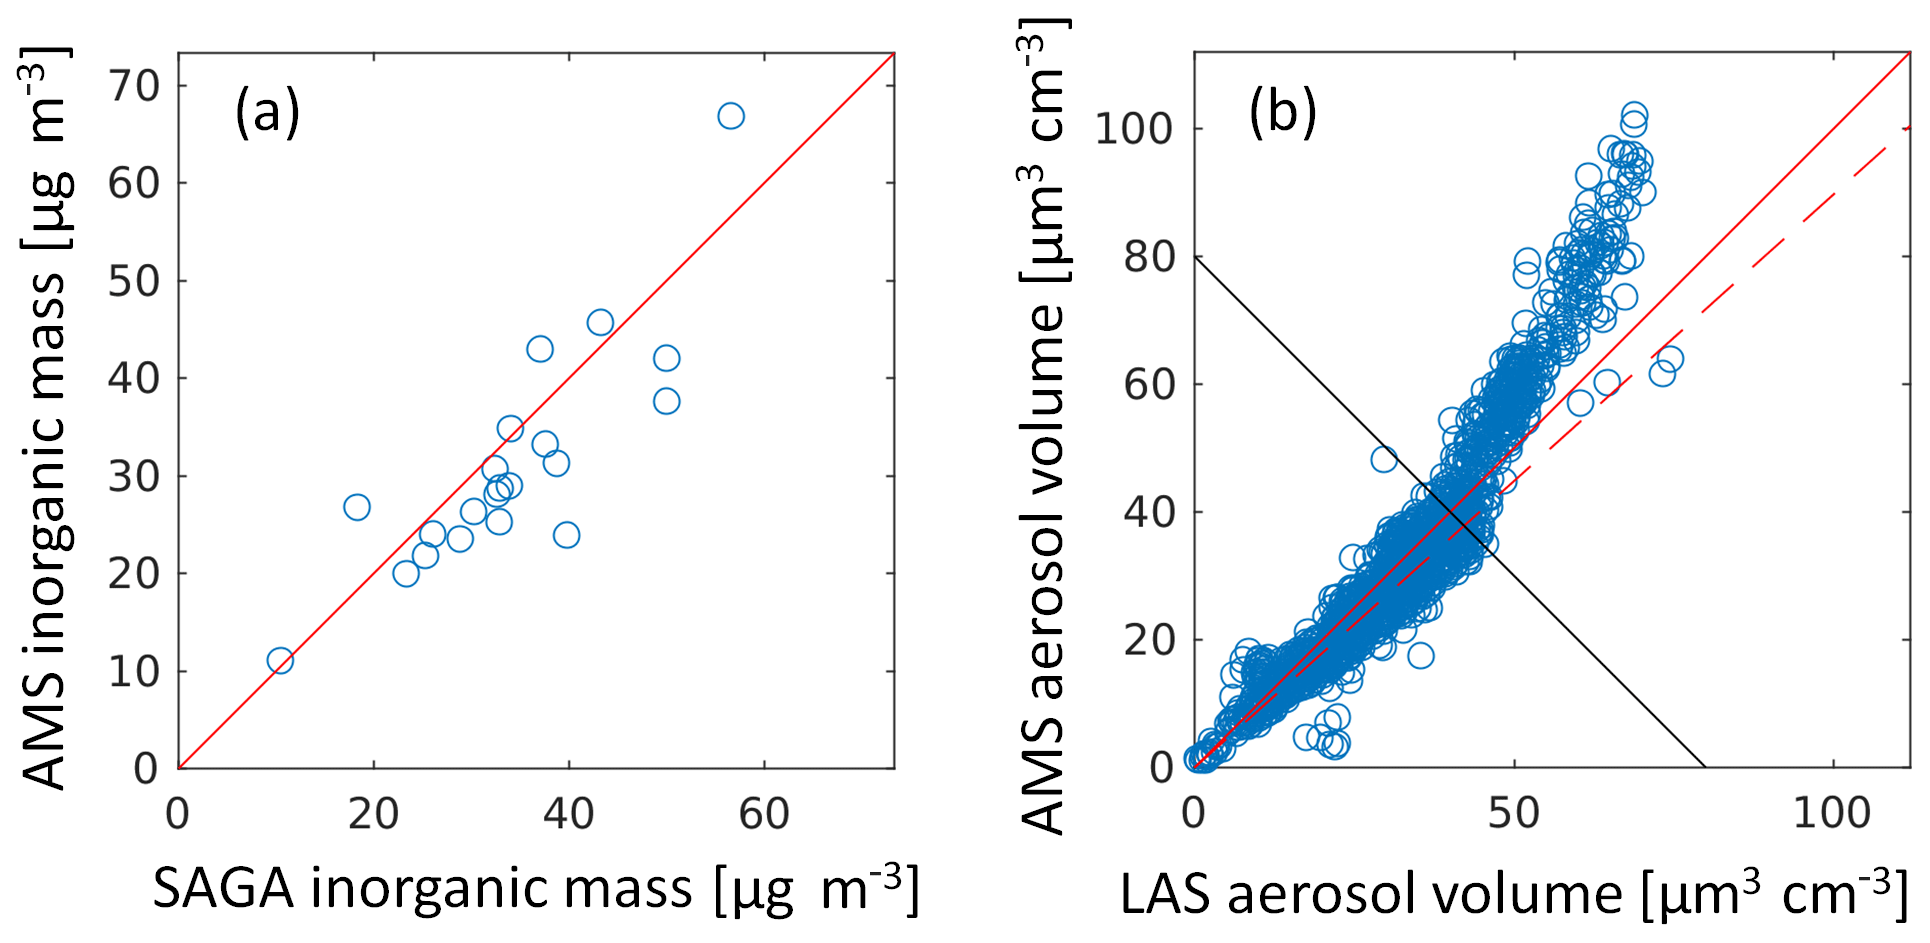
Figure 3(a) Scatterplot of total inorganic aerosol (sulfate, ammonium, chloride, and nitrate) mass (µg m−3) as measured by SAGA and AMS, averaging the AMS data to the SAGA integration time (R2=0.72, slope =1.07). The solid red line indicates the 1:1 line. (b) Scatterplot of aerosol volume measured by the AMS and LAS, accounting for the AMS transmission. The solid red line indicates the 1:1 line, the solid black line represents an approximate cutoff for the LAS saturation, and the dashed red line represents the regression line when using data below the black line (slope of 0.9).
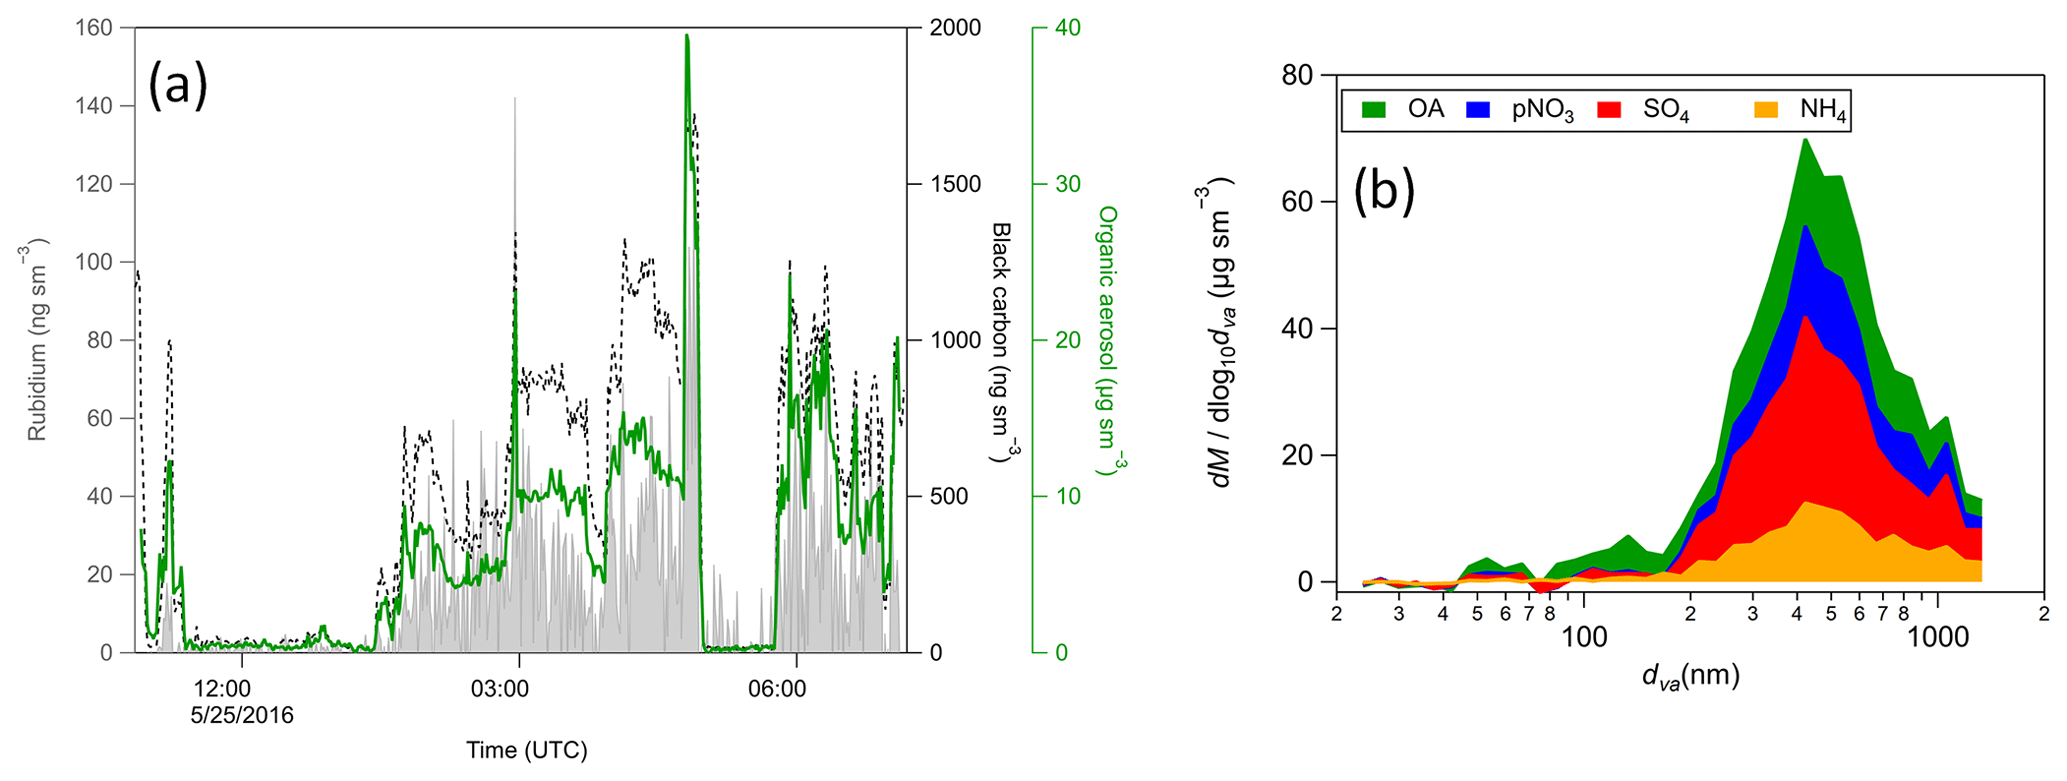
Figure 4(a) Time series of rubidium (grey, left axis, measured by the AMS), black carbon (black dashed line, right axis, measured by SP2), and total organic aerosol (green, right axis, measured by AMS) during the haze event sampled by the NASA DC-8 over the Yellow Sea. Rubidium was quantified using the AMS difference signal, a relative ionization efficiency of 1, and the same collection efficiency as the rest of the submicron aerosol (Nault et al., 2018). (b) Average size-resolved AMS measurements sampled (aerodynamic diameter) by the NASA DC-8 for the same period shown in (a).
Previous studies have found a saturation of the LAS detector for large aerosol number and mass concentrations (Liu et al., 2017; Nault et al., 2018), which occurs when scattering from individual particles starts overlapping so that the signal does not go down to the baseline between events. This was the case for a large fraction of the measurements in the haze layer during the flight studied. Figure 3b shows that while this saturation is evident for large aerosol mass concentrations, for lower aerosol mass concentrations (with no saturation expected) the LAS measures larger volume concentrations than the AMS+SP2 by ∼11 %. Although 11 % falls within the stated accuracies of both measurements, it also potentially reflects a true difference in concentrations. The AMS detected exotic metals not typically reported, such as rubidium (Fig. 4a), in the haze event. There was, on average, 10 ng sm−3 of rubidium in the plume between 01:30 and 05:00 UTC (and up to 71 ng sm−3). Rubidium originates either from soil (e.g., dust; Kabata-Pendias and Pendias, 2001) or anthropogenic emissions, such as dust from steel and aluminum industries (Dillner et al., 2006; Tang et al., 2018). Rubidium is one of numerous types of metal emitted from these sources and would account for the minority of the mass for these emissions (Dillner et al., 2006). Also, the detection shown here is likely a lower limit of the actual concentrations considering the refractory nature of aerosols typically containing rubidium. The presence of rubidium would suggest other inorganic material present in the haze event not typically measured by the AMS, further suggesting that the 11 % difference in volume is due to these types of compounds. Thus, we corrected the LAS submicron number and volume distributions using the aerosol mass measured by the AMS+SP2 accounting for the ∼11 % volume not detected. For this, scaling factors were computed using the aerosol volume (estimated using the measured aerosol mass and the aerosol density reported by the AMS), corrected by 11 %, and dividing by the measured LAS volume, accounting for the AMS transmission. The AMS transmission considers 100 % and 0 % efficiency at aerodynamic diameters of 550 nm and 1.5 µm, respectively, and a linear decrease between using the logarithm of the aerodynamic diameters (Hu et al., 2017). The transmission curve was converted to a geometric diameter for each observation using Eq. (28) from DeCarlo et al. (2004) iteratively to update the Cunningham slip correction factor until convergence. The LAS correction assumes that the fractional contribution of aerosol not measured by AMS+SP2 is constant, which is a limitation of the approach, but we expect it to have a limited impact on the analysis due to the small contribution. The submicron dust aerosol mass concentration is estimated using this volume residual, assuming a dust density of 2.6 g cm−3 (value used in WRF-Chem), and falls into the OIN aerosol category when comparing to model estimates.
2.4 Ground-based observations
We also used multiple sources of ground-based observations. This includes Level 2.0 AOD at 500 nm wavelength, which was obtained from the Aerosol Robotic Network (AERONET; Holben et al., 1998) version 3 algorithm (Giles et al., 2019). During KORUS-AQ, the AERONET team enhanced the long-term AERONET sites with a short-term DRAGON network (Holben et al., 2018) to assess the mesoscale spatial variability of aerosol properties; thus, a total of 21 locations were available during the campaign period. We also used PM2.5 and PM10 from the air quality network maintained by the Korean National Institute of Environmental Research (NIER). For the period analyzed, PM2.5 and PM10 data were available from 320 and 329 locations, respectively, distributed across the peninsula.
3.1 Forecast evaluation
Figure 5a shows comparisons of AOD measured by the AERONET network over South Korea versus forecasted AOD at the site locations. The model shows good performance over the period (e.g., mean AOD for observations and the model is 0.58 and 0.60, respectively). This performance is expected as the system is assimilating satellite AOD, and satellite AOD retrievals have shown good agreement with AERONET data in the region (Choi et al., 2019b). However, the forecasts generally show large overpredictions of surface particulate matter for the period of large concentrations in the peninsula (mean bias for PM2.5 and PM10 is 44 and 21 µg m−3, respectively), consistent with previously reported results (Lennartson et al., 2018). These overpredictions are more severe for PM2.5 during the passing of the transboundary pollution coming from China (25 and 26 May), sometimes exceeding a factor of 2 difference. This points towards model deficiencies in connecting surface mass concentrations with column optical properties, which is explored in this study focusing on the day the aircraft sampled this air mass (24 May). Also note that PM2.5 and PM10 are similar in the model, while PM10 is larger than PM2.5 in the observations (reflected in the differences in mean bias), pointing towards model biases in representing coarse-mode aerosols.
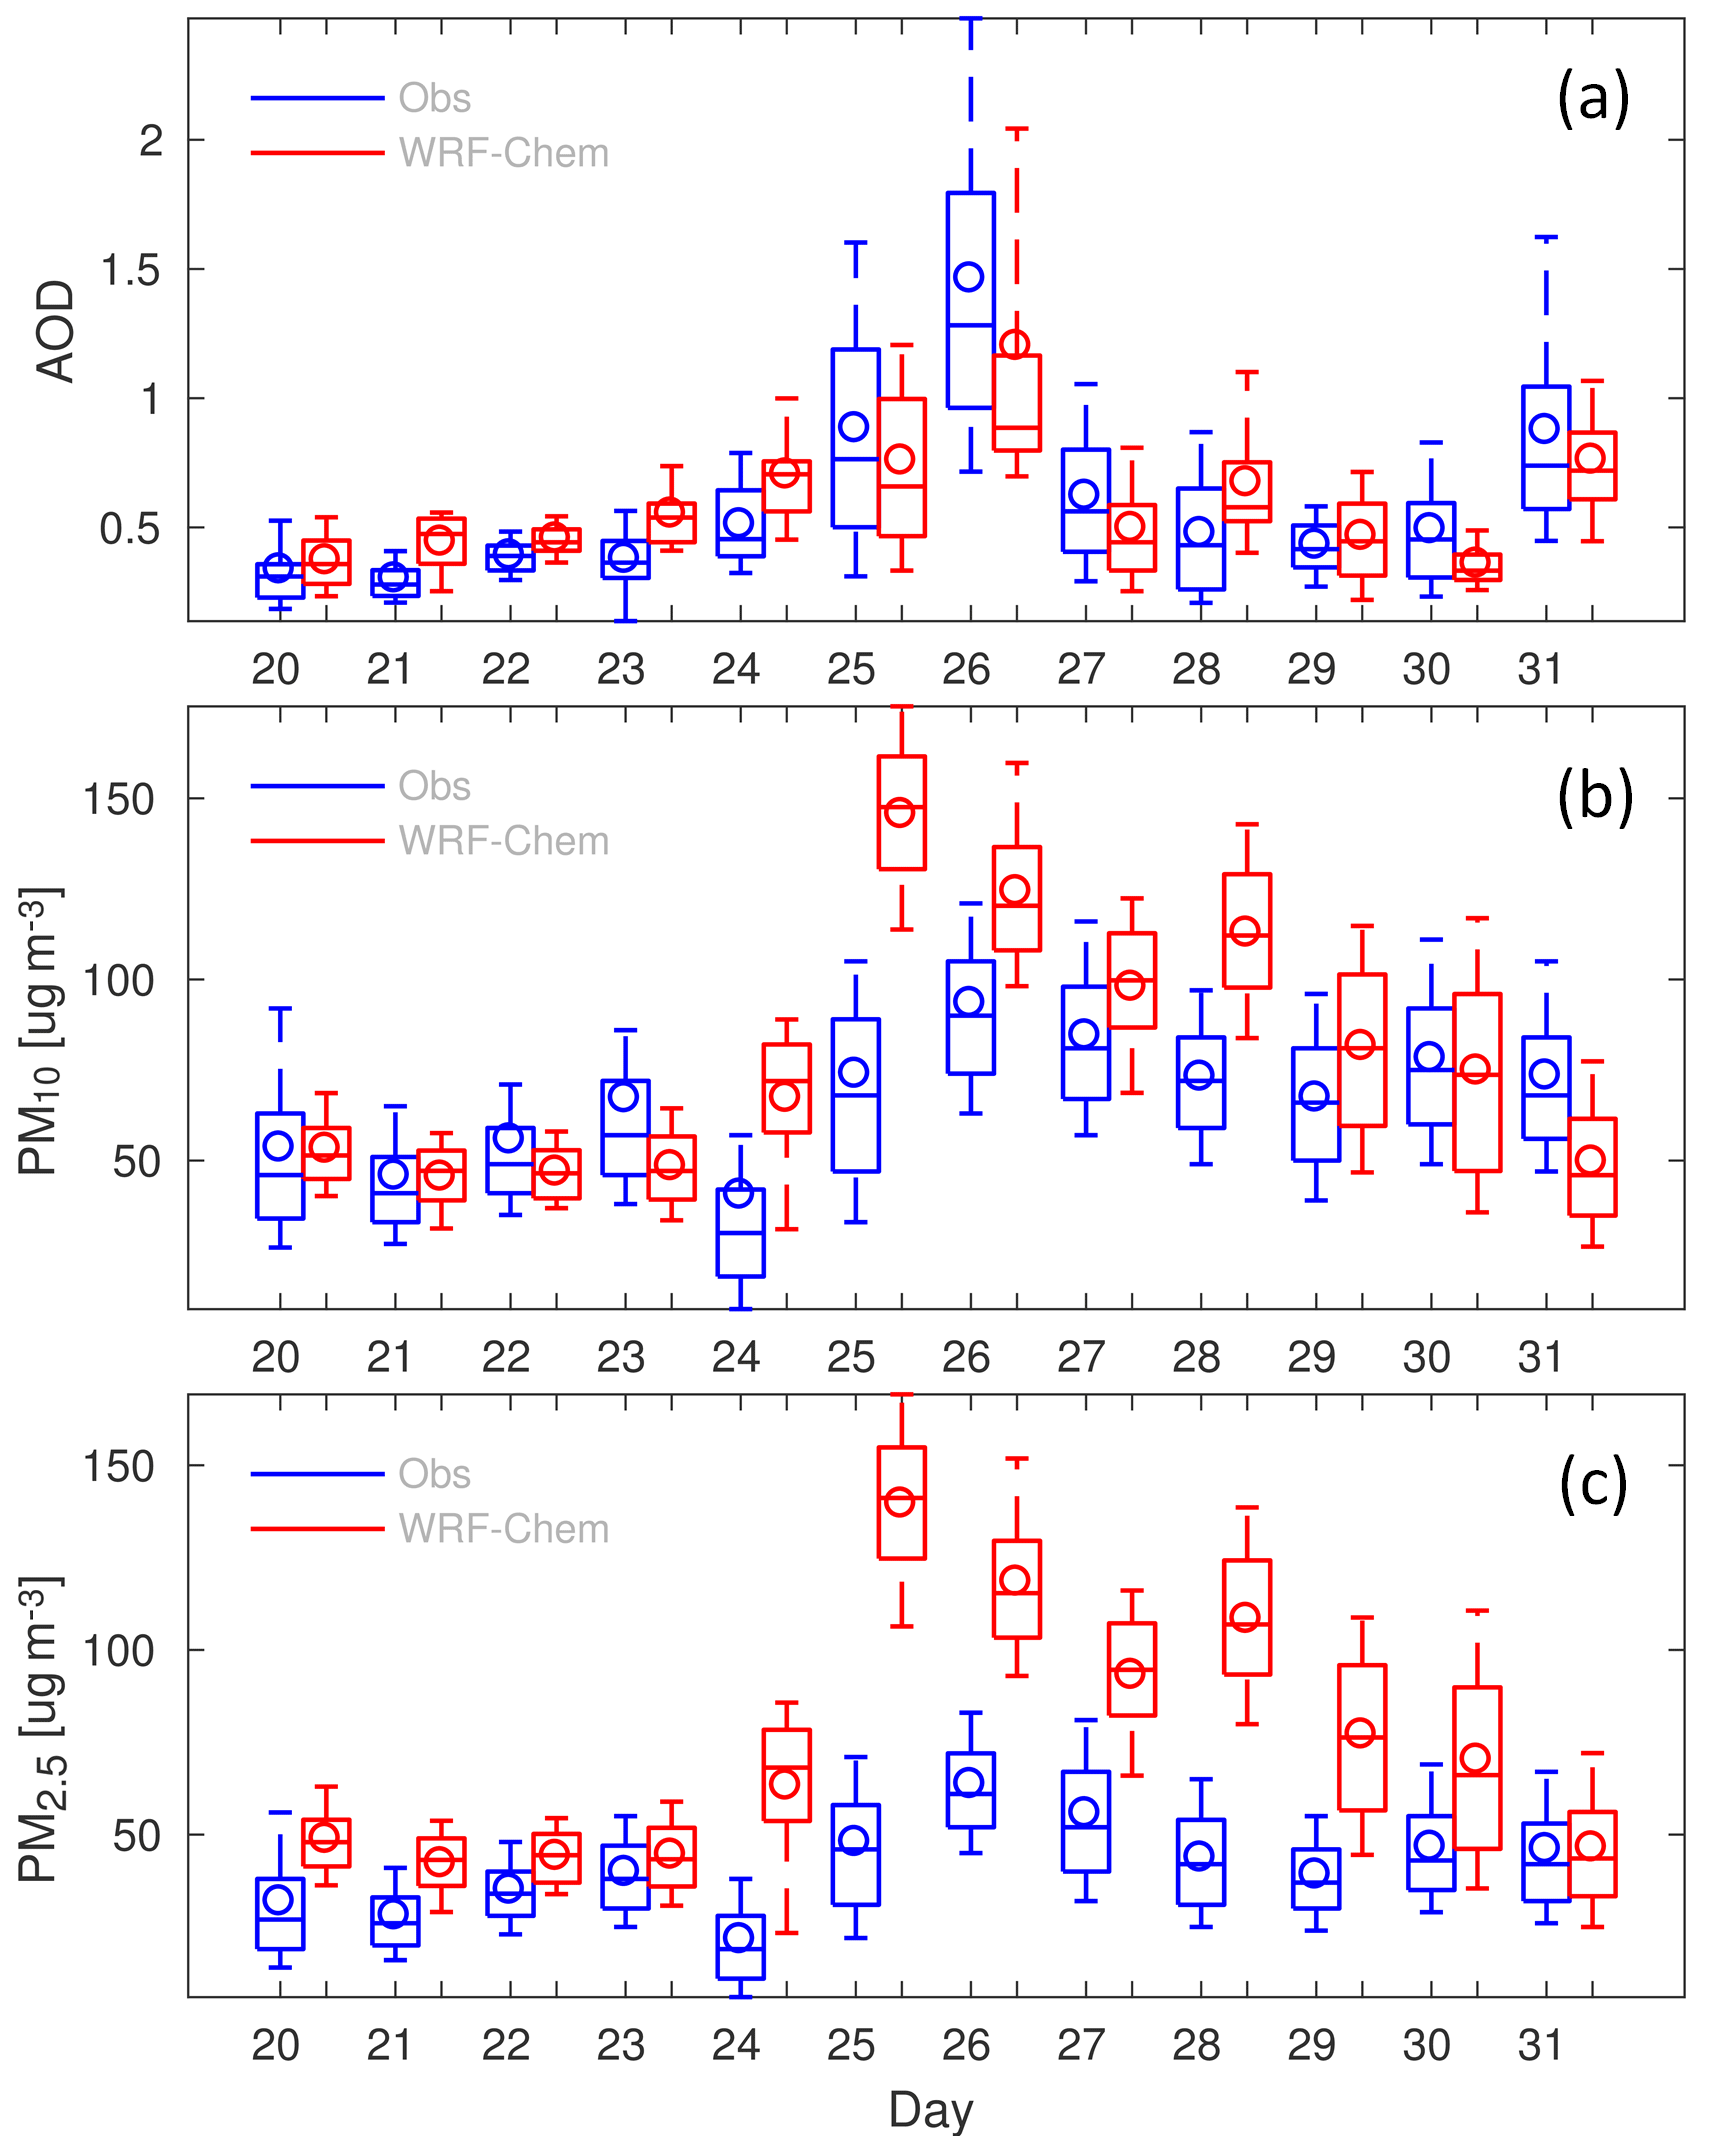
Figure 5Time series of box and whisker plots for AOD (a), PM10 (b), and PM2.5 (c) for select days in the month of May 2016, comparing observations and forecasts over sites in South Korea. Data are aggregated by day (in UTC). Center solid lines indicate the median, circles represent the mean, boxes indicate upper and lower quartiles, and whiskers show the upper and lower deciles.
Figure 6 shows observed and forecasted AOD retrievals at noon local time the day of the 24 May DC-8 flight that sampled the transboundary pollution that affected the Korean Peninsula. The forecasts shown have not yet assimilated the AOD retrieved that day, showing the ability of the system to carry forward the information assimilated the day before. AODs larger than 1 were found over areas in the Yellow Sea that were correctly forecasted and that enabled the KORUS-AQ team to plan a successful flight (track in yellow in Fig. 6c) in the region. Data from this flight are used to perform a detailed model evaluation to understand the model biases.
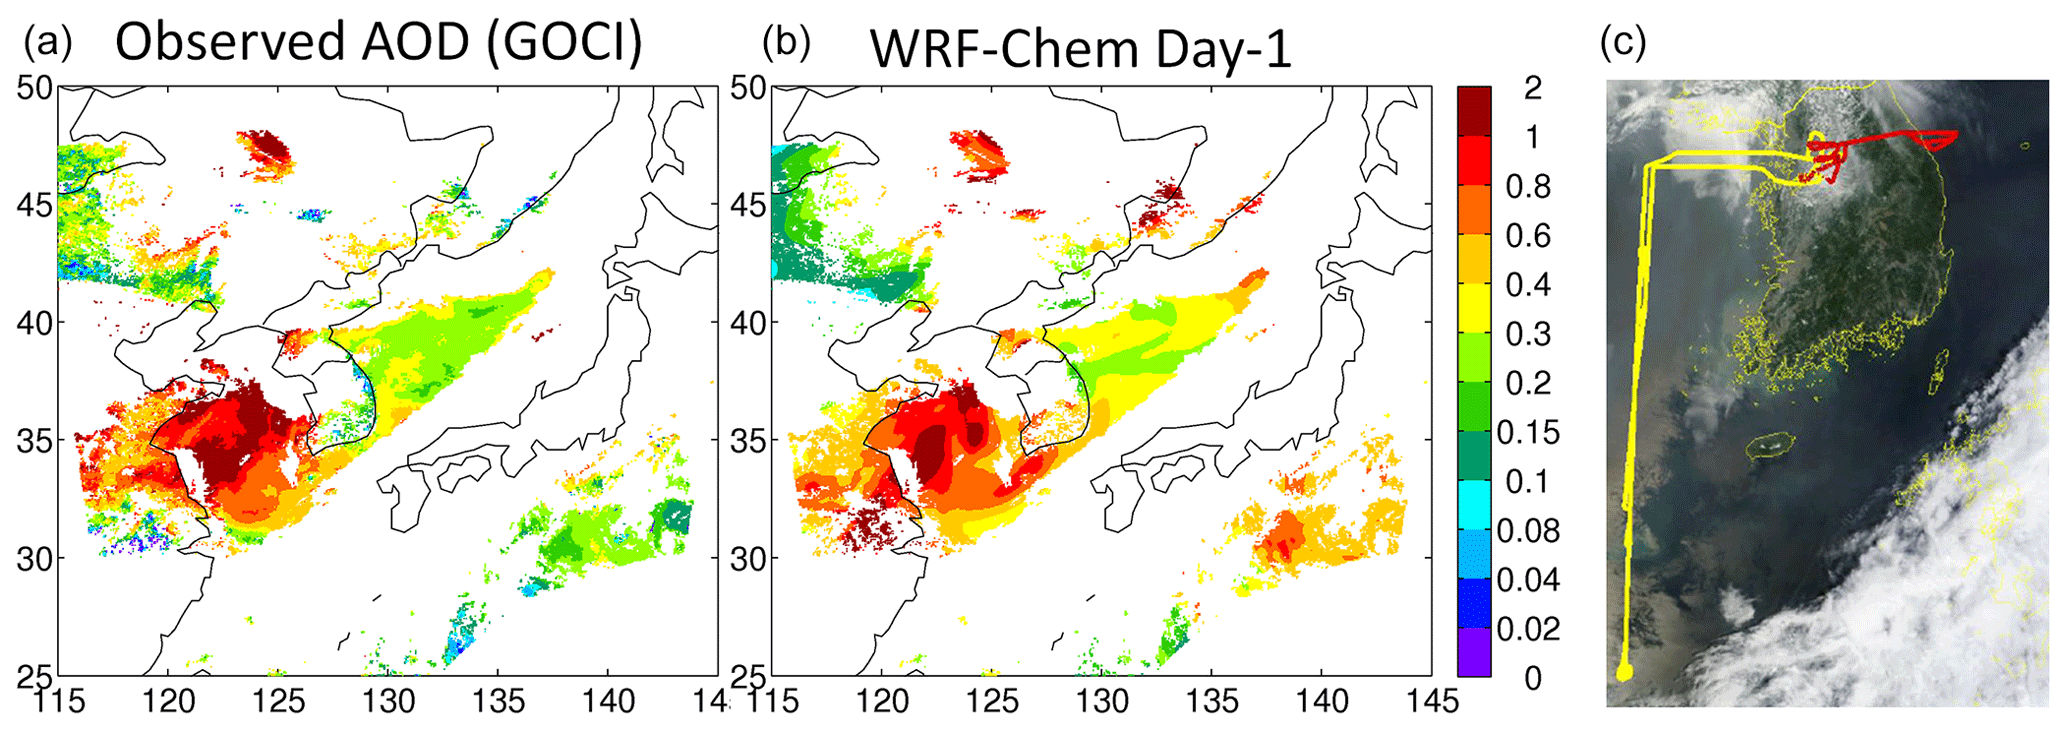
Figure 6Observed (a) and forecasted (b) AOD maps at 03:00 UTC (noon local Korean time) on 25 May. (c) Advanced Himawari Imager true color imagery for the same time with overlays of the DC-8 (in yellow) and Twin Otter (in red) flight tracks for that day (source: KORUS-AQ flight report).
One potential reason for the discrepancies found could be related to the model representation of aerosol vertical profiles. Figure 7 shows aerosol extinction curtains over the DC-8 trajectory (aircraft altitude in red solid line) as sampled by the DIAL-HSRL and as predicted by the forecasts. The haze layer is mostly confined to below 2 km, which the model represents properly (e.g., mean extinction in this layer for the observations and model is 0.44 and 0.38 km−1, respectively). The model has slightly higher mixing layers, which, if anything, would lead to opposite biases (e.g., underestimation of surface concentrations). A layer with lower aerosol extinction found between 2 and 6 km, which DIAL-HSRL classified as dust (not shown) and where SAGA reported elevated levels of Ca+2 associated with dust, is also well captured by the model in terms of both aerosol type and amount (mean extinction in this layer during 00:00–01:00 UTC for the observation and model is 0.012 and 0.015 km−1 respectively). Thus, we discard issues with the model representation of the vertical placement of the plume as reasons explaining the AOD to PM inconsistencies mentioned earlier.
AOD is also highly sensitive to relative humidity (Brock et al., 2016a), and previous studies have explained AOD biases due to model issues representing relative humidity (Feng et al., 2016). In situ measurements of relative humidity in the haze layer showed average values of 62 % with an interquartile range of 9 % (57 %–66 %). The forecast shows a reasonable representation with a slightly higher average value (64 %) and interquartile range (10 %). Thus, we conclude that skill in predicting relative humidity is not related to the discrepancies found in this study.
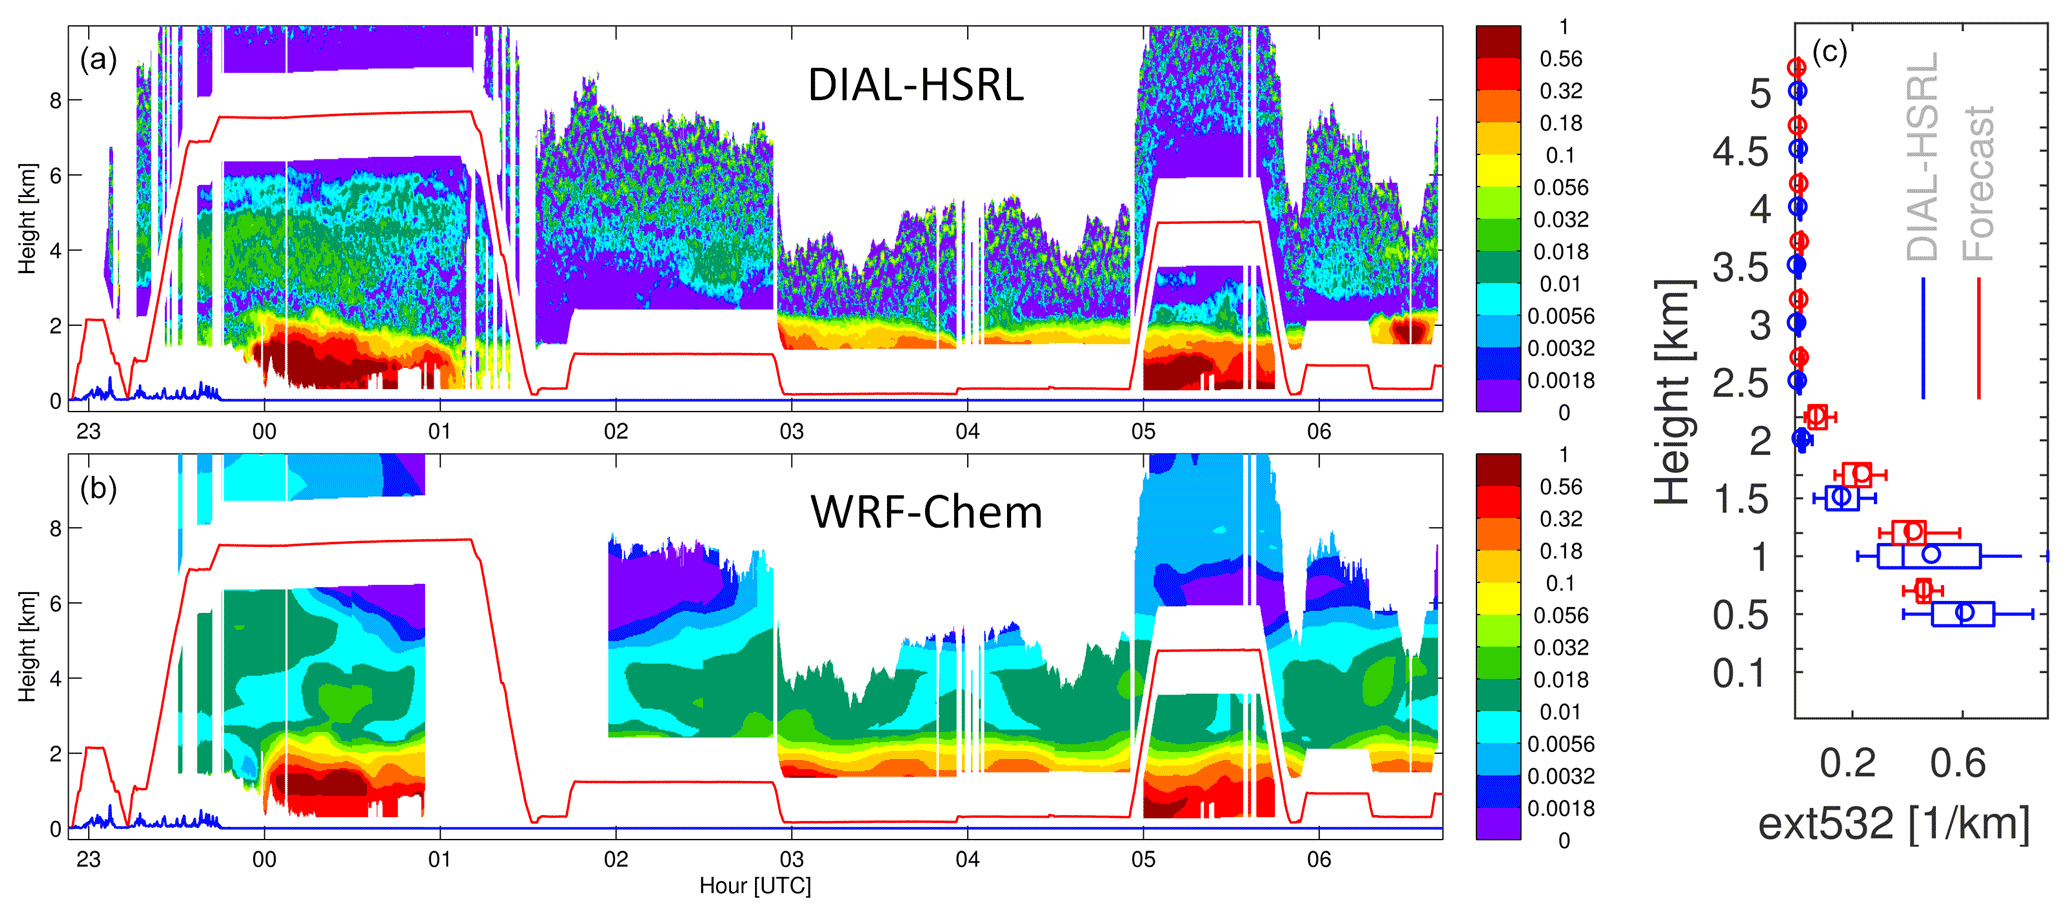
Figure 7DIAL-HSRL (a) and WRF-Chem forecast simulation (b) extinction curtains at 532 nm for the KORUS-AQ flight on 24 May. The red solid line represents the altitude of the aircraft from which DIAL-HSRL was being operated. (c) Box and whisker plots as in Fig. 5, aggregating the observed and modeled data shown in panels (a, b) for the periods during which the aircraft was above the haze layer (00:00–01:00 and 05:00–05:45 UTC).
From this analysis, we conclude that the likely reason for the discrepancy resides in the computation of the aerosol optical properties, i.e., how aerosol mass is translated to AOD, and thus in the following sections we perform a thorough evaluation of this topic using in situ airborne data.
3.2 Closure studies
Model representation of optical properties can be separated into two stages: (1) how well the model represents the aerosol properties that drive the optical properties computation (e.g., size distribution, composition, concentrations, etc.); and (2) the accuracy of the optical properties code. The latter can be evaluated by driving the optical properties code using observed quantities and comparing the outputs with measurements of aerosol optical properties, a methodology that has been applied for previous field campaigns (Barnard et al., 2010; Brock et al., 2016a) and that we will refer to as a “closure study” here. This allows us to isolate issues regarding the optical properties code and to assess ways to improve the model representation of optical properties.
One challenge of closure studies is that the optical properties code requires speciated and size-resolved aerosols; thus, assumptions need to be made on how to distribute the measured chemical species into the size bins. Figure 3a shows a scatterplot of SAGA filter-based vs. AMS online measurements of inorganic aerosol mass concentrations (sulfate, nitrate, ammonium, chloride), showing good agreement for this flight. While secondary inorganic aerosol mass concentrations were elevated in the coarse mode for other KORUS-AQ flights (and thus not detected by AMS; Heim et al., 2020), for the flight analyzed here this fraction seems to be negligible. Thus, we assume that the tail of the coarse mode is composed of only OINs (likely dust). We also assume that the composition is not size-dependent within the accumulation mode. Size-resolved AMS measurements support this assumption by showing a similar composition within the accumulation mode (Fig. 4b). We set the aerosol diameter cutoff between the accumulation mode and the lower tail of the coarse mode at 884 nm based on size distribution measurements (Fig. 8). Also, since both LAS and APS cover the lower tail of the coarse mode, we use APS estimates in this range because LAS presents lower volume concentrations.
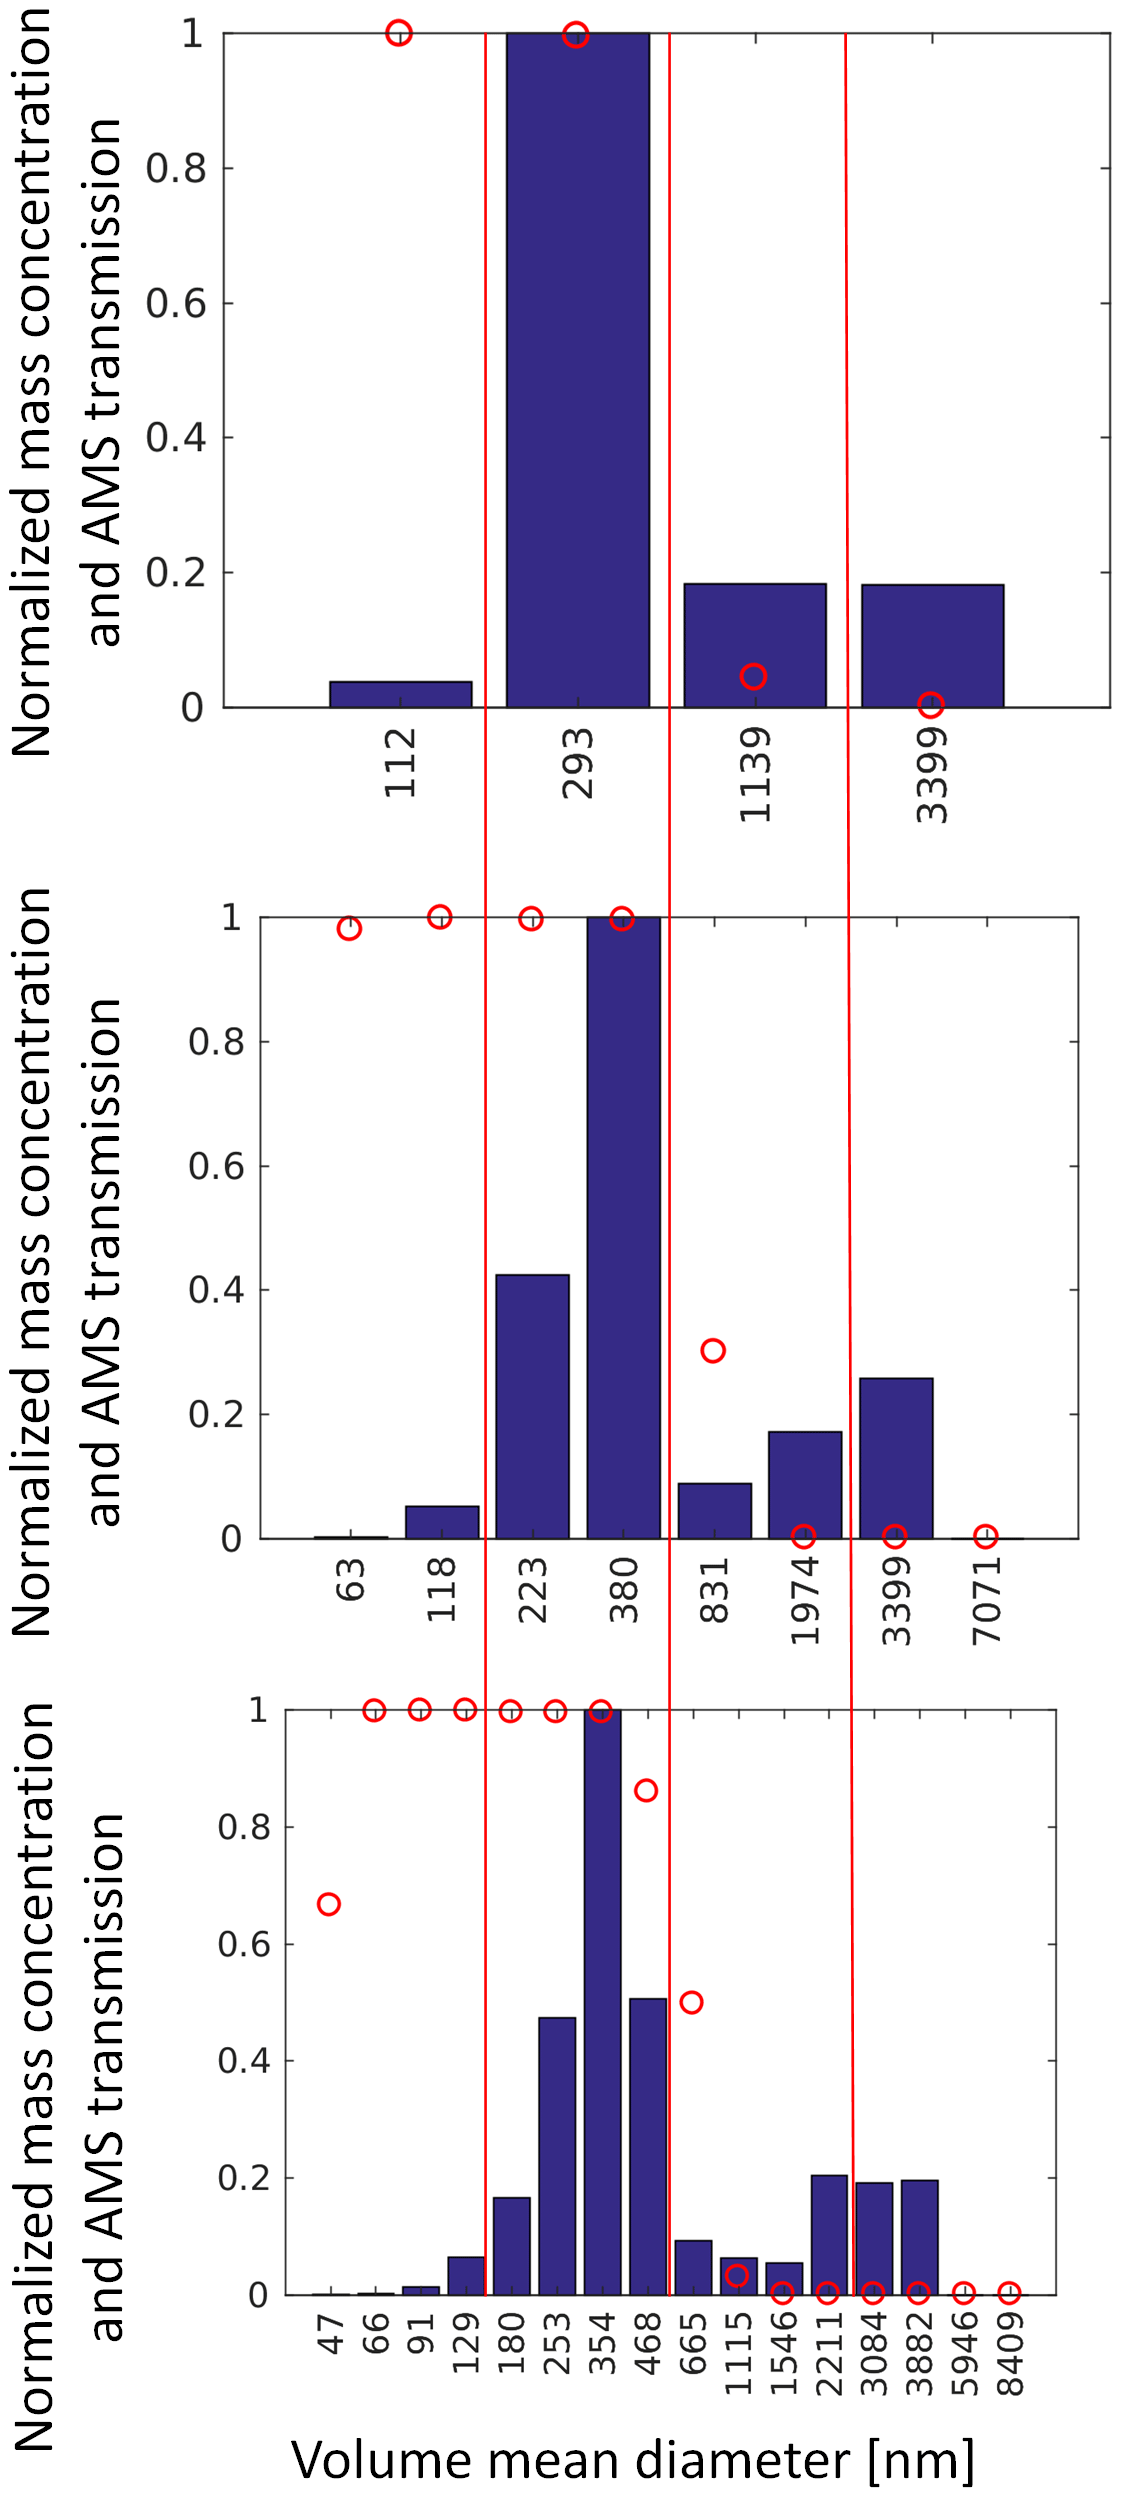
Figure 8Resulting average size distributions (blue bars) when aggregating observed data (02:00–05:00 UTC) to 4, 8, and 16 size bins. Sizes distributions show the average mass concentration in each bin normalized by the maximum value within each distribution. Red lines separate bins aggregated when going from a finer to coarser bin representation. Size bins boundaries are defined in Table 3. Red circles indicate the average AMS transmission efficiency (dimensionless) for each size bin.
Figure 9 shows multiple statistical metrics in the form of box and whisker plots for observations and closure results during the three consecutive hours that the DC-8 spent measuring the haze layer at multiple altitudes (02:00–05:00 UTC; see Fig. 7). The different closure scenarios are described in Table 4 and consist of the base configuration and then the base with varying parameters such as the size bin resolution, refractive indices, and hygroscopicity parameter.
Table 4Description of closure cases. Refer to Sect. 3.2 for definitions of the base and updated configurations. Size bins are defined in Table 3.
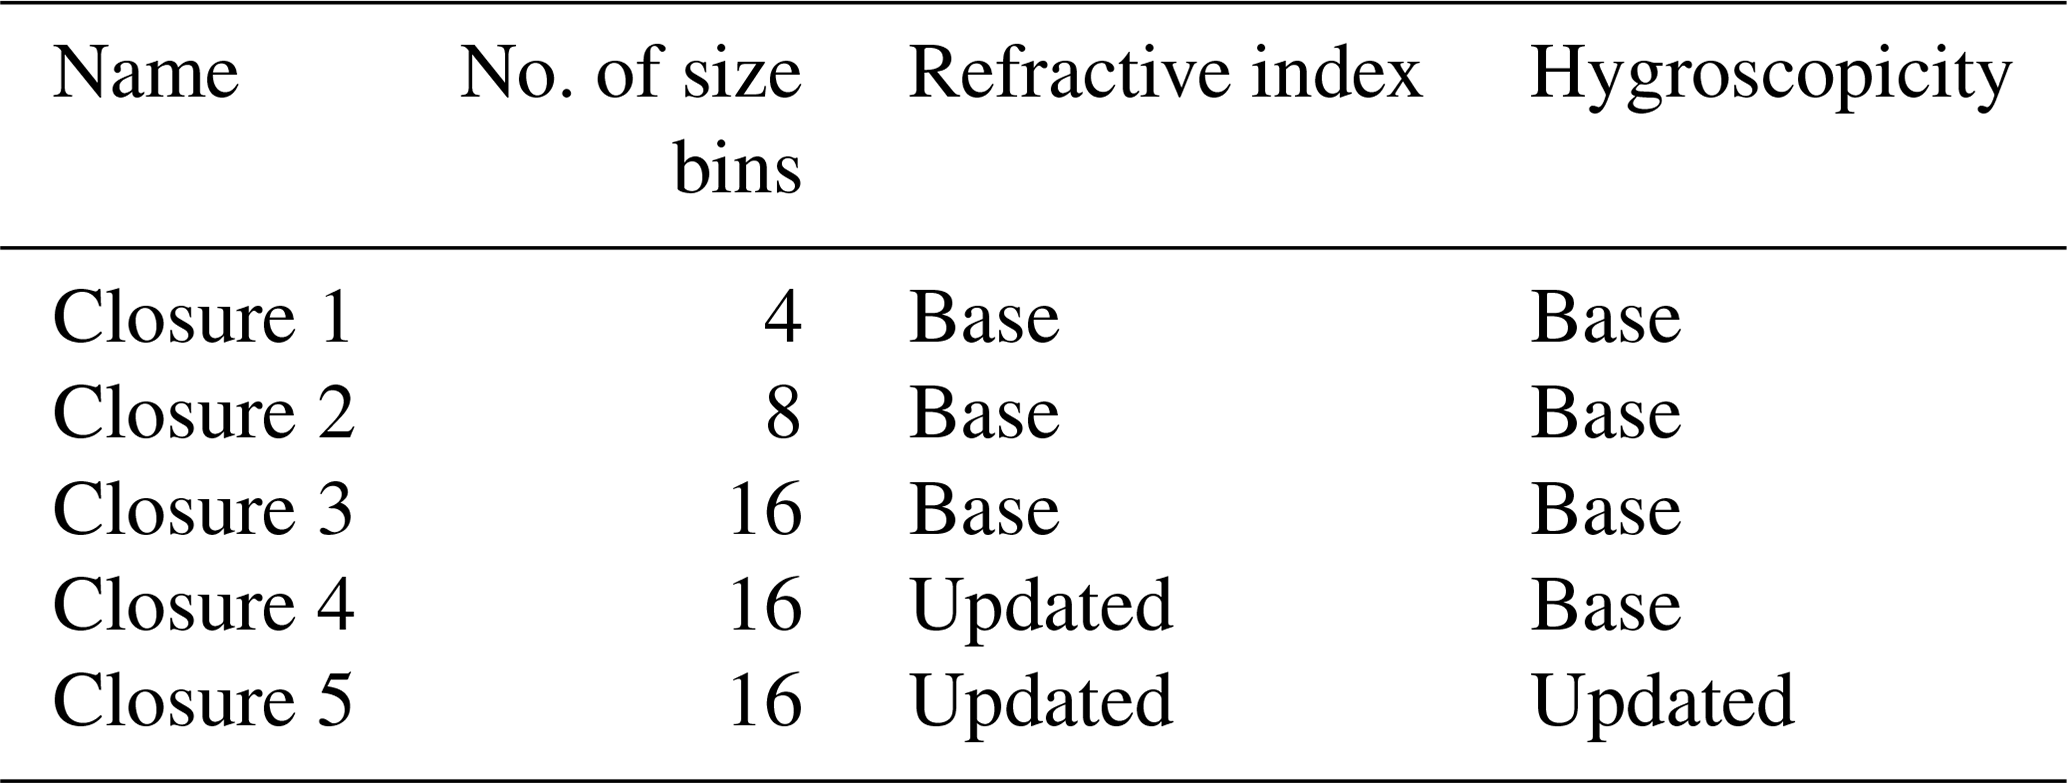
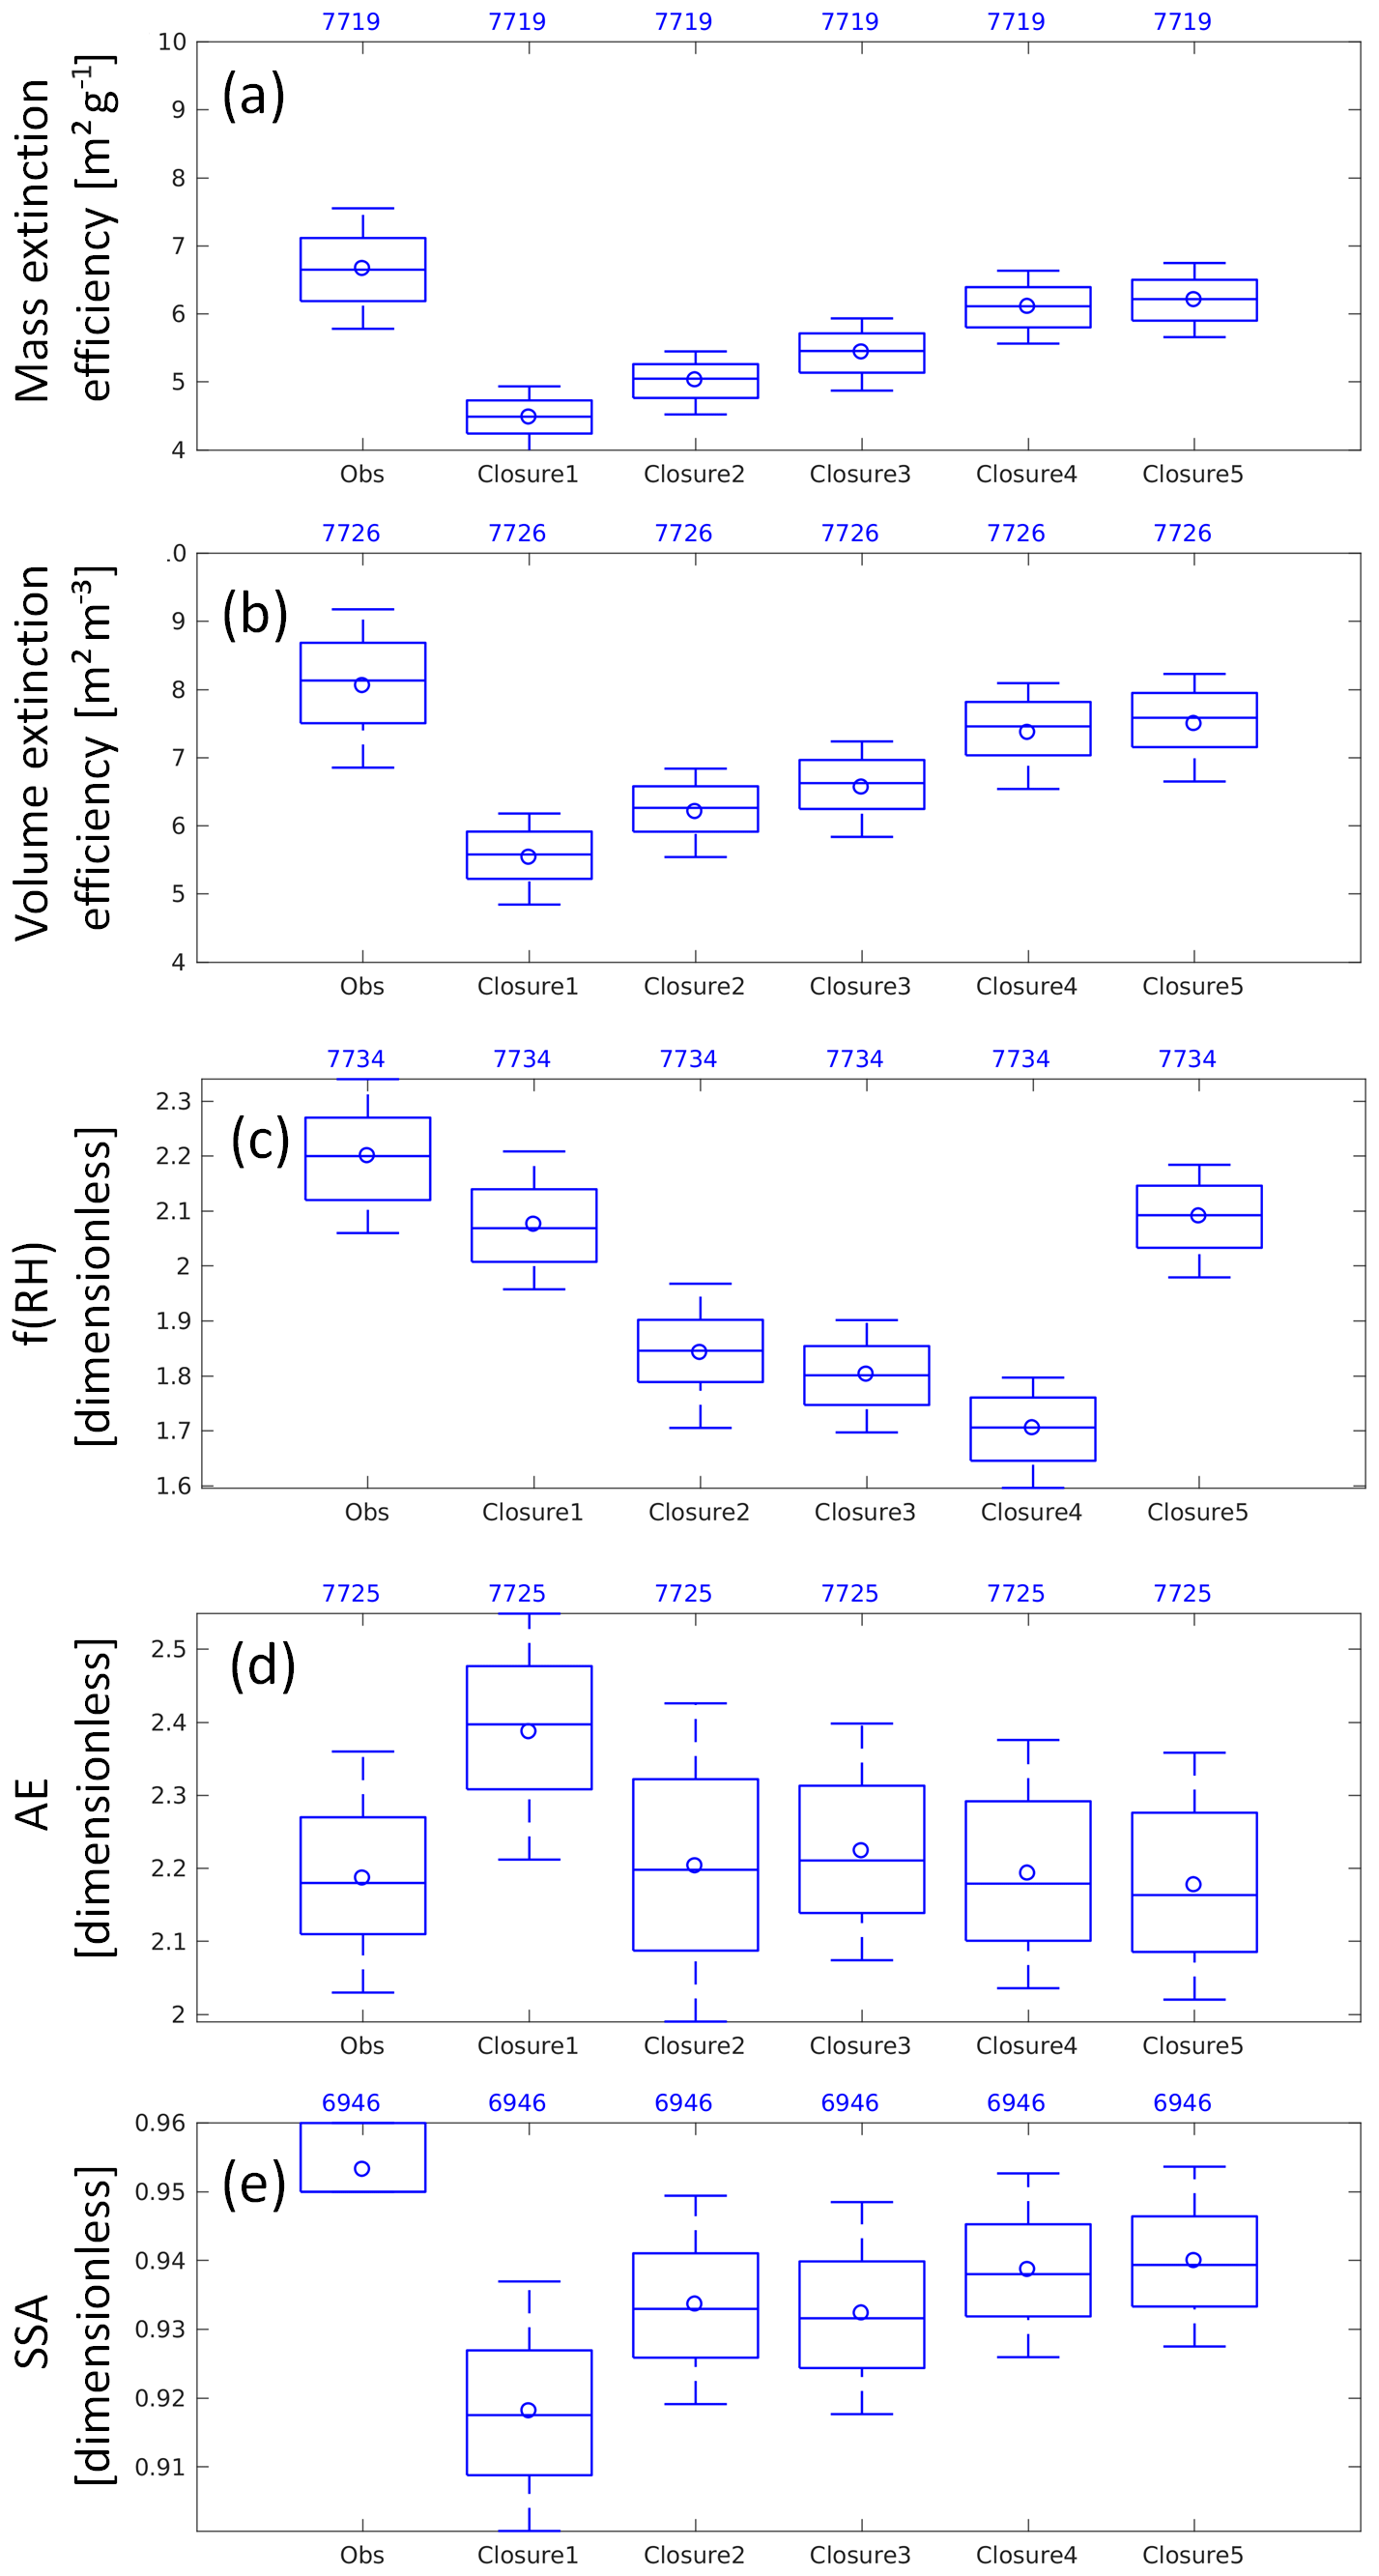
Figure 9Box and whisker plots (as in Fig. 5) showing observations and closure results driving the optical properties code with observations. Closure cases are described in Table 4. Results are shown for (a) the extinction-to-mass ratio (550 nm; mass extinction efficiency), (b) extinction-to-volume ratio (volume extinction efficiency), (c) f(RH) measured at 550 nm, (d) the 550–700 Ångström exponent, and (e) dry single-scattering albedo. The blue numbers on top of the plots represent the sample size used when computing statistics.
3.2.1 Dry extinction
A variable that is typically computed to assess the efficiency of an aerosol population at scattering light is the ratio between dry extinction (scattering) and aerosol mass concentrations, which is typically referred to as “mass extinction (scattering) efficiency”. Note that for this study, the aerosol mass concentration corresponds to that measured by AMS+SP2. We also define “volume extinction efficiency” as the ratio between dry extinction and the aerosol volume concentration obtained from the aerosol size distribution measurements after performing the corrections described in Sect. 2.3. As AMS and SP2 measure mostly submicron aerosols of select chemical species, there is potential for unaccounted aerosol mass contributing to aerosol extinction that could complicate the interpretation of the mass extinction efficiency. Therefore, the volume extinction efficiency is reported in addition to the mass extinction efficiency as the extinction and volume are measured for all aerosols in the same size range (behind the LARGE inlet).
Figure 9a and b clearly show how the base configuration of the optical properties code drastically underpredicts the mass and volume extinction efficiencies (e.g., mean mass extinction efficiency for the observations and Closure 1 is 6.7 and 4.5 m2 g−1, respectively), consistent with the discrepancies shown in Fig. 5. Aerosols are binned into four size bins in the base configuration (Closure 1); thus, Closures 2 and 3 explore finer binning to 8 and 16 sections, respectively. The finer binning does improve the performance, especially when going from four to eight bins (average mass extinction efficiencies of 4.5 and 5.0 m2 g−1, respectively). Figure 8 shows the size distributions for the three types of size aggregation, showing a large diversity in the bin concentrations contributing to the total mass in fine-resolution bins, which is lost when aggregating to coarser-resolution bins. Figure 10 shows steep changes in the volume extinction efficiency for the diameters at which most of the aerosol mass is found (200–500 nm). In the four-bin configuration, the whole accumulation mode is included in one bin. After aggregation, a mean diameter of 293 nm is obtained, which has a volume extinction efficiency below 6 m2 m−3 with base refractive indices. On the other hand, a large percentage of the accumulation mode is found in bin no. 4 with the eight-bin configuration, which has a mean diameter of 380 nm and a volume extinction efficiency of ∼8 m2 m−3; this raises the overall efficiency substantially. The improvements from 8 to 16 bins are lower than from four to eight bins, but they are still significant and due to similar reasons. For instance, bin no. 8 in the 16-bin configuration shows a volume extinction efficiency above 9 m2 m−3, getting close to the maximum values for base refractive indices. Negligible improvements are found when further refining from 16 to 32 size bins (not shown).
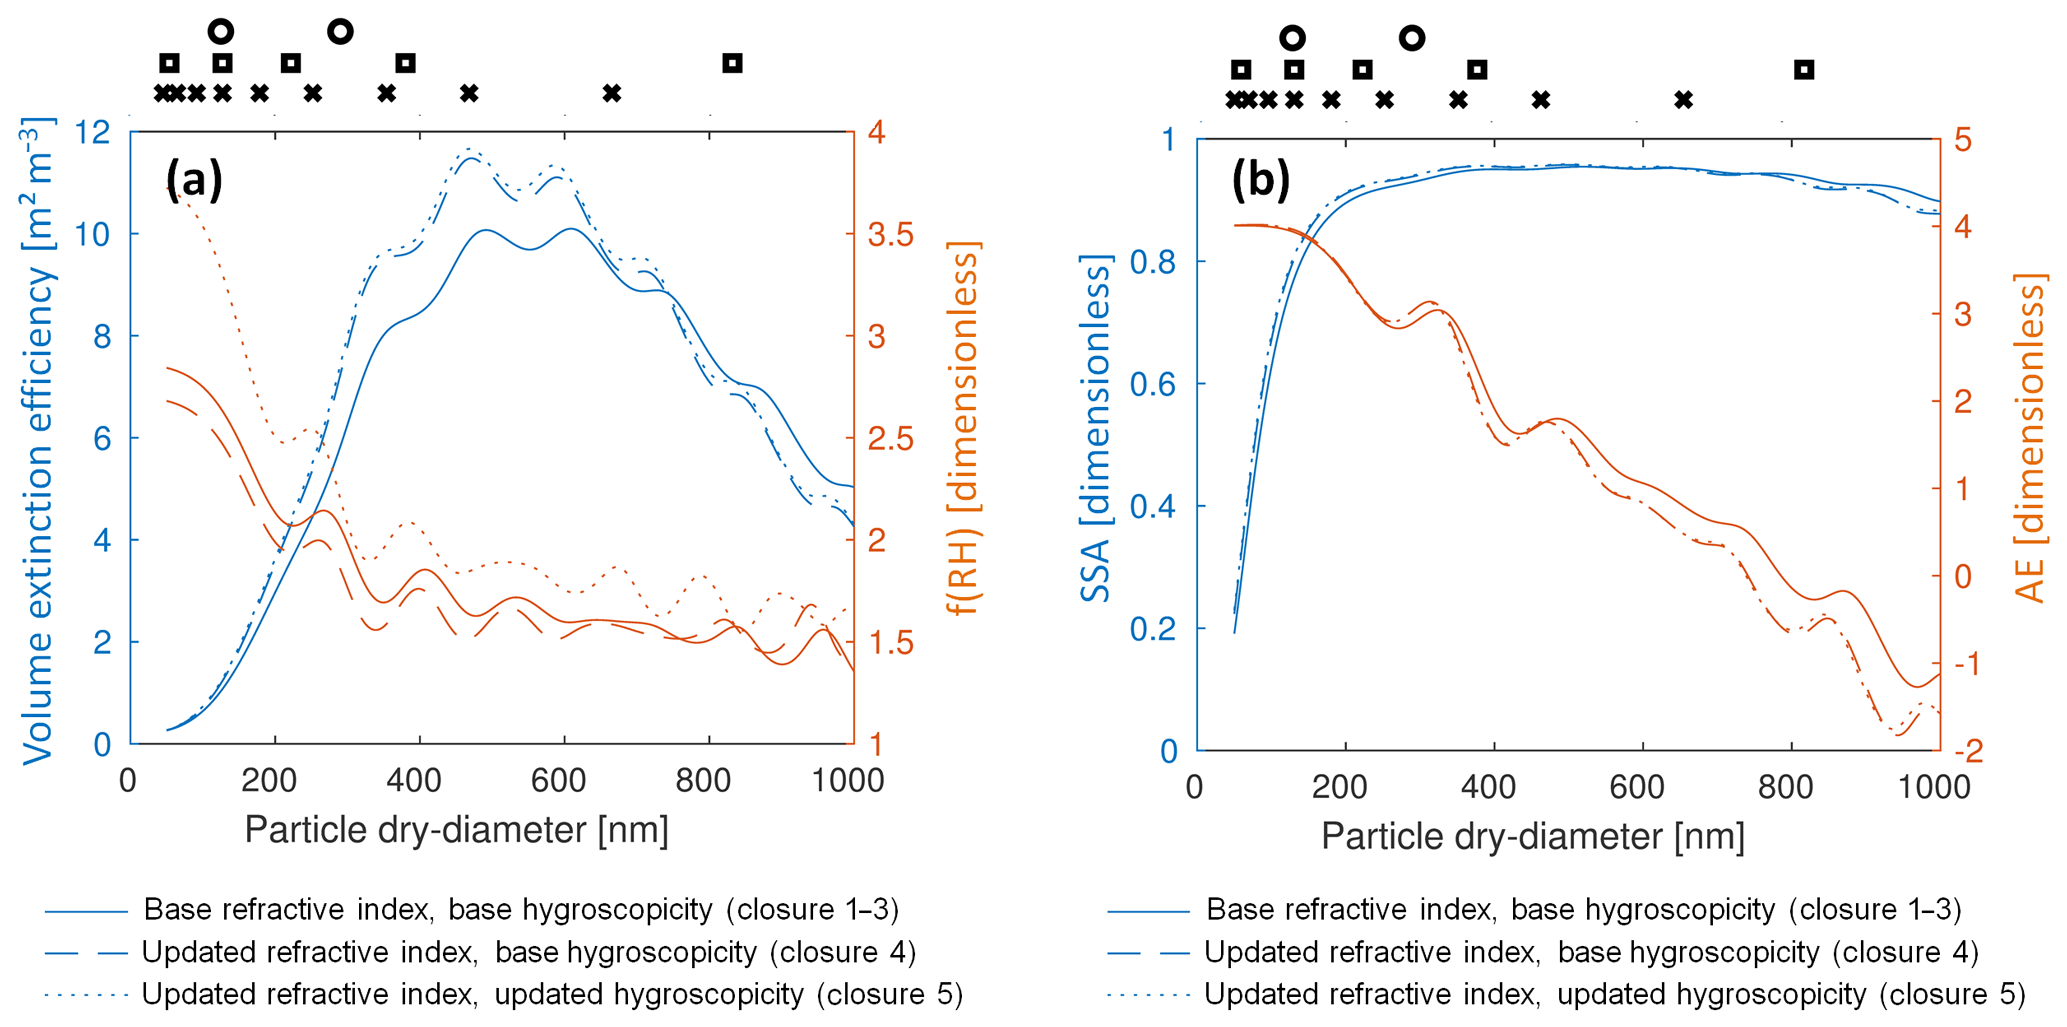
Figure 10(a) Volume extinction efficiency (blue, scale on the left) and f(RH) (orange, scale on the right) as a function of geometric dry particle diameter considering a monodisperse aerosol distribution of fixed aerosol composition equal to the mean of the data analyzed. Different lines represent cases in which the real refractive index and hygroscopicity correspond to the base and updated conditions (see text for details). Black markers on top of the plots represent the calculated volume mean diameter for each size bin when using 4 (circles), 8 (squares), and 16 (x) bins for the mean observed size distribution (numerical values found in Fig. 8). Note that only mean diameters below 1 µm are shown. (b) Same as (a) but for dry single-scattering albedo and the 550–700 nm Ångström exponent.
Although improvements are found when refining the size bins, significant biases still persist for the 16-bin configuration (Fig. 9a, b). Thus, we explore modifying the refractive indices used in the Mie calculation (see Sect. 2.3) based on values reported in the literature for the aerosol species accounting for the most submicron mass. Typical real refractive indices assumed in closure studies (e.g., Brock et al., 2016a) for ammonium sulfate and ammonium nitrate are 1.527 (Hand and Kreidenweis, 2002) and 1.553 (Tang, 1996), which are larger than those used in the base configuration, and thus we update them accordingly. For primary and secondary organic aerosols, there is a large range of values found in the literature (e.g., Moise et al., 2015; Lu et al., 2015). Aldhaif et al. (2018) derived the organic aerosol (OA) real refractive index from field deployments by air mass type, finding a mean value of 1.54 with 1.52–1.55 as the 25–75th percentile range for urban air masses. We chose the value of 1.55 as it is in the 25–75th percentile range and because it is a typical value used in past studies (Zhang et al., 1994; Hand and Kreidenweis, 2002; Hodzic et al., 2004). This value also corresponds to the mean real refractive index reported by Lu et al. (2015) for primary organic aerosol based on a literature review. The Closure 4 case includes these updates (summary of updated parameters in Table 2), showing an increase in the efficiencies that improves the model representation (Fig. 9a, b). Although the mass and volume extinction efficiencies are still underpredicted (e.g., average mass extinction efficiencies of 6.7 and 6.1 m2 g−1 for observations and Closure 4, respectively), there is much better agreement when using the updated refractive indices, obtaining an overlap of the observed and modeled 25–75th percentile boxes. Besides the overall increase in the efficiencies, there is also a slight shift towards smaller sizes for the location where the curve of efficiencies vs. particle dry diameter achieves its maximum (Fig. 10a). The update in the OA refractive index generates the most impact (not shown) due to the larger increase (7 % change vs. 0.5 % and 3.5 % for ammonium sulfate and ammonium nitrate, respectively) and large contribution to the total mass (23 % on average).
3.2.2 Hygroscopic growth
While the analysis in the previous subsection was performed for dry aerosol extinction, we also explored possible biases due to hygroscopic growth, considering that relative humidity was in the 50 %–80 % range in the haze layer. We assessed the performance of the optical properties code, driven by observed inputs in representing the aerosol light-scattering enhancement factor (f(RH)), defined here as the ratio between 550 nm aerosol scattering at 80 % (wet) and 20 % (dry) relative humidity.
Figure 9c shows that the base configuration performs well for f(RH) (average of 2.2 vs. 2.1 for observations and Closure 1, respectively). This is due to a combination of the wrong reasons (i.e., cancellation of errors), as it deteriorates when increasing the size bin resolution (Closures 2 and 3) and upon increasing the refractive indices (Closure 4), going down to average values as low as 1.7. Figure 10a additionally shows f(RH) and can help explain this behavior, as f(RH) has a strong decreasing trend with increasing diameter in the region < 350 nm. Thus, because the four-bin representation displays an apparent decrease in the mean diameter (Fig. 7), f(RH) is overestimated. As the size bins are refined, less aerosol mass falls in the smaller size bins, decreasing the total f(RH). The further decrease in f(RH) with increasing refractive indices at these size ranges is also shown in Fig. 10a. While our alternative approach at computing aerosol water uptake resulted in values ∼7 % lower than that shown by WRF-Chem, the difference in the observed vs. Closure 4 f(RH) are close to 30 %; thus, we conclude that similar biases would be expected for the WRF-Chem routines.
To improve the optical properties code performance, we updated the hygroscopicity parameter based on values found in the literature for the species contributing to most of the aerosol mass. κ values are generally reported with a large range of uncertainty and can depend on the measurement technique and environmental conditions. Petters and Kreidenweis (2007) show a wide range of κ values for ammonium sulfate (from 0.33 to 0.72 with a mean of 0.53) and for κ derived using growth factors, with a mean value of 0.61 based on cloud condensation nuclei (CCN) measurements. For ammonium nitrate, only CCN-derived κ is available, with a mean value of 0.67 and a range of 0.577–0.753. We chose to use the mean values of the CCN-derived estimates (0.61 for ammonium sulfate and 0.67 for ammonium nitrate), as they are contained in the ranges provided in Petters and Kreidenweis (2007) and in other studies (e.g., Good et al., 2010). For organic aerosol, the range is even larger. We chose to treat organic aerosol and OINs as slightly hygroscopic, as was originally specified in the WRF-Chem parameterization for GOCART, with κ values of 0.14 for both, which is consistent with values reported for aged urban OA and for rural environments (Wang et al., 2010; Mei et al., 2013; Levin et al., 2014). κ of sodium chloride was updated to 1.1 following the revisions of Zieger et al. (2017) to consider the properties of inorganic sea salt. This large decrease in κ has little impact for the study period as sea salt mass concentrations represented less than 1 % of the total in both observations and models. A summary of the updated κ values can be found on Table 2. Figure 9c shows significant increases in f(RH) from Closure 4 to Closure 5 (average f(RH) of 2.1) up to a similar level as the observations. Sensitivity analysis shows that most of the change is related to the κ increases in ammonium sulfate and ammonium nitrate due to their larger contribution to the mass fraction (62 % on average), while additional water uptake of organics and other inorganic aerosols play a minor role. Thus, choosing a lower OA κ value more consistent with other studies (Brock et al., 2016a; Shingler et al., 2016) would have resulted in similar findings.
3.2.3 Other aerosol optical properties
Figure 9d and e show the change for the Ångström exponent (AE) and single-scattering albedo (SSA) for the different model closure configurations. Overall, the representation of both AE and SSA improves when going from the coarse size bin resolution and base parameters to the finer bin and updated parameters, which represents independent pieces of evidence that the change in configuration is in the right direction. As seen in Fig. 10b, AE is sensitive to the aerosol size distribution and generally decreases with larger aerosol sizes. This explains the sharp decrease when refining the aerosol size bins (mean AE drops from 2.4 in Closure 1 to 2.2 in Closure 2) due to the lower mean diameters for the four-bin configuration as described previously. Figure 9e shows that SSA gradually increases with the change in configuration (from 0.92 in Closure 1 to 0.94 in Closure 5), which is due to changes in mean diameters and higher scattering when increasing the real refractive indices (Fig. 10b). While the AE of Closure 5 matches the observed values very well (mostly due to improvements from Closure 1 to 2), SSA is still slightly underpredicted (mean observation of 0.95), which is an issue previously identified in other closure studies using a similar approach for computing aerosol optical properties (Barnard et al., 2010). This underestimation could be due to multiple uncertainties including assumptions on black carbon and OIN complex refractive indices, black carbon mixing state, and the size-independent black carbon fractional contribution to the accumulation mode.
3.3 Evaluation of retrospective simulations
The previous section provides clarity on what we should expect from the optical properties code if the model is reproducing observed aerosol size distributions and composition. In this section we perform a similar analysis but driving the optical properties code with simulated aerosol properties (summarized in Table 1 and shown in Fig. 11). Comparing Fig. 11a and b, we can see large discrepancies in the performance of the mass and volume extinction efficiencies that are opposite to the closure studies (Fig. 9) for which they remain consistent. For instance, MOSAIC4b shows a good representation for the mass extinction efficiency against Closure 5 (mean of 6.4 and 6.2 m2 g−1, respectively) but largely underestimates the volume extinction efficiency (mean of 4.5 and 7.5 m2 m−3, respectively). Comparing Figs. 11 and 9, the mass extinction efficiency is shifted up in the three base modeling configurations, and thus a refinement in size bins (going from MOSAIC4bin to MOSAIC8b or MADE1) has the opposite effect on performance for mass and volume extinction efficiencies. The modeled aerosol mass concentration used when computing the mass extinction efficiency is that for which the AMS transmission is applied. Thus, one possible explanation could be that the models have significant aerosol mass outside the sizes the AMS can detect. This would reduce the mass concentration after applying the transmission curve, which would increase the extinction-to-mass ratio (i.e., the mass extinction efficiency) due to the unaccounted mass that contributes to extinction. Figure 12 shows the size distributions and AMS transmission efficiency for the simulations, for which this issue is evident as all three base model configurations (MOSAIC4b, MOSAIC8b, and MADE1) place substantial aerosol accumulation-mode mass in sizes at which the AMS transmission starts decreasing (> 625 nm). This is not the case for the observed size distribution (Fig. 8), for which most accumulation-mode aerosol mass is within the AMS transmission and explains the consistency between the mass and volume extinction efficiency for closure studies.
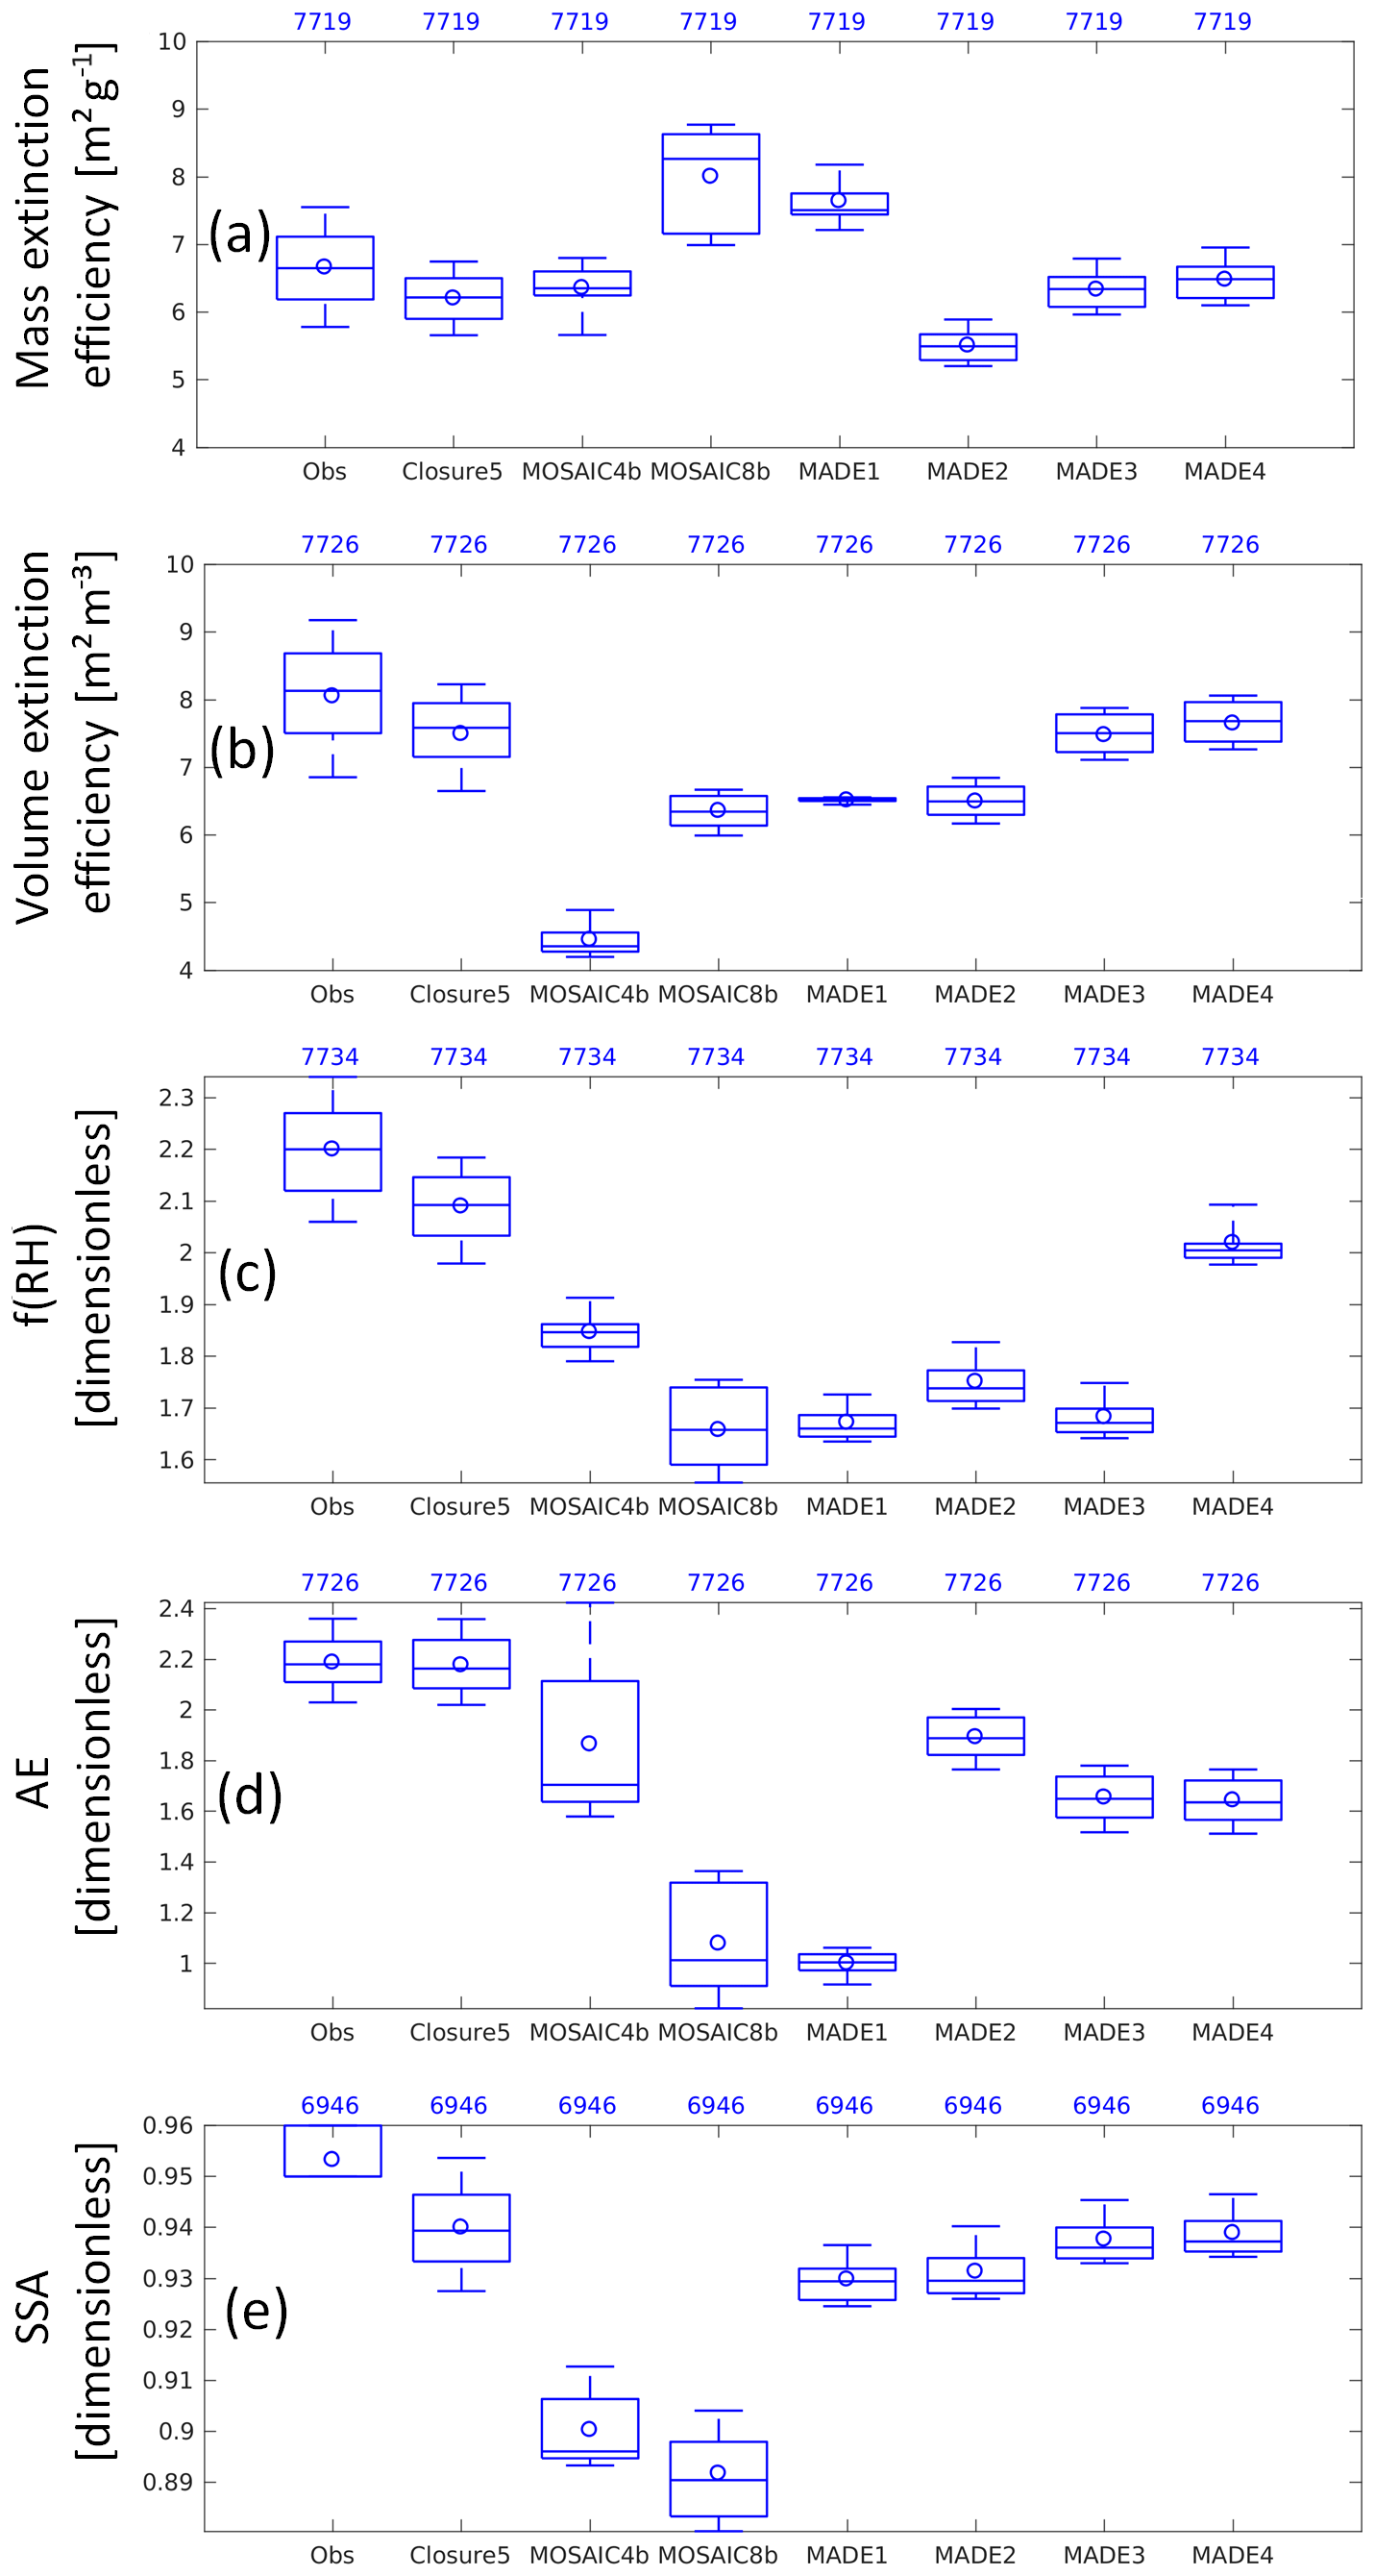
Figure 11As Fig. 9 but comparing observations and the Closure 5 study to different modeling configurations (described in Table 1).
Another contributor to this discrepancy is the model prediction of chemical composition. Figure 13 shows that, although OIN absolute concentrations are in the range of the observations, all modeling configurations overpredict the fractional contribution of submicron OIN mass (17 %–28 % vs. 12 % in the observations), with the MOSAIC configurations showing larger overpredictions. Since the aerosol mass used in the mass extinction efficiency corresponds to that measured by AMS+SP2 for which OINs are not included, then overpredicting the OIN fraction would increase the mass not accounted for in the ratio, increasing it relative to the observations. Potential reasons contributing to the overprediction in the OIN fraction include (1) an overprediction of the “other PM2.5” anthropogenic emission category and/or distributing it in the accumulation mode as opposed to in the lower tail of the coarse mode; (2) overprediction of the fine mode by windblown dust parameterizations (Kok, 2011); and/or, (3) insufficient production of secondary organic and inorganic aerosols (see underprediction in Fig. 13a), which has the effect of increasing the fractional contribution of the primary aerosol species (OINs in this case). Underpredictions of organic aerosol could be explained by large variations of secondary organic aerosol production within urban areas (Nault et al., 2018) that are not captured by the modeling configurations. Underpredictions of secondary inorganics could be due to missing mechanisms to produce sulfate during Chinese haze conditions (e.g., Gao et al., 2016a). These mechanisms were not included in this study as uncertainties remain on the actual pathways (Guo et al., 2017) and representation in models (Song et al., 2018). Other potential reasons for the underestimate of secondary inorganics could include the slow in-cloud H2O2 oxidation of SO2 due to underestimates of cloud volume and NOx underpredictions (e.g., Goldberg et al., 2019b).

Figure 12Same as Fig. 8 but for simulations using different modeling configurations. Size bins and AMS transmission efficiency are aggregated to coarser bins when possible for comparison across configurations. Size bin boundaries are defined in Table 3.
Another point to note is that models underpredict the relative magnitude of the coarse aerosols (2.5–10 µm range, bin no. 4 in the four-bin configuration). This helps to explain why the biases shown in Fig. 5 are more pronounced for PM2.5 than PM10, as the underprediction in the coarse aerosols is offset by the overprediction in the fine aerosols and is consistent with findings from previous studies (Balzarini et al., 2015; Im et al., 2015).
As mentioned earlier, all three base modeling configurations have issues representing the size distribution regardless of the large diversity in chemical and aerosol schemes. This is a topic that needs to be explored further in a future dedicated study. In the case of the MOSAIC configurations, the shape of the size distribution evolves through aerosol processes (coagulation, condensation, etc.). Since these processes that modify the size distribution are reasonably well known (Seinfeld and Pandis, 2016), it is unlikely that such large errors would arise from the model implementation of these processes. A more likely explanation is that the shape of the size distribution established at the point of emission is too wide to start with and unfolds into the results shown. In the case of the MADE1 configuration, the widths of the lognormal modes are controlled by the geometric standard deviation (GSD). In the WRF-Chem implementation the GSD is fixed at 1.7, 2.0, and 2.5 for nuclei, accumulation mode, and coarse mode, respectively. Changing the GSD to 1.6 for both the nuclei and accumulation mode (i.e., MADE2 simulations) results in a better representation of the observed aerosol size distribution (Fig. 12 vs. Fig. 8), with a narrower accumulation mode peaking in the 300–450 nm range and a much smaller mass contribution in sizes above 625 nm. These results are consistent with Brock et al. (2016b), who showed that GSDs in the southeastern US are in the 1.4–1.6 range, while chemistry–climate models generally overpredict them by using a GSD value of 2.0.

Figure 13(a) Bar plot showing submicron aerosol mass concentration by species for observations (AMS+SP2) and retrospective simulations. (b) Pie charts showing the percentage contribution by each species for observations and retrospective simulations.
After correcting the modeled size distribution, a larger percentage of the aerosol mass is found within the AMS transmission (see the increase in mass for all species from MADE1 to MADE2 in Fig. 13a). Also, the model representation of mass and volume extinction efficiency against observations now follows the same trend for MADE2 (Fig. 11a, b). Another reason for potential discrepancies is related to the aerosol density used for organic aerosol (OA) in the model. For the closure study, OA mass is converted to volume using the density reported by the AMS, which varies substantially with the oxidation state of organic aerosol (Kuwata et al., 2012). For the period analyzed here, the OA density has a mean of 1.5 g cm−3 and 25th and 75th percentiles of 1.35 and 1.6 g cm−3, respectively. In the case of the simulations, the aerosol optical properties code in WRF-Chem uses a constant OA density of 1.0 g cm−3. Thus, a lower density translates into larger volume per unit mass, increasing the mass extinction efficiency and explaining the remaining discrepancy. On the other hand, the volume extinction efficiency is less sensitive to changes in aerosol density as a decrease in density decreases both extinction and volume. In fact, the volume extinction efficiency remains consistent with the analyses shown in the previous section when changing the size distribution and aerosol density. Thus, we use volume extinction efficiency in the following analysis.
As shown in Fig. 11b, the dry-extinction-to-volume ratio is greatly underestimated by almost a factor of 2 by the MOSAIC4b simulation, which helps explain the discrepancy described in Fig. 5. As described in the previous section, large improvements are found when computing optical properties using a finer aerosol bin representation, with some remaining biases (MOSAIC8b and MADE1 bring the mean volume extinction efficiency to 6.4 and 6.5 m2 m−3, respectively). This large improvement from the four- to eight-bin configuration is in agreement with previous studies that found an overall consistency between AOD and surface PM when using eight size bins (Saide et al., 2014; Gao et al., 2015, 2016b). Surprisingly, simulations with a better aerosol size distribution representation (MADE2) do not significantly modify the representation of the volume and mass extinction efficiency (mean volume extinction efficiency remains at 6.5 m2 m−3). Figures 12 and 10 show that both size distributions (MADE1 and MADE2 for the eight-bin configuration) are centered in a size range with high mass extinction efficiency (∼9 m2 g−1 at a 400 nm diameter). While the original size distribution has less mass assigned to this high-efficiency bin, it has substantial mass in larger size ranges at which the mass extinction efficiency is still high (∼7 m2 g−1 at ∼800 nm diameter). On the other hand, the updated size distribution has larger mass in smaller size bins in which the mass extinction efficiency drops substantially (∼3–4 m2 g−1 at 200–250 nm diameter). Thus, the overall mass extinction efficiency remains similar for both size distributions due to compensating effects. As performed in the previous section, a sensitivity simulation is carried out such that the refractive indices of selected species are increased (MADE3–4), which brings the ratios to similar levels as Closure 5 (mean volume extinction efficiency of 7.6 m2 m−3 for MADE4 vs. 7.5 m2 m−3 for Closure 5).
In terms of aerosol hygroscopic growth and its effects on scattering, all base simulations underpredict f(RH) (1.7–1.8 on average, with observations and Closure 5 showing 2.2 and 2.1, respectively), which also helps explain the discrepancies shown in Fig. 5. Improving the size distribution (MADE2) has a small but positive effect on the f(RH) representation. The largest improvement is found when updating the hygroscopicity parameters for the same species updated in Closure 5 (average f(RH) of 2.0 for MADE4). After this, a slight underprediction is still found. A possible contribution to this bias could be linked to the simulations not representing the aerosol chemical composition properly. As seen in Fig. 13, MADE2 reasonably represents the observed pie chart but does show a slight overprediction of the less hydrophilic species (sum of OA, BC, and OINs is 44 % vs. 37 % in the observations). Another contributor to this bias is the low OA density used in the retrospective simulations. Using a lower aerosol density has a similar effect as using a larger refractive index (more extinction per unit mass), and, as seen in Fig. 10a, increasing the refractive index reduces f(RH), explaining the bias. A sensitivity analysis using observed OA density confirms this finding (not shown).
AE performance improves drastically when the size resolution is improved (average AE increases from 1.0 in MADE1 to 1.9 in MADE2) as the size distribution is shifted to smaller sizes, increasing AE. The AE after all the updates (MADE4) is still low (mean AE for MADE4 is 1.6 vs. 2.2 in the observations), which is partially related to the low OA density but also might be associated with the modeled size distribution. Out of the base simulations, SSA performance is better for the MADE1 simulation (mean of 0.93) as MOSAIC8b (mean of 0.89) overpredicts the black carbon fraction (Fig. 13) and MOSAIC4b (mean of 0.90) has a coarse size bin representation (see previous section). After the updates (MADE4), SSA skill is comparable to that of the Closure 5 study (mean of 0.94), likely due to BC being well represented in both magnitude and fractional contribution (the MADE2 results shown in Fig. 13 are similar to those from MADE4).
In this study, we first evaluated WRF-Chem forecasts, which included the assimilation of AOD, performed to support flight planning during the NASA/NIER KORUS-AQ field campaign. While forecasts showed accurate predictions of aerosol optical depth, there were overpredictions of surface particulate matter in the Korean Peninsula, with the largest deviations occurring for PM2.5 during a transboundary pollution event. Additional analysis showed that the model was able to capture the vertical extent and the relative humidity of the haze layer, pointing towards issues related to the calculation of aerosol mass to optical properties.
Further analysis was split into two sections. First, a closure study was performed by driving the optical properties parameterization with in situ observations of aerosol size distributions and composition collected by the DC-8 aircraft. These were compared to measured optical properties, including mass and volume extinction efficiencies, hygroscopic growth represented by f(RH), the Ångström exponent, and single-scattering albedo (SSA). This analysis showed closure was not possible by the base configuration and that multiple modifications were needed to achieve closure. These included driving the optical properties code with a finer size bin representation (from 4 up to 16 bins), increasing the refractive indices of ammonium nitrate (to 1.553) and organic aerosol (to 1.55) according to ranges found in the recent literature, and increasing the hygroscopicity parameter of ammonium sulfate (to 0.61), ammonium nitrate (to 0.67), organic aerosol (to 0.14), and other inorganics (to 0.14) within published ranges. The coarse bin representation and low values of refractive indices and hygroscopicity parameters explain why the forecasts showed the largest discrepancies during the haze event, as these events are associated with large relative humidity and aerosol size distributions that peak close to the maximum mass extinction efficiencies.
Second, aerosol optical and microphysical properties were evaluated for retrospective simulations using three different aerosol models within WRF-Chem. This exercise additionally found that all three aerosol models were unable to properly capture the aerosol size distribution, showing a larger size range than what was observed. As a result, a substantial fraction of modeled aerosol mass was in sizes at which the AMS transmission starts decreasing, which led to discrepancies between the modeled mass and volume extinction efficiencies. We also found that, while the model uses a value of 1.0 g cm−3 for organic aerosol density, larger values were observed with a mean of ∼1.5 g cm−3 and considerable variability, which generated further discrepancies and reduced the skill in predicting some of the optical properties. Other issues included an overprediction of the OIN fractional contribution by all models (which could be due to issues with OIN emissions and/or secondary aerosol formation). The size distribution of a configuration using a modal scheme was improved by reducing the geometric standard deviation (GSD) of the accumulation mode from 2.0 to 1.6. Further increasing the refractive indices and hygroscopicity parameters (as noted above) provided an overall better representation of optical properties. Future work needs to assess if the simulated size distributions can be improved by including primary aerosol emissions in the model using size-resolved and source-specific observational datasets (Winijkul et al., 2015; Lu et al., 2015).
A series of assumptions were made in this study that should be considered when analyzing the results. One of them corresponds to the correction of the LAS measurements to account for the PSL calibration and for the saturation of the instrument at high aerosol concentrations. The calibration correction was performed by applying a single scaling factor to the measured diameters, which may not be constant due to changes in aerosol size and composition (Kupc et al., 2018). In addition, the saturation correction was applied for all LAS size bins equally, while the saturation of the instrument is a function of both particle concentration and size. The use of these assumptions could impact the results, which could account for some of the minor mismatches found between observations and the closure study after accounting for possible model uncertainties (Closure 5). The LAS was the only instrument onboard sampling the overall aerosol size distribution over the ranges in which the accumulation mode peaked, so it would be useful for future field campaigns to have overlapping instruments with similar capabilities over this size range or dilute the sample during high-concentration events as has been done in other deployments (Brock et al., 2019).
The consistency of relationships between AOD and PM in models is a key element of effectively improving predictions through data assimilation of AOD and/or PM mass. This work found that multiple sources of model uncertainties need to be addressed to provide an accurate representation of optical properties and avoid mismatches when performing data assimilation driven by AOD observations. These include the use of a fine aerosol size representation in optical properties calculations and an improved representation of aerosol properties (size distribution, chemical composition, refractive index, hygroscopicity parameter, density). Accurate representation of aerosol optical properties is also important for other fields that use these models to make the connection between aerosol mass concentrations and aerosol optical properties, including assessments of aerosol health effects based on satellite data, proper projections of aerosol–radiation interactions by climate models, visibility forecasts, and solar power predictions for energy applications.
In this study we evaluated different configurations of the WRF-Chem model for the specific case of anthropogenic outflow from China, and thus future studies can perform similar analyses for other types of air masses and assess if the model configuration updates suggested here produce better results in other scenarios. Also, a similar analysis is needed for other air quality and chemistry–climate models to assess if similar biases or different ones arise.
The WRF-Chem code and satellite AOD retrievals used in this study are available upon request. AERONET data are available at https://aeronet.gsfc.nasa.gov/ (NASA, 2020). Korean air quality data for the period studied, KORUS-AQ data and flight reports, are public at https://doi.org/10.5067/Suborbital/KORUSAQ/DATA01 (Aknan and Chen, 2019). Contact Pablo E. Saide (saide@atmos.ucla.edu) for data requests.
PES designed and executed the study and led the writing of the paper. AB, CAC, KLT, BA, JWH, ARN, GSD, JLJ, BAN, PCJ, JD, EH, KDL, JPS, AEP, JK, MC, and BH provided observational data. GP and AH provided code. All coauthors contributed with feedback during the development and writing of the study.
The authors declare that they have no conflict of interest.
The contents of this study are solely the responsibility of the authors and do not necessarily represent the official views of the funding institutions.
We thank all KORUS-AQ participants that made the field experiment possible. We also thank the PIs and their staff at all the AERONET sites in South Korea for establishing and maintaining them.
This research has been supported by the NASA Tropospheric Composition Program and NASA grants NNX11AI52G, NNX16AD96G, NNX15AT96G, 20 NNX15AT88G, NNH15AB60I, and 80NSSC19K0124. The National Center for Atmospheric Research is sponsored by the National Science Foundation. Jhoon Kim and Myungje Choi were supported by the program “Technology development for Practical Applications of Multi-Satellite data to maritime issues” funded by the Ministry of Ocean and Fisheries, Korea.
This paper was edited by Pedro Jimenez-Guerrero and reviewed by two anonymous referees.
Ahmadov, R., McKeen, S. A., Robinson, A. L., Bahreini, R., Middlebrook, A. M., de Gouw, J. A., Meagher, J., Hsie, E.-Y., Edgerton, E., Shaw, S., and Trainer, M.: A volatility basis set model for summertime secondary organic aerosols over the eastern United States in 2006, J. Geophys. Res.-Atmos., 117, D06301, https://doi.org/10.1029/2011jd016831, 2012.
Ahmadov, R., McKeen, S., Trainer, M., Banta, R., Brewer, A., Brown, S., Edwards, P. M., de Gouw, J. A., Frost, G. J., Gilman, J., Helmig, D., Johnson, B., Karion, A., Koss, A., Langford, A., Lerner, B., Olson, J., Oltmans, S., Peischl, J., Pétron, G., Pichugina, Y., Roberts, J. M., Ryerson, T., Schnell, R., Senff, C., Sweeney, C., Thompson, C., Veres, P. R., Warneke, C., Wild, R., Williams, E. J., Yuan, B., and Zamora, R.: Understanding high wintertime ozone pollution events in an oil- and natural gas-producing region of the western US, Atmos. Chem. Phys., 15, 411–429, https://doi.org/10.5194/acp-15-411-2015, 2015.
Aknan, A. and Chen, G.: KORUS-AQ DC-8 Aircraft Dataset, KORUS-AQ, https://doi.org/10.5067/Suborbital/KORUSAQ/DATA01, 2019.
Aldhaif, A. M., Stahl, C., Braun, R. A., Moghaddam, M. A., Shingler, T., Crosbie, E., Sawamura, P., Dadashazar, H., Ziemba, L., Jimenez, J. L., Campuzano-Jost, P., and Sorooshian, A.: Characterization of the Real Part of Dry Aerosol Refractive Index Over North America From the Surface to 12 km, J. Geophys. Res.-Atmos., 123, 8283–8300, https://doi.org/10.1029/2018jd028504, 2018.
Balzarini, A., Pirovano, G., Honzak, L., Žabkar, R., Curci, G., Forkel, R., Hirtl, M., San José, R., Tuccella, P., and Grell, G. A.: WRF-Chem model sensitivity to chemical mechanisms choice in reconstructing aerosol optical properties, Atmos. Environ., 115, 604–619, https://doi.org/10.1016/j.atmosenv.2014.12.033, 2015.
Barnard, J. C., Fast, J. D., Paredes-Miranda, G., Arnott, W. P., and Laskin, A.: Technical Note: Evaluation of the WRF-Chem “Aerosol Chemical to Aerosol Optical Properties” Module using data from the MILAGRO campaign, Atmos. Chem. Phys., 10, 7325–7340, https://doi.org/10.5194/acp-10-7325-2010, 2010.
Benedetti, A., Morcrette, J., Boucher, O., Dethof, A., Engelen, R., Fisher, M., Flentje, H., Huneeus, N., Jones, L., and Kaiser, J.: Aerosol analysis and forecast in the European Centre for Medium-Range Weather Forecasts Integrated Forecast System: 2. Data assimilation, J. Geophys. Res, 114, D13205, https://doi.org/10.1029/2008JD011115, 2009.
Bohren, C. F. and Huffman, D. R.: Absorption and scattering of light by small particles, Wiley, New York, 1983.
Boucher, O., Randall, D., Artaxo, P., Bretherton, C., Feingold, G., Forster, P., Kerminen, V.-M., Kondo, Y., Liao, H., Lohmann, U., Rasch, P., Satheesh, S. K., Sherwood, S., Stevens, B., and Zhang, X. Y.: Clouds and Aerosols, in: Climate Change 2013: The Physical Science Basis. Contribution of Working Group I to the Fifth Assessment Report of the Intergovernmental 25 Panel on Climate Change, edited by: Stocker, T. F., Qin, D., Plattner, G.-K., Tignor, M., Allen, S. K., Boschung, J., Nauels, A., Xia, Y., Bex, V., and Midgley, P. M., Cambridge University Press, Cambridge, United Kingdom and New York, NY, USA, 2013.
Brock, C. A., Wagner, N. L., Anderson, B. E., Attwood, A. R., Beyersdorf, A., Campuzano-Jost, P., Carlton, A. G., Day, D. A., Diskin, G. S., Gordon, T. D., Jimenez, J. L., Lack, D. A., Liao, J., Markovic, M. Z., Middlebrook, A. M., Ng, N. L., Perring, A. E., Richardson, M. S., Schwarz, J. P., Washenfelder, R. A., Welti, A., Xu, L., Ziemba, L. D., and Murphy, D. M.: Aerosol optical properties in the southeastern United States in summer – Part 1: Hygroscopic growth, Atmos. Chem. Phys., 16, 4987–5007, https://doi.org/10.5194/acp-16-4987-2016, 2016a.
Brock, C. A., Wagner, N. L., Anderson, B. E., Beyersdorf, A., Campuzano-Jost, P., Day, D. A., Diskin, G. S., Gordon, T. D., Jimenez, J. L., Lack, D. A., Liao, J., Markovic, M. Z., Middlebrook, A. M., Perring, A. E., Richardson, M. S., Schwarz, J. P., Welti, A., Ziemba, L. D., and Murphy, D. M.: Aerosol optical properties in the southeastern United States in summer – Part 2: Sensitivity of aerosol optical depth to relative humidity and aerosol parameters, Atmos. Chem. Phys., 16, 5009–5019, https://doi.org/10.5194/acp-16-5009-2016, 2016b.
Brock, C. A., Williamson, C., Kupc, A., Froyd, K. D., Erdesz, F., Wagner, N., Richardson, M., Schwarz, J. P., Gao, R.-S., Katich, J. M., Campuzano-Jost, P., Nault, B. A., Schroder, J. C., Jimenez, J. L., Weinzierl, B., Dollner, M., Bui, T., and Murphy, D. M.: Aerosol size distributions during the Atmospheric Tomography Mission (ATom): methods, uncertainties, and data products, Atmos. Meas. Tech., 12, 3081–3099, https://doi.org/10.5194/amt-12-3081-2019, 2019.
Chin, M., Ginoux, P., Kinne, S., Torres, O., Holben, B. N., Duncan, B. N., Martin, R. V., Logan, J. A., Higurashi, A., and Nakajima, T.: Tropospheric Aerosol Optical Thickness from the GOCART Model and Comparisons with Satellite and Sun Photometer Measurements, J. Atmos. Sci., 59, 461–483, https://doi.org/10.1175/1520-0469(2002)059<0461:taotft>2.0.co;2, 2002.
Choi, M., Kim, J., Lee, J., Kim, M., Park, Y.-J., Jeong, U., Kim, W., Hong, H., Holben, B., Eck, T. F., Song, C. H., Lim, J.-H., and Song, C.-K.: GOCI Yonsei Aerosol Retrieval (YAER) algorithm and validation during the DRAGON-NE Asia 2012 campaign, Atmos. Meas. Tech., 9, 1377–1398, https://doi.org/10.5194/amt-9-1377-2016, 2016.
Choi, M., Kim, J., Lee, J., Kim, M., Park, Y.-J., Holben, B., Eck, T. F., Li, Z., and Song, C. H.: GOCI Yonsei aerosol retrieval version 2 products: an improved algorithm and error analysis with uncertainty estimation from 5-year validation over East Asia, Atmos. Meas. Tech., 11, 385–408, https://doi.org/10.5194/amt-11-385-2018, 2018.
Choi, J., Park, R. J., Lee, H.-M., Lee, S., Jo, D. S., Jeong, J. I., Henze, D. K., Woo, J.-H., Ban, S.-J., Lee, M.-D., Lim, C.-S., Park, M.-K., Shin, H. J., Cho, S., Peterson, D., and Song, C.-K.: Impacts of local vs. trans-boundary emissions from different sectors on PM2.5 exposure in South Korea during the KORUS-AQ campaign, Atmos. Environ., 203, 196–205, https://doi.org/10.1016/j.atmosenv.2019.02.008, 2019a.
Choi, M., Lim, H., Kim, J., Lee, S., Eck, T. F., Holben, B. N., Garay, M. J., Hyer, E. J., Saide, P. E., and Liu, H.: Validation, comparison, and integration of GOCI, AHI, MODIS, MISR, and VIIRS aerosol optical depth over East Asia during the 2016 KORUS-AQ campaign, Atmos. Meas. Tech., 12, 4619–4641, https://doi.org/10.5194/amt-12-4619-2019, 2019b.
Clark, P. A., Harcourt, S. A., Macpherson, B., Mathison, C. T., Cusack, S., and Naylor, M.: Prediction of visibility and aerosol within the operational Met Office Unified Model. I: Model formulation and variational assimilation, Q. J. Roy. Meteor. Soc., 134, 1801–1816, https://doi.org/10.1002/qj.318, 2008.
Cohen, A. J., Brauer, M., Burnett, R., Anderson, H. R., Frostad, J., Estep, K., Balakrishnan, K., Brunekreef, B., Dandona, L., Dandona, R., Feigin, V., Freedman, G., Hubbell, B., Jobling, A., Kan, H., Knibbs, L., Liu, Y., Martin, R., Morawska, L., Pope, C. A., III, Shin, H., Straif, K., Shaddick, G., Thomas, M., van Dingenen, R., van Donkelaar, A., Vos, T., Murray, C. J. L., and Forouzanfar, M. H.: Estimates and 25-year trends of the global burden of disease attributable to ambient air pollution: an analysis of data from the Global Burden of Diseases Study 2015, Lancet, 389, 1907–1918, https://doi.org/10.1016/S0140-6736(17)30505-6, 2017.
Crippa, P., Sullivan, R. C., Thota, A., and Pryor, S. C.: Sensitivity of Simulated Aerosol Properties Over Eastern North America to WRF-Chem Parameterizations, J. Geophys. Res.-Atmos., 124, 3365–3383, https://doi.org/10.1029/2018JD029900, 2019.
Curci, G., Alyuz, U., Barò, R., Bianconi, R., Bieser, J., Christensen, J. H., Colette, A., Farrow, A., Francis, X., Jiménez-Guerrero, P., Im, U., Liu, P., Manders, A., Palacios-Peña, L., Prank, M., Pozzoli, L., Sokhi, R., Solazzo, E., Tuccella, P., Unal, A., Vivanco, M. G., Hogrefe, C., and Galmarini, S.: Modelling black carbon absorption of solar radiation: combining external and internal mixing assumptions, Atmos. Chem. Phys., 19, 181–204, https://doi.org/10.5194/acp-19-181-2019, 2019.
Darmenov, A. and da Silva, A. M.: The Quick Fire Emissions Dataset (QFED) – Documentation of versions 2.1, 2.2 and 2.4, NASA/TM–2015–104606, Vol. 38, 183 pp., available at: https://gmao.gsfc.nasa.gov/pubs/docs/Darmenov796.pdf (last access: 28 May 2020), 2015.
DeCarlo, P. F., Slowik, J. G., Worsnop, D. R., Davidovits, P., and Jimenez, J. L.: Particle Morphology and Density Characterization by Combined Mobility and Aerodynamic Diameter Measurements. Part 1: Theory, Aerosol Sci. Technol., 38, 1185–1205, https://doi.org/10.1080/027868290903907, 2004.
DeCarlo, P. F., Kimmel, J. R., Trimborn, A., Northway, M. J., Jayne, J. T., Aiken, A. C., Gonin, M., Fuhrer, K., Horvath, T., Docherty, K. S., Worsnop, D. R., and Jimenez, J. L.: Field-Deployable, High-Resolution, Time-of-Flight Aerosol Mass Spectrometer, Anal. Chem., 78, 8281–8289, https://doi.org/10.1021/ac061249n, 2006.
Dibb, J. E., Talbot, R. W., and Scheuer, E. M.: Composition and distribution of aerosols over the North Atlantic during the Subsonic Assessment Ozone and Nitrogen Oxide Experiment (SONEX), J. Geophys. Res.-Atmos., 105, 3709–3717, 2000.
Dillner, A. M., Schauer, J. J., Zhang, Y., Zeng, L., and Cass, G. R.: Size-resolved particulate matter composition in Beijing during pollution and dust events, J. Geophys. Res.-Atmos., 111, D05203, https://doi.org/10.1029/2005jd006400, 2006.
Fast, J. D., Gustafson Jr., W. I., Easter, R. C., Zaveri, R. A., Barnard, J. C., Chapman, E. G., Grell, G. A., and Peckham, S. E.: Evolution of ozone, particulates, and aerosol direct radiative forcing in the vicinity of Houston using a fully coupled meteorology-chemistry-aerosol model, J. Geophys. Res., 111, D21305, https://doi.org/10.1029/2005JD006721, 2006.
Feng, Y., Cadeddu, M., Kotamarthi, V. R., Renju, R., and Suresh Raju, C.: Humidity Bias and Effect on Simulated Aerosol Optical Properties during the Ganges Valley Experiment, Current Science (Bangalore), 111, 93–100, JSTOR, available at: https://www.jstor.org/stable/24910012 (last access: 29 May 2020), 2016.
Gakidou, E., Afshin, A., Abajobir, A. A., Abate, K. H., Abbafati, C., Abbas, K. M., Abd-Allah, F., Abdulle, A. M., Abera, S. F., Aboyans, V., Abu-Raddad, L. J., Abu-Rmeileh, N. M. E., Abyu, G. Y., Adedeji, I. A., Adetokunboh, O., Afarideh, M., Agrawal, A., Agrawal, S., Ahmadieh, H., Ahmed, M. B., Aichour, M. T. E., Aichour, A. N., Aichour, I., Akinyemi, R. O., Akseer, N., Alahdab, F., Al-Aly, Z., Alam, K., Alam, N., Alam, T., Alasfoor, D., Alene, K. A., Ali, K., Alizadeh-Navaei, R., Alkerwi, A. a., Alla, F., Allebeck, P., Al-Raddadi, R., Alsharif, U., Altirkawi, K. A., Alvis-Guzman, N., Amare, A. T., Amini, E., Ammar, W., Amoako, Y. A., Ansari, H., Antó, J. M., Antonio, C. A. T., Anwari, P., Arian, N., Ärnlöv, J., Artaman, A., Aryal, K. K., Asayesh, H., Asgedom, S. W., Atey, T. M., Avila-Burgos, L., Avokpaho, E. F. G. A., Awasthi, A., Azzopardi, P., Bacha, U., Badawi, A., Balakrishnan, K., Ballew, S. H., Barac, A., Barber, R. M., Barker-Collo, S. L., Bärnighausen, T., Barquera, S., Barregard, L., Barrero, L. H., Batis, C., Battle, K. E., Baumgarner, B. R., Baune, B. T., Beardsley, J., Bedi, N., Beghi, E., Bell, M. L., Bennett, D. A., Bennett, J. R., Bensenor, I. M., Berhane, A., Berhe, D. F., Bernabé, E., Betsu, B. D., Beuran, M., Beyene, A. S., Bhansali, A., Bhutta, Z. A., Bicer, B. K., Bikbov, B., Birungi, C., Biryukov, S., Blosser, C. D., Boneya, D. J., Bou-Orm, I. R., Brauer, M., Breitborde, N. J. K., Brenner, H., Brugha, T. S., Bulto, L. N. B., Butt, Z. A., Cahuana-Hurtado, L., Cárdenas, R., Carrero, J. J., Castañeda-Orjuela, C. A., Catalá-López, F., Cercy, K., Chang, H.-Y., et al.: Global, regional, and national comparative risk assessment of 84 behavioural, environmental and occupational, and metabolic risks or clusters of risks, 1990–2016: a systematic analysis for the Global Burden of Disease Study 2016, Lancet, 390, 1345–1422, https://doi.org/10.1016/S0140-6736(17)32366-8, 2017.
Gao, M., Carmichael, G. R., Wang, Y., Ji, D., Liu, Z., and Wang, Z.: Improving simulations of sulfate aerosols during winter haze over Northern China: the impacts of heterogeneous oxidation by NO2, Front. Env. Sci. Eng., 10, 16, https://doi.org/10.1007/s11783-016-0878-2, 2016a.
Gao, M., Carmichael, G. R., Wang, Y., Saide, P. E., Yu, M., Xin, J., Liu, Z., and Wang, Z.: Modeling study of the 2010 regional haze event in the North China Plain, Atmos. Chem. Phys., 16, 1673–1691, https://doi.org/10.5194/acp-16-1673-2016, 2016b.
Gao, Y., Zhang, M., Liu, Z., Wang, L., Wang, P., Xia, X., Tao, M., and Zhu, L.: Modeling the feedback between aerosol and meteorological variables in the atmospheric boundary layer during a severe fog–haze event over the North China Plain, Atmos. Chem. Phys., 15, 4279–4295, https://doi.org/10.5194/acp-15-4279-2015, 2015.
Giles, D. M., Sinyuk, A., Sorokin, M. G., Schafer, J. S., Smirnov, A., Slutsker, I., Eck, T. F., Holben, B. N., Lewis, J. R., Campbell, J. R., Welton, E. J., Korkin, S. V., and Lyapustin, A. I.: Advancements in the Aerosol Robotic Network (AERONET) Version 3 database – automated near-real-time quality control algorithm with improved cloud screening for Sun photometer aerosol optical depth (AOD) measurements, Atmos. Meas. Tech., 12, 169–209, https://doi.org/10.5194/amt-12-169-2019, 2019.
Ginoux, P., Chin, M., Tegen, I., Prospero, J. M., Holben, B., Dubovik, O., and Lin, S.-J.: Sources and distributions of dust aerosols simulated with the GOCART model, J. Geophys. Res.-Atmos., 106, 20255–20273, https://doi.org/10.1029/2000jd000053, 2001.
Goldberg, D. L., Gupta, P., Wang, K., Jena, C., Zhang, Y., Lu, Z., and Streets, D. G.: Using gap-filled MAIAC AOD and WRF-Chem to estimate daily PM2.5 concentrations at 1 km resolution in the Eastern United States, Atmos. Environ., 199, 443–452, https://doi.org/10.1016/j.atmosenv.2018.11.049, 2019a.
Goldberg, D. L., Saide, P. E., Lamsal, L. N., de Foy, B., Lu, Z., Woo, J.-H., Kim, Y., Kim, J., Gao, M., Carmichael, G., and Streets, D. G.: A top-down assessment using OMI NO2 suggests an underestimate in the NOx emissions inventory in Seoul, South Korea, during KORUS-AQ, Atmos. Chem. Phys., 19, 1801–1818, https://doi.org/10.5194/acp-19-1801-2019, 2019b.
Gong, S. L., Barrie, L. A., and Lazare, M.: Canadian Aerosol Module (CAM): A size-segregated simulation of atmospheric aerosol processes for climate and air quality models 2. Global sea-salt aerosol and its budgets, J. Geophys. Res.-Atmos., 107, AAC 13-11–AAC 13-14, https://doi.org/10.1029/2001jd002004, 2002.
Good, N., Topping, D. O., Allan, J. D., Flynn, M., Fuentes, E., Irwin, M., Williams, P. I., Coe, H., and McFiggans, G.: Consistency between parameterisations of aerosol hygroscopicity and CCN activity during the RHaMBLe discovery cruise, Atmos. Chem. Phys., 10, 3189–3203, https://doi.org/10.5194/acp-10-3189-2010, 2010.
Grell, G., Peckham, S. E., Schmitz, R., McKeen, S. A., Frost, G., Skamarock, W. C., and Eder, B.: Fully coupled “online” chemistry within the WRF model, Atmos. Environ., 39, 6957–6975, https://doi.org/10.1016/j.atmosenv.2005.04.027, 2005.
Grell, G., Freitas, S. R., Stuefer, M., and Fast, J.: Inclusion of biomass burning in WRF-Chem: impact of wildfires on weather forecasts, Atmos. Chem. Phys., 11, 5289–5303, https://doi.org/10.5194/acp-11-5289-2011, 2011.
Guenther, A., Karl, T., Harley, P., Wiedinmyer, C., Palmer, P. I., and Geron, C.: Estimates of global terrestrial isoprene emissions using MEGAN (Model of Emissions of Gases and Aerosols from Nature), Atmos. Chem. Phys., 6, 3181–3210, https://doi.org/10.5194/acp-6-3181-2006, 2006.
Guo, H., Weber, R. J., and Nenes, A.: High levels of ammonia do not raise fine particle pH sufficiently to yield nitrogen oxide-dominated sulfate production, Sci. Rep.-UK, 7, 12109, https://doi.org/10.1038/s41598-017-11704-0, 2017.
Hair, J. W., Hostetler, C. A., Cook, A. L., Harper, D. B., Ferrare, R. A., Mack, T. L., Welch, W., Izquierdo, L. R., and Hovis, F. E.: Airborne High Spectral Resolution Lidar for profiling aerosol optical properties, Appl. Optics, 47, 6734–6752, https://doi.org/10.1364/ao.47.006734, 2008.
Hand, J. L. and Kreidenweis, S. M.: A New Method for Retrieving Particle Refractive Index and Effective Density from Aerosol Size Distribution Data, Aerosol Sci. Technol., 36, 1012–1026, https://doi.org/10.1080/02786820290092276, 2002.
Hayes, P. L., Carlton, A. G., Baker, K. R., Ahmadov, R., Washenfelder, R. A., Alvarez, S., Rappenglück, B., Gilman, J. B., Kuster, W. C., de Gouw, J. A., Zotter, P., Prévôt, A. S. H., Szidat, S., Kleindienst, T. E., Offenberg, J. H., Ma, P. K., and Jimenez, J. L.: Modeling the formation and aging of secondary organic aerosols in Los Angeles during CalNex 2010, Atmos. Chem. Phys., 15, 5773–5801, https://doi.org/10.5194/acp-15-5773-2015, 2015.
Heim, E. W., Dibb, J., Scheuer, E., Jost, P. C., Nault, B. A., Jimenez, J. L., Peterson, D., Knote, C., Fenn, M., Hair, J., Beyersdorf, A. J., Corr, C., and Anderson, B. E.: Asian dust observed during KORUS-AQ facilitates the uptake and incorporation of soluble pollutants during transport to South Korea, Atmos. Environ., 224, 117305, https://doi.org/10.1016/j.atmosenv.2020.117305, 2020.
Hodzic, A. and Jimenez, J. L.: Modeling anthropogenically controlled secondary organic aerosols in a megacity: a simplified framework for global and climate models, Geosci. Model Dev., 4, 901–917, https://doi.org/10.5194/gmd-4-901-2011, 2011.
Hodzic, A., Chepfer, H., Vautard, R., Chazette, P., Beekmann, M., Bessagnet, B., Chatenet, B., Cuesta, J., Drobinski, P., Goloub, P., Haeffelin, M., and Morille, Y.: Comparison of aerosol chemistry transport model simulations with lidar and Sun photometer observations at a site near Paris, J. Geophys. Res.-Atmos., 109, D23201, https://doi.org/10.1029/2004jd004735, 2004.
Holben, B. N., Eck, T. F., Slutsker, I., Tanré, D., Buis, J. P., Setzer, A., Vermote, E., Reagan, J. A., Kaufman, Y. J., Nakajima, T., Lavenu, F., Jankowiak, I., and Smirnov, A.: AERONET–A Federated Instrument Network and Data Archive for Aerosol Characterization, Remote Sens. Environ., 66, 1–16, https://doi.org/10.1016/S0034-4257(98)00031-5, 1998.
Holben, B. N., Kim, J., Sano, I., Mukai, S., Eck, T. F., Giles, D. M., Schafer, J. S., Sinyuk, A., Slutsker, I., Smirnov, A., Sorokin, M., Anderson, B. E., Che, H., Choi, M., Crawford, J. H., Ferrare, R. A., Garay, M. J., Jeong, U., Kim, M., Kim, W., Knox, N., Li, Z., Lim, H. S., Liu, Y., Maring, H., Nakata, M., Pickering, K. E., Piketh, S., Redemann, J., Reid, J. S., Salinas, S., Seo, S., Tan, F., Tripathi, S. N., Toon, O. B., and Xiao, Q.: An overview of mesoscale aerosol processes, comparisons, and validation studies from DRAGON networks, Atmos. Chem. Phys., 18, 655–671, https://doi.org/10.5194/acp-18-655-2018, 2018.
Hu, W., Campuzano-Jost, P., Day, D. A., Croteau, P., Canagaratna, M. R., Jayne, J. T., Worsnop, D. R., and Jimenez, J. L.: Evaluation of the new capture vapourizer for aerosol mass spectrometers (AMS) through laboratory studies of inorganic species, Atmos. Meas. Tech., 10, 2897–2921, https://doi.org/10.5194/amt-10-2897-2017, 2017.
Im, U., Bianconi, R., Solazzo, E., Kioutsioukis, I., Badia, A., Balzarini, A., Baró, R., Bellasio, R., Brunner, D., Chemel, C., Curci, G., Flemming, J., Forkel, R., Giordano, L., Jiménez-Guerrero, P., Hirtl, M., Hodzic, A., Honzak, L., Jorba, O., Knote, C., Kuenen, J. J. P., Makar, P. A., Manders-Groot, A., Neal, L., Pérez, J. L., Pirovano, G., Pouliot, G., San Jose, R., Savage, N., Schroder, W., Sokhi, R. S., Syrakov, D., Torian, A., Tuccella, P., Werhahn, J., Wolke, R., Yahya, K., Zabkar, R., Zhang, Y., Zhang, J., Hogrefe, C., and Galmarini, S.: Evaluation of operational on-line-coupled regional air quality models over Europe and North America in the context of AQMEII phase 2. Part I: Ozone, Atmos. Environ., 115, 404–420, https://doi.org/10.1016/j.atmosenv.2014.09.042, 2015.
Inness, A., Blechschmidt, A.-M., Bouarar, I., Chabrillat, S., Crepulja, M., Engelen, R. J., Eskes, H., Flemming, J., Gaudel, A., Hendrick, F., Huijnen, V., Jones, L., Kapsomenakis, J., Katragkou, E., Keppens, A., Langerock, B., de Mazière, M., Melas, D., Parrington, M., Peuch, V. H., Razinger, M., Richter, A., Schultz, M. G., Suttie, M., Thouret, V., Vrekoussis, M., Wagner, A., and Zerefos, C.: Data assimilation of satellite-retrieved ozone, carbon monoxide and nitrogen dioxide with ECMWF's Composition-IFS, Atmos. Chem. Phys., 15, 5275–5303, https://doi.org/10.5194/acp-15-5275-2015, 2015.
Jimenez, P. A., Hacker, J. P., Dudhia, J., Haupt, S. E., Ruiz-Arias, J. A., Gueymard, C. A., Thompson, G., Eidhammer, T., and Deng, A.: WRF-Solar: Description and Clear-Sky Assessment of an Augmented NWP Model for Solar Power Prediction, B. Am. Meteorol. Soc., 97, 1249–1264, https://doi.org/10.1175/bams-d-14-00279.1, 2016.
Kabata-Pendias, A. and Pendias, H.: Trace elements in soils and plants, CRC Press, Boca Raton, FL, 2001.
Kipling, Z., Stier, P., Johnson, C. E., Mann, G. W., Bellouin, N., Bauer, S. E., Bergman, T., Chin, M., Diehl, T., Ghan, S. J., Iversen, T., Kirkevåg, A., Kokkola, H., Liu, X., Luo, G., van Noije, T., Pringle, K. J., von Salzen, K., Schulz, M., Seland, Ø., Skeie, R. B., Takemura, T., Tsigaridis, K., and Zhang, K.: What controls the vertical distribution of aerosol? Relationships between process sensitivity in HadGEM3–UKCA and inter-model variation from AeroCom Phase II, Atmos. Chem. Phys., 16, 2221–2241, https://doi.org/10.5194/acp-16-2221-2016, 2016.
Knote, C., Hodzic, A., and Jimenez, J. L.: The effect of dry and wet deposition of condensable vapors on secondary organic aerosols concentrations over the continental US, Atmos. Chem. Phys., 15, 1–18, https://doi.org/10.5194/acp-15-1-2015, 2015.
Kok, J. F.: A scaling theory for the size distribution of emitted dust aerosols suggests climate models underestimate the size of the global dust cycle, P. Natl. Acad. Sci. USA, 108, 1016–1021, https://doi.org/10.1073/pnas.1014798108, 2011.
Kumar, R., Delle Monache, L., Bresch, J., Saide, P. E., Tang, Y., Liu, Z., da Silva, A. M., Alessandrini, S., Pfister, G., Edwards, D., Lee, P., and Djalalova, I.: Toward Improving Short-Term Predictions of Fine Particulate Matter Over the United States Via Assimilation of Satellite Aerosol Optical Depth Retrievals, J. Geophys. Res.-Atmos., 124, 2753–2773, 2019.
Kupc, A., Williamson, C., Wagner, N. L., Richardson, M., and Brock, C. A.: Modification, calibration, and performance of the Ultra-High Sensitivity Aerosol Spectrometer for particle size distribution and volatility measurements during the Atmospheric Tomography Mission (ATom) airborne campaign, Atmos. Meas. Tech., 11, 369–383, https://doi.org/10.5194/amt-11-369-2018, 2018.
Kuwata, M., Zorn, S. R., and Martin, S. T.: Using Elemental Ratios to Predict the Density of Organic Material Composed of Carbon, Hydrogen, and Oxygen, Environ. Sci. Technol., 46, 787–794, https://doi.org/10.1021/es202525q, 2012.
Lamb, K. D., Perring, A. E., Samset, B., Peterson, D., Davis, S., Anderson, B. E., Beyersdorf, A., Blake, D. R., Campuzano-Jost, P., Corr, C. A., Diskin, G. S., Kondo, Y., Moteki, N., Nault, B. A., Oh, J., Park, M., Pusede, S. E., Simpson, I. J., Thornhill, K. L., Wisthaler, A., and Schwarz, J. P.: Estimating Source Region Influences on Black Carbon Abundance, Microphysics, and Radiative Effect Observed Over South Korea, J. Geophys. Res.-Atmos., 123, 13527–13548, https://doi.org/10.1029/2018jd029257, 2018.
Lee, H.-H., Bar-Or, R. Z., and Wang, C.: Biomass burning aerosols and the low-visibility events in Southeast Asia, Atmos. Chem. Phys., 17, 965–980, https://doi.org/10.5194/acp-17-965-2017, 2017.
Lee, J., Kim, J., Song, C. H., Ryu, J.-H., Ahn, Y.-H., and Song, C. K.: Algorithm for retrieval of aerosol optical properties over the ocean from the Geostationary Ocean Color Imager, Remote Sens. Environ., 114, 1077–1088, https://doi.org/10.1016/j.rse.2009.12.021, 2010.
Lee, S., Song, C. H., Park, R. S., Park, M. E., Han, K. M., Kim, J., Choi, M., Ghim, Y. S., and Woo, J.-H.: GIST-PM-Asia v1: development of a numerical system to improve particulate matter forecasts in South Korea using geostationary satellite-retrieved aerosol optical data over Northeast Asia, Geosci. Model Dev., 9, 17–39, https://doi.org/10.5194/gmd-9-17-2016, 2016.
Lennartson, E. M., Wang, J., Gu, J., Castro Garcia, L., Ge, C., Gao, M., Choi, M., Saide, P. E., Carmichael, G. R., Kim, J., and Janz, S. J.: Diurnal variation of aerosol optical depth and PM2.5 in South Korea: a synthesis from AERONET, satellite (GOCI), KORUS-AQ observation, and the WRF-Chem model, Atmos. Chem. Phys., 18, 15125–15144, https://doi.org/10.5194/acp-18-15125-2018, 2018.
Levin, E. J. T., Prenni, A. J., Palm, B. B., Day, D. A., Campuzano-Jost, P., Winkler, P. M., Kreidenweis, S. M., DeMott, P. J., Jimenez, J. L., and Smith, J. N.: Size-resolved aerosol composition and its link to hygroscopicity at a forested site in Colorado, Atmos. Chem. Phys., 14, 2657–2667, https://doi.org/10.5194/acp-14-2657-2014, 2014.
Liu, X., Huey, L. G., Yokelson, R. J., Selimovic, V., Simpson, I. J., Müller, M., Jimenez, J. L., Campuzano-Jost, P., Beyersdorf, A. J., Blake, D. R., Butterfield, Z., Choi, Y., Crounse, J. D., Day, D. A., Diskin, G. S., Dubey, M. K., Fortner, E., Hanisco, T. F., Hu, W., King, L. E., Kleinman, L., Meinardi, S., Mikoviny, T., Onasch, T. B., Palm, B. B., Peischl, J., Pollack, I. B., Ryerson, T. B., Sachse, G. W., Sedlacek, A. J., Shilling, J. E., Springston, S., St. Clair, J. M., Tanner, D. J., Teng, A. P., Wennberg, P. O., Wisthaler, A., and Wolfe, G. M.: Airborne measurements of western U.S. wildfire emissions: Comparison with prescribed burning and air quality implications, J. Geophys. Res.-Atmos., 122, 6108–6129, 2017.
Liu, Y., Paciorek, C. J., and Koutrakis, P.: Estimating Regional Spatial and Temporal Variability of PM2.5 Concentrations Using Satellite Data, Meteorology, and Land Use Information, Environ. Health Persp., 117, 887, https://doi.org/10.1289/ehp.0800123, 2009.
Lu, Z., Streets, D. G., Winijkul, E., Yan, F., Chen, Y., Bond, T. C., Feng, Y., Dubey, M. K., Liu, S., Pinto, J. P., and Carmichael, G. R.: Light Absorption Properties and Radiative Effects of Primary Organic Aerosol Emissions, Environ. Sci. Technol., 49, 4868–4877, https://doi.org/10.1021/acs.est.5b00211, 2015.
Mangold, A., De Backer, H., De Paepe, B., Dewitte, S., Chiapello, I., Derimian, Y., Kacenelenbogen, M., Léon, J.-F., Huneeus, N., Schulz, M., Ceburnis, D., O'Dowd, C., Flentje, H., Kinne, S., Benedetti, A., Morcrette, J.-J., and Boucher, O.: Aerosol analysis and forecast in the European Centre for Medium-Range Weather Forecasts Integrated Forecast System: 3. Evaluation by means of case studies, J. Geophys. Res.-Atmos., 116, D03302, https://doi.org/10.1029/2010jd014864, 2011.
Mätzler, C.: MATLAB functions for Mie scattering and absorption, version 2, IAP Res. Rep, 8, 9, 2002.
McNaughton, C. S., Clarke, A. D., Howell, S. G., Pinkerton, M., Anderson, B., Thornhill, L., Hudgins, C., Winstead, E., Dibb, J. E., Scheuer, E., and Maring, H.: Results from the DC-8 Inlet Characterization Experiment (DICE): Airborne Versus Surface Sampling of Mineral Dust and Sea Salt Aerosols, Aerosol Sci. Technol., 41, 136–159, https://doi.org/10.1080/02786820601118406, 2007.
Mei, F., Hayes, P. L., Ortega, A., Taylor, J. W., Allan, J. D., Gilman, J., Kuster, W., de Gouw, J., Jimenez, J. L., and Wang, J.: Droplet activation properties of organic aerosols observed at an urban site during CalNex-LA, J. Geophys. Res.-Atmos., 118, 2903–2917, https://doi.org/10.1002/jgrd.50285, 2013.
Moise, T., Flores, J. M., and Rudich, Y.: Optical Properties of Secondary Organic Aerosols and Their Changes by Chemical Processes, Chem. Rev., 115, 4400–4439, https://doi.org/10.1021/cr5005259, 2015.
Myhre, G., Samset, B. H., Schulz, M., Balkanski, Y., Bauer, S., Berntsen, T. K., Bian, H., Bellouin, N., Chin, M., Diehl, T., Easter, R. C., Feichter, J., Ghan, S. J., Hauglustaine, D., Iversen, T., Kinne, S., Kirkevåg, A., Lamarque, J.-F., Lin, G., Liu, X., Lund, M. T., Luo, G., Ma, X., van Noije, T., Penner, J. E., Rasch, P. J., Ruiz, A., Seland, Ø., Skeie, R. B., Stier, P., Takemura, T., Tsigaridis, K., Wang, P., Wang, Z., Xu, L., Yu, H., Yu, F., Yoon, J.-H., Zhang, K., Zhang, H., and Zhou, C.: Radiative forcing of the direct aerosol effect from AeroCom Phase II simulations, Atmos. Chem. Phys., 13, 1853–1877, https://doi.org/10.5194/acp-13-1853-2013, 2013.
NASA: AERONET homepage, available at: https://aeronet.gsfc.nasa.go, last access: 1 April 2020.
Nault, B. A., Campuzano-Jost, P., Day, D. A., Schroder, J. C., Anderson, B., Beyersdorf, A. J., Blake, D. R., Brune, W. H., Choi, Y., Corr, C. A., de Gouw, J. A., Dibb, J., DiGangi, J. P., Diskin, G. S., Fried, A., Huey, L. G., Kim, M. J., Knote, C. J., Lamb, K. D., Lee, T., Park, T., Pusede, S. E., Scheuer, E., Thornhill, K. L., Woo, J.-H., and Jimenez, J. L.: Secondary organic aerosol production from local emissions dominates the organic aerosol budget over Seoul, South Korea, during KORUS-AQ, Atmos. Chem. Phys., 18, 17769–17800, https://doi.org/10.5194/acp-18-17769-2018, 2018.
NCEP: NCEP Global Forecast System (GFS) Analyses and Forecasts, Research Data Archive at the National Center for Atmospheric Research, Computational and Information Systems Laboratory, Boulder, Colo., https://doi.org/10.5065/D65Q4TSG, 2007.
Palacios-Peña, L., Jiménez-Guerrero, P., Baró, R., Balzarini, A., Bianconi, R., Curci, G., Landi, T. C., Pirovano, G., Prank, M., Riccio, A., Tuccella, P., and Galmarini, S.: Aerosol optical properties over Europe: an evaluation of the AQMEII Phase 3 simulations against satellite observations, Atmos. Chem. Phys., 19, 2965–2990, https://doi.org/10.5194/acp-19-2965-2019, 2019.
Peterson, D. A., Hyer, E. J., Han, S.-O., Crawford, J. H., Park, R. J., Holz, R., Kuehn, R. E., Eloranta, E., and Lefer, B. L.: Meteorology Influencing Springtime Air Quality, Pollution Transport, and Visibility in Korea, Elem. Sci. Anth., 7, 57, https://doi.org/10.1525/elementa.395, 2019.
Petters, M. D. and Kreidenweis, S. M.: A single parameter representation of hygroscopic growth and cloud condensation nucleus activity, Atmos. Chem. Phys., 7, 1961–1971, https://doi.org/10.5194/acp-7-1961-2007, 2007.
Pfister, G. G., Walters, S., Lamarque, J. F., Fast, J., Barth, M. C., Wong, J., Done, J., Holland, G., and Bruyère, C. L.: Projections of future summertime ozone over the U.S, J. Geophys. Res.-Atmos., 119, 5559–5582, https://doi.org/10.1002/2013jd020932, 2014.
Podolske, J. R., Sachse, G. W., and Diskin, G. S.: Calibration and data retrieval algorithms for the NASA Langley/Ames Diode Laser Hygrometer for the NASA Transport and Chemical Evolution Over the Pacific (TRACE-P) mission, J. Geophys. Res.-Atmos., 108, 8792, https://doi.org/10.1029/2002jd003156, 2003.
Reddington, C. L., Spracklen, D. V., Artaxo, P., Ridley, D. A., Rizzo, L. V., and Arana, A.: Analysis of particulate emissions from tropical biomass burning using a global aerosol model and long-term surface observations, Atmos. Chem. Phys., 16, 11083–11106, https://doi.org/10.5194/acp-16-11083-2016, 2016.
Reddington, C. L., Morgan, W. T., Darbyshire, E., Brito, J., Coe, H., Artaxo, P., Scott, C. E., Marsham, J., and Spracklen, D. V.: Biomass burning aerosol over the Amazon: analysis of aircraft, surface and satellite observations using a global aerosol model, Atmos. Chem. Phys., 19, 9125–9152, https://doi.org/10.5194/acp-19-9125-2019, 2019.
Saide, P. E., Carmichael, G. R., Liu, Z., Schwartz, C. S., Lin, H. C., da Silva, A. M., and Hyer, E.: Aerosol optical depth assimilation for a size-resolved sectional model: impacts of observationally constrained, multi-wavelength and fine mode retrievals on regional scale analyses and forecasts, Atmos. Chem. Phys., 13, 10425–10444, https://doi.org/10.5194/acp-13-10425-2013, 2013.
Saide, P. E., Kim, J., Song, C. H., Choi, M., Cheng, Y., and Carmichael, G. R.: Assimilation of next generation geostationary aerosol optical depth retrievals to improve air quality simulations, Geophys. Res. Lett., 41, 2014GL062089, https://doi.org/10.1002/2014gl062089, 2014.
Schroedter-Homscheidt, M., Oumbe, A., Benedetti, A., and Morcrette, J.-J.: Aerosols for Concentrating Solar Electricity Production Forecasts: Requirement Quantification and ECMWF/MACC Aerosol Forecast Assessment, B. Am. Meteorol. Soc., 94, 903–914, https://doi.org/10.1175/BAMS-D-11-00259.1, 2013.
Seinfeld, J. H. and Pandis, S. N.: Atmospheric chemistry and physics: from air pollution to climate change, John Wiley & Sons, 2016.
Shah, V., Jaeglé, L., Jimenez, J. L., Schroder, J. C., Campuzano-Jost, P., Campos, T. L., Reeves, J. M., Stell, M., Brown, S. S., Lee, B. H., Lopez-Hilfiker, F. D., and Thornton, J. A.: Widespread Pollution From Secondary Sources of Organic Aerosols During Winter in the Northeastern United States, Geophys. Res. Lett., 46, 2974–2983, https://doi.org/10.1029/2018gl081530, 2019.
Shingler, T., Crosbie, E., Ortega, A., Shiraiwa, M., Zuend, A., Beyersdorf, A., Ziemba, L., Anderson, B., Thornhill, L., Perring, A. E., Schwarz, J. P., Campazano-Jost, P., Day, D. A., Jimenez, J. L., Hair, J. W., Mikoviny, T., Wisthaler, A., and Sorooshian, A.: Airborne characterization of subsaturated aerosol hygroscopicity and dry refractive index from the surface to 6.5 km during the SEAC4RS campaign, J. Geophys. Res.-Atmos., 121, 4188–4210, https://doi.org/10.1002/2015jd024498, 2016.
Shrivastava, M., Fast, J., Easter, R., Gustafson Jr., W. I., Zaveri, R. A., Jimenez, J. L., Saide, P., and Hodzic, A.: Modeling organic aerosols in a megacity: comparison of simple and complex representations of the volatility basis set approach, Atmos. Chem. Phys., 11, 6639–6662, https://doi.org/10.5194/acp-11-6639-2011, 2011.
Shrivastava, M., Berg, L. K., Fast, J. D., Easter, R. C., Laskin, A., Chapman, E. G., Gustafson, W. I., Liu, Y., and Berkowitz, C. M.: Modeling aerosols and their interactions with shallow cumuli during the 2007 CHAPS field study, J. Geophys. Res.-Atmos., 118, 1343–1360, https://doi.org/10.1029/2012jd018218, 2013.
Skamarock, W. C., Klemp, J. B., Dudhia, J., Gill, D. O., Barker, D. M., Duda, M. G., Huang, X.-Y., Wang, W., and Powers, J. G.: A description of the Advanced Research WRF version 3, NCAR Tech. Note NCAR/TN-475+ STR, 2008.
Song, S., Gao, M., Xu, W., Shao, J., Shi, G., Wang, S., Wang, Y., Sun, Y., and McElroy, M. B.: Fine-particle pH for Beijing winter haze as inferred from different thermodynamic equilibrium models, Atmos. Chem. Phys., 18, 7423–7438, https://doi.org/10.5194/acp-18-7423-2018, 2018.
Stier, P., Schutgens, N. A. J., Bellouin, N., Bian, H., Boucher, O., Chin, M., Ghan, S., Huneeus, N., Kinne, S., Lin, G., Ma, X., Myhre, G., Penner, J. E., Randles, C. A., Samset, B., Schulz, M., Takemura, T., Yu, F., Yu, H., and Zhou, C.: Host model uncertainties in aerosol radiative forcing estimates: results from the AeroCom Prescribed intercomparison study, Atmos. Chem. Phys., 13, 3245–3270, https://doi.org/10.5194/acp-13-3245-2013, 2013.
Tang, H., Zhao, L., Sun, W., Hu, Y., Ji, X., Han, H., and Guan, Q.: Extraction of rubidium from respirable sintering dust, Hydrometallurgy, 175, 144–149, https://doi.org/10.1016/j.hydromet.2017.11.003, 2018.
Tang, I. N.: Chemical and size effects of hygroscopic aerosols on light scattering coefficients, J. Geophys. Res.-Atmos., 101, 19245–19250, https://doi.org/10.1029/96jd03003, 1996.
Tuccella, P., Curci, G., Grell, G. A., Visconti, G., Crumeyrolle, S., Schwarzenboeck, A., and Mensah, A. A.: A new chemistry option in WRF-Chem v. 3.4 for the simulation of direct and indirect aerosol effects using VBS: evaluation against IMPACT-EUCAARI data, Geosci. Model Dev., 8, 2749–2776, https://doi.org/10.5194/gmd-8-2749-2015, 2015.
van Donkelaar, A., Martin, R. V., Brauer, M., Hsu, N. C., Kahn, R. A., Levy, R. C., Lyapustin, A., Sayer, A. M., and Winker, D. M.: Global Estimates of Fine Particulate Matter using a Combined Geophysical-Statistical Method with Information from Satellites, Models, and Monitors, Environ. Sci. Technol., 50, 3762–3772, https://doi.org/10.1021/acs.est.5b05833, 2016.
Wang, J., Cubison, M. J., Aiken, A. C., Jimenez, J. L., and Collins, D. R.: The importance of aerosol mixing state and size-resolved composition on CCN concentration and the variation of the importance with atmospheric aging of aerosols, Atmos. Chem. Phys., 10, 7267–7283, https://doi.org/10.5194/acp-10-7267-2010, 2010.
Winijkul, E., Yan, F., Lu, Z., Streets, D. G., Bond, T. C., and Zhao, Y.: Size-resolved global emission inventory of primary particulate matter from energy-related combustion sources, Atmos. Environ., 107, 137–147, https://doi.org/10.1016/j.atmosenv.2015.02.037, 2015.
Zaveri, R. A. and Peters, L. K.: A new lumped structure photochemical mechanism for large-scale applications, J. Geophys. Res., 104, 30387–30415, 1999.
Zaveri, R. A., Easter, R. C., Fast, J. D., and Peters, L. K.: Model for simulating aerosol interactions and chemistry (MOSAIC), J. Geophys. Res, 113, D13204, https://doi.org/10.1029/2007JD008782, 2008.
Zhang, X., Turpin, B. J., McMurry, P. H., Hering, S. V., and Stolzenburg, M. R.: Mie Theory Evaluation of Species Contributions to 1990 Wintertime Visibility Reduction in the Grand Canyon, Air Waste, 44, 153–162, https://doi.org/10.1080/1073161X.1994.10467244, 1994.
Zhao, C., Liu, X., Leung, L. R., Johnson, B., McFarlane, S. A., Gustafson Jr., W. I., Fast, J. D., and Easter, R.: The spatial distribution of mineral dust and its shortwave radiative forcing over North Africa: modeling sensitivities to dust emissions and aerosol size treatments, Atmos. Chem. Phys., 10, 8821–8838, https://doi.org/10.5194/acp-10-8821-2010, 2010.
Zieger, P., Fierz-Schmidhauser, R., Weingartner, E., and Baltensperger, U.: Effects of relative humidity on aerosol light scattering: results from different European sites, Atmos. Chem. Phys., 13, 10609–10631, https://doi.org/10.5194/acp-13-10609-2013, 2013.
Zieger, P., Väisänen, O., Corbin, J. C., Partridge, D. G., Bastelberger, S., Mousavi-Fard, M., Rosati, B., Gysel, M., Krieger, U. K., Leck, C., Nenes, A., Riipinen, I., Virtanen, A., and Salter, M. E.: Revising the hygroscopicity of inorganic sea salt particles, Nat. Commun., 8, 15883, https://doi.org/10.1038/ncomms15883, 2017.
Ziemba, L. D., Lee Thornhill, K., Ferrare, R., Barrick, J., Beyersdorf, A. J., Chen, G., Crumeyrolle, S. N., Hair, J., Hostetler, C., Hudgins, C., Obland, M., Rogers, R., Scarino, A. J., Winstead, E. L., and Anderson, B. E.: Airborne observations of aerosol extinction by in situ and remote-sensing techniques: Evaluation of particle hygroscopicity, Geophys. Res. Lett., 40, 417–422, https://doi.org/10.1029/2012gl054428, 2013.