the Creative Commons Attribution 4.0 License.
the Creative Commons Attribution 4.0 License.
 | 05 Jun 2020
Rapid reduction in black carbon emissions from China: evidence from 2009–2019 observations on Fukue Island, Japan
Kazuyo Yamaji
Takuma Miyakawa
Fumikazu Taketani
Chunmao Zhu
Yongjoo Choi
Yuichi Komazaki
Kohei Ikeda
Yutaka Kondo
Zbigniew Klimont
A long-term, robust observational record of atmospheric black carbon (BC) concentrations at Fukue Island for 2009–2019 was produced by unifying the data from a continuous soot monitoring system (COSMOS) and a Multi-Angle Absorption Photometer (MAAP). This record was then used to analyze emission trends from China. We identified a rapid reduction in BC concentrations of () % yr−1 or −48 % from 2010 to 2018. We concluded that an emission change of () % yr−1, related to changes in China of as much as −4.6 % yr−1, was the main underlying driver. This evaluation was made after correcting for the interannual meteorological variability (IAV) by using the regional atmospheric chemistry model simulations from the Weather Research and Forecasting (WRF) and Community Multiscale Air Quality (CMAQ) models (collectively WRF/CMAQ) with the constant emissions. This resolves the current fundamental disagreements about the sign of the BC emissions trend from China over the past decade as assessed from bottom-up emission inventories. Our analysis supports inventories reflecting the governmental clean air actions after 2010 (e.g., MEIC1.3, ECLIPSE versions 5a and 6b, and the Regional Emission inventory in ASia (REAS) version 3.1) and recommends revisions to those that do not (e.g., Community Emissions Data System – CEDS). Our estimated emission trends were fairly uniform across seasons but diverse among air mass origins. Stronger BC reductions, accompanied by a reduction in carbon monoxide (CO) emissions, occurred in regions of south-central East China, while weaker BC reductions occurred in north-central East China and northeastern China. Prior to 2017, the BC and CO emissions trends were both unexpectedly positive in northeastern China during winter months, which possibly influenced the climate at higher latitudes. The pace of the estimated emissions reduction over China surpasses the Shared Socioeconomic Pathways (SSPs with reference to SSP1, specifically) scenarios for 2015–2030, which suggests highly successful emission control policies. At Fukue Island, the BC fraction of fine particulate matter (PM2.5) also steadily decreased over the last decade. This suggests that reductions in BC emissions started without significant delay when compared to other pollutants such as NOx and SO2, which are among the key precursors of scattering PM2.5.
- Article
(5403 KB) - Full-text XML
-
Supplement
(2416 KB) - BibTeX
- EndNote


Atmospheric particles containing black carbon (BC) strongly absorb sunlight and reduce the surface albedo of ice and/or snow upon their deposition. Hence, the high BC emissions and atmospheric concentration levels in the present, when compared to those of preindustrial times, have contributed to global warming (IPCC, 2013). The major sources of BC are either anthropogenic fuel combustion or natural fires. Following its rapid economic growth after 2000, China became the nation with the highest anthropogenic emissions rate of BC, which exceeds 1 Tg yr−1 and corresponds to ∼30 % of the world's total emissions (Bond et al., 2004; Zhang et al., 2009; Lamarque et al., 2010; Granier et al., 2011; Klimont et al., 2017; Li et al., 2017; Crippa et al., 2018). Therefore, China's emission trend is of major concern with respect to global air quality and climate change. However, fundamental disagreement remains among bottom-up emission inventories regarding the sign of the emissions trend – especially during 2005 and 2014, which represents the modern reference period for the Coupled Model Intercomparison Project Phase 6 (CMIP6) experiments. This is in sharp contrast to our understanding of the SO2 and NOx emissions trends from China (e.g., Zheng et al., 2018) for which studies have reached fairly consistent conclusions. It may be that the reductions in the atmospheric concentration levels that have been observed with satellites since 2008 or 2011 (Li et al., 2010; Krotkov et al., 2016) can be attributed to an emissions reduction after the effects of the meteorological variations and loss-rate variability have been considered (e.g., Miyazaki et al., 2017). Here, the major difference between BC, SO2, and NOx is the unavailability of satellite observations that provide long-term regional-scale information. Moreover, reliable long-term mass concentration measurements at regionally representative ground-based sites that are useful for an emissions trend analysis are scarce for BC. In the US and Europe, harmonized ground-based observations of BC (Murphy et al., 2011; Chen et al., 2012; Zanatta et al., 2016; Kutzner et al., 2018) are available and are used for the estimation of emissions (e.g., Evangeliou et al., 2018). In Asia, Zhang et al. (2019) reported long-term trends in BC mass concentrations from China's BC observational NETwork (CBNET). CBNET covers urban and remote sites and measured BC from 2006 to 2017 by using aethalometers. Zhang et al. (2019) found that most of the stations had decreasing trends, which ranged from 1.1 % yr−1 to 16.6 % yr−1. However, there are issues with the interpretation of the data from aethalometers because of potential artifacts from coexisting scattering particles (Collaud Coen et al., 2010; Virkkula et al., 2007; Saturno et al., 2017).
In this context, long-term observations, which are based on reliable instruments with careful calibration, are desired to determine the BC emissions trends in China. We have been conducting such observations of BC and related species at Fukue Island since 2009 (Kanaya et al., 2013, 2016; Miyakawa et al., 2017). This site receives air masses from various latitudinal bands in China during the winter monsoon (effective from autumn to spring) with negligible effects from local sources. It is unique that two instruments (a continuous soot monitoring system – COSMOS; a Multi-Angle Absorption Photometer – MAAP) are regularly operated in parallel, that their compatibility is assured, and that comparisons with other BC-measuring instruments have been successfully made on-site (i.e., with a Single Particle Soot Photometer (SP2) and an elemental carbon and organic carbon (ECOC) analyzer; Miyakawa et al., 2017; Kanaya et al., 2013). Since the major source region is located some distance (ca. 700–1000 km) from Fukue Island, the variability in the wet loss term during transport could be of concern. Nonetheless, previous analyses suggest that the accumulated precipitation along a trajectory (APT) is a useful index that can be used to characterize the strength of the wet deposition (Oshima et al., 2012; Kondo et al., 2016; Kanaya et al., 2016). Therefore, emission-specific characterization is possible when data with a low APT (e.g., <1 mm for the previous 72 h) are analyzed. In this paper, on the basis of the previously established approach, we provide an emissions trend analysis of major Asian source regions, which focuses on China, by using the observation record of BC mass concentrations at Fukue Island for 2009–2019 (Sect. 3.1). The emissions trend was analyzed after removing the potential effects of the changes related to atmospheric transport (Sect. 3.2). The analysis includes a discussion of how emission regions and seasonality affect the trend. In Sect. 3.3, we use this trend to evaluate the bottom-up emission inventories of China for the past decade, as well as for the future Shared Socioeconomic Pathway (SSP) scenarios. Furthermore, in Sect. 3.4, this same analysis was applied to the emissions trend of carbon monoxide (CO), which acts as a tracer for incomplete combustion so that the balance between the BC and CO changes can be studied, and the temporal evolution of the emissions structure can be characterized. Finally, in Sect. 3.5, the decreasing trend in the BC fraction of fine particulate matter (PM2.5) mass concentrations at Fukue Island is evaluated, which shows that the BC reduction has started without a significant delay to the reductions of NOx and SO2, which are precursors of scattering or cooling aerosol particles.
The Fukue Atmospheric Environment Observatory (32.75∘ N, 128.68∘ E) is located on Fukue Island (western Japan) in the East China Sea at an elevation of 75 m above sea level (a.s.l.; Fig. 1). The main township on Fukue Island is located in its southeastern part, which ensures that the observatory in the northwest is free from the interference of local emission sources. Past observations at this site have shown that the regional-scale characterizations of eastern Asian air pollution are tenable (Takami et al., 2005; Ikeda et al., 2014; Kanaya et al., 2016; Miyakawa et al., 2017).
Two filter-based BC-measuring instruments were regularly operated in parallel from April 2009 to May 2019 at this site. One is a continuous soot monitoring system (COSMOS) called the Black Carbon Monitor (BCM, model 3130; Kanomax Japan, Inc., Osaka, Japan), and the other is a Multi-Angle Absorption Photometer (MAAP, model 5012; Thermo Fisher Scientific, Waltham, Massachusetts, USA). They are qualified in such a way that the effects of coexisting scattering particles are minimized in BC observations. For the COSMOS, a preheater maintained at a temperature of 300 ∘C removed the major nonrefractory fraction of scattering particles, and thus the temporal change in the filter transmittance related to BC was measured unambiguously. In addition, high-frequency measurements of the transmittance (at 1 kHz) enabled the precise determination of this change (Miyazaki et al., 2008; Kondo et al., 2009, 2011a). For the MAAP, measurements of reflectance at two angles, in addition to transmittance, were made with respect to the particle-laden filter, and the built-in algorithm for radiative transfer enabled the separation of scattering from absorption (Petzold and Schönlinner, 2004). We demonstrated that the two instruments had a high level of agreement and compatibility at Fukue Island once the mass absorption cross section for the MAAP was modified from manufacturer's recommendation of (6.6) to 10.3 m2 g−1 (Kanaya et al., 2013, 2016). The filter-based observations were also successfully compared to an ECOC analyzer (Sunset Laboratory Inc., Tigard, Oregon, USA) in which BC was calibrated as CO2 after combustion and to a Single Particle Soot Photometer (SP2; Droplet Measurement Technologies, Longmont, Colorado, USA) in which Alfa Aesar™ Fullerene soot (Fisher Scientific, part of Thermo Fisher Scientific, Leicestershire, England) particles with a known mass were used as a calibration standard (Miyakawa et al., 2017). The COSMOS and MAAP had a common inlet equipped with a PM1 size-cut cyclone (PM2.5 before 17 September 2011). Ohata et al. (2019), and the references therein, showed that the average accuracy of the COSMOS was estimated as ∼10 % in various field environments in the Arctic and in eastern Asia. In this paper, the data records from the two instruments were “unified” to minimize the gaps related to the failure of the individual instruments. The gap periods were 9673 and 10 974 h (11 % and 12 %) for COSMOS and MAAP, respectively. An arithmetic mean was used to unify these data. When the data from only one of the instruments were valid, then the data from the other instrument were estimated by using a regression based on the nearest month for which the data from both instruments were available. Close agreement between the hourly data from the two instruments during the whole period was demonstrated in time series plots (Fig. S1 in the Supplement) and a scatterplot (Fig. S2). From the average and a standard deviation of the monthly MAAP–COSMOS ratios, the systematic and random uncertainties were estimated as ±14 % and ±17 %, respectively (±22 % in total).
The atmospheric CO mixing ratios and PM2.5 mass concentrations were observed with a nondispersive infrared sensor (model 48C; Thermo Fisher Scientific, Waltham, Massachusetts, USA) and with a hybrid system (SHARP Synchronized Hybrid Ambient, Real-time Particulate Monitor, model 5030; Thermo Fisher Scientific, Waltham, Massachusetts, USA) based on nephelometry and β-ray absorption measurements (Kanaya et al., 2016). Their uncertainties were estimated to be 4 % and <14 %, respectively. Although CO measurements were initiated in 2010, the summertime data until June 2013 were unusable because of an artifact related to water vapor.
A backward trajectory analysis (NOAA HYSPLIT Trajectory Model; Stein et al., 2015) was used to identify the air mass origins and to extract hourly data with negligible influence from the wet deposition. A trajectory was drawn every hour for the coordinates of the observation site at an altitude of 500 m a.s.l. for the duration of 120 h. The Global Data Assimilation System with a resolution (GDAS1) with a resolution was the meteorological field used. Similar to Kanaya et al. (2016), six air mass origin regions (regions I–VI) were identified: northeastern (NE) China, north-central East China (N-CEC), south-central East China (S-CEC), southern (S) China, South Korea, and Japan from the first border to cross below 2500 m a.s.l. (Fig. 1). Some air masses, particularly those identified as being from South Korea, were influenced by other regions (e.g., N-CEC). To characterize the emissions from South Korea, we extracted air masses that had only passed over the South Korean region (Region V'). Similar extractions were made for Japan (Region VI') as some air masses had traversed the continent beforehand. Uncertainty in the region assignment was evaluated against trajectories based on the fifth generation ECMWF atmospheric reanalysis (ERA5) meteorological field with a finer horizontal resolution (30 km) during 2013–2015. While the assignment was in agreement for large fractions (83 %–93 %) on a country level (i.e., China, South Korea, and Japan), the fraction decreased to 57 %–67 % for the four individual Chinese regions due to cross talk with the adjacent regions. The APT was calculated as the accumulated precipitation along trajectories integrated over the last 72 h (mainly occurring over the sea) and used as an index of the wet deposition effect (e.g., Oshima et al., 2012). Our previous analysis suggested that, on average, a 15 mm APT halves the BC concentration observed on Fukue Island, which is based on decreases in the ΔBC∕ΔCO ratio with APT (Kanaya et al., 2016). In this study, air masses without significant influence from the wet deposition were extracted for analysis by using the criterion of an APT with less than 1 mm. The median ΔBC∕ΔCO ratio for the observational data with APT<1 mm (N=26 423) was only 1.9 % lower than data with APT=0 mm (N=18 907), which suggests an insignificant influence of the wet deposition.
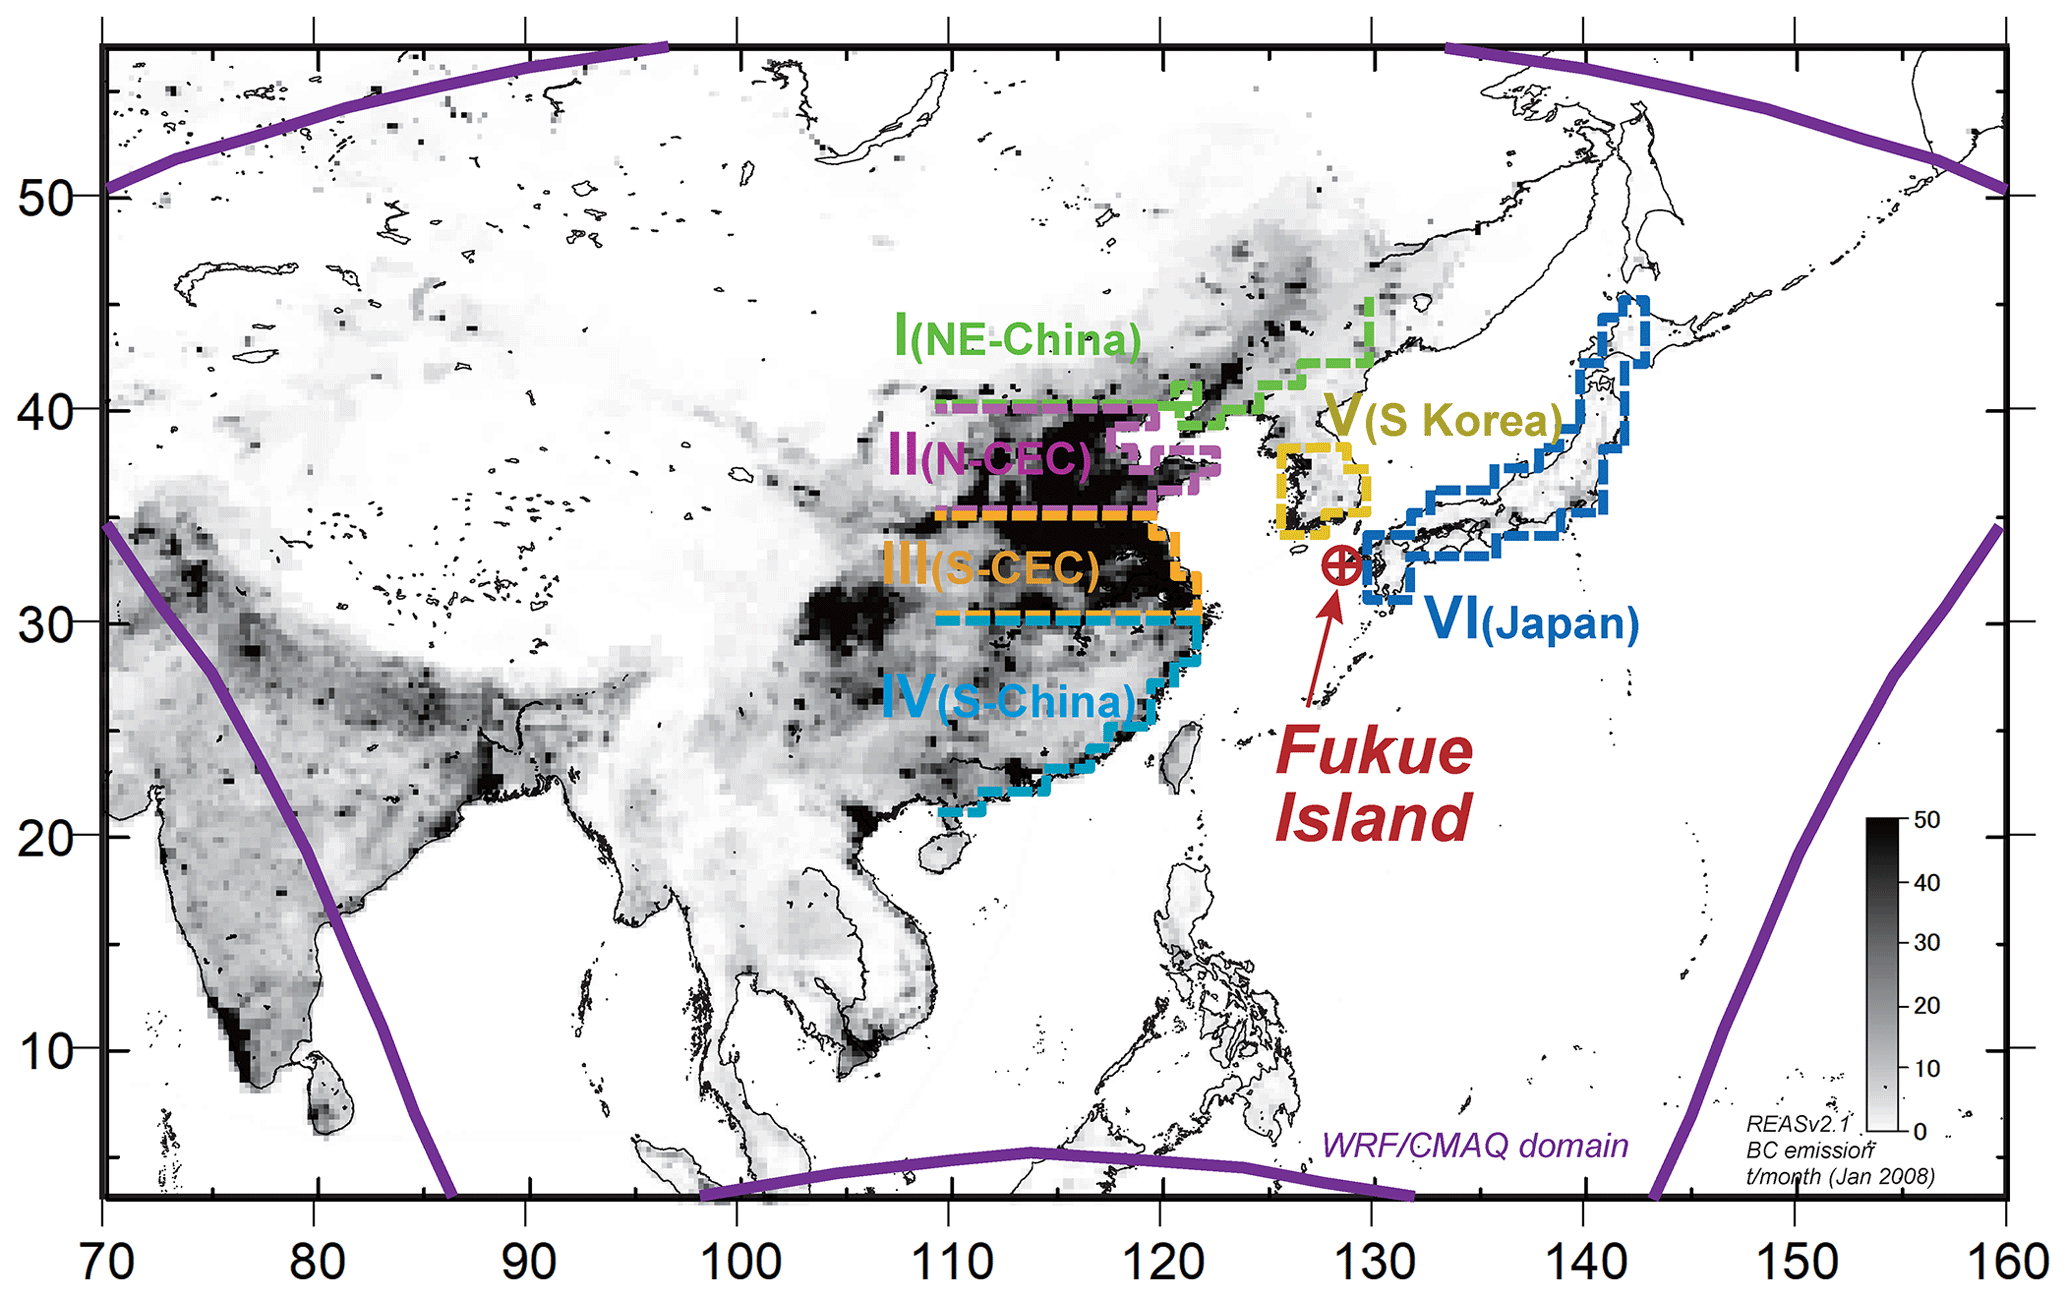
Figure 1Location of Fukue Island (red), model domain (purple), and regional classification of air mass origin areas (regions I–VI). The background scale is the black carbon (BC) emissions. NE China – northeastern China; N-CEC – north-central East China; S-CEC – south-central East China; and S China – southern China.
The Weather Research and Forecasting (WRF) coupled with the Community Multiscale Air Quality (CMAQ) model with constant emissions of BC and CO was used to characterize the effects of meteorology on, and particularly the transport efficiency to, Fukue Island. This WRF/CMAQ model included the effects of stagnation, dilution, and dispersion in both the horizontal and vertical directions. The details of the model setup have been described by Ikeda et al. (2014) and Yamaji et al. (2014). Briefly, the WRF model (version 3.3.1; Skamarock et al., 2008), based on the National Centers for Environmental Prediction (NCEP) Final (FNL) Operational Global Analysis data (ds083.2) originating from GDAS, was coupled to the CMAQ (version 4.7.1; Byun and Schere, 2006) to simulate regional-scale air pollution with a horizontal resolution of 80 km and 37 vertical layers. The domain of the model is depicted in Fig. 1. The superior performance of the WRF model for the study region was confirmed in three dimensions (Li et al., 2013). Figure S3 indicates that the model captured the observed features of the averaged monthly zonal and meridional wind speeds and their variability at 925 hPa. The fifth-generation CMAQ aerosol module (AERO5) was used for the BC simulation, while the Statewide Air Pollution Research Center version 99 (SAPRC-99) was used for air chemistry. Wet deposition was represented with the cloud_acm_ae5 module. Similar to the observational data, the modeled ΔBC∕ΔCO ratio decreased with APT, i.e., the modeled median ΔBC∕ΔCO ratio for data with APT<1 mm (N=26 737) was 3.7 % lower than data with APT=0 mm (N=19 197). The wet removal of BC in the model appeared stronger than in the observational trend (1.9 %), but the error introduced due to the wet deposition representation was estimated to be small (−2 %) when using the adopted criterion (APT<1 mm). The boundary concentrations were derived from the climatological means of the global chemical transport CHemical Atmospheric general circulation model for the Study of atmospheric Environment and Radiative forcing (CHASER; Sudo et al., 2002). The fixed anthropogenic emissions were taken from the monthly data of the Regional Emission inventory in ASia (REAS, version 2.1) with a resolution (Kurokawa et al., 2013) for 2008 (hereafter referred to as REAS2.1, 2008). We adopted the Global Fire Emissions Database (GFED; version 3.1) for the monthly emissions from biomass burning. Note that BC from natural fires in China was estimated to be only several percent of the anthropogenic emissions (Yin et al., 2019).
We estimated the model uncertainties from meteorology to be % by simulating the surface BC concentrations under conditions with negligible wet deposition and considering both the horizontal and vertical inhomogeneities in the model and the spread of multimodel simulations of CO over the East China Sea (Kong et al., 2020). The uncertainty was assumed to have been equally contributed by the systematic and random terms (±12 %).
The model simulations were performed from April 2009 to May 2019. Hourly outputs on a grid, including for the Fukue Island site, were used for the analysis. The observed and simulated hourly BC concentrations satisfying the low APT criterion (i.e., <1 mm for previous 72 h) were individually and annually averaged for all air masses or for individual air mass origin areas. Since the emission rates were interannually unchanged in the model simulations, the model results represented interannual variations (IAVs) in the meteorology. Therefore the only factor that the model failed to replicate in the observation, except for their uncertainties, was the emissions trend. The residual ratio of the observed-to-modeled BC mass concentrations for all or individual regions (and for a particular year, y) embodies the information of a correction factor for the emission rates with respect to REAS2.1(2008), i.e., E(y) / REAS2.1(2008). This factor can be used to bring the model into agreement with the observations by assuming that the interior geographical pattern of emissions for the individual regions are unchanged from 2008 to the study period. Here, the function connecting emissions to observations was regarded as linear because there were no known feedback processes linking the wet deposition to the source term (emissions). It should be noted that REAS2.1(2008) values were used as working references, and they were not necessarily the true values for 2008. The annual estimation of E(y) / REAS2.1(2008), and its trend analysis, was also done at a seasonal level. The bias from the true values in the emission inventory is most likely systematic, i.e., associated with systematic uncertainties in emission factors and/or activity data common in a country or its individual subregion. Therefore we aim for the correction of the systematic bias with the E(y) / REAS2.1(2008) ratio in this study. The geographical distribution pattern of BC emissions (Fig. 1) needs to be less uncertain; this condition is satisfied with REAS2.1, even though it is a relatively old emission inventory. This is inferred from the fact that the simulated BC mass concentrations using the emission inventory have more systematic bias than random discrepancies from observations, as shown in Sect. 3.2. Indeed, the geographical pattern of BC emissions is almost unchanged in more recent emission inventories. We will conclude this by removing the selection of the emission inventory that is not critical for the major results of this study about the emissions trend estimation.
3.1 Observed black carbon mass concentrations and trends
Monthly statistics for BC, CO, and PM2.5 mass concentrations or mixing ratios and their trends for 2009–2019 are shown in Fig. 2. In the case of BC, the whole 122 months were covered by unifying the data from the COSMOS and the MAAP. A long-term decreasing trend was apparent because the annual averages of BC mass concentrations decreased from 0.412 µg m−3 in 2010 to 0.214 µg m−3 in 2018, which represents a 48 % reduction. A seasonal trend with summer (June–July–August: JJA) minima was superimposed on this downward trend, and some increases were evident during early 2014. The cause of the summertime minima was the intrusion of clean air masses from the Pacific Ocean, as discussed previously (Kanaya et al., 2016). For both CO and PM2.5, clear decreasing trends were detected in which the annual averages decreased from 206.6 ppbv in 2014 to 164.9 ppbv in 2018 for CO and from 18.0 µg m−3 in 2010 to 14.2 µg m−3 in 2018 for PM2.5.
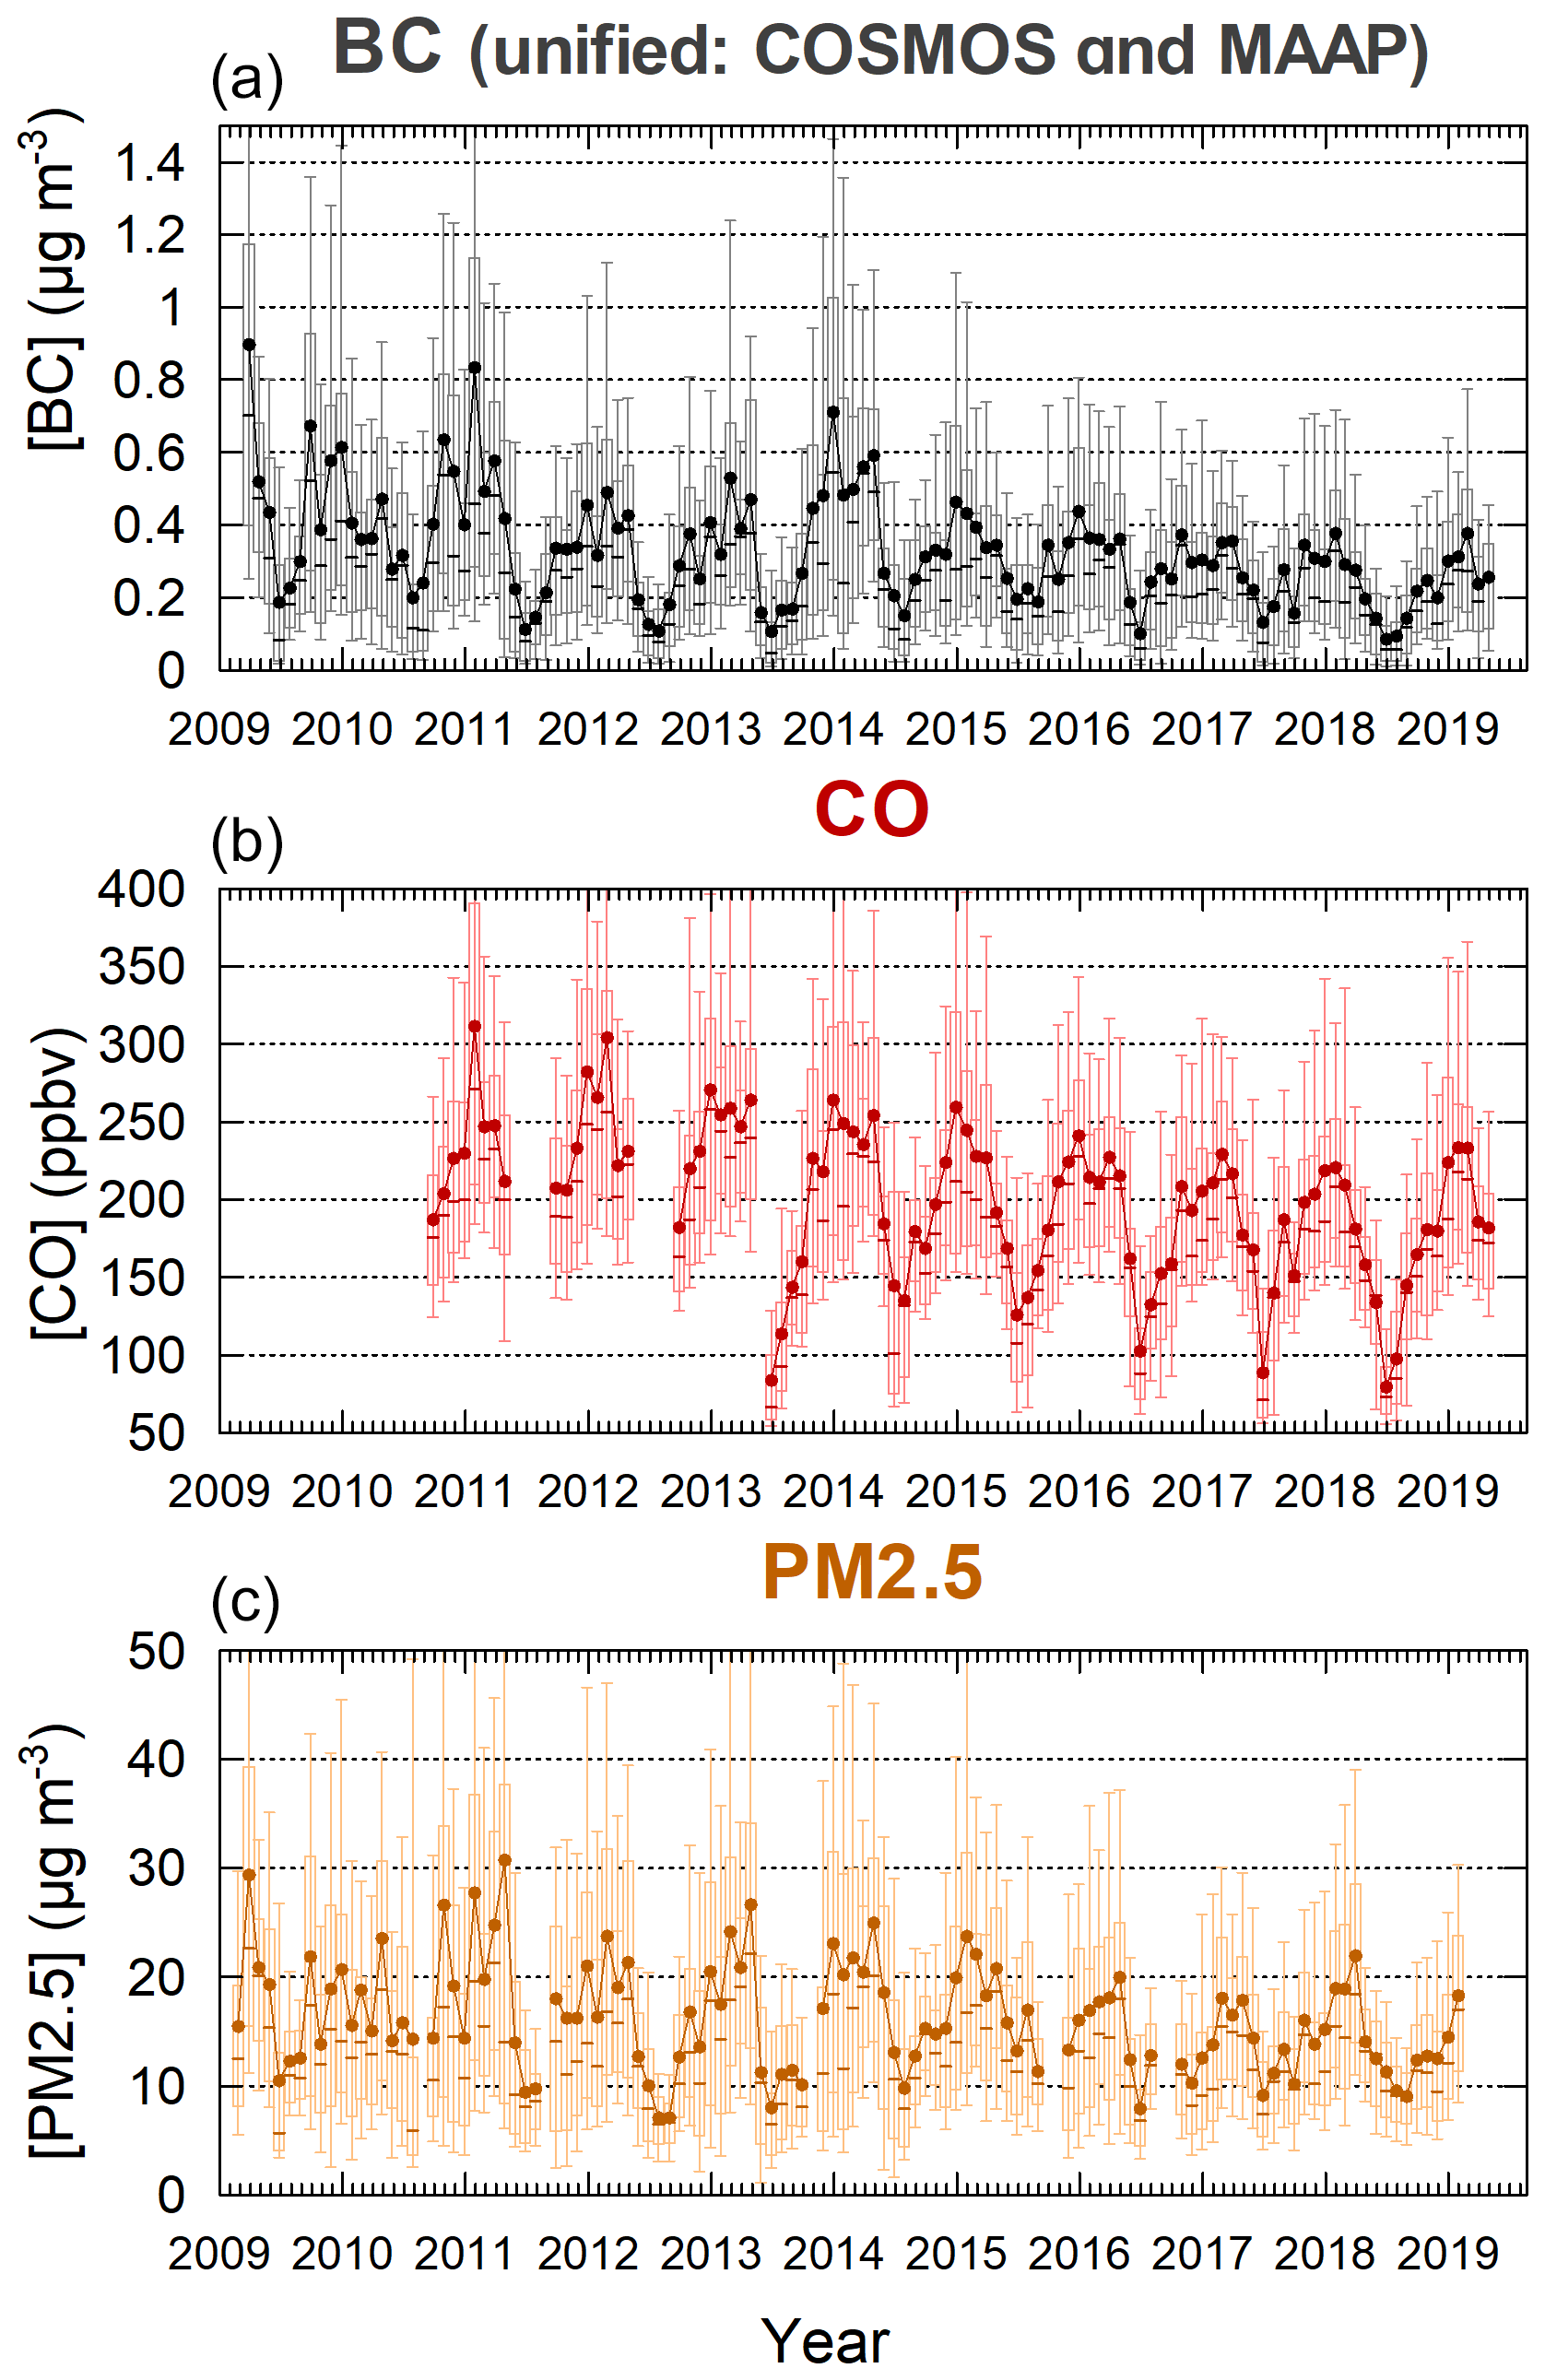
Figure 2Monthly statistics of concentrations or mixing ratios of black carbon (BC), CO, and fine particulate matter (PM2.5) at Fukue Island during 2009–2019. Average (dots), interquartile range (open box), range from the 10th to 90th percentile (error bars), and median (horizontal whiskers). BC measurements are from the continuous soot monitoring system (COSMOS) and a Multi-Angle Absorption Photometer (MAAP).
The trends in spring (March–April–May; MAM) are shown in Fig. 3 (plus signs indicate maxima; error bars indicate 90th and 10th percentiles; and boxes indicate 25th and 75th percentiles with median values shown as horizontal whiskers and averages as circles). Decreasing trends were evident for the high percentiles (75th and 90th) and for averages. The 3-year running means were also shown for the medians and the 90th and 10th percentiles (solid and broken gray lines) to smooth out the interannual variations (IAVs). Least square linear fittings were made for annual averages and showed negative slopes. For the unified BC data, the slope was ()(1σ) µg m−3 yr−1, which suggests that the negative slope was significant at a 3σ or higher confidence interval (P=0.0031). By dividing the slopes by the mean mass concentrations for all available data during the 2009–2019 period (0.421 µg m−3; Table 1), the relative springtime trends were evaluated as () % yr−1, which implies that the emission rates from important source regions have decreased. We will conclude by removing the effects of the meteorological variability that were quantified with model simulations in the following sections.
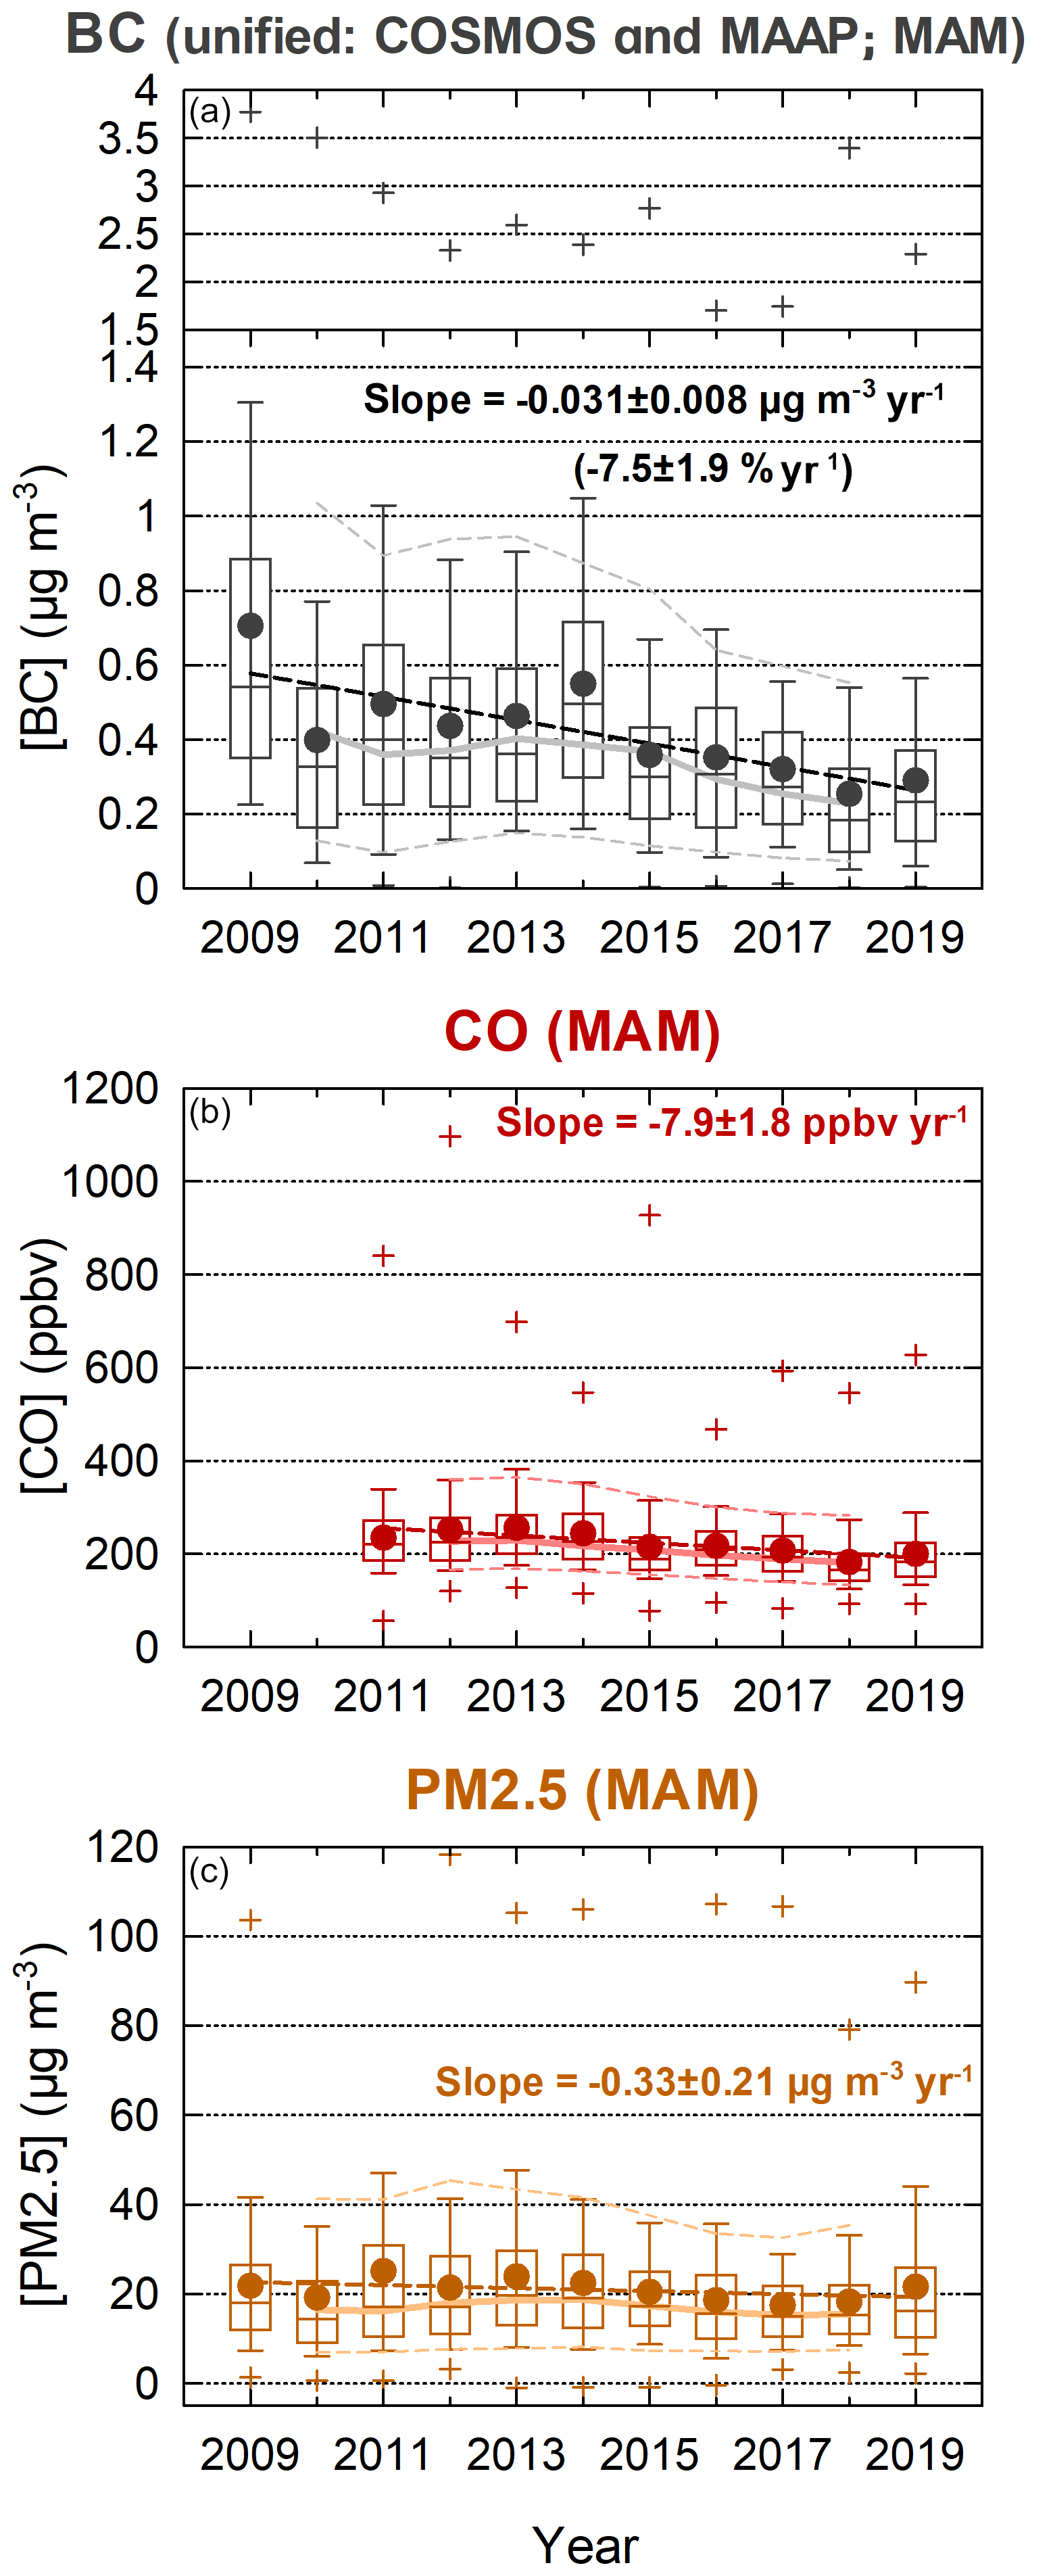
Figure 3Statistics of the observed black carbon (BC) mass concentrations, CO mixing ratio, and fine particulate matter (PM2.5) mass concentrations during spring (MAM) from 2009 to 2019. Averages (dots), interquartile range (open boxes), 10th to 90th range (error bars), medians (horizontal whiskers), and maximum and minimum hourly values (plus signs). The 3-year running means are from 2010 to 2018 for the medians, and the 10th and 90th percentiles are shown with connected solid and/or dotted lines. The regression lines for the 3-year running means for the averages are shown as broken lines. The BC measurements are from the continuous soot monitoring system (COSMOS) and a Multi-Angle Absorption Photometer (MAAP).
Table 1 summarizes the mean values and trends in the observed BC mass concentrations for all seasons and within each season. The percentage trends were derived by dividing the trend by the mean concentrations over the 2009–2019 period. The ranges of the percentage trends were negative for all cases (at 95 % confidence level, P≤0.016), which ranged from −5.8 % yr−1 to −7.5 % yr−1 except during summer. Up to this point, the observational data were not selected by using the APT criterion. If the trends are different for the subset of cases with APT <1 mm, then an influence from the variable wet deposition strength is implied. However, this hypothesis was not supported as the trends were indifferent. The subset of data with APT <1 mm had a range from −6.2 % yr−1 to −7.6 % yr−1 (P≤0.019 except during summer).
Table 1Observed trends in atmospheric black carbon (BC) mass concentrations at Fukue Island for 2009–2019 and showing cases with and without data filtering based on the accumulated precipitation along trajectory (APT) criterion for all seasons and in each season. The BC mass concentrations are those unified from a continuous soot monitoring system (COSMOS) and a Multi-Angle Absorption Photometer (MAAP).
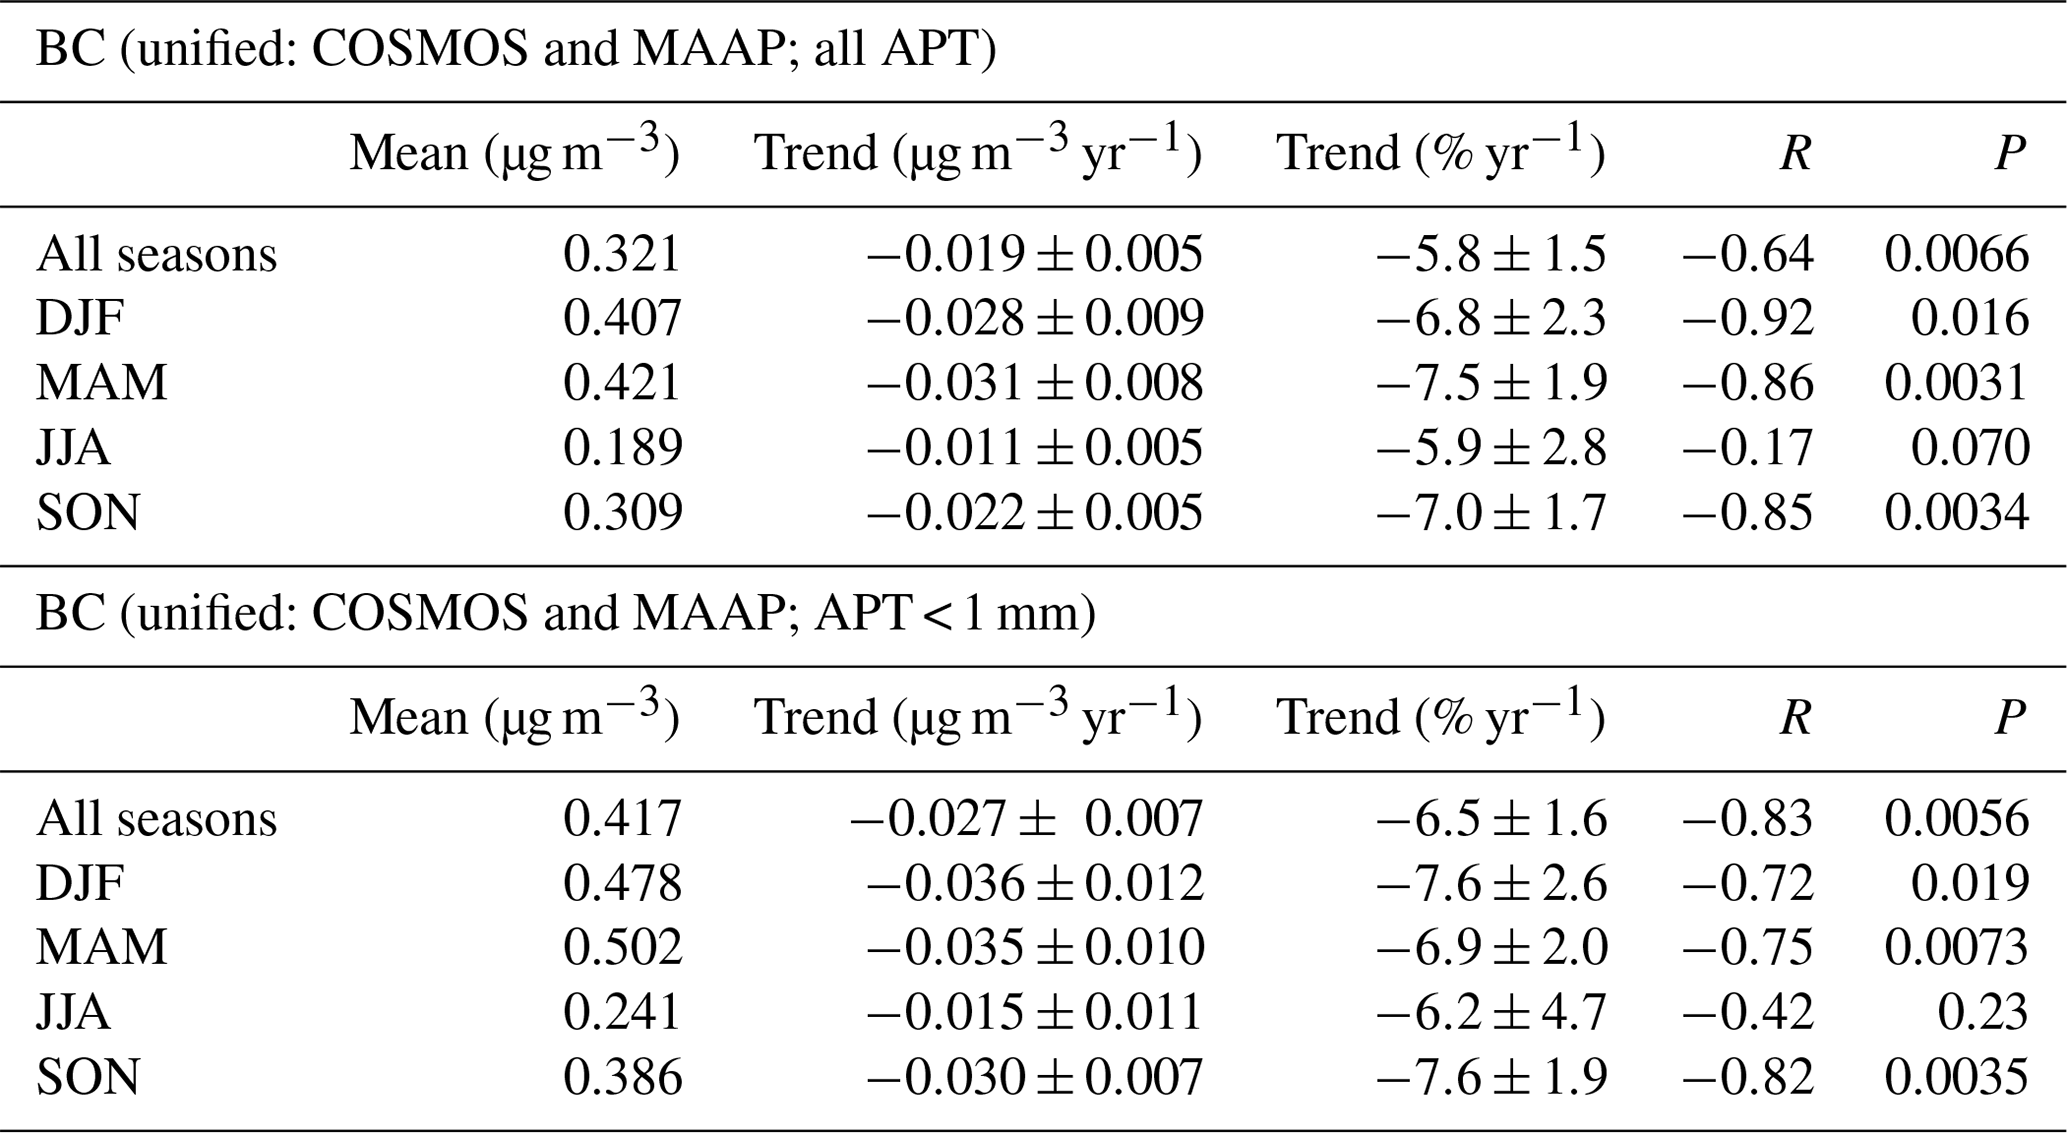
Winter – DJF; spring – MAM; summer – JJA; and autumn – SON.
Weak trends were recognized for APT (Fig. S4) for all seasons during 2009–2018 with a mean value of 7.4 mm and a trend of () mm yr−1 or () % yr−1 (P=0.31). When the precipitation amount was translated to the BC transport efficiency (TE) by using the previously established relationship of , where A1 = 0.109 and A2 = 0.684 (Kanaya et al., 2016), a +0.3 % yr−1 increase in BC mass concentrations could be expected because of the reduced amount of precipitation. Seasonally, the negative APT trend was significant in winter (December–January–February; DJF) and summer, which yields expected increases of +0.6 % yr−1 and +3.2 % yr−1, respectively, in BC mass concentrations. This may explain why negative trends were weaker for the observed BC levels for all APT values when compared to those for APT < 1 mm. However, the trend was opposite to and of smaller magnitude than the overall decreasing trend of −5.8 % yr−1, which suggests that the wet deposition was a minor contributing factor.
Changes in large-scale flow patterns could also be a potential contributor to this trend in the BC observations. However, this is unlikely, as the frequencies for various air mass origin areas were almost unchanged during the study period (Fig. S5). The dominant source regions for Fukue Island were identified as S-CEC and N-CEC for the periods of 2010–2013 and 2015–2018, respectively. These results were consistent with those of our previous study (Kanaya et al., 2016).
3.2 Estimating emission trends after the removal of meteorological effects
3.2.1 Model performance to capture short-term variations
The temporal variations in the observed and modeled BC and CO concentrations are shown in Fig. 4. These are based on March–April 2018 data from when the EMeRGe–Asia campaign was conducted and includes airborne observations from a German High Altitude and Long Range Research Aircraft (HALO) over eastern Asia. The gray and light magenta lines from the WRF/CMAQ model captured the elevated concentrations of BC and CO quite well, which demonstrates the high performance of the WRF/CMAQ and its ability to reproduce the phenomena of regional air pollution over eastern Asia. The air mass origins are superimposed on the figure according to backward trajectory modeling. The light blue vertical bands in Fig. 4a represent periods when APT was higher than 1 mm. In the periods without bands (i.e., APT < 1 mm), the concentration peaks are linked to the different regions as follows: Region V (South Korea) during 11–12 March 2018; Region II (N-CEC) during 24–26 March; Region III (S-CEC) during 27–28 March; Region VI (Japan) from 30 March to 2 April; and Region IV (S China) during 9–10 April. There is a tendency for BC concentrations to be overpredicted in the air masses from China and/or South Korea and underpredicted in those from Japan. CO concentrations were also underestimated for cases from China and/or South Korea. The observed-to-modeled mass concentration ratios were statistically analyzed to estimate the correction factors of the emissions rate – i.e., E(y) / REAS2.1(2008) – and its trend. In the plots for the whole study period (Fig. S1), a similar performance of the WRF/CMAQ is demonstrated.
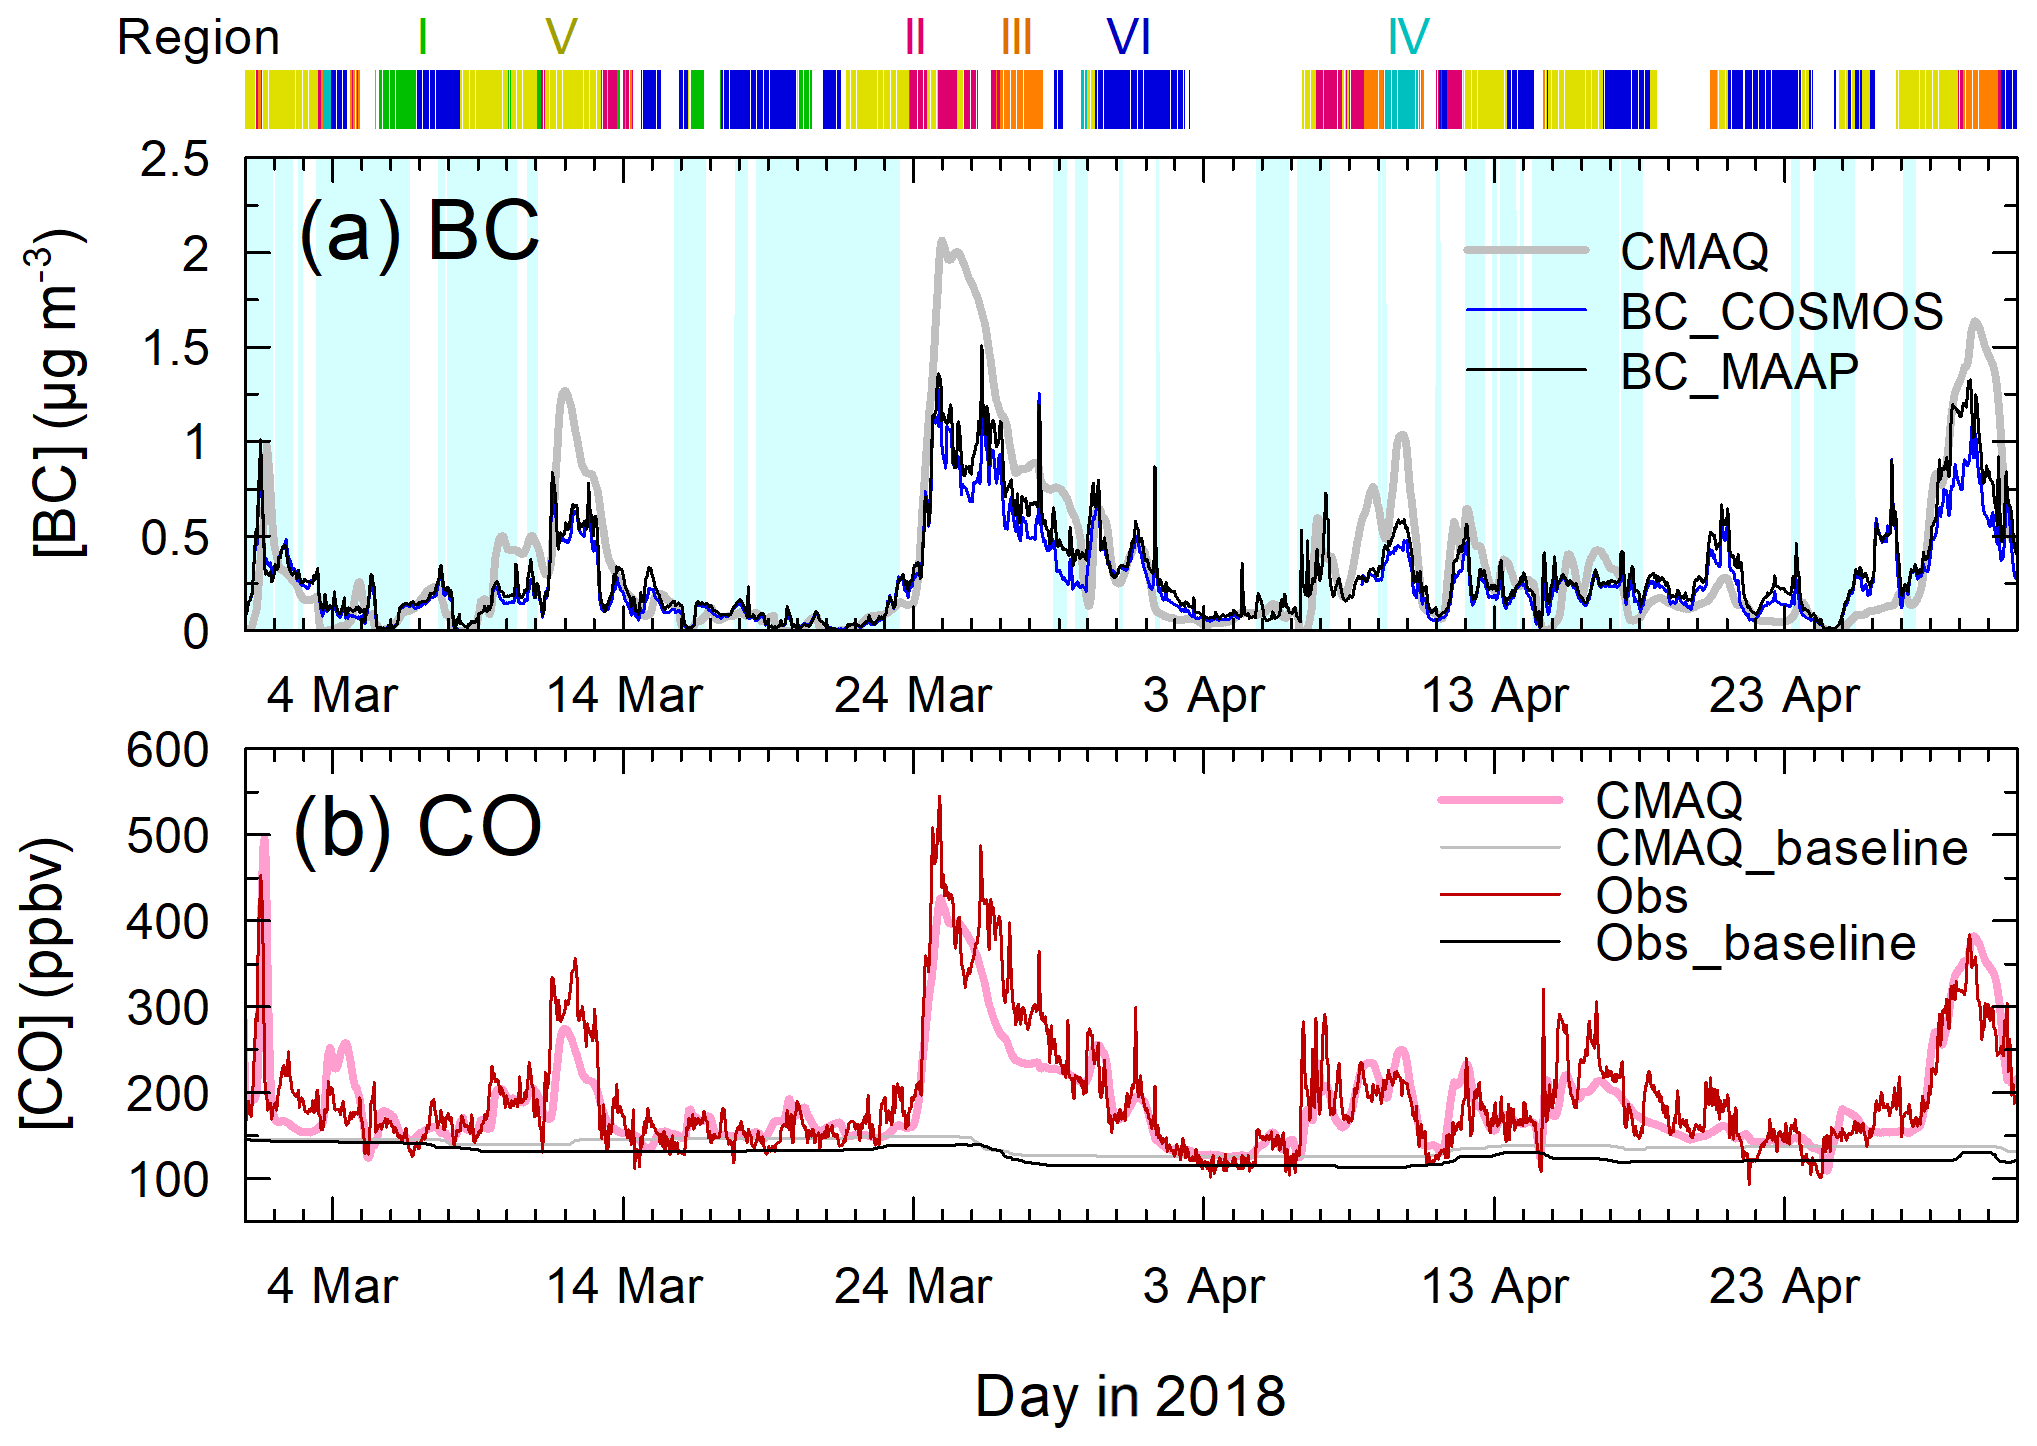
Figure 4Black carbon (BC) mass concentrations and CO mixing ratios from observations and model simulations during the EMeRGe–Asia campaign. The air mass origin areas are indicated with colored vertical bars above panel (a). The light blue bands in panel (a) indicate the periods with accumulated precipitation along trajectory (APT) > 1 mm.
3.2.2 Effects of meteorological interannual variability derived from simulations: extraction of emission trends
The left panels of Fig. 5 depict the footprints (total trajectory hourly points per grid, below 2500 m a.s.l.) for all regions (I–VI) and for individual air mass origin areas – regions I, II, III, IV, V' (South Korea only), and VI' (Japan only) – for all seasons during 2009–2019. In the middle columns, the IAVs of mean BC concentrations (APT <1 mm) assigned to individual origin regions are depicted for the observations and simulations of the WRF/CMAQ model with the fixed 2008 emissions. Data from 2009 and 2019 were eliminated from the analysis of all seasons because the observation periods did not cover a full year. Generally, the observed IAVs were sometimes well reproduced by the model. This is expected because the model captures pollution events transported over high emission grids and the effects of meteorology (i.e., dilution, stagnation, and vertical diffusion) as demonstrated by the data from the EMeRGe–Asia campaign in the previous subsection. The residual ratios of the observed-to-modeled BC mass concentrations for the individual air mass origin areas are shown in the right panels of Fig. 5 as an estimation of E(y) / REAS2.1(2008). The trends of this ratio (Table 2) are discussed below.
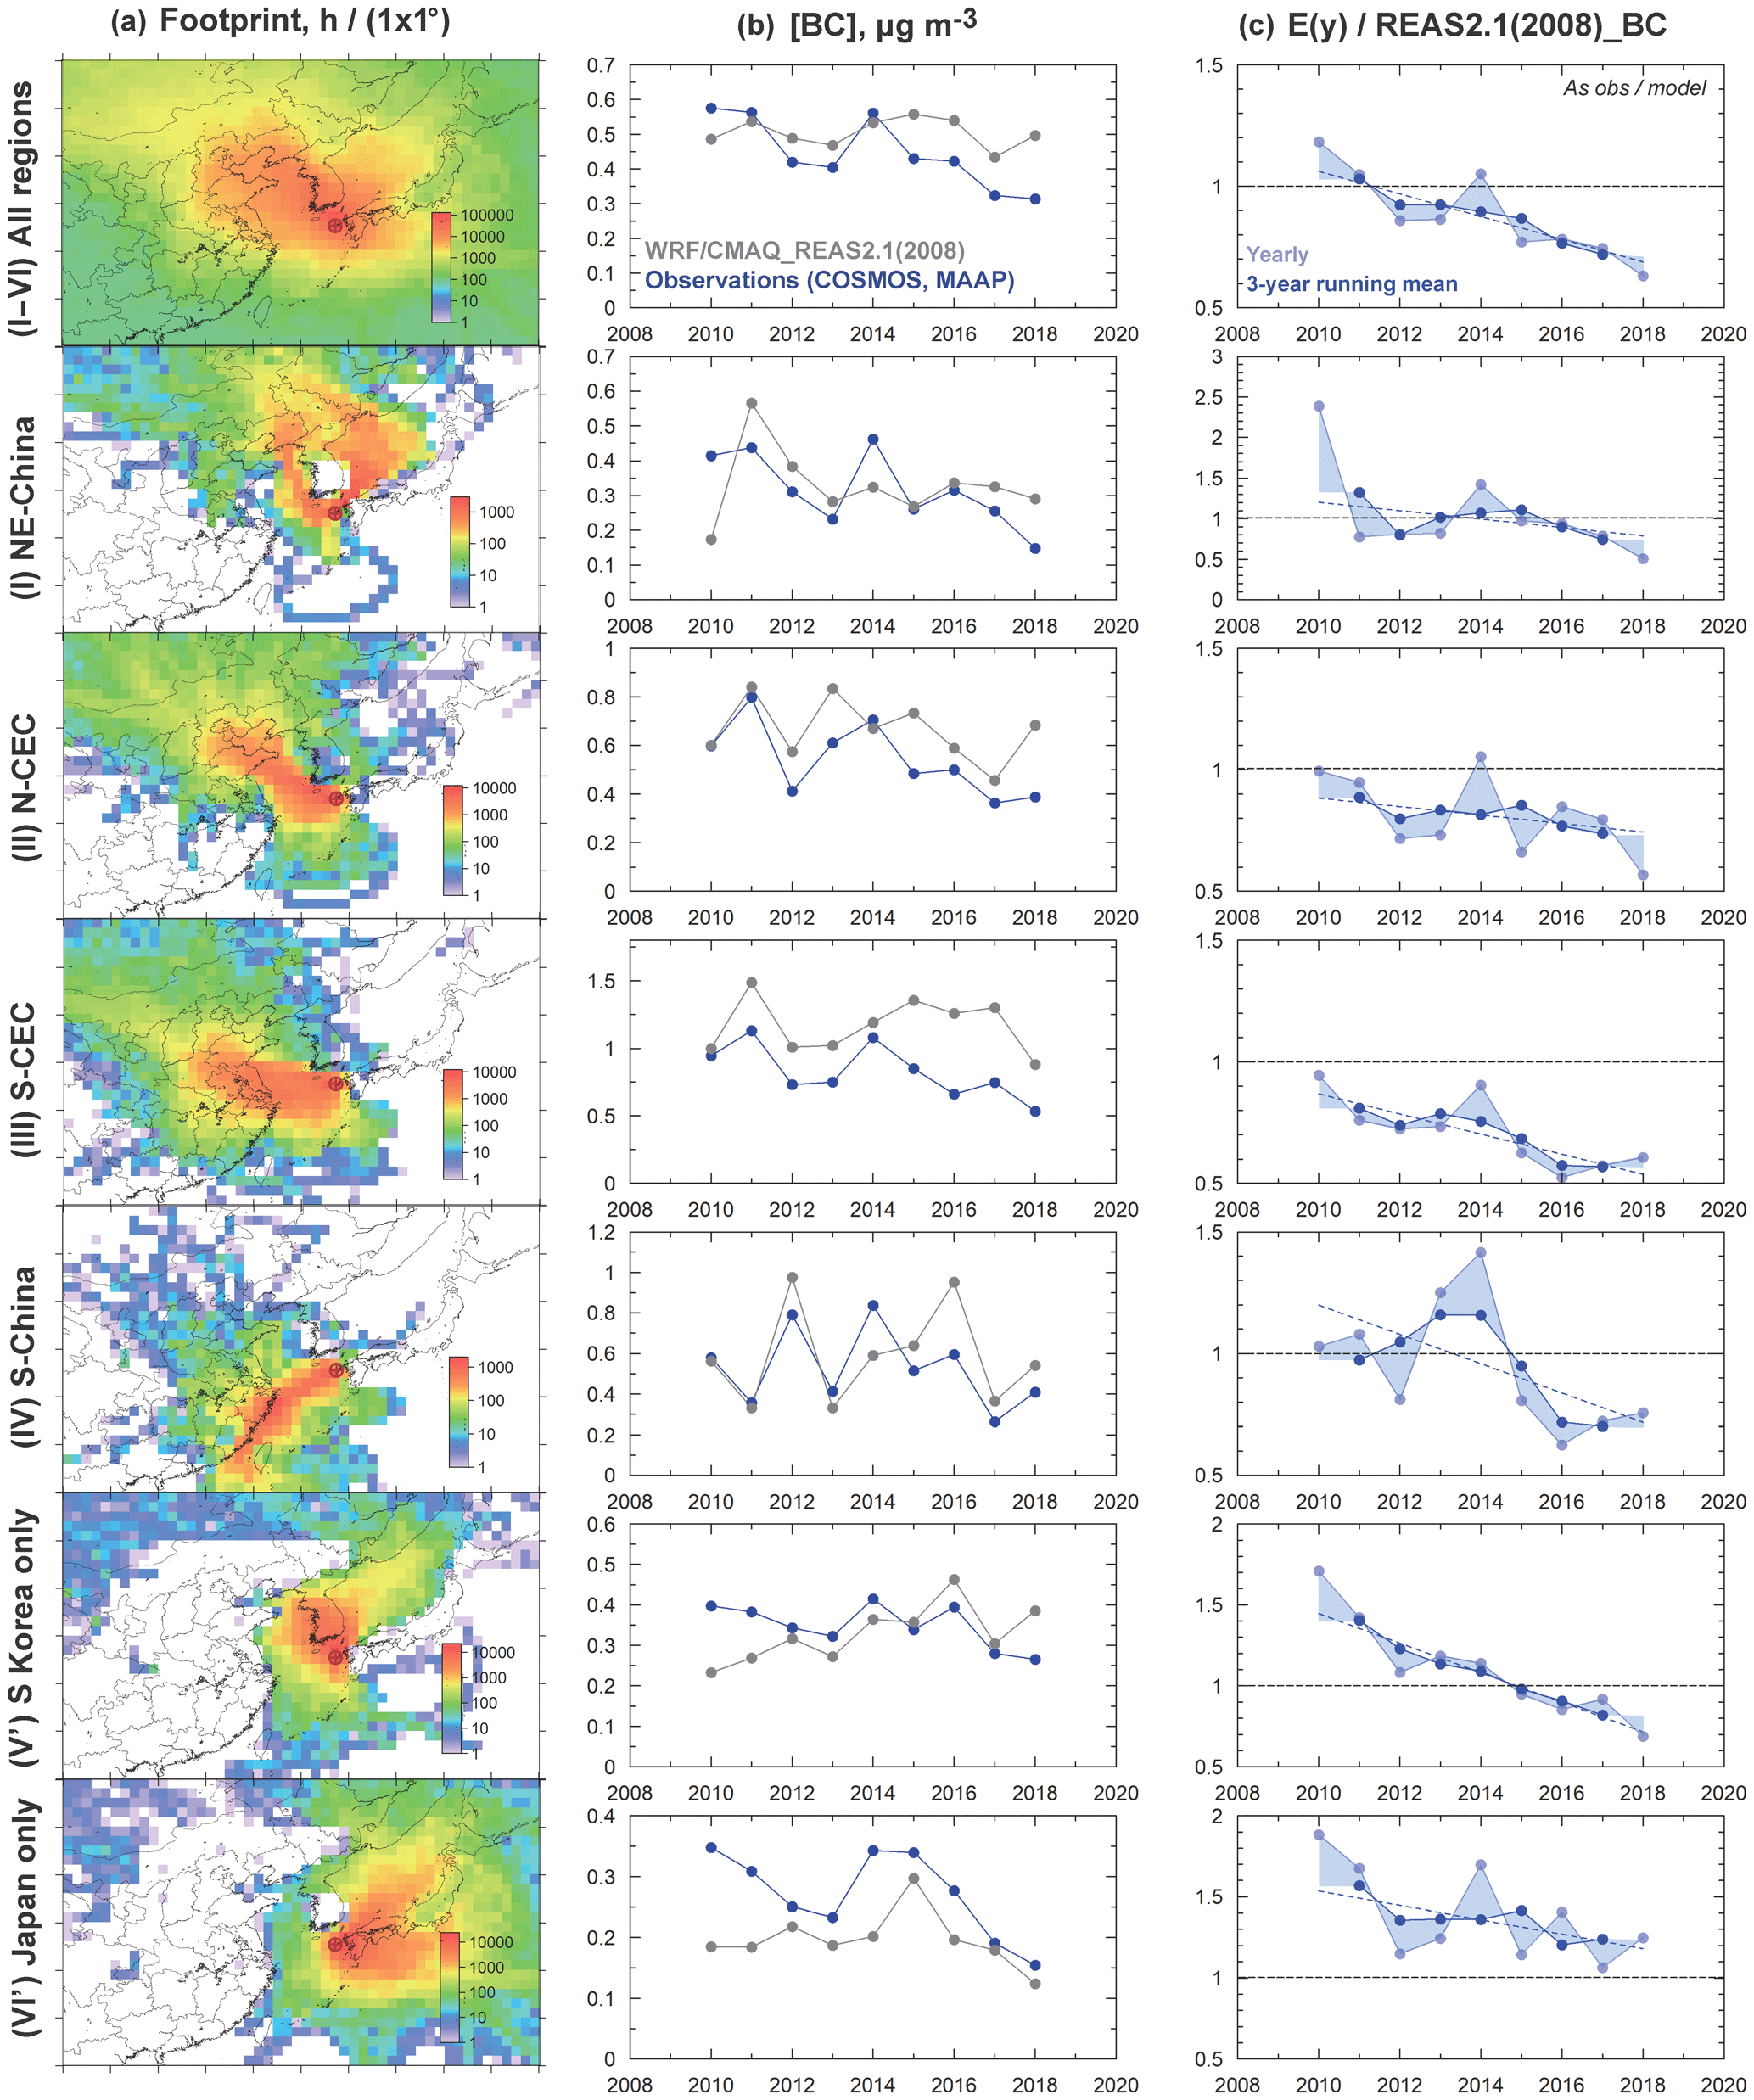
Figure 5(a) Footprints, (b) annually averaged black carbon (BC) concentrations for observations (blue dots) and model simulations (gray dots), and (c) observed/modeled BC concentration ratios used to estimate the emission correction factors – E(y) / REAS2.1(2008) – for all regions (I–VI) and individual regions (from top to bottom, as labeled on the left) for all seasons. NE China – northeastern China; N-CEC – north-central East China; S-CEC – south-central East China; and S China – southern China.
It should be noted that, after applying a smoothing filter (3-year running mean), the ratios (Fig. 5; Table 2) have relatively smaller IAVs (with correlation coefficients closer to −1 with respect to the year) than the raw observations (Fig. 2, Table 1). Therefore, the emission trends could be more precisely quantified after the removal of the meteorological effects. The emissions change was estimated to be () % yr−1 on average (P=0.00048) for all regions (I–VI). This value was similar for each season with values of (), (), (), and () % yr−1 for winter, spring, summer, and autumn, respectively. All values were negative and with statistical significance (P≤0.01).
Table 2Trends of estimated emissions of black carbon (BC) for all or in each of the seasons and for all regions (I–VI) and individual regions. The hourly data numbers (N), estimated emission ratios with respect to REAS2.1(2008), correlation coefficients regarding the year (R), and P values regarding the significance of the trend are also listed.
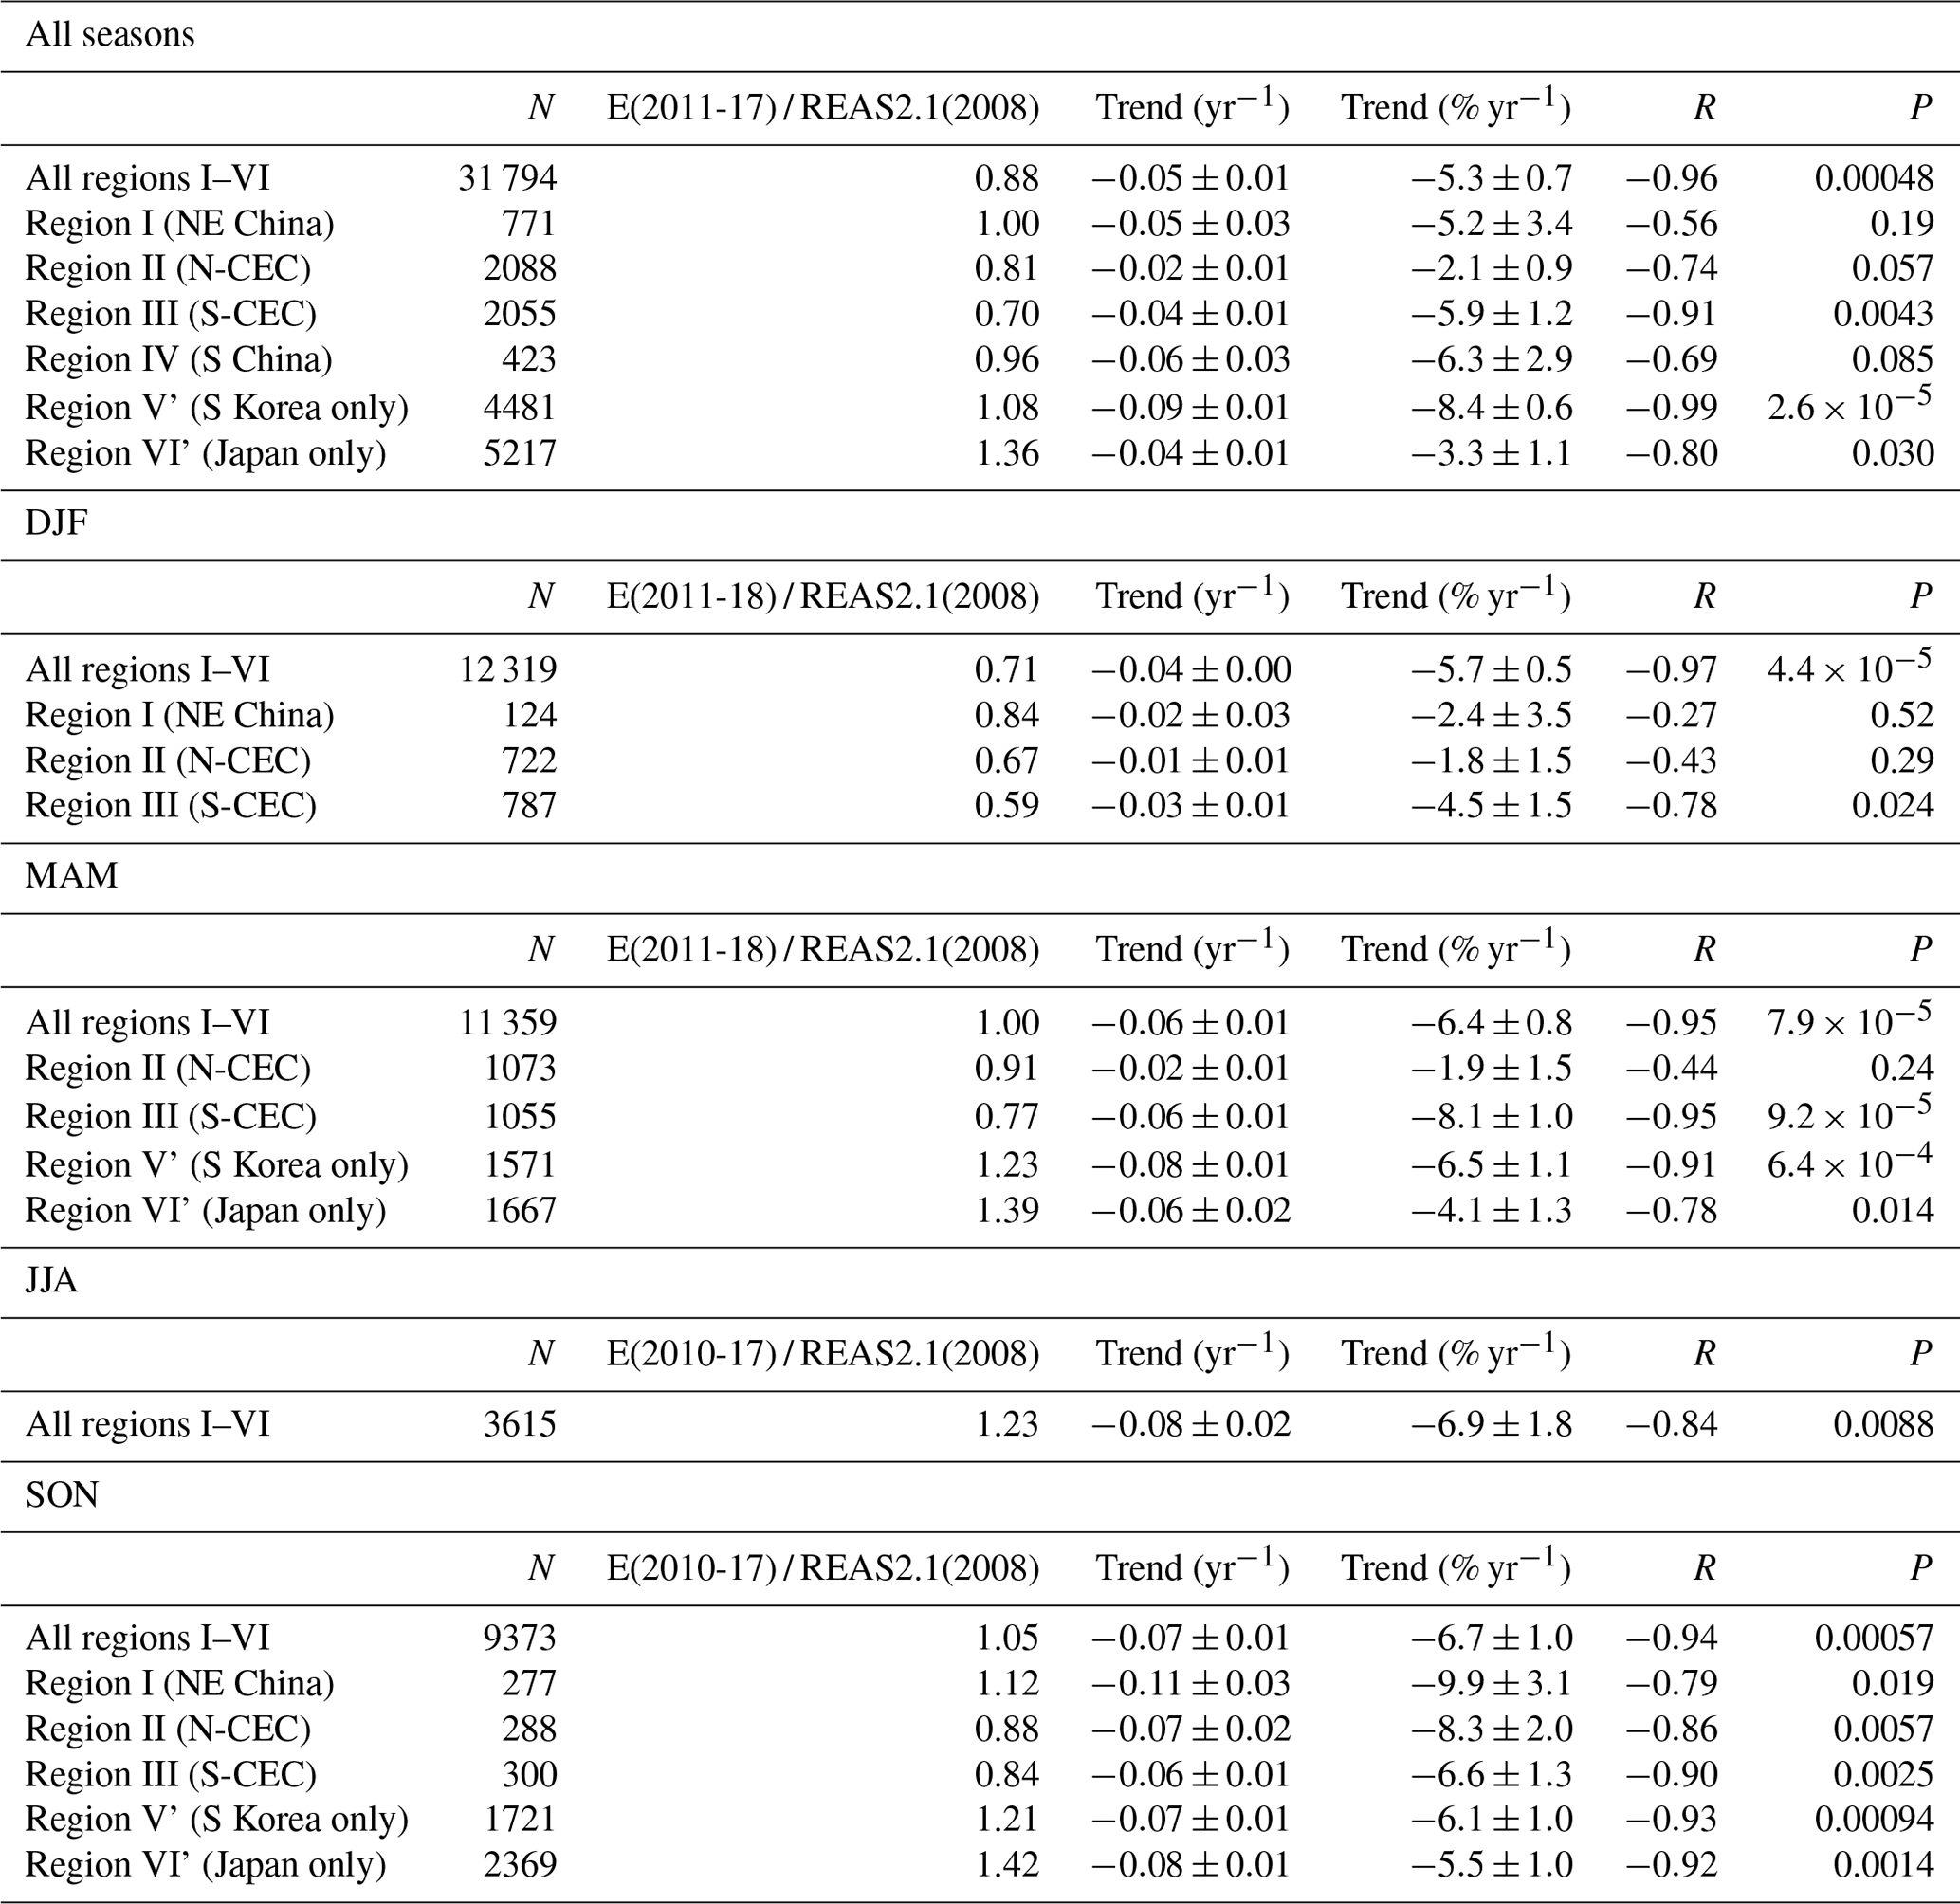
N-CEC – north-central East China; S-CEC – south-central East China; NE China – northeastern China; S China – southern China; winter – DJF; spring – MAM; summer – JJA; and autumn – SON.
Regionally, the trend was weaker for Japan, N-CEC, and NE China with values of (), (), and () % yr−1, respectively. However, it was stronger for S-CEC, S China, and South Korea for all seasons with values of (), (), and () % yr−1, respectively. In Japan the reduction pace of emissions may have slowed down after the earlier initial rapid decrease that occurred in populated areas (e.g., Kondo et al., 2012; Yamagami et al., 2019). For N-CEC the trends for winter and spring were similarly low at () and () % yr−1 when the data number was large. For NE China the trend was () % yr−1 for winter. This south–north contrast may reflect changes in the emissions structure. These values are compared to the CO changes in Sect. 3.4.
The results were unchanged within uncertainties with a stricter selection of data regarding the APT. When selecting data with APT = 0 mm, the estimated trends for all seasons were () % yr−1 (N=22 000) for all regions and () % yr−1 (N=1495) for N-CEC, which is consistent with () and () % yr−1 for APT < 1 mm, respectively.
Figure 6 shows our analysis for spring. This season had the longest record from 2009 to 2019 (or from 2010 to 2018 after the 3-year smoothing). Qualitatively, negative trends in BC were found for all regions. Weaker decreases were evident for N-CEC (third row from the top) and Japan (bottom row), although this trend was not linear for the whole period. The general trend was negative from 2010 to 2012, stable during 2012–2016, and became negative again during 2016–2018. This pattern was also found in the plots for all seasons (Fig. 5).
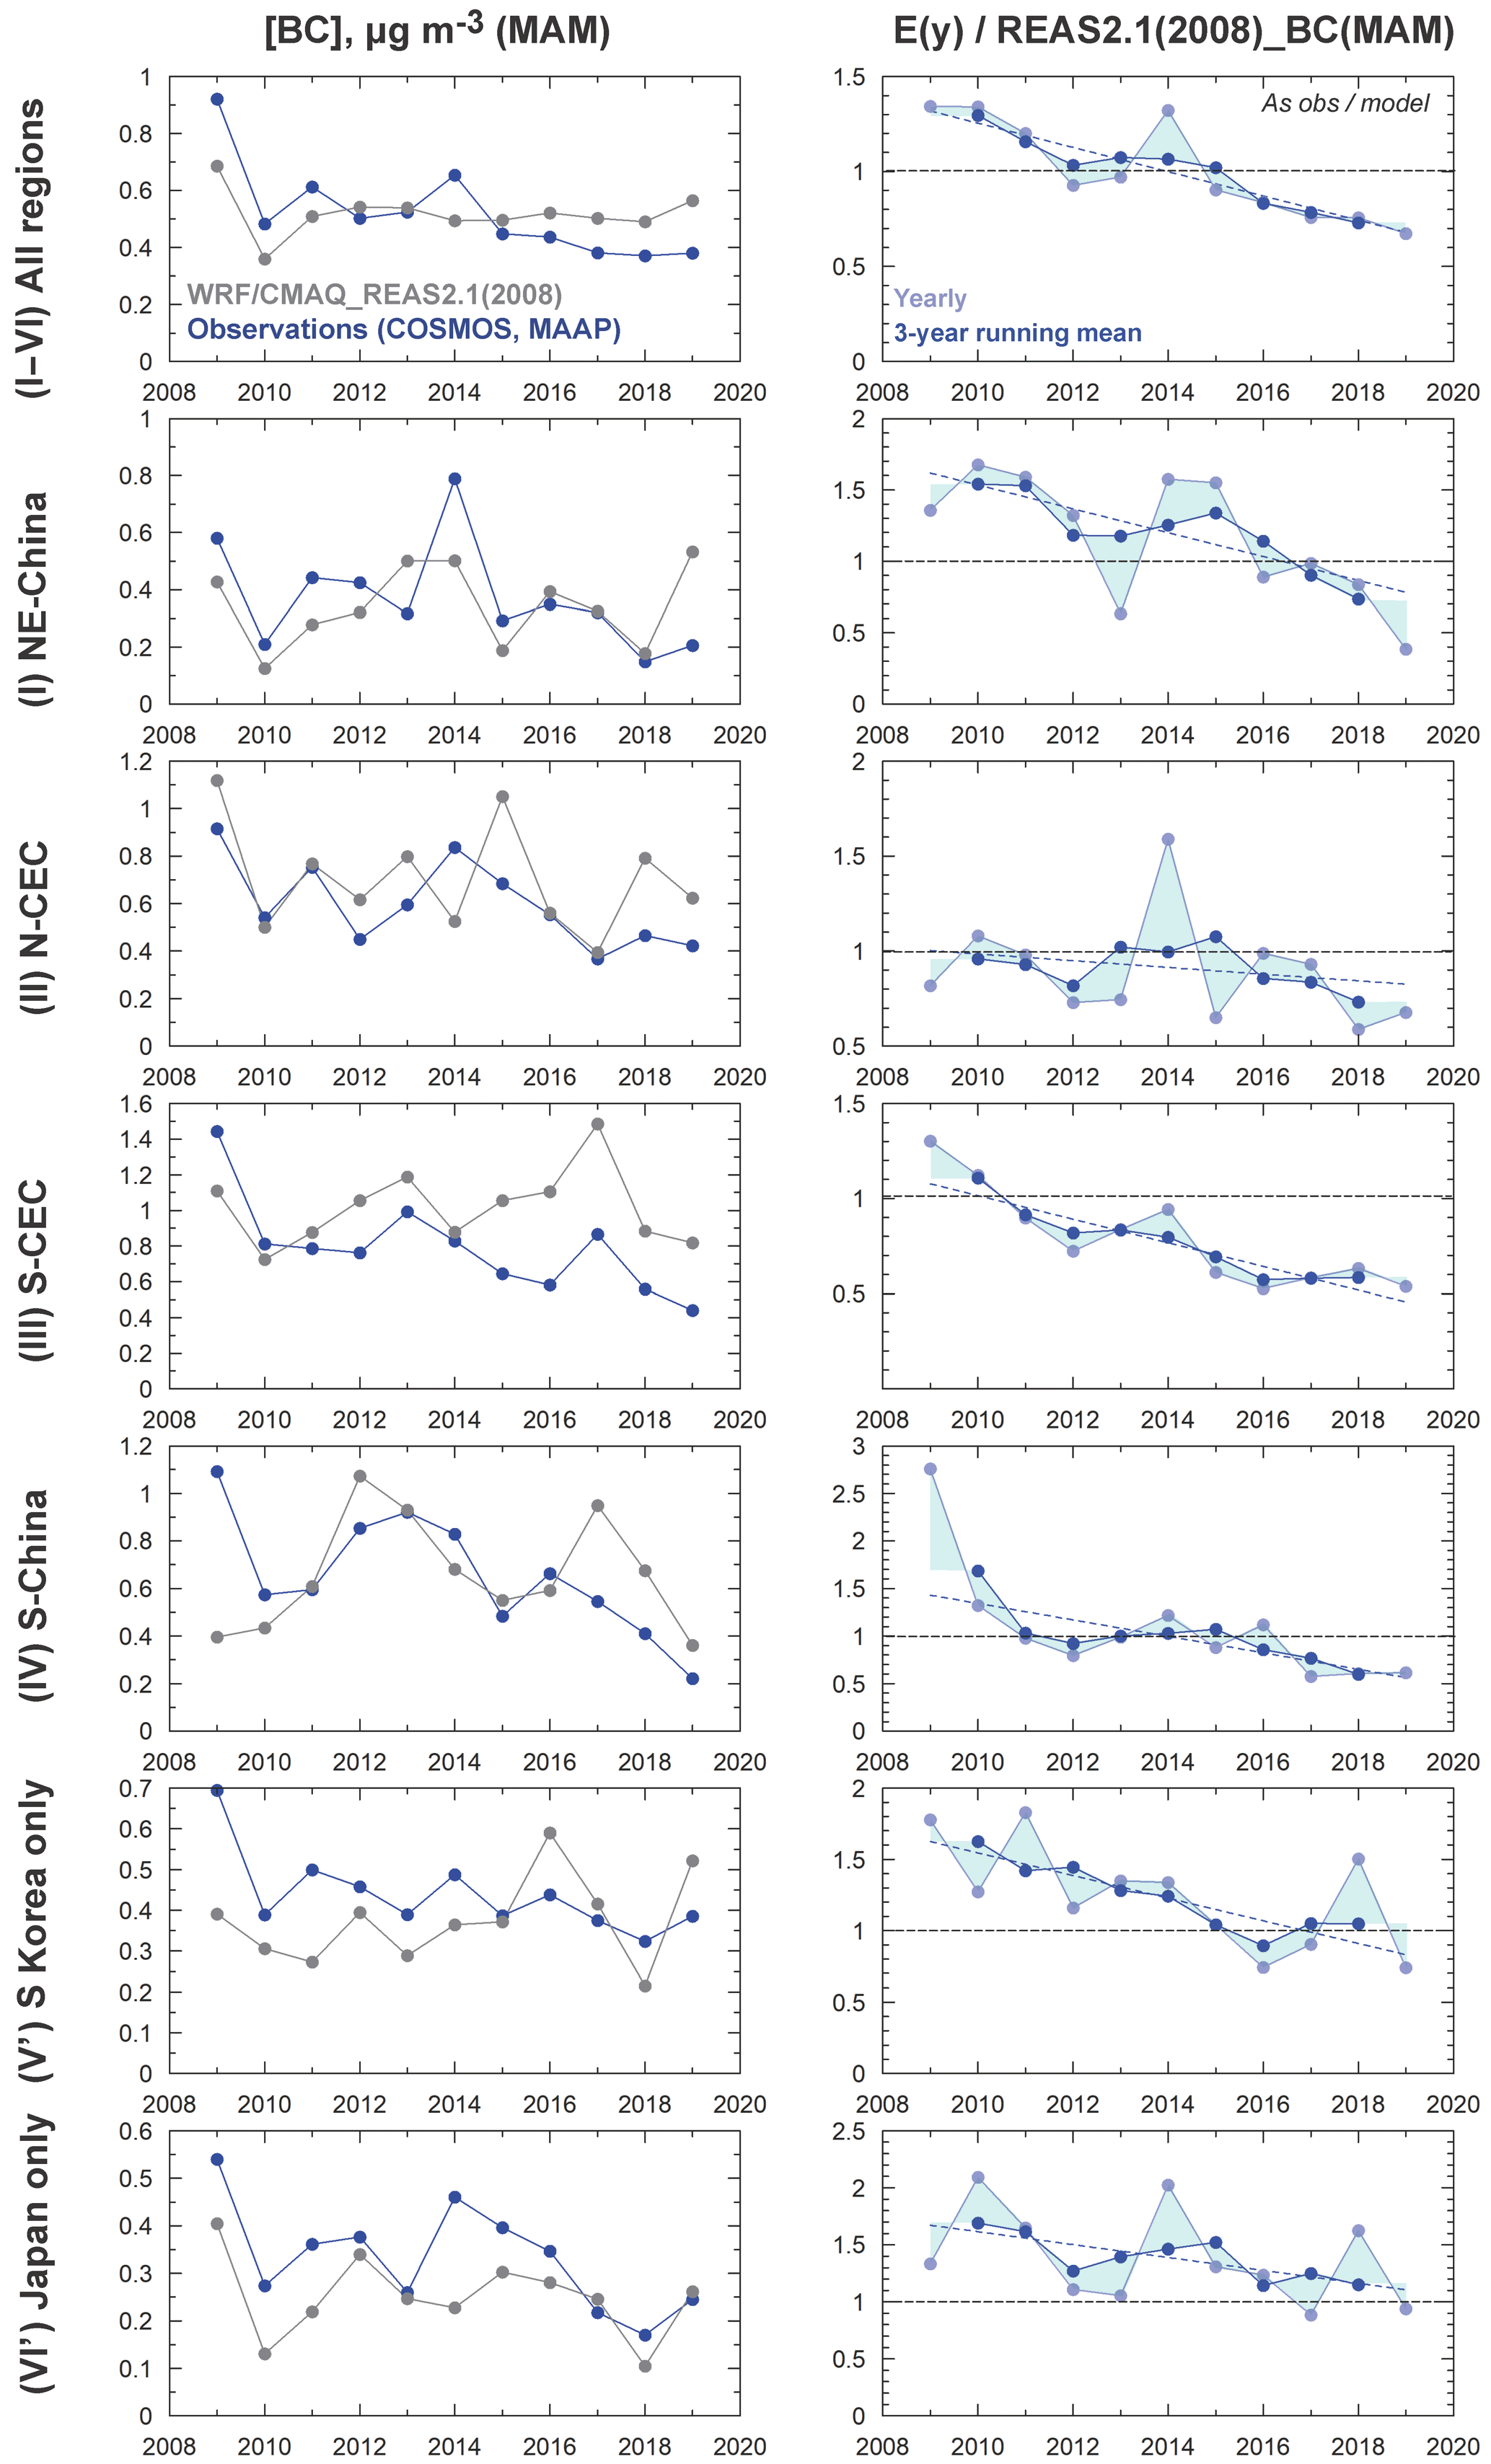
Figure 6Same as Fig. 5 but for spring (MAM), which is shown without footprint representation. Emissions correction factor – E(y) / REAS2.1(2008); NE China – northeastern China; N-CEC – north-central East China; S-CEC – south-central East China; and S China – southern China.
It should be noted that the observation-to-model ratio, E(y) / REAS2.1(2008), carries important information about the absolute emissions rate (e.g., Kondo et al., 2011b). A ratio exceeding the unity indicates that the emission rate needs to be increased by that factor for the studied region and year for the WRF/CMAQ to reproduce the observed levels, while a ratio below the unity implies that a reduction is needed. However, the uncertainties in the model simulations and observations may play an important role. For example, if the model had weak vertical diffusion/mixing coefficients and a tendency to systematically overpredict the surface concentrations with reference to those at higher altitudes, then the correction factor determined from this ratio would underestimate the emissions. The overall uncertainty in the estimated E(y) / REAS2.1(2008) values was estimated to be ±27 %, which includes those random and systematic uncertainties from the model and observation (see Sect. 2). On the other hand, the uncertainty in the trend was estimated to be ±21 % as it was only influenced by random uncertainties.
In this context cases (year, region) with ratios exceeding 1.27, lower than 0.73, or with trends exceeding 21 % were highlighted as being noteworthy. As shown for the four subregions in China in Fig. 5, the original ratios (3-year average) spanning a range of 0.8–1.3 became lower in 2011 and yielded values of 0.6–0.8 in 2017 (3-year average), which suggests that the REAS2.1's original emissions ratio for 2008 was reasonable in 2011 but required major revision for 2017. For South Korea the values in 2011 were relatively high, with a range of 1.3–1.6 in 2011, but concentrated around 0.8 in 2017, which suggests that an upshift and downshift in emissions are necessary for the early and later study periods, respectively. Similarly, for Japan the range in 2011 was very high (1.3–2.0) and needed a significant upshift in the BC emissions. In 2017, the ratio was also still over the unity (1.2–1.4) and required a small but relevant upshift.
3.3 Estimated black carbon emissions trends and rates from China: comparisons with bottom-up inventories
In this section, the total BC emissions for China and its decadal trends were estimated on a best-effort basis and compared to bottom-up inventories and future projections. Firstly, all Chinese provinces were assigned to the four Chinese subregions (i.e., regions I–IV) defined in this study (Fig. S6). Provinces with an annual BC emissions rate exceeding 0.05 Tg, with REAS2.1(2008), were assigned to the regions as follows: Heilongjiang and Liaoning to NE China; Hebei, Nei-Mongol, Shandong, and Shanxi to N-CEC; Anhui, Henan, Hubei, Jiangsu, and Sichuan to S-CEC; and Guangdong and Guangxi to S China. The regression lines for all seasons (based on 3-year averages) were used to calculate the E(y) / REAS2.1(2008) ratios to be used as emission correction factors for each region. These values were multiplied by the sum of the province-level emissions from REAS2.1(2008) to obtain the emissions over a given year for that region. Finally, the total rate of emissions from all four regions was calculated for each year.
The uncertainty range (light red shading) was evaluated as the interval between maximum and minimum values of the following: (1) the ±27 % uncertainty range discussed above; (2) estimates using raw 3-year running means before regression; and (3) estimates using raw yearly means. Term (3) had the largest interval in 2014, while in all other cases term (1) was the main contributing factor. The uncertainty of the trend might be smaller (±21 %) when dominated only by the random uncertainty (not shown in the figure). One caveat in this analysis would be that the emissions from inland areas (e.g., Sichuan) produced a lower observational signal at Fukue Island than central East China (CEC), while the footprint (Fig. 5) covered the inland areas to 100∘ E well. We estimated that 36 % of BC emissions from China, particularly those from southern or western areas including Sichuan, Guizhou, and Guangdong provinces (pale colors in Fig. S6), might have resulted in only 5 % of the signal at Fukue Island when the synthesized pseudosignal was analyzed by multiplying the footprint with the emission rates. Thus any emission trends in areas with a lower signal weight might easily be overlooked. A broken line in Fig. 7a represents a case in which emissions from southern and western areas are assumed to be unchanged during the study period. Even in this case, the trend was clearly negative and was within the range of overall uncertainty. We assumed that this scenario provided the weakest possible negative trend since Zhang et al. (2019) reported negative trends in BC concentrations in the southern and western provinces as well as CEC. Obviously, reliable BC measurements at other locations with a larger footprint over the areas are required to improve the analysis in the future. Here, nonetheless, we were able to conclude a decadal decreasing trend in the Chinese BC emissions from a long-term observation at the single site of Fukue Island.

Figure 7(a) Comparison of estimated black carbon (BC) emissions trends (bold red line) for China in past/present periods and compared to various bottom-up emission inventories, as shown in the figure legend. (b) Similar plot showing comparisons with future emission scenarios after normalization from 2012 to 2015, as shown in the figure legend. SSP – Shared Socioeconomic Pathway; NTCF – near-term climate forcer; and OS – overshoot scenario.
These emission estimates were compared with bottom-up inventories from after 2005 for China in Fig. 7a. Notably, data from the Emission Database for Global Atmospheric Research (EDGAR version 4.3.2) (Crippa et al., 2018) up to 2012 and the Community Emissions Data System (CEDS) data for CMIP6 (Hoesly et al., 2018) until 2014 showed monotonic increases, which clearly differs from the decreasing tendency found in this study. The industry sector mainly drove the increase in the CEDS from 2010 to 2014 (Fig. S7). Similarly, the REAS version 3.1 (Kurokawa and Ohara, 2019) and MEIC1.3 (Zheng et al., 2018) data also showed increases until 2011 and 2012, but then there were decreases until 2015 and 2017, respectively. The ECLIPSE version 5a (Klimont et al., 2017) showed a decrease of −3.1 % yr−1 during 2010–2015. Our results support the decreases in these data but suggest that the onset of this decrease was earlier than 2012. This indicates that the emission policies for particulates were effective even during the 11th 5-year planning period (2006–2010) and are reducing BC emissions. It should be noted that the ECLIPSE version 6b (https://iiasa.ac.at/web/home/research/researchPrograms/air/Global_emissions.html, last access: 25 May 2020) predicted a decreasing trend that started from 2005 to 2010 and was related to emission reductions in the residential sector, while decreases from 2010 to 2015 were mainly driven by emission reductions in the industrial sector (Fig. S7). The decreasing trend of Chinese BC emissions found in this study of −4.6 % yr−1 is in good agreement with the value of −4.7 % yr−1 from MEIC1.3 (Zheng et al., 2018). The different emission trends among inventories mainly reflect whether the government's clean air actions after 2010, particularly those enacted in 2012, or during the 12th 5-year planning period were taken into account. These actions were considered in REAS version 3.1, MEIC1.3, and ECLIPSE version 5a (and version 6b), while CEDS only considered the effect of the policies for CO, NOx, and SO2 but not for BC. CEDS uses BC emission factors from the Speciated Pollutant Emission Wizard (SPEW) database (Bond et al., 2007) instead, and the more recent control concept that came after 2010 was not introduced (Hoesly et al., 2018). It should be noted that this decreasing trend has not previously been recognized – not even in a recent national review of bottom-up inventories (Li et al., 2017). Clearly the sharp decrease in the BC emissions from China identified in this study needs be addressed by the next generation of emission inventories for CMIP7.
In terms of absolute values, the emissions rate from CEDS was much higher (by a factor of ∼2; 2–2.5 g yr−1) than our current estimate and is well outside its estimated uncertainty range. Our previous work (Kanaya et al., 2016; Choi et al., 2020), based on an independent approach in which we multiplied the estimated BC∕CO emissions ratio with the CO emissions rate, also did not support such a high emissions rate from China. The ECLIPSE version 6b result matched our absolute emissions rate the best. The largest difference between the ECLIPSE version 6b and CEDS for 2010 and 2015 occurred primarily in the industry sector and then in the residential sector (Fig. S7).
The emissions reduction trend was converted to a relative scale by normalizing it to the average value for 2012–2015 (Fig. 7b). Here we used a Monte Carlo approach to evaluate the annual average and uncertainty intervals. A small increase was recognized in 2014 and related to a larger uncertainty for that year. Nonetheless, a clear decrease was evident during the decade. This relative trend was compared to those from future emission scenarios, namely SSP scenarios starting from 2015 (Fig. 7b). The emissions projection data for China were taken from Gidden et al. (2019) and the Shared Socioeconomic Pathways (SSPs) Public Database hosted by the International Institute for Applied Systems Analysis (IIASA) Energy Program (ENE) (https://tntcat.iiasa.ac.at/SspDb/dsd?Action=htmlpage&page=50, last access: 25 May 2020). Until 2018, the pace of reduction was higher than the lowest envelope that was projected in the future scenarios of SSP1-19 and SSP1-26 with trends of −3.9 % yr−1 and −3.5 % yr−1, respectively, for the period between 2015 and 2030. These scenarios had the most significant emission reductions of greenhouse gases and short-lived climate forcers, which is consistent with sustainable development. This analysis suggests that the countermeasures implemented in China have been successful at reducing BC emissions.
3.4 Comparative trends in CO emissions
CO is a useful tracer for BC emissions because they are coemitted from incomplete combustion. Figure 8 shows our analyses for ΔCO for the winter months. Here, similar to our previous study (Kanaya et al., 2016), ΔCO was defined as the enhancement from the baseline, which was determined as the 5th percentile over the moving 14 d time frame (see Fig. 4b). Thus, ΔCO represents a regional enhancement in the observations and model simulations. Although the model does not include IAVs of the CO mixing ratios at lateral boundaries, a fair comparison to the observations is possible. The IAVs of the removal of CO via its reaction with OH or secondary production of CO from hydrocarbons were not taken into account because the focus of this study was on relatively fresh peaks with magnitudes of 50–250 ppbv. The size of the data set was larger than for BC because we did not preselect data with APT < 1 mm. Therefore, we achieved a better statistical convergence than for BC.
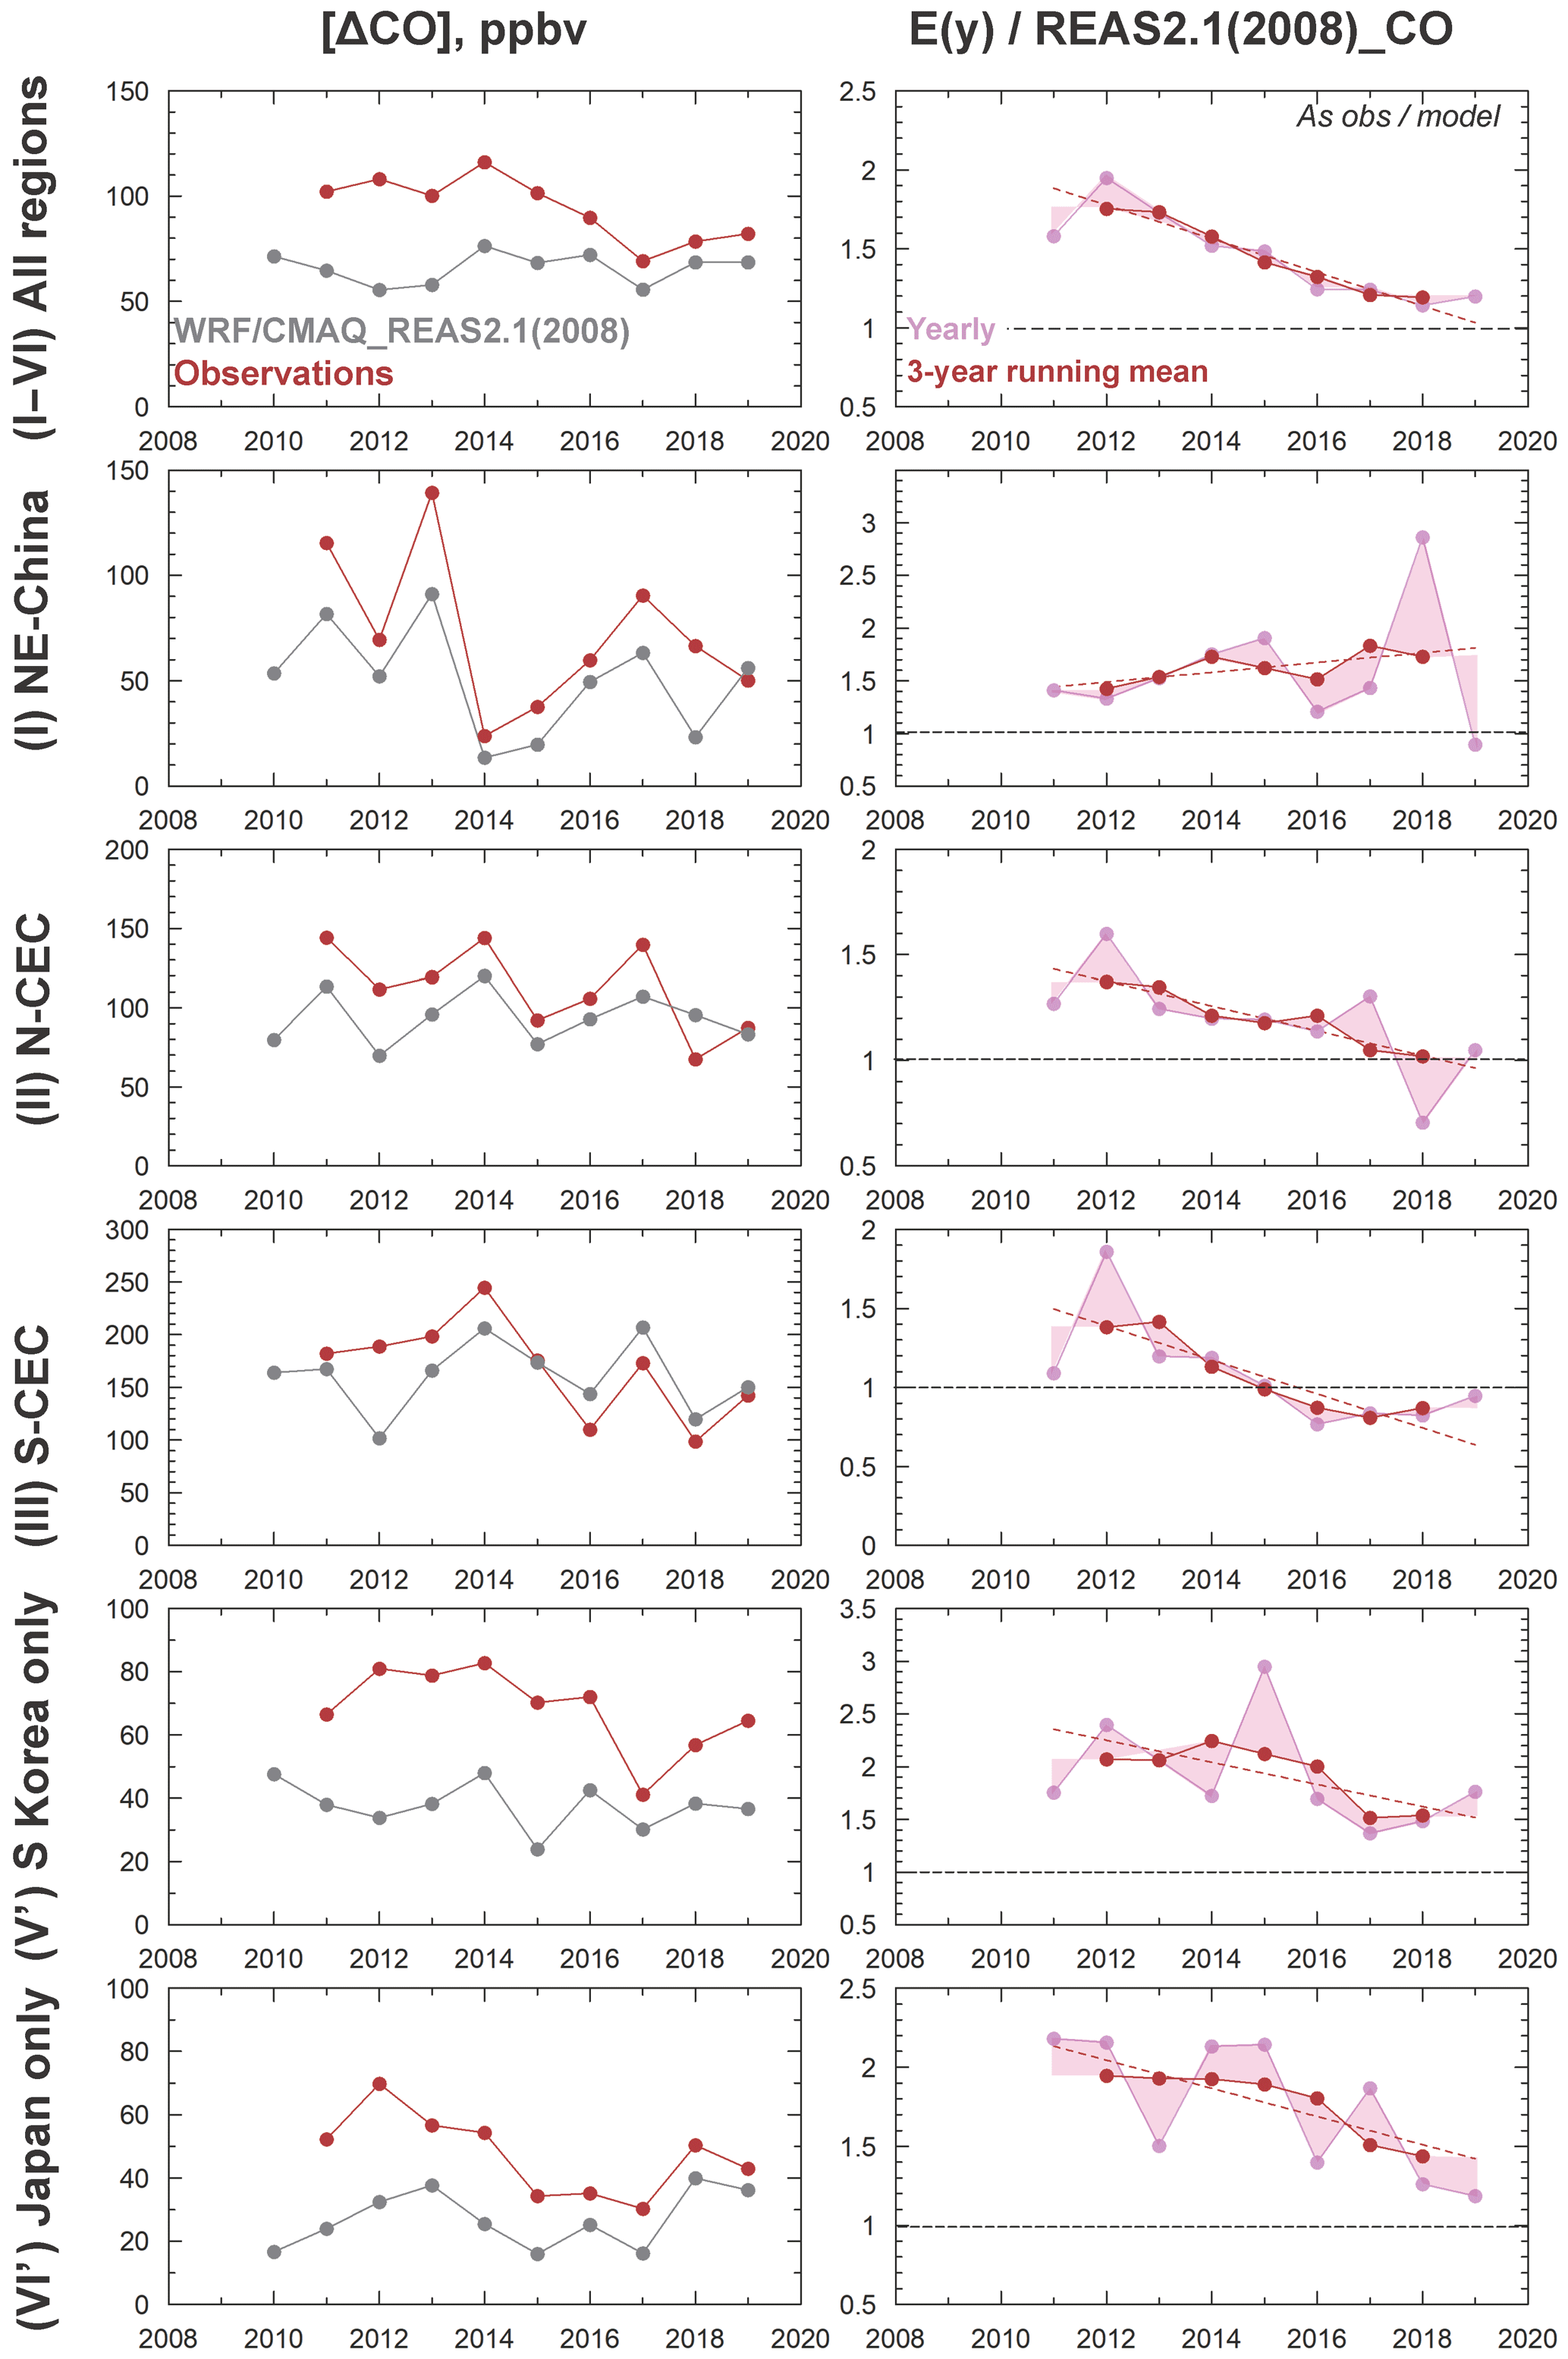
Figure 8Same as Fig. 6 but for ΔCO during winter (DJF). Emissions correction factor – E(y) / REAS2.1(2008); NE China – northeastern China; N-CEC – north-central East China; and S-CEC – south-central East China.
As for BC, the IAVs of ΔCO that were linked to meteorology were reproduced well by the WRF/CMAQ model. We used the residual trend to approximate the emissions trend for CO. As expected, a negative emissions trend was inferred (Supplement Table S1; Fig. 8). We found trends of () % yr−1 for all seasons and all regions for 2014–2017 (P=0.029) and () % yr−1 for winter and all regions for 2012–2018 (), respectively. They were similar to () % yr−1 and () % yr−1, which was estimated for BC during the same period. This suggests that the BC and CO emissions rate from China decreased in parallel over the past decade. In Region II (N-CEC), a slower CO reduction rate was identified () % yr−1, while large reductions occurred in regions III (S-CEC) and IV (S China) with rates of () and () % yr−1, respectively (for all seasons). This pattern was quite comparable to the case of BC. In South Korea, the reduction in CO () % yr−1 was relatively small when compared to BC () % yr−1. In Japan, the reduction () % yr−1 was similar to BC () % yr−1.
The direction of BC and CO emissions changes in winter were compared for the period 2012–2018 (Fig. 9). A parallel reduction in BC and CO emissions was noticed, which was based on the averages of the air masses from all regions (colored squares). In Region I (NE China), except for 2018, the BC and CO emissions increased (colored triangles) and the BC∕CO ratio remained almost constant, which is in contrast to other regions of China. Compared to other regions, this region may have undergone different economic development, delayed implementation of pollution controls, or a shift of, or even an increase in, coal use in the residential sector from urban to rural areas. The emissions sources in winter are unlikely to be forest fires because the region would have had snow cover. Given that this region is nearer to the higher latitudes/Arctic, the evolution of its BC emissions needs to be carefully watched in the future to assess its impact on BC transport to higher latitudes and/or snow albedo changes. Itahashi et al. (2019) recently found that NOx emissions from NE China exhibited a later peak between 2013 and 2016, which is consistent with the tendency for BC. Region II (N-CEC) showed a CO decrease but only a very weak BC decrease, which suggests that the BC∕CO emissions ratio increased. Zheng et al. (2018) suggested to the whole nation in MEIC1.3 that a control in industrial emissions will result in a larger reduction of CO than BC; this type of change, which is a step toward improved energy efficiency, might be dominant in this region. In Region III (S-CEC), the reductions of BC and CO were similarly strong, which suggests effective pollution control measures in this region.
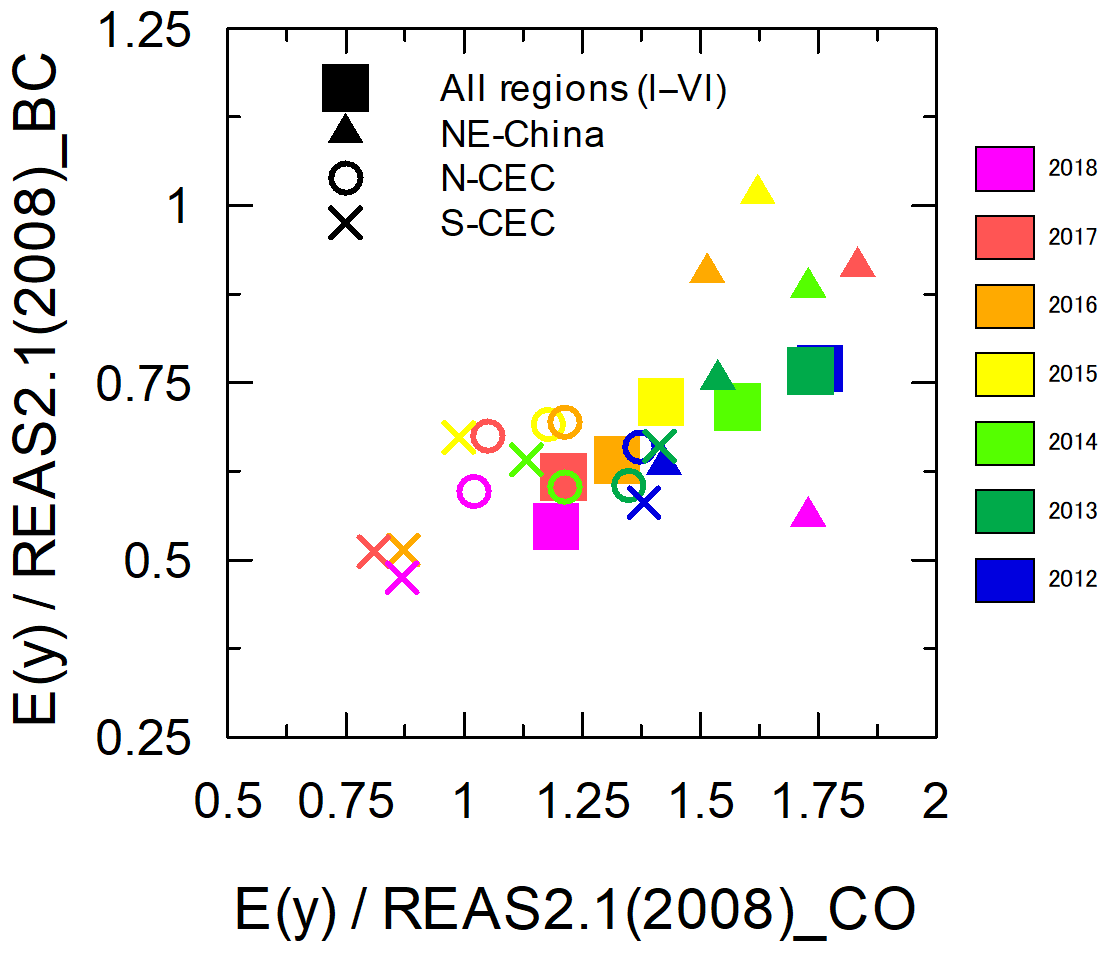
Figure 9Relationship between trends in black carbon (BC) and CO emissions estimated by this study. Emissions correction factor – E(y) / REAS2.1(2008); NE China – northeastern China; N-CEC – north-central East China; and S-CEC – south-central East China.
3.5 Tendency of the atmospheric black carbon∕PM2.5 mass concentration ratio
We also found that the BC reduction occurred at a faster pace than atmospheric PM2.5 mass concentrations at Fukue Island (Fig. 10). In panel (a), similar IAVs were found for mass concentrations of BC and PM2.5 related to the meteorology. In panel (b), by using the BC∕PM2.5 ratio, these meteorological IAVs were removed as in previous analyses. The fraction of BC to PM2.5 (0.0205 on average) showed a decrease of () % yr−1 with P=0.013, which suggests that PM2.5 is “brighter” (containing less black carbon) than it was a decade ago with a 95 % confidence interval. This constant decrease would be difficult to achieve if the BC emissions increased while SO2 and NOx (as precursors of non-BC fraction of PM2.5) emissions decreased as the CEDS data indicate. We also confirmed that the trend remained unchanged when we selected data with APT < 1 mm. Therefore, we concluded that a BC emissions reduction occurred without significant delay with respect to the reductions of NOx and SO2, although the secondary production of organic aerosols from natural sources, if constant, may help explain part of the reduction in the BC∕PM2.5 ratio over time. Moreover, the balance or lag between SO2 and BC reductions could have strong effects on the climate. By using satellite data inversion, the emission reductions from China were estimated to be 24 %–33 % or (2.4–3.3) % yr−1 for SO2 during 2007–2016 (Qu et al., 2019) and (3.0–5.4) % yr−1 for NOx during 2011–2016 (Itahashi et al., 2019). Our estimated reduction of BC emissions (4.6 % yr−1) was nearly equal to or even faster than these rates.
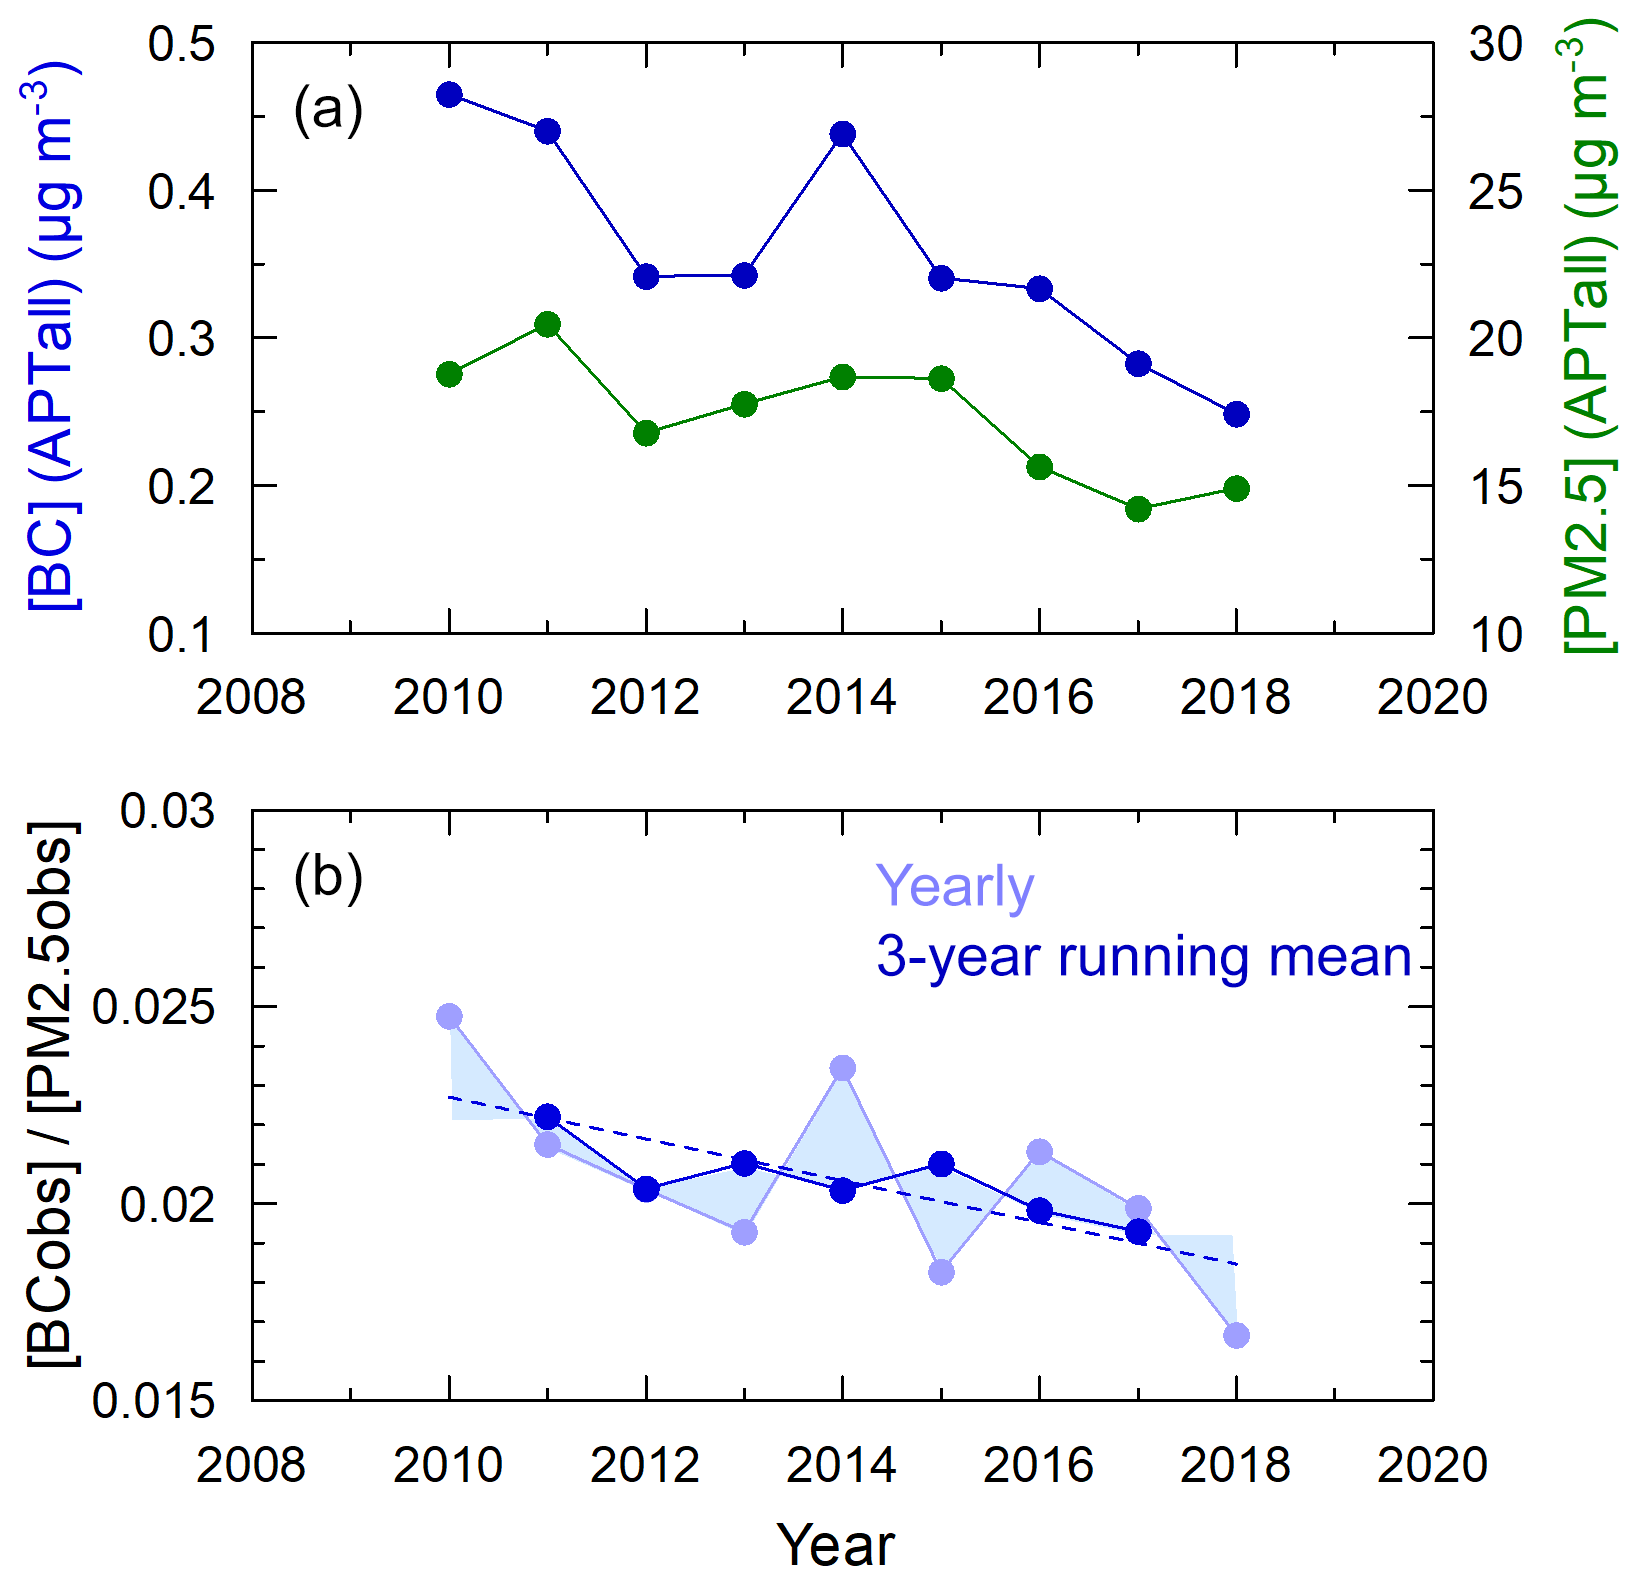
Figure 10(a) Temporal trends in the annually averaged black carbon (BC) and fine particulate matter (PM2.5) mass concentrations for all cases. (b) BC∕PM2.5 ratios showing a decreasing trend.
At Fukue Island, a rapidly decreasing decadal trend in the atmospheric BC mass concentrations of () % yr−1 was detected in the period between 2009 and 2019. By choosing air masses for analysis that were unaffected by the wet deposition and by normalizing the observed annual averages with those from model simulations, we eliminated the influence of meteorology and focused on residual trends. We attributed these residual trends to emission changes in major source regions, particularly within four Chinese subregions, according to a backward trajectory analysis. The overall emissions reduction trend was estimated to be () % yr−1 and was governed by the trend in S-CEC () % yr−1, while N-CEC China and NE China showed weaker reductions. We estimated a −4.6 % yr−1 BC emissions reduction in China over the period 2009–2018. This supports MEIC1.3, ECLIPSE versions 5a and 6b, and REAS version 3.1 inventories that reflect emission reduction policies occurring after 2012, although our results suggest an earlier onset of these reductions. The CEDS estimates used in CMIP6, characterized by a large emissions rate (>2 Tg yr−1) and an increasing trend (until 2014), were not supported by this analysis. This indicates a need for the revision of emission inventories for CMIP7. We suggest that the following key potential factors lead to the discrepancy: recent air pollution legislation and its implementation in industrial sector, recent trends in residential coal use, and estimates of the open burning of municipal waste. The reduction in Chinese BC emissions appears to be even faster than the decline estimated by the deep mitigation SSP1 scenarios for 2015–2030, which suggests the successful implementation of the BC reduction policies. The BC∕PM2.5 mass concentration ratio at Fukue Island showed a decreasing trend, which implies that BC reductions followed the SO2 and NOx controls; the latter species are among the key contributors to secondary PM2.5 components. A limitation of this study is that the analysis was conducted at a single site. Future studies should involve long-term observational data at multiple sites when available.
The observational data set for BC is collectively available from https://ebcrpa.jamstec.go.jp/atmoscomp/obsdata/ (Atmospheric Composition Research Group, 2020).
The supplement related to this article is available online at: https://doi.org/10.5194/acp-20-6339-2020-supplement.
YKa designed the study, conducted analyses, and wrote the paper. KY and KI conducted and optimized the WRF/CMAQ model simulations. YKa, TM, FT, CZ, YKom, and YKon contributed to the observations and instrumentation. YC contributed to the verification of the assignment of the air mass origin regions and the criterion of APT to extract cases with negligible wet deposition. ZK provided the interpretation and discussion of the emissions reduction.
The authors declare that they have no conflict of interest.
This article is part of the special issue “Effect of Megacities on the Transport and Transformation of Pollutants at Regional and Global Scales (EMeRGe) (ACP/AMT inter-journal SI)”. It is not associated with a conference.
We gratefully acknowledge the assistance of Minoru Kubo, Tamio Takamura, Hitoshi Irie, and Jun-ichi Kurokawa. We thank Trudi Semeniuk from the Edanz Group (https://en-author-services.edanzgroup.com/, last access: 25 May 2020) for editing a draft of this paper.
This research has been supported by the Environment Research and Technology Development Fund (ERTDF) from the Ministry of the Environment, Government of Japan (grant nos. S-7, 2-1505, and 2-1803), the Grants-in-Aid for Scientific Research (KAKENHI; grant nos. 16H01770, 25220101, 18H04143, and 19H05704), and the Arctic Challenge for Sustainability (ArCS) Project funded by the Ministry of Education, Culture, Sports, Science, and Technology of Japan.
This paper was edited by Qiang Zhang and reviewed by three anonymous referees.
Atmospheric Composition Research Group: Observational data set for BC at Fukue, available at: https://ebcrpa.jamstec.go.jp/atmoscomp/obsdata/, last access: 25 May 2020.
Bond, T. C., Streets, D. G., Yarber, K. F., Nelson, S. M., Woo, J.-H., and Klimont, Z.: A technology-based global inventory of black and organic carbon emissions from combustion, J. Geophys. Res., 109, D14203, https://doi.org/10.1029/2003JD003697, 2004.
Bond, T. C., Bhardwaj, E., Dong, R., Jogani, R., Jung, S., Roden, C., Streets, D. G., and Trautmann, N. M.: Historical emissions of black and organic carbon aerosol from energy-related combustion,1850–2000: historical BC/OC emissions, Global Biogeochem. Cy., 21, GB002840, https://doi.org/10.1029/2006GB002840, 2007.
Byun, D. and Schere, K. L.: Review of the governing equations, computational algorithms, and other components of the Model-3 Community Multiscale Air Quality (CMAQ) modeling system, Appl. Mech. Rev., 59, 51–77, https://doi.org/10.1115/1.2128636, 2006.
Chen, L.-W. A., Chow, J. C., Watson, J. G., and Schichtel, B. A.: Consistency of long-term elemental carbon trends from thermal and optical measurements in the IMPROVE network, Atmos. Meas. Tech., 5, 2329–2338, https://doi.org/10.5194/amt-5-2329-2012, 2012.
Choi, Y., Kanaya, Y., Park, S.-M., Matsuki, A., Sadanaga, Y., Kim, S.-W., Uno, I., Pan, X., Lee, M., Kim, H., and Jung, D. H.: Regional variability in black carbon and carbon monoxide ratio from long-term observations over East Asia: assessment of representativeness for black carbon (BC) and carbon monoxide (CO) emission inventories, Atmos. Chem. Phys., 20, 83–98, https://doi.org/10.5194/acp-20-83-2020, 2020.
Collaud Coen, M., Weingartner, E., Apituley, A., Ceburnis, D., Fierz-Schmidhauser, R., Flentje, H., Henzing, J. S., Jennings, S. G., Moerman, M., Petzold, A., Schmid, O., and Baltensperger, U.: Minimizing light absorption measurement artifacts of the Aethalometer: evaluation of five correction algorithms, Atmos. Meas. Tech., 3, 457–474, https://doi.org/10.5194/amt-3-457-2010, 2010.
Crippa, M., Guizzardi, D., Muntean, M., Schaaf, E., Dentener, F., van Aardenne, J. A., Monni, S., Doering, U., Olivier, J. G. J., Pagliari, V., and Janssens-Maenhout, G.: Gridded emissions of air pollutants for the period 1970–2012 within EDGAR v4.3.2, Earth Syst. Sci. Data, 10, 1987–2013, https://doi.org/10.5194/essd-10-1987-2018, 2018.
Evangeliou, N., Thompson, R. L., Eckhardt, S., and Stohl, A.: Top-down estimates of black carbon emissions at high latitudes using an atmospheric transport model and a Bayesian inversion framework, Atmos. Chem. Phys., 18, 15307–15327, https://doi.org/10.5194/acp-18-15307-2018, 2018.
Gidden, M. J., Riahi, K., Smith, S. J., Fujimori, S., Luderer, G., Kriegler, E., van Vuuren, D. P., van den Berg, M., Feng, L., Klein, D., Calvin, K., Doelman, J. C., Frank, S., Fricko, O., Harmsen, M., Hasegawa, T., Havlik, P., Hilaire, J., Hoesly, R., Horing, J., Popp, A., Stehfest, E., and Takahashi, K.: Global emissions pathways under different socioeconomic scenarios for use in CMIP6: a dataset of harmonized emissions trajectories through the end of the century, Geosci. Model Dev., 12, 1443–1475, https://doi.org/10.5194/gmd-12-1443-2019, 2019.
Granier, C., Bessagnet, B., Bond, T., D'Angiola, A., Denier van der Gon, H., Frost, G. J., Heil, A., Kaiser, J. W., Kinne, S., Klimont, Z., Kloster, S., Lamarque, J.-F., Liousse, C., Masui, T., Meleux, F., Mieville, A., Ohara, T., Raut, J.-C., Riahi, K., Schultz, M. G., Smith, S. J., Thompson, A., Aardenne, J., Werf, G. R., and Vuuren, D. P.: Evolution of anthropogenic and biomass burning emissions of air pollutants at global and regional scales during the 1980–2010 period, Climatic Change, 109, 163–190, https://doi.org/10.1007/s10584-011-0154-1, 2011.
Hoesly, R. M., Smith, S. J., Feng, L., Klimont, Z., Janssens-Maenhout, G., Pitkanen, T., Seibert, J. J., Vu, L., Andres, R. J., Bolt, R. M., Bond, T. C., Dawidowski, L., Kholod, N., Kurokawa, J.-I., Li, M., Liu, L., Lu, Z., Moura, M. C. P., O'Rourke, P. R., and Zhang, Q.: Historical (1750–2014) anthropogenic emissions of reactive gases and aerosols from the Community Emissions Data System (CEDS), Geosci. Model Dev., 11, 369–408, https://doi.org/10.5194/gmd-11-369-2018, 2018.
Ikeda, K., Yamaji, K., Kanaya, Y., Taketani, F., Pan, X., Komazaki, Y., Kurokawa, J., and Ohara, T.: Sensitivity analysis of source regions to PM2.5 concentration at Fukue Island, Japan, J. Air. Waste Manag. Assoc., 64, 445–452, https://doi.org/10.1080/10962247.2013.845618, 2014.
IPCC: Climate Change 2013: The Physical Science Basis, Cambridge University Press, Cambridge, United Kingdom and New York, NY, USA, 2013.
Itahashi, S., Yumimoto, K., Kurokawa, J.-I., Morino, Y., Nagashima, T., Miyazaki, K., Maki, T., and Ohara, T.: Inverse estimation of NOx emissions over China and India 2005–2016: contrasting recent trends and future perspectives, Environ. Res. Lett., 14, 12402, https://doi.org/10.1088/1748-9326/ab4d7f, 2019.
Kanaya, Y., Taketani, F., Komazaki, Y., Liu, X., Kondo, Y., Sahu, L. K., Irie, H., and Takashima, H.: Comparison of black carbon mass concentrations observed by Multi-Angle Absorption Photometer (MAAP) and Continuous Soot-Monitoring System (COSMOS) on Fukue Island and in Tokyo, Japan, Aerosol Sci. Technol., 47, 1–10, 2013.
Kanaya, Y., Pan, X., Miyakawa, T., Komazaki, Y., Taketani, F., Uno, I., and Kondo, Y.: Long-term observations of black carbon mass concentrations at Fukue Island, western Japan, during 2009–2015: constraining wet removal rates and emission strengths from East Asia, Atmos. Chem. Phys., 16, 10689–10705, https://doi.org/10.5194/acp-16-10689-2016, 2016.
Klimont, Z., Kupiainen, K., Heyes, C., Purohit, P., Cofala, J., Rafaj, P., Borken-Kleefeld, J., and Schöpp, W.: Global anthropogenic emissions of particulate matter including black carbon, Atmos. Chem. Phys., 17, 8681–8723, https://doi.org/10.5194/acp-17-8681-2017, 2017.
Kondo, Y., Sahu, L., Kuwata, M., Miyazaki, Y., Takegawa, N., Moteki, N., Imaru, J., Han, S., Nakayama, T., Kim Oanh, N. T., Hu, M., Kim, Y. J., and Kita, K.: Stabilization of the mass absorption cross section of black carbon for filter-based absorption photometry by the use of a heated inlet, Aerosol Sci. Technol., 43, 741–756, https://doi.org/10.1080/02786820902889879, 2009.
Kondo, Y., Sahu, L., Moteki, N., Khan, F., Takegawa, N., Liu, X., Koike, M., and Miyakawa, T.: Consistency and traceability of black carbon measurements made by laser-induced incandescence, thermal-optical transmittance, and filter-based photoabsorption techniques, Aerosol Sci. Technol., 45, 295–312, https://doi.org/10.1080/02786826.2010.533215, 2011a.
Kondo, Y., Oshima, N., Kajino, M., Mikami, R., Moteki, N., Takegawa, N., Verma, R. L., Kajii, Y., Kato, S., and Takami, A.: Emissions of black carbon in East Asia estimated from the observations at a remote site in the East China Sea, J. Geophys. Res., 116, D16291, https://doi.org/10.1029/2011JD015637, 2011b.
Kondo, Y., Ram, K., Takegawa, N., Sahu, L., Morino, Y., Liu, X., and Ohara, T.: Reduction of black carbon aerosols in Tokyo: comparison of real-time observations with emission estimates, Atmos. Environ., 54, 242–249, 2012.
Kondo, Y., Moteki, N., Oshima, N., Ohata, S., Koike, M., Shibano, Y., Takegawa, N., and Kita, K.: Effects of wet deposition on the abundance and size distribution of black carbon in East Asia, J. Geophys. Res.-Atmos., 121, 4691–4712, 2016.
Kong, L., Tang, X., Zhu, J., Wang, Z., Fu, J. S., Wang, X., Itahashi, S., Yamaji, K., Nagashima, T., Lee, H.-J., Kim, C.-H., Lin, C.-Y., Chen, L., Zhang, M., Tao, Z., Li, J., Kajino, M., Liao, H., Wang, Z., Sudo, K., Wang, Y., Pan, Y., Tang, G., Li, M., Wu, Q., Ge, B., and Carmichael, G. R.: Evaluation and uncertainty investigation of the NO2, CO and NH3 modeling over China under the framework of MICS-Asia III, Atmos. Chem. Phys., 20, 181–202, https://doi.org/10.5194/acp-20-181-2020, 2020.
Krotkov, N. A., McLinden, C. A., Li, C., Lamsal, L. N., Celarier, E. A., Marchenko, S. V., Swartz, W. H., Bucsela, E. J., Joiner, J., Duncan, B. N., Boersma, K. F., Veefkind, J. P., Levelt, P. F., Fioletov, V. E., Dickerson, R. R., He, H., Lu, Z., and Streets, D. G.: Aura OMI observations of regional SO2 and NO2 pollution changes from 2005 to 2015, Atmos. Chem. Phys., 16, 4605–4629, https://doi.org/10.5194/acp-16-4605-2016, 2016.
Kurokawa, J. and Ohara, T.: Long-term historical trends in air pollutant emissions in Asia: Regional Emission inventory in ASia (REAS) version 3.1, Atmos. Chem. Phys. Discuss., https://doi.org/10.5194/acp-2019-1122, in review, 2019.
Kurokawa, J., Ohara, T., Morikawa, T., Hanayama, S., Janssens-Maenhout, G., Fukui, T., Kawashima, K., and Akimoto, H.: Emissions of air pollutants and greenhouse gases over Asian regions during 2000–2008: Regional Emission inventory in ASia (REAS) version 2, Atmos. Chem. Phys., 13, 11019–11058, https://doi.org/10.5194/acp-13-11019-2013, 2013.
Kutzner, R. D., von Schneidemesser, E., Kuik, F., Quedenau, J., Weatherhead, E. C., and Schmale, J.: Long-term monitoring of black carbon across Germany, Atmos. Environ., 185, 41–52, https://doi.org/10.1016/j.atmosenv.2018.04.039, 2018.
Lamarque, J.-F., Bond, T. C., Eyring, V., Granier, C., Heil, A., Klimont, Z., Lee, D., Liousse, C., Mieville, A., Owen, B., Schultz, M. G., Shindell, D., Smith, S. J., Stehfest, E., Van Aardenne, J., Cooper, O. R., Kainuma, M., Mahowald, N., McConnell, J. R., Naik, V., Riahi, K., and van Vuuren, D. P.: Historical (1850–2000) gridded anthropogenic and biomass burning emissions of reactive gases and aerosols: methodology and application, Atmos. Chem. Phys., 10, 7017–7039, https://doi.org/10.5194/acp-10-7017-2010, 2010.
Li, C., Zhang, Q., Krotkov, N. A., Streets, D. G., He, K., Tsay, S.-C., and Gleason, J. F.: Recent large reduction in sulfur dioxide emissions from Chinese power plants observed by the Ozone Monitoring Instrument, Geophys. Res. Lett., 37, L08807, https://doi.org/10.1029/2010gl042594, 2010.
Li, J., Wang, Z., Yamaji, K., Takigawa, M., Kanaya, Y., Taketani, F., Sugimoto, N., Pan, X., Hu, M., Meng, F., Sun, Y., and Yang, T.: Uplifting of Asian continental pollution plumes from the boundary layer to the free atmosphere over the Northwestern Pacific rim in spring, SOLA, 9, 40–44, 2013.
Li, M., Liu, H., Geng, G., Hong, C., Liu, F., Song, Y., Tong, D., Zheng, B., Cui, H., Man, H., Zhang, Q., and He, K.: Anthropogenic emission inventories in China: a review, Nat. Sci. Rev., 4, 834–866, 2017.
Miyakawa, T., Oshima, N., Taketani, F., Komazaki, Y., Yoshino, A., Takami, A., Kondo, Y., and Kanaya, Y.: Alteration of the size distributions and mixing states of black carbon through transport in the boundary layer in east Asia, Atmos. Chem. Phys., 17, 5851–5864, https://doi.org/10.5194/acp-17-5851-2017, 2017.
Miyazaki, Y., Kondo, Y., Sahu, L. K., Imaru, J., Fukushima, N., and Kanno,A.: Performance of a Newly Designed Continuous Soot MonitoringSystem (COSMOS), J. Env. Monit., 10, 1195–1201, https://doi.org/10.1039/b806957c, 2008.
Miyazaki, K., Eskes, H., Sudo, K., Boersma, K. F., Bowman, K., and Kanaya, Y.: Decadal changes in global surface NOx emissions from multi-constituent satellite data assimilation, Atmos. Chem. Phys., 17, 807–837, https://doi.org/10.5194/acp-17-807-2017, 2017.
Murphy, D. M., Chow, J. C., Leibensperger, E. M., Malm, W. C., Pitchford, M., Schichtel, B. A., Watson, J. G., and White, W. H.: Decreases in elemental carbon and fine particle mass in the United States, Atmos. Chem. Phys., 11, 4679–4686, https://doi.org/10.5194/acp-11-4679-2011, 2011.
Ohata, S., Kondo, Y., Moteki, N., Mori, T., Yoshida, A., Sinha, P. R., and Koike, M.: Accuracy of black carbon measurements by a filter-based absorption photometer with a heated inlet, Aerosol Sci. Tech., 53, 1079–1091, https://doi.org/10.1080/02786826.2019.1627283, 2019.
Oshima, N., Kondo, Y., Moteki, N., Takegawa, N., Koike, M., Kita, K., Matsui, H., Kajino, M., Nakamura, H., Jung, J. S., and Kim, Y. J.: Wet removal of black carbon in Asian outflow: Aerosol Radiative Forcing in East Asia (A-FORCE) aircraft campaign, J. Geophys. Res., 117, D03204, https://doi.org/10.1029/2011JD016552, 2012.
Petzold, A. and Schönlinner, M.: Multi-angle absorption photometry – a new method for the measurement of aerosol light absorption and atmospheric black carbon, J. Aerosol Sci., 35, 421–444, 2004.
Qu, Z., Henze, D. K., Li, C., Theys, N., Wang, Y., Wang, J., Wang, W., Han, J., Shim, C., Dickerson, R. R., and Ren, X.: SO2 emission estimates using OMI SO2 retrievals for 2005–2017, J. Geophys. Res.-Atmos., 124, 8336–8359, https://doi.org/10.1029/2019JD030243, 2019.
Saturno, J., Pöhlker, C., Massabò, D., Brito, J., Carbone, S., Cheng, Y., Chi, X., Ditas, F., Hrabě de Angelis, I., Morán-Zuloaga, D., Pöhlker, M. L., Rizzo, L. V., Walter, D., Wang, Q., Artaxo, P., Prati, P., and Andreae, M. O.: Comparison of different Aethalometer correction schemes and a reference multi-wavelength absorption technique for ambient aerosol data, Atmos. Meas. Tech., 10, 2837–2850, https://doi.org/10.5194/amt-10-2837-2017, 2017.
Skamarok, W. C., Klemp, J. B., Dudhia, J., Gill, D. O., Barker, D. M., Duda, M. G., Huang, X. Y., Wang, W., and Powers, J. G.: A description of the Advanced Research WRF version 3, NCAR Technical Note NCAR/TN-4751STR, 2008.
Stein, A. F., Draxler, R. R, Rolph, G. D., Stunder, B. J. B., Cohen, M. D., and Ngan, F.: NOAA's HYSPLIT atmospheric transport and dispersion modeling system, B. Am. Meteor. Soc., 96, 2059–2077, https://doi.org/10.1175/BAMS-D-14-00110.1, 2015.
Sudo, K., Takahashi, M., Kurokawa, J., and Akimoto, H.: CHASER: A global chemical model of the troposphere – 1. Model 10description, J. Geophys. Res.-Atmos., 107, 20, https://doi.org/10.1029/2001jd001113, 2002.
Takami, A., Miyoshi, T., Shimono, A., and Hatakeyama, S.: Chemical composition of fine aerosol measured by AMS at Fukue Island, Japan during APEX period, Atmos. Environ., 39, 4913–4924, 2005.
Virkkula, A., Makela, T., Hillamo, R., Yli-Tuomi, T., Hirsikko, A., Hameri, K., and Koponen, I. K.: A simple procedure for correcting loading effects of aethalometer data, J. Air Waste Manag. Assoc., 57, 1214–1222, https://doi.org/10.3155/1047-3289.57.10.1214, 2007.
Yamagami, M., Ikemori, F., Nakashima, H., Hisatsune, K., and Osada, K.: Decreasing trend of elemental carbon concentration with changes in major sources at Mega city Nagoya, Central Japan, Atmos. Environ., 199, 155–163, https://doi.org/10.1016/j.atmosenv.2018.11.014, 2019.
Yamaji, K., Ikeda, K., Irie, H., Kurokawa, J.-I., and Ohara, T.: Influence of model grid resolution on NO2 vertical column densities over East Asia, J. Air Waste Manag. Assoc., 64, 436–444, 2014.
Yin, L., Du, P., Zhang, M., Liu, M., Xu, T., and Song, Y.: Estimation of emissions from biomass burning in China (2003–2017) based on MODIS fire radiative energy data, Biogeosciences, 16, 1629–1640, https://doi.org/10.5194/bg-16-1629-2019, 2019.
Zanatta, M., Gysel, M., Bukowiecki, N., Müller, T., Weingartner, E., Areskoug, H., Fiebig, M., Yttri, K. E., Mihalopoulos, N., Kouvarakis, G., Beddows, D., Harrison, R. M., Cavalli, F., Putaud, J. P., Spindler, G., Wiedensohler, A., Alastuey, A., Pandolfi, M., Sellegri, K., Swietlicki, E., Jaffrezo, J. L., Baltensperger, U., and Laj, P.: A European aerosol phenomenology-5: Climatology of black carbon optical properties at 9 regional background sites across Europe, Atmos. Environ., 145, 346–364, https://doi.org/10.1016/j.atmosenv.2016.09.035, 2016.
Zhang, Q., Streets, D. G., Carmichael, G. R., He, K. B., Huo, H., Kannari, A., Klimont, Z., Park, I. S., Reddy, S., Fu, J. S., Chen, D., Duan, L., Lei, Y., Wang, L. T., and Yao, Z. L.: Asian emissions in 2006 for the NASA INTEX-B mission, Atmos. Chem. Phys., 9, 5131–5153, https://doi.org/10.5194/acp-9-5131-2009, 2009.
Zhang, Y., Li, Y., Guo, J., Wang, Y., Chen, D., and Chen, H.: The climatology and trend of black carbon in China from 12-year ground observations, Clim. Dynam., 53, 5881–5892, https://doi.org/10.1007/s00382-019-04903-0, 2019.
Zheng, B., Tong, D., Li, M., Liu, F., Hong, C., Geng, G., Li, H., Li, X., Peng, L., Qi, J., Yan, L., Zhang, Y., Zhao, H., Zheng, Y., He, K., and Zhang, Q.: Trends in China's anthropogenic emissions since 2010 as the consequence of clean air actions, Atmos. Chem. Phys., 18, 14095–14111, https://doi.org/10.5194/acp-18-14095-2018, 2018.