the Creative Commons Attribution 4.0 License.
the Creative Commons Attribution 4.0 License.
Direct links between hygroscopicity and mixing state of ambient aerosols: estimating particle hygroscopicity from their single-particle mass spectra
Xinning Wang
Xingnan Ye
Jianmin Chen
Xiaofei Wang
Tzung-May Fu
Chongxuan Liu
Hygroscopicity plays crucial roles in determining aerosol optical properties and aging processes in the atmosphere. We investigated submicron aerosol hygroscopicity and composition by connecting an aerosol time-of-flight mass spectrometer (ATOFMS) in series to a hygroscopic tandem differential mobility analyzer (HTDMA), to characterize hygroscopicity and composition of ambient aerosols in Shanghai, China. The HTDMA–ATOFMS data suggested that particle types, including biomass burning, elemental carbon (EC), dust/ash, organic particles, cooking particles and sea salt, were shown to have distinct hygroscopicity distributions. Peak intensities in particle spectra were found to be nonlinearly correlated with hygroscopicity, and the correlations were variant with particle types. Based on the measured hygroscopicity–composition relations, we developed a statistical method to estimate ambient particle hygroscopicity just from their mass spectra. The method was applied to another ambient ATOFMS dataset sampled from 12 to 28 September 2012 in Shanghai. The estimated hygroscopicity suggested that ambient particles were present in three apparent hygroscopicity modes, whose growth factors peaked at 1.05, 1.42 and 1.60 (85 % relative humidity, RH). The estimated growth factor (GF) were divided into four bins as <1.1, 1.1–1.3, 1.3–1.5 and >1.5 to represent the nearly hydrophobic (NH), less-hygroscopic (LH), more-hygroscopic (MH) and sea salt (SS) modes. Number contributions of particle types to hygroscopicity modes showed consistent results with the HTDMA–ATOFMS experiment. Based on the combined information on particle composition, hygroscopicity, air mass back trajectories and ambient pollutant concentrations, we inferred that the NH, LH, MH and SS modes were characterized by primary organic aerosol (POA) ∕ EC, secondary organic aerosol (SOA), secondary inorganic aerosol (SIA) and salt compositions, respectively. The proposed method would provide additional information to the study of particle mixing states, source identification and visibility variation.
- Article
(1529 KB) - Full-text XML
-
Supplement
(1126 KB) - BibTeX
- EndNote
Atmospheric particles have critical impacts on climate and the environment. They affect climate by directly interacting with sunlight and changing the energy balance of Earth's atmosphere (Facchini et al., 1999; Lohmann and Feichter, 2005). Aerosol particles also act as cloud condensation nuclei or ice nuclei and impact cloud formation (Lohmann and Feichter, 2005). Aerosol particles provide surfaces for heterogeneous reactions to occur and act as the sink for many atmospheric reactions (Gard et al., 1998; Qiu and Zhang, 2013), which are of significance to air quality, visibility and human health. The climate-relevant and other properties of aerosols are largely determined by their hygroscopicity. In atmospheric conditions the hygroscopic growth transforms particles into microdroplets and their optical effects are altered importantly (Cheng et al., 2008; Qu et al., 2015), which further impacts particle aging processes and visibility degradation (Qu et al., 2015; Liu et al., 2012; Qiu and Zhang, 2013; Chen et al., 2012).
Atmospheric particles are a mixture of a complicated variety of chemical compounds. The bulk chemical composition of particulate matter (PM) usually refers to its dry composition. However, in ambient conditions the particulate water is also an important constitution of PM which has not been accounted for in conventional gravitational analysis. The mass of particulate water may be much larger than the total mass of dried PM at elevated relative humidities (RHs; Swietlicki et al., 2008). The factors that affect water contents in particles include the particle hygroscopicity, the particle size distributions and ambient RH. The hygroscopicity parameter determines the particle's ability to grow in a humid environment, which is directly related to particle composition and size. To accurately predict particulate water content, a detailed knowledge of particle hygroscopicity and composition is needed (Gysel et al., 2007; Sjogren et al., 2008; Laborde et al., 2013; Healy et al., 2014).
Aerosol hygroscopicity can be quantitatively measured by techniques such as the hygroscopic tandem differential mobility analyzer (HTDMA) (Swietlicki et al., 2008). Previous studies measured aerosol hygroscopicity and chemical composition simultaneously by deploying HTDMA and chemical composition measurements in parallel (Gysel et al., 2007; Sjogren et al., 2008; Laborde et al., 2013). The measured hygroscopicity was compared with the reconstructed values using the mixing rules of variant compositions (Gysel et al., 2007). The hygroscopicity reconstructed in this way represents the averaged hygroscopicity of ensembled particles and therefore could not reflect the mixing states of particles (Healy et al., 2014). However, the HTDMA measurements suggested that several hygroscopicity modes exist simultaneously, which evidenced the external mixing state of atmospheric particles. HTDMA hygroscopicity modes generally fell into four categories: nearly hydrophobic (NH), less-hygroscopic (LH), more-hygroscopic (MH) and sea salt, with their center growth factors (GFs, 90 % RH) in the 1.0–1.11, 1.11–1.33, >1.33 and >1.8 ranges, respectively (Swietlicki et al., 2008). To investigate the chemical nature of these hygroscopicity modes, it is better to connect HTDMA and composition measurement techniques in tandem, since more direct connection between hygroscopicity and composition could be established in this way (Buzorius et al., 2002; Zelenyuk et al., 2008; Herich et al., 2008; Laborde et al., 2013). For composition measurement techniques, single-particle mass spectrometers are preferred since they are sensitive to particles of low concentrations in the HTDMA outflow (Herich et al., 2008, 2009), and the particle mixing state information is preserved during analysis (Healy et al., 2014).
Only a few studies have reported simultaneous characterization of hygroscopicity and composition using the tandem method (Herich et al., 2008, 2009; Buzorius et al., 2002; Zelenyuk et al., 2008). Zelenyuk et al. (2008) connected a single-particle mass spectrometer SPLAT with the HTDMA to demonstrate the capability of this system to derive quantitative information on aerosol hygroscopicity, composition and effective density (Zelenyuk et al., 2008). Herich et al. (2008) firstly applied the tandem HTDMA and aerosol time-of-flight mass spectrometer (ATOFMS) system to characterize particle composition of different hygroscopicity (Herich et al., 2008, 2009). A large portion of the less hygroscopic modes were found to be contributed by organics and combustion species at both the urban and remote sites, while the sulfates and nitrates were present in almost all particles independent of hygroscopicity. Similar findings were also observed in our preliminary characterization using HTDMA–ATOFMS in Shanghai city (Wang et al., 2014), except higher nitrate and sulfate intensities were found in hygroscopic particles in our study. However, the preliminary dataset was not sufficiently large since only a few GFs were characterized in that study (GFs of 1.05–1.1, 1.3, 1.4 and 1.5 at 85 % RH). The primary objective of the present study is to establish more complete connections between hygroscopicity and single-particle signatures, which could be further utilized to predict hygroscopicity of ambient particles. We conducted a comprehensive HTDMA–ATOFMS experiment with the particle GF varied in a more complete range (0.9–1.7, 85 % RH), which accounted for the main number fraction of atmospheric particles in the urban atmosphere (Liu et al., 2014, 2011; Ye et al., 2013). Based on the HTDMA–ATOFMS data, we further developed and tested a method to estimate the hygroscopicity of ambient particles analyzed by ATOFMS.
2.1 HTDMA
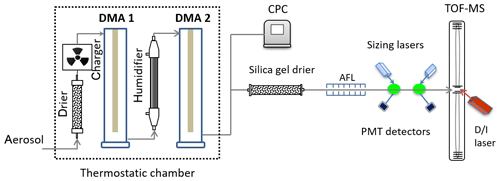
The custom-built HTDMA (Ye et al., 2009) consists of two DMAs and a humidifier connected in series (Fig. 1). Aerosol was dried before entering the HTDMA (RH − 10 %) by a diffusional silica gel tube. The dried aerosol reached charge equilibrium in a Kr-85 neutralizer. The DMA1 (model 3081, TSI Inc.) selected particles by electrical mobility size as Ddry. The monodisperse particles from DMA1 grew in a Nafion humidifier (RH = 85 %). The sizes of humidified particles DRH was determined by the second DMA connected by a condensation particle counter (CPC) to measure their concentrations. The sheath flow rate in DMA2 (3 L min−1) was regulated by a mass flow controller. The RH of the DMA2 sheath flow was managed to match the humidifier (85 % RH). The HTDMA was installed in a thermostatic chamber in which temperature was controlled to 25±0.1∘. The total aerosol flow was 0.4 L min−1 (the sum flow rate of the CPC was 0.3 L min−1 and that of the ATOFMS was 0.1 L min−1). Aerosol residence time in the humidifier was ∼10 s. Polystyrene latex (PSL) spheres of known size and (NH4)2SO4 salt were used to calibrate the HTDMA. The HTDMA uncertainty in GF determination is ±0.05 (Ye et al., 2009; Swietlicki et al., 2008).
2.2 ATOFMS
The schematic of the ATOFMS (model 3800-100, TSI. Inc) is illustrated in Fig. 1. Particles were drawn into ATOFMS through a 0.1 mm orifice and focused into a narrow beam through successive expansions and contractions in the aerodynamic focusing lens (AFL). Particles leaving the AFL obtain velocities depending on their aerodynamic sizes. In the ATOFMS sizing region particles pass through two orthogonally oriented continuous lasers (Nd:YAG, 532 nm) and laser light was scattered. The scattered light generates pulses in two photomultiplier tubes (PMTs) and the signal delay between the two pulses is used to calculate particle velocity. Particle velocity was also used to trigger the ionization laser (Nd:YAG, 266 nm) at the exact time to ionize particles. The negative and positive ions generated from particles are recorded by a dual polar time-of-flight mass spectrometer. More details of ATOFMS were described elsewhere (Su et al., 2004).
The ATOFMS data were analyzed within the YAADA toolkit (http://www.yaada.org/, last access: 10 April 2018). Particles showing similar composition were classified by the adaptive-resonance-theory-based clustering algorithm (ART-2a) (Song et al., 1999). The ART-2a algorithm parameters were set to a vigilance factor of 0.85, learning rate of 0.05 and number of iterations of 20. The clusters generated by the ART-2a were manually regrouped into major types by considering their common composition patterns. The obtained particle types were labeled by referring to previous single-particle characterization studies (Spencer et al., 2006; Silva et al., 1999; Sullivan et al., 2007; Gaston et al., 2011; Qin et al., 2012).
2.3 Sampling description
The HTDMA–ATOFMS characterization was carried out at the building of the Department of Environmental Science and Technology at Fudan University (31∘18′ N, 121∘29′ E) from 26 February to 7 March 2014. The aerosol inlet was installed at the building roof about 6 m above the ground. The Fudan campus was influenced by local emissions sources from transportation, residential, business and cooking activities from surrounding areas which can be viewed as an urban environment. A period of ambient ATOFMS data, which persisted from 12 to 28 September 2012, was recorded at the same site on the Fudan campus. Ambient air quality data of pollutant concentrations (PM2.5, O3 and SO2) in Shanghai city were provided by the Shanghai Environmental Monitoring Center (SEMC).
The sampling procedure was similar to our previous study (Wang et al., 2014). The typical HTDMA GF distributions at this site showed two separated hygroscopicity modes. In 85 % RH conditions, the two modes were present with center GFs of 1.05 and 1.45, which were conventionally classified as near-hydrophobic (NH) and more-hygroscopic (MH) modes, respectively (Swietlicki et al., 2008). These modes were normally present elsewhere in China and other areas (Liu et al., 2011; Swietlicki et al., 2008). The HTDMA data suggest that the majority of particles (>97 %) were of GFs in the 0.9–1.7 range. Consequently, particles in this GF range were characterized by the HTDMA–ATOFMS with a GF step of 0.1.
Table 1Statistics of the DRH, GF, sampling duration and the number of chemically analyzed particles from the ATOFMS (Ddry=250 nm, RH = 85 %).

To characterize the desired GFs, the two DMAs in HTDMA were set at certain diameters Ddry and DRH according to . The HTDMA–ATOFMS system was kept sampling until a sufficient number of particles (>200) were analyzed by ATOFMS for each GF setting (Table 1). We fixed the DMA1 (Ddry) diameter to 250 nm, while the DMA2 diameter (DRH) was set as shown in Table 1. The number of particle spectra in ATOFMS was affected by ambient particle concentrations of certain GFs. Since particle concentrations downstream of the HTDMA were very low, longer sampling was maintained to record a sufficient number of spectra in the ATOFMS (see the CPC concentrations in Fig. S1 in the Supplement). The ATOFMS instrument used in this study has a size detection range of 100–3000 nm. Considering this, the detection efficiency for 250 nm is expected to be low, as 250 nm is on the lower end of the ATOFMS detection range. However, in the HTDMA–ATOFMS experiment we selected 250 nm particles, because the concentrations of larger particles were found to decrease further in scanning mobility particle sizer (SMPS) size distributions. Therefore, the selection of Ddry as 250 nm is a compromise between detection efficiency and particle concentrations (Wang et al., 2014; Herich et al., 2008). With the measured ATOFMS particle numbers and CPC concentrations, the detection efficiency of the ATOFMS was calculated to be at the dry size. In Fig. S2 we presented ATOFMS detection efficiencies together with the particle hit rate (hit particles divided by total sized particles) at different growth factors. Generally, the detection efficiencies suggested variations at different GFs. We found higher detection efficiencies in the moderate GF range (1.2–1.4) and higher hit rates in the < 1.3 GF range, which is probably caused by variations in compositions with GF (Hatch et al., 2014).
2.4 Estimation of ambient particle hygroscopicity
Particles in the HTDMA–ATOFMS dataset are comparable to ambient ATOFMS particles. Particle types typically present in the HTDMA–ATOFMS study were also present in ambient ATOFMS studies. Therefore, it is possible to assign similar GFs to ambient particles if they have similar composition. The estimation method was firstly performed by evaluating spectra similarities between the ATOFMS and HTDMA–ATOFMS datasets (dot products of normalized spectra). The ATOFMS is known to have higher detection efficiencies toward some metals (such as Na, K, Fe), resulting in inappropriately large peaks in particle spectra. We solved the bias by taking the 0.5 power treatment to peak intensities (Rehbein et al., 2012). In this treatment the larger peaks were suppressed to some degree while smaller peaks increased their weight relatively. The 0.5 power treatment of peaks intensity was applied because it offered better results in the estimation of hygroscopicity than without it, as discussed in the Supplement (Fig. S3). In the second step we searched matched particles from the HTDMA–ATOFMS dataset showing the best similarities with the ambient particles (dot products in 95 %–100 % range of the maximum dot product). In this study we set a threshold similarity (0.7 dot product) in matching particles, as was required in the ART-2a algorithm (Song et al., 1999). Ambient particles with matching dot products <0.7 were excluded from analysis of the estimated GF. The similarity data suggest that 96.2 % of the matching similarities are >0.7, and 79 % of them are >0.8 (Fig. S4). Since each of the matched particles in the HTDMA–ATOFMS dataset was associated with a GF, we obtained a collection of the matching GFs (0.9–1.7 in 0.1 step). The estimated GF of the ambient particle was determined to be the weighted average of the matched GFs, with the weights being the number percentage of matched particles in each GF bin:
where GFpred is the estimated GF of ambient particle, GFi is GF value from 0.9 to 1.7 interspaced by 0.1 and Fi is number percentages of the matched particles in each GF bin.
The estimation process relied on a statistical approach in estimating the most probable hygroscopicity for ambient particles, rather than by inferring particle compositions of single particles (Healy et al., 2014). The latter method derived quantitative concentrations of various compositions from peak intensities, which were then applied to predict particle hygroscopicity using the Zdanovskii–Stokes–Robinson mixing rules. Some assumptions including material densities were needed in that method. As a comparison, we inferred hygroscopicity by matching particles with HTDMA–ATOFMS particles of known hygroscopicity. Therefore, the estimated GFs were derived from the measured GF, and the assumptions of composition densities and detection sensitivities in ATOFMS are obviated.
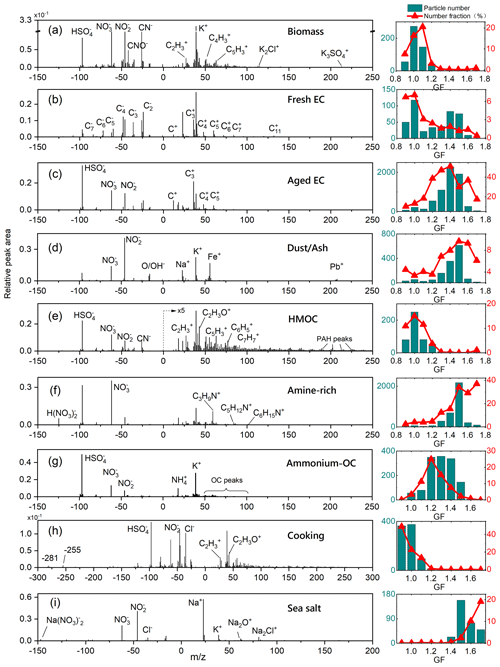
Figure 2(Left panel) Averaged particle mass spectra of the major particle types detected in HTDMA–ATOFMS characterization. Peaks of significance were labeled. Right panels show the particle numbers of each type (left axis) and their relative number fractions in total particles (right axis) as a function of GF.
The uncertainties in the GF prediction in this method were estimated. The uncertainties in eventual GFs may stem from the intrinsic uncertainties in HTDMA–ATOFMS techniques. For the estimation algorithm itself, only a few parameters exist that are capable of affecting the estimated GF. With the 0.5 power treatment to peak intensities, the only parameter that could influence the estimated GF would be the matching criteria of particles. We have adjusted the matching criteria of 95 %–100 % maximum dot products to 90 %–100 % and 98 %–100 %, and the variations in particle GFs were inspected (Fig. S5). Based on the variations in the obtained GF, we estimated that the uncertainty in GF estimation is within ±0.15.
3.1 Single-particle composition and hygroscopicity in the HTDMA–ATOFMS experiment
3.1.1 Hygroscopicity distribution of different particle types
The particles in the HTDMA–ATOFMS dataset were classified into major types based on their mass spectra. The ART-2a algorithm was applied to particle clustering and then similar clusters were combined. The majority of particles were eventually classified into nine types including biomass, fresh elemental carbon (EC), aged EC, dust/ash, high-mass organic carbon (HMOC), amine-rich, ammonium and organic carbon (OC), cooking and sea salt. In Fig. 2 we present the average spectra of each type and their numbers detected in each GF bin. Since the total number of detected particles in GF bins was not equal (Table 1), we also present the particle numbers normalized by the total numbers to indicate their detection probability in each GF bin (Fig. 2). The hygroscopicity of particle types showed different distribution patterns with GF. The hygroscopicity characters of biomass, EC, dust/ash, HMOC and amine-rich types were described previously, and their hygroscopicity has shown a consistent trend with the previous characterization (Wang et al., 2014).
The biomass particles produced characteristic peaks of −26(CN), −42(CNO), −59(C2H3O2) and −73(C3H5O2) and a dominant peak at 39(K) and related peaks at 113(K2Cl) or 213(K3SO4) (Silva et al., 1999; Zauscher et al., 2013; Pratt and Prather, 2009). Biomass particles displayed low hygroscopicity since the majority of them were present in the < 1.2 GF range, with the peak detection probability at a GF of 1.1 (Fig. 2a). The hygroscopicity of biomass particles is consistent with other HTDMA measurements of biomass particles (Rissler et al., 2006; Laborde et al., 2013). The hygroscopicity of biomass particles in the ambient environment were similarly detected in the HTDMA–SP2, which suggested the center GF of 1.1–1.2 of biomass particles (at 90 % RH), corresponding to the GF of 1.06–1.13 at 85 % RH (Laborde et al., 2013).
The EC particles were detected by a series of elemental carbon peaks at Cn () in the negative and positive spectra (Ault et al., 2010; Spencer et al., 2006; Toner et al., 2008). EC particles were distributed broadly from nearly hydrophobic (NH) mode to more-hygroscopic (MH) mode. However, the mass spectra of hydrophobic and hygroscopic EC particles were different. As shown in Fig. 2b–c, the mass spectra of hygroscopic EC particles produced stronger secondary peaks (−62, −97, 18) than hydrophobic EC particles, consistent with the significant fractions of secondary matter in hygroscopic EC (Laborde et al., 2013). According to their hygroscopicity distributions, the general EC type was divided into fresh EC and aged EC. The mass spectra of fresh EC suggested they were freshly emitted without significant secondary coatings (Weingartner et al., 1997; Laborde et al., 2013; Herich et al., 2009). Peak intensity trends of 62, −97, 18 and other related peaks at different GFs were summarized for EC particles (Fig. S6). Based on the statistics of peak intensities, we found clear increasing trends of secondary peak intensities in the 0.9–1.2 GF range, but not in all GFs (Laborde et al., 2013; Herich et al., 2008).
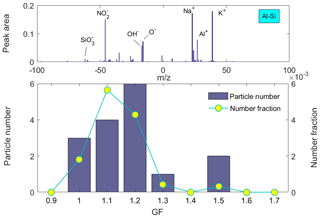
Dust/ash particles produced inorganic peaks of salts and metals (Gaston et al., 2017; Ault et al., 2011; Sullivan et al., 2007). Most dust/ash particles were detected in the hygroscopic range (GF > 1.3). Most dust/ash particles were internally mixed with nitrate. Within the general dust/ash type there are many sub-clusters according to specific association of metal peaks in particle spectra. Some of the clusters showed characteristic hygroscopicity distributions which offered values in the source apportionment of these particles. As an illustration, we presented the mass spectra and hygroscopicity distribution of the Al-Si cluster in Fig. 3. The mass spectra of Al-Si particles showed stronger aluminum (27Al+) and silicate (−76) peaks in their positive and negative spectra, respectively. Particle number distribution of Al-Si particles suggested that they were detected with the highest probability at a GF of 1.1. In the preliminary study we identified the similar Al-Si particles exclusively in NH mode (Wang et al., 2014). Based on their hygroscopicity distribution, we assumed the Al-Si particles are soil dusts according to their reported low hygroscopicity (Koehler et al., 2009).
The spectra of HMOC particles showed obvious organic peaks in the higher m∕z range (>150). Some HMOC particles produce obvious polycyclic aromatic hydrocarbon (PAH) peaks in positive spectra and high mass signals in negative spectra. The mass spectra of HMOCs suggested they were generated from combustion, including traffic emissions (Dall'Osto et al., 2013; Toner et al., 2008). The majority of HMOC particles displayed low hygroscopicity (GF < 1.2) (Wang et al., 2014; Herich et al., 2008).
Amine-rich particles produced amine peaks at +59(C3H9N), +86(C5H12N) and +101(C6H15N) (Angelino et al., 2001; Pratt et al., 2009). Particulate amine formation was favored in low temperatures and higher-humidity conditions (Huang et al., 2012; Zhang et al., 2012). The elevated amine particle fractions may be related to the low temperature (6∘) and high humidity (78 % RH) during this experiment. Both the preliminary and present studies identified the hydrophilicity of amine-rich particles, with the highest number contributions to the > 1.5 GF range (Wang et al., 2014). Short alkyl chain aliphatic amines are known to have relatively high vapor pressures and be basic in nature; their presence in particles indicates they most likely occur in the form of aminium salts, whose formation is greatly favored in the presence of particulate water (Angelino et al., 2001; Chen et al., 2019). Mass spectra of amine-rich particles suggest that 77 % of them were internally mixed with sulfate or nitrate.
With the expanded GF range and sampling durations, we identified other particle types of specific hygroscopic patterns, including ammonium–OC, cooking and sea salt particles in this study. The ammonium–OC particles demonstrated some similarities with biomass particles. There was a predominant potassium peak 39K and many organic peaks in the positive mass spectra, as shown in Fig. 2. Additionally, stronger 18 peaks for ammonium and sulfate (−97HSO4) were also present in these particles. The typical −26CN− and −42CNO− peaks observed for biomass particles were absent or very weak, suggesting the composition differences between ammonium–OC and biomass particles (Silva et al., 1999; Zauscher et al., 2013; Pratt and Prather, 2009). The hygroscopicity of the ammonium–OC particles was unique since they have the largest contributions to the moderate GF range (GF of 1.1–1.3), with the maximum contribution found at GF = 1.2. The GF of ammonium–OC particles suggests that they can be categorized as LH mode (Swietlicki et al., 2008). A prior ATOFMS study identified that ammonium–OC particles were from agricultural sources and found most of them were present in higher-photochemical-oxidation periods (Qin et al., 2012), consistent with the prominent secondary peaks of ammonium found in this study. It is likely the organics in this type are secondary since the GF of 1.2 is close to the hygroscopicity of secondary organic aerosol (SOA) (GF = 1.24 at 90 % RH) (Gysel et al., 2007; Sjogren et al., 2008). We inferred that ammonium was not contributing major fractions to ammonium–OC particles, since ammonium salts were very hydrophilic while ammonium–OC demonstrates only moderate hygroscopicity.
Cooking is an important source of primary organic aerosol (POA) in urban regions (Crippa et al., 2013; Dall'Osto and Harrison, 2012). Zhang et al. estimated that up to 35 % of POA is attributed to cooking aerosol during meal hours (Zhang et al., 2007). Cooking particles around the site was likely to be significant considering that the Fudan campus is located in a heavily populated area. The ATOFMS characterization of cooking particles has been performed previously (Dall'Osto et al., 2013). The marker peaks at −255(C16H32O2, palmitic acid) and −281 (C17H34O2, oleic acid) in the negative spectra were used to identify cooking particles (Dall'Osto and Harrison, 2012; Silva, 2000). As shown in Fig. 2h, cooking particles demonstrated very low hygroscopicity and were detected exclusively in the < 1.1 GF range. It is noted that GF of 0.9 does not necessarily indicate a particle shrinkage in 85 % RH. Cooking particles might become more spherical in elevated RH, resulting in smaller mobility diameters. This phenomenon was observed for other organic particles (Shi et al., 2012; Pratt and Prather, 2009). The low hygroscopicity of cooking particles is consistent with the enriched organic as indicated by the fatty acids (−171, −255, −279, −281) and hydrocarbon organic aerosol (HOA) (+55, +57) peaks in the spectra. The detection of cooking particles in NH mode complemented the conclusion that combustion processes are mainly responsible for NH particles (Swietlicki et al., 2008; Laborde et al., 2013; Herich et al., 2009).
With particles of higher GF being analyzed in this experiment, we also identified the sea salt particle, which constitutes an important particle type in ambient air in coastal areas (Herich et al., 2009; Gard et al., 1998). Sea salt mass spectra contain a dominant sodium peak 23Na+ and other sodium cluster peaks at 62Na2O+, 63Na2OH+ and 81Na2Cl+ (Gaston et al., 2017). The hydrophilicity of sea salt makes it clear that they were mostly detected in the largest GF bins (>1.5), with their number fractions increased from GF of 1.5 to 1.7 (Fig. 2). HTDMA studies in a marine environment have shown that sea salt particles constitute a separated hygroscopicity mode of the largest GF (Swietlicki et al., 2008), which is generally consistent with the observed GF range in the experiment. However, the observed sea salt particle hygroscopicity is somewhat different from the HTDMA–ATOFMS characterization in a subarctic region, where sea salt particles were found mainly in the 1.3–1.5 GF range at 82 % RH (Herich et al., 2009). We inferred that sea salt hygroscopicity properties are variant with locations, and other factors (organics in seawater, marine microbiological conditions, aging) should be considered (Facchini et al., 2008; Randles et al., 2004).
3.1.2 Peak intensity variations with GF
Apart from particle number distributions, the HTDMA–ATOFMS dataset provided another aspect of information regarding peak intensities with GF. In this study, we used relative peak intensities (peak areas normalized by the total areas in the spectrum) to investigate the relation between peak intensities and particle GF. Generally, the responses of peak intensity to GF variation were found to be nonlinear, since they were correlated only within specific GF ranges. A simple trend applicable to the whole GF range was not observed.
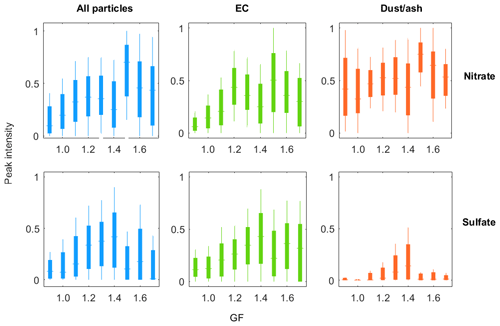
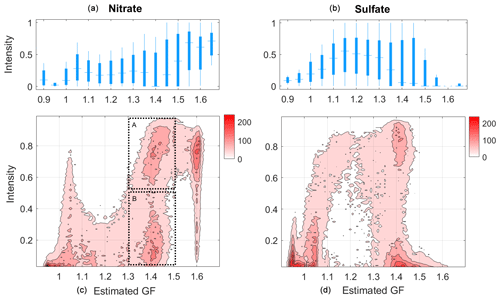
Figure 4Statistics of nitrate and sulfate peak intensities (minimum, 25th percentile, median, 75th percentile, maximum) with GF in the HTDMA–ATOFMS experiment.
We presented the statistics of peak intensity of nitrate (46, 62, 125H(NO3)) and sulfate (80, 97) which were known to be critical to particle hygroscopicity (Fig. 4). As previously observed, the nitrate and sulfate peaks were present in the majority of particles in all GF bins (Herich et al., 2009, 2008; Wang et al., 2014). However, peak intensities of nitrate and sulfate were indeed stronger in hygroscopic particles than hydrophobic particles. In Fig. 4 we observed positive correlation between nitrate and sulfate intensities and GF in the < 1.2 GF range, suggesting the contribution of nitrate and sulfate to particle hygroscopicity in the low GF range (Fig. 4). However, in the higher GF range (GF of 1.3–1.5), nitrate and sulfate peaks seem to reach a plateau with unclear dependence on GF. Nitrate and sulfate were known to contribute large fractions of particle mass in MH particles (Swietlicki et al., 2008; Laborde et al., 2013; Liu et al., 2014). The unclear trend of nitrate and sulfate with GF seems to suggest that nitrate and sulfate were in stable ratios since nitrate and sulfate peaks were dominating peak areas in negative spectra. For particles of even higher GF, differences were observed between GF ranges of 1.3–1.5 and 1.5–1.7 in that stronger nitrate and weaker sulfate peaks were detected in the 1.3–1.5 GF range. Particle classification suggests that this general characteristic also varies for different particle types. The same statistics for EC and dust/ash particles were presented in Fig. 4. Compared with EC particles, smaller sulfate and stronger nitrate peaks were found in dust/ash spectra, and the observed trend in total particles was less obvious in dust/ash. These facts highlight the nonlinearity between peak intensities and GF and that particle types should also be considered in describing peak intensities.
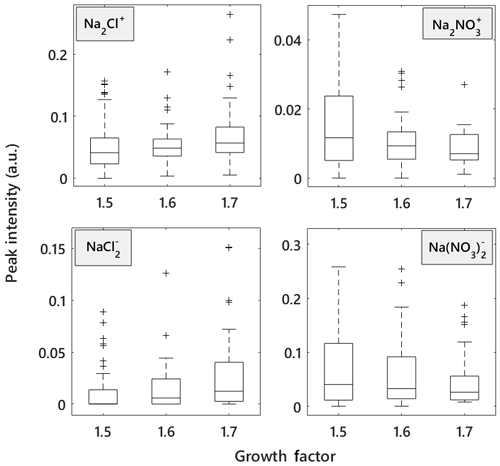
Figure 5Statistics of peak intensities in sea salt particle mass spectra in the 1.5–1.7 GF range. The statistics include minimum, 25th percentile, median, 75th percentile, maximum and outliers for each GF bin.
The analysis of peak intensities with GF can disclose some atmospheric processes happening in aerosol. We take sea salt as an illustration. Sea salt particles were known to react with atmospheric nitric acid, with NaCl in fresh sea salt being transformed into NaNO3 in the reacted sea salt (Gard et al., 1998). This composition transformation is indicated in corresponding changes of NaCl and NaNO3 peak intensities in particle spectra. The unreacted sea salt particles tend to produce larger peaks of Na2Cl+ and in spectra (Gaston et al., 2011; Prather et al., 2013). In particle spectra of reacted sea salt, the NaCl peaks (Na2Cl+, ) decrease while NaNO3 peaks (, Na(NO3)) increase. We presented peak intensities of sea salt in the 1.5–1.7 GF range where sea salt particles were detected with the largest numbers (Fig. 5). We found a positive correlation between NaCl peak intensity and GF and a negative correlation for NaNO3 peaks. Therefore, the HTDMA–ATOFMS data showed that reacted sea salt reduced hygroscopicity (Herich et al., 2009; Gaston et al., 2018). A laboratory HTDMA study suggested that NaCl and NaNO3 deliquesce at 85 % RH and that the NaNO3 (GF of 1.8) is less hygroscopic than NaCl (GF of 2.2) (Hu et al., 2010). The reduced hygroscopicity of sea salt is in line with the GF of sodium salts. However, the sea salt hygroscopicity (GF of 1.5–1.7) was smaller than pure NaNO3 salt (supposing fully reacted), suggesting that the chemical transformation alone is not sufficient to account for the observed hygroscopicity of sea salt. We hypothesize that other compositions such as organics were mixed into sea salt and contributed to the reduction of sea salt hygroscopicity (Gaston et al., 2011; Randles et al., 2004; Facchini et al., 2008).
3.2 Predictability of hygroscopicity from particle mass spectra
The GF of a particle can be estimated based on HTDMA–ATOFMS data for two reasons. First, different particle types had distinct GF distributions. Second, particles in different GF bins had different mass spectra. The GF estimation from particle spectra requires that the HTDMA–ATOFMS data are capable to represent the major particle types normally presented in the atmosphere, which is evidenced in the preceding discussions. In addition, the GF prediction from mass spectra also demands that HTDMA–ATOFMS data are sensitive to the composition differences with GF variations.
To test the sensitivity of HTDMA–ATOFMS data, we evaluated the average spectral similarities between each pair of GF groups. The average similarities were calculated from the similarities between every possible pair of particles from the two GF groups. The self-comparing of particles within the same GF group was excluded. As shown in Fig. S7, we observed a general trend that particles in the same GF bins tend to produce the highest similarities. As the GF differences increase, the mass spectra similarity between two GF bins tended to decrease. This result is evidence that the particles with different GFs are more likely to have discriminable mass spectra, which suggests that the HTDMA–ATOFMS dataset is capable to estimate hygroscopicity just from particle mass spectra.
3.3 Estimated hygroscopicity of ambient particles
A case study of the hygroscopicity estimation was carried out based on a period of ambient ATOFMS measurement. The ATOFMS data were collected at the same Fudan site from 12 to 28 September 2012. During this period the ATOFMS recorded 538 983 mass spectra of individual particles. With the described estimation method, the GF value (corresponding to 85 % RH) was generated for each particle based on individual particle mass spectra. A fraction of the estimated GFs (4 %) were excluded from analysis since their maximum similarities failed to exceed the threshold value (dot product >0.7) between ATOFMS and HTDMA–ATOFMS particles. Particle mixing states in this period were analyzed by clustering particles using the ART-2a algorithm (Song et al., 1999). After merging the clusters of similar composition and temporal trends, the majority of particles were finally grouped into the same general types as discussed in the HTDMA–ATOFMS dataset (fresh EC, aged EC, dust/ash, HMOC, amine-rich, ammonium–OC, cooking and sea salt), which account for 90.8 % of the total analyzed particles in this period.
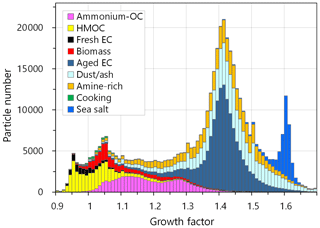
Figure 6Particle number distribution of different particle types as a function of estimated GF from 12 to 28 September 2012.
3.3.1 Hygroscopicity modes and contributions of particle types
The estimation method determined that the GFs of ATOFMS particles were restricted within the GF range in the HTDMA–ATOFMS dataset (0.9–1.7). Within this GF range, the ATOFMS particle GF distribution suggested several hygroscopicity modes similar to the HTDMA measurement. As shown in Fig. 6, three hygroscopicity modes were clear in the GF number distributions, with particle GF centered at about 1.05, 1.42 and 1.6 (85 % RH). Prior HTDMA studies suggested the regular presence of the nearly hydrophobic mode with a center in the 1.05–1.1 GF range in the Shanghai area (Ye et al., 2011), consistent with the 1.05 GF mode in this study. The second mode at 1.42 GF mode in ATOFMS particles corresponds to the MH mode (GF of 1.43–1.47) in Shanghai and other sites using a HTDMA (Ye et al., 2013, 2011; Liu et al., 2011). The sea salt mode in HTDMA GF distribution is not always clear because of the larger size of sea salt particles. However, the sea salt particles were readily detected by the ATOFMS because of the detection range of the ATOFMS. The particles in GF of 1.6 mode contained rich sodium content and their mass spectra suggest typical sea salt peaks (Fig. S8). In marine areas the sea salt particles were found to constitute hygroscopicity mode of the largest GF (about 2.0 at 90 % RH, corresponding to 1.76 at 85 % RH) (Swietlicki et al., 2008).
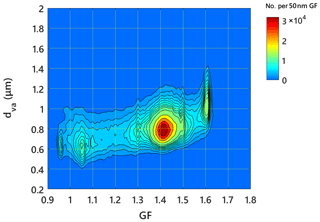
Figure 7The distribution of ATOFMS particles as a bivariate function of estimated GF and aerodynamic diameter.
The ATOFMS measured particle aerodynamic diameters simultaneously for individual particles. Together with the estimated GF, we inspected particle number distribution as a bivariate function of the estimated GF and diameter (aerodynamic diameter, dva) (Fig. 7). The hygroscopicity modes were clearer in the GF–dva diagram, which suggests the increasing trend of particle diameter with increasing GF, a result very consistent with HTDMA studies (Ye et al., 2011, 2013). Healy et al. (2014) applied a different method to estimate particle hygroscopicity from single-particle data using the Zdanovskii–Stokes–Robinson (ZSR) mixing rule (Healy et al., 2014). The particle aerodynamic diameter dva was transformed to equivalent mobility diameter dm by assuming a particle density in that study. Although the methods are different, the identified hygroscopicity modes were similar between the two studies, except the sea salt mode which was not found by Healy et al. (2014).
Based on the GF of hygroscopicity modes, prior HTDMA studies conventionally classified the observed modes into categories as nearly hydrophobic (NH), less-hygroscopic (LH), more-hygroscopic (MH) and sea salt (SS) (Swietlicki et al., 2008; Liu et al., 2011; Sjogren et al., 2008). However, the chemical nature of these hygroscopicity modes was not clear since the HTDMA technique is based on particle numbers and the particle composition information was not obtainable. With the ATOFMS single-particle data, particle composition and hygroscopicity were connected directly. To facilitate comparison, we similarly divide the estimated GF into four bins (<1.1, 1.1–1.3, 1.3–1.5 and >1.5) to roughly represent the NH, LH, MH and SS particles according to the conventional classification of hygroscopicity modes (Swietlicki et al., 2008). As shown in Fig. 6, particle types were distributed differently in GF modes. For example, the organic particles including HMOC, biomass and freshly emitted EC particles were mainly enriched in NH mode, which suggests directly that combustion sources are mainly responsible for NH particles in ambient conditions (Herich et al., 2008, 2009; Ye et al., 2011).
Table 2Statistics on particle number contributions of ATOFMS particle types to different GF modes. The statistics are the average contributions and variation ranges (in brackets) based on temporal data at daily resolution.
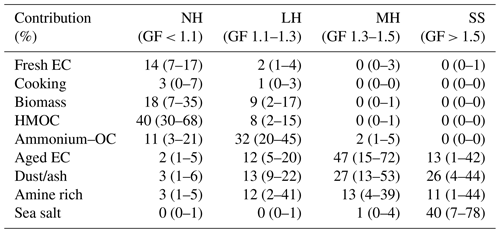
In Table 2 we list the statistics on average number contributions of particle types for the NH, LH, MH and SS modes. The presented statistics were based on the temporal contributions of each particle type at daily resolution. It is noted that particle number contributions presented in Table 2 may be different from the HTDMA–ATOFMS dataset (Fig. 2). For example, the cooking particle contributions to NH mode were significantly lower in the ATOFMS dataset (3 %) than the HTDMA–ATOFMS dataset (19 %). This result is understandable because particle concentrations vary with particle size, and the HTDMA–ATOFMS only analyzed a narrow size bin from the total particle size distribution. For each hygroscopicity mode, there were multiple particle types contributing significant number fractions, suggesting that even within the same hygroscopicity mode there was still some heterogeneity in particle composition. Particles in the same hygroscopicity mode may share some common features in compositions but their differences are distinguishable in single-particle data. In another respect, the contributions of each type also suggest the existence of a predominant type that accounts for major fractions in respective modes compared with other types, such as aged EC in MH mode and ammonium–OC in LH mode. The comparison between Table 2 and Fig. 2 suggests that, although their absolute contributions may be different, the hygroscopicity patterns of particle types in the two datasets are in good agreement. Based on this fact, we concluded that the composition–hygroscopicity connections contained in the HTDMA–ATOFMS dataset were successfully reflected in the predicted GF.
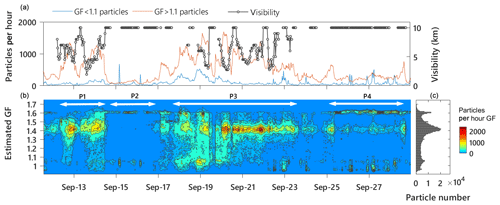
Figure 8Temporal variations in atmospheric visibility and number concentrations of nearly hydrophobic (estimated GF < 1.1) and hygroscopic (GF > 1.1) particles (a). (b) The temporal variation in estimated GF from 12 to 28 September 2012. (c) The particle number distribution with GF during the period.
3.3.2 Temporal variations in estimated hygroscopicity
The temporal variation in particle estimated GF from 12 to 28 September was illustrated in Fig. 8. Four distinct periods (P1–P4) were identified based on their different hygroscopicity distributions. Generally, the P1 and P3 periods were characterized by elevated MH mode which dominated the ATOFMS particle numbers, while in P2 and P4 the MH particles decreased significantly and sea salt mode was pronounced. Back trajectories during P1–P4 were analyzed using the HYSPLIT mode (Draxler and Rolph, 2019) to inspect the air mass that influenced the sampling site (Fig. S9). The 24 h back trajectories suggest that the air mass in the P1 period mainly circulated in local regions from the northwest to Shanghai. The local circulations brought regional aerosol pollution to the sampling site, resulting in elevated concentrations of particles, especially the MH particles. During P2, the air mass originated from the ocean in the northeast with less continental influence. The cleaner air from the ocean almost wiped out the accumulated particles observed in P1, and the concentrations of sea salt particles increased. The majority of the time during P3, the air mass stayed over continental areas. The MH particles dominated particle numbers in this period and the sea salt mode was barely present. From 18 to 20 September in P3, the LH particles showed increased concentrations and gradually decreased after 20 September. Similar to P1, the origin of air mass in P4 shifted to the ocean in the east and SS mode emerged again. Both the particle spectra and the back trajectories supported that the GF mode of 1.6 can be mainly attributed to sea salt particles.
Except for meteorological conditions, other differences exist in the temporal trends for each hygroscopicity mode. Generally, the NH mode showed relatively stable trends irrespective of the different periods P1–P4, as indicated in Fig. 8. Closer inspection of NH particles suggests a notable feature that obvious sharp spikes were present in NH particle temporal concentrations (Fig. 8). This characteristic is typical for particles from local emission sources, with undissipated plumes at the time of detection. With the combined information from particle composition in Table 2, we inferred that the NH particles were freshly emitted particles from local sources with high organic or elemental carbon content (Laborde et al., 2013; Herich et al., 2008; Weingartner et al., 1997). The mass spectra of NH particles indicated low nitrate and sulfate signals, suggesting that secondary matter has not accumulated significantly on these particles, consistent with negligible coating thickness on NH particles (Laborde et al., 2013). We tend to ascribe the organics in NH particles to primary organic aerosol (POA) considering their relatively fresh emission state (Sjogren et al., 2008; Liu et al., 2011; Gysel et al., 2007).
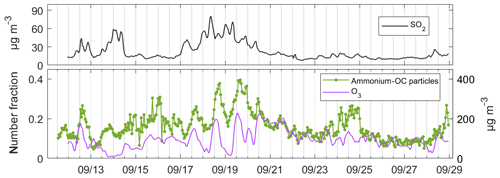
Figure 9Temporal traces of ammonium–OC relative number concentrations, ambient O3 and SO2 concentrations from 12 to 28 September 2012.
Some characteristics of LH particles were noticed. Similar to the particles in the MH range, the LH particles mainly presented in continent-influenced periods (P1 and P3) (Fig. 8). However, the temporal concentration trends suggested differences between LH and MH particles. For example, MH mode dominated particle numbers in the entire P3, while the LH particles were only pronounced from 17 to 21 September, with peak concentrations observed on 19 September. The particle contributions showed that ammonium–OC is the main contributor to NH particles (Table 2). This conclusion is also correct on a temporal basis since the ammonium–OC contributions to the LH range were always much larger than other types of particles in the studied period. We investigated the nature of the ammonium–OC particles by comparing its concentration with ambient pollutant levels. As shown in Fig. 9, the number fractions of ammonium–OC particles showed strong connections to ambient O3 concentrations. From 17 to 21 September there were daily oscillations of O3 levels, which were followed by the same pattern of ammonium–OC particles with lags of several hours. The maximum O3 concentration was found on 19 September (219 µgm−3) in the period, the same day when the highest ammonium–OC particle contribution was observed. HTDMA studies suggested that LH mode became pronounced in new particle formation (NPF) periods with high atmospheric reactivity (Swietlicki et al., 2008). Based on these facts, we think the ammonium–OC particles were related to the oxidation processes of organic vapors by oxidants such as O3 (Varutbangkul et al., 2006). The moderate hygroscopicity of ammonium–OC agrees with the hygroscopicity of ambient secondary organic aerosol (SOA) (Gysel et al., 2007; Sjogren et al., 2008). During periods of higher ammonium–OC contributions (17 to 21 September), increased SO2 levels were also encountered, which coincided with high sulfate signals in mass spectra of ammonium–OC (Fig. 2). Compared with the organic compositions, the sulfate was inferred to have minor contributions to mass fractions because of the moderate hygroscopicity of ammonium–OC.
Particles in MH mode dominated the particle numbers for the majority of the time in P1 and P3 (60 %) compared with the average fraction of 25 % in P2 and P4. Inspection of the temporal trends of MH particles also suggests some diurnal variations with higher concentrations in nighttime (Fig. 8). As illustrated in Figs. 4 and S6, mass spectra of MH particles were dominated by sulfate and nitrate peaks, suggesting that MH particles were mixed with a significant fraction of secondary inorganic aerosol (SIA). The coating thickness of the secondary matter was determined by the HTDMA–SP2 at different GFs (Laborde et al., 2013). The thickness of the secondary coating was measured to 40–80 nm (Ddry=265 nm) in the 1.2–1.7 GF range, being equivalent to 55 %–76 % of hygroscopic particle volume attributed to secondary matter (Laborde et al., 2013; Healy et al., 2014).
3.3.3 Peak intensity variations with estimated GF
Particle hygroscopicity and peak intensities in particle mass spectra were correlated to show their connections. The correlation was illustrated similarly to the analysis of the HTDMA–ATOFMS dataset, as shown in Fig. 10. In addition to the statistics on peak intensities of different GFs, the number distributions of ATOFMS particles with GF and peak intensities were presented for nitrate (46, 62, 125H(NO3)) and sulfate peaks (80, 97), in Fig. 10c, d. The general trends of peak intensities with GF in the HTDMA–ATOFMS dataset were preserved in estimated GF of ambient particles. The trends of nitrate and sulfate peak intensities showed increases from the NH to LH range and remained constant in the MH mode. Similar to HTDMA–ATOFMS particles, stronger nitrate peaks were detected in SS particles compared with the MH particles, while an opposite trend was observed for sulfate intensities. These results highlight the nonlinearity between GF and peak intensities of ATOFMS particles.
The nonlinearity of peak intensities with GF was also suggested by the different particle types presented in ATOFMS data. As shown in Fig. 10c, d, the distribution of ATOFMS individual particles showed enrichment in different areas in the GF peak intensity diagram, suggesting the presence of particle groups of different compositions. To illustrate this character, we selected two areas with clear particle enrichments in the GF peak intensity diagram, and their particle composition was analyzed (denoted as A and B in Fig. 10c). Obviously, particles in area A produced much larger nitrate signals than particles in area B. Particle numbers in the two areas suggested that dust/ash dominated particles in area A (59 %) while in area B the dust/ash only accounted for 14 % of particles (Fig. S10). As a contrast, particles in area B were dominated by aged EC (53 %) followed by 25 % dust/ash. Table 2 suggests that aged EC and dust/ash are the major types presented in the same MH mode. However, peak intensity responses to GF were indeed different for different particle types, suggesting the importance of particle types in describing peak intensities.
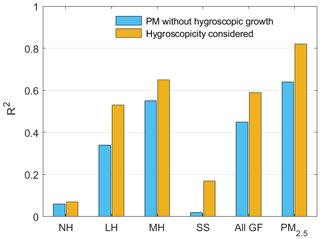
Figure 11The R squares between visibility and PM volume concentrations with and without considering particle hygroscopicity.
The particle distribution with sulfate intensities showed similar enrichment patterns to nitrate (in Fig. 10d). Sulfate peak intensities were found to be correlated with hygroscopicity in the <1.2 GF range, but in the MH range no correlation with GF was observed. We note that except for the larger peaks of nitrate and sulfate, some smaller peaks were also found to be correlated with GF within specific particle type. We correlated peak intensities of Na2Cl+ and with the estimated GF of sea salt particles (Fig. S11). The Na2Cl+ peaks were positively correlated with GF while the nitrate peaks were negatively correlated with GF. The observed correlation in sea salt particles is consistent with discussed trends in the HTDMA–ATOFMS dataset. These results demonstrate that the GF estimation method has effectively reflected the minor changes in particle mass spectra into the estimated hygroscopicity.
3.3.4 Comparing the estimated hygroscopicity with visibility
Particle optical properties were closely connected to hygroscopicity (Liu et al., 2012; Qu et al., 2015; Chen et al., 2012). The hygroscopic growth increases particle volumes and cross sections and contributes to the visibility degradation. With the estimated hygroscopicity of ATOFMS particles, we correlated atmospheric visibility with particle concentrations to study their contributions to the visibility variations. The ATOFMS particle volume concentrations were calculated for hygroscopicity modes of NH, LH, MH and SS based on ATOFMS particle diameter and numbers. The particle volume concentrations were used because hygroscopic growth changes particle sizes rather than numbers (Chen et al., 2012). The visibility data were obtained from https://www.wunderground.com/ (last access: 25 February 2015) logged in the Hongqiao airport (31∘12′ N, 121∘20′ E) and Pudong airport (31∘9.3′ N, 121∘49′ E) during the study period (see the map in Fig. S12). The temporal variations in visibility at two sites correlated strongly (Fig. S12), despite the 45 km distance between the two airports. The Fudan site is located roughly between the two airports, and the two sets of visibility data were averaged to represent the study site. In P2 and P4 the site was under influences from the ocean, resulting in visibilities larger than 10 km (Fig. 8). Apart from ATOFMS particles, contemporary PM2.5 volume concentrations were also correlated with visibility. The PM2.5 volume concentrations were derived from PM2.5 mass concentrations using particle density (1.4 g cm−3). A strong correlation between ATOFMS particle numbers and PM2.5 was found (R2=0.80).
An exponential relation between visibility and PM concentrations was found by the previous study (Qu et al., 2015). After applying the exponential fitting to the visibility and particle volume concentrations, we found a moderate correlation for ATOFMS particles (R2=0.45) and better correlations for PM2.5 concentrations (R2=0.64) (Fig. S13). However, the fitting errors were clearly dependent on ambient RH, with larger errors in higher humidity, indicating that hygroscopicity might affect visibility degradations, which were consistent with other studies (Chen et al., 2012; Liu et al., 2012). To further examine the effect of particle hygroscopicity on visibility, we derived particle volumes in different RHs using estimated κ values (Petters and Kreidenweis, 2007). The κ values were calculated using the GF of individual particles at 85 % RH for ATOFMS data and the average GF of 1.36 for PM2.5 volume concentrations. With hygroscopicity being considered, we found notable improvements of the correlations between PM concentrations and visibility, with the improved correlation observed for PM2.5 concentrations (R2=0.82) after applying correction for hygroscopicity (Fig. 11). However, this improvement was barely the case for NH particles, probably due to the negligible hygroscopic growth. For the ATOFMS particles in different GF modes, we found the highest R2 (0.65) for the MH particles. The correlation between SS particles and visibility was distorted due to the visibility reaching its limit (10 km) when sea salt mode was pronounced (Fig. 8). The R2 between MH particles and visibility suggests that the variation in MH particles accounted for the major part of visibility changes (65 %) during this period, which coincided with the major contribution of nitrate and sulfate to light extinction (61 %) in eastern China areas (Qu et al., 2015). These results indicate the importance of discriminating particles by hygroscopicity in explaining the measured visibility.
The hygroscopicity and composition of submicron particles were characterized in a megacity in eastern China. A single-particle mass spectrometer was connected to the downflow of an HTDMA to analyze particle composition of different hygroscopicities at 85 % RH. Direct connections between hygroscopicity and single-particle signatures were established. The HTDMA–ATOFMS dataset suggested that particle types were distributed differently in various hygroscopicity ranges. Generally, fresh EC particles and organic particle types including biomass, cooking and high molecular organic carbon (HMOC) were enriched in nearly hydrophobic (NH) mode (GF <1.1). The majority of particles in NH mode suggested characteristics of freshly emitted particles from combustion sources. Particle types in the more-hygroscopic (MH) range (GF of 1.3–1.5) include aged EC, amine-rich and dust/ash particles. The mass spectra of MH particles suggested that they were mixed with significant fractions of secondary matter. The sea salt particles were detected in the higher GF range (GF of 1.5–1.7), with increasing detection probability at larger GFs. In the moderate hygroscopicity range (GF of 1.1–1.3), the ammonium–OC particles were identified with peak detection probability at a GF of 1.2.
Single-particle spectra peak intensities were correlated with GF to disclose their possible connections. The peak intensities were nonlinearly correlated with GF. The peak intensities of nitrate and sulfate showed a gradual increase from a GF of 0.9 to 1.2 while in the larger GF range the same trends were not observed. Peak intensities showed opposite directions for nitrate and sulfate in the 1.5–1.7 GF range with stronger nitrate peaks and smaller sulfate peaks. Except the general nonlinearity of peak intensities is subjected to variations with different particle types. The peak intensity analysis suggested the reduced hygroscopicity of sea salt after atmospheric aging.
Based on the established connections between hygroscopicity and composition, we developed a method to estimate particle hygroscopicity from single-particle mass spectra. The method was tested in a period of ATOFMS data in Shanghai. The estimated GF of individual particles suggested that ATOFMS particles were present in similar hygroscopicity modes as HTDMA measurements on ambient aerosol. We discriminated particles into NH, LH, MH and SS modes by the GF of individual particles. Particle type contributions to the these hygroscopicity modes suggested consistent with the HTDMA–ATOFMS dataset. Based on the combined information on particle composition, hygroscopicity and air mass back trajectories, we inferred that POA∕EC, SOA, SIA and sea salt are the characteristic compositions for particles in the NH, LH, MH and SS modes, respectively. The proposed method is a novel way of single-particle mass spectrometry data analysis, which would provide additional information to the study of particle mixing states, source identification and visibility degradation.
Data are available upon request from the corresponding author.
The supplement related to this article is available online at: https://doi.org/10.5194/acp-20-6273-2020-supplement.
XW designed this study and conducted the experiments. XW and XY supervised this study and helped with the experiment design. XW, XW and XY prepared and revised the manuscript with contributions from all co-authors.
The authors declare that they have no conflict of interest.
This work was supported by the National Natural Science Foundation of China (nos. 91544224, 21906024, 41775150, 41827804), Shanghai Natural Science Foundation (no. 19ZR1404000) and the Program for Guangdong Introducing Innovative and Entrepreneurial Teams (2017ZT07Z479). We acknowledge the Shanghai Environmental Monitoring Center for providing ambient air quality data.
This research has been supported by the National Science Foundation of China (grant nos. 91544224, 21906024, 41775150, and 41827804) and the Shanghai Natural Science Foundation (grant no. 19ZR1404000).
This paper was edited by Timothy Bertram and reviewed by two anonymous referees.
Angelino, S., Suess, D. T., and Prather, K. A.: Formation of aerosol particles from reactions of secondary and tertiary alkylamines: Characterization by aerosol time-of-flight mass spectrometry, Environ. Sci. Technol., 35, 3130–3138, https://doi.org/10.1021/es0015444, 2001.
Ault, A. P., Gaston, C. J., Wang, Y., Dominguez, G., Thiemens, M. H., and Prather, K. A.: Characterization of the Single Particle Mixing State of Individual Ship Plume Events Measured at the Port of Los Angeles, Environ. Sci. Technol., 44, 1954–1961, https://doi.org/10.1021/es902985h, 2010.
Ault, A. P., Williams, C. R., White, A. B., Neiman, P. J., Creamean, J. M., Gaston, C. J., Ralph, F. M., and Prather, K. A.: Detection of Asian dust in California orographic precipitation, J. Geophys. Res.-Atmos., 116, D16205, https://doi.org/10.1029/2010jd015351, 2011.
Buzorius, G., Zelenyuk, A., Brechtel, F., and Imre, D.: Simultaneous determination of individual ambient particle size, hygroscopicity and composition, Geophys. Res. Lett., 29, 1974, https://doi.org/10.1029/2001gl014221, 2002.
Chen, J., Zhao, C. S., Ma, N., Liu, P. F., Göbel, T., Hallbauer, E., Deng, Z. Z., Ran, L., Xu, W. Y., Liang, Z., Liu, H. J., Yan, P., Zhou, X. J., and Wiedensohler, A.: A parameterization of low visibilities for hazy days in the North China Plain, Atmos. Chem. Phys., 12, 4935–4950, https://doi.org/10.5194/acp-12-4935-2012, 2012.
Chen, Y., Tian, M., Huang, R.-J., Shi, G., Wang, H., Peng, C., Cao, J., Wang, Q., Zhang, S., Guo, D., Zhang, L., and Yang, F.: Characterization of urban amine-containing particles in southwestern China: seasonal variation, source, and processing, Atmos. Chem. Phys., 19, 3245–3255, https://doi.org/10.5194/acp-19-3245-2019, 2019.
Cheng, Y. F., Wiedensohler, A., Eichler, H., Heintzenberg, J., Tesche, M., Ansmann, A., Wendisch, M., Su, H., Althausen, D., Herrmann, H., Gnauk, T., Bruggemann, E., Hu, M., and Zhang, Y. H.: Relative humidity dependence of aerosol optical properties and direct radiative forcing in the surface boundary layer at Xinken in Pearl River Delta of China: An observation based numerical study, Atmos. Environ., 42, 6373–6397, https://doi.org/10.1016/j.atmosenv.2008.04.009, 2008.
Crippa, M., DeCarlo, P. F., Slowik, J. G., Mohr, C., Heringa, M. F., Chirico, R., Poulain, L., Freutel, F., Sciare, J., Cozic, J., Di Marco, C. F., Elsasser, M., Nicolas, J. B., Marchand, N., Abidi, E., Wiedensohler, A., Drewnick, F., Schneider, J., Borrmann, S., Nemitz, E., Zimmermann, R., Jaffrezo, J.-L., Prévôt, A. S. H., and Baltensperger, U.: Wintertime aerosol chemical composition and source apportionment of the organic fraction in the metropolitan area of Paris, Atmos. Chem. Phys., 13, 961–981, https://doi.org/10.5194/acp-13-961-2013, 2013.
Dall'Osto, M. and Harrison, R. M.: Urban organic aerosols measured by single particle mass spectrometry in the megacity of London, Atmos. Chem. Phys., 12, 4127–4142, https://doi.org/10.5194/acp-12-4127-2012, 2012.
Dall'Osto, M., Ovadnevaite, J., Ceburnis, D., Martin, D., Healy, R. M., O'Connor, I. P., Kourtchev, I., Sodeau, J. R., Wenger, J. C., and O'Dowd, C.: Characterization of urban aerosol in Cork city (Ireland) using aerosol mass spectrometry, Atmos. Chem. Phys., 13, 4997–5015, https://doi.org/10.5194/acp-13-4997-2013, 2013.
Draxler, R. R. and Rolph, G. D.: HYSPLIT (Hybrid Single-Particle Lagrangian Integrated Trajectory) model v 4.9, NOAA Air Resource Laboratory, Silver Spring MD, available at: http://www.arl.noaa.gov/ready/hysplit4.html, last access: 8 July 2019.
Facchini, M. C., Mircea, M., Fuzzi, S., and Charlson, R. J.: Cloud albedo enhancement by surface-active organic solutes in growing droplets, Nature, 401, 257–259, https://doi.org/10.1038/45758, 1999.
Facchini, M. C., Rinaldi, M., Decesari, S., Carbone, C., Finessi, E., Mircea, M., Fuzzi, S., Ceburnis, D., Flanagan, R., and Nilsson, E. D.: Primary submicron marine aerosol dominated by insoluble organic colloids and aggregates, Geophys. Res. Lett., 35, L17814, https://doi.org/10.1029/2008GL034210, 2008.
Gard, E. E., Kleeman, M. J., Gross, D. S., Hughes, L. S., Allen, J. O., Morrical, B. D., Fergenson, D. P., Dienes, T., Galli, M. E., Johnson, R. J., Cass, G. R., and Prather, K. A.: Direct observation of heterogeneous chemistry in the atmosphere, Science, 279, 1184–1187, https://doi.org/10.1126/science.279.5354.1184, 1998.
Gaston, C. J., Furutani, H., Guazzotti, S. A., Coffee, K. R., Bates, T. S., Quinn, P. K., Aluwihare, L. I., Mitchell, B. G., and Prather, K. A.: Unique ocean-derived particles serve as a proxy for changes in ocean chemistry, J. Geophys. Res.-Atmos., 116, D18310, https://doi.org/10.1029/2010jd015289, 2011.
Gaston, C. J., Pratt, K. A., Suski, K. J., May, N. W., Gill, T. E., and Prather, K. A.: Laboratory Studies of the Cloud Droplet Activation Properties and Corresponding Chemistry of Saline Playa Dust, Environ. Sci. Technol., 51, 1348–1356, https://doi.org/10.1021/acs.est.6b04487, 2017.
Gaston, C. J., Cahill, J. F., Collins, D. B., Suski, K. J., Ge, J. Y., Barkley, A. E., and Prather, K. A.: The Cloud Nucleating Properties and Mixing State of Marine Aerosols Sampled along the Southern California Coast, Atmosphere, 9, 52, https://doi.org/10.3390/atmos9020052, 2018.
Gysel, M., Crosier, J., Topping, D. O., Whitehead, J. D., Bower, K. N., Cubison, M. J., Williams, P. I., Flynn, M. J., McFiggans, G. B., and Coe, H.: Closure study between chemical composition and hygroscopic growth of aerosol particles during TORCH2, Atmos. Chem. Phys., 7, 6131–6144, https://doi.org/10.5194/acp-7-6131-2007, 2007.
Hatch, L. E., Pratt, K. A., Huffman, J. A., Jimenez, J. L., and Prather, K. A.: Impacts of Aerosol Aging on Laser Desorption/Ionization in Single-Particle Mass Spectrometers, Aerosol Sci. Tech., 48, 1050–1058, https://doi.org/10.1080/02786826.2014.955907, 2014.
Healy, R. M., Evans, G. J., Murphy, M., Juranyi, Z., Tritscher, T., Laborde, M., Weingartner, E., Gysel, M., Poulain, L., Kamilli, K. A., Wiedensohler, A., O'Connor, I. P., McGillicuddy, E., Sodeau, J. R., and Wenger, J. C.: Predicting hygroscopic growth using single particle chemical composition estimates, J. Geophys. Res.-Atmos., 119, 9567–9577, https://doi.org/10.1002/2014jd021888, 2014.
Herich, H., Kammermann, L., Gysel, M., Weingartner, E., Baltensperger, U., Lohmann, U., and Cziczo, D. J.: In situ determination of atmospheric aerosol composition as a function of hygroscopic growth, J. Geophys. Res.-Atmos., 113, D16213, https://doi.org/10.1029/2008jd009954, 2008.
Herich, H., Kammermann, L., Friedman, B., Gross, D. S., Weingartner, E., Lohmann, U., Spichtinger, P., Gysel, M., Baltensperger, U., and Cziczo, D. J.: Subarctic atmospheric aerosol composition: 2. Hygroscopic growth properties, J. Geophys. Res.-Atmos., 114, D13204, https://doi.org/10.1029/2008jd011574, 2009.
Hu, D., Qiao, L., Chen, J., Ye, X., Yang, X., Cheng, T., and Fang, W.: Hygroscopicity of Inorganic Aerosols: Size and Relative Humidity Effects on the Growth Factor, Aerosol Air Qual. Res., 10, 255–264, https://doi.org/10.4209/aaqr.2009.12.0076, 2010.
Huang, Y., Chen, H., Wang, L., Yang, X., and Chen, J.: Single particle analysis of amines in ambient aerosol in Shanghai, Environ. Chem., 9, 202–210, https://doi.org/10.1071/en11145, 2012.
Koehler, K. A., Kreidenweis, S. M., DeMott, P. J., Petters, M. D., Prenni, A. J., and Carrico, C. M.: Hygroscopicity and cloud droplet activation of mineral dust aerosol, Geophys. Res. Lett., 36, L08805, https://doi.org/10.1029/2009gl037348, 2009.
Laborde, M., Crippa, M., Tritscher, T., Jurányi, Z., Decarlo, P. F., Temime-Roussel, B., Marchand, N., Eckhardt, S., Stohl, A., Baltensperger, U., Prévôt, A. S. H., Weingartner, E., and Gysel, M.: Black carbon physical properties and mixing state in the European megacity Paris, Atmos. Chem. Phys., 13, 5831–5856, https://doi.org/10.5194/acp-13-5831-2013, 2013.
Liu, H. J., Zhao, C. S., Nekat, B., Ma, N., Wiedensohler, A., van Pinxteren, D., Spindler, G., Müller, K., and Herrmann, H.: Aerosol hygroscopicity derived from size-segregated chemical composition and its parameterization in the North China Plain, Atmos. Chem. Phys., 14, 2525–2539, https://doi.org/10.5194/acp-14-2525-2014, 2014.
Liu, P. F., Zhao, C. S., Göbel, T., Hallbauer, E., Nowak, A., Ran, L., Xu, W. Y., Deng, Z. Z., Ma, N., Mildenberger, K., Henning, S., Stratmann, F., and Wiedensohler, A.: Hygroscopic properties of aerosol particles at high relative humidity and their diurnal variations in the North China Plain, Atmos. Chem. Phys., 11, 3479–3494, https://doi.org/10.5194/acp-11-3479-2011, 2011.
Liu, X. G., Zhang, Y. H., Cheng, Y. F., Hu, M., and Han, T. T.: Aerosol hygroscopicity and its impact on atmospheric visibility and radiative forcing in Guangzhou during the 2006 PRIDE-PRD campaign, Atmos. Environ., 60, 59–67, https://doi.org/10.1016/j.atmosenv.2012.06.016, 2012.
Lohmann, U. and Feichter, J.: Global indirect aerosol effects: a review, Atmos. Chem. Phys., 5, 715–737, https://doi.org/10.5194/acp-5-715-2005, 2005.
Petters, M. D. and Kreidenweis, S. M.: A single parameter representation of hygroscopic growth and cloud condensation nucleus activity, Atmos. Chem. Phys., 7, 1961–1971, https://doi.org/10.5194/acp-7-1961-2007, 2007.
Prather, K. A., Bertram, T. H., Grassian, V. H., Deane, G. B., Stokes, M. D., DeMott, P. J., Aluwihare, L. I., Palenik, B. P., Azam, F., Seinfeld, J. H., Moffet, R. C., Molina, M. J., Cappa, C. D., Geiger, F. M., Roberts, G. C., Russell, L. M., Ault, A. P., Baltrusaitis, J., Collins, D. B., Corrigan, C. E., Cuadra-Rodriguez, L. A., Ebben, C. J., Forestieri, S. D., Guasco, T. L., Hersey, S. P., Kim, M. J., Lambert, W. F., Modini, R. L., Mui, W., Pedler, B. E., Ruppel, M. J., Ryder, O. S., Schoepp, N. G., Sullivan, R. C., and Zhao, D.: Bringing the ocean into the laboratory to probe the chemical complexity of sea spray aerosol, P. Natl. Acad. Sci. USA, 110, 7550–7555, https://doi.org/10.1073/pnas.1300262110, 2013.
Pratt, K. A. and Prather, K. A.: Real-Time, Single-Particle Volatility, Size, and Chemical Composition Measurements of Aged Urban Aerosols, Environ. Sci. Technol., 43, 8276–8282, https://doi.org/10.1021/es902002t, 2009.
Pratt, K. A., Hatch, L. E., and Prather, K. A.: Seasonal Volatility Dependence of Ambient Particle Phase Amines, Environ. Sci. Technol., 43, 5276–5281, https://doi.org/10.1021/es803189n, 2009.
Qin, X. Y., Pratt, K. A., Shields, L. G., Toner, S. M., and Prather, K. A.: Seasonal comparisons of single-particle chemical mixing state in Riverside, CA, Atmos. Environ., 59, 587–596, https://doi.org/10.1016/j.atmosenv.2012.05.032, 2012.
Qiu, C., and Zhang, R. Y.: Multiphase chemistry of atmospheric amines, Phys. Chem. Chem. Phys., 15, 5738–5752, https://doi.org/10.1039/c3cp43446j, 2013.
Qu, W. J., Wang, J., Zhang, X. Y., Wang, D., and Sheng, L. F.: Influence of relative humidity on aerosol composition: Impacts on light extinction and visibility impairment at two sites in coastal area of China, Atmos. Res., 153, 500–511, https://doi.org/10.1016/j.atmosres.2014.10.009, 2015.
Randles, C. A., Russell, L. M., and Ramaswamy, V.: Hygroscopic and optical properties of organic sea salt aerosol and consequences for climate forcing, Geophys. Res. Lett., 31, L16108, https://doi.org/10.1029/2004gl020628, 2004.
Rehbein, P. J. G., Jeong, C.-H., McGuire, M. L., and Evans, G. J.: Strategies to Enhance the Interpretation of Single-Particle Ambient Aerosol Data, Aerosol Sci. Tech., 46, 584–595, https://doi.org/10.1080/02786826.2011.650334, 2012.
Rissler, J., Vestin, A., Swietlicki, E., Fisch, G., Zhou, J., Artaxo, P., and Andreae, M. O.: Size distribution and hygroscopic properties of aerosol particles from dry-season biomass burning in Amazonia, Atmos. Chem. Phys., 6, 471–491, https://doi.org/10.5194/acp-6-471-2006, 2006.
Shi, Y., Ge, M., and Wang, W.: Hygroscopicity of internally mixed aerosol particles containing benzoic acid and inorganic salts, Atmos. Environ., 60, 9–17, 2012.
Silva, P. J., Liu, D. Y., Noble, C. A., and Prather, K. A.: Size and chemical characterization of individual particles resulting from biomass burning of local Southern California species, Environ. Sci. Technol., 33, 3068–3076, https://doi.org/10.1021/es980544p, 1999.
Silva, P. J.: Source profiling and apportionment of airborne particles: A new approach using aerosol time-of-flight mass spectrometry, PhD, University of California, Riverside, United States, California, 428–428, 2000.
Sjogren, S., Gysel, M., Weingartner, E., Alfarra, M. R., Duplissy, J., Cozic, J., Crosier, J., Coe, H., and Baltensperger, U.: Hygroscopicity of the submicrometer aerosol at the high-alpine site Jungfraujoch, 3580 m a.s.l., Switzerland, Atmos. Chem. Phys., 8, 5715–5729, https://doi.org/10.5194/acp-8-5715-2008, 2008.
Song, X. H., Hopke, P. K., Fergenson, D. P., and Prather, K. A.: Classification of single particles analyzed by ATOFMS using an artificial neural network, ART-2A, Anal. Chem., 71, 860–865, https://doi.org/10.1021/ac9809682, 1999.
Spencer, M. T., Shields, L. G., Sodeman, D. A., Toner, S. M., and Prather, K. A.: Comparison of oil and fuel particle chemical signatures with particle emissions from heavy and light duty vehicles, Atmos. Environ., 40, 5224–5235, https://doi.org/10.1016/j.atmosenv.2006.04.011, 2006.
Su, Y. X., Sipin, M. F., Furutani, H., and Prather, K. A.: Development and characterization of an aerosol time-of-flight mass spectrometer with increased detection efficiency, Anal. Chem., 76, 712–719, https://doi.org/10.1021/ac034797z, 2004.
Sullivan, R. C., Guazzotti, S. A., Sodeman, D. A., and Prather, K. A.: Direct observations of the atmospheric processing of Asian mineral dust, Atmos. Chem. Phys., 7, 1213–1236, https://doi.org/10.5194/acp-7-1213-2007, 2007.
Swietlicki, E., Hansson, H. C., Hameri, K., Svenningsson, B., Massling, A., McFiggans, G., McMurry, P. H., Petaja, T., Tunved, P., Gysel, M., Topping, D., Weingartner, E., Baltensperger, U., Rissler, J., Wiedensohler, A., and Kulmala, M.: Hygroscopic properties of submicrometer atmospheric aerosol particles measured with H-TDMA instruments in various environments – a review, Tellus B, 60, 432–469, https://doi.org/10.1111/j.1600-0889.2008.00350.x, 2008.
Toner, S. M., Shields, L. G., Sodeman, D. A., and Prather, K. A.: Using mass spectral source signatures to apportion exhaust particles from gasoline and diesel powered vehicles in a freeway study using UF-ATOFMS, Atmos. Environ., 42, 568–581, https://doi.org/10.1016/j.atmosenv.2007.08.005, 2008.
Varutbangkul, V., Brechtel, F. J., Bahreini, R., Ng, N. L., Keywood, M. D., Kroll, J. H., Flagan, R. C., Seinfeld, J. H., Lee, A., and Goldstein, A. H.: Hygroscopicity of secondary organic aerosols formed by oxidation of cycloalkenes, monoterpenes, sesquiterpenes, and related compounds, Atmos. Chem. Phys., 6, 2367–2388, https://doi.org/10.5194/acp-6-2367-2006, 2006.
Wang, X. N., Ye, X. N., Chen, H., Chen, J. M., Yang, X., and Gross, D. S.: Online hygroscopicity and chemical measurement of urban aerosol in Shanghai, China, Atmos. Environ., 95, 318–326, https://doi.org/10.1016/j.atmosenv.2014.06.051, 2014.
Weingartner, E., Burtscher, H., and Baltensperger, U.: Hygroscopic properties of carbon and diesel soot particles, Atmos. Environ., 31, 2311–2327, 1997.
Ye, X. N., Chen, T. Y., Hu, D. W., Yang, X., Chen, J. M., Zhang, R. Y., Khakuziv, A. F., and Wang, L.: A Multifunctional HTDMA System with a Robust Temperature Control, Adv. Atmos. Sci., 26, 1235–1240, https://doi.org/10.1007/s00376-009-8134-3, 2009.
Ye, X. N., Ma, Z., Hu, D. W., Yang, X., and Chen, J. M.: Size-resolved hygroscopicity of submicrometer urban aerosols in Shanghai during wintertime, Atmos. Res., 99, 353–364, https://doi.org/10.1016/j.atmosres.2010.11.008, 2011.
Ye, X., Tang, C., Yin, Z., Chen, J., Ma, Z., Kong, L., Yang, X., Gao, W., and Geng, F.: Hygroscopic growth of urban aerosol particles during the 2009 Mirage-Shanghai Campaign, Atmos. Environ., 64, 263–269, https://doi.org/10.1016/j.atmosenv.2012.09.064, 2013.
Zauscher, M. D., Wang, Y., Moore, M. J. K., Gaston, C. J., and Prather, K. A.: Air Quality Impact and Physicochemical Aging of Biomass Burning Aerosols during the 2007 San Diego Wildfires, Environ. Sci. Technol., 47, 7633–7643, https://doi.org/10.1021/es4004137, 2013.
Zelenyuk, A., Imre, D., Han, J. H., and Oatis, S.: Simultaneous measurements of individual ambient particle size, composition, effective density, and hygroscopicity, Anal. Chem., 80, 1401–1407, https://doi.org/10.1021/ac701723v, 2008.
Zhang, G., Bi, X., Chan, L. Y., Li, L., Wang, X., Feng, J., Sheng, G., Fu, J., Li, M., and Zhou, Z.: Enhanced trimethylamine-containing particles during fog events detected by single particle aerosol mass spectrometry in urban Guangzhou, China, Atmos. Environ., 55, 121–126, https://doi.org/10.1016/j.atmosenv.2012.03.038, 2012.
Zhang, Q., Jimenez, J. L., Canagaratna, M. R., Allan, J. D., Coe, H., Ulbrich, I., Alfarra, M. R., Takami, A., Middlebrook, A. M., Sun, Y. L., Dzepina, K., Dunlea, E., Docherty, K., DeCarlo, P. F., Salcedo, D., Onasch, T., Jayne, J. T., Miyoshi, T., Shimono, A., Hatakeyama, S., Takegawa, N., Kondo, Y., Schneider, J., Drewnick, F., Borrmann, S., Weimer, S., Demerjian, K., Williams, P., Bower, K., Bahreini, R., Cottrell, L., Griffin, R. J., Rautiainen, J., Sun, J. Y., Zhang, Y. M., and Worsnop, D. R.: Ubiquity and dominance of oxygenated species in organic aerosols in anthropogenically-influenced Northern Hemisphere midlatitudes, Geophys. Res. Lett., 34, L13801, https://doi.org/10.1029/2007gl029979, 2007.


