the Creative Commons Attribution 4.0 License.
the Creative Commons Attribution 4.0 License.
 | 19 May 2020
Impact of topography on black carbon transport to the southern Tibetan Plateau during the pre-monsoon season and its climatic implication
Meixin Zhang
Chun Zhao
Zhiyuan Cong
Qiuyan Du
Mingyue Xu
Yu Chen
Ming Chen
Rui Li
Yunfei Fu
Lei Zhong
Shichang Kang
Delong Zhao
Yan Yang
Most previous modeling studies about black carbon (BC) transport and its
impact over the Tibetan Plateau (TP) conducted simulations with horizontal
resolutions coarser than 20 km that may not be able to resolve the
complex topography of the Himalayas well. In this study, the two experiments
covering all of the Himalayas with the Weather Research and Forecasting model
coupled with Chemistry (WRF-Chem) at the horizontal resolution of 4 km but
with two different topography datasets (4 km complex topography and 20 km
smooth topography) are conducted for pre-monsoon season (April 2016) to
investigate the impacts of topography on modeling the transport and
distribution of BC over the TP. Both experiments show the evident accumulation
of aerosols near the southern Himalayas during the pre-monsoon season,
consistent with the satellite retrievals. The observed episode of high
surface BC concentration at the station near Mt. Everest due to heavy
biomass burning near the southern Himalayas is well captured by the
simulations. The simulations indicate that the prevailing upflow across the
Himalayas driven by the large-scale westerly and small-scale southerly
circulations during the daytime is the dominant transport mechanism of southern
Asian BC into the TP, and it is much stronger than that during the nighttime.
The simulation with the 4 km topography resolves more valleys and mountain
ridges and shows that the BC transport across the Himalayas can overcome the
majority of mountain ridges, but the valley transport is more efficient. The
complex topography results in stronger overall cross-Himalayan transport
during the simulation period primarily due to the strengthened efficiency of
near-surface meridional transport towards the TP, enhanced wind speed at
some valleys and deeper valley channels associated with larger transported
BC mass volume. This results in 50 % higher transport flux of BC across
the Himalayas and 30 %–50 % stronger BC radiative heating in the atmosphere
up to 10 km over the TP from the simulation with the 4 km complex topography
than that with the 20 km smoother topography. The different topography also
leads to different distributions of snow cover and BC forcing in snow. This
study implies that the relatively smooth topography used by the models with
resolutions coarser than 20 km may introduce significant negative biases in
estimating light-absorbing aerosol radiative forcing over the TP during the
pre-monsoon season.
Highlights.
-
The black carbon (BC) transport across the Himalayas can overcome the majority of mountain ridges, but the valley transport is much more efficient during the pre-monsoon season.
-
The complex topography results in stronger overall cross-Himalayan transport during the study period primarily due to the strengthened efficiency of near-surface meridional transport towards the TP, enhanced wind speed at some valleys and deeper valley channels associated with larger transported BC mass volume.
-
The complex topography generates 50 % higher transport flux of BC across the Himalayas and 30 %–50 % stronger BC radiative heating in the atmosphere up to 10 km over the Tibetan Plateau (TP) than the smoother topography, which implies that the smooth topography used by the models with relatively coarse resolution may introduce significant negative biases in estimating BC radiative forcing over the TP during the pre-monsoon season.
-
The different topography also leads to different distributions of snow cover and BC forcing in snow over the TP.
- Article
(2587 KB) - Full-text XML
-
Supplement
(2288 KB) - BibTeX
- EndNote


The Tibetan Plateau (TP) is the highest plateau in the world with an average elevation over 4 km and an area of approximately 2.5×10⁶ km2; it is known as the world's third pole (Qiu, 2008), and its enormous dynamic and thermal effects have a huge impact on large-scale atmospheric circulation through the energy exchange with the atmosphere, especially the troposphere, such as Asian monsoons (e.g., Ye and Wu, 1998; Duan and Wu, 2005; Wu et al., 2007, 2012a; Boos and Kuang, 2013; Chen and Bordoni, 2014; He et al., 2019; Zhao et al., 2019). In addition, the glacial melting water of the TP is one of the important sources of water resources of the Indus River, Ganges River, Yangtze River and Yellow River in Asia (e.g., Singh and Bengtsson, 2004; Barnett et al., 2005; Immerzeel et al., 2010; Lutz et al., 2014). Previous studies found aerosols in the atmosphere over or around the TP could change the regional climate of Asia (e.g., Qian et al., 2011, 2015; Lau et al., 2017; Lau and Kim, 2018). Model simulations showed that the absorptive aerosols changed the surface radiative flux over the TP by 5–25 W m−2 during the pre-monsoon season in April and May and led to the changes in summer monsoon circulations (Qian et al., 2011). Meanwhile, aerosol may affect the atmosphere by modulating the vertical structure of clouds and precipitation around the TP and thus change the distribution of atmospheric latent heat around the TP; this is the main driving force of regional atmosphere circulations (e.g., Li and Min, 2010; R. Li et al., 2017, 2019). Moreover, when absorbing aerosols settle on the snow-covered areas, they will blacken the surface of snow cover and glaciers to a large extent (e.g., Hansen and Nazarenko, 2004; Ramanathan and Carmichael, 2008; Lau et al., 2010; Lee et al., 2013; Y. Zhang et al., 2017, 2018; Lau and Kim, 2018), reduce the snow albedo so as to absorb more solar radiation, and cause the consequences of accelerated melting (e.g., Ramanathan et al., 2007; Ming et al., 2009; Yasunari et al., 2010; Ji et al., 2015; Zhang et al., 2015). According to the Intergovernmental Panel on Climate Change Fifth Assessment Report (IPCC AR5), the radiative forcing caused by the important component of absorbing aerosols and black carbon (BC) on the surface snow is 0.04 W m−2 (0.02–0.09 W m−2) on average globally, and the regional forcing (such as over the Arctic and the Himalayas) can be considerably large.
The TP is surrounded by various sources of pollutants. Over the south of the TP, previous studies have suggested that southern Asia was the main source of pollutants transported to the plateau (e.g., Cong et al., 2009, 2015a, b; Kopacz et al., 2011; Lu et al., 2012; Zhao et al., 2013; Wang et al., 2015; Zhang et al., 2015; Kang et al., 2016, 2019; Li et al., 2016; Chen et al., 2018). A huge blanket or layer of “haze” is composed of light-absorbing carbonaceous aerosol particles that often erupts in the pre-monsoon season over southern Asia and has a significant influence on the plateau (e.g., Prasad and Singh, 2007; Engling and Gelencser, 2010). Among them, biomass burning emissions reaching the maximum in the pre-monsoon season over southern Asia is one of the dominant sources (e.g., Cong et al., 2015b). Many studies investigated the transport mechanisms of pollutants from southern Asia to the TP and found that the pollutants transported across the Himalayas were mainly due to the combination of a large-scale circulation and regional wind (e.g., Hindman and Upadhyay, 2002; Cao et al., 2010; Dumka et al., 2010; Marinoni et al., 2010; Cong et al., 2015a; Kang et al., 2016; Lüthi et al., 2015; R. Zhang et al., 2017). Cong et al. (2015b) suggested that strong large-scale westerly and local small-scale mountain-valley wind passed through western Nepal, northwestern India and Pakistan (i.e., southern Himalayas) in the pre-monsoon season. Dumka et al. (2010) and Kang et al. (2016) inferred from the trajectory analysis that long-distance transport from Africa and Europe may also affect the BC concentration of the Himalayas in addition to the influence of regional pollution. The synoptic troughs and ridges were also found favoring the transport of pollutants into the TP from southern Asia (Lüthi et al., 2015).
Although previous studies have confirmed the transport of pollutants across the Himalayas, the complex topography of the Himalayas complicates transport mechanisms. On one hand, Cao et al. (2010) revealed that the Himalayas acted as a huge barrier to the transport of a large amount of BC over the plateau based on model simulations. On the other hand, some studies found that the valleys across the Himalayas served as channels for the efficient transport of pollutants (e.g., Hindman and Upadhyay, 2002; Marinoni et al., 2010). Marinoni et al. (2010) analyzed the observation of wind at a station of the southern Himalayas and found that a distinct valley wind system with the prominent southerly continuously transported pollutants to the plateau. Most of these studies used observations and back-trajectory models to demonstrate the transport pathways of pollutants to the TP, which cannot explicitly reveal the transport mechanisms underneath, in particular quantifying the impacts of the complex topography.
A few of modeling studies investigated the pollutant transport mechanisms using 3-D chemical transport models (e.g., Kopacz et al., 2011; Liu et al., 2015; R. Zhang et al., 2017; Yang et al., 2018). However, most of them simulated transport processes at relatively coarse horizontal resolutions (e.g., 20–100 km), which cannot resolve the complex topography of the Himalayas well. It is noteworthy that studies about the aerosol climatic impact over the TP also used the models at relatively coarse horizontal resolutions (e.g., Flanner and Zender, 2005; Menon et al., 2010; Kopacz et al., 2011; Qian et al., 2011, 2015; He et al., 2014; Zhang et al., 2015; Ji, 2016). So far, there is only one study that used a chemical transport model at a horizontal resolution of less than 10 km to investigate pollutant transport mechanisms over the eastern Himalayas (Cao et al., 2010). Furthermore, none of the studies quantitatively assessed the impacts of topography on modeling the pollutant transport across the Himalayas and hence on estimating aerosol distribution and radiative forcing over the TP.
In order to examine the potential impacts of the complex topography on pollutant transport across the Himalayas over the TP, this study conducts multiple experiments with the Weather Research and Forecasting model coupled with Chemistry (WRF-Chem; Grell et al., 2005; Skamarock et al., 2008). The WRF-Chem model is selected because it includes the interaction between meteorology and aerosol and is widely used for the regional modeling of aerosol and its climatic impact (e.g., Cao et al., 2010; Zhao et al., 2010, 2011, 2012, 2014; Wu et al., 2013; Gao et al., 2014; Huang et al., 2015; Fan et al., 2015; Feng et al., 2016; Zhong et al., 2017; Sarangi et al., 2019; Liu et al., 2020). The model has also been used to investigate the aerosol transport and climatic impact over the Himalayan region (e.g., Feng et al., 2016; Cao et al., 2010; Sarangi et al., 2019). The model is suitable for simulations at hydrostatic and non-hydrostatic scales and thus can be used for investigating the impacts of resolution-dependent features, such as topography, on modeling results. In particular, the meteorological part of the model (WRF) has been systematically evaluated and used to investigate the impacts of resolutions on simulations of moisture transport and climate over the Himalayan region (e.g., Shi et al., 2008; Karki et al., 2017; Lin et al., 2018; Zhou et al., 2017, 2018; Wang et al., 2020). All of these previous studies with the model lay the foundation for this modeling study.
Two experiments with different topography representations are conducted to investigate the impacts of topography complexity on the pollutant transport across the Himalayas and the resulting radiative forcing over the TP. The simulations are conducted for April 2016 in the pre-monsoon season because southern Asia is seriously polluted during this period and the pollutants transported to the TP during the period may have significant impacts on the Asian monsoon system (e.g., Lau and Kim, 2006; Lau et al., 2006; Ding et al., 2009; Kuhlmann and Quaas, 2010; Qian et al., 2011, 2015). In addition, the observed concentration of BC at the observation station near Mt. Everest shows an evident pollution episode from 5 to 16 April 2016, deserving the investigation of the transport mechanisms. The rest of the paper is organized as follows. Section 2 briefly describes the WRF-Chem model, the physics parameterizations and the model configuration for this study, followed by a description of the data for evaluation. The series of numerical experiments at different resolutions are analyzed in Sect. 3. The findings are then summarized and discussed in Sects. 4 and 5.
2.1 Model and experiments
2.1.1 WRF-Chem model
In this study, the version of WRF-Chem updated by the University of Science and Technology of China (USTC version of WRF-Chem) is used. This USTC version of WRF-Chem includes some additional capabilities such as the diagnosis of radiative forcing of aerosol species, land-surface-coupled biogenic-volatile-organic-compound (VOC) emission and aerosol–snow interactions compared with the publicly released version (Zhao et al., 2013a, b, 2014, 2016; Hu et al., 2019; Du et al., 2020). The Model for Simulating Aerosol Interactions and Chemistry (MOSAIC; Zaveri et al., 2008) and the Carbon Bond Mechanism Z (CBM-Z) gas phase mechanisms (Zaveri and Peters, 1999) are selected. The MOSAIC aerosol scheme uses an approach of segmentation to represent aerosol size distribution with four or eight discrete size bins (Fast et al., 2006). It consists of a range of physical and chemical processes such as nucleation, condensation, coagulation, aqueous phase chemistry and water uptake by aerosol. The parameterization of the dry deposition of aerosol mass and number is according to the method of Binkowski and Shankar (1995), including particle diffusion and gravitational effects. Aerosol–cloud interactions were included in the model by Gustafson et al. (2007) for calculating the activation and resuspension between dry aerosols and cloud droplets. The wet removal of grid-resolved stratiform clouds/precipitation includes two aspects, namely in-cloud removal (rainout) and below-cloud removal (washout) by Easter et al. (2004) and Chapman et al. (2009), respectively. Aerosol optical properties such as single-scattering albedo (SSA) and scattering asymmetry and so on are calculated at each model grid through the function of wavelength. The shortwave (SW) and longwave (LW) refractive indices of aerosols use the Optical Properties of Aerosols and Clouds (OPAC) dataset (Hess et al., 1998), with a detailed description of the computation of aerosol optical properties can be found in Barnard et al. (2010) and Zhao et al. (2013a). For both short wave and long wave radiation, aerosol radiation feedback combined with the Rapid Radiative Transfer Model for General Circulation Models (RRTMG; Mlawer et al., 1997; Iacono et al., 2000) was implemented by Zhao et al. (2011). For the diagnosis of the optical properties and direct radiative forcing of various aerosol species in the atmosphere, the method described by Zhao et al. (2013a) is adopted. The radiative forcing of light-absorbing aerosol in surface snow is estimated with the Snow, Ice, and Aerosol Radiative model (SNICAR; Flanner and Zender, 2005) in the land surface scheme as introduced by Zhao et al. (2014). Please note that the SNICAR model was recently updated by He et al. (2018) to include the impact of non-spherical snow grains on aerosol snow-albedo effect that is not included in this study. More details about the coupling between the WRF-Chem and SNICAR models can be found in Zhao et al. (2014).
2.1.2 Numerical experiments
In this study, the WRF-Chem simulations are performed with two nested domains (one-way nesting), one outer domain at 20 km horizontal resolution with 350×250 grid cells (62–112∘ E, 1–38∘ N) and one inner domain at 4 km horizontal resolution with 400×300 grid cells (75–92∘ E, 23–35∘ N) (Fig. 1). The inner domain roughly covers all of the Himalayas. The WRF-Chem simulations conducted in this study use the terrain following coordinate (Skamarock et al., 2008). To resolve the vertical structure of transport across the Himalayas, the simulations are configured with 54 vertical layers and denser layers near the surface. For example, averaged over a region (26–28∘ N, 76–80∘ E) near the southern Himalayas, there are about 17 layers below 2 km above the ground (Fig. 2). The goal of this study is to investigate the impacts of different representations of topography on the transport of BC across the Himalayas. Therefore, besides this control experiment, one sensitivity (idealized) experiment is also conducted with the same configuration as the control one except that the terrain heights of the inner domain at 4 km resolution are bilinearly interpolated from the terrain heights at 20 km resolution similar as previous studies (e.g., Shi et al., 2008; Wu et al., 2012b; Lin et al., 2018). The two experiments are referred to the simulations with the complex and smooth topographies, respectively, hereafter.

Figure 1Anthropogenic and fire emissions over the simulated regions with 20 and 4 km resolutions; the black dot represents the Qomolangma station (QOMS; 86.95∘ E, 28.36∘ N).
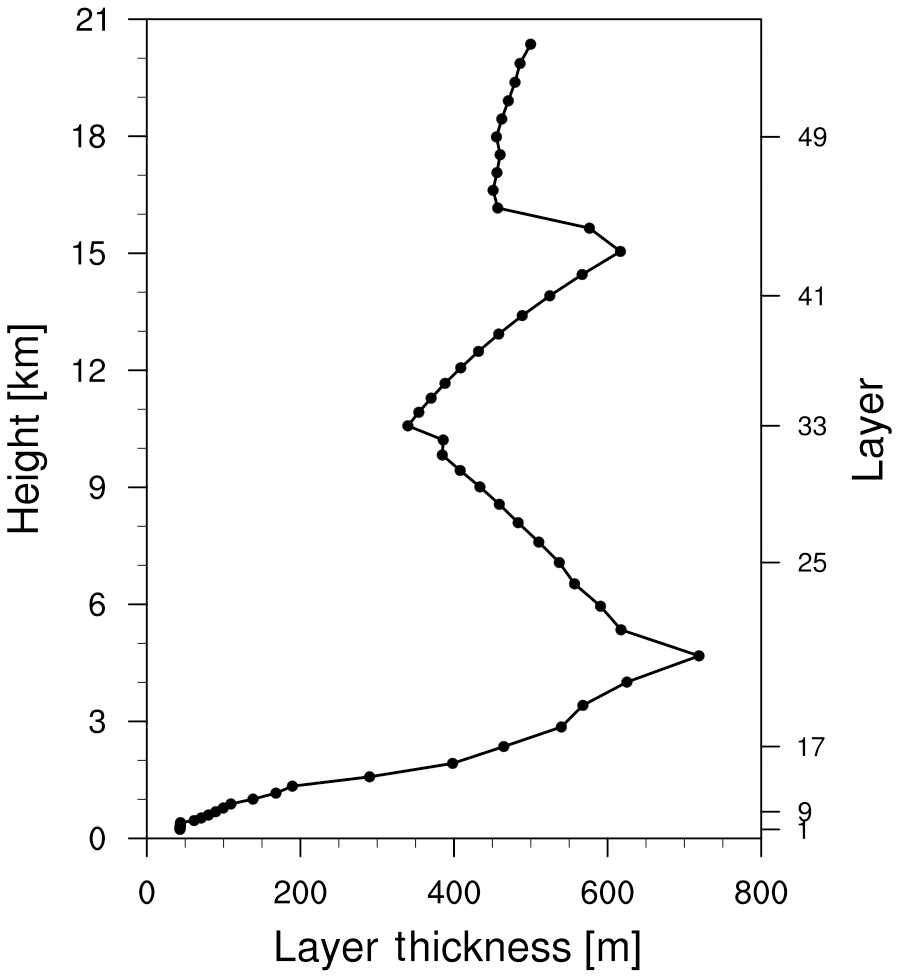
Figure 3 shows the spatial distribution of terrain height over the inner domain with the complex (4 km dataset) and smooth (20 km dataset) topographies. It is evident that the terrain is much smoother from the 20 km dataset than from the 4 km dataset. The mountain ridges and valleys can be resolved to some extent in the 4 km dataset but mostly missed or underestimated at 20 km. The probability distributions of terrain height over the Himalayas from the 20 and 4 km datasets (Fig. S1 in the Supplement) show that the difference between the two datasets is small for the terrain height lower than ∼4.5 km but is significant for the terrain height above ∼4.5 km. In addition, the slopes between the neighboring grids are significantly reduced in general with the smooth topography compared to with the complex topography, particularly over the Himalayan region (Fig. S2). The difference of results from the two experiments over the inner domain is analyzed as the impacts of topography representations. Therefore, all the results shown below are from the simulations of the inner domain at 4 km resolution with the different topography if not otherwise stated. It is noteworthy that this study focuses on understanding the impact of the complex topography resolved by 4 km instead of the difference between 4 and 20 km simulations. Prescribing the topography at 4 km following the 20 km resolution distribution is just one way to smooth the topography. In fact, the sensitivity experiment at 4 km resolution with the topography from the 1 ∘ resolution dataset is also conducted, and the result is consistent. In addition, although the topography at 4 km resolution resolves the topography of the Himalayas much better than at 20 km resolution, it still cannot fully resolve the complexity of the topography of the Himalayas. The higher resolution (e.g., 1 km or less than 1 km) may be needed. Previous studies have found that the simulations at the resolutions between 1 and 4 km can produce generally consistent features, but the simulation at 1 km with a better representation of topography can produce a little better meteorological field compared to the observations (e.g., Karki et al., 2017). One sensitivity experiment at 1.5 km resolution is also conducted in this study and found that the difference between the simulations at 1.5 and 4 km resolutions is relatively small. However, it should be noted that the simulation at 1.5 km resolution is only conducted covering a much smaller region for a shorter period due to the computational cost. The experiment at 4 km instead of 1.5 km resolution is conducted finally for the study region and period due to the balance of resolving the complex topography to some extent and affordable computational cost.
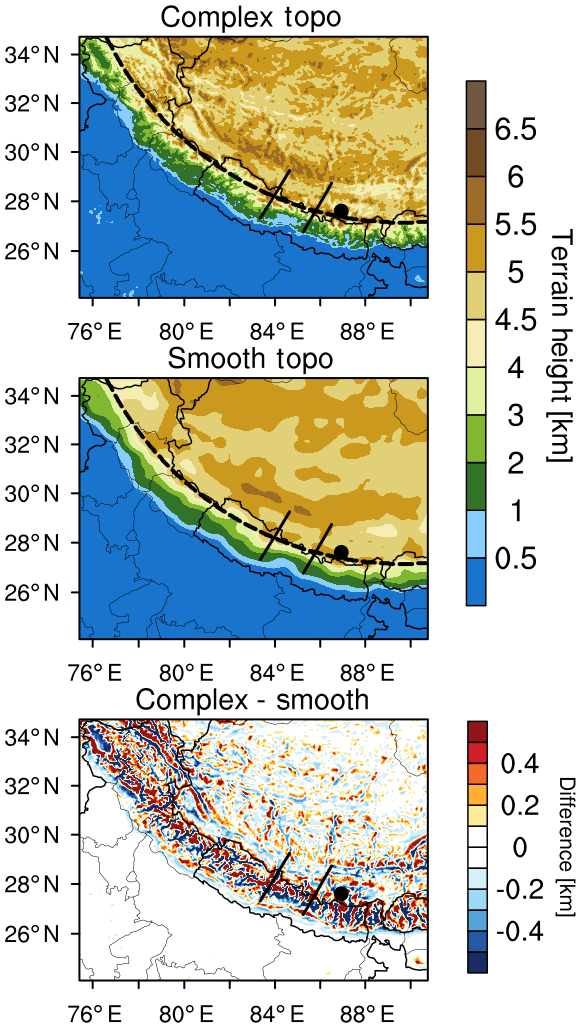
Figure 3Spatial distributions of terrain height from the dataset at 4 km resolution with the complex topography (complex topo) and smooth topography (smooth topo), which was bilinearly interpolated from the 20 km resolution dataset. The dashed line and two solid lines represent the cross sections for analysis in the following.
The simulations are conducted for 29 March–20 April 2016 for the reason discussed in the Introduction. The results of 1–20 April are analyzed for the observed pollution episode to allow for a few days of spin-up for the chemical initial condition. The meteorological initial and lateral boundary conditions are derived from the European Centre for Medium-Range Weather Forecasts (ECMWF) reanalysis data at 0.5∘ × 0.66∘ horizontal resolution and 6 h temporal intervals (ERA-Interim dataset). The modeled u and v component wind, atmospheric temperature and geopotential height over the outer domain are nudged towards the reanalysis data with a nudging timescale of 6 h following previous studies (e.g., Stauffer and Seaman, 1990; Seaman et al., 1995; Liu et al., 2012; Zhao et al., 2014; Karki et al., 2017; Hu et al., 2016, 2020). The spectral-nudging method is applied to balance the performance of the simulation at large and small scales (Liu et al., 2012) and only to the layers above the planetary boundary layer (PBL) with nudging coefficients of s−1. A wave number of 3 is selected for both the south–north and west–east directions. Please note that the choices of nudging coefficients and wave numbers for spectral nudging in this study are empirical. The purpose of nudging is to simulate reasonably large-scale features so that small-scale impacts from the complex topography can be focused. Therefore, the modeling sensitivity to these choices is not tested in this study. The results show that the simulations with the nudging method can reproduce the large-scale circulation at 700 hPa and higher over the outer domain compared to the reanalysis dataset with the spatial correlation coefficient of 0.96–0.98.
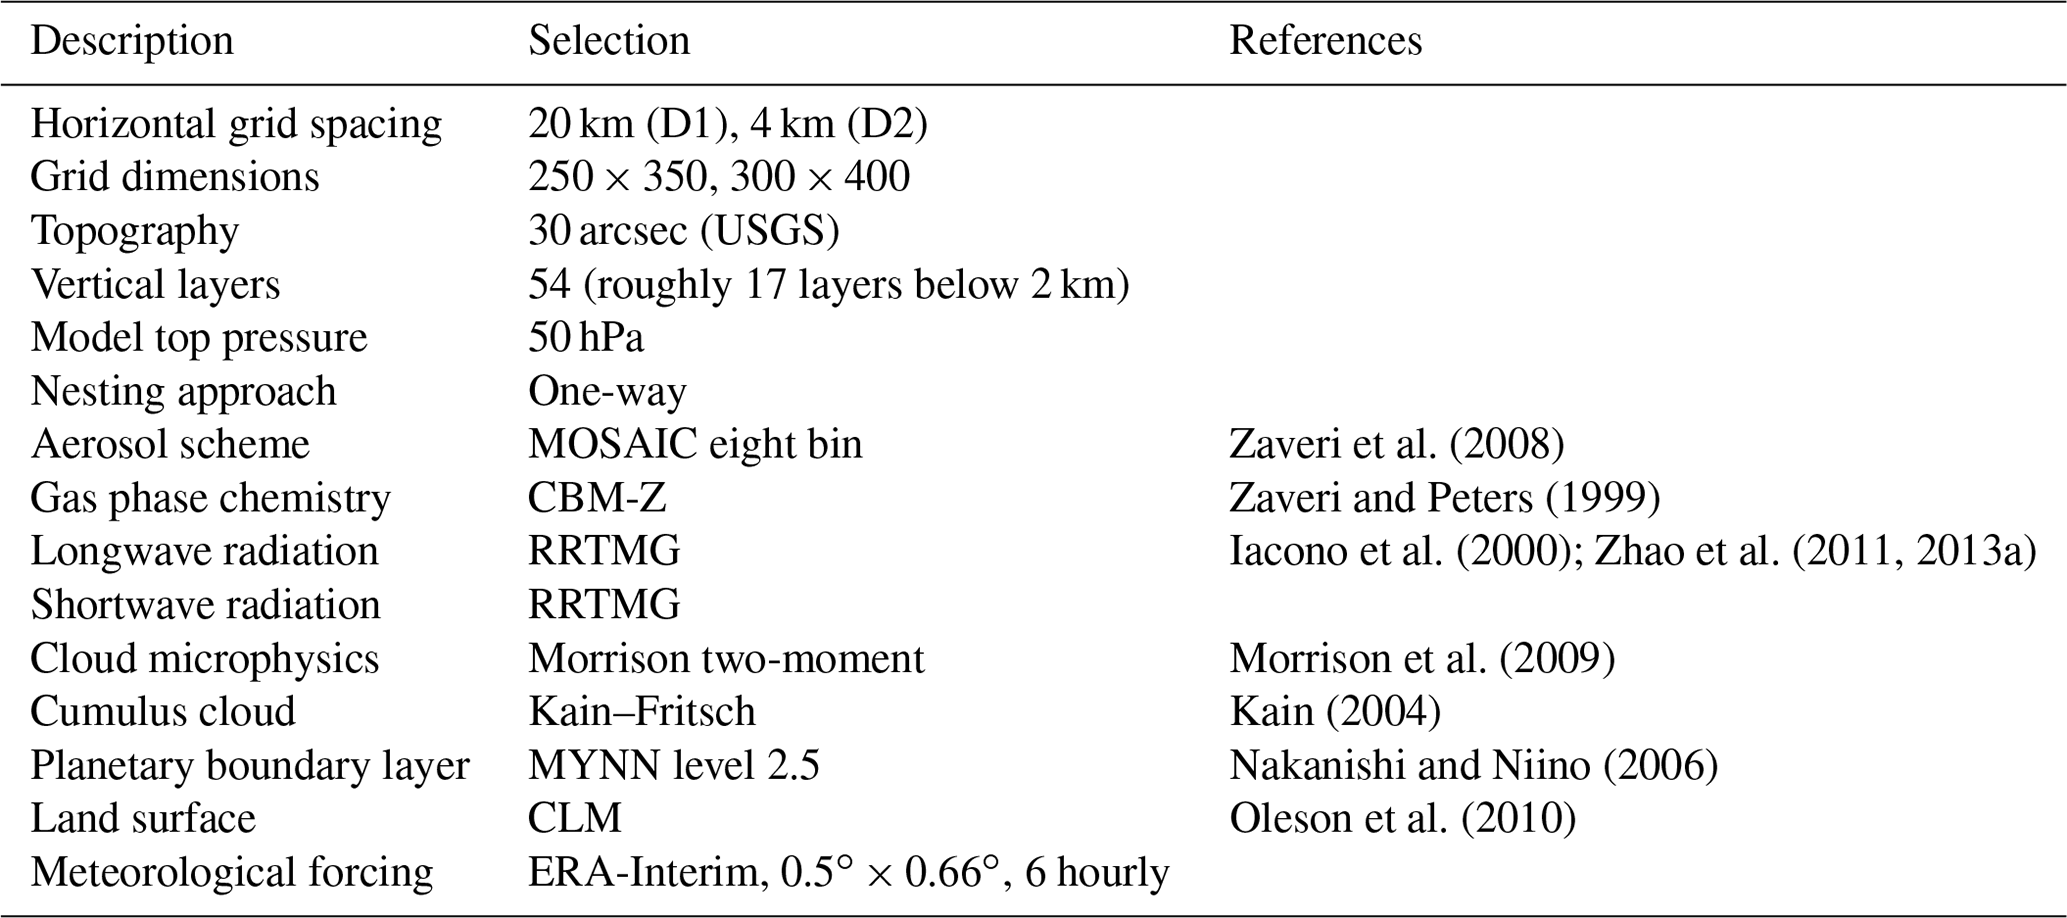
The Mellor–Yamada–Nakanishi–Niino (MYNN) planetary-boundary-layer scheme (Nakanishi and Niino, 2006), Community Land Model (CLM) land surface scheme (Oleson et al., 2010), Morrison two-moment microphysics scheme (Morrison et al., 2009), Kain–Fritsch cumulus scheme (Kain, 2004), and Rapid Radiative Transfer Model (RRTMG) longwave and shortwave radiation schemes (Iacono et al., 2000) are used in this study. It is noteworthy that the cumulus scheme is only used in the outer domain at 20 km resolution and is turned off in the inner domain at 4 km resolution. The chemical initial and boundary conditions are provided by a quasi-global WRF-Chem simulation for the same time period to include long-range transported chemical species. The quasi-global WRF-Chem simulation is performed at 1∘ × 1∘ horizontal resolution using a quasi-global channel configuration with 360×130 grid cells (180∘ W–180∘ E, 60∘ S–70∘ N). More details about the general configuration of a quasi-global WRF-Chem simulation can be found in Zhao et al. (2013b) and Hu et al. (2016). The detailed configuration of WRF-Chem experiments is summarized in Table 1. Due to the lack of publicly available in situ observations, this study does not tend to systematically evaluate the simulated meteorological fields over the Himalayan region. However, as shown in Table 1, the choice of physical parameterizations in this study follows that of one previous study (Karki et al., 2017) that evaluated systematically the WRF simulation for 1 entire year over the Himalayan region. Their results showed that the WRF simulation at a convection-permitting scale could generally capture the essential features of meteorological fields such as precipitation, temperature and wind over the Himalayan region. Therefore, the WRF-Chem simulations in this study are reliable to investigate the impacts of topography over the Himalayan region.
2.1.3 Emissions
Anthropogenic emissions for outer and inner simulation domains are obtained from the Hemispheric Transport of Air Pollution version 2 (HTAPv2) inventory at 0.1∘ × 0.1∘ horizontal resolution and a monthly temporal resolution for the year 2010 (Janssens-Maenhout et al., 2015), with the exception that emissions of eastern Asia are from the mosaic Asian anthropogenic emission inventory (MIX) at 0.1∘ × 0.1∘ horizontal resolution for 2015 (M. Li et al., 2017). Biomass burning emissions are obtained from the Fire Inventory (FINN) of the National Center for Atmospheric Research with hourly temporal resolution and 1 km horizontal resolution (Wiedinmyer et al., 2011) for the simulation period and are vertically distributed following the injection heights suggested by Dentener et al. (2006) from the Aerosol Comparison between Observations and Models (AeroCom) project. Sea-salt emission values follow Zhao et al. (2013b), which includes the correction of particles with a radius less than 0.2 µm (Gong, 2003) and the dependence of sea-salt emissions on sea surface temperature (Jaeglé et al., 2011). The vertical dust fluxes are calculated with the Georgia Institute of Technology–Goddard Global Ozone Chemistry Aerosol Radiation and Transport (GOCART) dust emission scheme (Ginoux et al., 2001), and the emitted dust particles are distributed into the MOSAIC aerosol size bins following a theoretical expression based on the physics of scale-invariant fragmentation of brittle materials derived by Kok (2011). More details about the dust emission scheme coupled with MOSAIC aerosol scheme in WRF-Chem can be found in Zhao et al. (2010, 2013b).
As shown in Fig. 1, anthropogenic fossil fuel emissions of BC are high over northeastern India. The fossil fuel BC emissions over Nepal, the country nearby the southern Himalayas, are relatively low. Instead, biomass burning emissions of BC are extremely high in Nepal and northwestern India (southern Himalayas at 26–29∘ N). Averaged over the southern Himalayas of the inner domain that may significantly affect the pollutant transport into the TP, the biomass burning emissions of BC are much higher than its anthropogenic fossil fuel emissions, particularly for the pollution episode (Fig. 4). The anthropogenic BC emissions are set constant through April, while biomass burning emissions show a strong fire event in 5–16 April. During the event, the biomass burning BC emissions can be a factor of 2 of the anthropogenic fossil fuel BC emissions over the southern Himalayas.
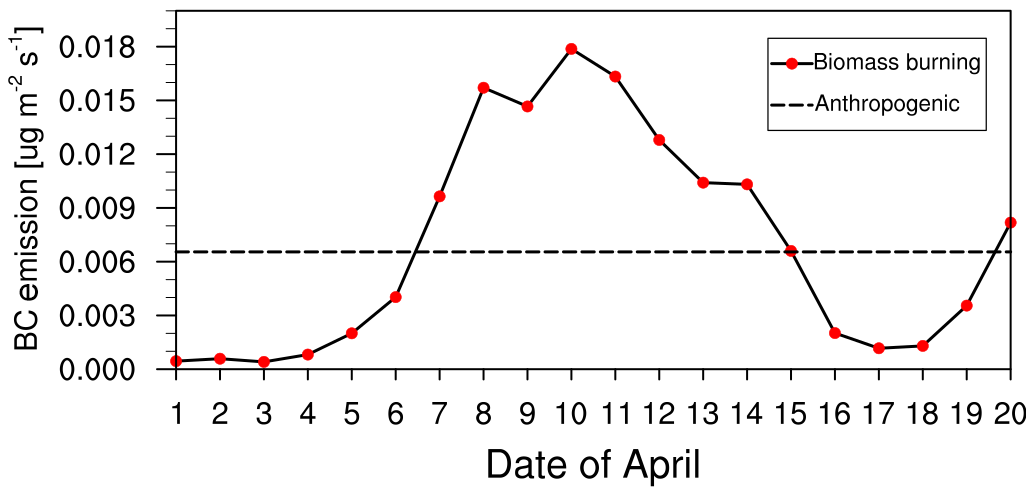
Figure 4Time series of area-averaged daily fire emissions between 26 and 29∘ N over the simulation domain at 4 km resolution. (The dashed line in the figure represents the anthropogenic emissions).
2.2 Dataset
Three datasets are used to compare with the modeling results to demonstrate the pollutant episode and spatial distribution. One is from the Moderate Resolution Imaging Spectroradiometer (MODIS) instruments on the Aqua and Terra satellites. The MODIS Aerosol Product monitors the ambient aerosol optical thickness over the oceans globally and over the continents. Daily level 2 products of aerosol optical depth (AOD) at 550 nm with a spatial resolution of 10 km × 10 km (at nadir) from both Aqua and Terra are applied. When compared with the modeling results, the simulations are sampled at the satellite overpass time and location. The second one is from the Aerosol Robotic Network (AERONET; Holben et al., 1998) that has ∼100 similar globally distributed sun- and sky-scanning ground-based automated radiometers, which provide measurements of aerosol optical properties throughout the world (Dubovik and King, 2000; Dubovik et al., 2002). In this study, AERONET measured AOD at 675 and 440 nm from two sites over the TP, the QOMS_CAS site (86.95∘ E, 28.36∘ N) and the NAM_CO site (90.96∘ E, 30.77∘ N), which are used to derive the AOD at 550 nm (using the Ångström exponent) for comparison with modeling results at 550 nm. All of the retrievals of AOD are at quality level 2, and the uncertainty of AOD measurements is about 0.01 (Holben et al., 2001). In this study, the available data in April 2016 are used to evaluate the modeling results during the same period.
The third one is the measurement of surface BC mass concentration collected during the simulation period for 4–20 April 2016 at the Qomolangma Station for Atmospheric and Environmental Observation and Research (QOMS; 86.95∘ E, 28.36∘ N), which is located on the northern slope of Mt. Everest, about 4276 m above sea level. The BC mass concentration is measured with the widely used Aethalometer (AE-33) instrument, which can provide real-time BC mass concentration measurements. The calibration of air flow is routinely conducted to maintain the data quality. The instrument estimates the BC mass concentration based on the optical method through measuring the reduction in light intensity induced by BC. The method assumes that the relationship between attenuation and BC surface loading is linear for low attenuation values. However, this relationship becomes nonlinear when the attenuation values are high due to a filter saturation effect, which may lead to an underestimation of the high BC concentration. The detection limit of the AE-33 instrument is 5 ng m−3, and the uncertainty is estimated to be within 10 % (e.g., Chen et al., 2018; Bansal et al., 2019; Kant et al., 2019). The dataset of BC mass concentration used in this study was reported by Chen et al. (2018), where more details about the measurements can be found.
3.1 Spatial distribution of BC around the TP
Figure 5 shows the spatial distributions of column-integrated BC mass within the inner domain from the simulations at 4 km resolution with the complex and smooth topographies averaged for 1–20 April 2016, and the difference between the two is also shown. For both experiments, the Himalayas are an apparent boundary line for the distribution of BC, with a sharp gradient across the Himalayas. The high BC mass loading exists near the southern Himalayas reaching over 10 mg m−2, which is largely contributed by the biomass burning emissions during the period (Fig. 4), while the value reduces significantly to less than 0.4 mg m−2 over the TP. The BC mass loading near the central and eastern Himalayas is higher than near the western Himalayas. In general, the column BC mass loading from the simulation with the complex topography is higher over the TP and lower over the region to the south of the Himalayas compared with the smooth topography, reflecting the stronger transport of BC from the source region to the Himalayas and TP due to the complex topography (see the discussion in Sect. 3.2). Figure 6 displays the spatial distributions of AOD from the MODIS retrievals and the simulations at 4 km with two different topographies averaged for 1–20 April 2016. In general, both simulations reproduce the overall spatial distribution of AOD, with the large values near the southern Himalayas, consistent with the BC mass loading. In addition, both the simulations and satellite retrievals show higher AOD near the central and eastern Himalayas than that near the western Himalayas during the study period. The difference between the simulations and retrievals may be partly related to the uncertainties in emissions, particularly for biomass burning emissions. Other than intense emissions, the wind circulation around the TP may also play an important role in accumulating BC near the southern Himalayas. Because of the blocking effect of the Himalayas, the wind circulation at 500 hPa is divided into the two branches of westerly and northwesterly. Both of them are relatively dry airflows with little effect on pollutant removal, favor the accumulation of pollutants near the southern Himalayas and carry the pollutants to the TP (e.g., Dumka et al., 2010; Kang et al., 2016; Cong et al., 2015a).
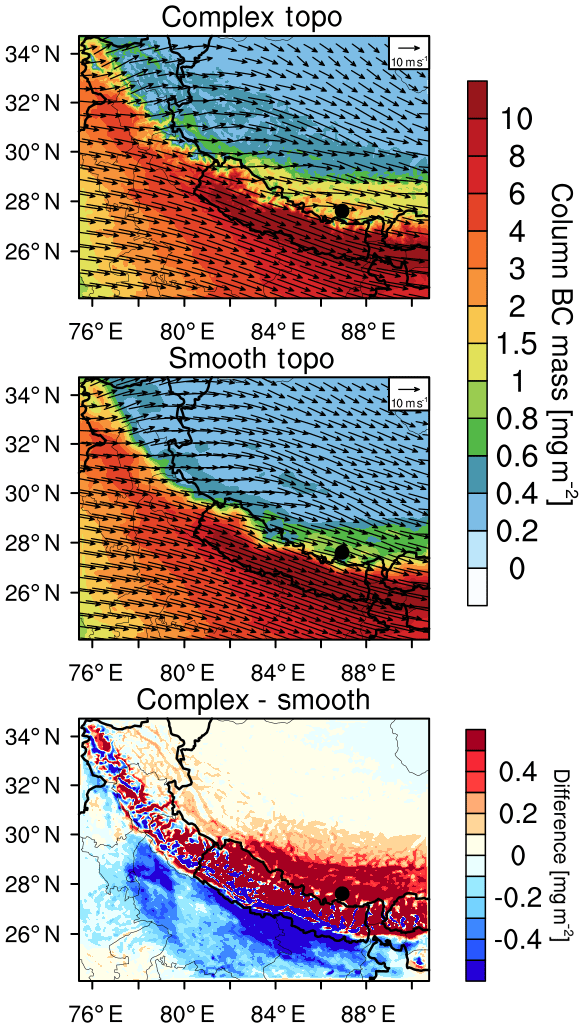
Figure 5Spatial distributions of column-integrated BC mass and the horizontal wind field at 500 hPa from the simulations with the complex and smooth topographies (complex topo and smooth topo) averaged for 1–20 April 2016. The difference between the two is also shown.
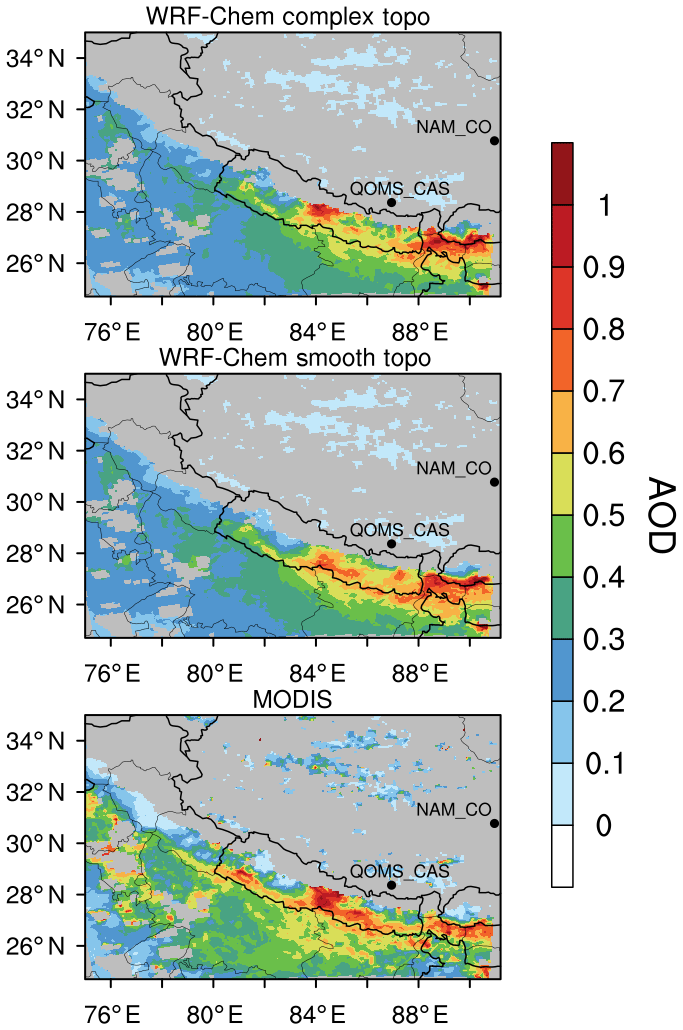
Figure 6Spatial distributions of AOD from the MODIS retrievals and the simulations with the complex and smooth topographies averaged for 1–20 April 2016. The two black dots represent the two AERONET sites over the TP (QOMS_CAS at 86.95∘ E, 28.36∘ N; NAM_CO at 90.96∘ E, 30.77∘ N).
The AOD retrieved at two AERONET sites over the TP is compared with the two simulations for 1–20 April 2016 (Fig. 7). The AOD at the QOMS_CAS site near the northern Himalayas is higher than that at the NAM_CO site inside of the TP. Both simulations can capture this gradient. The simulation with the complex topography produces higher AOD than the one with the smooth topography at both sites. The modeling biases (normalized mean bias; NMB) reduce from −46 % (smooth topography) to 9 % (complex topography) at the QOMS_CAS site and from −26 % (smooth topography) to −10 % (complex topography) at the NAM_CO site. Although the correlation coefficient between the simulations and observation increases from 0.37 (smooth topography) to 0.53 (complex topography) at the QOMS_CAS site, it is similar (∼0.2) between the two simulations at the NAM_CO site. The correlation coefficient is higher at the QOMS_CAS site near the source region than the NAM_CO site farther away, which may indicate that the model processes affecting the transport over the TP still need examination with more observations. The NAM_CO site over the eastern TP may also be affected by other sources that are not counted in this study. The modeling of temporal variations of pollutants over the TP deserves further investigation with more observations.

Figure 7Hourly AOD from the measurements of AERONET and simulations by WRF-Chem at the two sites over the TP (QOMS_CAS at 86.95∘ E, 28.36∘ N; NAM_CO at 90.96∘ E, 30.77∘ N) for 1–20 April 2016.
There is one in situ observational station (QOMS) near Mt. Everest (black dot shown in Fig. 1) to collect the surface BC concentration. The observed surface BC concentration at this station is compared with the corresponding simulations for this period as shown in Fig. 8. Without a local emission source, the surface BC concentration at QOMS is primarily contributed by the transport. The temporal variation of observed surface BC concentration correlates highly with the biomass burning emissions as shown in Fig. 4, with the peak value on 11 April reaching ∼3 µg m−3. One sensitivity experiment without biomass burning emissions shows that the simulated BC concentration at QOMS will be significantly reduced without the peak (not shown), which further proves that the BC concentration over the northern Himalayas can be largely influenced by the pollution episode near the southern Himalayas. It is noteworthy that both simulations can reproduce the episode in time and magnitude, and the difference at this station is small. The spatial distribution of difference in near-surface BC concentration between the two simulations (Fig. S3) is more heterogeneous than that of column BC mass (Fig. 5), reflecting the impact of topography on near-surface transport (see the discussion in Sect. 3.2).
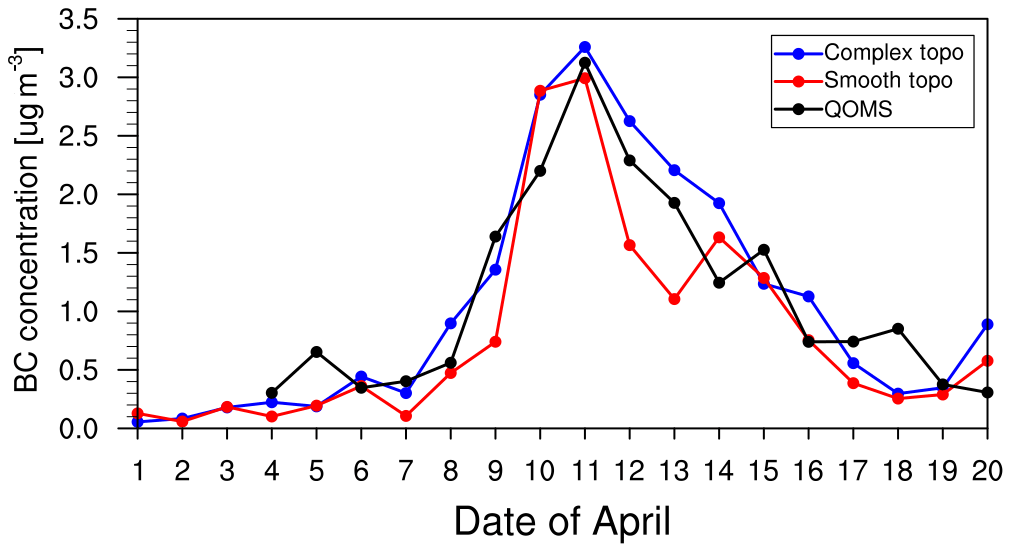
Figure 8The simulated (colored) and observed (black) temporal variability of surface BC mass concentration at the measurement station during 1–20 April 2016.
3.2 Transport flux into the TP
To further understand the difference in BC surface concentration and column mass loading over the TP between the two simulations with the different topographies, Fig. 9 shows the longitude–height cross section of BC transport flux along the cross line (shown as the black dashed line in Fig. 3) from the two simulations at 03:00 and 15:00 local time (LT) averaged for 1–20 April to represent nighttime and daytime transport, respectively. The PBL height along the cross line is also shown as the black dashed line. The transport flux is calculated by projecting the wind field perpendicularly to the cross line and then multiplying the BC mass concentration along the cross line. More specifically, the transport flux is calculated as follows:
where α is the angle between the east–west wind component and the cross line, β is the angle between the south–north wind component and the cross line, and C is the BC mass concentration at the grid along the cross line. The flux is estimated at each model level. Positive values represent the transport towards the TP, while negative values represent the transport away from the TP. It is evident that BC is imported into the TP during the day and night to the west of ∼85∘ E, although the transport flux is much larger during the daytime than nighttime. To the east of ∼85∘ E, BC is imported into the TP during the day but exported slightly from the TP during the night. The difference of transport flux between the western and eastern Himalayas is primarily due to the influence of a large-scale westerly that is weak over the eastern Himalayas (Fig. 5). The transport across the western Himalayas is controlled by the large-scale westerly, while a local southerly dominates the transport across the eastern Himalayas and also influences the transport across the central Himalayas (Fig. S4). The stronger diurnal variation of local southerly (towards the TP in the daytime to away from the TP in the nighttime) compared to that of a westerly near the surface (Fig. S4) leads to the large difference in diurnal variation of the transport between the western and eastern Himalayas. The strong transport is primarily within the PBL during the daytime, and the deeper PBL during the daytime allows BC over the source region to be mixed at a higher altitude, which also leads to stronger import transport during the day than the night. The relatively small difference in simulated PBL heights and structure between the two experiments can be due to their different surface heating resulting from different topography complexity (e.g., Wagner et al., 2014).
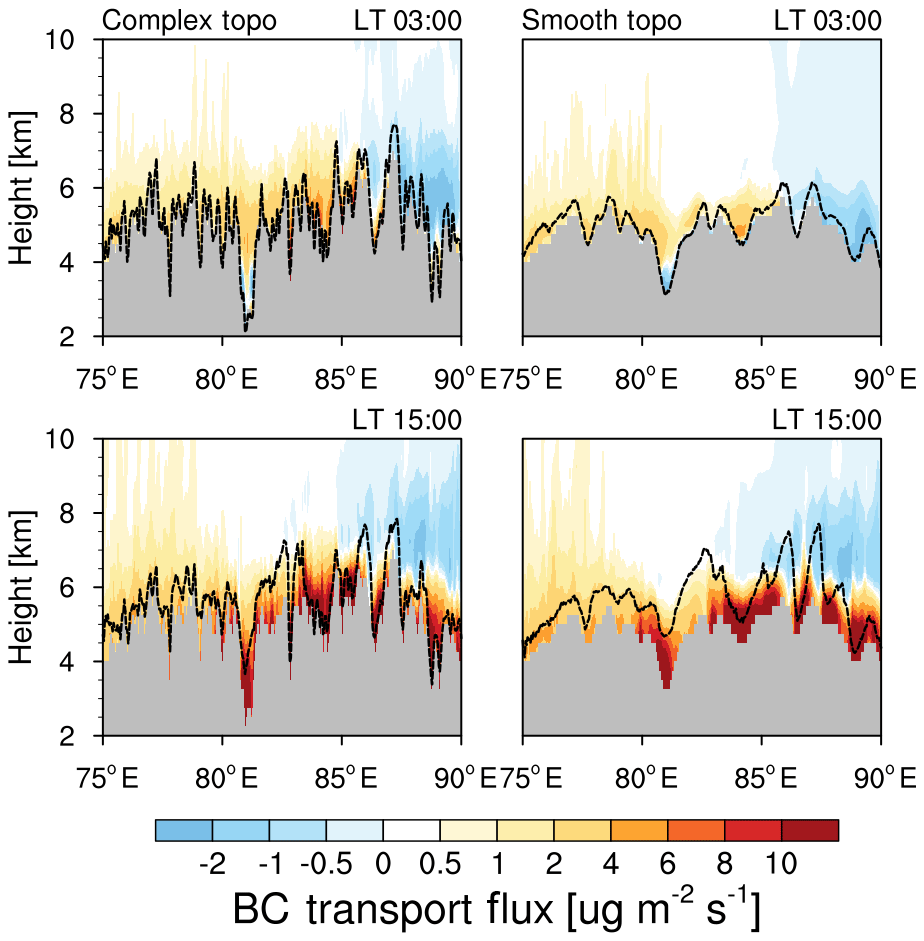
Figure 9Longitude–height cross section of BC transport flux along the cross line (shown as the black dashed line in Fig. 3) from the simulations with the complex and smooth topographies at 03:00 and 15:00 local time (LT) averaged for 1–20 April. The PBL height along the cross section is shown here as the black dashed line.
The difference between the simulations with two different topographies is evident. The mountain ridges are much higher, and valleys are much deeper with the complex topography than with the smooth topography. The simulation with the smooth topography produces overwhelming cross-Himalayan transport towards the TP within the PBL, in particular during the daytime. Although, in the simulation with the complex topography, the mountain ridges resolved weaken the cross-Himalayan transport compared to the simulation with the smooth topography, the overall positive values near the surface indicate that the transport can overcome most mountain ridges along the Himalayas. The transport fluxes near the surface from the simulation with the complex topography become close to zero only at a few mountain ridges that are 6.5 km or higher. To better demonstrate the transport pathway across mountain ridges, one cross section across the mountain ridge as shown as one black solid line in Fig. 3 is taken as one example. Figure 10 shows the latitude–height cross section of BC mass concentration and transport flux across one mountain ridge from the simulations with the complex and smooth topographies at 03:00 and 15:00 LT averaged for 1–20 April 2016. Near the southern part of mountain, the elevated concentration of BC mass accumulates and can mix up, reaching as high as 5 km with the much stronger transport during the daytime. It is obvious that the mountain ridge in the simulation with the smooth topography is quite low. With the high mountain ridge resolved by the complex topography, the simulated BC transport flux can still cross the mountain. Analysis of transport flux across a few more mountain ridges indicates similar results (not shown). The results above indicate that the transport of pollutants can cross the majority of mountain ridges of the Himalayas, which is consistent with the observation-based estimate by Gong et al. (2019) that also found pollutants could overcome the blocking effect of the mountain ridges of the Himalayas as a transport pathway. On the other hand, the resolved deeper valleys in the simulation with the complex topography enhance the transport flux compared to the one with the smooth topography. Similarly, Fig. 11 shows one example of a latitude–height cross section of BC mass concentration and transport flux across one valley from the simulations with the complex and smooth topographies at 03:00 and 15:00 LT averaged for 1–20 April 2016. The transport is much stronger and deeper along the valley from the simulation with complex topographies than the one with the smooth topography. Again, analysis of transport flux across a few more valleys does not show different results (not shown).
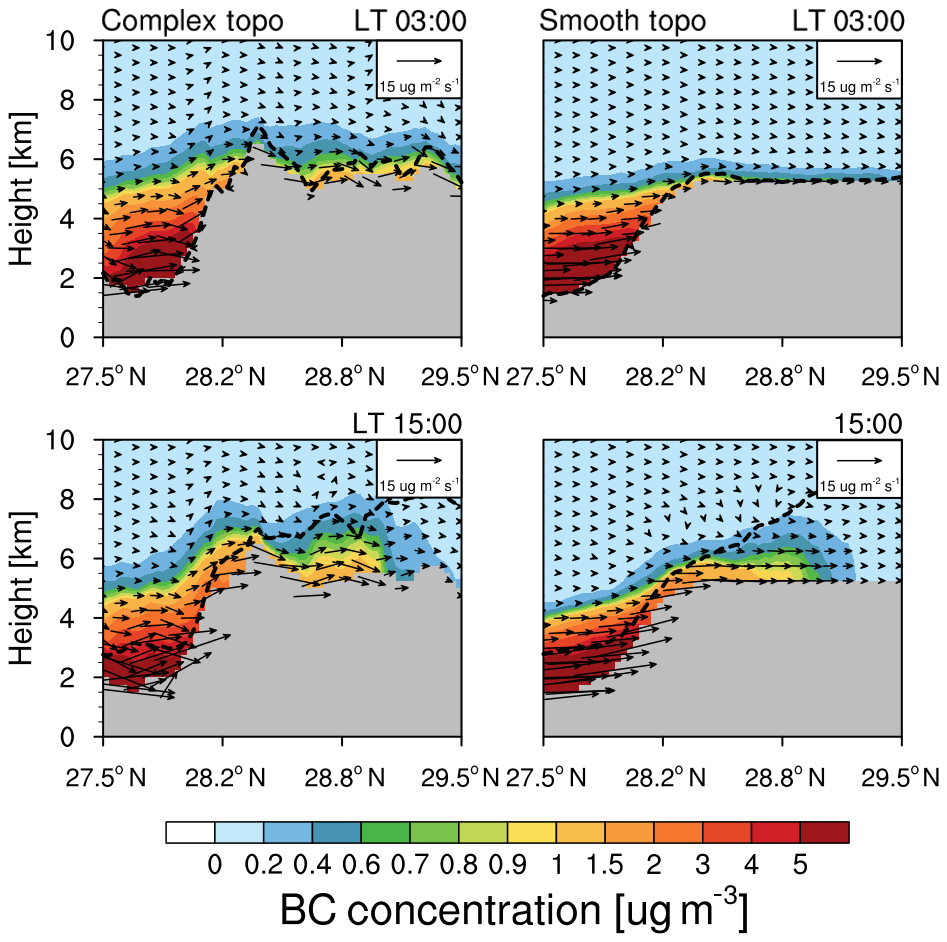
Figure 10Latitude–height cross section of BC flux (vector) across the mountain (shown as the eastern black solid line in Fig. 3) from the simulations with the complex and smooth topographies at 03:00 and 15:00 local time (LT) averaged for 1–20 April 2016. Contour represents the BC concentration.
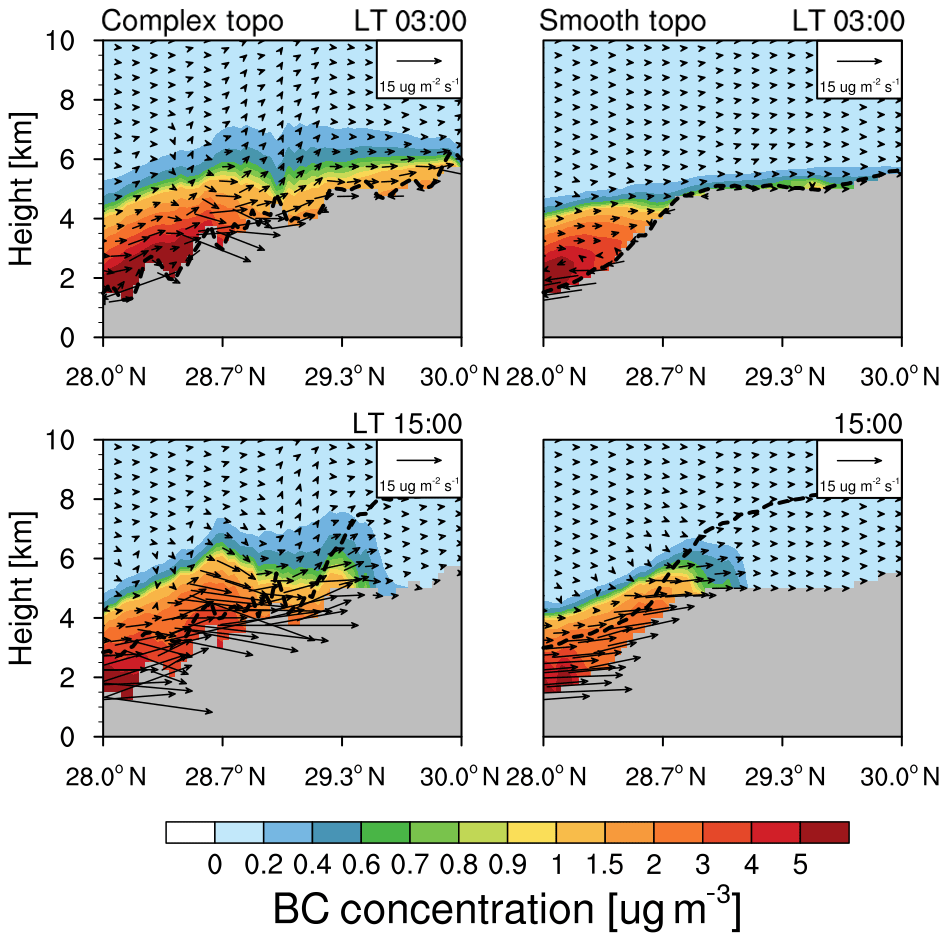
Figure 11Latitude–height cross section of BC flux (vector) along the valley (shown as the western black solid line in Fig. 3) from the simulations with the complex and smooth topographies at 03:00 and 15:00 local time (LT) averaged for 1–20 April 2016. Contour represents the BC concentration.
In order to further demonstrate the overall inflow flux across the Himalayas, the vertically integrated BC mass flux along the longitudinal cross section (as shown in Fig. 9) from the simulations with different topographies is shown in Fig. 12. The terrain heights from the two simulations along the cross section are also shown as black lines. The total mass flux is calculated by integrating the right-hand term of Eq. (1) as follows:
where δz is the thickness of each vertical model level. Similarly, positive values represent the transport towards the TP, while negative values represent the transport away from the TP. More evidently, the positive BC inflows towards the TP occur not only through the valleys but also across the mountain ridges with both topographies. The negative values only exist to the east of 88∘ E. With the complex topography, higher mountain ridges can reduce the transport flux to some extent compared to the smooth topography. The complex topography results in a significantly larger BC inflow towards the TP compared to the smooth topography, particularly corresponding to the deep valleys, such as the Karnali River valley around 82∘ E and the Kali Gandaki valley around 84∘ E.
One reason for the enhanced transport across the Himalayas with the complex topography is the resolved deeper valleys that lead to the increased valley wind. The wind across some valleys can be significantly larger with the complex topography than the smooth one (Fig. S4). The enhanced valley wind across the Himalayas has also been found by previous studies with observations and numerical simulations (e.g., Egger et al., 2000; Zängl et al., 2001; Carrera et al., 2009; Karki et al., 2017; Lin et al., 2018). However, it is noteworthy that previous studies have found that the orographic drag (including gravity wave drag and turbulence orographic form drag) over a region with complex topography, such as the Himalayas and other mountainous areas, would weaken the overall near-surface wind speed (e.g., Beljaars et al., 2004; Horvath et al., 2012; Jiménez and Dudhia, 2012; Zhou et al., 2017, 2018; Lin et al., 2018; Wang et al., 2020). Therefore, the near-surface wind speed is also examined. The complex topography does lead to the overall reduction of near-surface wind speed over the Himalayan area (Fig. S5), which is consistent with previous studies. However, it is interesting to note that the near-surface southerly wind during the daytime of the simulation period is overall increased over the Himalayan area with the complex topography (Fig. 13), which indicates that the transport towards the TP is strengthened with the complex topography in the daytime, particularly over the central and eastern Himalayas where the BC mass loading is higher (Fig. 5). During the night, the meridional wind is dominated by a northerly over the Himalayan region in the simulation with the smooth topography. The complex topography weakens the transport away from the TP or changes the wind direction from northerly to southerly over some areas of the Himalayas. Both effects enhance the overall transport efficiency across the Himalayas towards the TP. Therefore, although the complex topography weakens the overall near-surface wind speed around the Himalayas, it induces more realistic small-scale mountain-valley circulation that favors the BC transport across the Himalayas towards the TP during the study period. The wind in the free troposphere (4 km above the ground and above) is also examined, and the change due to the topography is relatively small (not shown). Another effect of resolving valleys is that the volume of relatively high-concentration BC could be higher with deeper valleys (Fig. S6), which can also result in stronger transport towards the TP even if the wind condition is similar. For example, the altitude (above the ground) below which the BC mass concentration is larger than 0.3 µg m−3 is much higher along the valleys with the complex topography than with the smooth topography (Fig. S7). The correlation coefficient between the difference of terrain heights of valleys and of volumes of relatively high-concentration BC can reach −0.76, indicating that the lower the valleys are, the higher the volumes of BC mass transported across the Himalayas can be. The combined influence of these factors results in significantly enhanced BC transport towards the TP with the complex topography (Fig. 12), which can also be demonstrated by the distributions of wind and BC mass concentration along the longitudinal cross section (Fig. S8a, b).
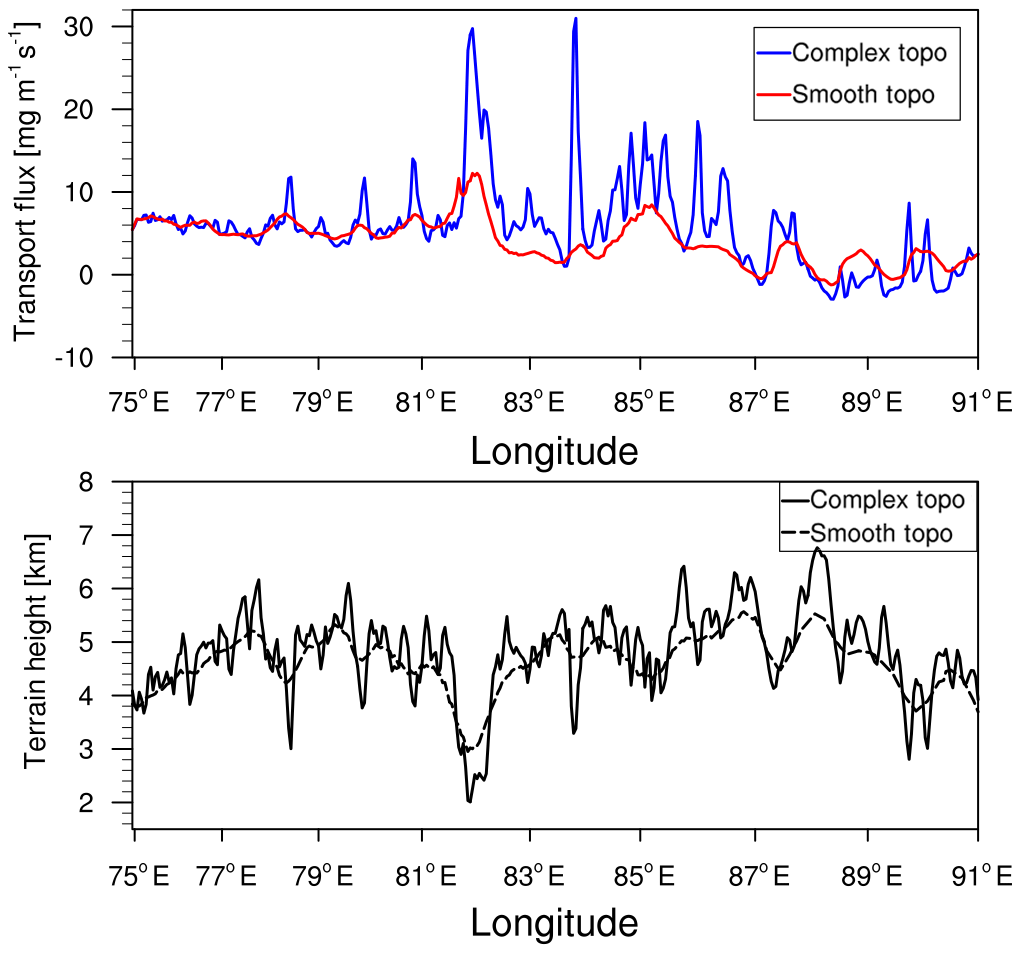
Figure 12Longitudinal distribution of integrated BC mass flux along the cross section in Fig. 3 from the simulations with the complex and smooth topographies. The black lines represent the terrain heights with different topographies.
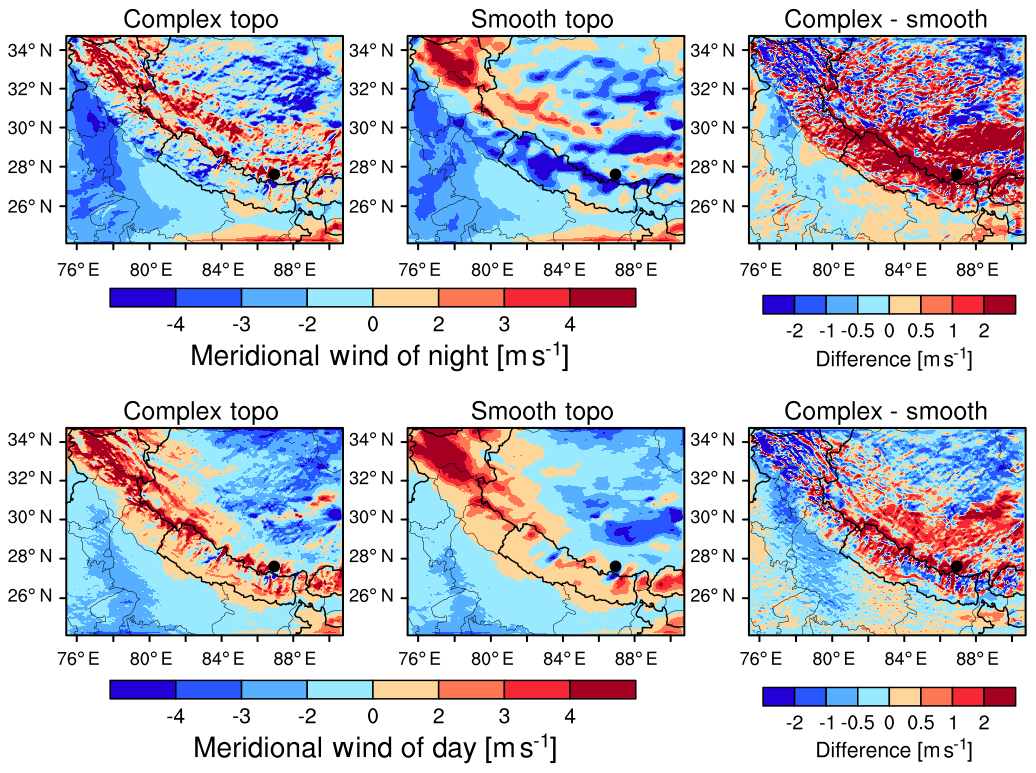
Figure 13Spatial distributions of meridional wind speed averaged within 500 m above the ground for day and night during 1–20 April 2016 from the simulations with the complex and smooth topographies. The difference between the two is also shown. Nighttime is defined as 21:00–06:00 local time, and daytime is defined as 09:00–18:00 local time. Positive value denotes a southerly, and negative value denotes a northerly. The results averaged within 2 km above the ground are consistent.
The enhanced transport across the Himalayas shows that the overall BC inflow with the complex topography is much stronger than that with the smooth topography. Figure 14 shows the accumulated integrated total transport flux of BC across the Himalayas estimated from the simulations with the complex and smooth topographies for 1–20 April 2016. The accumulated import flux of BC increases during the period in both experiments, and the difference between the two experiments gradually increases with time. At the end of the period, the simulation with the complex topography estimates a total import flux of BC of t that is ∼50 % higher than t estimated based on the simulation with the smooth topography. The analysis of the transport fluxes at different altitudes indicates that the transport fluxes below 2 km (above the ground) dominate (>80 %) the total flux. The sensitivity analysis by moving the cross line (cross section of the analysis in Figs. 9, 12 and 14) towards or away from the TP within a certain distance and recalculating the flux indicates that the impacts of topography on the simulated results do not change significantly.
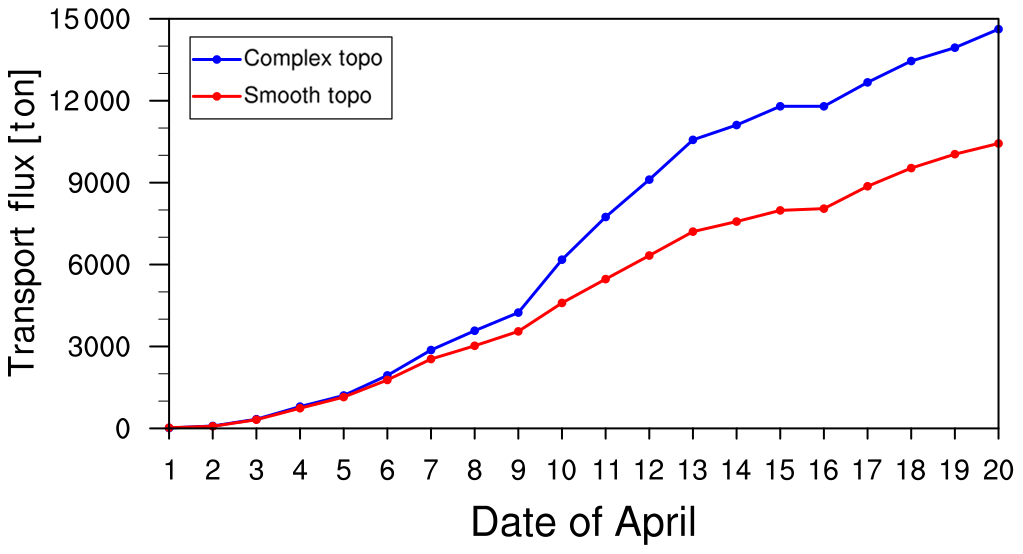
Figure 14Accumulated integrated total transport flux of BC across the Himalayas estimated from the simulations with the complex and smooth topographies during 1–20 April 2016.
The analysis above focuses on investigating the BC transport flux across the Himalayas. Although the inflow can reflect the impact of transport on the BC mass over the TP to some extent, the change of BC mass concentration is eventually determined by the convergence of transport. Therefore, the contribution of each model process (transport, dry deposition, emission, PBL mixing and wet deposition) to the increase of BC column mass averaged over the TP (with elevation >4 km) during this episode is analyzed for both simulations following the methodology introduced by Du et al. (2020). The results show that the two main processes affecting the BC column mass over the TP during the period are transport and dry deposition. The transport is the dominant process that increases the BC column mass over the TP, while the dry deposition reduces it. The contribution of transport to the increase of BC column mass over the TP during the episode from the simulation with the complex topography is significantly larger than that with the smooth topography, which is consistent with the results shown by analyzing the transport flux across the Himalayas. Although the impacts of PBL mixing and wet deposition on the BC column mass over the TP are also different between the simulations with different topographies, their impacts are much smaller than those of transport and dry deposition during the study period.
3.3 Radiative forcing of BC over the TP
The BC transported over the TP could significantly influence the regional climate and water resources over Asia through heating the atmosphere and accelerating the melting of snow and glaciers (e.g., Qian et al., 2011, 2015; Lau et al., 2017). Therefore, the impact of the complex topography on estimating the BC radiative-heating profile in the atmosphere and radiative forcing in surface snow deserves investigation. Figure 15 shows the vertical profiles of BC-induced radiative-heating rate in the atmosphere averaged over the TP (with elevation >4 km) within the inner domain shown in Fig. 1 for 1–20 April 2016 from the simulations with the complex and smooth topographies. Both simulations generate higher BC heating rates near the surface, and the rate gradually decreases with altitude, which is consistent with the vertical profiles of BC mass concentration averaged over the TP (Fig. S9). The BC heating rate over the TP from the simulation with the complex topography is ∼0.17 K d−1 near the surface and reduces to ∼0.08 K d−1 at 8 km, which is ∼50 % and ∼30 %, respectively, higher than that from the simulation with the smooth topography at the corresponding altitudes. The higher BC heating rate over the TP estimated by the simulation with the complex topography is consistent with its higher BC column mass (Fig. 5) and concentration profile (Fig. S9).
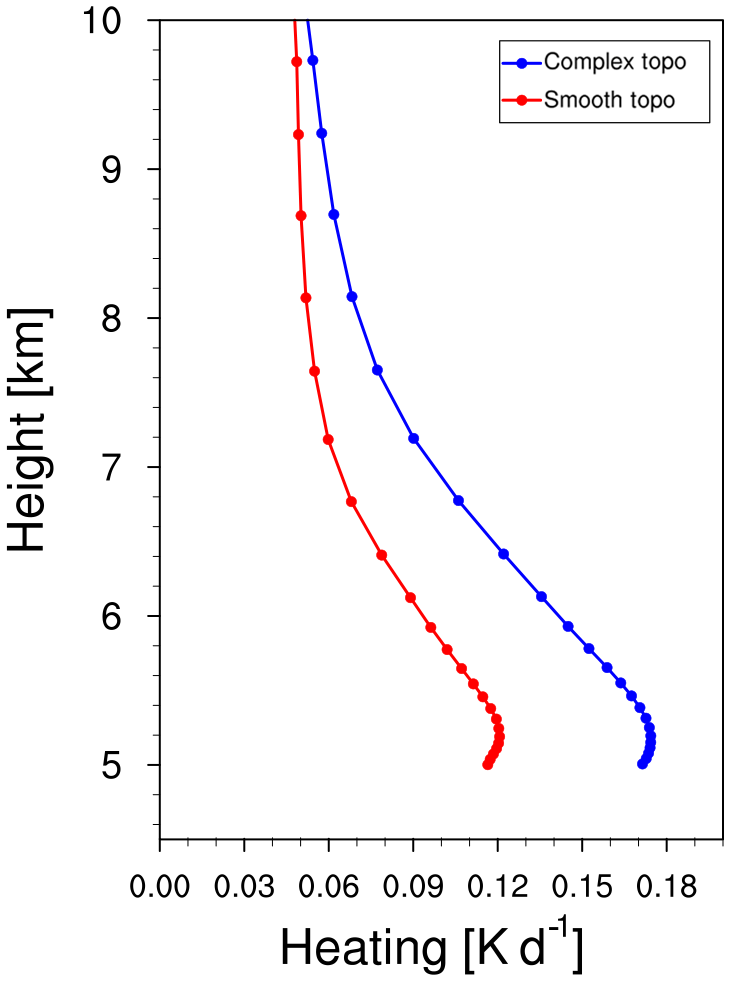
Figure 15Vertical profiles of BC-induced radiative-heating rate in the atmosphere averaged over the TP (with elevation >4 km) from the simulations with the complex and smooth topographies during 1–20 April 2016.
The BC radiative forcing in surface snow is controlled by both the distributions of BC mass concentration and snow coverage (e.g., Zhao et al., 2014). Figure 16 shows the spatial distributions of snow water equivalent (SWE) averaged for 1–20 April 2016 from the simulations with two topographies. The difference between the two is also shown. It shows that the simulation with the complex topography generates more areas with higher SWE compared to that with the smooth topography over the TP. Along the Himalayas, the simulated SWE is higher over the mountain ridges with the complex topography, particularly for the eastern Himalayas, while the smooth topography leads to broader snow coverage over the western Himalayas. The difference in SWE between the two simulations is highly correlated with their difference in precipitation (Fig. S10). Along the Himalayas, the simulated precipitation with the complex topography is larger than that with the smooth topography at the mountain ridges and smaller at the valleys. Over the TP, the overall precipitation is larger with the complex topography than with the smooth topography (Fig. S10). Previous studies have found that the topography could significantly affect the precipitation over the Himalayan region (e.g., Bookhagen and Burbank, 2010; Wulf et al., 2016; Cannon et al., 2017; Karki et al., 2017).
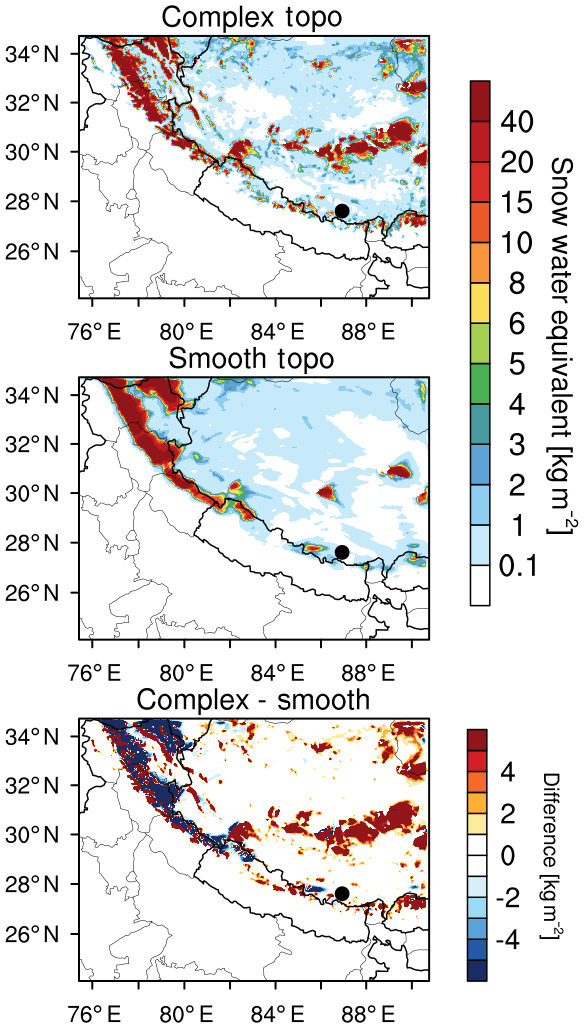
Figure 16Spatial distributions of snow water equivalent averaged for 1–20 April 2016 from the simulations with the complex and smooth topographies. The difference between the two is also shown.
Figure 17 shows the spatial distributions of BC radiative forcing in the surface snow over the TP averaged for 1–20 April 2016 from the simulations with the two topographies, and the difference between the two is also shown. The BC radiative forcing in surface snow is largely coincident with the spatial distributions of SWE as shown in Fig. 16, mainly due to the heterogeneous distributions of snow cover over the TP. The BC radiative forcing in surface snow over the TP from the simulation with the complex topography reaches 5 W m−2 where the snow exists, larger than that with the smooth topography. Along the Himalayas, the simulation with the complex topography produces higher BC snow forcing over the mountain ridges, particularly over the eastern Himalayas, while the one with the smooth topography simulates higher BC snow forcing over most areas of the western Himalayas due to its broader snow coverage there. Overall, the complex topography leads to higher BC forcing in snow over the TP and the eastern Himalayas and lower BC forcing in snow over the western Himalayas, and this therefore results in the different distribution of BC forcing in snow over the TP and Himalayas, compared to the smooth topography.
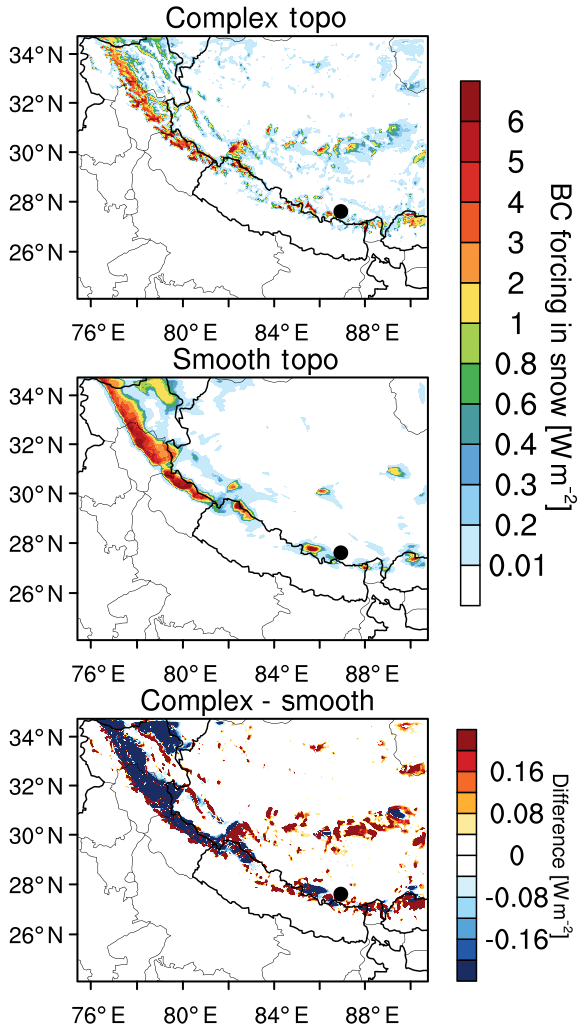
Figure 17Spatial distributions of BC radiative forcing in the surface snow averaged for 1–20 April 2016 from the simulations with the complex and smooth topographies. The difference between the two is also shown.
In this study, the model experiments with different topographies are conducted to illustrate the impacts of the complexity of the topography of the Himalayas on BC transport from southern Asia to the TP. The observed pollution episode at the QOMS station near Mt. Everest during the pre-monsoon season is simulated. The observed surface BC concentration shows a peak of ∼3 µg m−3, which is much larger than the background value of <0.4 µg m−3 over the TP. The observed temporal variation of surface BC concentrations correlates highly with that of biomass burning emissions near the southern Himalayas, indicating the significant impacts of biomass burning on the pollutants over the TP. The simulations can reproduce the episode in time and magnitude and are used to investigate the BC transport mechanisms and the impacts of topography.
The high BC mass loading during the simulation period accumulates near the southern Himalayas, driven by the large-scale westerly and small-scale southerly circulations, which is also observed by satellites. The modeling results demonstrate that the circulations favor the accumulation of pollutants near the Himalayas, particularly the central and eastern parts, and can carry the pollutants to the TP during the study period, which is consistent with previous modeling studies (e.g., Kopacz et al., 2011). It is noteworthy that the BC which accumulated near the southern Himalayas can be transported across the Himalayas, overcoming the majority of mountain ridges, which is consistent with the observation-based estimate by Gong et al. (2019) that also found that pollutants could overcome the blocking effect of the mountain ridges of the Himalayas. However, the transport through the valleys is found to be much stronger and more efficient than across the mountain ridges, and the enhancement effect cannot be ignored. The complex topography results in 50 % higher overall transport flux across the Himalayas during the simulation period than the smooth topography, primarily due to the strengthened efficiency of near-surface meridional transport towards the TP, enhanced wind speed at some valleys and deeper valley channels associated with larger BC mass volume that can be transported into the TP, although the overall wind speed is weakened due to the orographic drags with the complex topography. This shows that the simulation with the complex topography produces a 30 %–50 % higher BC radiative-heating rate in the atmosphere up to 10 km averaged over the TP than the simulation with the smooth topography.
For the BC radiative forcing in surface snow, the simulation with the complex topography produces stronger forcing over the TP than that with the smooth one. The complex topography makes the distribution of BC forcing in surface snow quite different from the smooth topography, partly due to its different distribution of surface snow. The simulated BC radiative forcing in snow is distributed more heterogeneously than those in previous studies using global models at relatively coarse resolutions (e.g., Qian et al., 2011). He et al. (2014) used a global-chemical-transport model to simulate the BC forcing in snow at the horizontal resolution of ∼0.2∘ and obtained a distribution similar to the simulation with the smooth topography in this study with the high values over the western Himalayas. However, their simulated values near the Himalayas are higher than the simulated results of this study, which may be due to their estimation being averaged for November–April.
This study highlights the importance of resolving the complex topography of the Himalayas in modeling the aerosol transport across the Himalayas and radiative impact over the TP. Although this study focuses on the impacts of topography on the simulated results, the additional analysis (Figs. S11–S13) of the outer domain simulation at 20 km resolution and the inner domain simulation at 4 km with different topographies indicates that the resolution-dependent difference between 20 and 4 km is largely contributed by their different representations of topography over the Himalayan region, consistent with previous studies (e.g., Karki et al., 2017; Lin et al., 2018). Therefore, the relatively smooth topography used by the models at horizontal resolutions coarser than 20 km may result in negative biases of aerosol transport from southern Asia to the TP during the pre-monsoon season and lead to biases in distributions of aerosol radiative forcing in the atmosphere and surface snow over the TP.
Previous studies also found the induced change of circulation and transport due to the complex topography at convection-permitting scales with a focus on the meteorological fields over the Himalayan and TP regions (e.g., Karki et al., 2017; Zhou et al., 2017, 2018; Lin et al., 2018; Wang et al., 2020). Most of them either conducted the sub-10 km simulations covering a relatively smaller region (e.g., 101×96 grids at 5 km in Karki et al., 2017; 181×121 grids at 2 km in Lin et al., 2018; grids at 3 km in Wang et al., 2020) compared to this study (400×300 grids at 4 km) or conducted the simulations covering all of the Himalayas but at the resolutions above 10 km and with the subgrid orographic-drag parameterization to consider the impact of complex topography. Although some previous studies also showed that the resolved complex topography yielded more realistic small-scale mountain-valley circulations and enhanced valley winds over the Himalayan region compared to the smoother topography, the overall moisture transport across the Himalayas towards the TP was weaker with the complex topography due to the orographic drags.
The difference between previous studies and this study can be due to several factors. First, previous studies focused on moisture instead of air pollutants. The spatial (horizontal and vertical) distributions between air pollutants and moisture are different and may contribute to the different impacts of topography on the overall transport flux across the Himalayas. However, the analysis of the moisture from the simulations in this study shows the increase of moisture transport (not shown) and hence the increase of precipitation over the TP with the complex topography (Fig. S10). Second, most of previous studies focused on the monsoon season instead of the pre-monsoon season. Therefore, the meteorological simulations for the monsoon season (June–July–August) at different resolutions are also conducted in this study. The results show that the moisture transport and precipitation are reduced at the higher resolution with the complex topography and that the meridional wind is overall weakened particularly over the central and eastern Himalayas and TP (not shown), which is consistent with previous studies. This may indicate that the different large-scale circulations between the two seasons (a much stronger southerly during the monsoon season) may also lead to different impacts of the complex topography on meridional winds and hence cross-Himalayan transport.
Since this study only demonstrates the potential impacts for a relatively short period, a longer-term study should be conducted to examine the impacts of topography on the aerosol climatic effect over the TP in both the pre-monsoon and monsoon seasons. In addition, the active convection during the monsoon season may also play an important role in pollutant transport across the Himalayas, which deserves further investigation. Furthermore, aerosol impact on clouds and precipitation, particularly during the monsoon season, and thus on the latent heat in the atmosphere and the associated responses may also depend on the complex topography. Previous studies based on observations found that the rain frequency and intensity reached their highest values and the cloud thickness reached their deepest values at the foothill of the Himalayas and decreased as the elevation increased up to the TP (e.g., Chen et al., 2017; Fu et al., 2018; A. Zhang et al., 2018), which was explained by Fu et al. (2018) due to the blocking of the air flow by the steep slope of the southern Himalayas. However, the large amount of transported aerosol along the slope from the foothill up to the TP may also play a role. These potential impacts of aerosols on the regional hydroclimate around the TP and over Asia using a high-resolution model that can resolve the complex topography of the Himalayas and TP deserve further investigation.
The released version of WRF-Chem can be downloaded from http://www2.mmm.ucar.edu/wrf/users/download/get_source.html (last access: 14 May 2020; new users must first submit the request form). The updated USTC version of WRF-Chem can be obtained from http://aemol.ustc.edu.cn/product/list/ (last access: 14 May 2020; new users must first submit the request form) or by contacting chunzhao@ustc.edu.cn. Also, the code modifications will be incorporated in the release version of WRF-Chem in the future.
The supplement related to this article is available online at: https://doi.org/10.5194/acp-20-5923-2020-supplement.
MZ and CZ designed the experiments and conducted and analyzed the simulations. ZC provided the BC observations and helped analyze the data. QD, MX, YC and MC helped design numerical experiments. All authors contributed to the discussion and final version of the paper.
The authors declare that they have no conflict of interest.
This article is part of the special issue “Study of ozone, aerosols and radiation over the Tibetan Plateau (SOAR-TP) (ACP/AMT inter-journal SI)”. It is not associated with a conference.
The study used computing resources from the High Performance Computing Center of the University of Science and Technology of China (USTC) and the TH-2 of the National Supercomputer Center in Guangzhou (NSCC-GZ).
This research was supported by the National Key Research and Development Program of China (grant no. 2016YFA0602001), the National Natural Science Foundation of China (NSFC; grant no. 91837310), the second Tibetan Plateau Scientific Expedition and Research Program (STEP; grant no. 2019QZKK0605), and the Fundamental Research Funds for the Central Universities.
This paper was edited by Hang Su and reviewed by four anonymous referees.
Bansal, O., Singh, A., and Singh, D.: Characteristics of Black Carbon aerosols over Patiala Northwestern part of the IGP: Source apportionment using cluster and CWT analysis, Atmos. Pollut. Res., 10, 244–256, https://doi.org/10.1016/j.apr.2018.08.001, 2019.
Barnard, J. C., Fast, J. D., Paredes-Miranda, G., Arnott, W. P., and Laskin, A.: Technical Note: Evaluation of the WRF-Chem “Aerosol Chemical to Aerosol Optical Properties” Module using data from the MILAGRO campaign, Atmos. Chem. Phys., 10, 7325–7340, https://doi.org/10.5194/acp-10-7325-2010, 2010.
Barnett, T. P., Adam, J. C., and Lettenmaier, D. P.: Potential impacts of a warming climate on water availability in snow-dominated regions, Nature, 438, 303–309, https://doi.org/10.1038/nature04141, 2005.
Beljaars, A. C., Brown, A. R., and Wood, N.: A new parametrization of turbulent orographic form drag, Q. J. Roy. Meteor. Soc., 130, 1327–1347, https://doi.org/10.1256/qj.03.73, 2004.
Binkowski, F. S. and Shankar, U.: The Regional Particulate Matter Model: 1. Model description and preliminary results, J. Geophys. Res., 100, 26191, https://doi.org/10.1029/95JD02093, 1995.
Bookhagen, B. and Burbank, D. W.: Toward a complete Himalayan hydrological budget: Spatiotemporal distribution of snowmelt and rainfall and their impact on river discharge, J. Geophys. Res., 115, 39, https://doi.org/10.1029/2009JF001426, 2010.
Boos, W. R. and Kuang, Z.: Sensitivity of the South Asian monsoon to elevated and non-elevated heating, Sci. Rep.-UK, 3, 1192, https://doi.org/10.1038/srep01192, 2013.
Cannon, F., Carvalho, L. M. V., Jones, C., Norris, J., Bookhagen, B., and Kiladis, G. N.: Effects of topographic smoothing on the simulation of winter precipitation in High Mountain Asia, J. Geophys. Res.-Atmos., 122, 1456–1474, https://doi.org/10.1002/2016JD026038, 2017.
Cao, J., Tie, X., Xu, B., Zhao, Z., Zhu, C., Li, G., and Liu, S.: Measuring and modeling black carbon (BC) contamination in the SE Tibetan Plateau, J. Atmos. Chem., 67, 45–60, https://doi.org/10.1007/s10874-011-9202-5, 2010.
Carrera, M. L., Gyakum, J. R., and Lin, C. A.: Observational Study of Wind Channeling within the St. Lawrence River Valley, J. Appl. Meteorol. Clim., 48, 2341–2361, https://doi.org/10.1175/2009JAMC2061.1, 2009.
Chapman, E. G., Gustafson Jr., W. I., Easter, R. C., Barnard, J. C., Ghan, S. J., Pekour, M. S., and Fast, J. D.: Coupling aerosol-cloud-radiative processes in the WRF-Chem model: Investigating the radiative impact of elevated point sources, Atmos. Chem. Phys., 9, 945–964, https://doi.org/10.5194/acp-9-945-2009, 2009.
Chen, J. and Bordoni, S.: Orographic Effects of the Tibetan Plateau on the East Asian Summer Monsoon: An Energetic Perspective, J. Climate, 27, 3052–3072, https://doi.org/10.1175/JCLI-D-13-00479.1, 2014.
Chen, X., Kang, S., Cong, Z., Yang, J., and Ma, Y.: Concentration, temporal variation, and sources of black carbon in the Mt. Everest region retrieved by real-time observation and simulation, Atmos. Chem. Phys., 18, 12859–12875, https://doi.org/10.5194/acp-18-12859-2018, 2018.
Chen, Y., Fu, Y., Xian, T., and Pan, X.: Characteristics of cloud cluster over the steep southern slopes of the Himalayas observed by CloudSat, Int. J. Climatol., 37, 4043–4052, https://doi.org/10.1002/joc.4992, 2017.
Cong, Z., Kang, S., and Qin, D.: Seasonal features of aerosol particles recorded in snow from Mt. Qomolangma (Everest) and their environmental implications, J. Environ. Sci.-China, 21, 914–919, https://doi.org/10.1016/S1001-0742(08)62361-X, 2009.
Cong, Z., Kang, S., Kawamura, K., Liu, B., Wan, X., Wang, Z., Gao, S., and Fu, P.: Carbonaceous aerosols on the south edge of the Tibetan Plateau: concentrations, seasonality and sources, Atmos. Chem. Phys., 15, 1573–1584, https://doi.org/10.5194/acp-15-1573-2015, 2015a.
Cong, Z., Kawamura, K., Kang, S., and Fu, P.: Penetration of biomass-burning emissions from South Asia through the Himalayas: new insights from atmospheric organic acids, Sci. Rep.-UK, 5, 9580, https://doi.org/10.1038/srep09580, 2015b.
Dentener, F., Kinne, S., Bond, T., Boucher, O., Cofala, J., Generoso, S., Ginoux, P., Gong, S., Hoelzemann, J. J., Ito, A., Marelli, L., Penner, J. E., Putaud, J.-P., Textor, C., Schulz, M., van der Werf, G. R., and Wilson, J.: Emissions of primary aerosol and precursor gases in the years 2000 and 1750 prescribed data-sets for AeroCom, Atmos. Chem. Phys., 6, 4321–4344, https://doi.org/10.5194/acp-6-4321-2006, 2006.
Ding, Y., Sun, Y., Wang, Z., Zhu, Y., and Song, Y.: Inter-decadal variation of the summer precipitation in China and its association with decreasing Asian summer monsoon Part II: Possible causes, Int. J. Climatol., 29, 1926–1944, https://doi.org/10.1002/joc.1759, 2009.
Du, Q., Zhao, C., Zhang, M., Dong, X., Chen, Y., Liu, Z., Hu, Z., Zhang, Q., Li, Y., Yuan, R., and Miao, S.: Modeling diurnal variation of surface PM2.5 concentrations over East China with WRF-Chem: impacts from boundary-layer mixing and anthropogenic emission, Atmos. Chem. Phys., 20, 2839–2863, https://doi.org/10.5194/acp-20-2839-2020, 2020.
Duan, A. M. and Wu, G. X.: Role of the Tibetan Plateau thermal forcing in the summer climate patterns over subtropical Asia, Clim. Dynam., 24, 793–807, https://doi.org/10.1007/s00382-004-0488-8, 2005.
Dubovik, O. and King, M. D.: A flexible inversion algorithm for retrieval of aerosol optical properties from Sun and sky radiance measurements, J. Geophys. Res., 105, 20673–20696, https://doi.org/10.1029/2000JD900282, 2000.
Dubovik, O., Holben, B., Eck, T. F., Smirnov, A., Kaufman, Y. J., King, M. D., Tanré, D., and Slutsker, I.: Variability of Absorption and Optical Properties of Key Aerosol Types Observed in Worldwide Locations, J. Atmos. Sci., 59, 590–608, https://doi.org/10.1175/1520-0469(2002)059<0590:VOAAOP>2.0.CO;2, 2002.
Dumka, U. C., Moorthy, K. K., Kumar, R., Hegde, P., Sagar, R., Pant, P., Singh, N., and Babu, S. S.: Characteristics of aerosol black carbon mass concentration over a high altitude location in the Central Himalayas from multi-year measurements, Atmos. Res., 96, 510–521, https://doi.org/10.1016/j.atmosres.2009.12.010, 2010.
Easter, R. C., Ghan, S. J., Zhang, Y., Saylor, R. D., Chapman, E. G., Laulainen, N. S., Abdul-Razzak, H., Leung, L. R., Bian, X., and Zaveri, R. A.: MIRAGE: Model Description and Evaluation of Aerosols and Trace Gases, J. Geophys. Res., 109, D20210, https://doi.org/10.1029/2004JD004571, 2004.
Egger, J., Bajracharya, S., Egger, U., Heinrich, R., Reuder, J., Shakya, P., Wendt, H., and Wirth, V.: Diurnal winds in the Himalayan Kali Gandaki Valley. Part I: Observations, Mon. Weather Rev., 128, 1106–1122, 2000.
Engling, G. and Gelencser, A.: Atmospheric Brown Clouds: From Local Air Pollution to Climate Change, Elements, 6, 223–228, https://doi.org/10.2113/gselements.6.4.223, 2010.
Fan, J., Rosenfeld, D., Yang, Y., Zhao, C., Leung, L. R., and Li, Z.: Substantial contribution of anthropogenic air pollution to catastrophic floods in Southwest China, Geophys. Res. Lett., 42, 6066–6075, https://doi.org/10.1002/2015GL064479, 2015.
Fast, J. D., Gustafson Jr, W. I., Easter, R. C., Zaveri, R. A., Barnard, J. C., Chapman, E. G., Grell, G. A., and Peckham, S. E.: Evolution of ozone, particulates, and aerosol direct radiative forcing in the vicinity of Houston using a fully coupled meteorology-chemistry-aerosol model, J. Geophys. Res., 111, D21305, https://doi.org/10.1029/2005JD006721, 2006.
Feng, Y., Kotamarthi, V. R., Coulter, R., Zhao, C., and Cadeddu, M.: Radiative and thermodynamic responses to aerosol extinction profiles during the pre-monsoon month over South Asia, Atmos. Chem. Phys., 16, 247–264, https://doi.org/10.5194/acp-16-247-2016, 2016.
Flanner, M. G. and Zender, C. S.: Snowpack radiative heating: Influence on Tibetan Plateau climate, Geophys. Res. Lett., 32, L06501, https://doi.org/10.1029/2004GL022076, 2005.
Fu, Y., Pan, X., Xian, T., Liu, G., Zhong, L., Liu, Q., Li, R., Wang, Y., and Ma, M.: Precipitation characteristics over the steep slope of the Himalayas in rainy season observed by TRMM PR and VIRS, Clim. Dynam., 51, 1971–1989, https://doi.org/10.1007/s00382-017-3992-3, 2018.
Gao, Y., Zhao, C., Liu, X., Zhang, M., and Leung, L. R.: WRF-Chem simulations of aerosols and anthropogenic aerosol radiative forcing in East Asia, Atmos. Environ., 92, 250–266, https://doi.org/10.1016/j.atmosenv.2014.04.038, 2014.
Ginoux, P., Chin, M., Tegen, I., Prospero, J. M., Holben, B., Dubovik, O., and Lin, S.-J.: Sources and distributions of dust aerosols simulated with the GOCART model, J. Geophys. Res., 106, 20255–20273, https://doi.org/10.1029/2000JD000053, 2001.
Gong, P., Wang, X., Pokhrel, B., Wang, H., Liu, X., Liu, X., and Wania, F.: Trans-Himalayan Transport of Organochlorine Compounds: Three-Year Observations and Model-Based Flux Estimation, Environ. Sci. Technol., 53, 6773–6783, https://doi.org/10.1021/acs.est.9b01223, 2019.
Gong, S. L.: A parameterization of sea-salt aerosol source function for sub- and super-micron particles, Global Biogeochem. Cy., 17, 1097, https://doi.org/10.1029/2003GB002079, 2003.
Grell, G. A., Peckham, S. E., Schmitz, R., McKeen, S. A., Frost, G., Skamarock, W. C., and Eder, B.: Fully coupled “online” chemistry within the WRF model, Atmos. Environ., 39, 6957–6975, https://doi.org/10.1016/j.atmosenv.2005.04.027, 2005.
Gustafson, W. I., Chapman, E. G., Ghan, S. J., Easter, R. C., and Fast, J. D.: Impact on modeled cloud characteristics due to simplified treatment of uniform cloud condensation nuclei during NEAQS 2004, Geophys. Res. Lett., 34, L19809, https://doi.org/10.1029/2007GL030021, 2007.
Hansen, J. and Nazarenko, L.: Soot climate forcing via snow and ice albedos, P. Natl. Acad. Sci. USA, 101, 423–428, https://doi.org/10.1073/pnas.2237157100, 2004.
He, C., Li, Q., Liou, K. N., Takano, Y., Gu, Y., Qi, L., Mao, Y., and Leung, L. R.: Black carbon radiative forcing over the Tibetan Plateau, Geophys. Res. Lett., 41, 7806–7813, https://doi.org/10.1002/2014GL062191, 2014.
He, C., Flanner, M. G., Chen, F., Barlage, M., Liou, K.-N., Kang, S., Ming, J., and Qian, Y.: Black carbon-induced snow albedo reduction over the Tibetan Plateau: uncertainties from snow grain shape and aerosol–snow mixing state based on an updated SNICAR model, Atmos. Chem. Phys., 18, 11507–11527, https://doi.org/10.5194/acp-18-11507-2018, 2018.
He, C., Wang, Z., Zhou, T., and Li, T.: Enhanced Latent Heating over the Tibetan Plateau as a Key to the Enhanced East Asian Summer Monsoon Circulation under a Warming Climate, J. Climate, 32, 3373–3388, https://doi.org/10.1175/JCLI-D-18-0427.1, 2019.
Hess, M., Koepke, P., and Schult, I.: Optical Properties of Aerosols and Clouds: The Software Package OPAC, B. Am. Meteorol. Soc., 79, 831–844, https://doi.org/10.1175/1520-0477(1998)079<0831:OPOAAC>2.0.CO;2, 1998.
Hindman, E. E. and Upadhyay, B. P.: Air pollution transport in the Himalayas of Nepal and Tibet during the 1995–1996 dry season, Atmos. Environ., 36, 727–739, https://doi.org/10.1016/S1352-2310(01)00495-2, 2002.
Holben, B. N., Eck, T. F., Slutsker, I., Tanré, D., Buis, J. P., Setzer, A., Vermote, E., Reagan, J. A., Kaufman, Y. J., Nakajima, T., Lavenu, F., Jankowiak, I., and Smirnov, A.: AERONET – A Federated Instrument Network and Data Archive for Aerosol Characterization, Remote Sens. Environ., 66, 1–16, https://doi.org/10.1016/S0034-4257(98)00031-5, 1998.
Holben, B. N., Tanre, D., Smirnov, A., Eck, T. F., Slutsker, I., Abuhassan, N., Newcomb, W., Schafer, J., Chatenet, B., Lavenu, F., Kaufman, Y., Vande Castle, J., Setzer, A., Markham, B., Clark, D., Frouin, R., Halthore, R., Karneli, A., O'Neill, N., Pietras, C., Pinker, R., Voss, K., and Zibordi, G.: An emerging ground-based aerosol climatology: Aerosol optical depth from AERONET, J. Geophys. Res., 106, 12067–12097, https://doi.org/10.1029/2001JD900014, 2001.
Horvath, K., Koracin, D., Vellore, R., Jiang, J., and Belu, R.: Sub-kilometer dynamical downscaling of near-surface winds in complex terrain using WRF and MM5 mesoscale models, J. Geophys. Res.-Atmos., 117, D11111, https://doi.org/10.1029/2012JD017432, 2012.
Hu, Z., Zhao, C., Huang, J., Leung, L. R., Qian, Y., Yu, H., Huang, L., and Kalashnikova, O. V.: Trans-Pacific transport and evolution of aerosols: evaluation of quasi-global WRF-Chem simulation with multiple observations, Geosci. Model Dev., 9, 1725–1746, https://doi.org/10.5194/gmd-9-1725-2016, 2016.
Hu, Z., Huang, J., Zhao, C., Bi, J., Jin, Q., Qian, Y., Leung, L. R., Feng, T., Chen, S., and Ma, J.: Modeling the contributions of Northern Hemisphere dust sources to dust outflow from East Asia, Atmos. Environ., 202, 234–243, https://doi.org/10.1016/j.atmosenv.2019.01.022, 2019.
Hu, Z., Huang, J., Zhao, C., Jin, Q., Ma, Y., and Yang, B.: Modeling dust sources, transport, and radiative effects at different altitudes over the Tibetan Plateau, Atmos. Chem. Phys., 20, 1507–1529, https://doi.org/10.5194/acp-20-1507-2020, 2020.
Huang, X., Song, Y., Zhao, C., Cai, X., Zhang, H., and Zhu, T.: Direct Radiative Effect by Multicomponent Aerosol over China, J. Climate, 28, 3472–3495, https://doi.org/10.1175/JCLI-D-14-00365.1, 2015.
Iacono, M. J., Mlawer, E. J., Clough, S. A., and Morcrette, J. J.: Impact of an improved longwave radiation model, RRTM, on the energy budget and thermodynamic properties of the NCAR community climate model, CCM3, J. Geophys. Res., 105, 14873–14890, https://doi.org/10.1029/2000JD900091, 2000.
Immerzeel, W. W., van Beek, L. P. H., and Bierkens, M. F. P.: Climate change will affect the Asian water towers, Science, 328, 1382–1385, https://doi.org/10.1126/science.1183188, 2010.
Jaeglé, L., Quinn, P. K., Bates, T. S., Alexander, B., and Lin, J.-T.: Global distribution of sea salt aerosols: new constraints from in situ and remote sensing observations, Atmos. Chem. Phys., 11, 3137–3157, https://doi.org/10.5194/acp-11-3137-2011, 2011.
Janssens-Maenhout, G., Crippa, M., Guizzardi, D., Dentener, F., Muntean, M., Pouliot, G., Keating, T., Zhang, Q., Kurokawa, J., Wankmüller, R., Denier van der Gon, H., Kuenen, J. J. P., Klimont, Z., Frost, G., Darras, S., Koffi, B., and Li, M.: HTAP_v2.2: a mosaic of regional and global emission grid maps for 2008 and 2010 to study hemispheric transport of air pollution, Atmos. Chem. Phys., 15, 11411–11432, https://doi.org/10.5194/acp-15-11411-2015, 2015.
Ji, Z., Kang, S., Cong, Z., Zhang, Q., and Yao, T.: Simulation of carbonaceous aerosols over the Third Pole and adjacent regions: distribution, transportation, deposition, and climatic effects, Clim. Dynam., 45, 2831–2846, https://doi.org/10.1007/s00382-015-2509-1, 2015.
Ji, Z. M.: Modeling black carbon and its potential radiative effects over the Tibetan Plateau, Advances in Climate Change Research, 7, 139–144, https://doi.org/10.1016/j.accre.2016.10.002, 2016.
Jiménez, P. A. and Dudhia, J.: Improving the representation of resolved and unresolved topographic effects on surface wind in the WRF model, J. Appl. Meteorol. Clim., 51, 300–316, https://doi.org/10.1175/JAMC-D-11-084.1, 2012.
Kain, J. S.: The Kain–Fritsch Convective Parameterization: An Update, J. Appl. Meteorol., 43, 170–181, https://doi.org/10.1175/1520-0450(2004)043<0170:TKCPAU>2.0.CO;2, 2004.
Kang, S., Chen, P., Li, C., Liu, B., and Cong, Z.: Atmospheric Aerosol Elements over the Inland Tibetan Plateau: Concentration, Seasonality, and Transport, Aerosol Air Qual. Res., 16, 789–800, https://doi.org/10.4209/aaqr.2015.02.0307, 2016.
Kang, S., Zhang, Q., Qian, Y., Ji, Z., Li, C., Cong, Z., Zhang, Y., Guo, J., Du, W., Huang, J., You, Q., Panday, A. K., Rupakheti, M., Chen, D., Gustafsson, O., Thiemens, M. H., and Qin, D.: Linking atmospheric pollution to cryospheric change in the Third Pole region: current progress and future prospects, Natl. Sci. Rev., 6, 796–809, https://doi.org/10.1093/nsr/nwz031, 2019.
Kant, Y., Shaik, D. S., Mitra, D., Chandola, H. C., Babu, S. S., and Chauhan, P.: Black carbon aerosol quantification over north-west Himalayas: Seasonal heterogeneity, source apportionment and radiative forcing, Environ. Poll., 257, 113446, https://doi.org/10.1016/j.envpol.2019.113446, 2019.
Karki, R., Hasson, S., Gerlitz, L., Schickhoff, U., Scholten, T., and Böhner, J.: Quantifying the added value of convection-permitting climate simulations in complex terrain: a systematic evaluation of WRF over the Himalayas, Earth Syst. Dynam., 8, 507–528, https://doi.org/10.5194/esd-8-507-2017, 2017.
Kok, J. F.: A scaling theory for the size distribution of emitted dust aerosols suggests climate models underestimate the size of the global dust cycle, P. Natl. Acad. Sci. USA, 108, 1016–1021, https://doi.org/10.1073/pnas.1014798108, 2011.
Kopacz, M., Mauzerall, D. L., Wang, J., Leibensperger, E. M., Henze, D. K., and Singh, K.: Origin and radiative forcing of black carbon transported to the Himalayas and Tibetan Plateau, Atmos. Chem. Phys., 11, 2837–2852, https://doi.org/10.5194/acp-11-2837-2011, 2011.
Kuhlmann, J. and Quaas, J.: How can aerosols affect the Asian summer monsoon? Assessment during three consecutive pre-monsoon seasons from CALIPSO satellite data, Atmos. Chem. Phys., 10, 4673–4688, https://doi.org/10.5194/acp-10-4673-2010, 2010.
Lau, K. M. and Kim, K. M.: Observational relationships between aerosol and Asian monsoon rainfall, and circulation, Geophys. Res. Lett., 33, D22101, https://doi.org/10.1029/2006GL027546, 2006.
Lau, W. K. and Kim, K. M.: Impact of Snow Darkening by Deposition of Light-Absorbing Aerosols on Snow Cover in the Himalayas–Tibetan Plateau and Influence on the Asian Summer Monsoon: A Possible Mechanism for the Blanford Hypothesis, Atmosphere, 9, 438, https://doi.org/10.3390/atmos9110438, 2018.
Lau, K. M., Kim, M. K., and Kim, K. M.: Asian summer monsoon anomalies induced by aerosol direct forcing: the role of the Tibetan Plateau, Clim. Dynam., 26, 855–864, https://doi.org/10.1007/s00382-006-0114-z, 2006.
Lau, W. K. M., Kim, M. K., Kim, K. M., and Lee, W. S.: Enhanced surface warming and accelerated snow melt in the Himalayas and Tibetan Plateau induced by absorbing aerosols, Environ. Res. Lett., 5, 25204, https://doi.org/10.1088/1748-9326/5/2/025204, 2010.
Lau, W. K. M., Kim, K. M., Shi, J. J., Matsui, T., Chin, M., Tan, Q., Peters-Lidard, C., and Tao, W. K.: Impacts of aerosol–monsoon interaction on rainfall and circulation over Northern India and the Himalaya Foothills, Clim. Dynam., 49, 1945–1960, https://doi.org/10.1007/s00382-016-3430-y, 2017.
Lee, W. S., Bhawar, R. L., Kim, M. K., and Sang, J.: Study of aerosol effect on accelerated snow melting over the Tibetan Plateau during boreal spring, Atmos. Environ., 75, 113–122, https://doi.org/10.1016/j.atmosenv.2013.04.004, 2013.
Li, C., Bosch, C., Kang, S., Andersson, A., Chen, P., Zhang, Q., Cong, Z., Chen, B., Qin, D., and Gustafsson, Ö.: Sources of black carbon to the Himalayan–Tibetan Plateau glaciers, Nat. Commun., 7, 4825, https://doi.org/10.1038/ncomms12574, 2016.
Li, M., Zhang, Q., Kurokawa, J.-I., Woo, J.-H., He, K., Lu, Z., Ohara, T., Song, Y., Streets, D. G., Carmichael, G. R., Cheng, Y., Hong, C., Huo, H., Jiang, X., Kang, S., Liu, F., Su, H., and Zheng, B.: MIX: a mosaic Asian anthropogenic emission inventory under the international collaboration framework of the MICS-Asia and HTAP, Atmos. Chem. Phys., 17, 935–963, https://doi.org/10.5194/acp-17-935-2017, 2017.
Li, R. and Min, Q. L.: Impacts of mineral dust on the vertical structure of precipitation, J. Geophys. Res., 115, 1337, https://doi.org/10.1029/2009JD011925, 2010.
Li, R., Dong, X., Guo, J., Fu, Y., Zhao, C., Wang, Y., and Min, Q.: The implications of dust ice nuclei effect on cloud top temperature in a complex mesoscale convective system, Sci. Rep.-UK, 7, 291, https://doi.org/10.1038/s41598-017-12681-0, 2017.
Li, R., Shao, W., Guo, J., Fu, Y., Wang, Y., Liu, G., Zhou, R., and Li, W.: A Simplified Algorithm to Estimate Latent Heating Rate Using Vertical Rainfall Profiles Over the Tibetan Plateau, J. Geophys. Res.-Atmos., 124, 942–963, https://doi.org/10.1029/2018JD029297, 2019.
Lin, C., Chen, D., Yang, K., and Ou, T.: Impact of model resolution on simulating the water vapor transport through the central Himalayas: implication for models' wet bias over the Tibetan Plateau, Clim. Dynam., 51, 3195–3207, https://doi.org/10.1007/s00382-018-4074-x, 2018.
Liu, P., Tsimpidi, A. P., Hu, Y., Stone, B., Russell, A. G., and Nenes, A.: Differences between downscaling with spectral and grid nudging using WRF, Atmos. Chem. Phys., 12, 3601–3610, https://doi.org/10.5194/acp-12-3601-2012, 2012.
Liu, Y., Sato, Y., Jia, R., Xie, Y., Huang, J., and Nakajima, T.: Modeling study on the transport of summer dust and anthropogenic aerosols over the Tibetan Plateau, Atmos. Chem. Phys., 15, 12581–12594, https://doi.org/10.5194/acp-15-12581-2015, 2015.
Liu, Z., Ming, Y., Zhao, C., Lau, N. C., Guo, J., Bollasina, M., and Yim, S. H. L.: Contribution of local and remote anthropogenic aerosols to a record-breaking torrential rainfall event in Guangdong Province, China, Atmos. Chem. Phys., 20, 223–241, https://doi.org/10.5194/acp-20-223-2020, 2020.
Lu, Z., Streets, D. G., Zhang, Q., and Wang, S.: A novel back-trajectory analysis of the origin of black carbon transported to the Himalayas and Tibetan Plateau during 1996–2010, Geophys. Res. Lett., 39, L01809, https://doi.org/10.1029/2011GL049903, 2012.
Lüthi, Z. L., Škerlak, B., Kim, S.-W., Lauer, A., Mues, A., Rupakheti, M., and Kang, S.: Atmospheric brown clouds reach the Tibetan Plateau by crossing the Himalayas, Atmos. Chem. Phys., 15, 6007–6021, https://doi.org/10.5194/acp-15-6007-2015, 2015.
Lutz, A. F., Immerzeel, W. W., Shrestha, A. B., and Bierkens, M. F. P.: Consistent increase in High Asia's runoff due to increasing glacier melt and precipitation, Nat. Clim. Change, 4, 587–592, https://doi.org/10.1038/nclimate2237, 2014.
Marinoni, A., Cristofanelli, P., Laj, P., Duchi, R., Calzolari, F., Decesari, S., Sellegri, K., Vuillermoz, E., Verza, G. P., Villani, P., and Bonasoni, P.: Aerosol mass and black carbon concentrations, a two year record at NCO-P (5079 m, Southern Himalayas), Atmos. Chem. Phys., 10, 8551–8562, https://doi.org/10.5194/acp-10-8551-2010, 2010.
Menon, S., Koch, D., Beig, G., Sahu, S., Fasullo, J., and Orlikowski, D.: Black carbon aerosols and the third polar ice cap, Atmos. Chem. Phys., 10, 4559–4571, https://doi.org/10.5194/acp-10-4559-2010, 2010.
Ming, J., Xiao, C., Cachier, H., Qin, D., Qin, X., Li, Z., and Pu, J.: Black Carbon (BC) in the snow of glaciers in west China and its potential effects on albedos, Atmos. Res., 92, 114–123, https://doi.org/10.1016/j.atmosres.2008.09.007, 2009.
Mlawer, E. J., Taubman, S. J., Brown, P. D., Iacono, M. J., and Clough, S. A.: Radiative transfer for inhomogeneous atmospheres: RRTM, a validated correlated-k model for the longwave, J. Geophys. Res., 102, 16663–16682, https://doi.org/10.1029/97JD00237, 1997.
Morrison, H., Thompson, G., and Tatarskii, V.: Impact of Cloud Microphysics on the Development of Trailing Stratiform Precipitation in a Simulated Squall Line: Comparison of One- and Two-Moment Schemes, Mon. Weather Rev., 137, 991–1007, https://doi.org/10.1175/2008MWR2556.1, 2009.
Nakanishi, M. and Niino, H.: An Improved Mellor–Yamada Level-3 Model: Its Numerical Stability and Application to a Regional Prediction of Advection Fog, Bound.-Lay. Meteorol., 119, 397–407, https://doi.org/10.1007/s10546-005-9030-8, 2006.
Oleson, K. W., Lawrence, D. M., Bonan, G. B., Flanner, M. G., Kluzek, E., Lawrence, P. J., Levis, S., Swenson, S. C., Thornton, P. E., Dai, A., Decker, M., Dickinson, R., Feddema, J., Heald, C. L., Hoffman, F., Lamarque, J. F., Mahowald, N., Niu, G. Y., Qian, T., Randerson, J., Running, S., Sakaguchi, K., Slater, A., Stockli, R., Wang, A., Yang, Z. L., Zeng, X., and Zeng, X.: Technical Description of version 4.0 of the Community Land Model (CLM), Tech. Rep. NCAR/TN-478+STR, National Center for Atmospheric Research, Boulder, Colorado, USA, 2010.
Prasad, A. K. and Singh, R. P.: Comparison of MISR-MODIS aerosol optical depth over the Indo-Gangetic basin during the winter and summer seasons (2000–2005), Remote Sens. Environ., 107, 109–119, https://doi.org/10.1016/j.rse.2006.09.026, 2007.
Qian, Y., Flanner, M. G., Leung, L. R., and Wang, W.: Sensitivity studies on the impacts of Tibetan Plateau snowpack pollution on the Asian hydrological cycle and monsoon climate, Atmos. Chem. Phys., 11, 1929–1948, https://doi.org/10.5194/acp-11-1929-2011, 2011.
Qian, Y., Yasunari, T. J., Doherty, S. J., Flanner, M. G., Lau, W. K. M., Ming, J., Wang, H., Wang, M., Warren, S. G., and Zhang, R.: Light-absorbing particles in snow and ice: Measurement and modeling of climatic and hydrological impact, Adv. Atmos. Sci., 32, 64–91, https://doi.org/10.1007/s00376-014-0010-0, 2015.
Qiu, J.: China: The third pole, Nature, 454, 393–396, https://doi.org/10.1038/454393a, 2008.
Ramanathan, V. and Carmichael, G.: Global and regional climate changes due to black carbon, Nat. Geosci., 1, 221–227, https://doi.org/10.1038/ngeo156, 2008.
Ramanathan, V., Ramana, M. V., Roberts, G., Kim, D., Corrigan, C., Chung, C., and Winker, D.: Warming trends in Asia amplified by brown cloud solar absorption, Nature, 448, 575–578, https://doi.org/10.1038/nature06019, 2007.
Sarangi, C., Qian, Y., Rittger, K., Bormann, K. J., Liu, Y., Wang, H., Wan, H., Lin, G., and Painter, T. H.: Impact of light-absorbing particles on snow albedo darkening and associated radiative forcing over high-mountain Asia: high-resolution WRF-Chem modeling and new satellite observations, Atmos. Chem. Phys., 19, 7105–7128, https://doi.org/10.5194/acp-19-7105-2019, 2019.
Seaman, N. L., Stauffer, D. R., and Lario-Gibbs, A. M.: A Multiscale Four-Dimensional Data Assimilation System Applied in the San Joaquin Valley during SARMAP. Part I: Modeling Design and Basic Performance Characteristics, J. Appl. Meteorol., 34, 1739–1761, https://doi.org/10.1175/1520-0450(1995)034<1739:AMFDDA>2.0.CO;2, 1995.
Shi, X., Wang, Y., and Xu, X.: Effect of mesoscale topography over the Tibetan Plateau on summer precipitation in China: A regional model study, Geophys. Res. Lett., 35, 255, https://doi.org/10.1029/2008GL034740, 2008.
Singh, P. and Bengtsson, L.: Hydrological sensitivity of a large Himalayan basin to climate change, Hydrol. Process., 18, 2363–2385, https://doi.org/10.1002/hyp.1468, 2004.
Skamarock, W. C., Klemp, J. B., Dudhia, J., Gill, D. O., Barker, D. M., Duda, M., Huang, X. Y., Wang, W., and Powers, J. G.: A Description of the Advanced Research WRF Version 3, NCAR Technical Note, NCAR/TN-468+STR, available at: http://wrf-model.org/wrfadmin/docs/arw v2.pdf (last access: 14 May 2020), 2008.
Stauffer, D. R. and Seaman, N. L.: Use of Four-Dimensional Data Assimilation in a Limited-Area Mesoscale Model. Part I: Experiments with Synoptic-Scale Data, Mon. Weather Rev., 118, 1250–1277, https://doi.org/10.1175/1520-0493(1990)118<1250:UOFDDA>2.0.CO;2, 1990.
Wagner, J. S., Gohm, A., and Rotach, M. W.: The Impact of Horizontal Model Grid Resolution on the Boundary Layer Structure over an Idealized Valley, Mon. Weather Rev., 142, 3446–3465, https://doi.org/10.1175/MWR-D-14-00002.1, 2014.
Wang, X., Gong, P., Sheng, J., Joswiak, D. R., and Yao, T.: Long-range atmospheric transport of particulate Polycyclic Aromatic Hydrocarbons and the incursion of aerosols to the southeast Tibetan Plateau, Atmos. Environ., 115, 124–131, https://doi.org/10.1016/j.atmosenv.2015.04.050, 2015.
Wang, Y., Yang, K., Zhou, X., Chen, D., Lu, H., Ouyang, L., Chen, Y., Lazhu, and Wang, B.: Synergy of orographic drag parameterization and high resolution greatly reduces biases of WRF-simulated precipitation in central Himalaya, Clim. Dynam., 54, 1729–1740, https://doi.org/10.1007/s00382-019-05080-w, 2020.
Wiedinmyer, C., Akagi, S. K., Yokelson, R. J., Emmons, L. K., Al-Saadi, J. A., Orlando, J. J., and Soja, A. J.: The Fire INventory from NCAR (FINN): a high resolution global model to estimate the emissions from open burning, Geosci. Model Dev., 4, 625–641, https://doi.org/10.5194/gmd-4-625-2011, 2011.
Wu, G., Liu, Y., Zhang, Q., Duan, A., Wang, T., Wan, R., Liu, X., Li, W., Wang, Z., and Liang, X.: The Influence of Mechanical and Thermal Forcing by the Tibetan Plateau on Asian Climate, J. Hydrometeorol., 8, 770–789, https://doi.org/10.1175/JHM609.1, 2007.
Wu, G., Liu, Y., Dong, B., Liang, X., Duan, A., Bao, Q., and Yu, J.: Revisiting Asian monsoon formation and change associated with Tibetan Plateau forcing: I. Formation, Clim. Dynam., 39, 1169–1181, https://doi.org/10.1007/s00382-012-1334-z, 2012a.
Wu, G., Liu, Y., He, B., Bao, Q., Duan, A., and Jin, F. F.: Thermal controls on the Asian summer monsoon, Sci. Rep.-UK, 2, 404, https://doi.org/10.1038/srep00404, 2012b.
Wu, L., Su, H., and Jiang, J. H.: Regional simulation of aerosol impacts on precipitation during the East Asian summer monsoon, J. Geophys. Res.-Atmos., 118, 6454–6467, https://doi.org/10.1002/jgrd.50527, 2013.
Wulf, H., Bookhagen, B., and Scherler, D.: Differentiating between rain, snow, and glacier contributions to river discharge in the western Himalaya using remote-sensing data and distributed hydrological modeling, Adv. Water Resour., 88, 152–169, https://doi.org/10.1016/j.advwatres.2015.12.004, 2016.
Yang, J., Kang, S., Ji, Z., and Chen, D.: Modeling the Origin of Anthropogenic Black Carbon and Its Climatic Effect Over the Tibetan Plateau and Surrounding Regions, J. Geophys. Res.-Atmos., 123, 671–692, https://doi.org/10.1002/2017JD027282, 2018.
Yasunari, T. J., Bonasoni, P., Laj, P., Fujita, K., Vuillermoz, E., Marinoni, A., Cristofanelli, P., Duchi, R., Tartari, G., and Lau, K.-M.: Estimated impact of black carbon deposition during pre-monsoon season from Nepal Climate Observatory – Pyramid data and snow albedo changes over Himalayan glaciers, Atmos. Chem. Phys., 10, 6603–6615, https://doi.org/10.5194/acp-10-6603-2010, 2010.
Ye, D. Z. and Wu, G. X.: The role of the heat source of the Tibetan Plateau in the general circulation, Meteorl. Atmos. Phys., 67, 181–198, https://doi.org/10.1007/BF01277509, 1998.
Zängl, G., Egger, J., and Wirth, V.: Diurnal Winds in the Himalayan Kali Gandaki Valley. Part II: Modeling, Mon. Weather Rev., 129, 1062–1080, https://doi.org/10.1175/1520-0493(2001)129<1062:DWITHK>2.0.CO;2, 2001.
Zaveri, R. A. and Peters, L. K.: A new lumped structure photochemical mechanism for large-scale applications, J. Geophys. Res., 104, 30387–30415, https://doi.org/10.1029/1999JD900876, 1999.
Zaveri, R. A., Easter, R. C., Fast, J. D., and Peters, L. K.: Model for Simulating Aerosol Interactions and Chemistry (MOSAIC), J. Geophys. Res., 113, 1591, https://doi.org/10.1029/2007JD008782, 2008.
Zhang, A., Fu, Y., Chen, Y., Liu, G., and Zhang, X.: Impact of the surface wind flow on precipitation characteristics over the southern Himalayas: GPM observations, Atmos. Res., 202, 10–22, https://doi.org/10.1016/j.atmosres.2017.11.001, 2018.
Zhang, R., Wang, H., Qian, Y., Rasch, P. J., Easter, R. C., Ma, P.-L., Singh, B., Huang, J., and Fu, Q.: Quantifying sources, transport, deposition, and radiative forcing of black carbon over the Himalayas and Tibetan Plateau, Atmos. Chem. Phys., 15, 6205–6223, https://doi.org/10.5194/acp-15-6205-2015, 2015.
Zhang, R., Wang, Y., He, Q., Chen, L., Zhang, Y., Qu, H., Smeltzer, C., Li, J., Alvarado, L. M. A., Vrekoussis, M., Richter, A., Wittrock, F., and Burrows, J. P.: Enhanced trans-Himalaya pollution transport to the Tibetan Plateau by cut-off low systems, Atmos. Chem. Phys., 17, 3083–3095, https://doi.org/10.5194/acp-17-3083-2017, 2017.
Zhang, Y., Kang, S., Cong, Z., Schmale, J., Sprenger, M., Li, C., Yang, W., Gao, T., Sillanpää, M., Li, X., Liu, Y., Chen, P., and Zhang, X.: Light-absorbing impurities enhance glacier albedo reduction in the southeastern Tibetan plateau, J. Geophys. Res.-Atmos., 122, 6915–6933, https://doi.org/10.1002/2016JD026397, 2017.
Zhang, Y., Kang, S., Sprenger, M., Cong, Z., Gao, T., Li, C., Tao, S., Li, X., Zhong, X., Xu, M., Meng, W., Neupane, B., Qin, X., and Sillanpää, M.: Black carbon and mineral dust in snow cover on the Tibetan Plateau, The Cryosphere, 12, 413–431, https://doi.org/10.5194/tc-12-413-2018, 2018.
Zhao, C., Liu, X., Leung, L. R., Johnson, B., McFarlane, S. A., Gustafson Jr., W. I., Fast, J. D., and Easter, R.: The spatial distribution of mineral dust and its shortwave radiative forcing over North Africa: modeling sensitivities to dust emissions and aerosol size treatments, Atmos. Chem. Phys., 10, 8821–8838, https://doi.org/10.5194/acp-10-8821-2010, 2010.
Zhao, C., Liu, X., Ruby Leung, L., and Hagos, S.: Radiative impact of mineral dust on monsoon precipitation variability over West Africa, Atmos. Chem. Phys., 11, 1879–1893, https://doi.org/10.5194/acp-11-1879-2011, 2011.
Zhao, C., Liu, X., and Leung, L. R.: Impact of the Desert dust on the summer monsoon system over Southwestern North America, Atmos. Chem. Phys., 12, 3717–3731, https://doi.org/10.5194/acp-12-3717-2012, 2012.
Zhao, C., Ruby Leung, L., Easter, R., Hand, J., and Avise, J.: Characterization of speciated aerosol direct radiative forcing over California, J. Geophys. Res.-Atmos., 118, 2372–2388, https://doi.org/10.1029/2012JD018364, 2013a.
Zhao, C., Chen, S., Leung, L. R., Qian, Y., Kok, J. F., Zaveri, R. A., and Huang, J.: Uncertainty in modeling dust mass balance and radiative forcing from size parameterization, Atmos. Chem. Phys., 13, 10733–10753, https://doi.org/10.5194/acp-13-10733-2013, 2013b.
Zhao, C., Hu, Z., Qian, Y., Ruby Leung, L., Huang, J., Huang, M., Jin, J., Flanner, M. G., Zhang, R., Wang, H., Yan, H., Lu, Z., and Streets, D. G.: Simulating black carbon and dust and their radiative forcing in seasonal snow: a case study over North China with field campaign measurements, Atmos. Chem. Phys., 14, 11475–11491, https://doi.org/10.5194/acp-14-11475-2014, 2014.
Zhao, C., Huang, M., Fast, J. D., Berg, L. K., Qian, Y., Guenther, A., Gu, D., Shrivastava, M., Liu, Y., Walters, S., Pfister, G., Jin, J., Shilling, J. E., and Warneke, C.: Sensitivity of biogenic volatile organic compounds to land surface parameterizations and vegetation distributions in California, Geosci. Model Dev., 9, 1959–1976, https://doi.org/10.5194/gmd-9-1959-2016, 2016.
Zhao, P., Zhou, X., Chen, J., Liu, G., and Nan, S.: Global climate effects of summer Tibetan Plateau, Sci. Bull., 64, 1–3, https://doi.org/10.1016/j.scib.2018.11.019, 2019.
Zhao, Z., Cao, J., Shen, Z., Xu, B., Zhu, C., Chen, L. W. A., Su, X., Liu, S., Han, Y., Wang, G., and Ho, K.: Aerosol particles at a high-altitude site on the Southeast Tibetan Plateau, China: Implications for pollution transport from South Asia, J. Geophys. Res.-Atmos., 118, 11360–11375, https://doi.org/10.1002/jgrd.50599, 2013.
Zhong, S., Qian, Y., Zhao, C., Leung, R., Wang, H., Yang, B., Fan, J., Yan, H., Yang, X.-Q., and Liu, D.: Urbanization-induced urban heat island and aerosol effects on climate extremes in the Yangtze River Delta region of China, Atmos. Chem. Phys., 17, 5439–5457, https://doi.org/10.5194/acp-17-5439-2017, 2017.
Zhou, X., Beljaars, A., Wang, Y., Huang, B., Lin, C., Chen, Y., and Wu, H.: Evaluation of WRF simulations with different selections of subgrid orographic drag over the Tibetan Plateau, J. Geophys. Res.-Atmos., 122, 9759–9772, https://doi.org/10.1002/2017JD027212, 2017.
Zhou, X., Yang, K., and Wang, Y.: Implementation of a turbulent orographic form drag scheme in WRF and its application to the Tibetan Plateau, Clim. Dynam., 50, 2443–2455, https://doi.org/10.1007/s00382-017-3677-y, 2018.