the Creative Commons Attribution 4.0 License.
the Creative Commons Attribution 4.0 License.
 | 14 May 2020
Mixing characteristics of refractory black carbon aerosols at an urban site in Beijing
Dantong Liu
Xiaoyong Liu
Xueshun Chen
Yu Tian
Pingqing Fu
Zifa Wang
Black carbon aerosols play an important role in climate change because they directly absorb solar radiation. In this study, the mixing state of refractory black carbon (rBC) at an urban site in Beijing in the early summer of 2018 was studied with a single-particle soot photometer (SP2) as well as a tandem observation system with a centrifugal particle mass analyzer (CPMA) and a differential mobility analyzer (DMA). The results demonstrated that the mass-equivalent size distribution of rBC exhibited an approximately lognormal distribution with a mass median diameter (MMD) of 171 nm. When the site experienced prevailing southerly winds, the MMD of rBC increased notably, by 19 %. During the observational period, the ratio of the diameter of rBC-containing particles (Dp) to the rBC core (Dc) was 1.20 on average for Dc=180 nm, indicating that the majority of rBC particles were thinly coated. The Dp∕Dc value exhibited a clear diurnal pattern, with a maximum at 14:00 LST and a Dp growth rate of 2.3 nm h−1; higher Ox conditions increased the coating growth rate.
The microphysical properties of rBC were also studied. Bare rBC particles were mostly found in fractal structures with a mass fractal dimensions (Dfm) of 2.35, with limited variation during both clean and polluted periods. The morphology of rBC changed with coating thickness increasing. When the mass ratio of nonrefractory matter to rBC (MR) was <1.5, rBC-containing particles were primarily found in external fractal structures, and they changed to a core–shell structure when MR>6, at which point the measured scattering cross section of rBC-containing particles was consistent with that based on the Mie-scattering simulation. We found that only 28 % of the rBC-containing particles were in core–shell structures with a particle mass of 10 fg in the clean period but that proportion increased considerably, to 45 %, in the polluted period. Due to the morphology change, the absorption enhancement (Eabs) was 12 % lower than that predicted for core–shell structures.
- Article
(6858 KB) - Full-text XML
-
Supplement
(880 KB) - BibTeX
- EndNote


Black carbon (BC) aerosol is one of the principal light-absorbing aerosols in the atmosphere. BC is regarded as one of the most important components contributing to global warming (Bond et al., 2013). BC has a much shorter lifetime than CO2. Thus, BC's radiative perturbation on a regional scale may be different from globally averaged estimates. It has been reported that BC's direct radiative forcing can reach an order of ≥ 10 W m−2 over eastern and southern Asia (Bond et al., 2013). BC aerosols can also influence the climate by altering cloud properties, such as the evaporation of cloud droplets, cloud lifetime and albedo (Ramanathan et al., 2001; Ramanathan and Carmichael, 2008). Ding et al. (2016) determined that the existence of BC in the upper mixing layer could absorb downward solar radiation, impeding the development of the boundary layer, which aggravates air pollution. Moreover, BC aerosols have detrimental health effects. Black carbon and organic carbon are regarded as the most toxic pollutants in PM2.5 and lead to as many as ∼3 million premature deaths worldwide (Adler et al., 2010; Apte et al., 2015).
Black carbon is typically emitted from the incomplete combustion of fossil fuels and biomass. After being emitted into the atmosphere, BC particles tend to mix with other substances through coagulation, condensation and other photochemical processes that significantly change BC's cloud condensation nuclei activity as well as its light absorption ability (Bond et al., 2013; Liu et al., 2013). The model results suggest that after BC's core is surrounded by a well-mixed shell, its direct-absorption radiative forcing could be 50 % higher than that of BC in an external mixing structure (Jacobson, 2001). Such an absorption enhancement phenomenon is interpreted as exhibiting a “lensing effect”, in which a non-absorbing coating causes more radiation to interact with the BC core and thus more light is absorbed. This absorption enhancement effect has been proven in laboratory studies (Schnaiter et al., 2005). Shiraiwa et al. (2010) reported that the absorption enhancement of BC in a core–shell structure increased with coating thickness and reached a factor as high as 2. Nevertheless, field observation results demonstrated large discrepancies (6 % to 40 %) in the absorption enhancement of aged BC particles (Cappa et al., 2012; Lack et al., 2012). The discrepancies could be attributed to the complex mixing state of BC in the real atmosphere, which depends on the coating composition, the coating amount, and the size of the BC core and structure. Bond et al. (2013) regarded the mixing state of BC as one of the most important uncertainties in evaluating BC direct radiative forcing. Furthermore, freshly emitted BC is initially hydrophobic. Mixing BC with other soluble materials will significantly increase BC-containing particles' hygroscopicity and thus their ability to become cloud condensation nuclei (Bond et al., 2013; Popovicheva et al., 2011). This ability is associated with the wet deposition rate and consequently influences the lifetime and spatial distribution of BC particles in the atmosphere. For these reasons, more observations are needed to determine the specific spatial and temporal distribution of BC's mixing state, which would be helpful for minimizing the uncertainty in evaluating BC's climatic and environmental effects.
China's economy has grown rapidly in recent decades, accompanied by the substantial emission of pollutant precursors. Annual emissions of BC in China are reported to have increased from 0.87 Tg in 1980 to 1.88 Tg in 2009, comprising half of the total emissions in Asia and an average of 18.97 % of the global BC emissions during this period (Qin and Xie, 2012). Such substantial BC emissions greatly influence the regional climate and environment (Ding et al., 2016; Menon et al., 2002). Although spatio-temporal variations in BC and the corresponding optical properties of aged BC have been recently reported (Cao et al., 2004, 2007; Zhang et al., 2009), the number of observational studies on BC's mixing state remains insufficient. Recently, the single-particle soot photometer (SP2) has been used as a reliable instrument for estimating the mixing state of BC due to its single-particle resolution and high accuracy. Several studies have used SP2 to investigate BC's mixing state in China (Gong et al., 2016; Huang et al., 2012; Wang et al., 2016; Wu et al., 2017). Most studies have primarily focused on the variability in BC's mixing state on severe haze days during winter because of the extremely high concentrations of particle matter and low visibility. In summer, higher radiation and high hydroxyl radical concentrations favor photochemical reactions and thus contribute to the condensation aging of BC. By using a smog chamber, Peng et al. (2016) found that the amount of BC-containing particles increased rapidly, owing to the photochemical aging of the BC-coating materials from Beijing's urban environment, even in relatively clean conditions. Cheng et al. (2012) noted that the changing rate of BC from an external to internal mixing state can reach up to 20 % h−1 in summer. Thus, the mixing state of BC should also be carefully considered on relatively clean days during summer.
In this study, we used an SP2 to investigate BC in the urban areas of Beijing, China, during early summer, focusing on the size distribution and coating thickness of BC-containing particles. Field experiments using a tandem system consisting of a centrifugal particle mass analyzer (CPMA; Cambustion Ltd.) and a differential mobility analyzer (DMA; model 3085A, TSI Inc., USA) with an SP2 were performed during two during clean and polluted cases, focusing on BC-containing particles' microphysical properties, including the effective density, morphology and light absorption enhancement. The results of this paper were exhibited in the following sequence: (1) the size distribution of BC core and its influence factors such as seasons, weather conditions, etc.; (2) the coating thickness of BC and its influence factors such as diurnal variation, Ox condition, etc.; (3) the morphology of BC and its relationship with coating thickness; and (4) the relationship of morphology of BC with its light absorption. Various techniques have been developed to quantify the mass concentration of BC aerosols, including optical, thermal, thermal–optical and photoacoustic methods. For the SP2, the mass concentration of BC was measured on the basis of incandescent signal emissions; therefore, refractory black carbon (rBC) was used. The abbreviations and symbols used in this paper are listed in Table S1 in the Supplement.
2.1 Site description
The measurement of rBC particles was performed from 30 May to 13 June 2018 in an air-conditioned container located on the tower campus of the State Key Laboratory of Atmospheric Boundary Layer Physics and Atmospheric Chemistry (LAPC), Institute of Atmospheric Physics (39.97∘ N, 116.37∘ E). The sampling site is located between the northern 3rd and 4th Ring Road of Beijing, approximately 50 m from the closest road and 380 m away from the nearest highway (the Jingzang highway) (Fig. 1b). Anthropogenic emissions from the experimental campus were negligible. Thus, this site can represent the urban conditions in Beijing well.
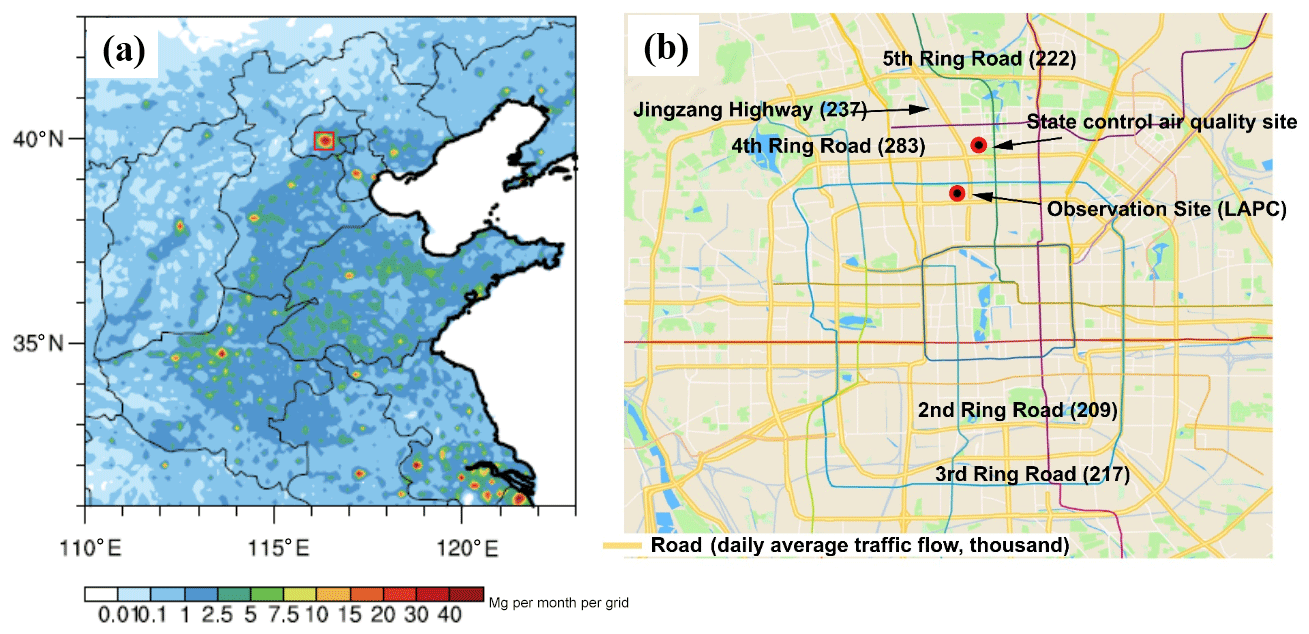
Figure 1(a) Monthly emissions of BC from traffic in June in eastern–central China. The red box denotes the geographical location of the observation site; the map was taken from NCL software (©2019 NCL, https://www.ncl.ucar.edu, last access: 28 March 2019). (b) Road map and traffic flow rate of Beijing. The red circle denotes the observation site; the map was taken from Google Maps (©Google Maps 2019, https://www.google.com/maps, last access: 15 January 2019).
2.2 Single-particle soot photometer (SP2)
A single-particle soot photometer (SP2, Droplet Measurement Technologies, Inc., Boulder, CO, USA) was used to determine the size distribution and mixing state of rBC particles in the atmosphere. In the SP2 measuring chamber, an intense continuous intracavity Nd : YAG laser beam is generated (1064 nm, TEM00 mode). After an rBC-containing particle crosses the beam, it is heated to incandesce by sequentially absorbing the laser power. The maximum incandescence intensity (or the peak height of the incandescence signal) is approximately linearly correlated with rBC mass, irrespective of the presence of non-BC material or the rBC's morphology. The SP2 was calibrated to determine the relationship between the incandescence peak height and the mass of rBC particles using Aquadag aerosols (Acheson Inc., USA). Figure 2b illustrates the schematic diagram of the calibration system. During calibration, monodisperse Aquadag aerosols were generated with an atomizer (model 3072, TSI Inc., USA) and dried using a diffusion dryer. Then, Aquadag aerosols with known mass (MrBC) were selected with a CPMA and injected into the SP2 to obtain the corresponding laser-induced incandescence (LII) signal. A recent study (Laborde et al., 2012) demonstrated that the mass of rBC particles could be underestimated when using Aquadag aerosol as the calibration material. We performed a correction by multiplying by a factor of 0.75 for LII peak height during the calibration, as described in Zhang et al. (2018) and Liu et al. (2014). The LII peak–MrBC relationship was thus obtained (Fig. S1 in the Supplement). The uncertainty of the derived rBC mass was estimated to be 20 %, which corresponds to an uncertainty of ∼6 % of the mass equivalent size (Dc),
by using a 1.8 g cm−3 density for rBC material density (Bond et al., 2013).
In addition to the incandescence channel, SP2 also has scattering channels to directly measure the scattering cross section (σmeasured) of every single particle. However, for rBC-containing particles, the particles will evaporate during the measurement, since rBC can absorb the laser energy, which results in a decrease in the rBC-containing particles' sizes and thus a decrease in the σmeasured. The leading-edge-only (LEO) fitting method was invented to obtain the scattering cross section of the initial rBC-containing particles before evaporation (Gao et al., 2007). With σmeasured and Dc, the diameter (Dp) of the rBC-containing particle can be obtained using Mie theory with refractive indices of 2.26–1.26i for the rBC (Moteki et al., 2010) and 1.48–0i for the coatings (Taylor et al., 2015) by assuming a core–shell structure. Thus, the coating thickness of rBC can be directly determined by SP2, as denoted by the shell–core ratio (Dp∕Dc). The Dp derivation method based on LEO fitting has been widely used (Taylor et al., 2015; Shiraiwa et al., 2008; Liu et al., 2014; Laborde et al., 2013), and Liu et al. (2015) estimated that the core–shell assumption will cause <6 % uncertainty in the derived Dp∕Dc. The scattering signal of SP2 was calibrated using polystyrene latex spheres (PSL, Nanosphere Size Standards, Duke Scientific Corp., USA) with known sizes (203±3 nm: lot no. 185856; 303±3 nm: lot no. 189903; 400±3 nm: lot no. 189904), as shown in Fig. S2. The calibration of the scattering channel and the incandescence channel was also conducted after the observation. The calibration coefficient varied little (<3 %), and the YAG power (laser intensity index recorded by the SP2) fluctuated by 4.8±0.1, indicating the stable condition of the SP2 during the observation period.
The detection efficiency of the SP2 was determined by comparing the number concentrations of Aquadag as simultaneously measured by the SP2 and a condensation particle counter (CPC; model 3775, TSI Inc., USA). For large particles, the SP2 detection efficiency was approximately unity and decreased gradually for smaller rBC particles (Fig. S3). For rBC with Dc<70 nm, the detection efficiency of the SP2 fell significantly below 60 %. The mass concentrations of rBC may be underestimated because of the low detection efficiency of for smaller rBC particles. By extrapolating a lognormal function fit to the observed mass distribution, we found that rBC particles outside the detection range caused an ∼15 % underestimation of the rBC mass concentration. To compensate, the mass concentration of rBC was corrected by dividing by a factor of 0.85 during the measurement.
In general, the SP2 can directly measure the mass of the rBC core (MrBC) and thus the mass equivalent diameter (Dc). Additionally, the scattering cross section (σmeasured) can be directly obtained by the SP2, and the diameter of the rBC-containing particle (Dp) can be derived using Mie theory.
2.3 Experiment
Two kinds of measurements were conducted in this study: a regular single-SP2 observation to provide the number and mass size distribution and coating thickness of the rBC-containing particles and a tandem CPMA-SP2–DMA-SP2 experiment to study the microphysical properties of the rBC-containing particles.
2.3.1 Single-SP2 measurement
The regular single-SP2 observations were conducted from 30 May to 7 June and 9 to 12 June. An aerosol sampling inlet was placed at 4 m a.g.l. (meters above ground level). A PM2.5 cyclone (URG-2000-30ENS-1) was used to selectively measure particles with an aerodynamic diameter smaller than 2.5 µm because rBC particles are typically present in the submicron mode. The systematic configuration of the rBC measurements is presented in Fig. 2a. A supporting pump with a flow rate of 9.6 L min−1 was used to guarantee a total inlet flow rate of 10 L min−1 (the demanding flow rate of a PM2.5 cyclone) and to minimize particle loss in the tube. The residence time of the sampling flow was estimated to be ∼17 s. Then, the sample air was dried by passing through a Nafion dryer (MD-700-24S, TSI) at a flow rate of 0.4 L min−1. The dried sample was measured with the SP2 and CPC.
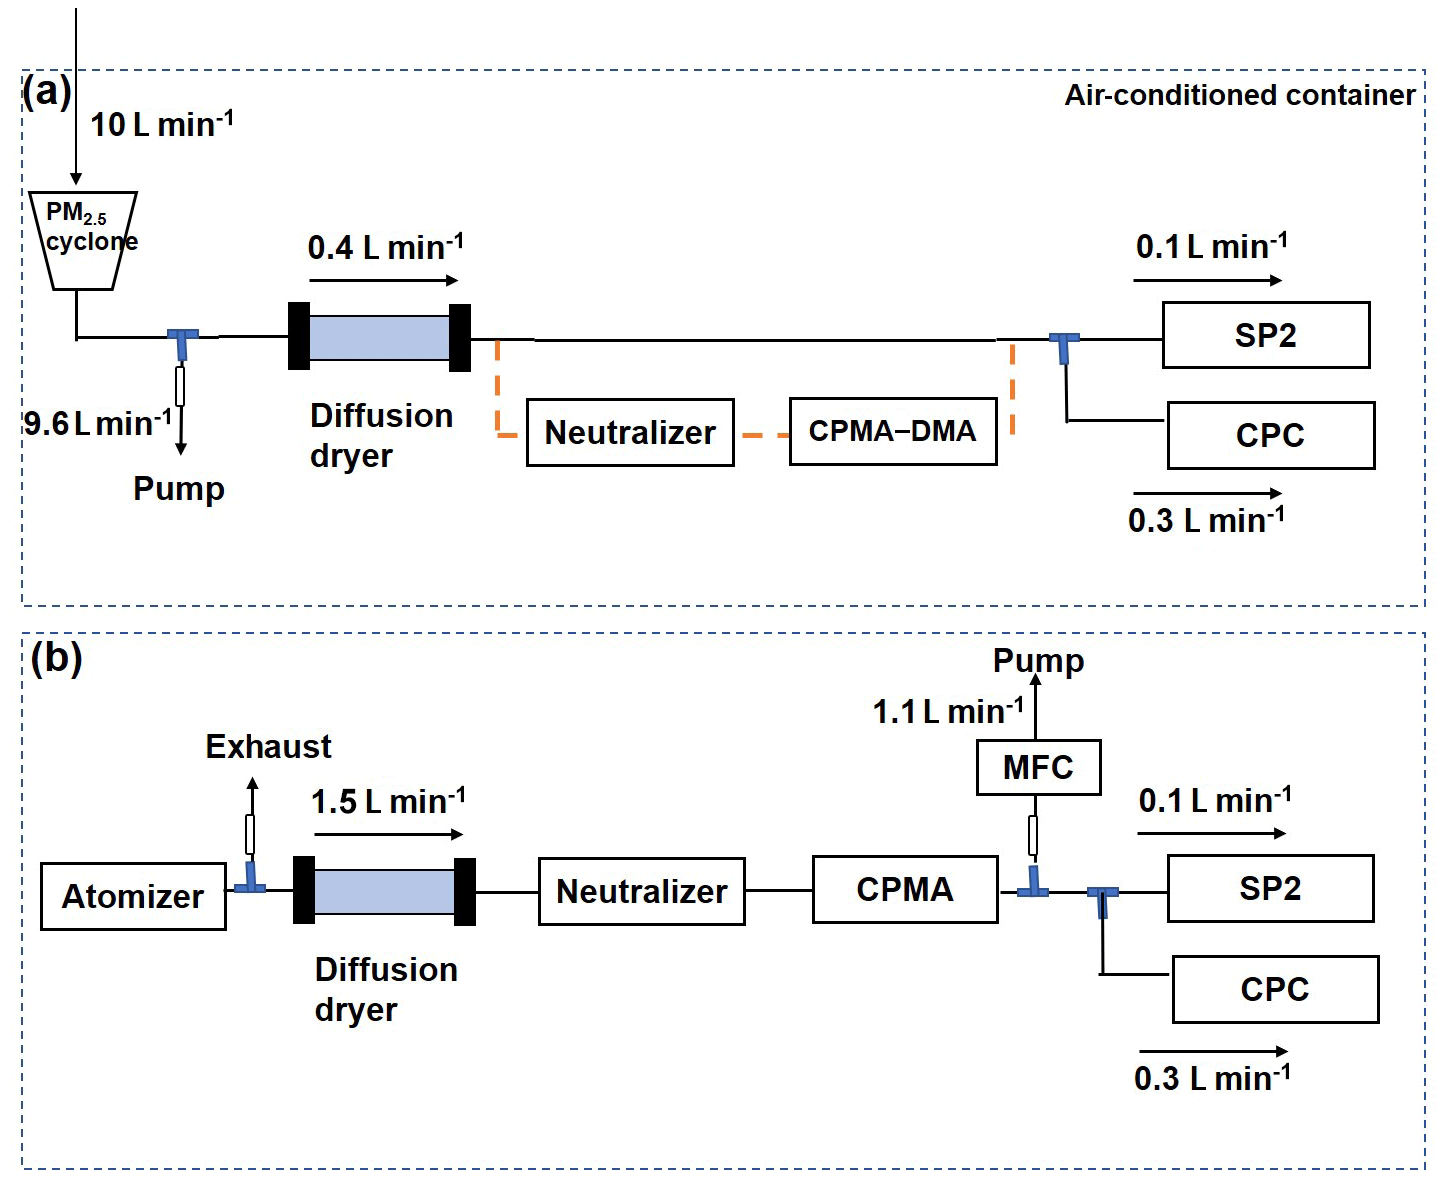
Figure 2Schematic diagram of (a) the measurement system, with the orange dashed line denoting the tandem CPMA-SP2–DMA-SP2 measurement system, during the periods 9 and 13 June, and (b) the calibration system.
2.3.2 Tandem CPMA-SP2–DMA-SP2 measurement
The tandem CPMA-SP2–DMA-SP2 experiments were conducted on 8 and 13 June: 8 June is representative of a clean period, when the concentrations of PM2.5 and O3 averaged 20 µg m−3 and 60 ppbv, respectively, and Beijing was mainly affected by a clean northern air mass (Fig. S5), while 13 June is representative of a polluted period when the hourly mass concentration of PM2.5 exceeded 110 µg m−3 – the air mass was from the southern area of Beijing, which is one of the most polluted areas in China. Thus, the tandem CPMA-SP2–DMA-SP2 experiment was conducted on 8 and 13 June to study the detailed physical characteristics of rBC under different pollution conditions.
As shown in Fig. 2a, the tandem system was similar to the regular single-SP2 observation system. The difference is the neutralizer, and a DMA or CPMA was added in front of the SP2, as denoted by the orange dashed line. Specifically, in the DMA-SP2 system, particles were first selected by DMA to obtain particles with known mobility diameters (Dmob). Then, the monodispersed particles were injected into the SP2 to obtain the corresponding information. In practice, we set three Dmob points (Dmob=200, 250, 300 nm). The duration of one set point is ∼20 min, and we recorded data 2 min after we changed the set point to allow the system to stabilize. The purpose of the DMA-SP2 system is to obtain the effective density of bare rBC. Bare rBC is defined as rBC with , and the effective density of bare rBC was calculated according to the following equation:
In principle, the measured effective density is the same as the material density if the particle has an ideal spherical shape with no void space. Thus, the effective density is an indicator of particle compactness, as it compares the effective density and the material density. Several studies that include the coupling of DMA with an aerosol particle mass analyzer (APM) or CPMA have been conducted to determine the ρeff−Dmob relationship of Aquadag rBC samples in the laboratory (Moteki and Kondo, 2010; Gysel et al., 2011). The relationship between the ρeff and Dmob of Aquadag is presented in Fig. S4. The ρeff obtained using the DMA-SP2 system in this study agreed well with previous research.
In the CPMA-SP2 system, particles with known mass (Mp) selected by CPMA were injected into the SP2, and the Mp set points were 1, 2, 5 and 10 fg. The duration of one set point was ∼20 min, and we waited 2 min after we changed the set points to record a measurement. The purpose of the CPMA-SP2 system is to obtain morphological information about rBC-containing particles with different coating degrees. Using a tandem CPMA-SP2 system, the mass of an rBC-containing particle (Mp) and of the rBC core (MrBC) can be simultaneously obtained. The coating thickness can be represented by the mass ratio of the coating to the rBC core (MR= () without any assumptions. Knowing Mp and MrBC, the scattering cross section of rBC-containing particles can be calculated through Mie theory with refractive indices of 2.26–1.26i for the rBC and 1.48i for the coatings by assuming a core–shell structure and a coating density of 1.5 g cm−3. The calculated scattering cross section (σmodel) can be compared to the σmeasured by SP2, which can reflect the morphological characteristic of rBC-containing particles; this comparison will be further discussed in Sect. 4.1.2.
2.4 Results
2.5 Concentrations of PM2.5, rBC and pollutant gases
The temporal variations in the concentrations of PM2.5, rBC and gaseous pollutants (O3, NO2) during the project are presented in Fig. 3. The regular pollutant concentrations, including PM2.5 (1405-F, Thermo Fisher Scientific), NO2 (42c, Thermo Fisher Scientific) and O3 (49i, Thermo Fisher Scientific), were obtained from a state-controlled air quality site (2.5 km from LAPC), provided by the China National Environmental Monitoring Center. The mass concentration of PM2.5 ranged between 5 and 120 µg m−3 on a daily basis during the observation period. The mixing ratios of both NO2 and O3 exhibited obvious opposite diurnal variations. The maximum O3 concentration appeared at 14:00 LST on 2 June, with a value of 145 ppbv, reflecting high atmospheric oxidant levels and strong photochemistry during the observation period. The mass concentration of rBC was 1.2±0.7 µg m−3 on average, accounting for 3.5±2.4 % of PM2.5 on an hourly basis, which was comparable to the previous filter-based measurement in Beijing, with an average fraction of 3.2 % in the summer of 2010 (Zhang et al., 2013). The mass concentration of rBC also exhibited a clear diurnal variation, with a maximum at night and a minimum at noon.

Figure 3Time series of aerosol/gaseous pollutants and meteorological conditions during the observation period.
During the period from 1 to 6 June, the meteorological conditions were characterized by low relative humidity (RH <40 %) and strong solar radiation and were favorable for ozone formation. The mixing ratio of ozone was relatively high from 1 to 6 June. On 7 June, a heavy rainfall event occurred, and most of the major pollutants decreased due to significant wet scavenging. The mass concentration of PM2.5 decreased from 65 to 10 µg m−3, and the mass concentration of rBC decreased from 2.6 to 0.2 µg m−3 from 03:00 to 07:00 LST on 7 June. The pollutant concentration remained at a low level from 7 to 8 June. After 9 June, the ambient RH increased to 80 %. Under high-humidity conditions, the mass concentration of PM2.5 experienced steady growth, increasing from 10 to 120 µg m−3 and staying at a high level from 12 to 13 June. Thus, the tandem CPMA-SP2–DMA-SP2 observations were conducted separately on 8 and 13 June, which separately represented the different PM2.5 pollution conditions.
2.6 Size distribution of rBC
The number and mass distribution as a function of the Dc are illustrated in Fig. 4. As presented, the number size distribution follows the lognormal distribution and peaks at 70 nm; the mass size distribution is also fitted by the lognormal distribution, and the mass median diameter (MMD) was 171 nm during the project. A brief summary of the SP2 observations in China is presented in Table 1. Most previous studies focused on the rBC characteristics in winter, when a larger MMD (∼200–230 nm) was obtained (Zhang et al., 2013; Wu et al., 2017; Wang et al., 2016; Huang et al., 2012; Gong et al., 2016) than in this study. A similar MMD (180 nm) was reported in urban Shenzhen during a summer observation period (Lan et al., 2013), and a higher MMD (210–222 nm) was reported in winter. Liu et al. (2014) also found a winter-high–summer-low trend for rBC sizes in London, with nm in winter and 120±6 nm in summer. Laboratory studies have proven that MMD is highly dependent on combustion conditions (Pan et al., 2017) and material. Thus, MMD is a suitable indicator of the sources of rBC. Several studies have suggested that the MMD of rBC from biomass burning and coal is much larger than that from traffic emissions (Wang et al., 2016; Schwarz et al., 2008). Huang et al. (2012) found the MMD observed at rural sites to be much larger than that observed at urban sites because urban sites are primarily affected by rBC emitted from traffic sources and rural sites are more influenced by rBC from coal combustion. The seasonal trends in MMD may be partially explained by the different rBC sources in summer and winter.
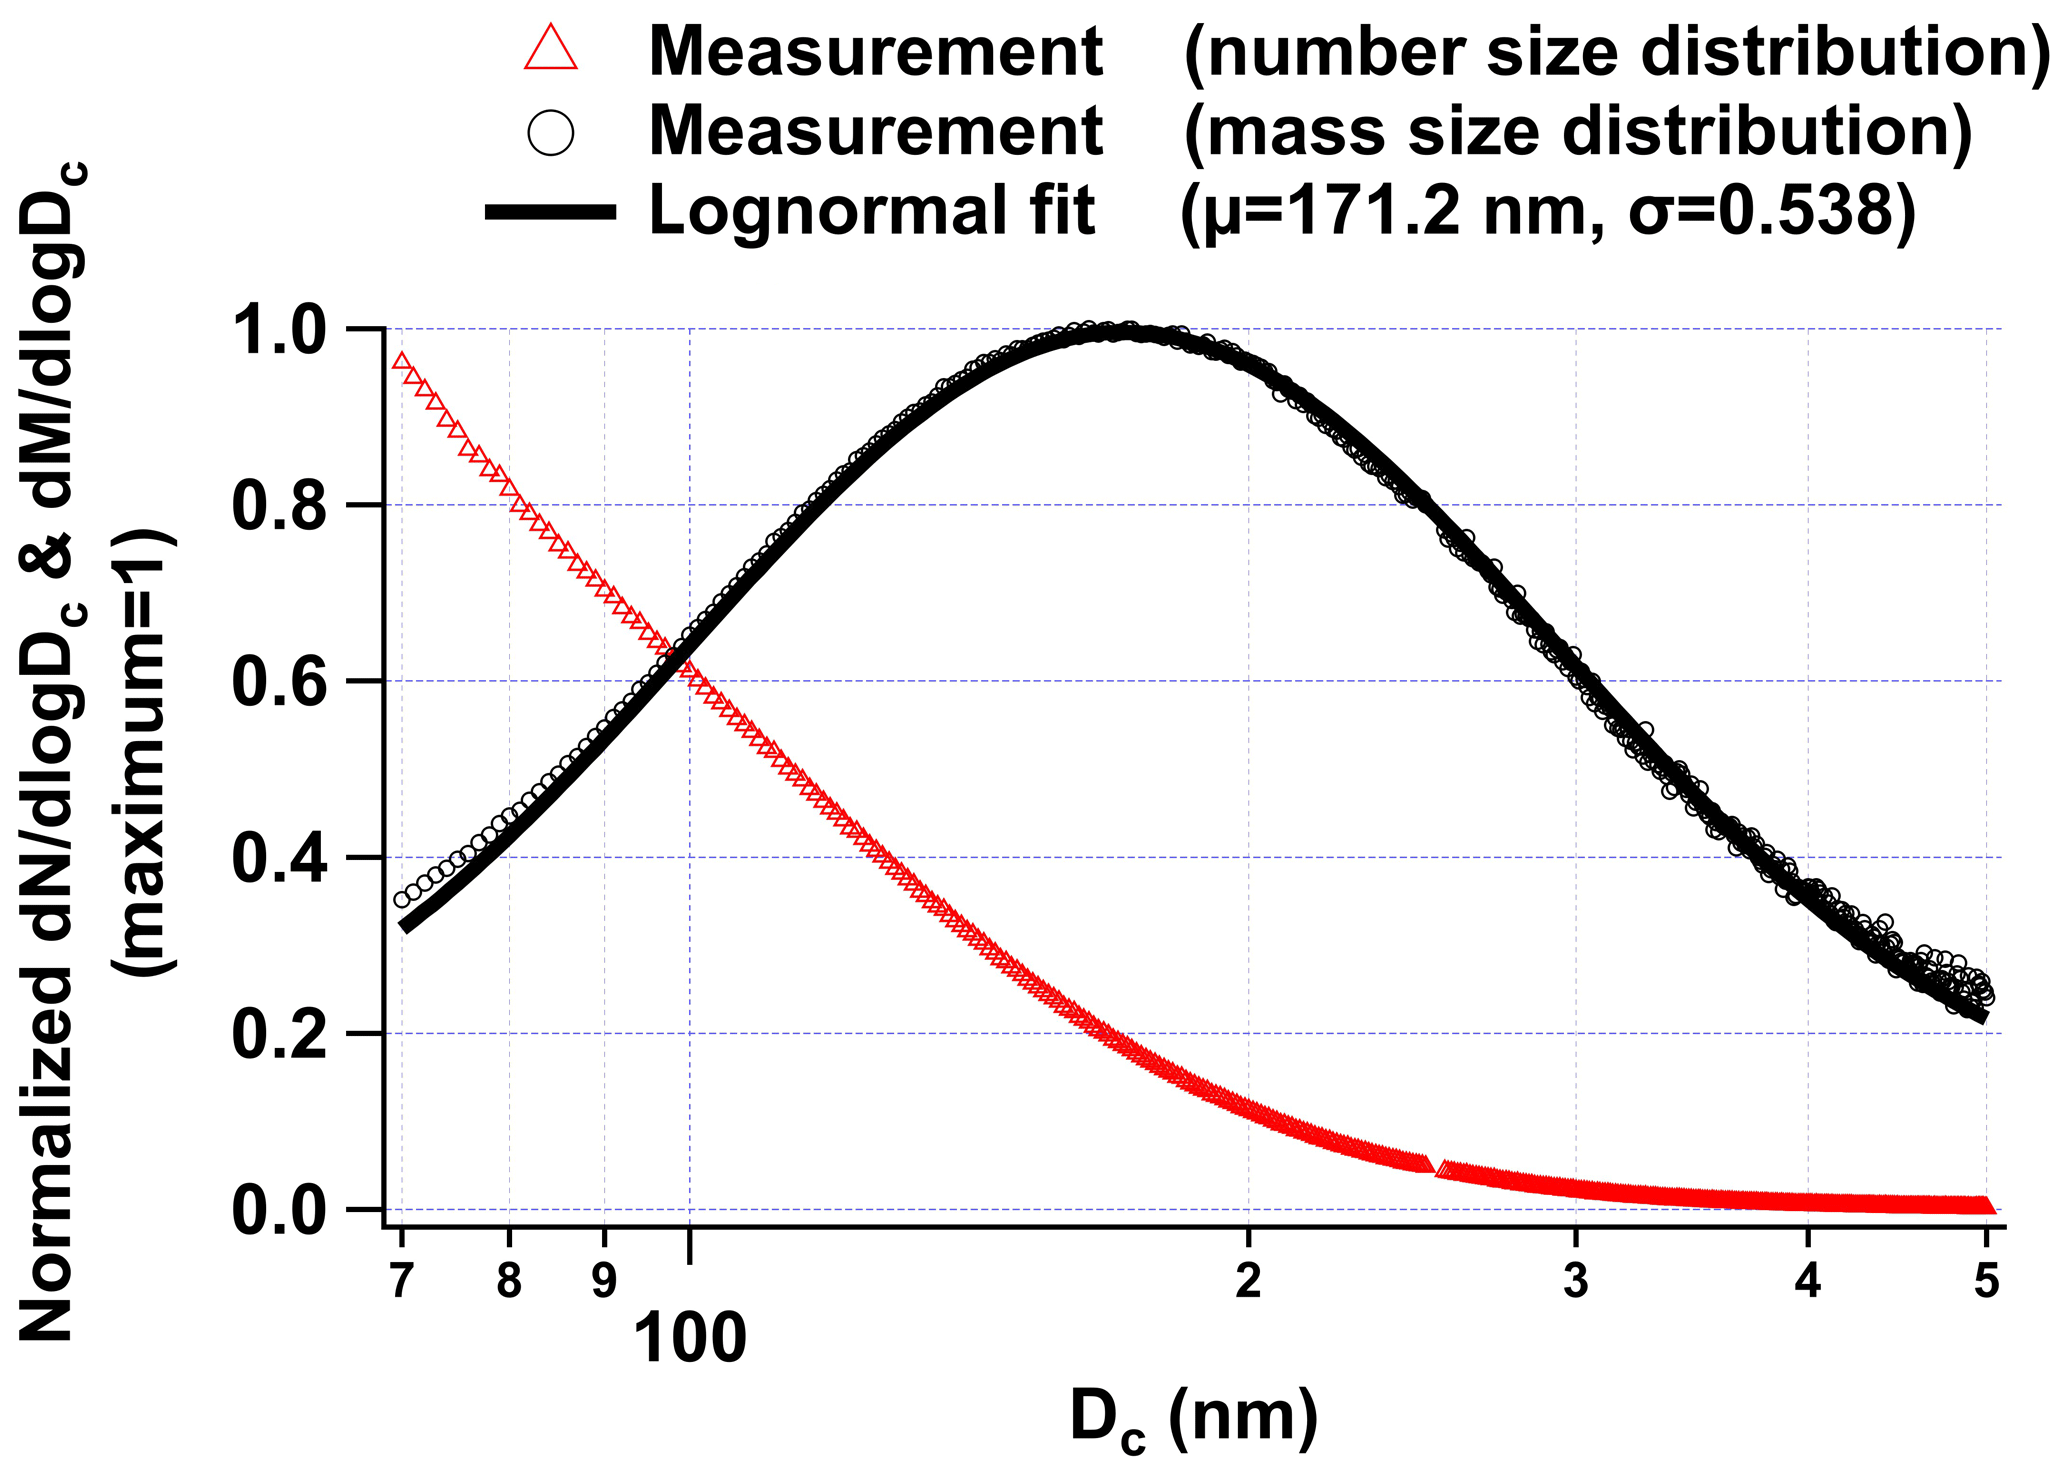
Figure 4Number and mass size distribution (dN ∕ dlogDc and dM ∕ dlogDc) during the observation period.
Table 1Brief summary of some of the observations on the mixing state of rBC-containing particles.
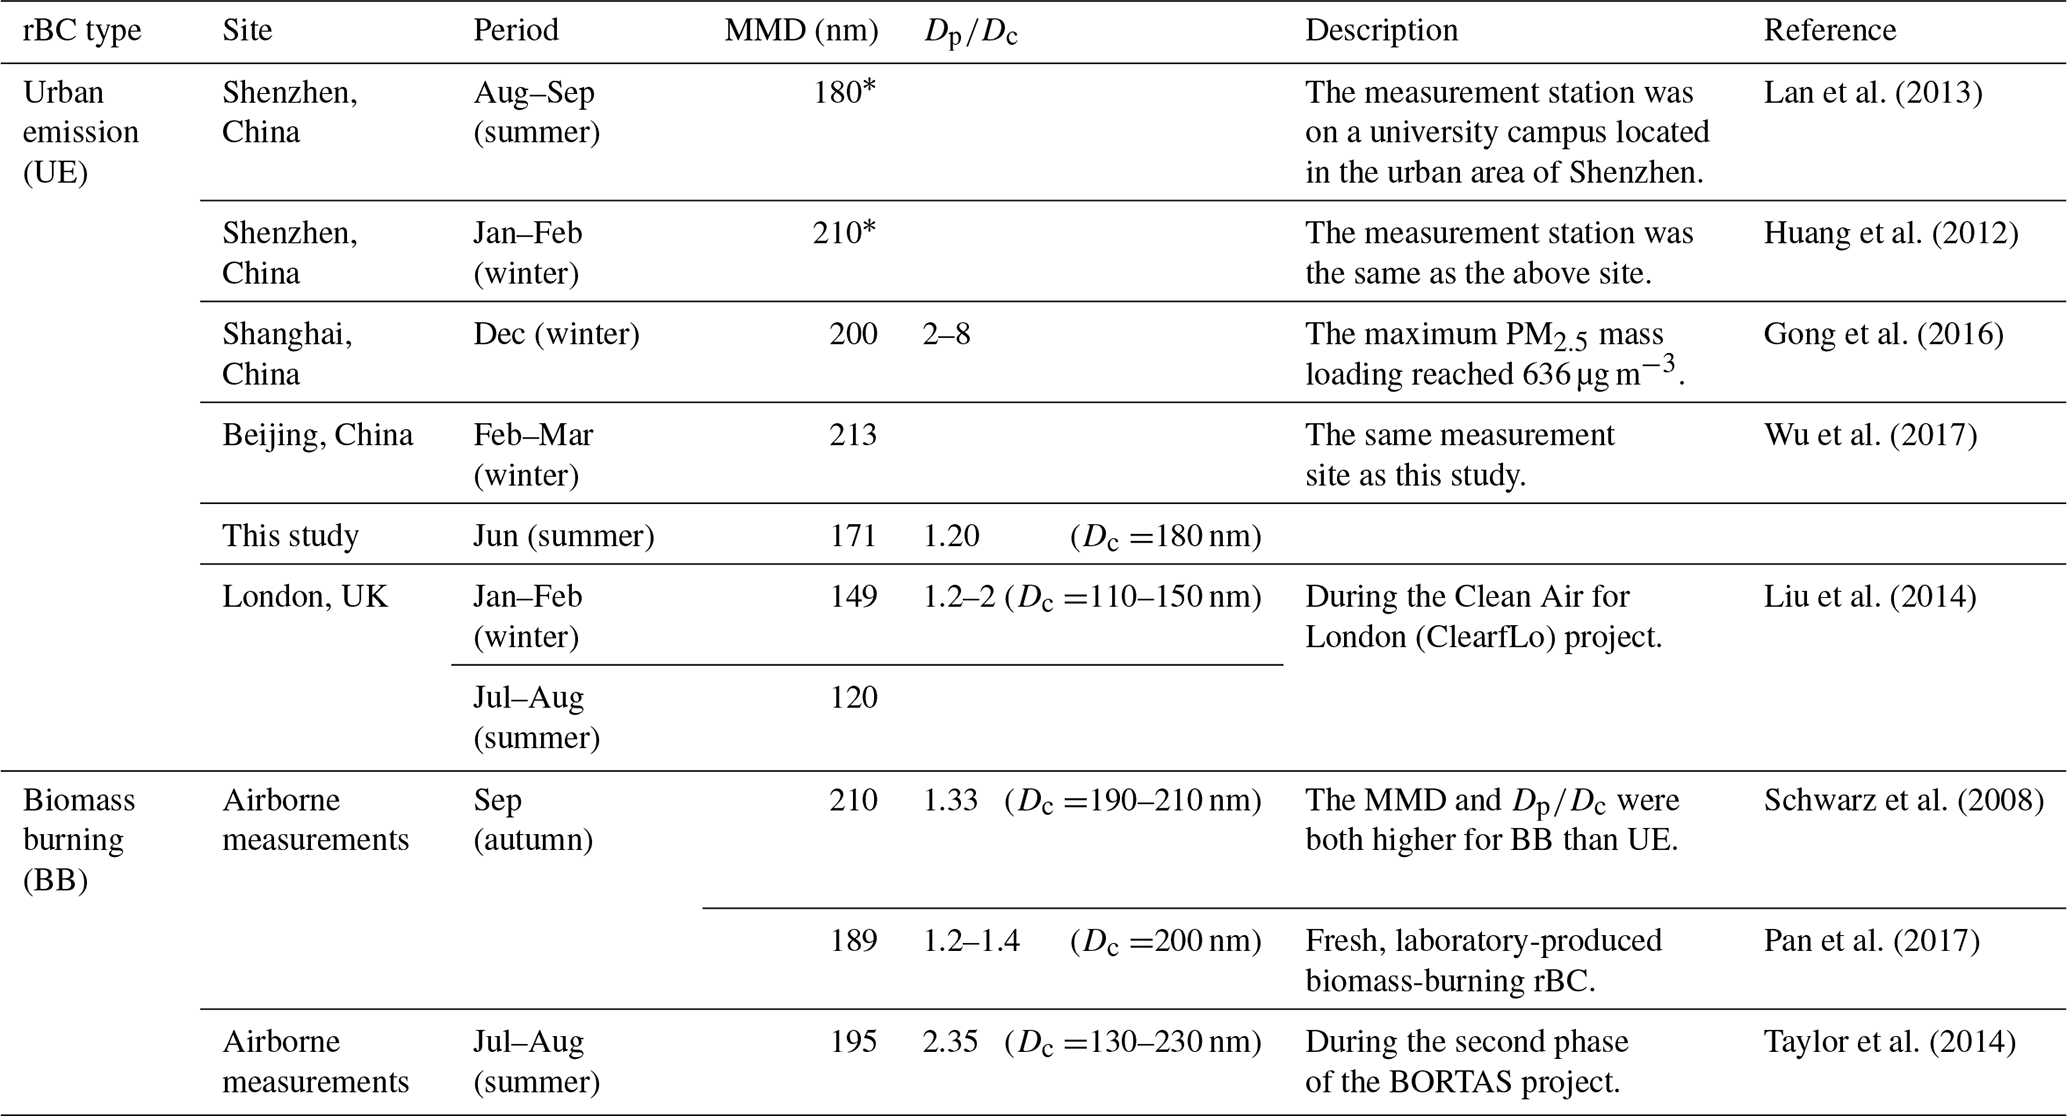
* Assuming that the density of rBC is 2 g cm−3.
Figure 5 provides the temporal variations in the mass size distribution of rBC during the entire investigation period. Most rBC particles were within the size range of 70–300 nm, with a clear diurnal pattern of the value of dM ∕ dlogDc. The diurnal cycle reached a peak plateau between 03:00 and 07:00 LST and decreased gradually in the afternoon. The cycle was controlled by the combined effects of the development of planetary boundary layer (PBL) variation and on-road rBC emissions.
After the two rain events (4 and 7 June), the MMD decreased significantly from 186 to 170 nm and from 183 to 159 nm, respectively, as shown in Figs. 3 and S7. Taylor et al. (2014) observed that the rBC core size distribution shifted to smaller sizes after a biomass-burning plume passed through a precipitating cloud, attributing this shift to the preferential nucleation scavenging of larger rBC cores. By counting the MMD on non-rainy days and rainy days, Wang et al. (2018) also found that the MMD decreased from 164±21 to 145±25 nm. The decrease in MMD after rain events can be explained by the preferential wet scavenging of the larger rBC-containing particles.
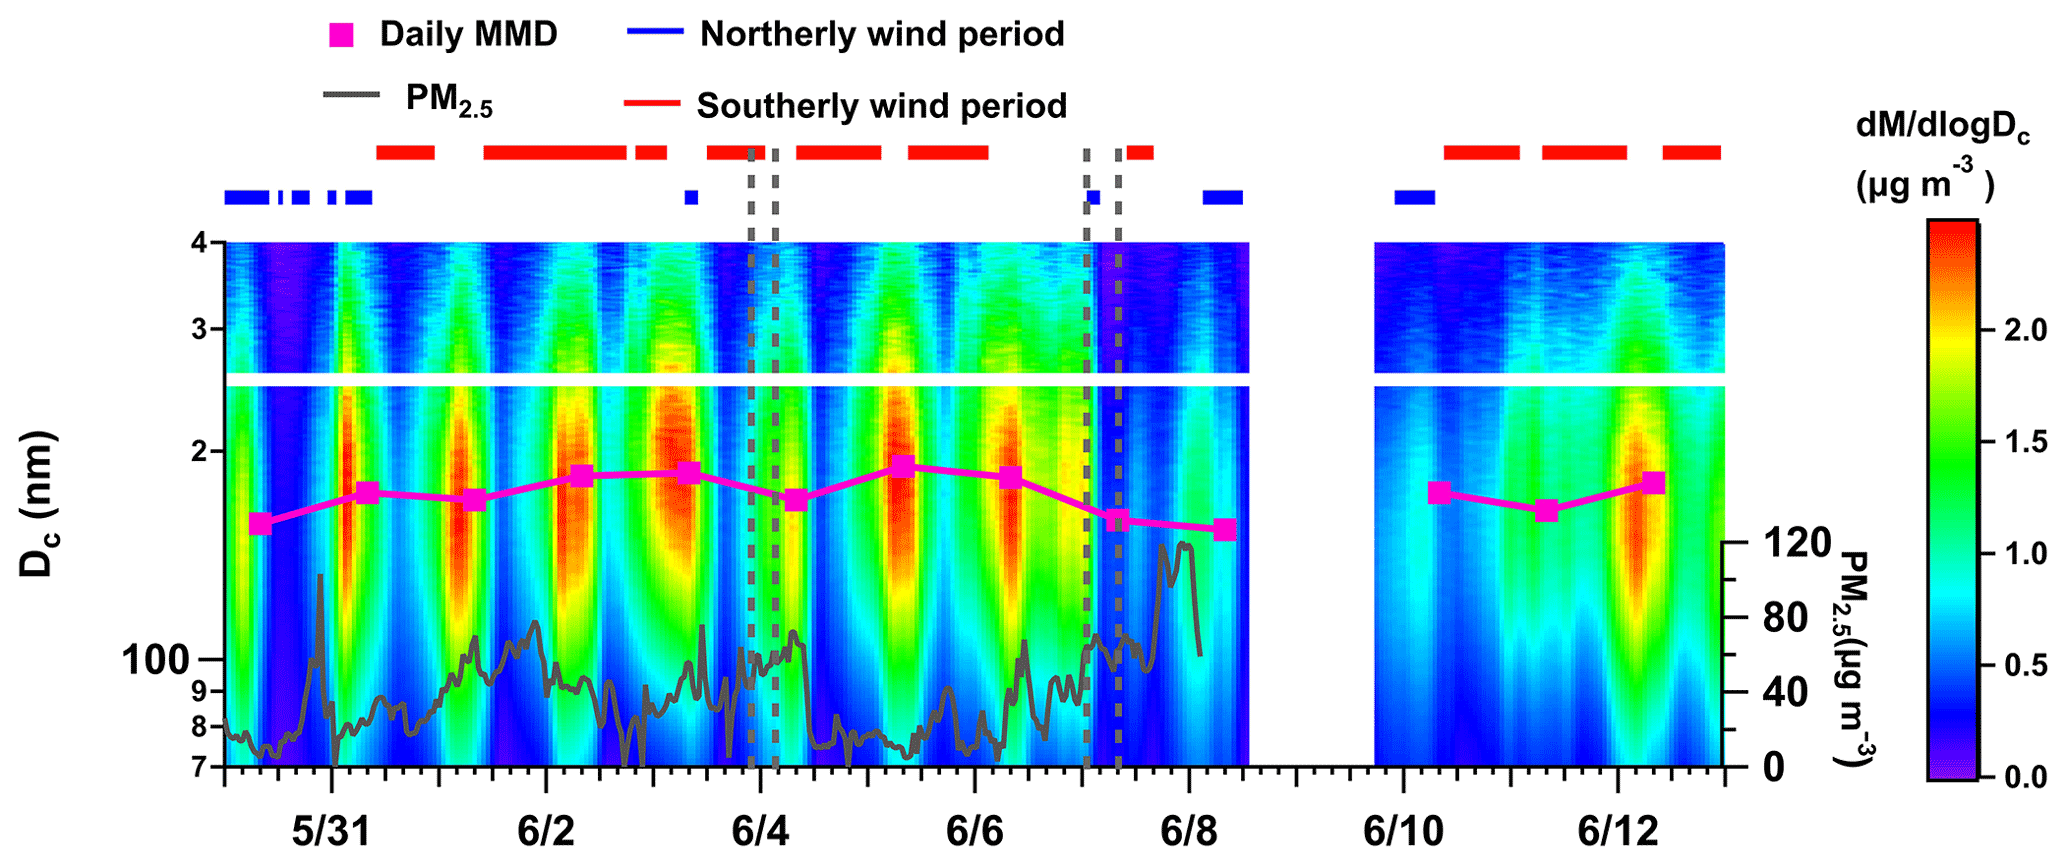
Figure 5Time series of the mass size distribution of rBC. A southerly wind period is selected when the wind direction is 135–225∘, and a northerly wind period is the time when the wind direction is 325–45∘. The gray dashed line denotes the rainy period.
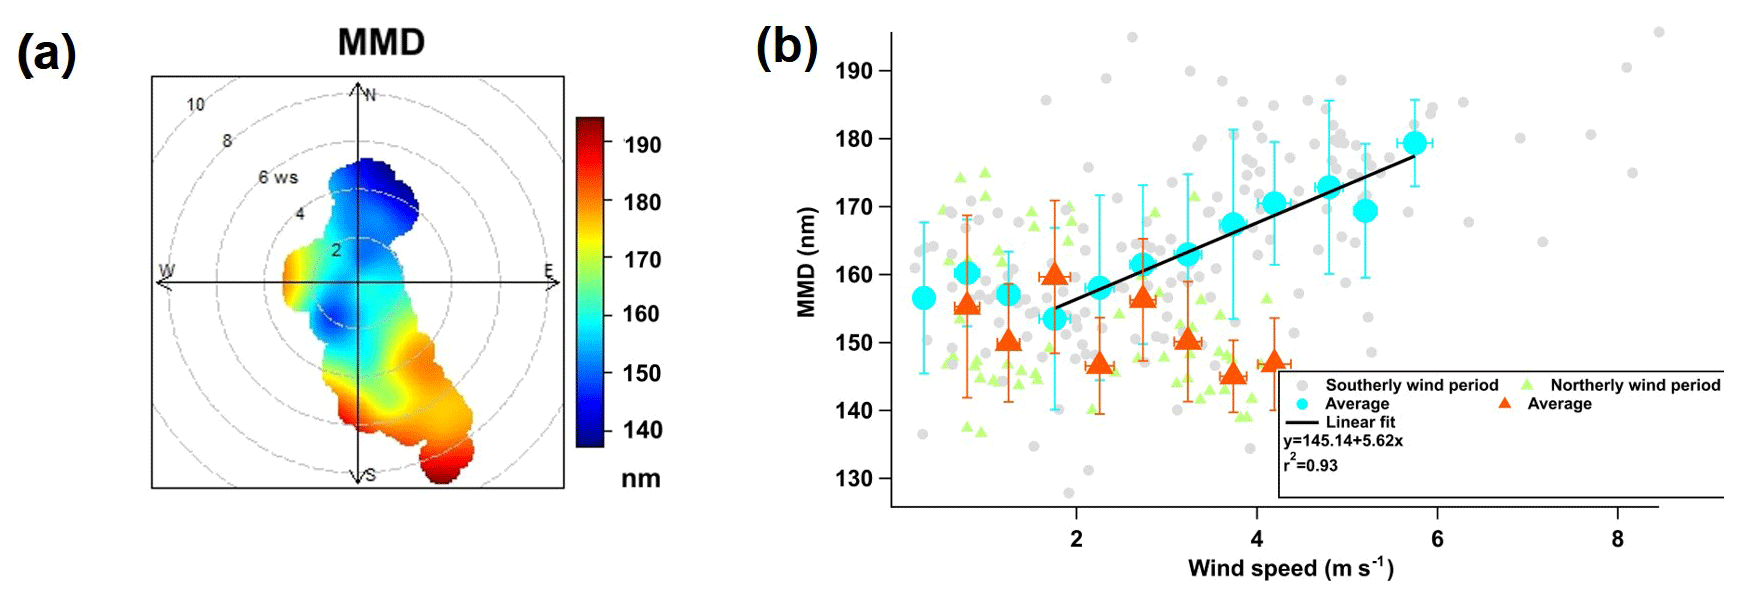
Figure 6(a) Dependence of rBC's MMD on wind speed and wind direction during the observation period. (b) MMD versus wind speed during the southerly wind period and northerly wind period. The error bars correspond to the standard deviations of MMD in each wind speed bin.
A pollutant rose plot of MMD versus wind speed and wind direction is presented in Fig. 6a. The MMD of rBC was ∼160 nm at low-wind-speed conditions and exhibited a significant increase with increasing southeastern wind speed. The maximum MMD exceeded 190 nm when the wind speed was greater than 10 m s−1. Figure 6b presents the correlation between wind speed and MMD. A southerly wind period was selected when the wind direction was 135–225∘, and a northerly wind period was the time when the wind direction was 325–45∘. The MMD exhibited little correlation with wind speed and varied little between the southern and northerly wind periods when the wind speeds were less than 2 m s−1, as local rBC emissions were predominant. An MMD of 150–160 nm during low-wind-speed periods may be characteristic of the local sources. The MMD had a strong positive correlation with the wind speed during the southerly wind period (r2=0.93), suggesting that the rBC from the south was larger, which may be the result of the different rBC sources in the southern polluted region. Since the air mass from the north is always clean, the local rBC emissions may be the main contributors to the total rBC concentration in the northerly wind period. Thus, the MMD may be more influenced by local emissions and show a weak correlation with the wind speed during northerly wind periods.
2.7 Temporal variation in Dp∕Dc
The Dp∕Dc for a given single rBC-containing particle was calculated using the LEO fitting method. Herein, rBC cores with nm were selected because the low scattering signal of small rBC is easily influenced by signal noise (Dp∕Dc indicates the Dp∕Dc with nm in the following discussion if not specified). The Dp∕Dc variation during the investigation period is illustrated in Fig. 7. In general, Dp∕Dc was 1.20±0.05 on average during the investigation, which is consistent with observations (1.15) during the summer in Paris (Laborde et al., 2013). Black carbon sources and the aging process significantly influenced the Dp∕Dc of rBC. The rBC from traffic is reported to be relatively uncoated (Liu et al., 2014), whereas the rBC emitted by biomass burning is found to be moderately coated, with –1.40 (Pan et al., 2017). Moreover, Dp∕Dc increases with the aging process, and a larger Dp∕Dc (1.60) was found in an aged continental air mass (Shiraiwa et al., 2008). The relatively low Dp∕Dc value further supports the argument that rBC was primarily emitted from on-road vehicles during the summer in Beijing.
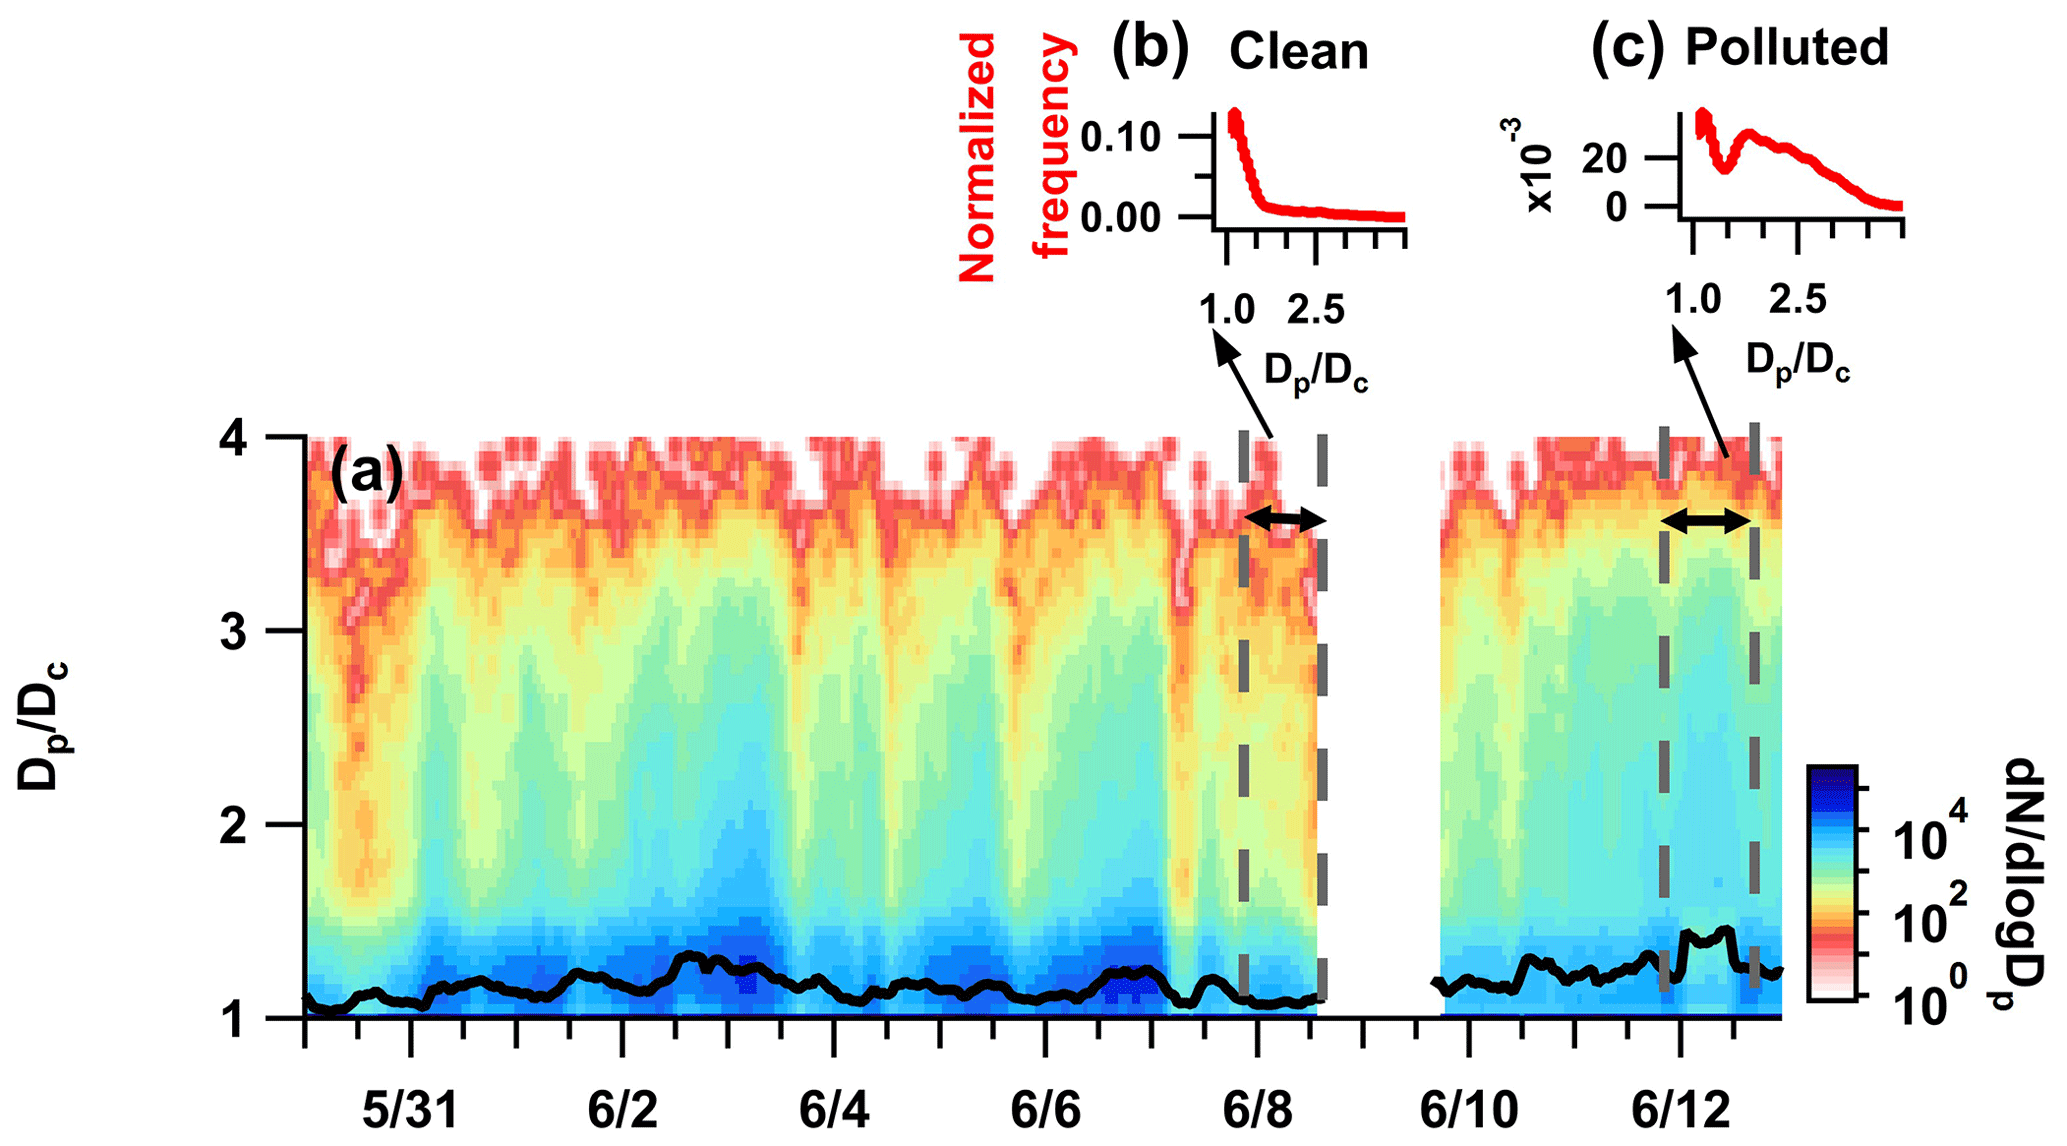
Figure 7(a) Temporal variation in Dp∕Dc, with Dc=180 nm; the image plot denotes the frequency (dN ∕ dlogDp) of rBC-containing particles with varied Dp∕Dc values. The black line denotes the average Dp∕Dc for each hour. (b) The normalized frequency of Dp∕Dc for the clean period before the tandem experiment. (c) The normalized frequency of Dp∕Dc for the polluted period.
The Dp∕Dc distributions for the two episodes before the tandem CPMA-SP2–DMA-SP2 experiments are shown in Fig. 7. Episode 1 (7 June at 22:00 LST–8 June at 12:00 LST) occurred after a heavy rain period and is representative of clean conditions. Episode 2 (11 June at 23:00 LST–12 June at 12:00 LST) was characterized by the highest average Dp∕Dc value (1.40) and the highest PM2.5 concentration value (120 µg m−3) during the observation period. The Dp∕Dc exhibited a unimodal distribution during episode 1 (Fig. 7b) and a clear bimodal pattern during episode 2 (Fig. 7c), which indicates that there may be one type of rBC in episode 1 and two types of rBC with a clear coating thickness difference in episode 2. The coating thickness of the first kind of rBC was relatively thin, with a Dp∕Dc value of ∼1.05, corresponding to the single peak of the unimodal distribution in episode 1 and the left peak of the unimodal distribution. This kind rBC may be freshly emitted by the local rBC sources (such as traffic) and underwent a short aging time. However, the second kind of rBC was thickly coated, with a Dp∕Dc value of ∼1.80, corresponding to the right peak of the bimodal distribution during episode 2. Zhang et al. (2018) demonstrated that 63 % of the rBC was estimated to be transported from outside of Beijing during previous pollution events, and the rBC-containing particles from regional transportation were characterized by having more coating material. The rBC-containing particles with in the right peak of the bimodal distribution may be the result of transportation from polluted regions.
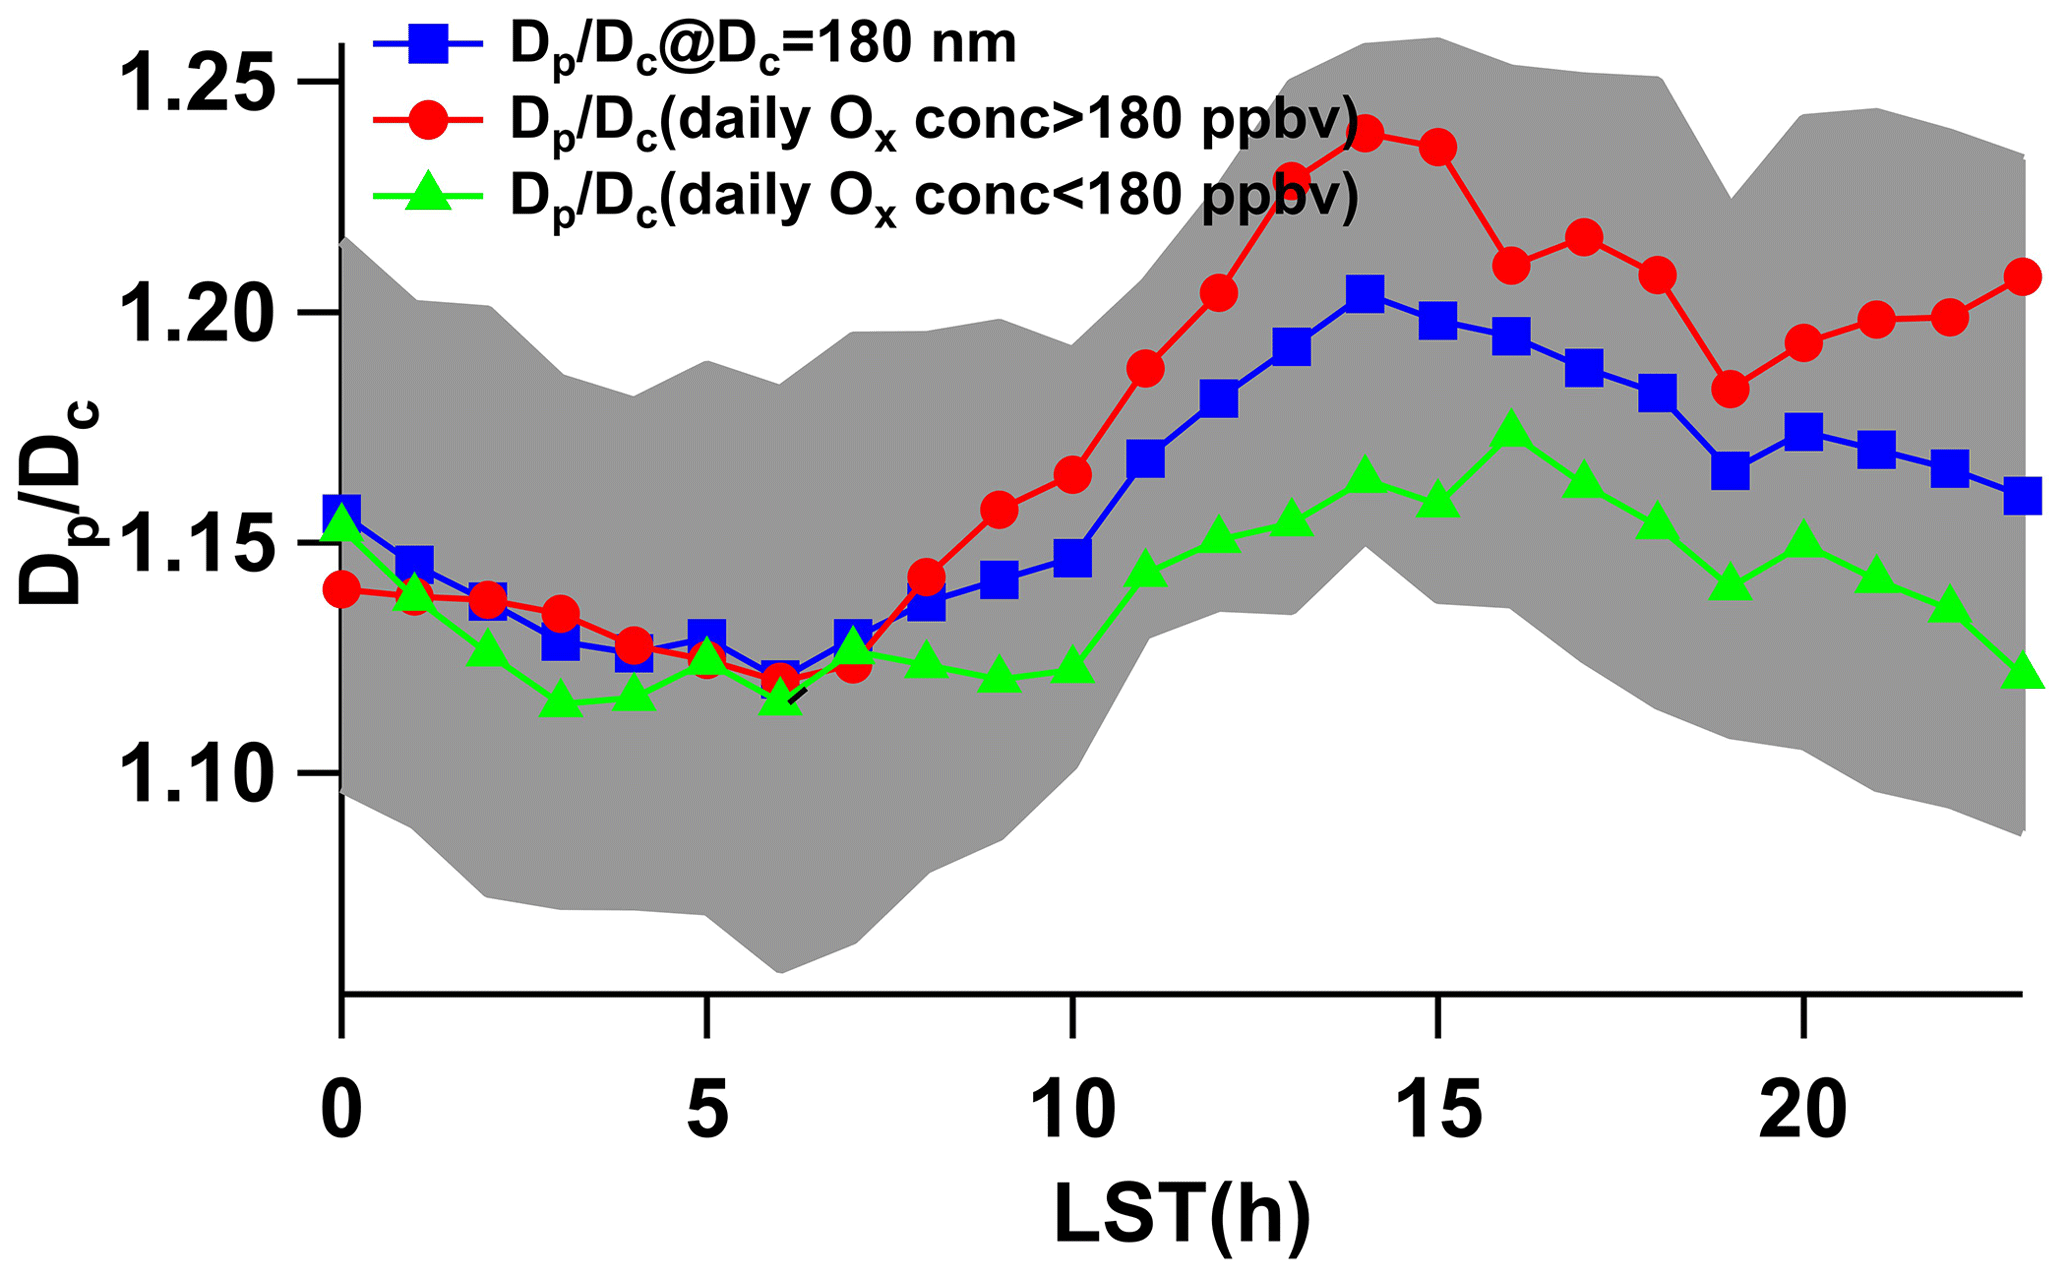
Figure 8Diurnal variation in Dp∕Dc for all periods, high-Ox periods and low-Ox periods. The gray shaded area denotes the standard deviation of Dp∕Dc for all periods.
2.8 Diurnal variation in Dp∕Dc
The temporal variation in Dp∕Dc exhibited a clear day-high and night-low pattern. Figure 8 exhibits the diurnal trend of Dp∕Dc. The mean Dp∕Dc increased during the daytime, with a peak (1.20) at 14:00 LST and a minimum (1.12) at 06:00 LST. Coating thickness (Dp∕Dc) was controlled by the competing effects of emissions and aging because freshly emitted thinly coated rBC tends to decrease Dp∕Dc and the aging process tends to increase Dp∕Dc. The increasing trend of Dp∕Dc during the day could be explained by the prevailing aging process, whereas the decreasing trend at night can be explained by the prevailing emissions process, as the photochemical condensation aging during the day was much faster than the coagulation aging at night (Riemer et al., 2004; Chen et al., 2017). The advection of aged rBC-containing particles from the upper boundary layer with the development of boundary layer during daytime may be another reason for the increase in Dp∕Dc. By measuring the Dp from 06:00 to 14:00 LST, the Dp growth rate was calculated to be 2.3 nm h−1. A larger Dp growth rate was found in the period with a high Ox concentration, which may be favorable for the formation of coating material on rBC. The photochemical process and condensation aging have proven to be very efficient during the day. Using a smog chamber, Peng et al. (2016) found that the Dp growth rate of rBC-containing particles could reach 26 nm h−1 in Beijing's urban area. Although the photochemical process and condensation may rapidly increase the Dp, the difference between the present study and the smog chamber results indicated that the “apparent” Dp growth rate in the ambient measurement was relatively low given the continuous freshly emitted rBC in urban Beijing. Thus, the Dp∕Dc was always at a low level, resulting in little light absorption enhancement during the summer.
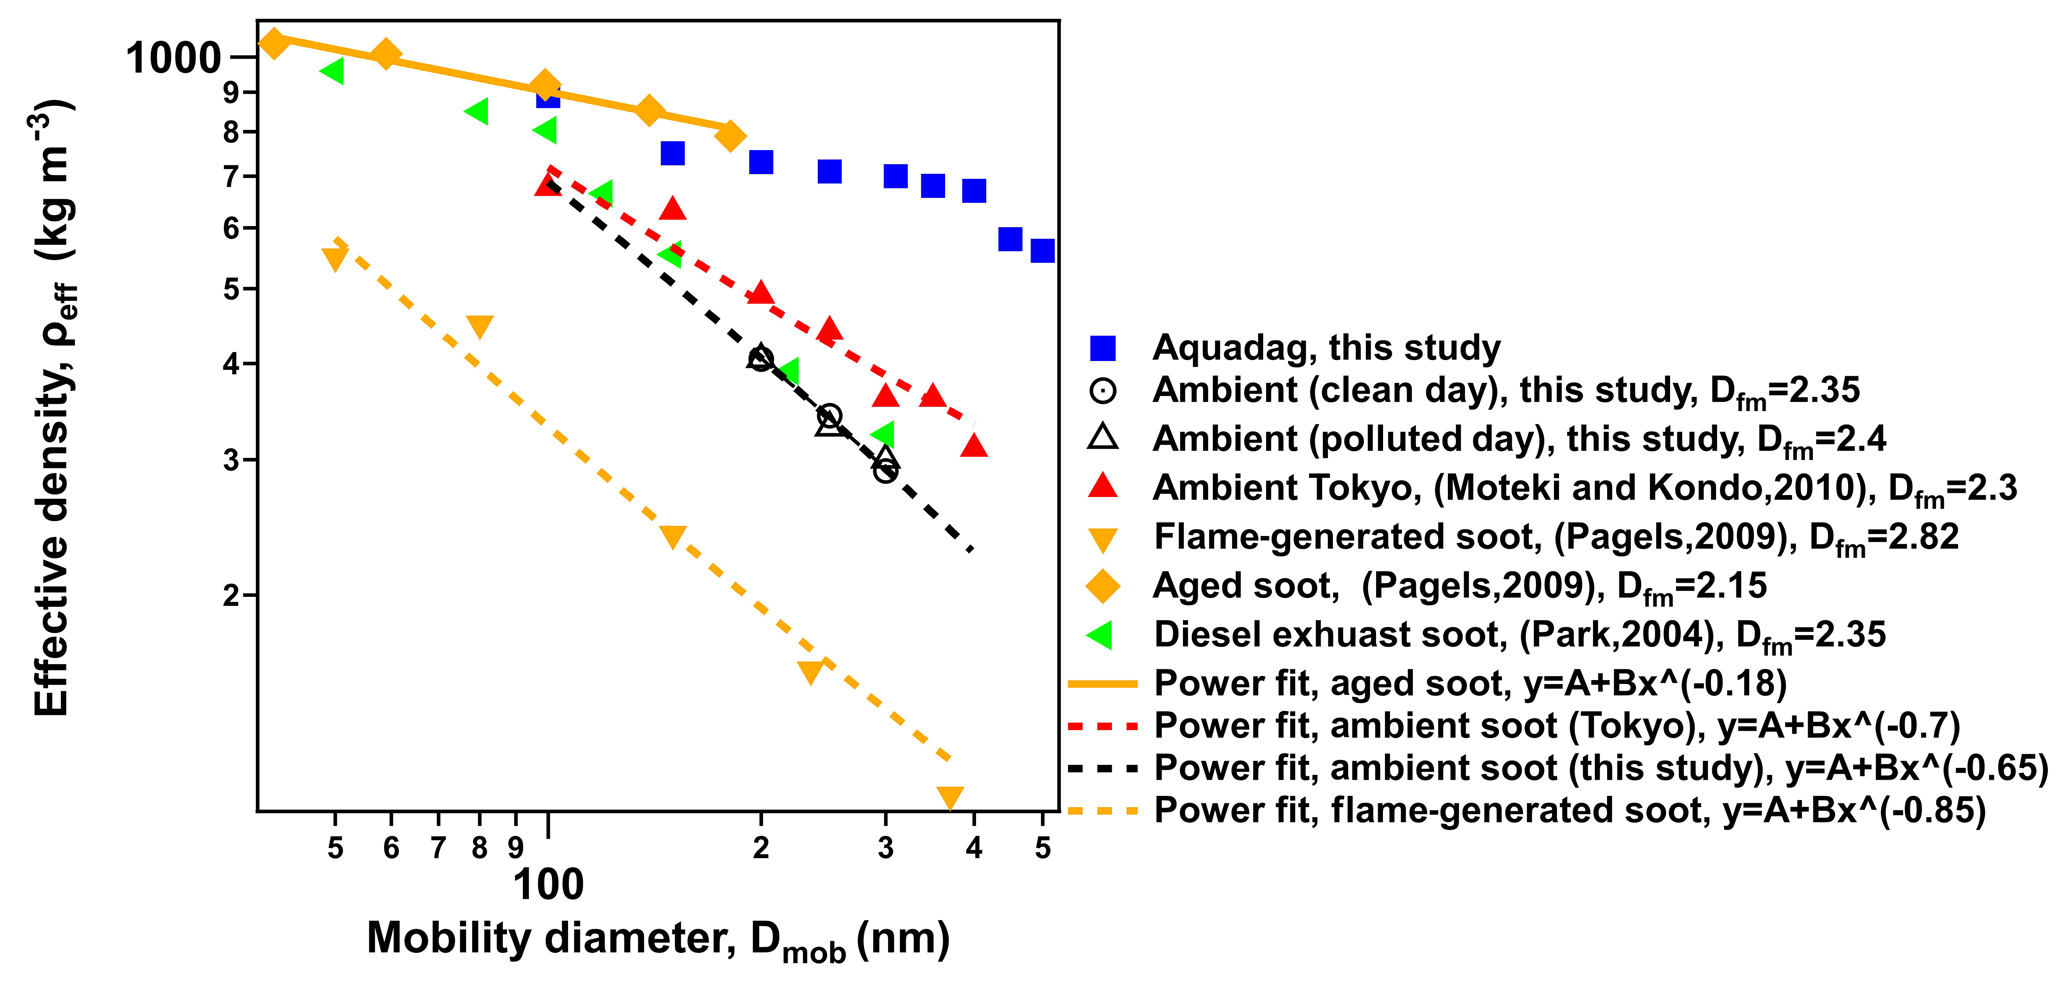
Figure 9Relationship between effective density and mobility diameter of rBC-containing particles. The black circle and triangle denote the fresh rBC-containing particles () measured on clean days and polluted days in this study. Other markers denote the data from previous research.
3.1 Morphological evolution of rBC-containing particles
3.1.1 Morphology of bare rBC
By coupling DMA and SP2, the mass and the mobility diameter of bare rBC () can be obtained simultaneously, and, therefore, the effective density (ρeff) can be calculated. The ρeff of the ambient bare rBC was measured on a clean day (8 June) and a polluted day (13 June). The ρeff of bare rBC at 200–300 nm ranged from 0.41 to 0.29 g cm−3, which was much smaller than the material density of rBC (1.8 g cm−3). This significant discrepancy indicates that bare rBC was in a fractal structure consistent with the previous research from electron microscopic images, which showed that bare rBC was in a fractal chain-like structure (Adachi and Buseck, 2013; Li et al., 2003; Wang et al., 2017). The effective densities showed no evident difference between the polluted day and the clean day because the bare rBC particles were freshly emitted and only affected by local sources. A power law is always used to describe the fractal-like aggregates of particles: (Moteki and Kondo, 2010; Park et al., 2004), where Dfm is defined as the mass fractal dimension that is an indicator of particle compactness. The value of Dfm is 3 for ideal spherical particles and less than 3 for fractal particles. Based on the equation for ρeff, the following relationship can be found: . Thus, a larger bare rBC had a smaller ρeff, which was consistent with the results in Fig. 9. A power function was used to fit the observed data. and were found separately on clean and polluted days, corresponding to the mass fractal dimensions of 2.35 and 2.40, respectively. These mass fractal dimensions from the summer in Beijing are similar to the observations (Dfm=2.30) from urban Tokyo (Moteki and Kondo, 2010) and the diesel exhaust measurement (Dfm=2.35) (Park et al., 2004), suggesting that the freshly emitted bare rBC particles originated primarily from traffic sources. Traffic may contribute a majority of the fresh rBC during both polluted and clean periods in the summer.
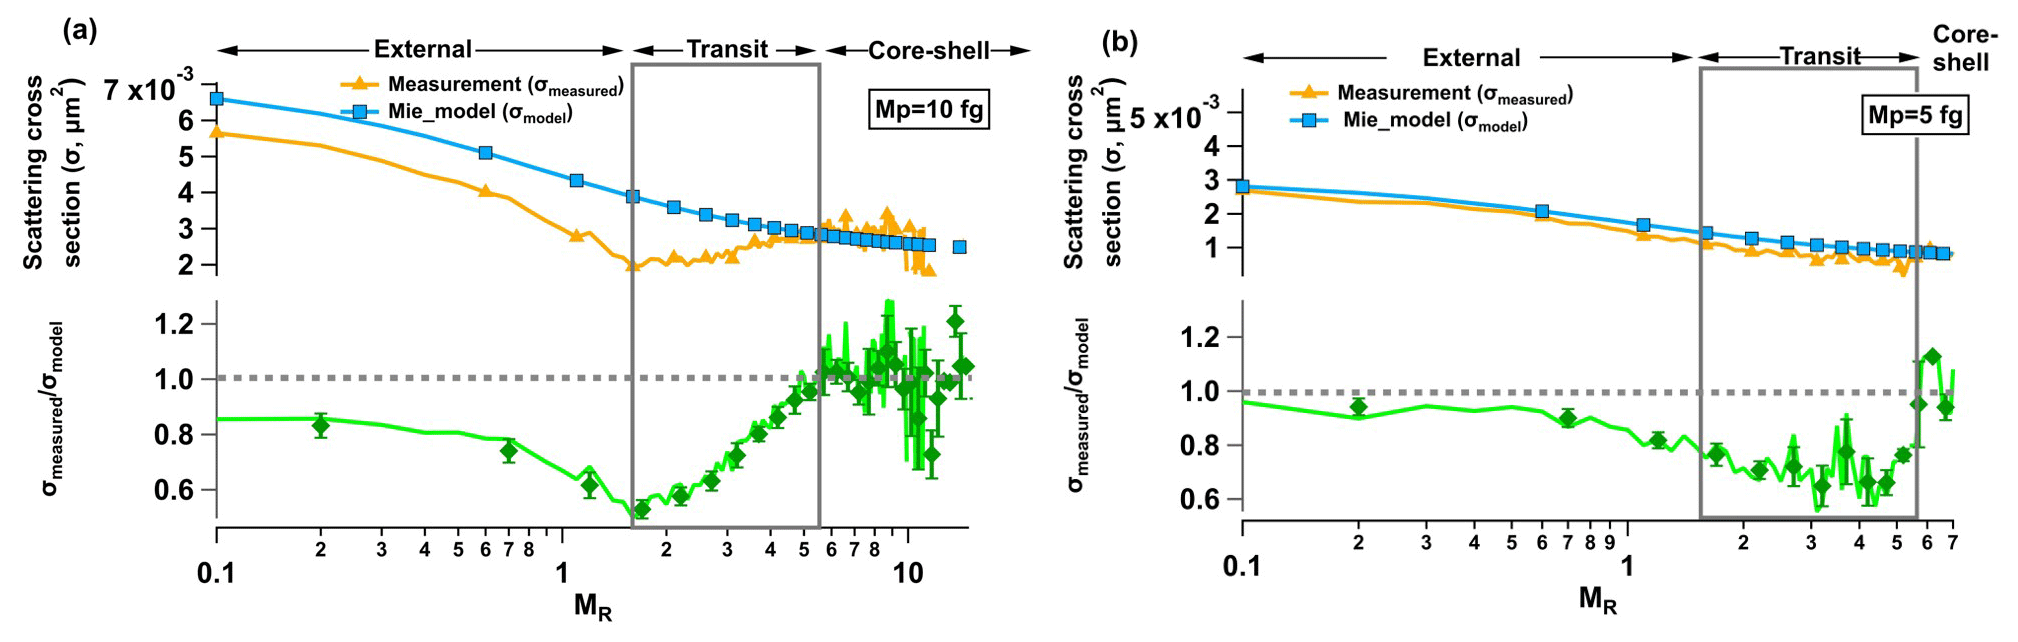
Figure 10(a) Scattering cross section of rBC-containing particles as measured by SP2 (yellow line) and calculated by Mie theory (blue line), assuming a core–shell structure. Bottom panel: the ratio (green line) between these two scattering cross sections at a CPMA set point of 10 fg as a function of MR (the mass ratio of nonrefractory matter to rBC). (b) The same as (a) but for a CPMA set point of 5 fg.
3.1.2 Morphology of rBC-containing particles with increasing coating thickness
The morphological characteristics of rBC-containing particles were investigated by comparing the σmeasured and σmodel using a CPMA-SP2 system first proposed by Liu et al. (2017). The comparison of σmeasured and σmodel as a function of MR for a particle mass of 10 fg is illustrated in Fig. 10a. If the ratio of σmeasured and σmodel equals 1, it implies that the scattering cross section measured by SP2 is the same as the model prediction under the assumption of a core–shell mixing structure; thus, the rBC-containing particle was likely a core–shell structure. When the rBC was bare (MR≈0), the rBC was in a fractal structure, as discussed in Sect. 4.1.1. With increasing MR, the σmeasured∕σmodel gradually decreased until MR=1.5, indicating that the coating material may not be sufficient to encapsulate rBC and that the rBC-containing particles tended not to be away from a core–shell structure. Liu et al. (2017) showed that rBC-containing particles with MR<1.5 primarily presented an external structure. When 1.5<MR<6, the σmeasured∕σmodel steadily increased, which implied that the shape of rBC-containing particles gradually transformed to become more compact, with a core–shell-like structure, in this stage. When MR>6, the σmeasured∕σmodel approached 1, indicating that the rBC-containing particles were in a core–shell-like structure in this stage. Similar phenomena were found in the relationship of σmeasured∕σmodel and MR for particle masses of 5 fg, as illustrated in Fig. 10b. However, when MR≈0.1, σmeasured was consistent with the model prediction for a particle mass of 5 fg. This is because the scattering signal was not sensitive to the irregularity of smaller-sized particles (Moteki et al., 2010). Therefore, a Mie theory-based core–shell model could capture the main morphological features.

Figure 11(a) The average MR (the mass ratio of nonrefractory matter to rBC) under different CPMA set points (1, 2, 5, 10 fg). (b) The fraction of different types of rBC-containing particles under different CPMA set points under varied pollution conditions.
Different techniques have been used to explore the morphology of rBC-containing particles in ambient and laboratory measurements (Zhang et al., 2008; Peng et al., 2016; Pagels et al., 2009). It is generally agreed that the morphology of rBC-containing particles will become more compact with the aging process or with increasing coating thickness. However, this study reveals that the morphology transform may only be true when the coating is thick enough (MR>1.5), and the coatings may only attach to rBC and slightly influence rBC-containing particles' morphology when the coating is not thick enough (MR<1.5).
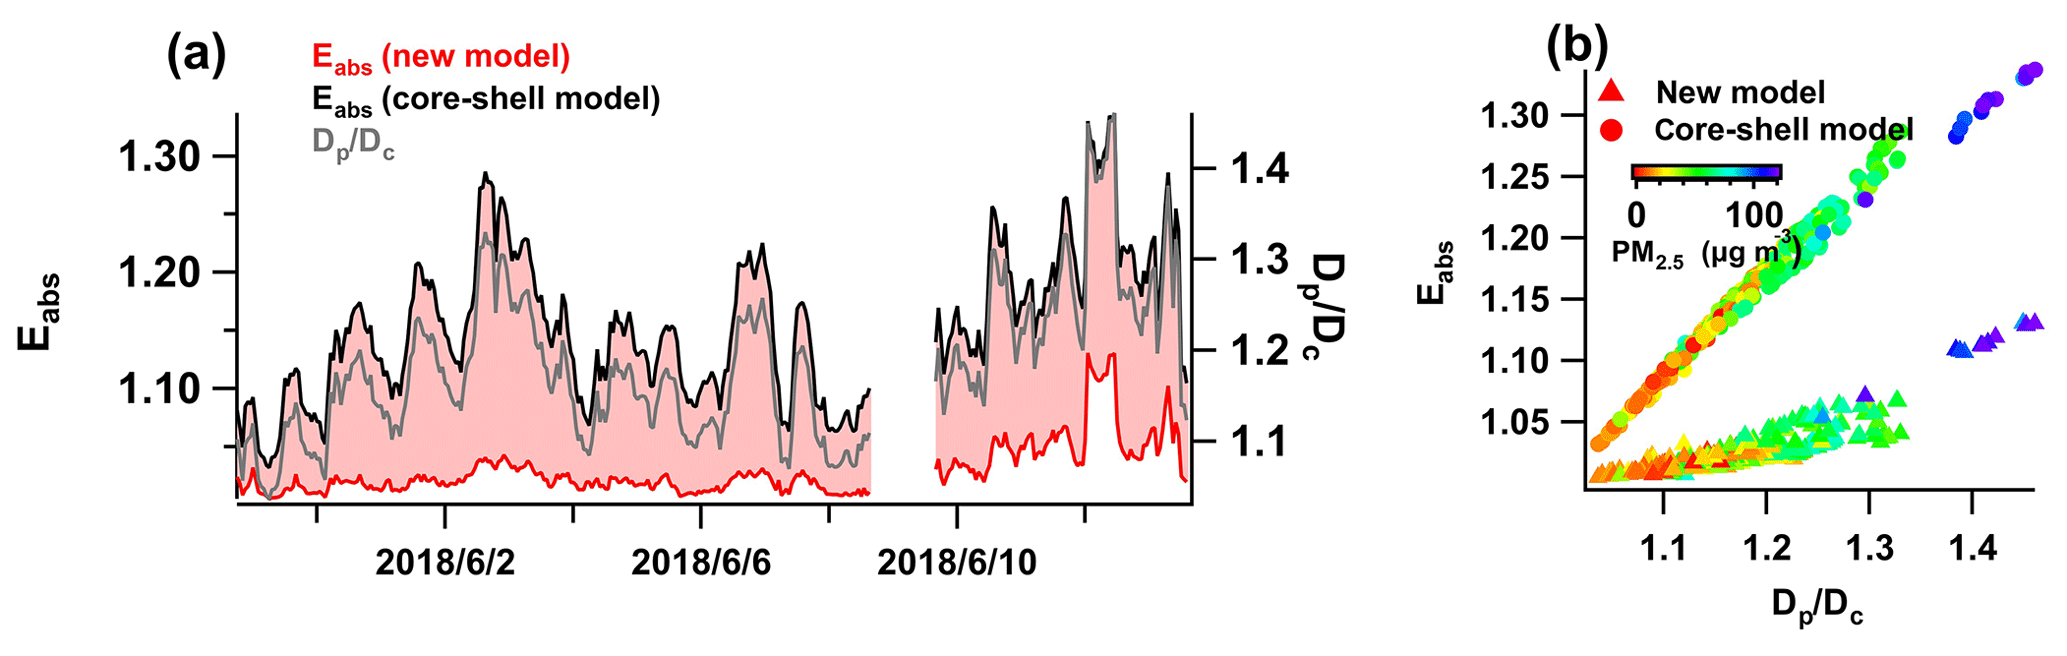
Figure 12(a) Time series of Dp∕Dc with nm and Eabs at 550 nm wavelength using the core–shell model and the morphology-dependent model. (b) Relationship between Eabs and Dp∕Dc. Circles denote the Eabs derived from the core–shell model, and triangles denote the Eabs derived from the morphology-dependent model.
Based on the relationship between the σmeasured∕σmodel and MR, the rBC-containing particles are classified into three groups: external stage (0<MR<1.5), transit stage (1.5<MR<6) and core–shell stage (MR>6). A similar variation between the σmeasured∕σmodel and MR was also found by Liu et al. (2017) and Wu et al. (2018). The MR transition point from the transit stage and core–shell stage determined by Liu et al. (2017) is slightly lower than that in this study. Liu et al. (2017) found that the MR transition point varied among different rBC sources. In addition to rBC sources, the environmental conditions during the aging process of rBC-containing particles, such as temperature and humidity, may also influence the rBC-containing particle morphology. We determined the MR transition point in Beijing in summer. More work needs to be done in the future to better quantify MR in different situations.
The combined CPMA and SP2 measurements were conducted separately on a clean day (8 June) and a polluted day (13 June). Figure 11a presents the average MR for different CPMA set points (1, 2, 5 and 10 fg) on 8 and 13 June. The average MR is 0.77 for Mp=1 fg and 5.29 for Mp=10 fg on the clean day, whereas the average MR is 0.84 for Mp=1 fg and 7.28 for Mp=10 fg on the polluted day. The average MR values of the polluted day were all larger than those on the clean day for the four Mp points. This result demonstrated that rBC had more coating material on the polluted day than on the clean day. Based on the MR transition points discussed above, the rBC-containing particles were classified into three stages, as shown in Fig. 11b. The rBC-containing particles with Mp=1 fg were primarily in the external mixing stage regardless of the pollution conditions. With an increase in Mp, more rBC-containing particles were in the transition or core–shell stage. On the clean day, 28 % of the rBC-containing particles were in the core–shell stage, when Mp=10 fg. However, on the polluted day, 45 % of the rBC-containing particles were in the core–shell stage, when Mp=10 fg. This phenomenon implied that most rBC-containing particles are not in an ideal core–shell structure on clean days, whereas more rBC-containing particles were in a core–shell structure with thicker coatings on the polluted day.
3.2 Implications of rBC-containing particle morphology for light absorption
The morphology of rBC-containing particles varied with MR. A simple core–shell model, as always used in the previous research to determine optical properties, will certainly cause bias. Based on the classification of the rBC-containing particles according to the relationship between σmeasured∕σmodel and MR, Liu et al. (2017) proposed a simple morphology-dependent scheme in which the rBC-containing particles at the external stage were considered to have no absorption enhancement (Eabs) and the rBC-containing particles at the core–shell stage were considered to have the same Eabs from the Mie theory under the assumption of a perfect core–shell structure. The Eabs at the transit stage was calculated by the interpolation of Eabs between the external and core–shell stages. A graphical and detailed description of the calculation of Eabs can be found in Fig. S6. Liu et al. (2017) proved that this morphology-dependent scheme is in good agreement with the measured Eabs. Thus, the Eabs at the 550 nm wavelength with nm was calculated separately using the core–shell model and the morphology-dependent scheme to quantify the uncertainty of using a core–shell model, as shown in Fig. 12. The absorption enhancement was 1.15, on average, using the core–shell model but was only 1.03 using the new scheme. The Eabs determined by the core–shell model was overestimated by 12 % because the observed averaged coating thickness () determined from single-SP2 measurements corresponded to MR=0.37, suggesting that the coating material was not sufficient and most of the rBC-containing particles were not in a core–shell structure in summer in Beijing. Thus, it is necessary to consider the morphology of rBC-containing particles when calculating their optical properties.
The mixing characteristics of rBC-containing particles were investigated in Beijing during the early summer of 2018 using a single-particle soot photometer (SP2). The rBC had an approximately lognormal distribution as a function of the mass equivalent diameter (Dc), characterized by a mass median diameter (MMD) of 171 nm, which is consistent with previous urban measurements. The mass size distribution was highly associated with the meteorological conditions. Heavy rain events caused the rBC mass size distribution to be smaller, indicating that wet scavenging may be a more efficient removal mechanism for larger rBC-containing particles. The mass size distribution of rBC shifted to larger sizes when southerly winds prevailed, which was primarily caused by the different rBC sources in the south.
The Dp∕Dc was 1.20 on average, with Dc=180 nm during the investigation period, indicating a low coating thickness of rBC during the summer. The coating thickness exhibited a clear diurnal pattern with a peak at 14:00 LST, increasing from 06:00 to 14:00 LST at a Dp growth rate of 2.3 nm h−1, with Dc=180 nm during the day. The growth rate was much higher in high-Ox periods. However, this growth rate was significantly lower than that in the smog chamber results, with a growth rate of 26 nm h−1 because the continuously emitted fresh rBC lowered the Dp∕Dc in ambient measurements. Although photochemical aging may be very efficient, with continuously emitted fresh rBC, the Dp∕Dc increase in the ambient air was very slow, indicating that the rBC-containing particles were primarily at a low Dp∕Dc level in summer.
A tandem measurement system with a differential mobility analyzer (DMA) and a centrifugal particle mass analyzer (CPMA) were coupled with an SP2 to investigate the detailed characteristics of rBC-containing particles in summer. The results showed that the effective density of bare rBC () was determined to be 0.41–0.30 g cm−3 for Dc=200–300 nm. These effective densities were significantly lower than the rBC material density (1.8 g cm−3), suggesting that the bare rBC was in a fractal structure. The corresponding mass fractal dimension (Dfm) was 2.35, which agrees well with the Dfm of the direct measurement from vehicles, and was unchanged regardless of pollution, indicating that traffic emissions are a major source of fresh bare rBC on both clean and polluted days during the summer in Beijing. With increasing coating thickness, the morphology of rBC changed from a fractal structure to a compact core–shell structure. When MR (Mcoat∕MrBC) <1.5, rBC-containing particles were in an external structure. When MR>6, rBC-containing particles were in a core–shell structure. When 1.5<MR<6, the rBC-containing particles were in a transition stage.
Based on the core–shell model and Mie theory, a new morphology-dependent absorption enhancement (Eabs) scheme was proposed and applied to the ambient measurements. A simulation showed that the Eabs averaged to 1.03 with Dc=180 nm at a wavelength of 550 nm in the summer. The core–shell model overestimated the Eabs by 12 %.
To request the data given in this study, please contact Xiaole Pan at the Institute of Atmospheric Physics, Chinese Academy of Sciences, via email (panxiaole@mail.iap.ac.cn).
The supplement related to this article is available online at: https://doi.org/10.5194/acp-20-5771-2020-supplement.
HL and XP designed the research. HL, XP, XL, YT, YS, PF and ZW performed the experiments. HL, XP, DL and XC performed the data analysis. HL and XP wrote the paper.
The authors declare that they have no conflict of interest.
This research has been supported by the National Natural Science Foundation of China (grant nos. 41877314, 41675128).
This paper was edited by Thomas Karl and reviewed by three anonymous referees.
Adachi, K. and Buseck, P. R.: Changes of ns-soot mixing states and shapes in an urban area during CalNex, J. Geophys. Res.-Atmos., 118, 3723–3730, https://doi.org/10.1002/jgrd.50321, 2013.
Adler, G., Riziq, A. A., Erlick, C., and Rudich, Y.: Effect of intrinsic organic carbon on the optical properties of fresh diesel soot, P. Natl. Acad. Sci. USA, 107, 6699–6704, https://doi.org/10.1073/pnas.0903311106, 2010.
Apte, J. S., Marshall, J. D., Cohen, A. J., and Brauer, M.: Addressing Global Mortality from Ambient PM2.5, Environ. Sci. Technol., 49, 8057–8066, https://doi.org/10.1021/acs.est.5b01236, 2015.
Bond, T. C., Doherty, S. J., Fahey, D., Forster, P., Berntsen, T., DeAngelo, B., Flanner, M., Ghan, S., Kärcher, B., and Koch, D.: Bounding the role of black carbon in the climate system: A scientific assessment, J. Geophys. Res.-Atmos., 118, 5380–5552, 2013.
Cao, J. J., Lee, S. C., Ho, K. F., Zou, S. C., Fung, K., Li, Y., Watson, J. G., and Chow, J. C.: Spatial and seasonal variations of atmospheric organic carbon and elemental carbon in Pearl River Delta Region, China, Atmos. Environ., 38, 4447–4456, https://doi.org/10.1016/j.atmosenv.2004.05.016, 2004.
Cao, J. J., Lee, S. C., Chow, J. C., Watson, J. G., Ho, K. F., Zhang, R. J., Jin, Z. D., Shen, Z. X., Chen, G. C., Kang, Y. M., Zou, S. C., Zhang, L. Z., Qi, S. H., Dai, M. H., Cheng, Y., and Hu, K.: Spatial and seasonal distributions of carbonaceous aerosols over China, J. Geophys. Res.-Atmos., 112, D22s11, https://doi.org/10.1029/2006jd008205, 2007.
Cappa, C. D., Onasch, T. B., Massoli, P., Worsnop, D. R., Bates, T. S., Cross, E. S., Davidovits, P., Hakala, J., Hayden, K. L., Jobson, B. T., Kolesar, K. R., Lack, D. A., Lerner, B. M., Li, S. M., Mellon, D., Nuaaman, I., Olfert, J. S., Petaja, T., Quinn, P. K., Song, C., Subramanian, R., Williams, E. J., and Zaveri, R. A.: Radiative Absorption Enhancements Due to the Mixing State of Atmospheric Black Carbon, Science, 337, 1078–1081, https://doi.org/10.1126/science.1223447, 2012.
Chen, X. S., Wang, Z. F., Yu, F. Q., Pan, X. L., Li, J., Ge, B. Z., Wang, Z., Hu, M., Yang, W. Y., and Chen, H. S.: Estimation of atmospheric aging time of black carbon particles in the polluted atmosphere over central-eastern China using microphysical process analysis in regional chemical transport model, Atmos. Environ., 163, 44–56, https://doi.org/10.1016/j.atmosenv.2017.05.016, 2017.
Cheng, Y. F., Su, H., Rose, D., Gunthe, S. S., Berghof, M., Wehner, B., Achtert, P., Nowak, A., Takegawa, N., Kondo, Y., Shiraiwa, M., Gong, Y. G., Shao, M., Hu, M., Zhu, T., Zhang, Y. H., Carmichael, G. R., Wiedensohler, A., Andreae, M. O., and Poschl, U.: Size-resolved measurement of the mixing state of soot in the megacity Beijing, China: diurnal cycle, aging and parameterization, Atmos. Chem. Phys., 12, 4477–4491, https://doi.org/10.5194/acp-12-4477-2012, 2012.
Ding, A. J., Huang, X., Nie, W., Sun, J. N., Kerminen, V. M., Petaja, T., Su, H., Cheng, Y. F., Yang, X. Q., Wang, M. H., Chi, X. G., Wang, J. P., Virkkula, A., Guo, W. D., Yuan, J., Wang, S. Y., Zhang, R. J., Wu, Y. F., Song, Y., Zhu, T., Zilitinkevich, S., Kulmala, M., and Fu, C. B.: Enhanced haze pollution by black carbon in megacities in China, Geophys. Res. Lett., 43, 2873–2879, https://doi.org/10.1002/2016gl067745, 2016.
Gao, R. S., Schwarz, J. P., Kelly, K. K., Fahey, D. W., Watts, L. A., Thompson, T. L., Spackman, J. R., Slowik, J. G., Cross, E. S., Han, J. H., Davidovits, P., Onasch, T. B., and Worsnop, D. R.: A novel method for estimating light-scattering properties of soot aerosols using a modified single-particle soot photometer, Aerosol Sci. Technol., 41, 125–135, https://doi.org/10.1080/02786820601118398, 2007.
Gong, X. D., Zhang, C., Chen, H., Nizkorodov, S. A., Chen, J. M., and Yang, X.: Size distribution and mixing state of black carbon particles during a heavy air pollution episode in Shanghai, Atmos. Chem. Phys., 16, 5399–5411, https://doi.org/10.5194/acp-16-5399-2016, 2016.
Gysel, M., Laborde, M., Olfert, J. S., Subramanian, R., and Grohn, A. J.: Effective density of Aquadag and fullerene soot black carbon reference materials used for SP2 calibration, Atmos. Meas. Tech., 4, 2851–2858, https://doi.org/10.5194/amt-4-2851-2011, 2011.
Huang, X. F., Sun, T. L., Zeng, L. W., Yu, G. H., and Luan, S. J.: Black carbon aerosol characterization in a coastal city in South China using a single particle soot photometer, Atmos. Environ., 51, 21–28, https://doi.org/10.1016/j.atmosenv.2012.01.056, 2012.
Jacobson, M. Z.: Strong radiative heating due to the mixing state of black carbon in atmospheric aerosols, Nature, 409, 695–697, https://doi.org/10.1038/35055518, 2001.
Laborde, M., Mertes, P., Zieger, P., Dommen, J., Baltensperger, U., and Gysel, M.: Sensitivity of the Single Particle Soot Photometer to different black carbon types, Atmos. Meas. Tech., 5, 1031–1043, https://doi.org/10.5194/amt-5-1031-2012, 2012.
Laborde, M., Crippa, M., Tritscher, T., Juranyi, Z., Decarlo, P. F., Temime-Roussel, B., Marchand, N., Eckhardt, S., Stohl, A., Baltensperger, U., Prevot, A. S. H., Weingartner, E., and Gysel, M.: Black carbon physical properties and mixing state in the European megacity Paris, Atmos. Chem. Phys., 13, 5831–5856, https://doi.org/10.5194/acp-13-5831-2013, 2013.
Lack, D. A., Langridge, J. M., Bahreini, R., Cappa, C. D., Middlebrook, A. M., and Schwarz, J. P.: Brown carbon and internal mixing in biomass burning particles, P. Natl. Acad. Sci. USA, 109, 14802–14807, https://doi.org/10.1073/pnas.1206575109, 2012.
Lan, Z. J., Huang, X. F., Yu, K. Y., Sun, T. L., Zeng, L. W., and Hu, M.: Light absorption of black carbon aerosol and its enhancement by mixing state in an urban atmosphere in South China, Atmos. Environ., 69, 118–123, https://doi.org/10.1016/j.atmosenv.2012.12.009, 2013.
Li, J., Posfai, M., Hobbs, P. V., and Buseck, P. R.: Individual aerosol particles from biomass burning in southern Africa: 2. Compositions and aging of inorganic particles, J. Geophys. Res.-Atmos., 108, 12, https://doi.org/10.1029/2002jd002310, 2003.
Liu, D., Allan, J., Whitehead, J., Young, D., Flynn, M., Coe, H., McFiggans, G., Fleming, Z. L., and Bandy, B.: Ambient black carbon particle hygroscopic properties controlled by mixing state and composition, Atmos. Chem. Phys., 13, 2015–2029, https://doi.org/10.5194/acp-13-2015-2013, 2013.
Liu, D., Allan, J. D., Young, D. E., Coe, H., Beddows, D., Fleming, Z. L., Flynn, M. J., Gallagher, M. W., Harrison, R. M., Lee, J., Prevot, A. S. H., Taylor, J. W., Yin, J., Williams, P. I., and Zotter, P.: Size distribution, mixing state and source apportionment of black carbon aerosol in London during wintertime, Atmos. Chem. Phys., 14, 10061–10084, https://doi.org/10.5194/acp-14-10061-2014, 2014.
Liu, D. T., Taylor, J. W., Young, D. E., Flynn, M. J., Coe, H., and Allan, J. D.: The effect of complex black carbon microphysics on the determination of the optical properties of brown carbon, Geophys. Res. Lett., 42, 613–619, https://doi.org/10.1002/2014gl062443, 2015.
Liu, D. T., Whitehead, J., Alfarra, M. R., Reyes-Villegas, E., Spracklen, D. V., Reddington, C. L., Kong, S. F., Williams, P. I., Ting, Y. C., Haslett, S., Taylor, J. W., Flynn, M. J., Morgan, W. T., McFiggans, G., Coe, H., and Allan, J. D.: Black-carbon absorption enhancement in the atmosphere determined by particle mixing state, Nat. Geosci., 10, 184–U132, https://doi.org/10.1038/Ngeo2901, 2017.
Menon, S., Hansen, J., Nazarenko, L., and Luo, Y.: Climate effects of black carbon aerosols in China and India, Science, 297, 2250–2253, 2002.
Moteki, N. and Kondo, Y.: Dependence of Laser-Induced Incandescence on Physical Properties of Black Carbon Aerosols: Measurements and Theoretical Interpretation, Aerosol Sci. Technol., 44, 663–675, https://doi.org/10.1080/02786826.2010.484450, 2010.
Moteki, N., Kondo, Y., and Nakamura, S.: Method to measure refractive indices of small nonspherical particles: Application to black carbon particles, J. Aerosol. Sci., 41, 513–521, https://doi.org/10.1016/j.jaerosci.2010.02.013, 2010.
Pagels, J., Khalizov, A. F., McMurry, P. H., and Zhang, R. Y.: Processing of Soot by Controlled Sulphuric Acid and Water CondensationMass and Mobility Relationship, Aerosol Sci. Technol., 43, 629–640, https://doi.org/10.1080/02786820902810685, 2009.
Pan, X. L., Kanaya, Y., Taketani, F., Miyakawa, T., Inomata, S., Komazaki, Y., Tanimoto, H., Wang, Z., Uno, I., and Wang, Z. F.: Emission characteristics of refractory black carbon aerosols from fresh biomass burning: a perspective from laboratory experiments, Atmos. Chem. Phys., 17, 13001–13016, https://doi.org/10.5194/acp-17-13001-2017, 2017.
Park, K., Kittelson, D. B., and McMurry, P. H.: Structural properties of diesel exhaust particles measured by transmission electron microscopy (TEM): Relationships to particle mass and mobility, Aerosol Sci. Technol., 38, 881–889, https://doi.org/10.1080/027868290505189, 2004.
Peng, J. F., Hu, M., Guo, S., Du, Z. F., Zheng, J., Shang, D. J., Zamora, M. L., Zeng, L. M., Shao, M., Wu, Y. S., Zheng, J., Wang, Y., Glen, C. R., Collins, D. R., Molina, M. J., and Zhang, R. Y.: Markedly enhanced absorption and direct radiative forcing of black carbon under polluted urban environments, P. Natl. Acad. Sci. USA, 113, 4266–4271, https://doi.org/10.1073/pnas.1602310113, 2016.
Popovicheva, O. B., Persiantseva, N. M., Kireeva, E. D., Khokhlova, T. D., and Shonija, N. K.: Quantification of the Hygroscopic Effect of Soot Aging in the Atmosphere: Laboratory Simulations, J. Phys. Chem. A, 115, 298–306, https://doi.org/10.1021/jp109238x, 2011.
Qin, Y. and Xie, S. D.: Spatial and temporal variation of anthropogenic black carbon emissions in China for the period 1980–2009, Atmos. Chem. Phys., 12, 4825–4841, https://doi.org/10.5194/acp-12-4825-2012, 2012.
Ramanathan, V. and Carmichael, G.: Global and regional climate changes due to black carbon, Nat. Geosci., 36, 335–358, 2008.
Ramanathan, V., Crutzen, P. J., Kiehl, J. T., and Rosenfeld, D.: Atmosphere – Aerosols, climate, and the hydrological cycle, Science, 294, 2119–2124, https://doi.org/10.1126/science.1064034, 2001.
Riemer, N., Vogel, H., and Vogel, B.: Soot aging time scales in polluted regions during day and night, Atmos. Chem. Phys., 4, 1885–1893, https://doi.org/10.5194/acp-4-1885-2004, 2004.
Schnaiter, M., Linke, C., Möhler, O., Naumann, K. H., Saathoff, H., Wagner, R., Schurath, U., and Wehner, B.: Absorption amplification of black carbon internally mixed with secondary organic aerosol, J. Geophys. Res.-Atmos., 110, 11, https://doi.org/10.1029/2005jd006046, 2005.
Schwarz, J. P., Gao, R. S., Spackman, J. R., Watts, L. A., Thomson, D. S., Fahey, D. W., Ryerson, T. B., Peischl, J., Holloway, J. S., Trainer, M., Frost, G. J., Baynard, T., Lack, D. A., de Gouw, J. A., Warneke, C., and Del Negro, L. A.: Measurement of the mixing state, mass, and optical size of individual black carbon particles in urban and biomass burning emissions, Geophys. Res. Lett., 35, L13810, https://doi.org/10.1029/2008gl033968, 2008.
Shiraiwa, M., Kondo, Y., Moteki, N., Takegawa, N., Sahu, L., Takami, A., Hatakeyama, S., Yonemura, S., and Blake, D.: Radiative impact of mixing state of black carbon aerosol in Asian outflow, J. Geophys. Res.-Atmos., 113, 13, https://doi.org/10.1029/2008jd010546, 2008.
Shiraiwa, M., Kondo, Y., Iwamoto, T., and Kita, K.: Amplification of Light Absorption of Black Carbon by Organic Coating, Aerosol Sci. Technol., 44, 46–54, https://doi.org/10.1080/02786820903357686, 2010.
Taylor, J. W., Allan, J. D., Allen, G., Coe, H., Williams, P. I., Flynn, M. J., Le Breton, M., Muller, J. B. A., Percival, C. J., Oram, D., Forster, G., Lee, J. D., Rickard, A. R., Parrington, M., and Palmer, P. I.: Size-dependent wet removal of black carbon in Canadian biomass burning plumes, Atmos. Chem. Phys., 14, 13755–13771, https://doi.org/10.5194/acp-14-13755-2014, 2014.
Taylor, J. W., Allan, J. D., Liu, D., Flynn, M., Weber, R., Zhang, X., Lefer, B. L., Grossberg, N., Flynn, J., and Coe, H.: Assessment of the sensitivity of core/shell parameters derived using the single-particle soot photometer to density and refractive index, Atmos. Meas. Tech., 8, 1701–1718, https://doi.org/10.5194/amt-8-1701-2015, 2015.
Wang, Q. Y., Huang, R. J., Zhao, Z. Z., Cao, J. J., Ni, H. Y., Tie, X. X., Zhao, S. Y., Su, X. L., Han, Y. M., Shen, Z. X., Wang, Y. C., Zhang, N. N., Zhou, Y. Q., and Corbin, J. C.: Physicochemical characteristics of black carbon aerosol and its radiative impact in a polluted urban area of China, J. Geophys. Res.-Atmos., 121, 12505–12519, https://doi.org/10.1002/2016jd024748, 2016.
Wang, Q. Y., Cao, J. J., Han, Y. M., Tian, J., Zhu, C. S., Zhang, Y. G., Zhang, N. N., Shen, Z. X., Ni, H. Y., Zhao, S. Y., and Wu, J. R.: Sources and physicochemical characteristics of black carbon aerosol from the southeastern Tibetan Plateau: internal mixing enhances light absorption, Atmos. Chem. Phys., 18, 4639–4656, https://doi.org/10.5194/acp-18-4639-2018, 2018.
Wang, Y. Y., Liu, F. S., He, C. L., Bi, L., Cheng, T. H., Wang, Z. L., Zhang, H., Zhang, X. Y., Shi, Z. B., and Li, W. J.: Fractal Dimensions and Mixing Structures of Soot Particles during Atmospheric Processing, Environ. Sci. Tech. Let., 4, 487–493, https://doi.org/10.1021/acs.estlett.7b00418, 2017.
Wu, Y., Cheng, T. H., Liu, D. T., Allan, J. D., Zheng, L. J., and Chen, H.: Light Absorption Enhancement of Black Carbon Aerosol Constrained by Particle Morphology, Environ. Sci. Technol., 52, 6912–6919, https://doi.org/10.1021/acs.est.8b00636, 2018.
Wu, Y. F., Wang, X. J., Tao, J., Huang, R. J., Tian, P., Cao, J. J., Zhang, L. M., Ho, K. F., Han, Z. W., and Zhang, R. J.: Size distribution and source of black carbon aerosol in urban Beijing during winter haze episodes, Atmos. Chem. Phys., 17, 7965–7975, https://doi.org/10.5194/acp-17-7965-2017, 2017.
Zhang, R., Jing, J., Tao, J., Hsu, S. C., Wang, G., Cao, J., Lee, C. S. L., Zhu, L., Chen, Z., Zhao, Y., and Shen, Z.: Chemical characterization and source apportionment of PM2.5 in Beijing: seasonal perspective, Atmos. Chem. Phys., 13, 7053–7074, https://doi.org/10.5194/acp-13-7053-2013, 2013.
Zhang, R. J., Ho, K. F., Cao, J. J., Han, Z. W., Zhang, M. G., Cheng, Y., and Lee, S. C.: Organic carbon and elemental carbon associated with PM10 in Beijing during spring time, J. Hazard. Mater., 172, 970–977, https://doi.org/10.1016/j.jhazmat.2009.07.087, 2009.
Zhang, R. Y., Khalizov, A. F., Pagels, J., Zhang, D., Xue, H. X., and McMurry, P. H.: Variability in morphology, hygroscopicity, and optical properties of soot aerosols during atmospheric processing, P. Natl. Acad. Sci. USA, 105, 10291–10296, https://doi.org/10.1073/pnas.0804860105, 2008.
Zhang, Y. X., Zhang, Q., Cheng, Y. F., Su, H., Li, H. Y., Li, M., Zhang, X., Ding, A. J., and He, K. B.: Amplification of light absorption of black carbon associated with air pollution, Atmos. Chem. Phys., 18, 9879–9896, https://doi.org/10.5194/acp-18-9879-2018, 2018.