the Creative Commons Attribution 4.0 License.
the Creative Commons Attribution 4.0 License.
 | 14 May 2020
Measurements and modeling of airborne plutonium in Subarctic Finland between 1965 and 2011
Susanna Salminen-Paatero
Julius Vira
Jussi Paatero
The activity concentrations of and 241Am (for determining its mother nuclide, 241Pu) as well as activity ratios of , and and the mass ratio of 240Pu∕239Pu were determined from air filter samples collected in Rovaniemi (Finnish Lapland) in 1965 to 2011. The origin of plutonium in surface air was assessed based on these data from long time series. The most important Pu sources in the surface air of Rovaniemi were atmospheric nuclear-weapon testing in the 1950s and 1960s, later nuclear tests in 1973–1980 and the SNAP-9A satellite accident in 1964, whereas the influence from the 1986 Chernobyl accident was only minor. Contrary to the alpha-emitting Pu isotopes, 241Pu from the Fukushima accident in 2011 was detected in Rovaniemi. Dispersion modeling results with the SILAM (System for Integrated modeLling of Atmospheric composition) model indicate that Pu contamination in northern Finland due to hypothetical reactor accidents would be negligible in the case of a floating reactor in the Shtokman natural gas field and relatively low in the case of an intended nuclear power plant in western Finland.
- Article
(2492 KB) - Full-text XML
- BibTeX
- EndNote


The distribution of anthropogenic radionuclides in global fallout from nuclear-weapon testing is uneven, and even more inhomogeneous is their distribution in regional and local fallout from different sources. It is known that Subarctic and Arctic regions have received radionuclide deposition with radioactivity levels and composition different to the more temperate areas of the Earth. Subarctic and Arctic ecosystems have a special combination of harsh climate; often sparse vegetation; lack of nutrients; and, in the case of humans, dependence on traditional livelihoods and lifestyles like hunting, fishing, reindeer herding, and gathering mushrooms and berries. Consequently, these Nordic ecosystems are highly vulnerable to toxic agents, including radionuclides. Still, there are only a few contiguous long-term radioactivity data series from Subarctic and Arctic areas where the changes in concentration levels and isotope ratios can be followed and nuclear events can be identified as contamination sources in a particular environment.
In total, the radionuclides of 137Cs and 90Sr and total beta activity of and 241Am were determined from the air filter samples that were collected in Rovaniemi (Finnish Lapland) in 1965–2011. 241Am (t1∕2 – half-life – of 432.2 years) was analyzed for calculating the activity concentration of its mother nuclide, the relatively short-lived beta emitter 241Pu (t1∕2 of 14.35 years). The major part of 241Am in the samples originates from the decay of 241Pu after the sampling, and only a minor part of 241Am originates directly from nuclear events. The results for 137Cs, 90Sr and total beta activity have been reported elsewhere (Salminen-Paatero et al., 2019). The activity ratio of and the mass ratio of 240Pu∕239Pu in Rovaniemi have been presented pictorially with other global ratio values in an article by Thakur et al. (2017), which did not, however, discuss the ratio values of Rovaniemi in detail.
In this study, radionuclide concentration and isotope ratio data from 1965 to 2011 have been used for estimating nuclear contamination sources in the surface air of the Finnish Subarctic over almost 5 decades. Few long time series of atmospheric radioactivity exist in Subarctic and Arctic regions, especially of Pu isotopes, and even fewer data have been published about atmospheric transuranium concentrations in these high northern latitudes after the Chernobyl and Fukushima accidents. Furthermore, the atmospheric dispersion of one real and one hypothetical nuclear event has been modeled for establishing the potential transport of Pu isotopes and effect of these nuclear events on atmospheric radioactivity levels in Finnish Lapland. Atmospheric-dispersion modeling completed the experimental data by providing risk estimates and reference values for future accidental releases of nuclear material in and close to Arctic regions, as well as indicating the importance of the accurate source term in calculating the amount of radioactivity released into the atmosphere after Fukushima.
2.1 Sampling and procedures for the air filters before any chemical treatment
The air filter samples were collected at the Finnish Meteorological Institute's (FMI) Rovaniemi monitoring station at 66∘34′ N, 25∘50′ E with an elevation of 198 m above sea level (a.s.l.). The weekly volume of sampled air was ∼1000 m3. First, total beta activity was measured from the filters 5 d after the end of sampling. Then the filters were combined into suitable sets for the gamma measurement and determination of 137Cs concentration. The details of air sampling, combining air filters and measurements for the gamma activity of 137Cs, and total beta activity have been given by Salminen-Paatero et al. (2019).
2.2 Radiochemical separation of Pu, Am and Sr from air filters
A detailed description of the radioanalytical separation procedure and the radionuclide measurements is given elsewhere (Salminen-Paatero and Paatero, 2020). , 241Am and 90Sr were separated from dissolved air filter sample sets containing filters from 3 months to 5 years. The separation method included extraction chromatography and anion exchange steps, and it was modified from the original method designed for the air filters with a 1–3 d sampling time presented in Salminen and Paatero (2009). The radiochemical separations were performed in 2013–2014, i.e., 2–3 years after the last air filter sample set of 2011 was taken.
2.3 Measurement of , 241Am, 90Sr and 240Pu∕239Pu in the air filter samples
The activity concentration of alpha-emitting Pu isotopes 238Pu and 239+240Pu in the air filter samples was determined from the separated Pu fractions by the Alpha Analyst spectrometer (Canberra). From the separated Am fractions the activity concentration of 241Am was also measured by alpha spectrometry to calculate the activity concentration of its mother nuclide, beta emitter 241Pu, in each air filter sample set from 1965–2011 for the time of sampling. The alpha measurements were performed soon after the radiochemical separations in 2013–2014.
The activity concentration of 90Sr was measured by a Quantulus 1220 liquid scintillation counter (LSC) via the activity concentration of the daughter nuclide 90Y. Finally, after an additional purification step of the Pu alpha-counting samples, the mass ratio of 240Pu∕239Pu was determined by SF-ICP-MS (sector-focusing inductively coupled plasma mass spectrometry) with an ELEMENT XR (Thermo Scientific). A more detailed description of the measurements is given in Salminen-Paatero and Paatero (2020).
3.1 Activity concentrations of 238Pu, 239+240Pu and 241Pu in the surface air of Rovaniemi in 1965–2011
3.1.1 The activity concentration of 238Pu
In the period studied, 1965–2011, the activity concentration of 238Pu had the highest value of 259±13 nBq m−3 in 1968 (Table 1 and Fig. 1). The years of the highest concentrations of 238Pu around 1968 are a consequence of the destruction of the SNAP-9A satellite nuclear power unit re-entering the atmosphere in 1964. Since 1968, the activity concentration of 238Pu in the surface air of Rovaniemi has been decreasing and is now below or close to the detection limit. The concentration of 238Pu was also under the detection limit in the months after the Chernobyl accident, April–December 1986.

Figure 1The activity concentration of 238Pu (thin line; in nBq m−3) and 239+240Pu (thick line; in nBq m−3) in the surface air of Rovaniemi in 1965–2011. Values below the detection limit have been depicted as half the MDA (minimum-detectable-activity) value (Table 1). The black circles indicate the times of atmospheric nuclear tests (UNSCEAR, 2000).
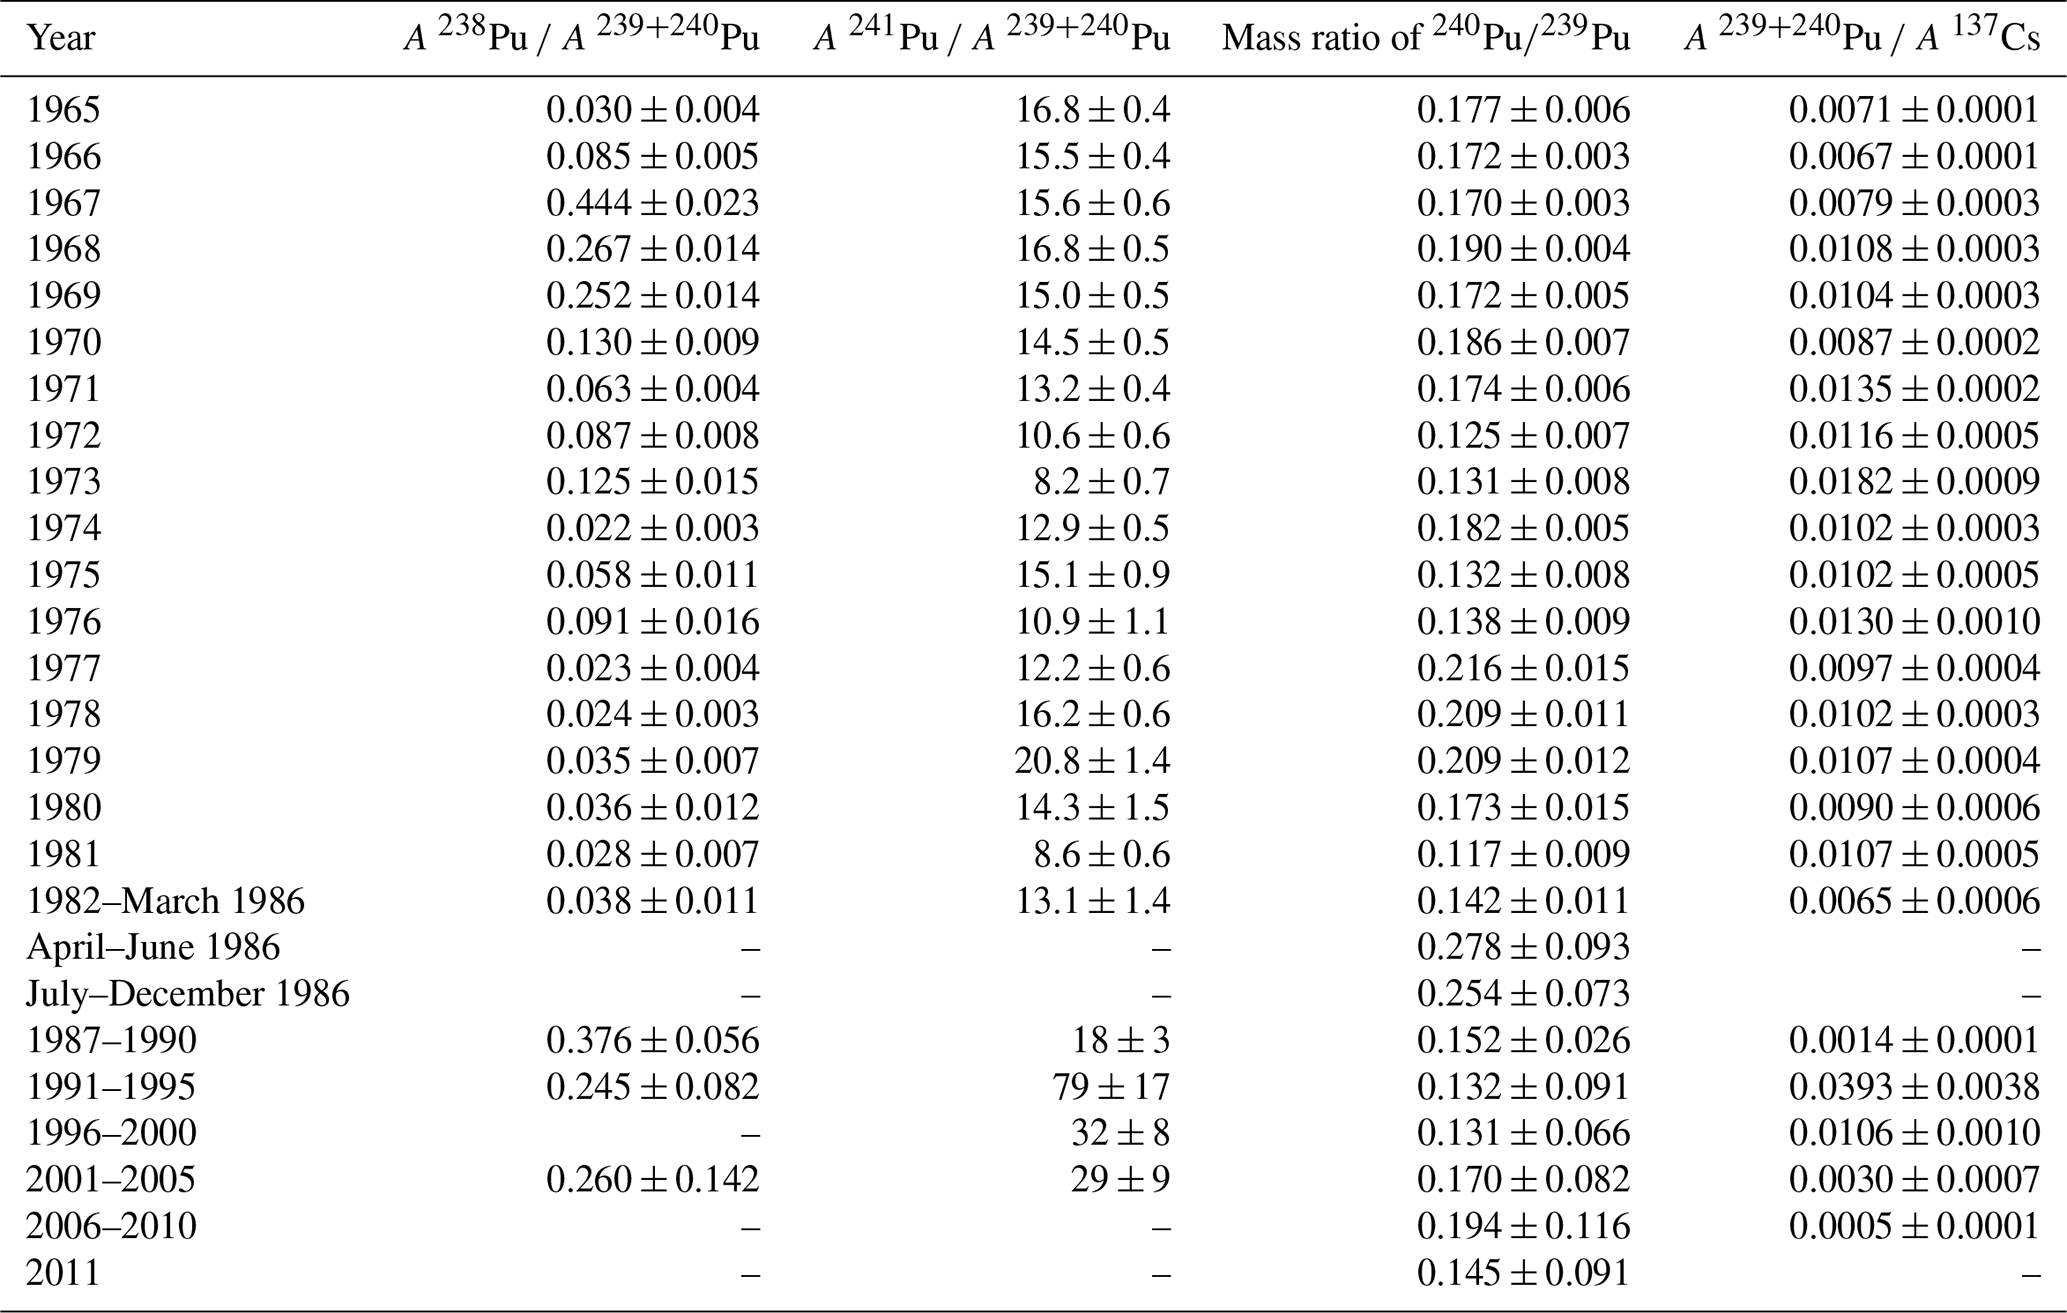
Table 1The atmospheric-activity concentrations of 238Pu, 239+240Pu and 241Pu in Rovaniemi, Finnish Lapland. The activity values have been decay-corrected to the middle point of the sampling period. A: activity concentration.

3.1.2 The activity concentration of 239+240Pu
The activity concentration of 239+240Pu in the surface air of Rovaniemi has been dropping from the highest value 2270±40 nBq m−3 (in 1965) and has been a few nBq m−3 since 1996 (Table 1, Fig. 1). Two years before the sampling was started, in 1963, saw the deposition maximum from atmospheric nuclear tests performed before the Partial Test Ban Treaty. For example, at Sodankylä, Finnish Lapland, 120 km north of Rovaniemi, the average 239+240Pu activity concentration was 17 000 nBq m−3 in 1963 (Salminen and Paatero, 2009). Slight peaks in 239+240Pu concentration can be seen in 1974, 1978 and 1981, evidently due to the atmospheric nuclear tests performed by the People's Republic of China between 1973 and 1980. The effect of these nuclear tests on the radionuclide concentration level in Finnish Lapland has been already observed in the concentration variation of 137Cs (Salminen-Paatero et al., 2019). As with 238Pu, the concentration of 239+240Pu was below the detection limit on April-June 1986 following the Chernobyl accident. For comparison, the concentration of 239+240Pu was 32 µBq m−3 in the surface air in Nurmijärvi (southern Finland) on 28 April 1986 (Jaakkola et al., 1986).
Based on the extremely low activity concentrations of both 238Pu and 239+240Pu in the surface air of Rovaniemi in April–December 1986, hardly any plutonium migrated to Finnish Lapland from the destroyed Chernobyl nuclear reactor after 26 April 1986. This conclusion is supported by the high concentration of 137Cs (1294±7 µBq m−3) and the low concentration of 90Sr (5.2±1.1 µBq m−3) in the same air filter samples in April–June 1986 (Salminen-Paatero et al., 2019). It has been suggested that the initial contamination plume from the destroyed Chernobyl reactor contained intermediate (90Sr) and refractory elements (Pu isotopes) and that the plume passed over central and southern Finland, while the volatile elements such as 137Cs were mostly in the later contamination plumes which also reached Lapland (Saxén et al., 1987). However, the observations of activity ratio discussed in a later paragraph show some possibility of Chernobyl-derived plutonium in Finnish Lapland.
3.1.3 The activity concentration of 241Pu
The concentration of 241Pu was calculated via ingrowth of 241Am, and as with 239+240Pu, the activity concentration of 241Pu reached its highest value in 1965, 38 198 ± 711 nBq m−3, since which its concentration has been decreasing, except for small peaks in 1974, 1978 and 1981 (Table 1, Fig. 2). In a similar manner to the activity concentration changes of 239+240Pu, these peaks in the activity concentration of 241Pu are presumably caused by nuclear tests in the People's Republic of China. The atmospheric-activity concentration of 241Pu was below the detection limit in April–June 1986, and since July–December 1986, the amount of 241Pu has returned to the same pre-Chernobyl level in the surface air of Rovaniemi. Based on the 241Pu concentration alone, there is no evidence of any Chernobyl-derived 241Pu in Rovaniemi.
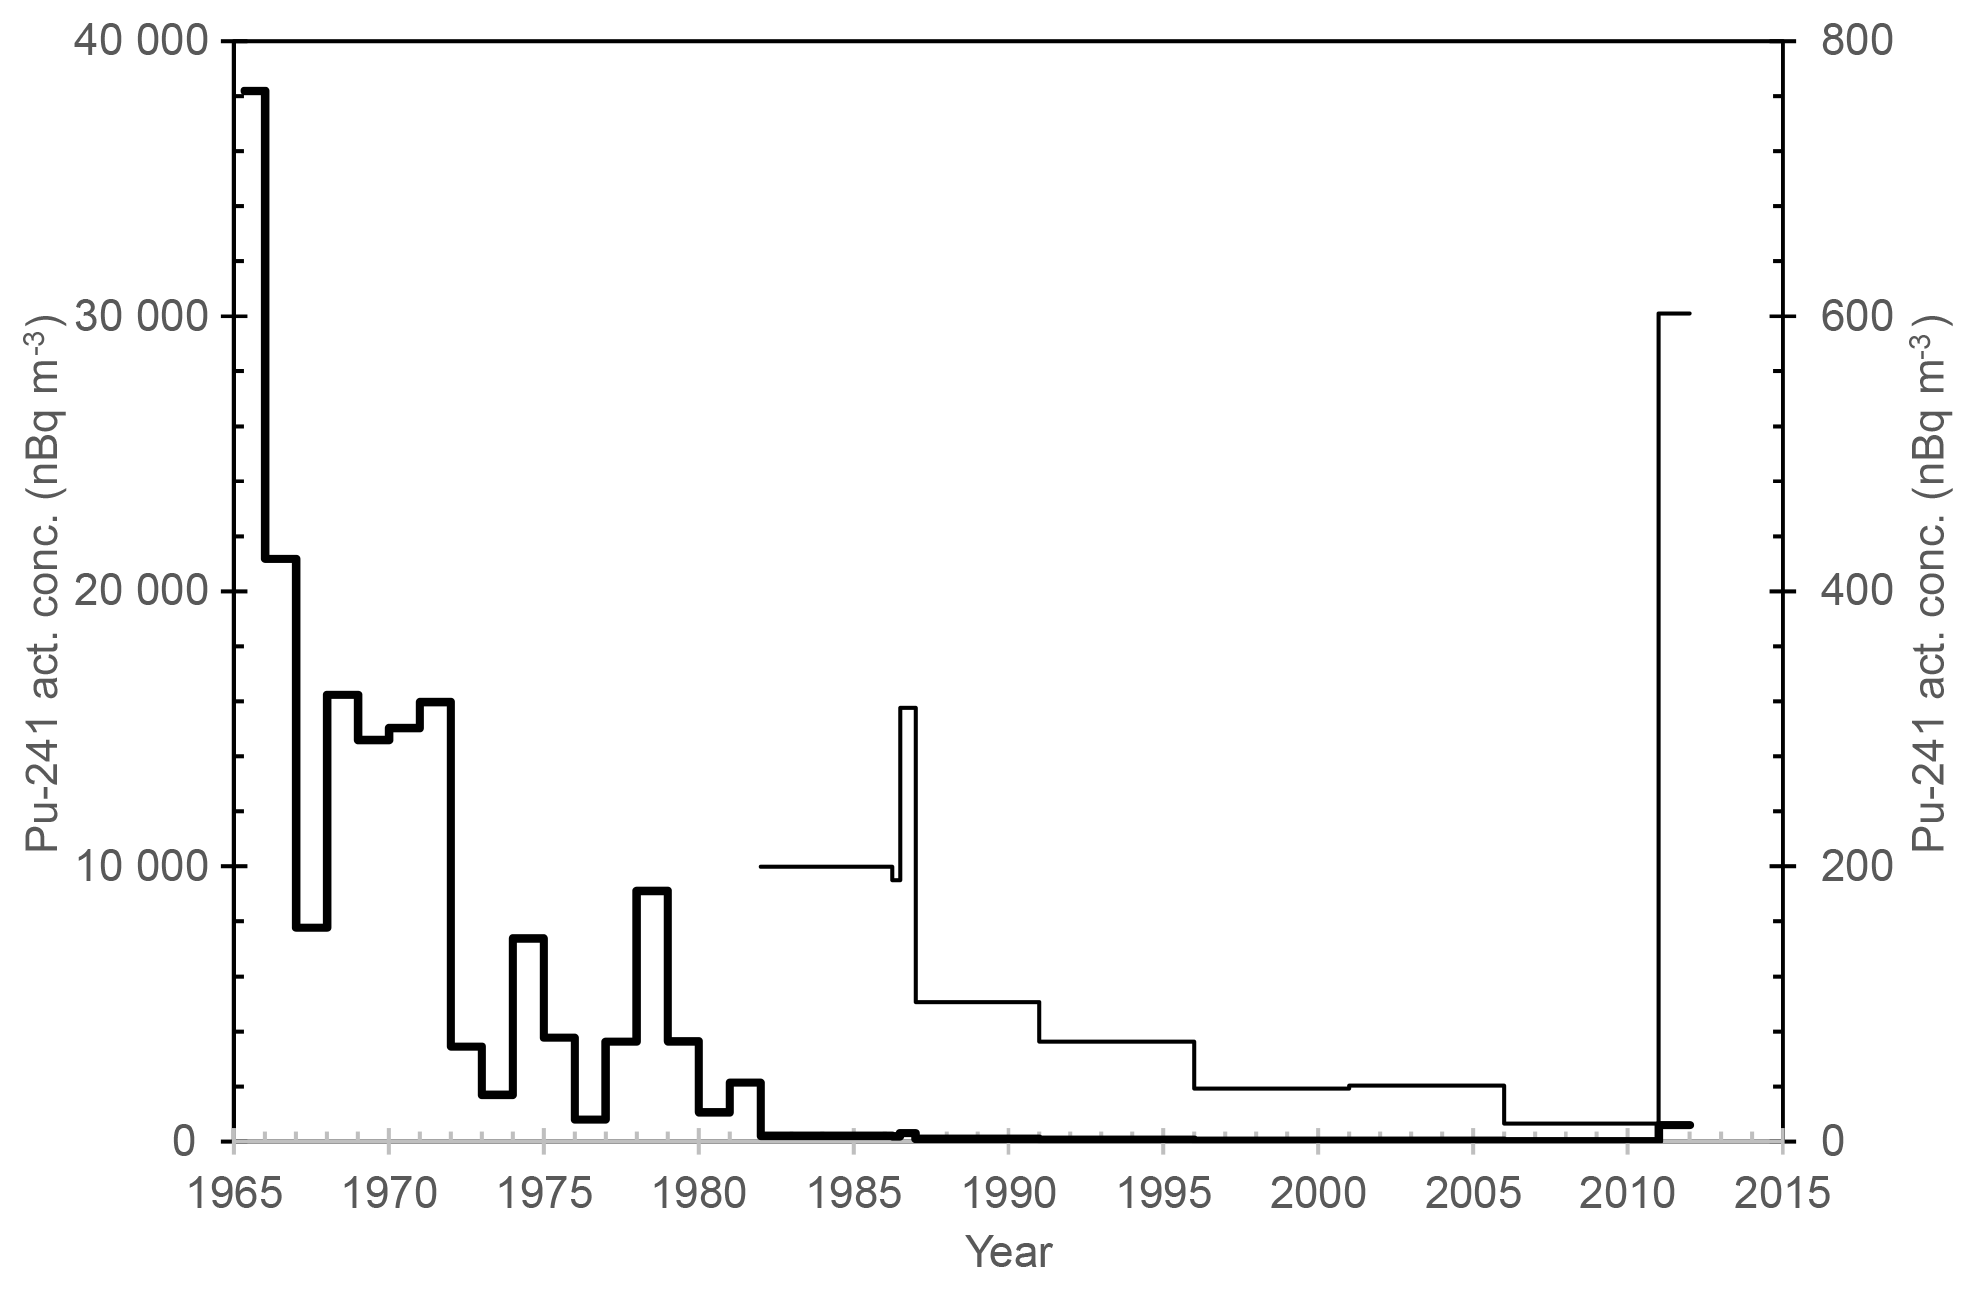
Figure 2The activity concentration of 241Pu (nBq m−3) in the surface air of Rovaniemi (thick line for 1965–2011 with the left vertical scale; thin line for 1982–2011 with the right vertical scale). Values below the detection limit have been depicted as half the MDA value (Table 1).
An increase in the activity concentration of 241Pu is seen in 2011, unlike with . The activity concentration of 241Pu in 2011, 602±131 nBq m−3, is above the concentration level in Rovaniemi during the last decades before 2011 and probably due to the Fukushima accident of 11 March 2011. The activity of 241Pu has been reported as much higher than the activity of 239+240Pu in the emissions from the destroyed Fukushima Daiichi Nuclear Power Plant (NPP), with the activity ratio of having a value of 108 in soil and litter samples (Zheng et al., 2012). The activity concentrations of Pu isotopes were 25 000 nBq m−3 for 241Pu, 130 nBq m−3 for 239Pu and 150 nBq m−3 for 240Pu in the air filters sampled at 120 km from Fukushima on 15 March 2011 (Shinonaga et al., 2014).
The existence of only one combined air filter sample of Rovaniemi for 2011 is unfortunate: the annual concentration is an average of the weekly concentrations in 2011, and the signal from the Fukushima accident has been diluted under the excess effect of global fallout in the air filters. Analysis of plutonium isotopes in weekly filters separately from March 2011, in order to determine Fukushima-derived 241Pu concentrations and isotope ratios in Finnish Lapland, would have been of interest.
3.2 The activity ratios of , , and total beta activity to 239+240Pu and mass ratio of 240Pu∕239Pu in the air filters
3.2.1 activity ratio
The activity ratio of was 0.022±0.003–0.444±0.023 in Rovaniemi in 1965–2011, with values below the detection limit excluded (Table 2, Fig. 3). The variation in the activity ratio values is 200-fold. The activity ratio of in the surface air can vary greatly even in a short time, for example due to stratospheric–tropospheric exchange, resuspension and an introduction of several contamination sources. For example, the activity ratio of varied from 0.014±0.003 to 0.32±0.11 in Sodankylä in 1963 alone; still, the most typical value was ∼0.03, which represents the activity ratio for global fallout (Salminen and Paatero, 2009). The ratio started to increase in 1966 in Rovaniemi, reaching a maximum in 1967 due to the aforementioned SNAP-9A satellite accident in 1964. Previously, an increased activity ratio due to the SNAP-9A accident has been found in lichens both in Subarctic Finland (Jaakkola et al., 1978) and Sweden (Holm and Persson, 1975) a couple of years after 1964. This delay of over 2 years after the accident indicates the slowness of the interhemispheric transport of stratospheric radionuclides (Fabian et al., 1968).
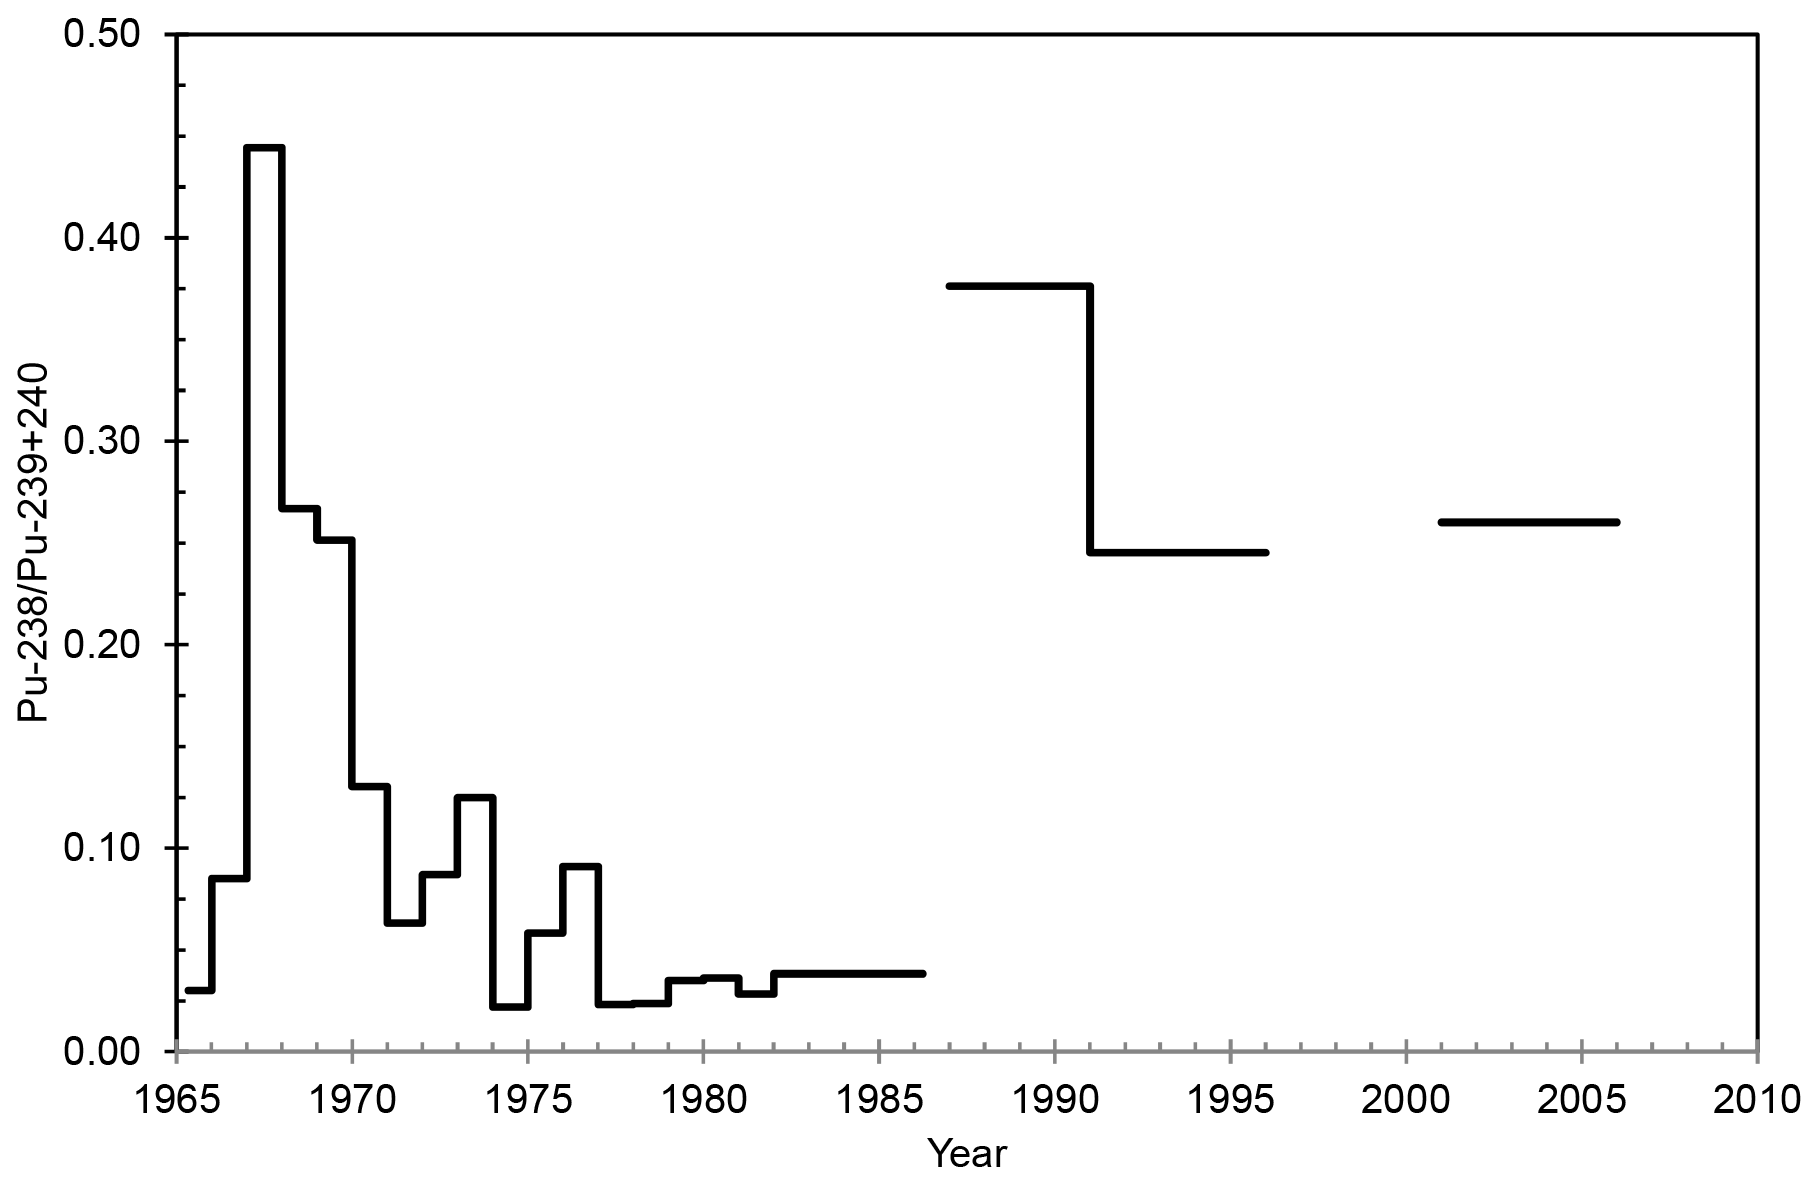
Table 2The activity ratios of , and and the mass ratio of 240Pu∕239Pu in the air filters collected in Rovaniemi. The uncertainty is 1σ error for the activity ratios and 2σ error for the mass ratio. The symbol “–” means that one or both isotopes had a concentration below the detection limit.
The activity ratio of cannot be determined for the period immediately after the Chernobyl accident because the activity concentrations of 238Pu and 239+240Pu were below the detection limit in April–December 1986. This finding is in agreement with the previous assumptions about there being barely any Chernobyl-derived refractory elements in Finnish Lapland (Salminen-Paatero et al., 2019). Because the activity concentrations of 238Pu and 239+240Pu were below the detection limit, the activity ratio of cannot be determined for the year of the Fukushima accident, 2011, either. For comparison, both 238Pu and 239+240Pu were detected in Lithuania, ∼1300 km south of Rovaniemi, soon after the Fukushima accident (Lujanienė et al., 2012). The combined air filter sample set in the Lithuanian study contained the sampled air volume of m3 from 23 March to 15 April 2011, with the activity concentration of 239+240Pu being 44.5±2.5 nBq m−3 and the activity concentration of 238Pu being 1.2 times higher than that of 239+240Pu. The resulting activity ratio of in Lithuania was 1.2, clearly deviating from the activity ratio values of the Chernobyl fallout and global fallout from nuclear-weapon testing.
3.2.2 activity ratio
The activity ratio of varied between 8.2±0.7 and 79±17 in the surface air of Rovaniemi in 1965–2011, except for April–December 1986 and 2011, when the concentration of one or both isotopes (either 239+240Pu or 241Pu) was below the detection limit (Table 2, Fig. 4). These two periods following the accidents of Chernobyl and Fukushima would have interesting activity ratio values for determining the Pu contamination source in Rovaniemi. Unfortunately, the concentration of 239+240Pu in the surface air of Finnish Lapland was extremely low during those periods.
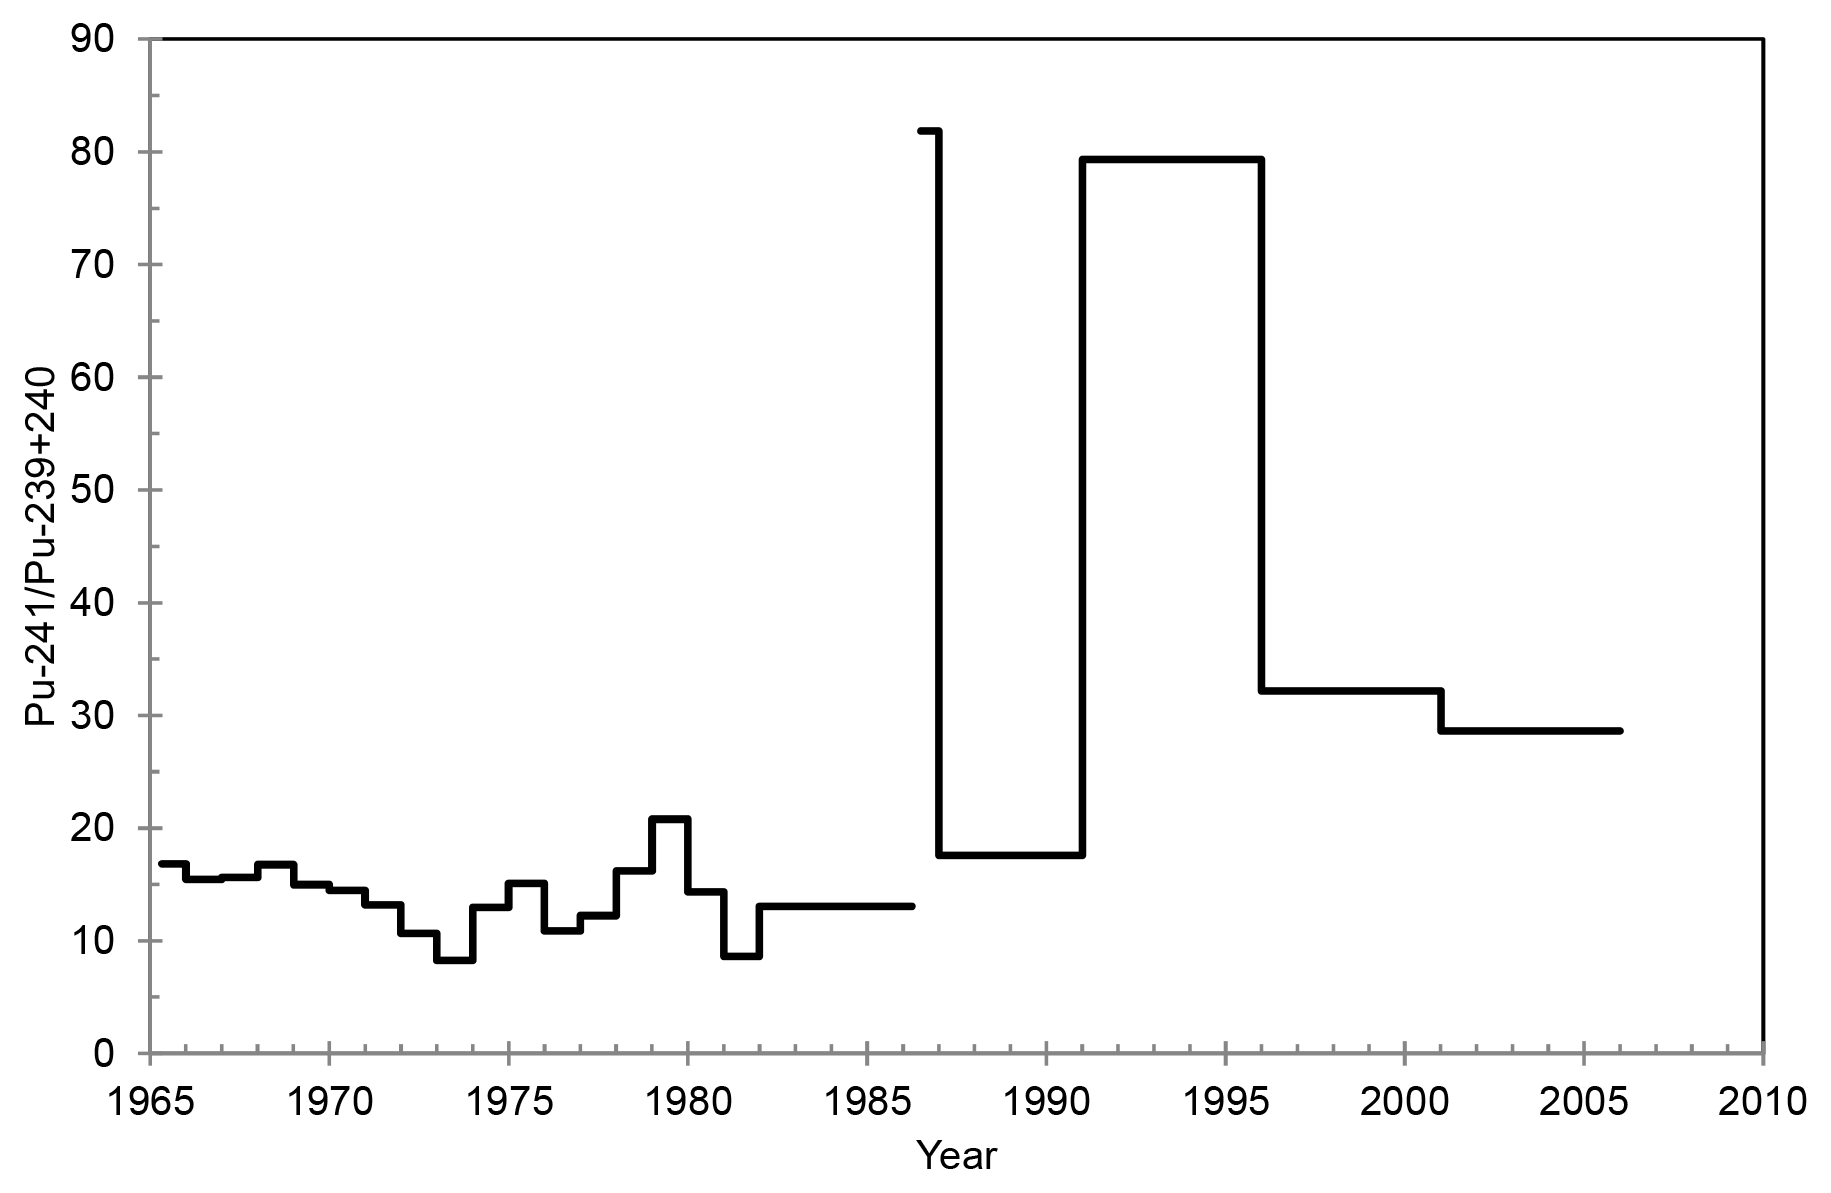
The activity ratio values of Rovaniemi were mainly due to atmospheric nuclear-weapon testing in 1965–March 1986 and 1987–2005. The influence of the Chernobyl accident can be seen as elevated ratio values. The activity ratio was determined to be 15 in fresh nuclear fallout in 1963–1972 (Perkins and Thomas, 1980), and the corresponding ratio values in the fallout from the Chernobyl accident have been 85 in Sweden and Poland (Holm et al., 1992; Mietelski et al., 1999) and 95 in Finland (Paatero et al., 1994). The published activity ratio values for the Fukushima-derived contamination are also high, e.g., 89 in air filters (calculated from the individual isotope concentrations in Shinonaga et al., 2014) and 108 in soil and litter samples (Zheng et al., 2012).
3.2.3 240Pu∕239Pu mass ratio
The mass ratio of 240Pu∕239Pu was 0.117±0.009–0.278±0.093 in 1965–2011 (Table 2 and Fig. 5), and the majority of ratio values corresponds to the value ∼0.18 for global fallout from atmospheric nuclear-weapon testing in the Northern Hemisphere (Beasley et al., 1998), taking into account the relative measurement uncertainties. The highest mass ratio value occurred in April–June 1986, while the activity concentrations of 238Pu, 239+240Pu and 241Pu were under the detection limit by alpha spectrometry. Therefore, it was possible to determine 239Pu and 240Pu by mass spectrometry even from the samples with very low Pu concentrations (April–December 1986, 2011, etc.), although the relative measurement uncertainties of ICP-MS are much higher for these samples with very low Pu concentrations compared to the measurement uncertainties of samples with a higher Pu concentration level.

Figure 5The mass ratio of 240Pu∕239Pu in the surface air of Rovaniemi as a function of time.
The mass ratio of 240Pu∕239Pu is higher in the emissions from the destroyed Chernobyl reactor than the global-fallout value. For example, a mass ratio value of 0.408±0.003 has been determined from samples of the Chernobyl-contaminated soil layer (Muramatsu et al., 2000), and two hot particles that migrated to Finland from Chernobyl had the mass ratios 0.33±0.07 and 0.53±0.03 (Salminen-Paatero et al., 2012). The air filters sampled in Rovaniemi in April–June and July–December 1986 seem to have elevated mass ratios, 0.278±0.093 and 0.254±0.073, respectively, but with consideration of their high measurement uncertainties, these post-Chernobyl ratio values might be close to the global-fallout ratio of 0.18 after all.
In a similar manner to the refractory-element emissions from the Chernobyl accident, the fuel particles released from the Fukushima accident have a significantly higher mass ratio of 240Pu∕239Pu than the global-fallout value of 0.18. Dunne et al. (2018) have compared the mass ratios of 240Pu∕239Pu in soil, sediment and vegetation samples collected at the surroundings of Fukushima with the known mass ratios in global fallout and in the destroyed nuclear reactors of the Fukushima Daiichi NPP. The mass ratio of 240Pu∕239Pu for the Fukushima reactor units was obtained using ORIGEN (Oak Ridge Isotope GENeration) code, being 0.344 for Reactor 1, 0.320 for Reactor 2 and 0.356 for Reactor 3, respectively (Nishihara et al., 2012). All investigated environmental samples from the proximity of Fukushima had 240Pu∕239Pu atom ratios between the global-fallout value and the value for the Reactor 3 calculated by ORIGEN, with the exception of one deviating value (Dunne et al., 2018).
The same study highlighted that the concentration level of Pu isotopes and the mass ratio of 240Pu∕239Pu varies greatly in the environment of Fukushima and that they do not necessarily correlate with each other. The lowest mass ratio values in Fukushima have also been at the global-fallout level. Other Fukushima-related investigations have also noted this variety of isotope concentrations and isotope ratios. In a litter and soil sample set collected 20–32 km from Fukushima, three samples had high 241Pu concentrations and mass ratios of 0.303–0.330 that can be considered as representing contamination from the destroyed reactors of Fukushima (Zheng et al., 2012). The rest of the soil and litter samples from the proximity of Fukushima in Zheng et al. (2012) had low 241Pu concentrations, and the 240Pu∕239Pu mass ratios were at the Northern Hemisphere global-fallout level. In another study, the air filter samples collected at 120 km from Fukushima formed two groups: one having a low 239Pu concentration and a fairly similar mass ratio to global fallout (0.141±0.002) and another having a high 239Pu concentration and a mass ratio clearly deviating from global fallout (≥0.3) (Shinonaga et al., 2014).
The 240Pu∕239Pu mass ratio was only 0.145±0.091 in the surface air of Rovaniemi in the year of the Fukushima accident, 2011. Again, the activity concentrations of both 239Pu and 240Pu were extremely low in Rovaniemi in that year, and the uncertainty of the mass ratio is therefore high, suggesting that the ratio value in 2011 is probably due to global fallout.
3.2.4 activity ratio
The activity ratio of varied between 0.0005±0.0001 and 0.0393±0.0038 in the surface air of Rovaniemi in 1965–2011, excluding the samples of April–December 1986 and 2011, when the concentration of 239+240Pu fell below the detection limit (Table 2). The lowest value for the activity ratio occurred in 2006–2010, when the activity concentration of both radionuclides (239+240Pu and 137Cs) in the surface air had been constantly decreasing for decades. The range of the values in Rovaniemi is in agreement with the previous studies of surface air in Finland. The activity ratio of was 0.0020±0.0008–0.029±0.010 in Sodankylä in 1963 (Salminen-Paatero and Paatero, 2012) and 0.005±0.002–0.012±0.004 (range of annual mean values) in Helsinki (southern Finland) in 1962–1977 (Jaakkola et al., 1979).
Bossew et al. (2007) have calculated the reference values for the activity ratio in global fallout and the Chernobyl accident, obtaining 0.0180±0.0024 (data from Bunzl and Kracke, 1988) and (data from Irlweck and Khademi, 1993), respectively. The values for Rovaniemi are higher than those for Chernobyl contamination, and some values for Rovaniemi are even higher than the value for global fallout.
In contrast with high ratio values in the surface air of Rovaniemi and in global fallout, very low activity ratios have been observed in the Fukushima environment. Among all litter and soil samples of Fukushima in the study by Zheng et al. (2012), the three samples that represent the Fukushima-derived contamination, i.e., have both a high 241Pu concentration and high 240Pu∕239Pu mass ratio, had the activity ratios of , and in 2011.
3.2.5 Activity ratio of total beta activity to 239+240Pu
The ratio between total beta activity (Salminen-Paatero et al., 2019) and 239+240Pu remains rather constant during the atmospheric-nuclear-testing era (Fig. 6). The ratio reflects the produced nuclide composition after fission and activation reactions in the detonating devices. Following the Chernobyl accident, the ratio increases by almost 3 orders of magnitude. After the initial explosion plume, the emissions from the burning reactor were dominated by volatile fission products, which explains the high activity ratio of total beta activity to 239+240Pu. After the decay of short-lived fission products, the ratio soon returns to near the pre-Chernobyl level. Towards the end of the 20th century, the ratio starts to gradually increase. This is explained by the decreasing amount of plutonium in the atmosphere, while the total beta activity remains on a constant level due to natural atmospheric radioactivity, mainly 210Pb.
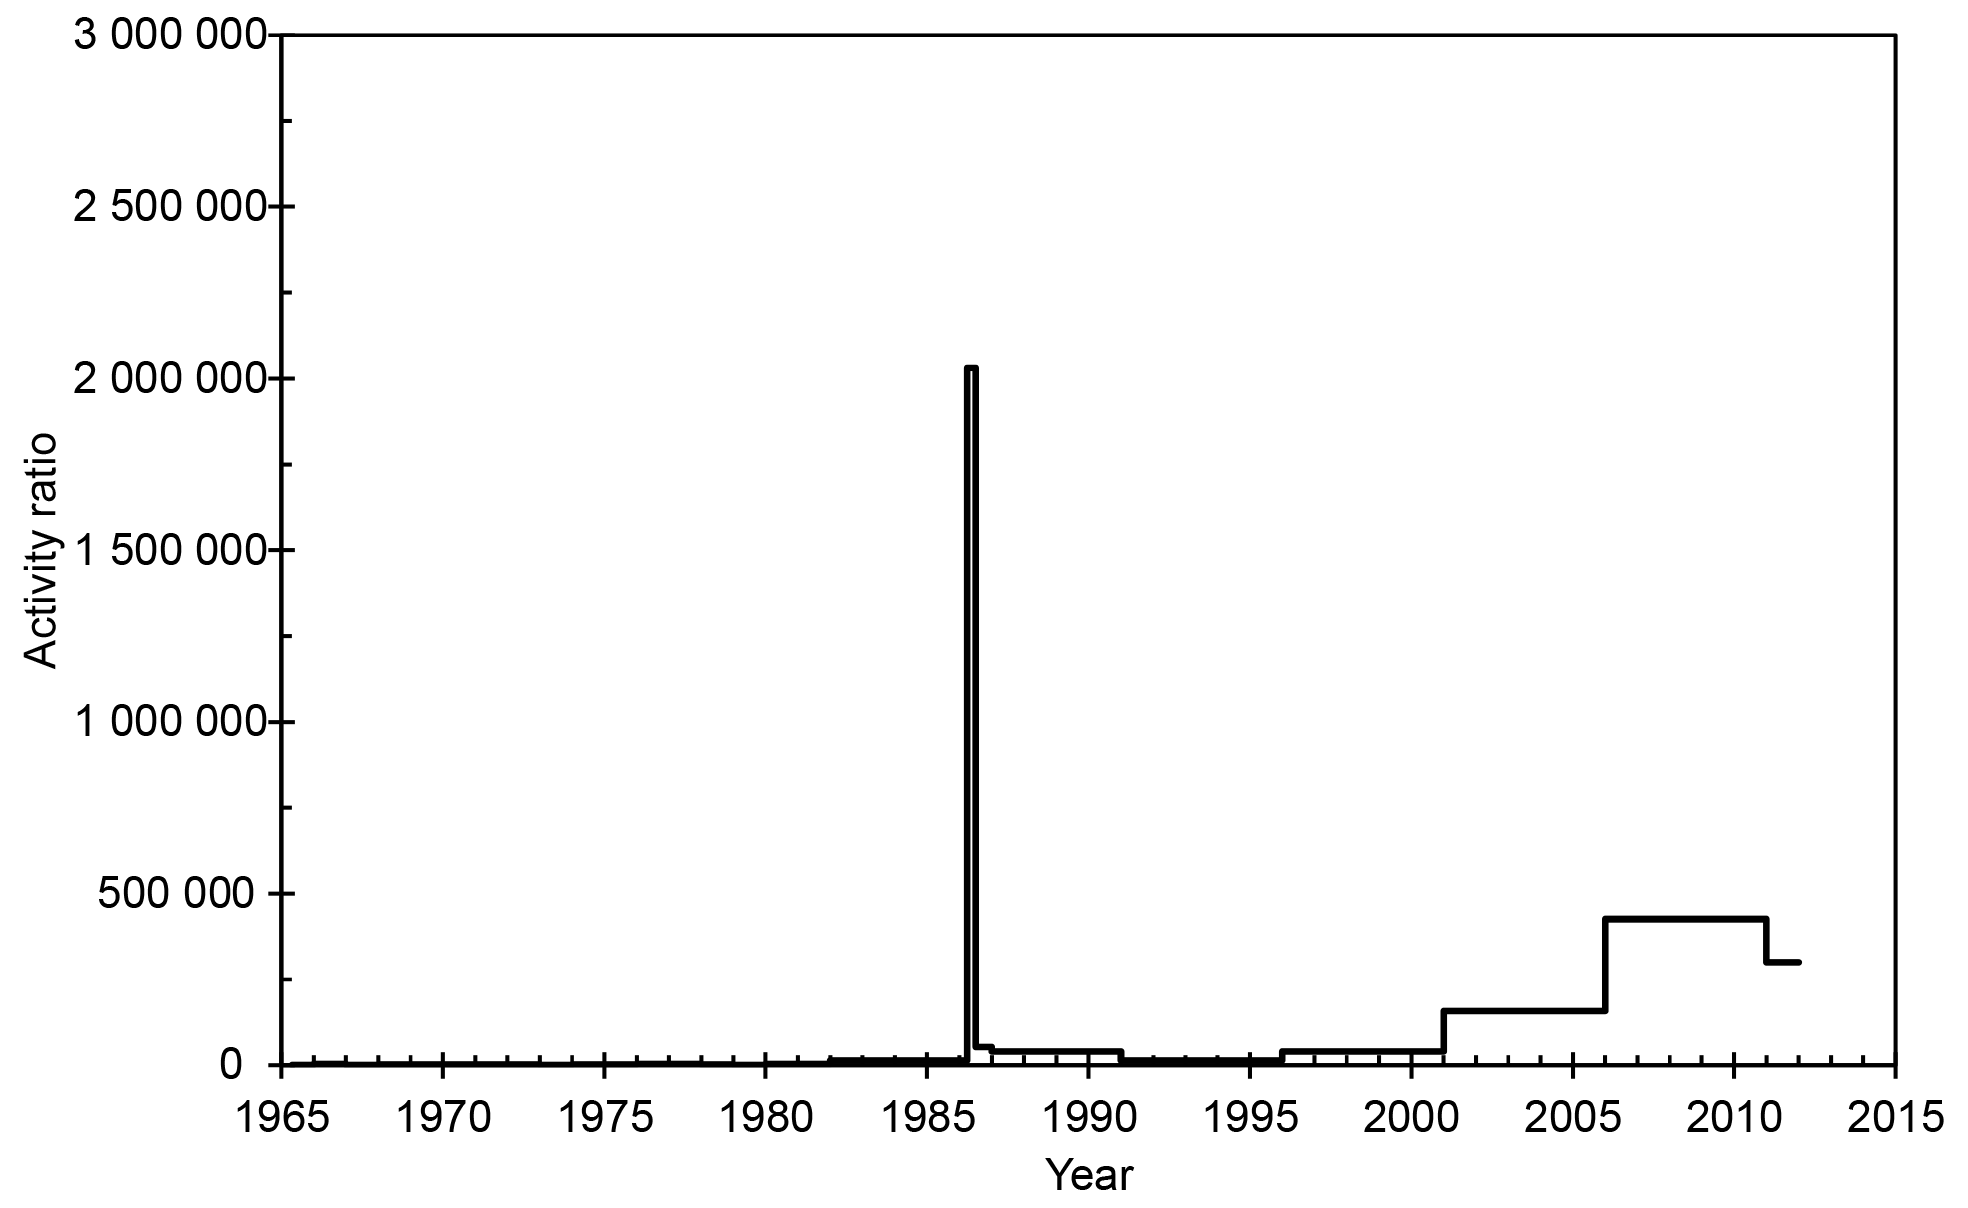
Figure 6The ratio of total beta activity (Salminen-Paatero et al., 2019) and 239+240Pu activity content in the surface air in Rovaniemi in 1965–2011. 239+240Pu values below the detection limit have been replaced with half the MDA values (Table 1).
3.3 Effect of actual and hypothetic nuclear detonations on the surface air of Subarctic Finland
At least two new nuclear facilities in or close to the European Arctic region are under preparation. The construction of infrastructure for a new nuclear power plant at Pyhäjoki, western Finland, has begun. The Shtokman natural gas field is located in the Barents Sea between northern Finland and Novaya Zemlya. The plans indicate that future gas extraction production facility will be powered by a floating nuclear power plant. The atmospheric dispersion of plutonium contamination in the event of accidents in these future plants was assessed with atmospheric transport modeling. In this study, ADM (atmospheric-dispersion modeling) provided risk estimates and reference contamination levels related to future nuclear activities in and close to Arctic regions, which can be compared with earlier actual releases.
241Pu dispersion in the atmosphere was simulated with the SILAM (System for Integrated modeLling of Atmospheric composition) model (Sofiev et al., 2006, 2008). The model runs were based on the meteorological forecast data of the European Centre for Medium-Range Weather Forecasts (https://www.ecmwf.int, last access: 6 April 2020) with a horizontal resolution of 0.25∘ and with nine vertical levels up to a height of 7700 m. Transport and dispersion calculations for both sites were made for each day in the year 2010. The average activity concentrations of 241Pu in the surface air during the first 48 h after the release were calculated.
The following accident conditions, previously listed in Paatero et al. (2014), for the Pyhäjoki reactor at 64∘32′ N, 24∘15′ E were used:
-
a pressurized water reactor with thermal power of 4000 MW;
-
the end of the refueling interval;
-
an immediate release after shutdown with an effective release height of 200 m a.s.l.; and
-
a 241Pu inventory of 6.2×10¹⁷ Bq, a release fraction of 0.1 % and a release of 6.2×10¹⁴ Bq.
The following accident conditions for the case of the Shtokman gas field in the Barents Sea at 73∘ N, 44∘ E were used (previously used by Paatero et al., 2014):
-
an ice breaker reactor with a fuel burn-up rate of 466 000 MW d T−1 HM (heavy metal);
-
an immediate release 2 h after shutdown;
-
a radionuclide inventory according to Reistad and Ølgaard (2006);
-
an effective release height of 100 m a.s.l.; and
-
a 241Pu inventory of 3.2×10¹⁴ Bq, a release fraction of 0.2 % and a release of 6.4×10¹¹ Bq.
Varying meteorological situations have a decisive effect on atmospheric plutonium transport following accidental emissions from a nuclear reactor. The wind direction determines the path of the emission plume. The wind speed sets how quickly the emission plume is advected. However, the wind speed also affects the turbulence that disperses the plume vertically and horizontally. This influences the plutonium concentrations in the air. Precipitation, for its part, efficiently brings plutonium-bearing particles from the atmosphere to the surface, which affects the deposition of plutonium and furthermore its transfer to food webs.
From the Rovaniemi region perspective, the worst of the calculated 365 dispersion cases would have caused an average 241Pu activity concentration of less than 1 kBq m−3 in ground-level air in the first 48 h after the release (Fig. 7). This equals an annual average 241Pu exposure of 5 Bq m−3. For comparison, the atmospheric nuclear tests caused the 241Pu activity concentration to vary between a few dozen and some 1700 µBq m−3 in 1963 in northern Finland or in other words several orders of magnitude lower (Salminen and Paatero, 2009). In practice, the human exposure to 241Pu via inhalation would remain on a clearly lower level because the civil-defense authorities would order the population to stay indoors with ventilation systems turned off and doors and windows sealed.
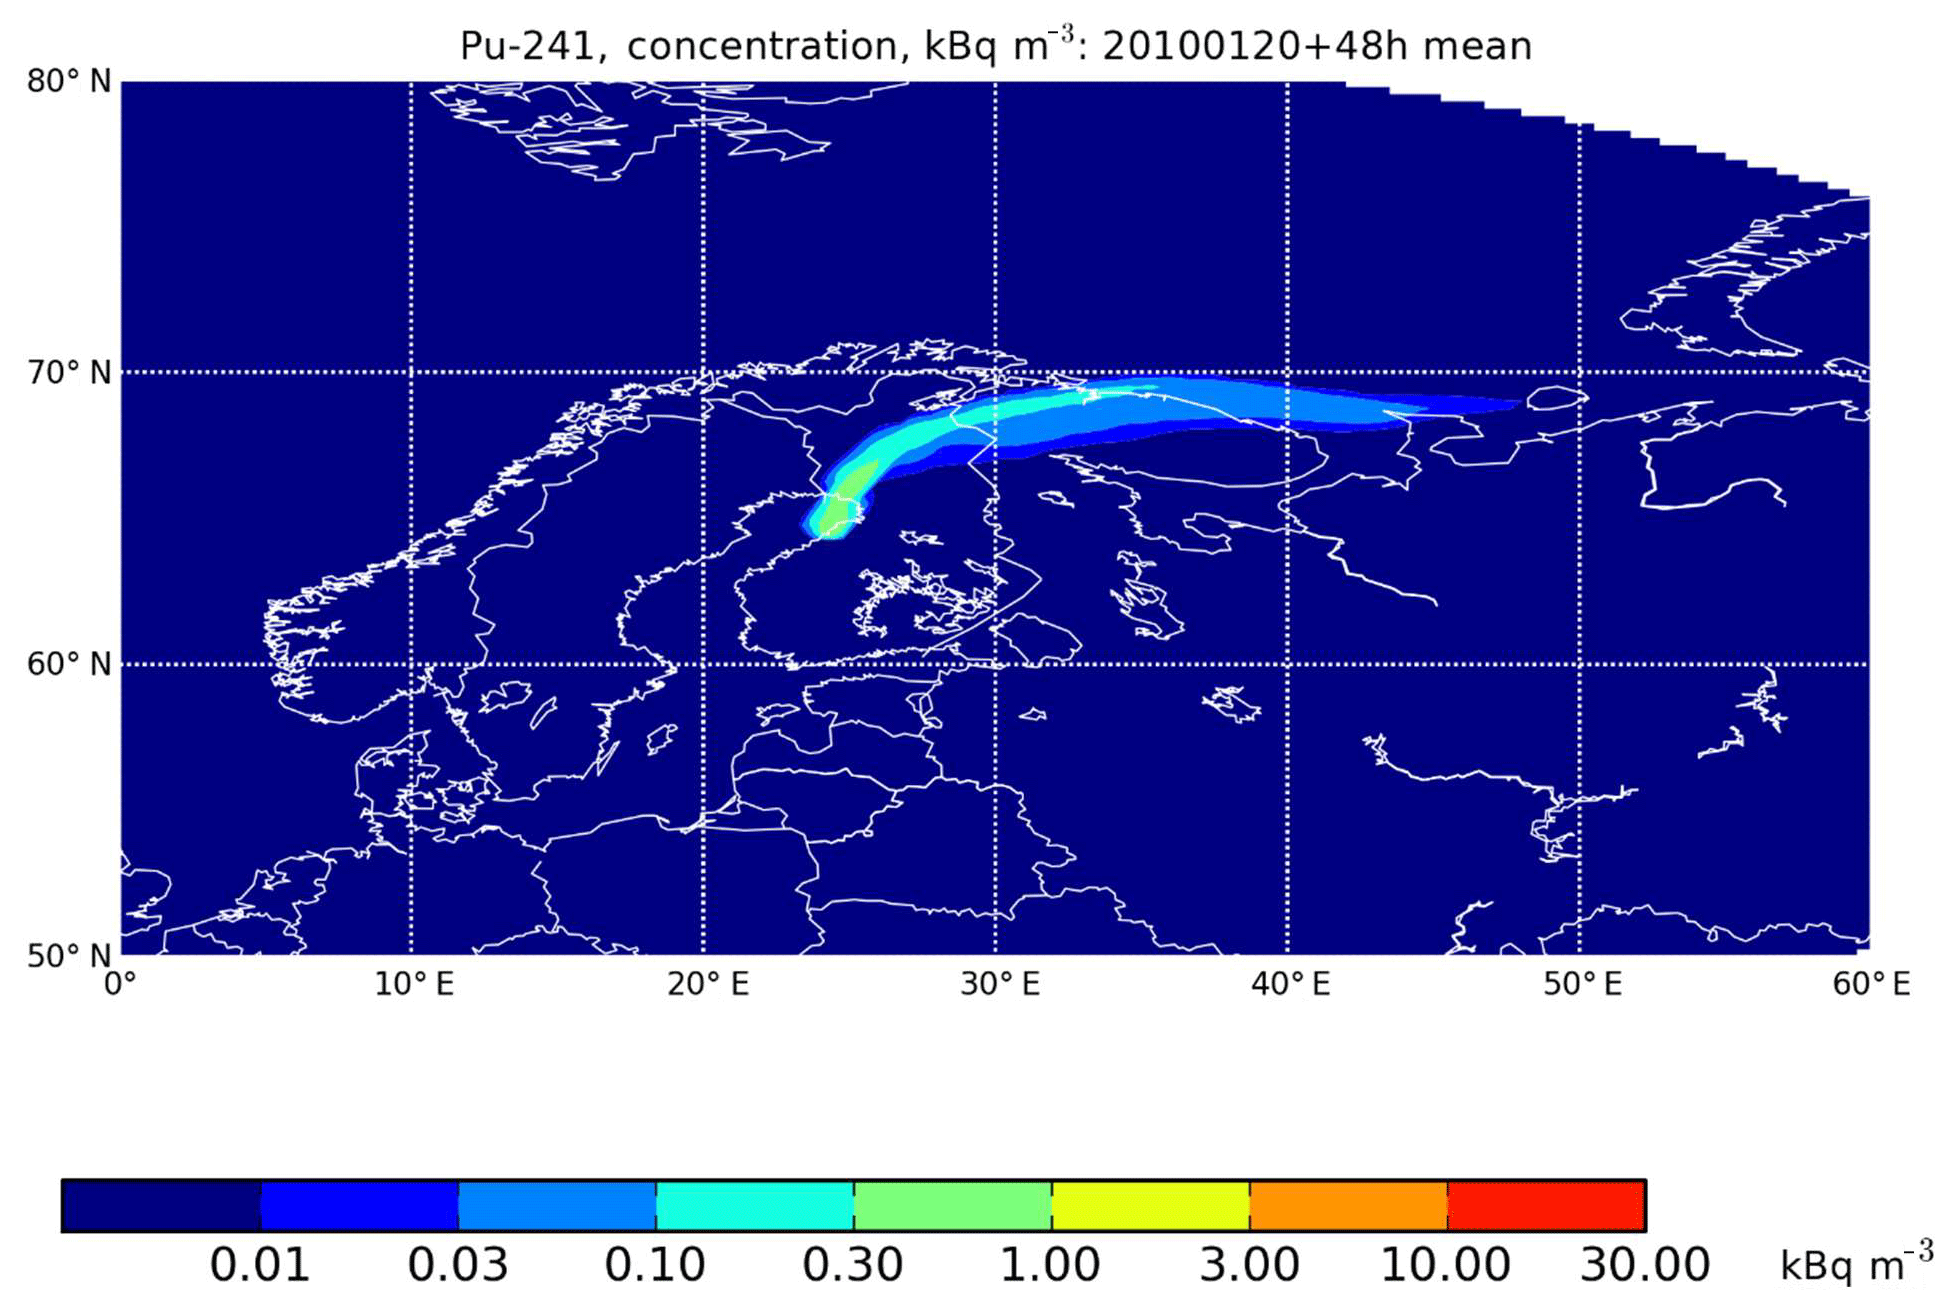
Figure 7The average activity concentration of 241Pu in the surface air during the first 48 h after a hypothetical reactor accident at Pyhäjoki, with an assumed release of 20 January 2010.
Compared with the Pyhäjoki accident scenario, the consequences after a hypothetical accident in a floating nuclear reactor in the Barents Sea would be much less significant from the northern Finnish perspective. This would be due to smaller emissions, a greater distance and favorable climatic conditions, namely prevailing westerly and southwesterly winds. Only one dispersion calculation of 365 produced an atmospheric transport pattern that reached the northernmost part of Finland (Fig. 8). The ground-level 241Pu activity concentrations would have been less than 0.01 Bq m−3 in the first 48 hours, corresponding to an annual average concentration of 55 µBq m−3. This is similar to the activity concentrations occurring in the early 1960s.
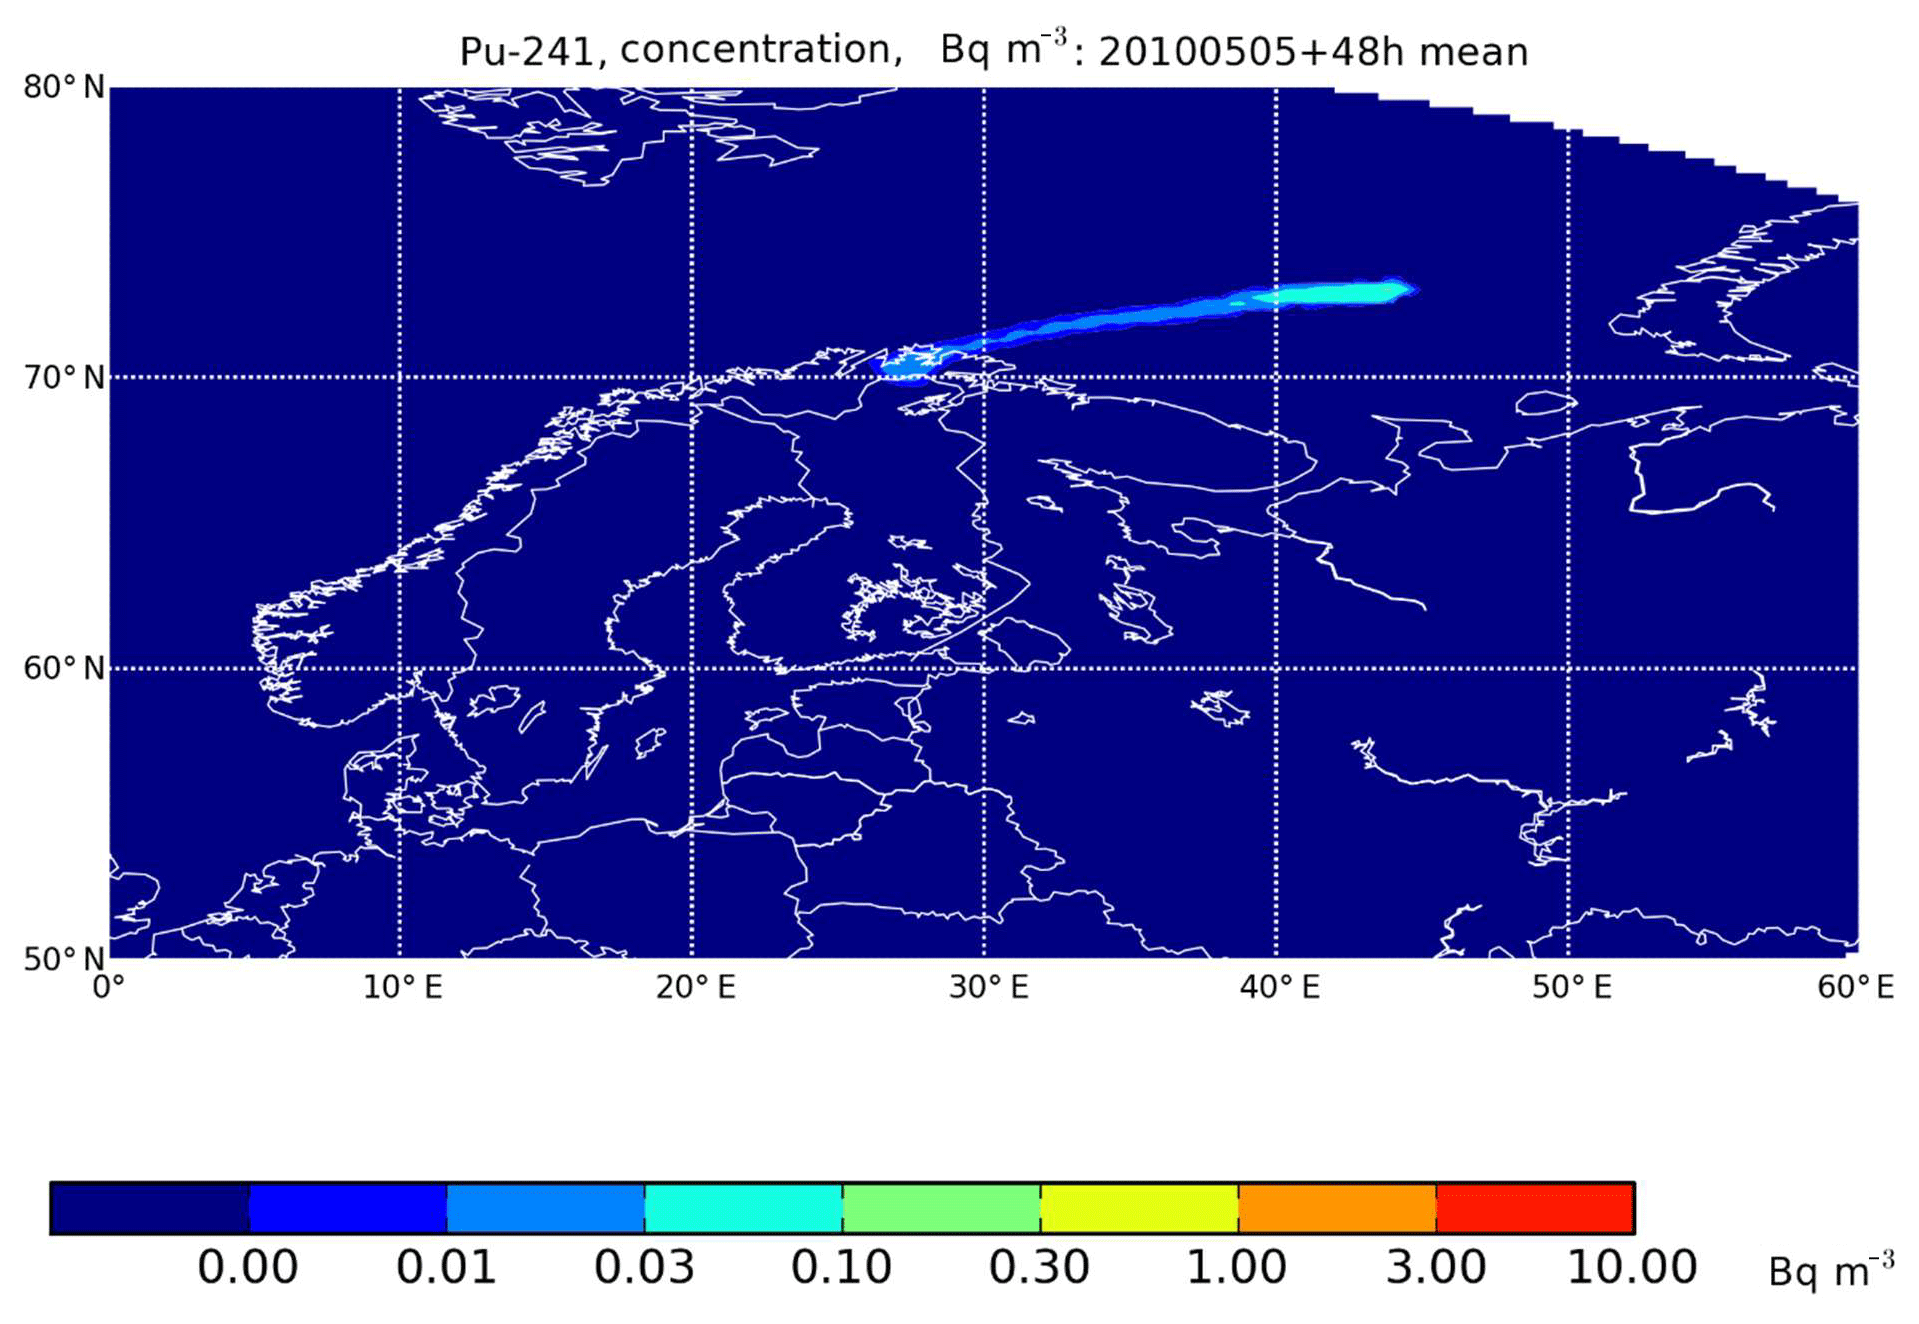
Figure 8The average activity concentration of 241Pu in the surface air during the first 48 h after a hypothetical accident in a floating reactor at the Shtokman natural gas field, in the Barents Sea, with an assumed release 5 May 2010.
3.4 Case of Fukushima 2011 and 241Pu
An earlier work by Paatero et al. (2012) observed that the SILAM model simulates the temporal behavior of the Fukushima emission plume in the High Arctic well. The calculated activity concentration levels, however, were an order of magnitude lower than the observed ones. This deviation was attributed to inaccuracies in the source term. From the same model dataset, the 137Cs activity concentration in the surface of Rovaniemi was extracted. The level of these values was then corrected by adjusting them to the observed weekly 137Cs activity concentration of 170 µBq m−3 between 28 March and 4 April 2011 (Salminen-Paatero et al., 2019). From these values, the 241Pu activity concentrations were obtained by multiplication with the 241Pu∕137Cs activity ratio of . This activity ratio was found in hot particles close to the Fukushima Daiichi NPP by Igarashi et al. (2019). The calculated hourly 241Pu activity concentration reaches a maximum level of 0.01 µBq m−3 for two short periods (Fig. 9). The calculated peak activity concentrations are very low, 6 orders of magnitude lower than daily 241Pu activity concentrations observed in northern Finland in 1963 (Salminen and Paatero, 2009). However, there is a discrepancy between this assessment and the annual observed 241Pu activity concentration of 0.6 µBq m−3 (Fig. 2). If we assume that the background 241Pu activity concentration due to the atmospheric nuclear tests and the Chernobyl accident were 0.03 µBq m−3, then the average activity concentration should be 9.3 µBq m−3 between 27 March and 17 April: in other words, 1000 times higher. An obvious explanation is that the 241Pu∕137Cs activity ratio we used () is not valid. The value may not be representative of the bulk emission mixture of the destroyed reactors. Zheng et al. (2012) found out that the activity ratio in environmental samples varied over 4 orders of magnitude. In addition, the hot particles were found close to the source, and fractionation processes were possible during the atmospheric transport of over 10 000 km.
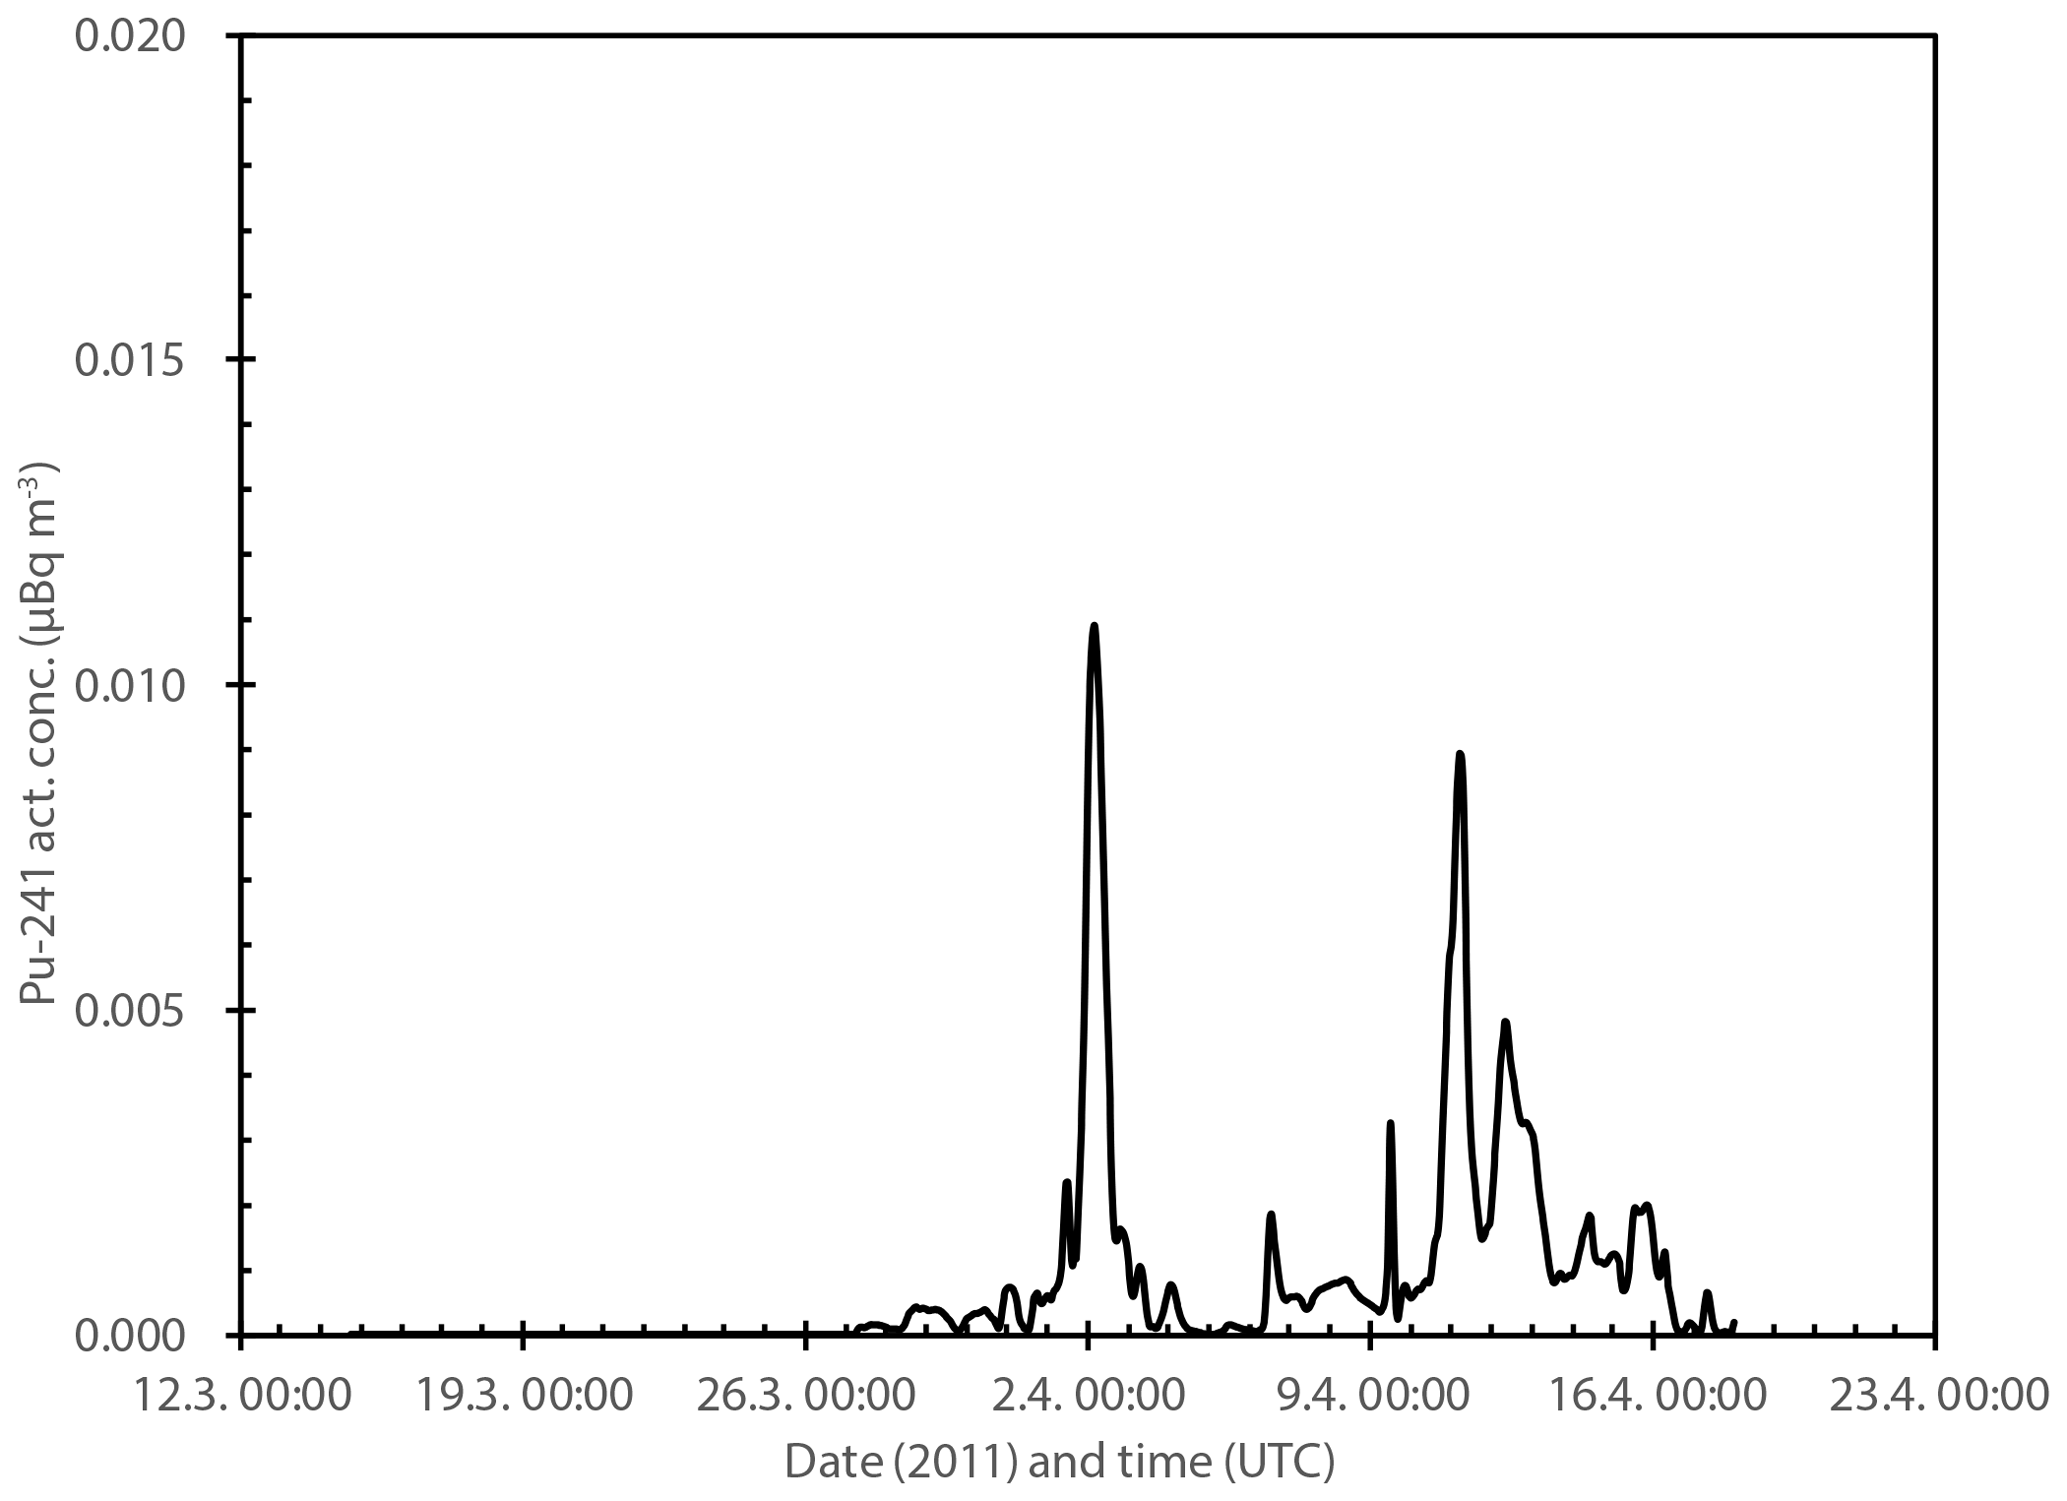
Figure 9Modeled hourly 241Pu activity concentration (µBq m−3) in the surface air of Rovaniemi in March–April 2011.
Based on the activity concentrations of , hardly any refractory elements from the exploded Chernobyl reactor reached Finnish Lapland in 1986. Previously Chernobyl-derived 137Cs, a more volatile isotope, has been detected from the same air filter samples, whereas there was no increased concentration of 90Sr in the samples after March 1986. The influence from the Fukushima Daiichi accident has seen an increased concentration of 241Pu in the air filters. Nuclear-weapon testing in the 1950s and 1960s, later nuclear tests on 1973–1980, the SNAP-9A satellite accident in 1964, and the Fukushima accident in 2011 have been the main sources of Pu in the surface air in Finnish Lapland during 1965–2011.
Overall, the mass ratio of 240Pu∕239Pu is a more sensitive contamination source indicator than the activity ratios of or because of the lower detection limit of ICP-MS, compared with alpha spectrometry and LSC. However, it is always useful to analyze more than one isotope ratio or activity ratio and single isotope concentrations when characterizing the origin of Pu contamination. In this case, the contribution of the Fukushima accident in Rovaniemi would not have been observed without analyzing the concentration of 241Pu in the air filter samples.
Dispersion modeling results with the atmospheric-dispersion model SILAM indicate that Pu contamination in northern Finland would be negligible due to a hypothetical accident in a floating nuclear reactor at the Shtokman natural gas field in the Barents Sea. The Pu contamination risk would be higher in the event of a severe accident at the intended nuclear power plant at Pyhäjoki, western Finland, due to the larger, closer reactor. The modeling of the Fukushima case demonstrated the importance of accurate source term data for predicting the activity concentrations of the radionuclides in the air following an atmospheric release of radioactivity.
Data will be available in the University of Helsinki open-data system (https://www.helsinki.fi/en/researchgroups/radioecology, last access: 12 May 2020).
SSP performed radiochemical analysis and data analysis. JV produced SILAM calculations. JP provided the air filter sampling and sampling data and planned the accident scenarios. All authors contributed to the writing of the paper.
The authors declare that they have no conflict of interest.
We acknowledge Emil Pesonen's help in cutting the air filter samples before ashing and Ilia Rodushkin's (ALS Scandinavia Luleå laboratory) help in measuring the Pu samples with ICP-MS. This is associated with the “Collaboration Network on EuroArctic Environmental Radiation Protection and Research (CEEPRA)”. The project was funded by the EU Kolarctic ENPI CBC 2007–2013 program managed by the Regional Council of Lapland. The authors would like to thank the EU project “TOXI Triage” (project ID 653409) for additional support.
This research has been supported by the H2020 Future and Emerging Technologies (TOXI-triage; grant no. 653409) and the EU Kolarctic ENPI CBC 2007–2013 program (CEEPRA).
Open access funding provided by Helsinki University Library.
This paper was edited by Manvendra K. Dubey and reviewed by two anonymous referees.
Beasley, T. M., Kelley, J. M., Maiti, T. C., and Bond, L. A.: 237Np∕239Pu Atom Ratios in Integrated Global Fallout: a Reassessment of the Production of 237Np, J. Environ. Radioactiv., 38, 133–146, https://doi.org/10.1016/S0265-931X(97)00033-7, 1998.
Bossew, P., Lettner, H., Hubmer, A., Erlinger, C., and Gastberger, M.: Activity ratios of 137Cs, 90Sr and 239+240Pu in environmental samples, J. Environ. Radioactiv., 97, 5–19, https://doi.org/10.1016/j.jenvrad.2007.02.008, 2007.
Bunzl, K. and Kracke, W.: Cumulative deposition of 137Cs, 238Pu, 239+240Pu and 241Am from global fallout in soils from forest, grassland and arable land in Bavaria (FRG), J. Environ. Radioactiv., 8, 1–14, https://doi.org/10.1016/0265-931X(88)90010-0, 1998.
Dunne, J. A., Martin, P. G., Yamashiki, Y., Ang, I. X. Y., Scott, T. B., and Richards, D. A.: Spatial pattern of plutonium and radiocaesium contamination released during the Fukushima Daiichi nuclear power plant disaster, Sci. Rep.-UK, 8, 16799, https://doi.org/10.1038/s41598-018-34302-0, 2018.
Fabian, P., Libby, W. F., and Palmer, C. E.: Stratospheric Residence Time and Interhemispheric Mixing of Strontium 90 from Fallout in Rain, J. Geophys. Res., 73, 3611–3616, https://doi.org/10.1029/JB073i012p03611, 1968.
Holm, E. and Persson, R. B. R.: Fall-out plutonium in Swedish reindeer lichens, Health. Phys., 29, 43–51, https://doi.org/10.1097/00004032-197507000-00005, 1975.
Holm, E., Rioseco, J., and Pettersson, H.: Fallout of transuranium elements following the Chernobyl accident, J. Radioanal. Nucl. Ch., 156, 183–200, https://doi.org/10.1007/BF02037433, 1992.
Igarashi, J., Zheng, J., Zhang, Z., Ninomiya, K., Satou, Y., Fukuda, M., Ni, Y., Aono, T., and Shinohara, A.: First determination of Pu isotopes (239Pu, 240Pu and 241Pu) in radioactive particles derived from Fukushima Daiichi Nuclear Power Plant accident, Sci. Rep.-UK, 9, 11807, https://doi.org/10.1038/s41598-019-48210-4, 2019.
Irlweck, K. and Khademi, B.: 239(240),238Pu, 90Sr, 103Ru and 137Cs concentrations in surface air in Austria due to dispersion of Chernobyl releases over Europe, J. Environ. Radioactiv., 20, 133–148, https://doi.org/10.1016/0265-931X(93)90038-9, 1993.
Jaakkola, T., Harva, K., Keinonen, M., and Hakanen, M.: Studies on behavior of transuranic elements in plants, in: Radioactive foodchains in the subarctic environment, Contract EY-76-C-02-3011.A002 of the US DOE, Report C-02-3011, 92–104, U.S. Department of Energy, Helsinki, 1978.
Jaakkola, T., Mussalo, H., and Tiainen, S.: Plutonium in the Helsinki air during 1962–1977, in: Radioactive foodchains in the subarctic environment, Contract EY-76-C-02-3011.A003 of the US DOE, Report C-02-3011, 60–67, U.S. Department of Energy, Helsinki, 1979.
Jaakkola, T., Suutarinen, R., and Paatero, J.: Transuraanialkuaineiden esiintyminen ympäristössä, Report Series in Aerosol Science, 2, 31–32, Finnish Association for Aerosol Research, Helsinki, 1986 (in Finnish).
Lujanienė, G., Byčenkienė, S., Povinec, P. P., and Gera, M.: Radionuclides from the Fukushima accident in the air over Lithuania: measurement and modelling approaches, J. Environ. Radioactiv., 114, 71–80, https://doi.org/10.1016/j.jenvrad.2011.12.004, 2012.
Mietelski, J. W., Dorda, J., and Was, B.: Pu-241 in samples of forest soil from Poland, Appl. Radiat. Isotopes, 51, 435–447, https://doi.org/10.1016/S0969-8043(99)00055-X, 1999.
Muramatsu, Y., Rühm, W., Yoshida, S., Tagami, K., Uchida, S., and Wirth, E.: Concentrations of 239Pu and 240Pu and Their Isotopic Ratios Determined by ICP-MS in Soils Collected from the Chernobyl 30-km Zone, Environ. Sci. Technol., 34, 2913–2917, https://doi.org/10.1021/es0008968, 2000.
Nishihara, K., Iwamoto, H., and Suyama, K.: Estimation of Fuel Compositions in Fukushima-Daiichi Nuclear Power Plant, JAEA-Data/Code 2012-018, 1–190, https://doi.org/10.11484/jaea-data-code-2012-018, Japan Atomic Energy Agency, Tokai-mura, Japan, 2012 (in Japanese).
Paatero, J., Jaakkola, T., and Reponen, A.: Determination of the 241Pu Deposition in Finland after the Chernobyl Accident, Radiochim. Acta, 64, 139–144, https://doi.org/10.1524/ract.1994.64.2.139, 1994.
Paatero, J., Vira, J., Siitari-Kauppi, M., Hatakka, J., Holmen, K., and Viisanen, Y.: Airborne fission products in the high Arctic after the Fukushima nuclear accident, J. Environ. Radioactiv., 114, 41–47, https://doi.org/10.1016/j.jenvrad.2011.12.027, 2012.
Paatero, J., Vira, J., Salminen-Paatero, S., Ryyppö, T., Bartnicki, J., Klein, H., and Leppänen, A.-P.: Atmospheric Transport of Radionuclides Following Hypothetical Reactor Accidents, Finnish Meteorological Institute Reports 8, 1–30, Finnish Meteorological Institute, Helsinki, 2014.
Perkins, R. W. and Thomas, C. W.: Worldwide fallout, in: Transuranic elements in the environment, edited by: Hanson, W. C., Technical Information Center, U.S. Department of Energy, Springfield, 53–82, 1980.
Reistad, O. and Ølgaard, P. L.: Inventory and Source Term Evaluation of Russian Nuclear Power Plants for Marine Applications, NKS-139, Nordic nuclear safety research, Roskilde, Denmark, 71 pp., 2006.
Salminen, S. and Paatero, J.: Concentrations of 238Pu, 239+240Pu and 241Pu in the surface air in Finnish Lapland in 1963, Boreal Environ. Res., 14, 827–836, 2009.
Salminen-Paatero, S. and Paatero, J.: Total beta activity, 137Cs and 90Sr in surface air in northern Finland in 1963, Radiochim. Acta, 100, 801–808, https://doi.org/10.1524/ract.2012.1947, 2012.
Salminen-Paatero, S. and Paatero, J.: Separation method for Pu, Am and Sr in large air filter sample sets, MethodsX, https://doi.org/10.1016/j.mex.2020.100910, online first, 2020.
Salminen-Paatero, S., Nygren, U., and Paatero, J.: Pu-240/Pu-239 mass ratio in environmental samples in Finland, J. Environ. Radioactiv., 113, 163–170, https://doi.org/10.1016/j.jenvrad.2012.06.005, 2012.
Salminen-Paatero, S., Thölix, L., Kivi, R., and Paatero, J.: Nuclear contamination sources in surface air of Finnish Lapland in 1965–2011 studied by means of 137Cs, 90Sr, and total beta activity, Environ. Sci. Pollut. R., 26, 21511–21523, https://doi.org/10.1007/s11356-019-05451-0, 2019.
Saxén, R., Taipale, T. K., and Aaltonen, H.: Radioactivity of wet and dry deposition and soil in Finland after the Chernobyl accident in 1986, STUK-A57, Finnish Centre for Radiation and Nuclear Safety, Helsinki, 1987.
Shinonaga, T., Steier, P., Lagos, M., and Ohkura, T.: Airborne Plutonium and Non-Natural Uranium from the Fukushima DNPP Found at 120 km Distance a Few Days after Reactor Hydrogen Explosions, Environ. Sci. Technol., 48, 3808–3814, https://doi.org/10.1021/es404961w, 2014.
Sofiev, M., Siljamo, P., Valkama, I., Ilvonen, M., and Kukkonen, J.: A dispersion modelling system SILAM and its evaluation against ETEX data, Atmos. Environ., 40, 674–685, https://doi.org/10.1016/j.atmosenv.2005.09.069, 2006.
Sofiev, M., Galperin, M., and Genikhovich, E.: A construction and Evaluation of Eulerian Dynamic Core for the Air Quality and Emergency Modelling System SILAM, in: Air Pollution Modeling and Its Application XIX, edited by: Borrego, C. and Miranda, A. I., Springer, Dordrecht, the Netherlands, 699–701, https://doi.org/10.1007/978-1-4020-8453-9, 2008.
Thakur, P., Khaing, H., and Salminen-Paatero, S.: Plutonium in the atmosphere: A global perspective, J. Environ. Radioactiv., 175–176, 39–51, https://doi.org/10.1016/j.jenvrad.2017.04.008, 2017.
UNSCEAR: United Nations Scientific Committee on the Effects of Atomic Radiation, Report, Vol. II, Sources and Effects of Ionizing Radiation, p. 519, Annex J., New York, USA, 2000.
Zheng, J., Tagami, K., Watanabe, Y., Uchida, S., Aono, T., Ishii, N., Yoshida, S., Kubota, Y., Fuma, S., and Ihara, S.: Isotopic evidence of plutonium release into the environment from the Fukushima DNPP accident, Sci. Rep.-UK, 2, 304, https://doi.org/10.1038/srep00304, 2012.