the Creative Commons Attribution 4.0 License.
the Creative Commons Attribution 4.0 License.
 | 13 May 2020
Shipborne observations reveal contrasting Arctic marine, Arctic terrestrial and Pacific marine aerosol properties
Jiyeon Park
Manuel Dall'Osto
Kihong Park
Yeontae Gim
Hyo Jin Kang
Eunho Jang
Ki-Tae Park
Minsu Park
Seong Soo Yum
Jinyoung Jung
Bang Yong Lee
Young Jun Yoon
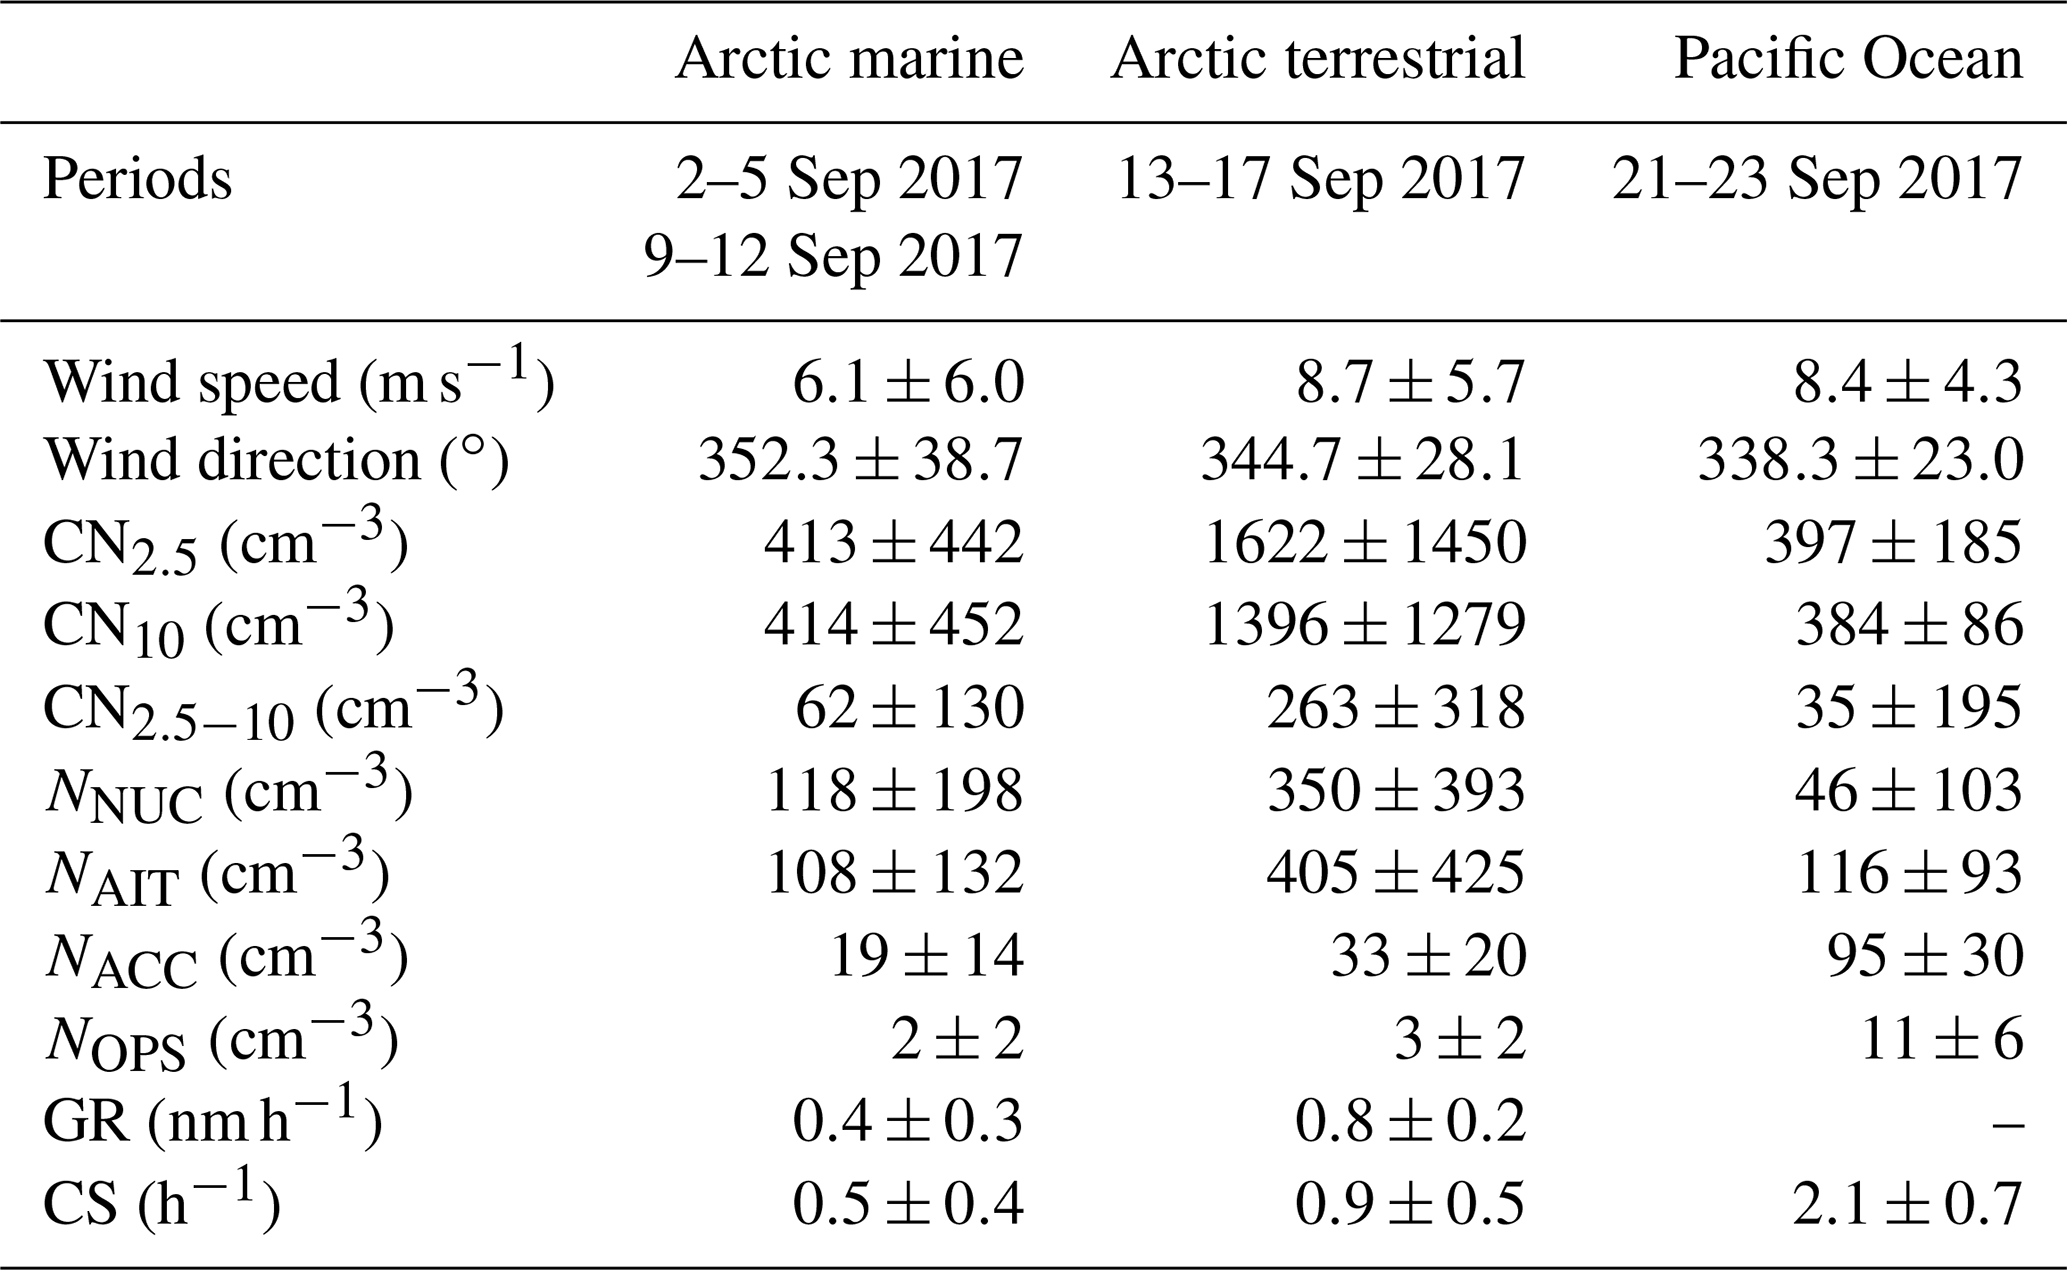
There are few shipborne observations addressing the factors influencing the relationships of the formation and growth of aerosol particles with cloud condensation nuclei (CCN) in remote marine environments. In this study, the physical properties of aerosol particles throughout the Arctic Ocean and Pacific Ocean were measured aboard the Korean icebreaker R/V Araon during the summer of 2017 for 25 d. A number of new particle formation (NPF) events and growth were frequently observed in both Arctic terrestrial and Arctic marine air masses. By striking contrast, NPF events were not detected in Pacific marine air masses. Three major aerosol categories are therefore discussed: (1) Arctic marine (aerosol number concentration CN2.5: 413±442 cm−3), (2) Arctic terrestrial (CN2.5: 1622±1450 cm−3) and (3) Pacific marine (CN2.5: 397±185 cm−3), following air mass back-trajectory analysis. A major conclusion of this study is not only that the Arctic Ocean is a major source of secondary aerosol formation relative to the Pacific Ocean but also that open-ocean sympagic and terrestrially influenced coastal ecosystems both contribute to shaping aerosol size distributions. We suggest that terrestrial ecosystems – including river outflows and tundra – strongly affect aerosol emissions in the Arctic coastal areas, possibly more than anthropogenic Arctic emissions. The increased river discharge, tundra emissions and melting sea ice should be considered in future Arctic atmospheric composition and climate simulations. The average CCN concentrations at a supersaturation ratios of 0.4 % were 35±40 cm−3, 71±47 cm−3 and 204±87 cm−3 for Arctic marine, Arctic terrestrial and Pacific marine aerosol categories, respectively. Our results aim to help evaluate how anthropogenic and natural atmospheric sources and processes affect the aerosol composition and cloud properties.
- Article
(4199 KB) - Full-text XML
-
Supplement
(1035 KB) - BibTeX
- EndNote


The climate change experienced in the Arctic is more rapid than that occurring at mid-latitudes in a phenomenon known as Arctic amplification (ACIA, 2005). In the warming Arctic, the extent and thickness of sea ice have dramatically decreased over the past few decades (Stroeve et al., 2012). It has been estimated that the Arctic may seasonally become sea-ice-free in the next 30 years (Wang and Overland, 2009). Aerosol particles in the atmosphere are a major driver of the Arctic climate (IPCC, 2013), as they directly affect the climate through scattering and absorbing solar radiation (Stier et al., 2007) and indirectly affect the climate by modifying the formation, properties and lifetimes of clouds (Twomey, 1974). These direct and indirect effects are the leading uncertainty in current climate predictions. New particle formation (NPF), a predominant source of atmospheric particles, occurs through the formation of nanometre-sized molecular clusters ( nm; i.e. nucleation) and their subsequent growth into aerosol particles of a few nanometres (∼1–10 nm) and larger ( nm; Kulmala et al., 2004; Zhang et al., 2012). NPF can significantly increase the number of aerosol particles in the atmosphere. During summer, the Arctic is more isolated from anthropogenic influences (Arctic haze) and experiences comparatively pristine background aerosol conditions (Heintzenberg et al., 2015; Law and Stohl, 2007). As the number concentrations of particles in the Arctic during summer are very low (of the order of ∼102 cm−3; Merikanto et al., 2009), the physicochemical properties of aerosol particles in the Arctic atmosphere are highly sensitive to NPF.
NPF events have been frequently observed within a wide range of environmental conditions at various Arctic locations, such as Zeppelin (Tunved et al., 2013; Croft et al., 2016; Heintzenberg et al., 2017), Tiksi (Asmi et al., 2016), Alert (Croft et al., 2016), Station Nord (Nguyen et al., 2016) and Utqiaġvik (formerly Barrow; Kolesar et al., 2017), and from limited ship-based observations (Chang et al., 2011; Kim et al., 2015; Heintzenberg et al., 2015). The formation and growth of particles in the Arctic atmosphere are strongly influenced by marine, coastal, marginal ice and/or anthropogenic sources. Oceanic dimethyl sulfide (DMS) and other volatile organic precursors (such as isoprene, monoterpenes and amines) play important roles in the formation and growth of new particles in the Arctic (Leaitch et al., 2013; Willis et al., 2016; Park et al., 2017; Abbatt et al., 2019; Mungall et al., 2016). In addition, iodine oxides significantly contribute to NPF in marine and coastal Arctic environments, owing to emissions from marine microalgae at low tide or snowpack photochemistry in ice- and snow-covered regions (Allan et al., 2015; O'Dowd et al., 2002; Raso et al., 2017). Biogenic gaseous precursors released by the melting Arctic sea-ice margins have also been associated with NPF (Dall-Osto et al., 2017; Willis et al., 2018). Recent studies in Alaska have indicated that the formation and growth of particles are influenced by emissions from oil and gas extraction activities in Prudhoe Bay (Gunsch et al., 2017; Kolesar et al., 2017). Although several observations have been made in the Arctic under different environmental conditions (Burkart et al., 2017b; Collins et al., 2017), there are few detailed size distribution analyses of particle formation and growth events within the Arctic marine environment.
Several studies have attempted to investigate the impacts of NPF on the concentrations of cloud condensation nuclei (CCN; Willis et al., 2016; Burkart et al., 2017b; Collins et al., 2017). Model-based studies have predicted that a large fraction of CCN (up to 78 % of CCN at a 0.2 % supersaturation) in the global atmosphere results from atmospheric NPF and growth (Merikanto et al., 2009; Westervelt et al., 2014; Spracklen et al., 2008). Field observations have also observed substantial increases in the concentrations of CCN due to atmospheric nucleation in various environments (Pierce et al., 2012; Kalivitis et al., 2015; Burkart et al., 2017b; Collins et al., 2017; Kim et al., 2019). Several examples of an increase in the CCN concentration after a few hours from the beginning of NPF events were presented by Burkart et al. (2017b) in the summer marine Arctic during the 2014 NETCARE Amundsen icebreaker campaign, by Kim et al. (2019) at King Sejong Station on the Antarctic Peninsula, by Pierce et al. (2012) in a forested mountain valley in western Canada and by Willis et al. (2016) in an Arctic aircraft campaign in Nunavut, Canada. However, due to the infrequency of aerosol measurements collected aboard icebreakers, very few studies have measured the simultaneous aerosol size distribution and CCN concentrations over the Arctic Ocean.
In this study, the physical characteristics of aerosol particles over the Arctic and Pacific oceans were investigated between 31 August and 24 September 2017, using aerosol-particle-monitoring instruments installed on the Korean icebreaker R/V Araon. Data of the aerosol size distribution and the concentrations of the total aerosol number (CN), black carbon (BC) and CCN were continuously collected using various aerosol instruments. The main aims of this study were to (1) investigate the frequency and characteristics of NPF and particle growth over the Arctic and Pacific oceans, (2) determine the major sources that are associated with NPF based on air mass back trajectory analysis, and (3) explore the potential contribution of NPF to the CCN concentrations in the remote marine environment.
2.1 Study area and ship tracks
Ambient atmospheric aerosol measurements were collected over the Arctic and Pacific oceans aboard the icebreaker R/V Araon, operated by the Korea Polar Research Institute (KOPRI), South Korea. The ship's track is presented in Fig. 1. The cruises covered two main areas: the Arctic Ocean (including both Beaufort and Chukchi seas) and the remote northwestern Pacific Ocean. The ship departed from Utqiaġvik, USA, on 28 August 2017, crossed the Beaufort (29 August–13 September 2017) and Chukchi seas (15 September 2017), and reached Nome, USA, on 16 September 2017. The Beaufort Sea extends across the northern coasts of Alaska and the Northwest Territories of Canada. After completing the Arctic survey, the ship departed from Nome, USA, on 18 September 2017; crossed the Bering Sea, Sea of Okhotsk and East Sea; and reached Busan, South Korea, on 28 September 2017.
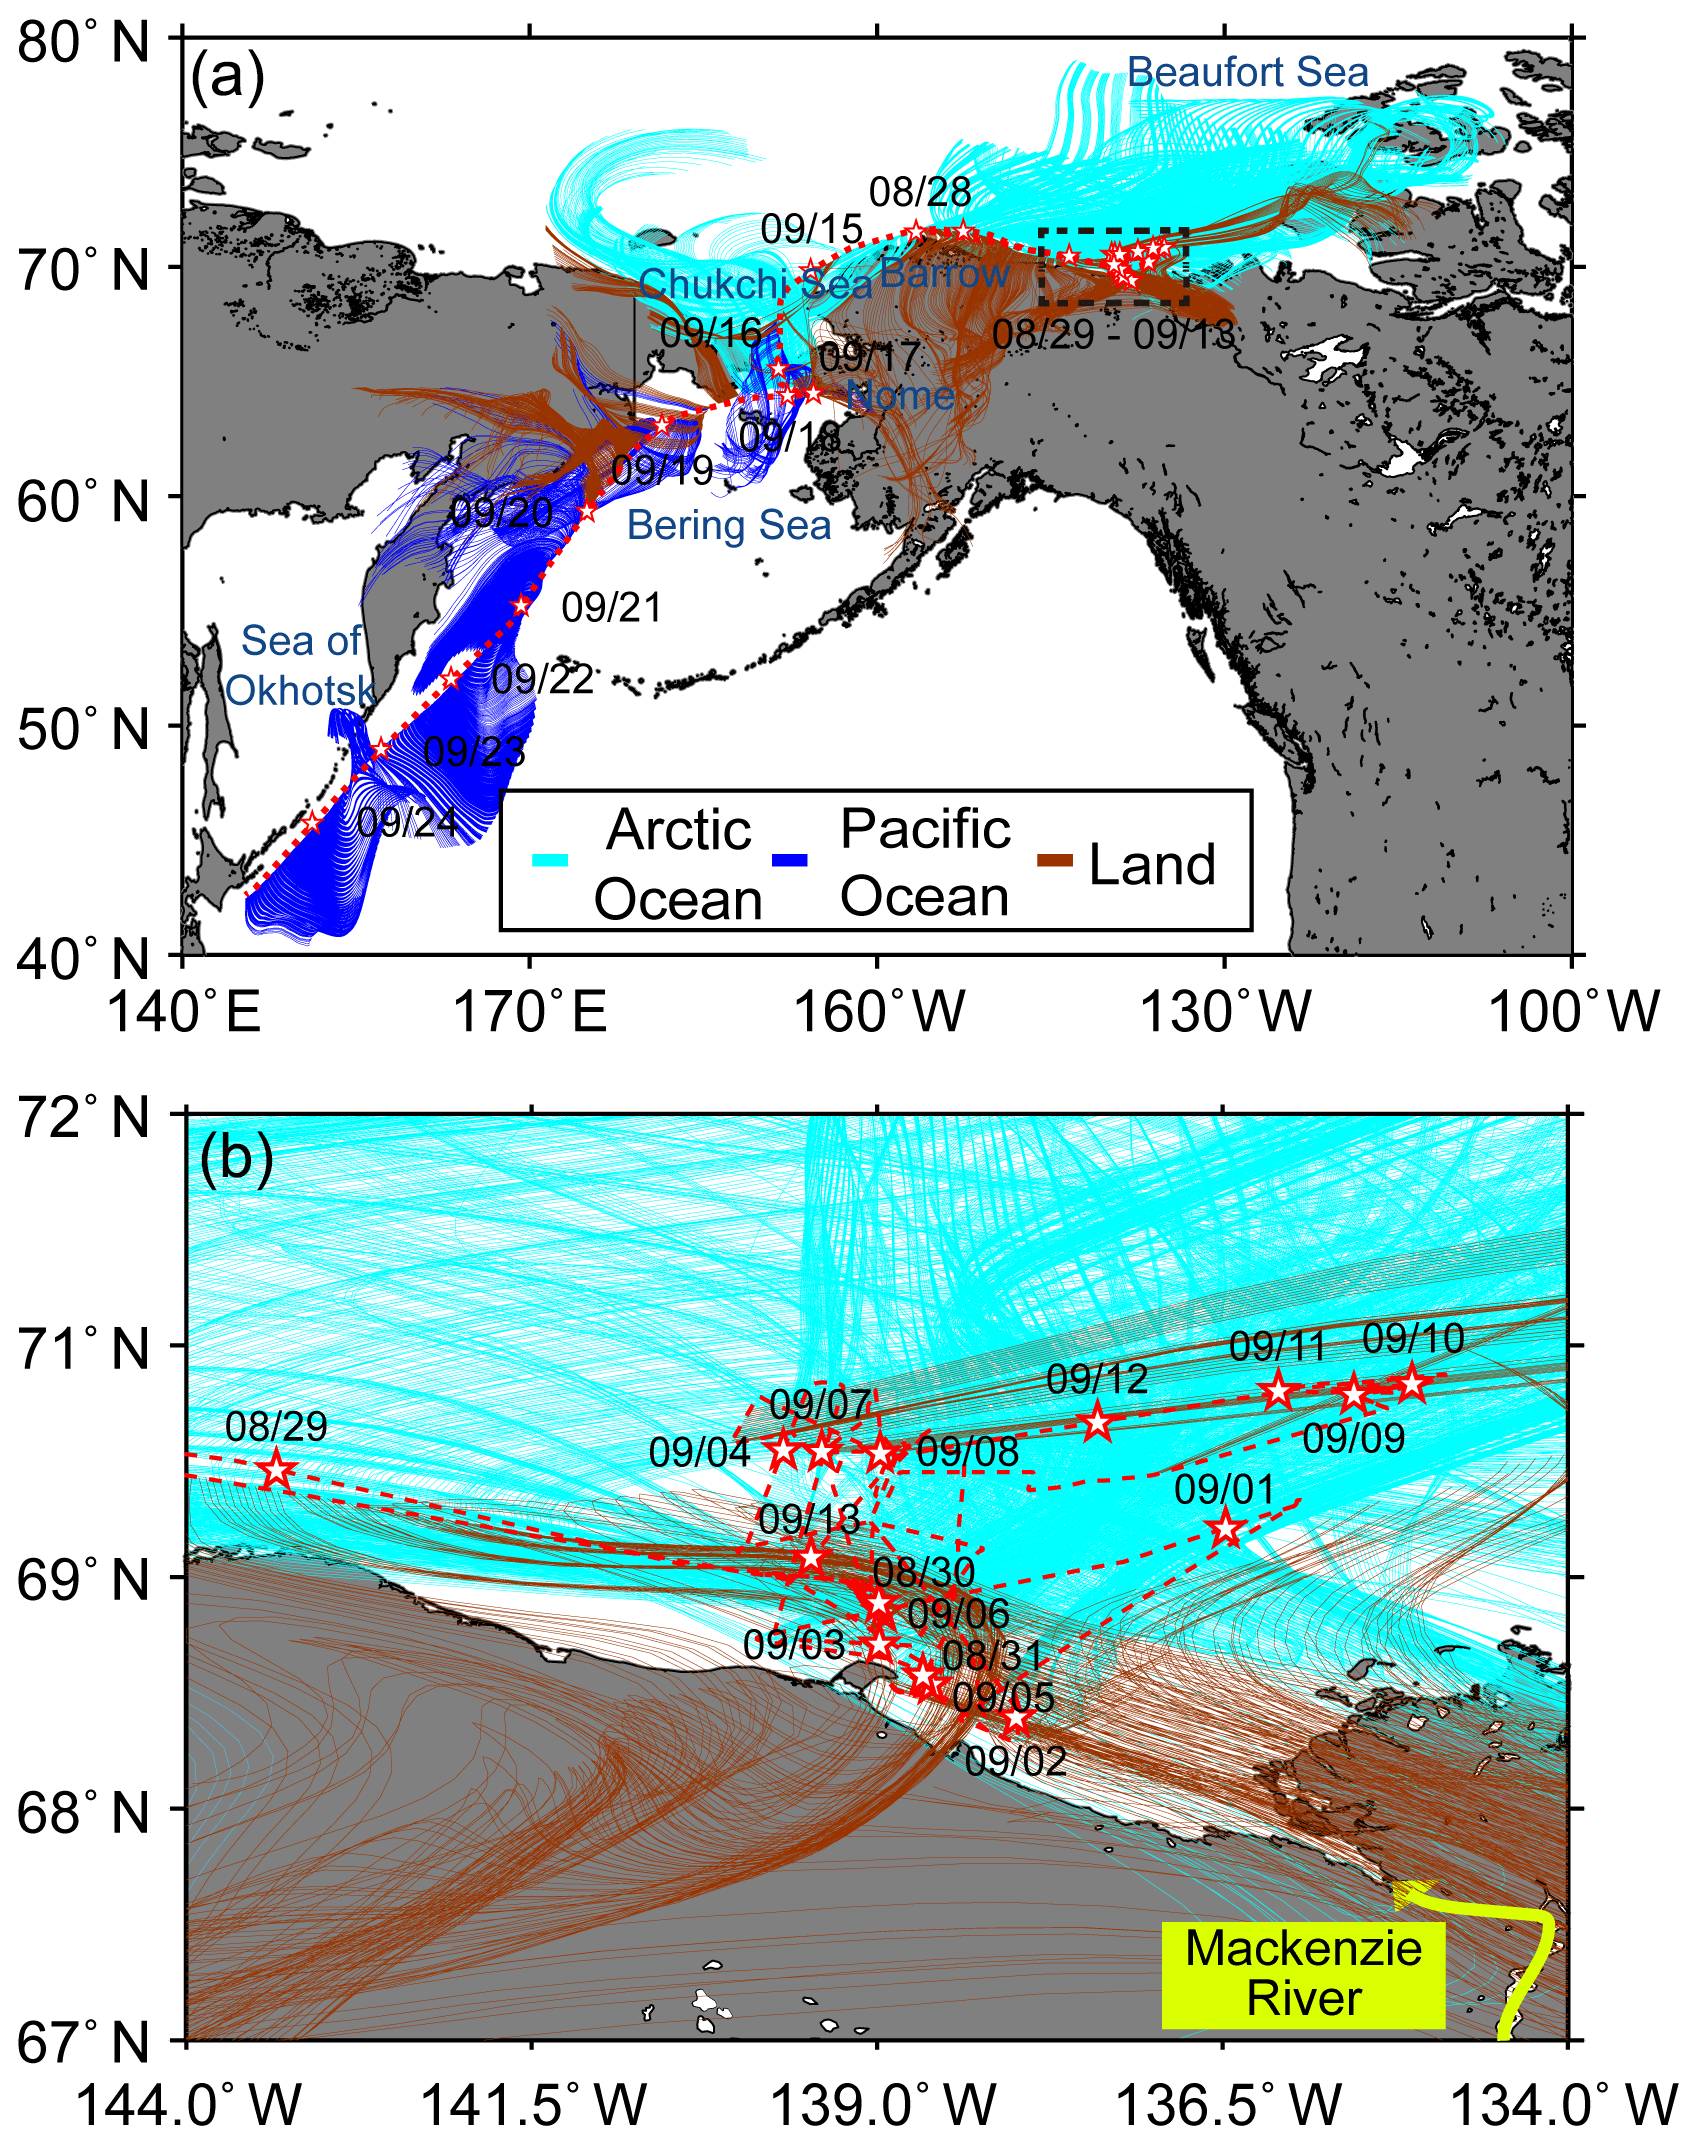
Figure 1Ship tracks across (a) the Arctic (28 August 2017–18 September 2017) and Pacific oceans (18–25 September 2017) and (b) zoomed-in view of the dotted black square region in Fig. 1a. A dotted red line including star symbols represents ship tracks during the entire cruise. The star symbols represent the daily ship location at midnight. Light blue, blue and brown lines denote the 2 d air mass trajectories categorised into three main domains, Arctic Ocean, Pacific Ocean and land, respectively.
2.2 Atmospheric aerosol measurements
The aerosol sampling inlet was placed on the front deck of the ship (13 m a.s.l.), ahead of the ship's engines, to avoid any influences from the emissions of the ship's exhaust. In addition, kitchen ventilation systems were connected by a plastic cylindrical pipe (∼15 m length) and moved back onto the deck (far away from the sampling inlet) to minimise the potential effects of cooking emissions on the atmospheric measurements during the sampling periods. Aerosols were sampled through a stainless-steel tube (inner diameter of 1∕4 in. and length of ∼1 m), which was connected to the various instruments by electrically conductive tubing to minimise particle losses in the sampling line.
The physical properties of the aerosols were measured with various aerosol instruments, including two condensation particle counters (TSI 3776 CPC and TSI 3772 CPC), two scanning mobility particle sizers (SMPSs), an optical particle sizer (OPS), an aethalometer and a cloud condensation nuclei counter (CCNC). The TSI 3776 CPC and TSI 3772 CPC measured the total number concentrations of particles larger than 2.5 and 10 nm every 1 s, respectively. The aerosol sample flow rates of TSI 3776 CPC and TSI 3776 CPC were 1.5 and 1.0 L min−1, respectively. The number size distributions of the particles were measured using the nano-SMPS every 3 min (differential mobility analyser – DMA: TSI 3085; CPC: TSI 3776), covering a size range of 3 to 63.8 nm, and the standard SMPS (DMA: TSI 3081; CPC: TSI 3772) every 3 min, covering a size range of 10 to 300 nm. The aerosol and sheath flow rates of the nano-SMPS were 1.5 and 15 L min−1, respectively, and those of the standard SMPS were 1.0 and 10 L min−1, respectively. An OPS (TSI 3330) was used to determine the size distribution of particles in the range of 100 nm to 10 µm diameter with a sample flow rate of 1.0 L min−1 every 3 min. The BC concentration was measured using an aethalometer (AE22, Magee Scientific Co., USA) with a 5 min time resolution to assess the influence of anthropogenic sources (such as local pollution and ship emissions). The instrument uses the absorption of light at a wavelength of 880 nm by the ambient aerosols collected on a quartz filter tape to determine the BC concentration. The flow rate through a sharp-cut 2.5 µm cyclone (BGI, Inc., USA) was set to 5 L min−1, and the integration time was 5 min. The Droplet Measurement Technologies CCN counter (DMT CCN-100) was operated to measure the CCN number concentrations. The total flow rate in the CCN counter was 0.5 L min−1, and the counter was operated at five different supersaturation (SS) ratios (0.2 %, 0.4 %, 0.6 %, 0.8 % and 1.0 %) every 30 min. The sample and sheath flow rates of the CCN counter were 0.05 and 0.45 L min−1, respectively.
2.3 Identification of ship exhaust
To obtain a data set that reflects background aerosol loading, measurement data affected by the exhaust emissions of the ship's engine should be excluded prior to further data analysis. For this, aerosol data were filtered based on the BC concentration, wind direction, wind speed and total particle number concentration. The data with the following properties were discarded: (1) BC concentrations exceeding 100 ng m−3, (2) relative wind direction against the ship's heading between 110 and 260∘, as this originates directly from the ship's exhaust, (3) relative wind speed lower than 2 m s−1, as air masses under a calm environment could become contaminated due to local turbulence, and (4) the total particle number concentrations that were particularly high (spike) and varied dramatically in a short time. Ship plumes were clearly observed in the data collected during the campaign. The data collected when total aerosol number concentrations were higher than 8000 cm−3 were removed. In addition, the CPC and SMPS data were removed for the time periods when total aerosol number concentrations suddenly increased to more than 2 times higher than the background values. Typically, the ship exhaust differs from the NPF events, as the enhanced number concentration during the NPF events lasted for at least an hour with a low BC concentration (Ehn et al., 2010).
2.4 Backward air mass trajectory and satellite observations
The air mass back trajectories were analysed using Version 4 of the Hybrid Single-Particle Lagrangian Integrated Trajectory (HYSPLIT) model (http://ready. arl.noaa.gov/, last access: 12 November 2019) to examine their relationships with the physical characteristics of aerosol particles. The 2 d air mass back trajectories (48 h) were determined at hourly intervals from the ship's position at an arrival height of 50 m to estimate the transport history of the air masses arriving at the observation site (Park et al., 2018). The potential origins of the aerosols were divided into three categories based on the retention time of the 2 d back trajectories over the three major domains: the Arctic Ocean (including the Beaufort and Chukchi seas and sea-ice region), Pacific Ocean (including the Bering Sea and Sea of Okhotsk) and land (including Alaska and the eastern part of Siberia; Fig. 1). The phytoplankton biomass was obtained by calculating the chlorophyll-a concentration from the Level-3 product of Aqua Moderate Resolution Imaging Spectroradiometer at a 4 km resolution (Fig. S1 in the Supplement). Geographical information over the ocean, land and sea-ice was obtained from the sea-ice index, which was provided by the National Snow and Ice Data Center (NSIDC; Fig. S2). Note that the sea-ice extent was defined as the area with an ice concentration of ≥15 % (Pang et al., 2018). Air masses that intensively passed over the Beaufort and Chukchi seas and sea-ice region were categorised as air masses originating from the Atlantic Ocean (i.e. >50 % retention over the ocean >65∘ N and sea-ice region). Air masses that intensively passed over northern Alaska and eastern Siberia were potentially affected by the Arctic tundra and categorised as air masses originating from land (i.e. >50 % retention over the land domain). Finally, air masses that travelled through the Bering Sea and Sea of Okhotsk were categorised as air masses originating from the Pacific Ocean domain (i.e. >50 % retention over the ocean domain <65∘ N).
2.5 Oceanic measurements
To examine the influence of oceanic conditions on NPF and growth, seawater samples were collected from sea surface at a depth of ∼1 m by Niskin bottles. The sampling locations and methods have been described previously in more detail (Park et al., 2019). In brief, concentrations of dissolved organic carbon (DOC) were measured with a Shimadzu TOC-V high-temperature combustion total organic carbon analyser. To identify the source and composition of DOC in surface seawater, three-dimensional excitation–emission matrices (EEMs) were scanned using a fluorescence spectrometer (Varian, USA). The excitation wavelength range (EX) was between 250 and 500 nm, and that of emission (EM) was between 280 and 600 nm. In this study, the four major fluorescent components were classified into four groups: the terrestrial–humic-substance peak (A) (EX: 260 nm; EM: 380–460 nm), the terrestrial–fulvic-substance peak (C) (EX: 350 nm; EM: 420–480 nm), the marine–fulvic-substance peak (M) (EX: 312 nm; EM: 380–420 nm) and the proteinaceous peak (T) (EX: 275 nm; EM: 340 nm; Coble, 2007).
3.1 Overall particle number concentrations
Figure 2a presents a time series of the 1 h average total particle number concentration (CN) measured using TSI 3776 CPC and TSI 3772 CPC throughout the sampling periods. The number concentration of particles larger than 2.5 nm (CN2.5) or 10 nm (CN10) in the Arctic and Pacific marine environments had a range of approximately 3 orders of magnitude (∼101–103 cm−3). In most cases, the CN2.5 and CN10 concentrations were less than ∼2000 cm−3, with averages of 505±280 and 492±264 cm−3, respectively, which were in agreement with those reported in previous studies conducted at other Arctic stations (Asmi et al., 2016; Burkart et al., 2017a; Freud et al., 2017) and remote marine regions (O'Dowd et al., 2014; Sellegri et al., 2006; Kim et al., 2019; Jang et al., 2019; Yum et al., 1998; Hudson and Yum, 2002). For example, 4 years of observational data from the Arctic Climate Observatory in Tiksi, Russia, showed that the monthly median CN concentration ranged from ∼184 cm−3 in November to ∼724 cm−3 in July (Asmi et al., 2016). Furthermore, Sellegri et al. (2006) reported CN concentrations under clean marine sector conditions at Mace Head of ∼200 cm−3 for January and ∼450 cm−3 for June. Elevated CN2.5 and CN10 concentrations were concentrated over the period from 13 to 20 September, when the ship sailed over the Chukchi and Bering seas. During this period, CN2.5 and CN10 concentrations exceeding ∼2000 cm−3 were frequently observed. The peak concentrations of aerosol particles were notable, as the CN2.5 and CN10 concentrations exceeded ∼6016 and ∼5750 cm−3, respectively.
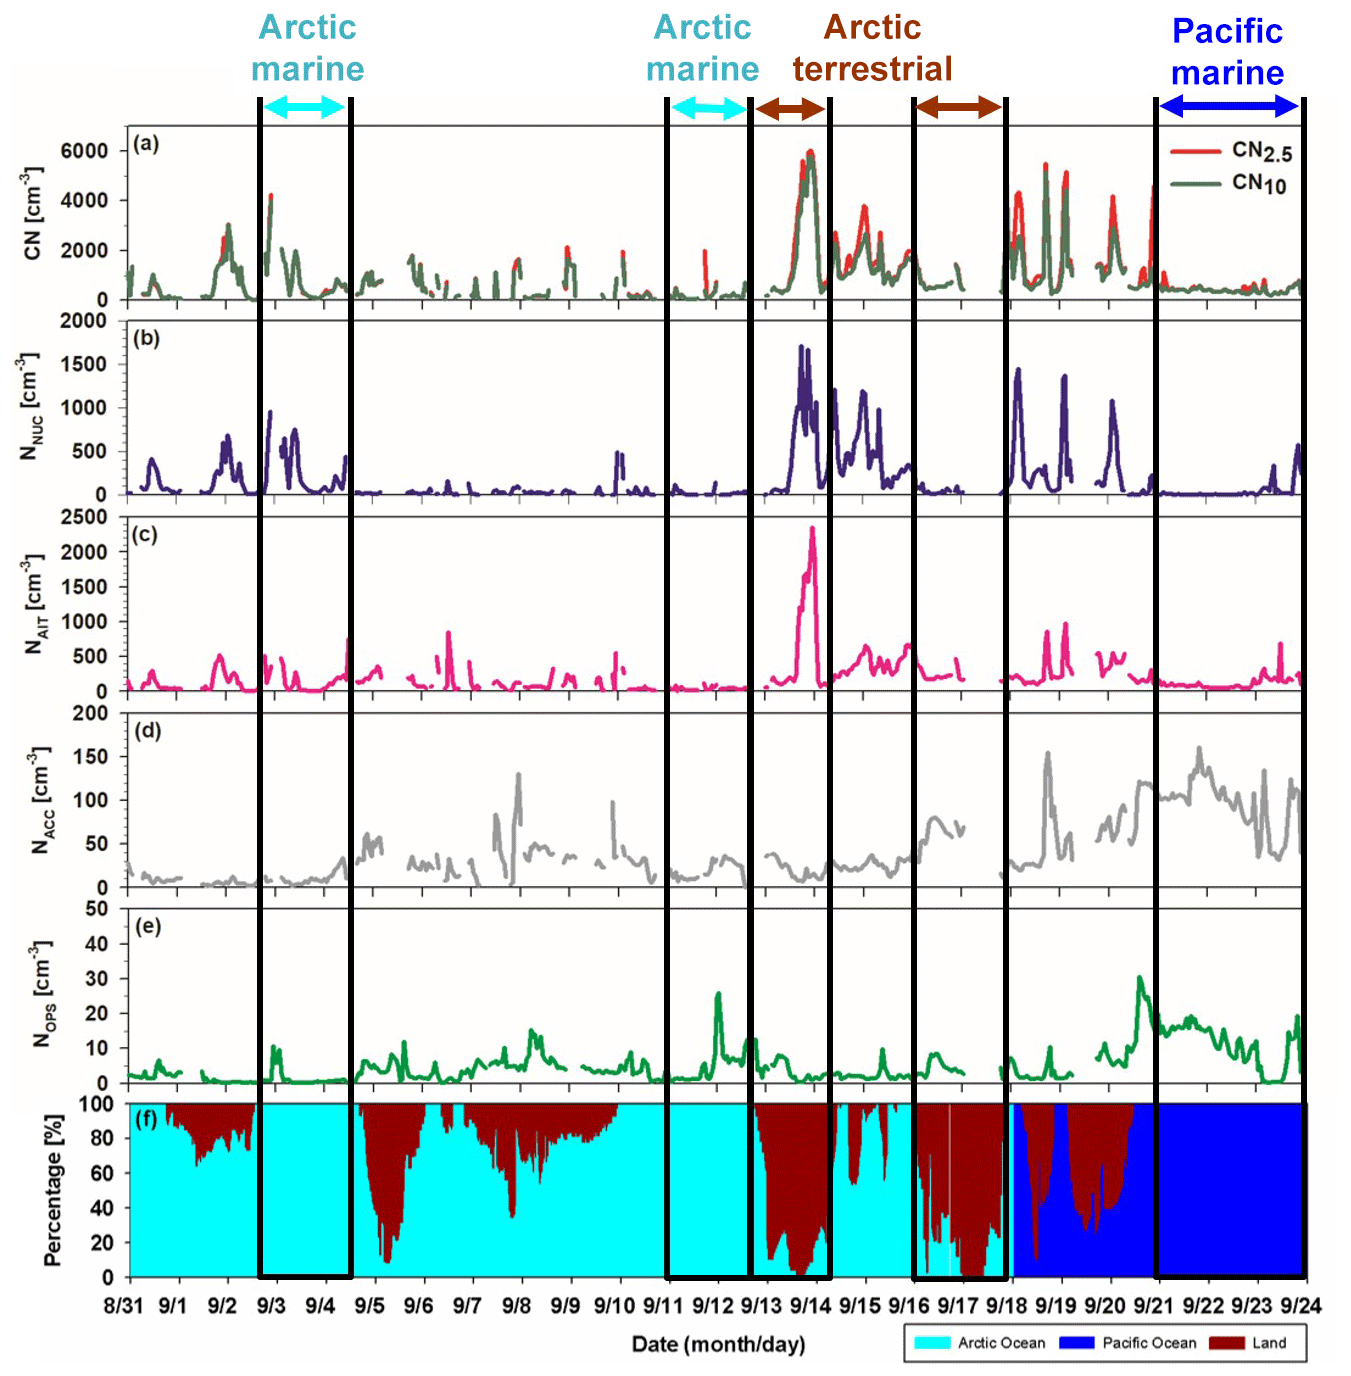
Figure 2Time series of the 1 h average (a) total aerosol (CN2.5 and CN10); (b) nucleation-mode (3–20 nm; NNUC), (c) Aitken-mode (20–100 nm; NAIT), (d) accumulation-mode (100–300 nm; NACC) and (e) coarse-mode (>300 nm from OPS; NOPS) number concentrations; and (f) the residence time of air masses that passed over the Arctic Ocean, Pacific Ocean and land. CN2.5 and CN10 represent total number concentration of particles larger than 2.5 and 10 nm, respectively.
To elucidate further details of the variations in CN2.5 and CN10, the particle size distributions measured with the nano-SMPS, standard SMPS and OPS were divided into four size groups: nucleation (3–20 nm), Aitken (20–100 nm), accumulation (100–300 nm) and coarse (>300 nm from OPS), as shown in Fig. 2b–e. The average number concentrations of the nucleation-mode (NNUC), Aitken-mode (NAIT), accumulation-mode (NACC) and coarse-mode (NOPS) particles were 169±142, 201±131, 40±17 and 4±2 cm−3, respectively. The temporal variations in NNUC and NAIT exhibited a distinct pattern compared to that of NACC and NOPS. Overall, NNUC and NAIT concentrations larger than ∼1000 cm−3 were observed from 13 to 20 September (e.g. the ship sailed over Chukchi and Bering seas), whereas relatively high concentrations of NACC and NOPS were observed from 21 to 23 September (e.g. the ship sailed over Sea of Okhotsk). As shown in Fig. 2b, sudden bursts of nucleation-mode particles occurred frequently, as indicated by a sudden increase in the NNUC concentration rising up to ∼1710 cm−3. Whenever the CN2.5 concentration exceeded ∼2000 cm−3, the NNUC concentration exceeded ∼600 cm−3 (except for the results observed in the evening of 18 September). In addition, the CN2.5 concentration was strongly correlated with the NNUC concentration (r2=0.69; Fig. S3), suggesting that the high CN concentration was mainly derived from nucleation-mode particles. Instances of elevated NNUC occurred along the northern coast of Alaska (13–14 September 2017), throughout the Chukchi Sea (15 September 2017), near Nome and eastern Siberia (16–18 September 2017), and throughout the Bering Sea (19–20 September 2017). During the cruises, the satellite-derived chlorophyll-a concentration data indicated strong biological activity over the Chukchi and Bering seas, as shown in Fig. S1. Thus, the high occurrence of nucleation-mode particles may be related to multiple processes that influence the formation of secondary aerosols (e.g. oceanic biological activities, regional anthropogenic emissions on land – Alaska or eastern Siberia – and terrestrial sources in the tundra ecosystems of Alaska).
3.2 Case studies
As mentioned in Sect. 3.1, significant increases in NNUC were frequently observed during the cruise (Fig. 2b). Typically, NNUC is used to indicate the presence of newly formed particles produced by gas-to-particle conversion (i.e. secondary aerosol formation; Asmi et al., 2016; Burkart et al., 2017a). Here, an NPF event was defined as a sharp increase in the NNUC with elevated CN2.5 that lasted for at least 1 h. Figure 3 presents contour plots of the size distributions measured using the nano-SMPS and standard SMPS. This strong NPF and growth event occurred over the Chukchi and Bering seas, which border the western and northern sides of Alaska, suggesting that there may be a substantial source of precursors in this region. Bursts of the smallest particles at the lowest detectable sizes (∼2.5 nm) were not observed; however, we hypothesise that, during the NPF event, particle formation occurred elsewhere and that subsequent horizontal extension caused the particles to reach the sampling site. Previously, NPF events have been identified on the regional scale in several locations around the world (Kerminen et al., 2018; Németh and Salma, 2014; Tremblay et al., 2019; Vana et al., 2004; Väänänen et al., 2013). For instance, Németh and Salma (2014) found that a nucleating air mass in regional NPF events may originate horizontally as far as several hundreds of kilometres (∼400 or 700 km) away from the sampling site. Tremblay et al. (2019) also concluded that particle nucleation events occurred over spatial scales of at least 500 km during the summertime in the Canadian High Arctic. In this section, case studies are discussed, including (i) marine Arctic NPF events, (ii) terrestrial Arctic NPF events and (iii) pacific marine aerosol categories. During these temporal periods, the influences of the origins and pathways of air masses on the characteristics of particle formation and growth were investigated.
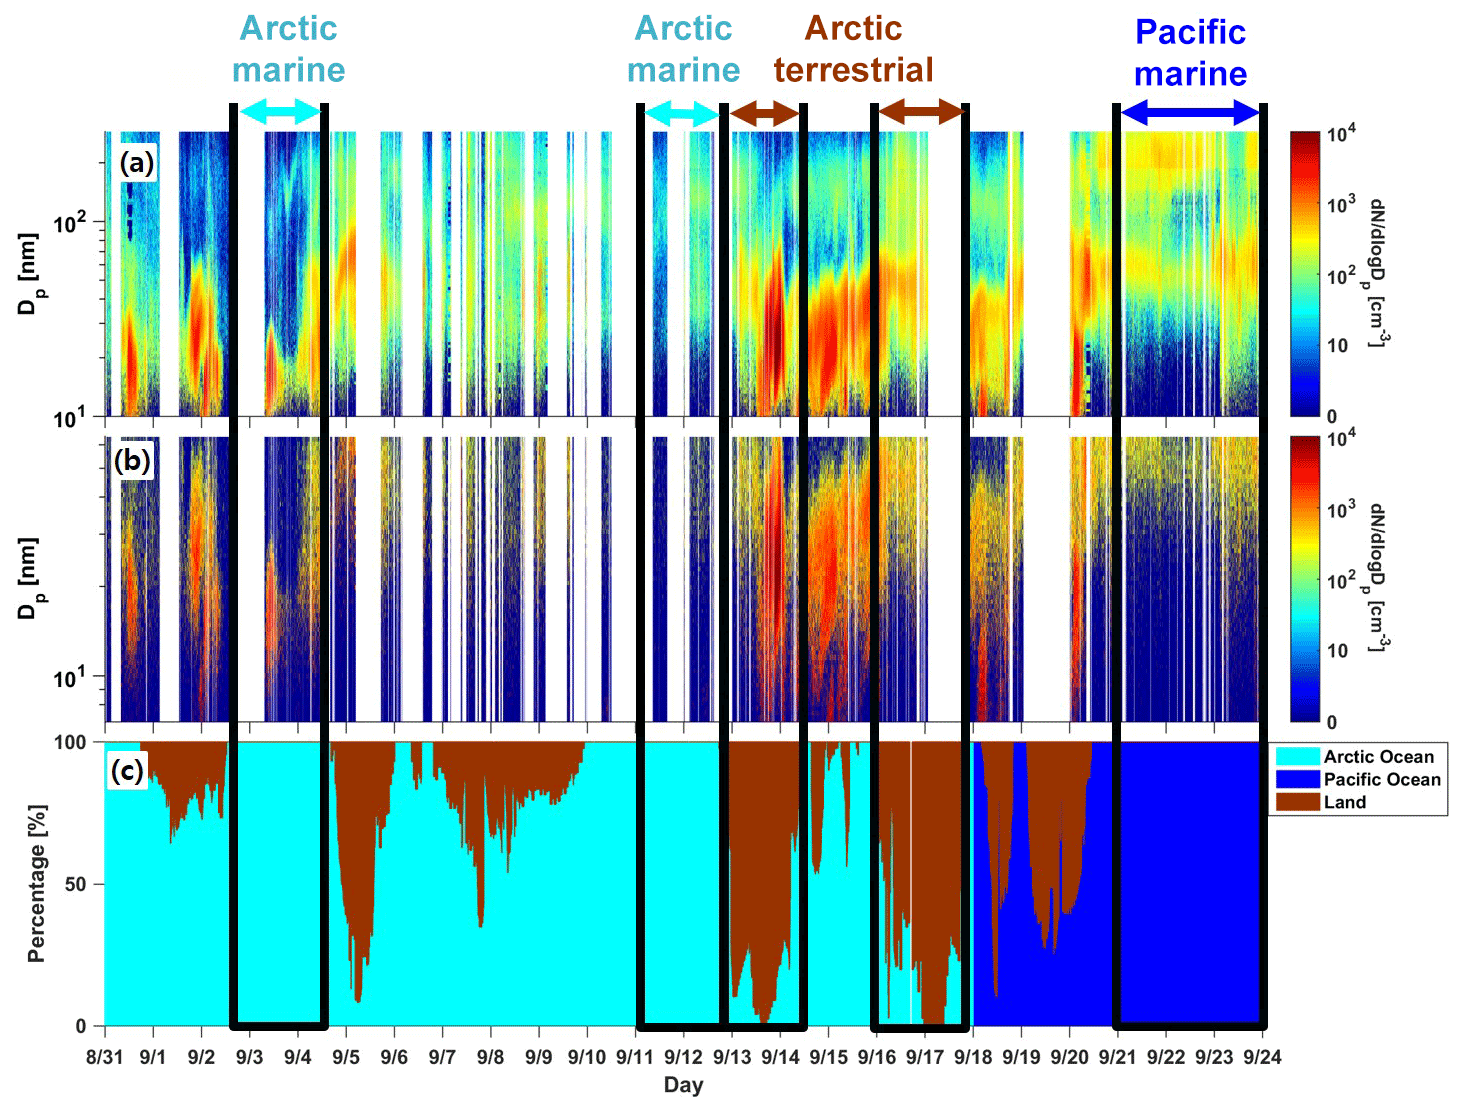
Figure 3Contour plots of the size distributions measured using (a) standard and (b) nano-SMPS and (c) the residence time of air masses that passed over the Arctic Ocean, Pacific Ocean and land throughout the sampling periods.
3.2.1 Open-ocean marine Arctic NPF event case study
The marine Arctic NPF event was observed on 3 September 2017, and time series plots of the particle size distribution and air mass origins are presented in Fig. 4. NNUC increased from 77 to 757 cm−3, while NAIT varied little. The elevated number concentration of nucleation-mode particles lasted for over 5 h and then disappeared. Geometric mean diameter (GMD) varied from 14.6 to 18.2 nm, with an average of 16.3 nm, indicating that particle growth hardly occurred. The GMD is defined as the particle diameter at which the cumulative probability becomes 50 % for the fitted log-normal distribution (Hinds, 1999). During the day, air masses travelled over the Arctic Ocean (explicitly, 47.6, 0 and 0.4 h over the Arctic Ocean, Pacific Ocean and land domain, respectively) and have been categorised as air masses originating from the Arctic Ocean. As shown in Fig. S1, the satellite-derived chlorophyll-a concentration indicated a relatively high level of biological activity in the ocean during the time period focused upon in this study. It was noteworthy that the monthly mean chlorophyll concentration in the Beaufort and Chukchi seas (2.24±3.44 mg m−3; 65–74∘ N and 170∘ E–120∘ W) was approximately 3-fold greater than that estimated in the Pacific Ocean, including the Bering Sea and the Sea of Okhotsk (0.83±1.30 mg m−3; 40–65∘ N and 145∘ E–168∘ W; Fig. S1). Moreover, the marginal ice zone is commonly associated with intense algae blooms during the melting season; therefore, significant emissions of biogenic trace gases such as DMS have been detected on the sea-ice edge (Levasseur, 2013; Oziel et al., 2017). Accordingly, as our measurements were collected over the Arctic Ocean aboard the icebreaker, marine biogenic sources could be considered an important factor inducing NPF events.
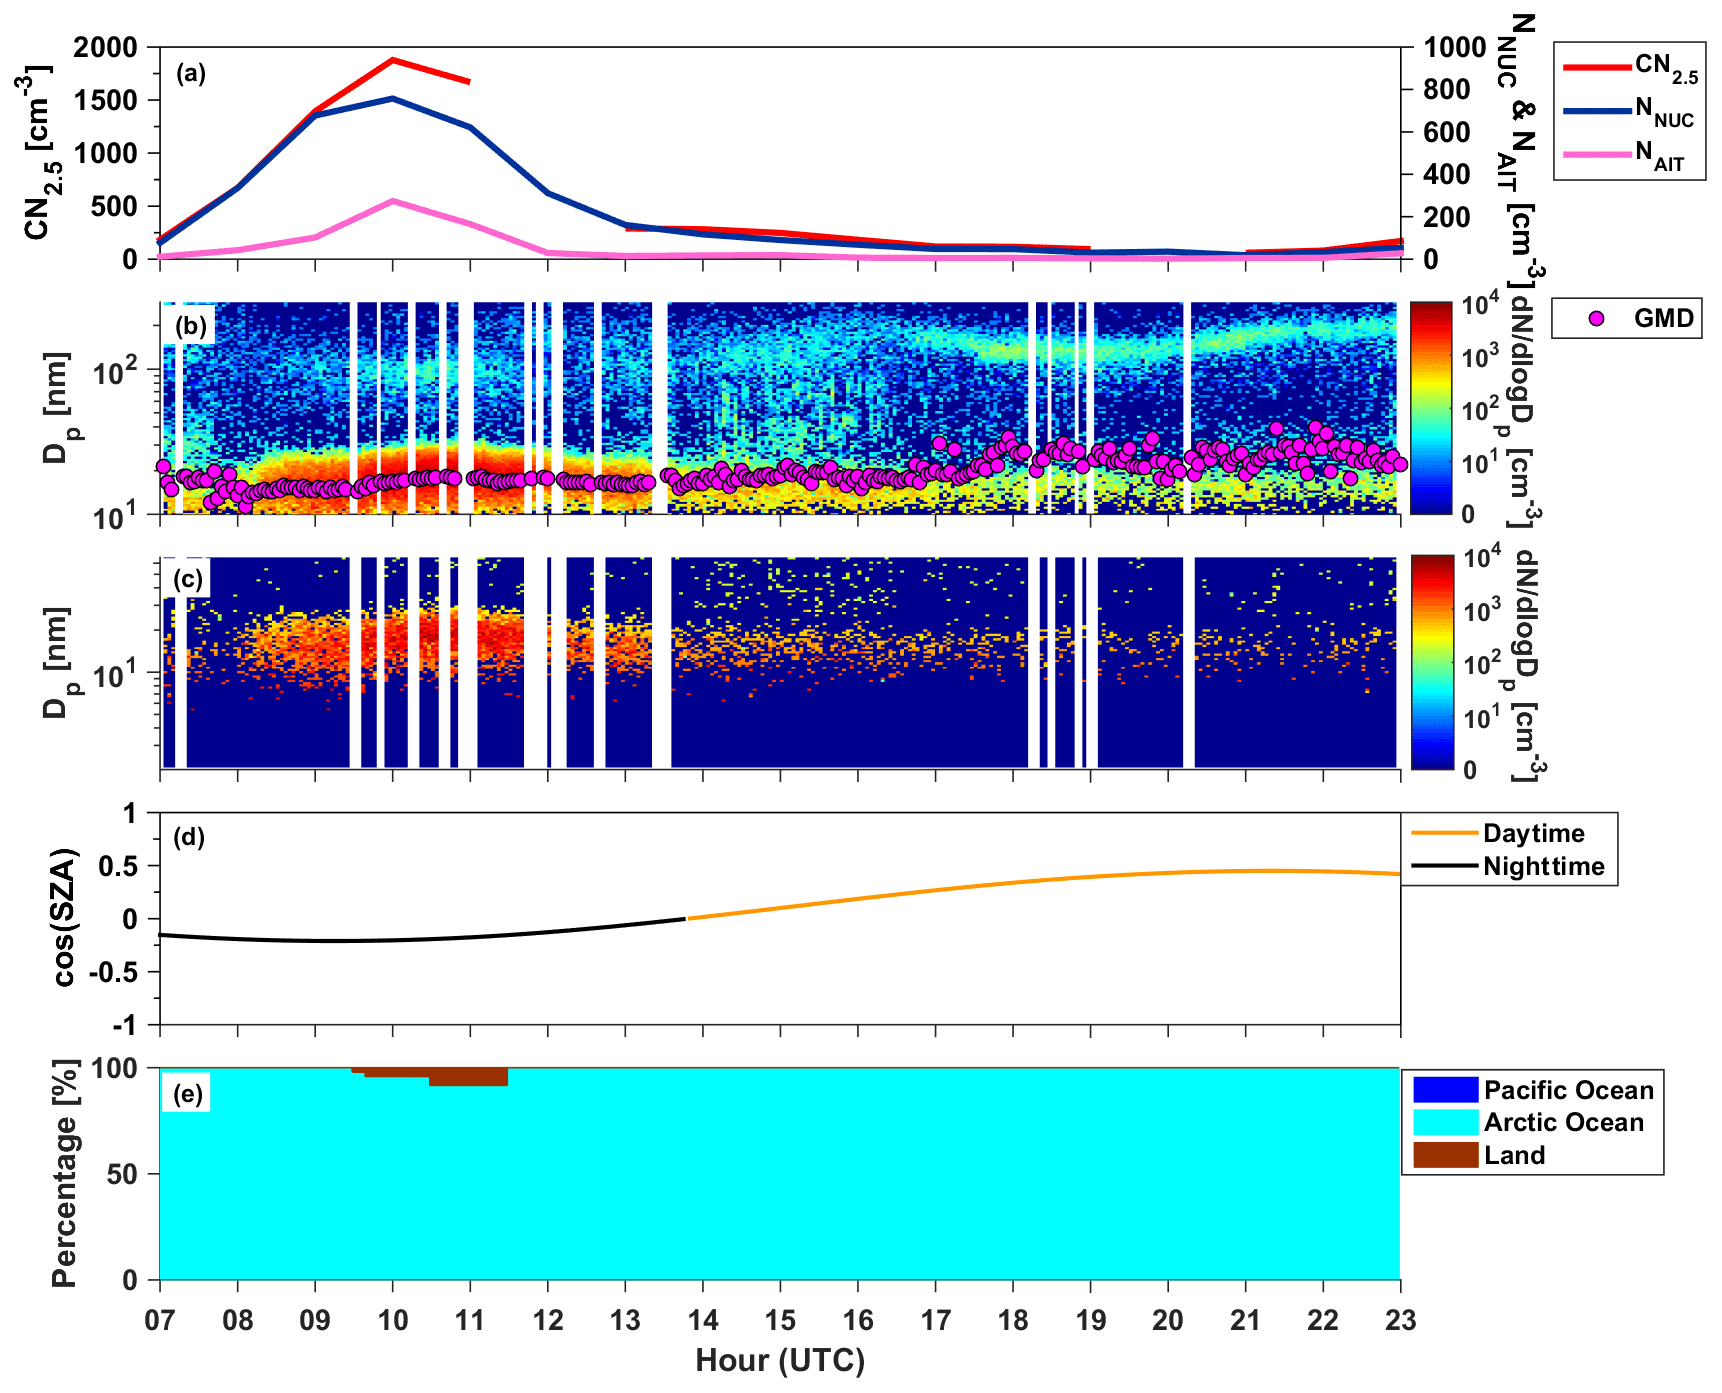
Figure 4Example of a case I event observed on 3 September 2017. From top to bottom, the parameters are as follows: (a) the total number concentration of particles smaller than 2.5 nm, nucleation-mode particles and Aitken-mode particles; (b) a time series of the standard-SMPS size distribution and GMD; (c) a time series of the nano-SMPS size; (d) cosine values of solar zenith angle; and (e) the residence time of air masses that passed over the ocean, land and sea-ice areas.
Figure 4d shows cosine of the solar zenith angle (cos(SZA)) data that can be used as a proxy for solar energy reaching the ground surface. In addition, cloudiness which usually affects the real solar radiation reaching the surface was compared based on Moderate Resolution Imaging Spectroradiometer (MODIS) cloud fraction retrievals (Fig. S5). The data showed that the cloud fraction was significantly high during the entire sampling periods, in general agreement with some other studies over the western Arctic region (e.g. Dong et al., 2010; Collins et al., 2017). In detail, the cloud fraction was relatively low for week 1 (29 August 2017–5 September 2017; Fig. S5a) and week 3 (14–21 September 2017; Fig. S5c), when NPF event and growth were frequently observed (Fig. 3). This suggests that solar radiation at the surface, which is affected both by the cloud cover and SZA, may have influenced aerosol concentration and NPF observed here. As illustrated in Fig. 4, the NPF event occurred when the sun was below the horizon (i.e. Arctic nighttime nucleation). Typically, nucleation tends to take place preferably with high solar irradiation during the daytime (Kulmala et al., 2004). In several locations, however, also nighttime nucleation has been observed at Tumbarumba in Australia (Suni et al., 2008), at the Värriö measurement station in Finnish Lapland (Vehkamäki et al., 2004) and at a subarctic site in northern Sweden (∼14 km east of Abisko; Svenningsson et al., 2008). The possible explanation for nighttime events is that the actual formation and growth occurred even during daylight, but very slow growth in the Arctic and marine atmosphere allowed detecting the particles (∼8 nm) only after sunset (Vehkamäki et al., 2004). A previous study reported that 32 % of strong nighttime nucleation events (2.5 times as frequent as daytime nucleation events) appeared in the presence of a very efficient ion source such as the strong radon efflux from the Tumbarumba soil (Suni et al., 2008). Due to their rarity, the major mechanisms for nocturnal aerosol production are still unclear and require more study.
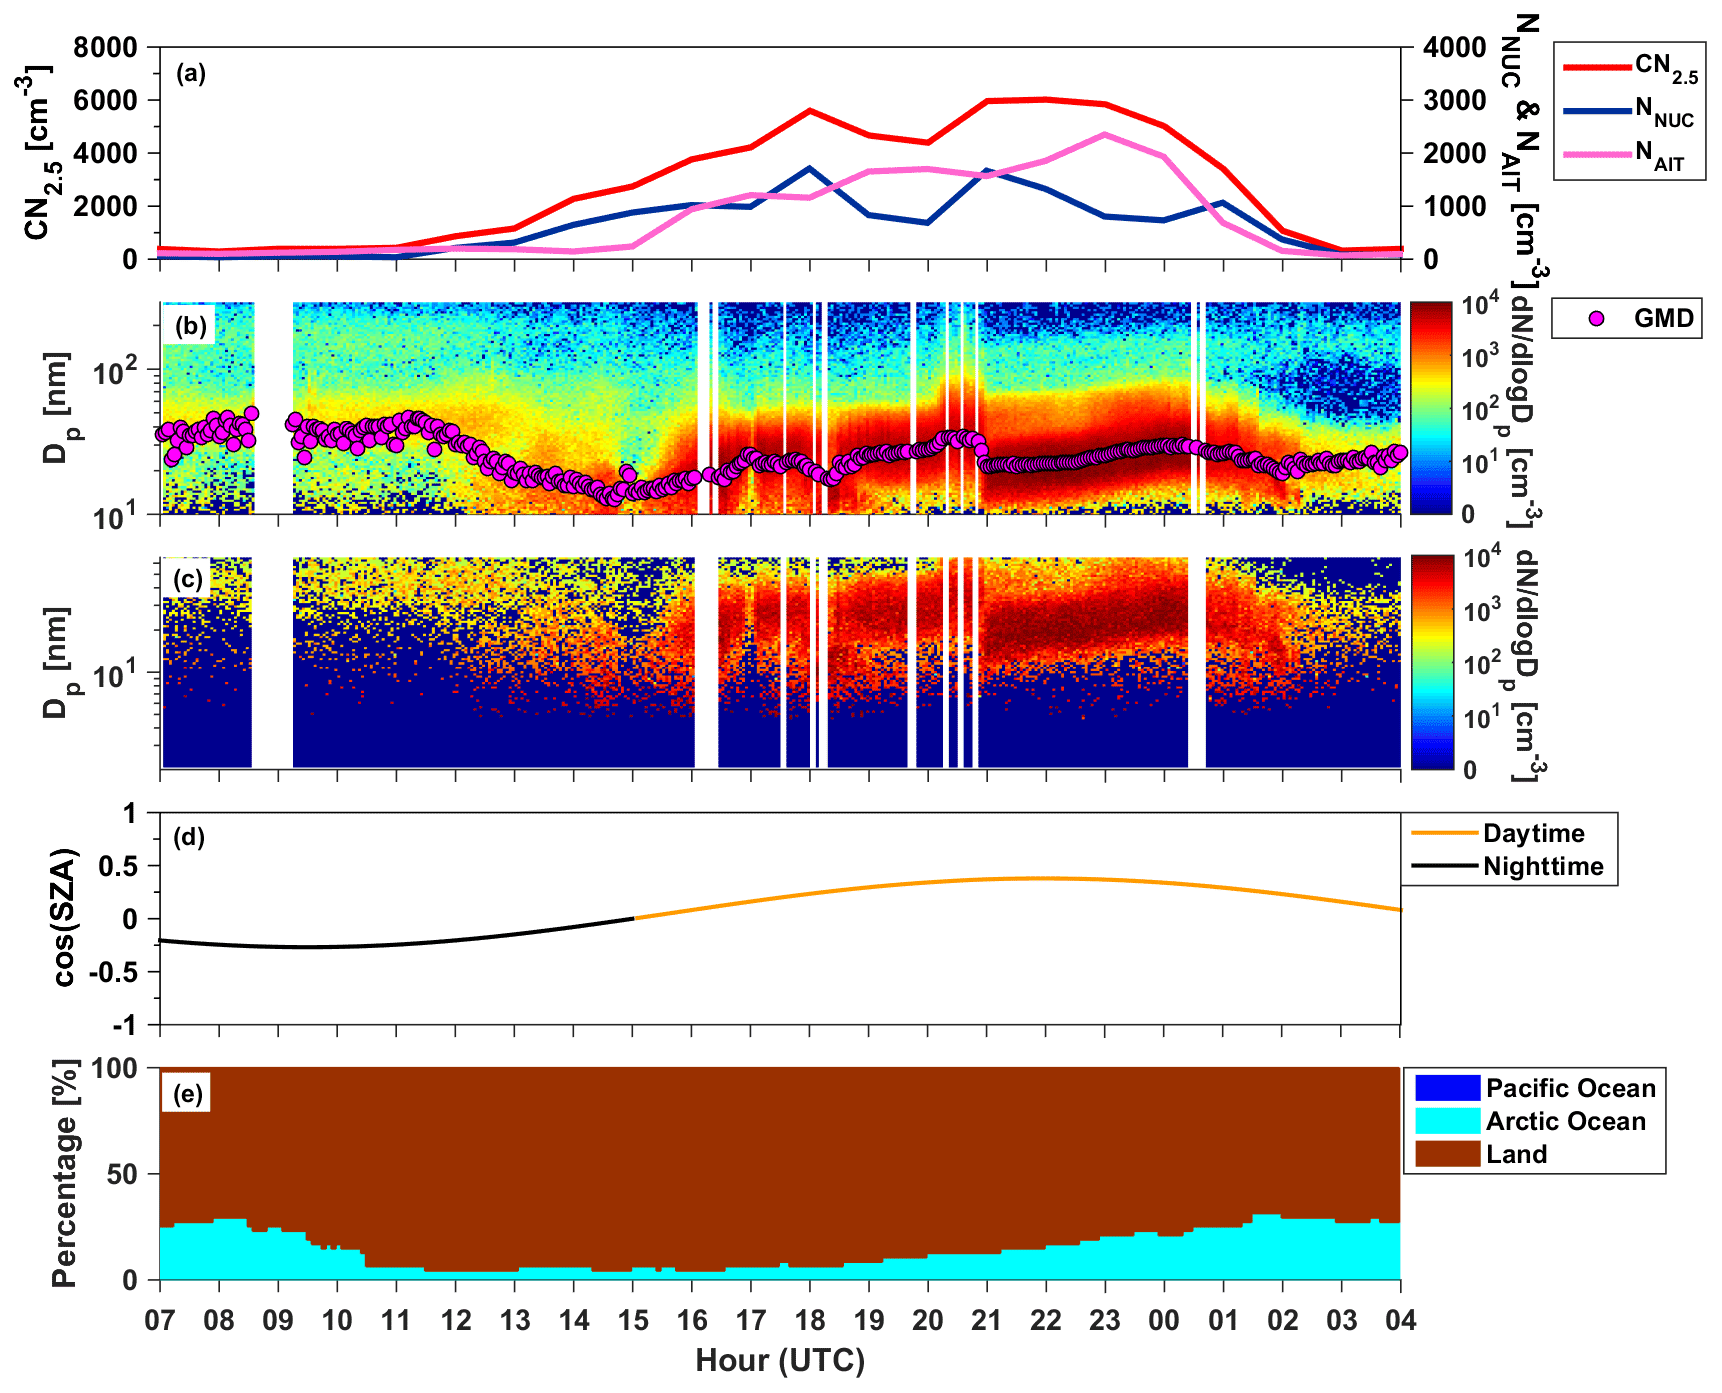
Figure 5Example of a case II event that was observed on 13–14 September 2017. From top to bottom, the parameters are as follows: (a) the total number concentration of particles smaller than 2.5 nm, nucleation-mode particles and Aitken-mode particles; (b) a time series of the standard-SMPS size distribution and GMD; (c) a time series of the nano-SMPS size; (d) cosine values of solar zenith angle; and (e) the residence time of air masses that passed over the ocean, land and sea-ice areas.
3.2.2 Open-ocean terrestrial Arctic NPF event case study
The terrestrial Arctic NPF event was observed during 13–14 September 2017. As shown in Fig. 5, significant strong NPF events occurred frequently during this period. The number concentration of total particles increased considerably, as a CN2.5 value exceeding ∼6016 cm−3 was observed during this event. In addition, the average concentrations of NNUC and NAIT during the terrestrial Arctic NPF were 931±222 and 1127±380 cm−3, respectively. This indicates that high CN2.5 concentration mainly contributed nucleation- and Aitken-mode particles (45 % and 54 % of the size distribution for nucleation-mode and Aitken-mode particles, respectively). The GMD increased from 13.9 to 33.3 nm, indicating that the nucleation-mode particles subsequently increased in size. The formation and growth of aerosol particles were observed during the daytime (Fig. 5d), suggesting that photochemistry is involved. During this period, air masses were heavily influenced by northern Alaska. The average retention times of the 2 d back trajectories arriving at the ship position over northern Alaska, the Arctic Ocean and the Pacific Ocean were 40.8, 7.2 and 0 h, respectively (Fig. 5e). It can be seen that the photochemical reactions of precursor gases (e.g. volatile organic compounds – VOCs – such as isoprene, monoterpenes and sesquiterpenes) emitted by terrestrial ecosystems in Alaska were associated with new particle formation and growth (Schollert et al., 2014; TAPE et al., 2006; Kolesar et al., 2017; Ström et al., 2003).
3.2.3 Pacific marine aerosol case study
A typical aerosol scenario for Pacific marine air masses was observed on 21–22 September 2017, when the air masses passed over mainly the Pacific Ocean (including the Bering Sea and Sea of Okhotsk; explicitly, 0, 47.9 and 0.1 h over the Arctic Ocean, Pacific Ocean and land domain, respectively; Fig. 1a). As shown in Fig. 6, the aerosol number concentrations exhibited a bimodal size distribution, peaking at size ranges of 30–80 nm (Aitken mode) and 100–300 nm (accumulation mode), respectively. In contrast, the concentrations of nucleation-mode particles were very low. For example, the concentration of NNUC ranged from 1 to 38 cm−3, with an average of 8±4 cm−3. We also observed CN2.5 values at the background level of cm−3, which is consistent with the measurements collected at a coastal Antarctic station during summer (∼600 cm−3; Kim et al., 2017) and from flight-based measurements over the Arctic Ocean (∼300 cm−3; Burkart et al., 2017a).

Figure 6Example of a case III event that was observed on 21–22 September 2017. From top to bottom, the parameters are as follows: (a) the total number concentration of particles smaller than 2.5 nm, nucleation-mode particles and Aitken-mode particles; (b) a time series of the standard-SMPS size distribution and GMD; (c) a time series of the nano-SMPS size; (d) cosine values of solar zenith angle; and (e) the residence time of air masses that passed over the ocean, land and sea-ice areas.
3.3 Overview of aerosol properties according to different air mass back trajectories
Air masses comprising marine Pacific along with marine and terrestrial Arctic air masses were encountered during the campaign. In the Sect. 3.2, two case studies of NPF events (Figs. 4 and 5) were found in the Arctic atmosphere. As stressed in Willis et al. (2018), NPF and growth are frequently observed in the boundary layer in the both Arctic open-ocean and coastal regions. These events seem to occur more frequently than lower-latitude marine boundary layers (Quinn and Bates, 2011); there are multiple reasons for this, including summer 24 h high solar radiation, low condensation sink, low temperatures and low mixing of surface emissions, as recently reviewed in Abbatt et al. (2019). Our study also confirmed that no NPF detected during the Pacific transect.
In this section, we present an overall meteorological air mass summary of the open-ocean field study, categorising it into three synoptic period types: Pacific marine, Arctic marine and Arctic terrestrial. These classifications do not represent specific air mass back-trajectory analyses, but they can mainly represent air masses that have travelled over these three distinct geographical regions (Sect. 2.4). Average size distributions for the three selected periods in the different air masses are shown in Fig. 7. To obtain the number size distribution in the size range from 7 to 300 nm, as shown in Fig. 7, we used nano-SMPS data from 7 to 64 nm and standard-SMPS data from 64 to 300 nm. The nano-SMPS and standard-SMPS data agreed within ∼8.8 % in their overlapping size range (10–64 nm; Fig. S4), similar to a previous study (Watson et al., 2011). In addition, a summary of total number concentrations of particles for these periods is included in Table 1. The three period types are as follows.
-
Arctic marine. A trimodal distribution was seen at 18±3 nm, 53±6 nm and 150±6 nm. The first mode is due to NPF arriving from open-pack sea-ice and open-ocean Arctic regions, as discussed in Sect. 3.2.1, where a case study is presented. The Aitken mode (∼53 nm) is remarkably similar to the Pacific Ocean aerosol size distribution and to previous studies detected in the Arctic regions (Tunved et al., 2013; Freud et al., 2017; Dall'Osto et al., 2019). The largest mode at ∼150 nm may be due to a combination of primary and secondary aerosol components.
-
Arctic terrestrial. A bimodal distribution is seen, with two main modes at 24±3 nm and 151±3 nm, respectively. The nucleation and Aitken modes are much higher than the accumulation mode, suggesting that NPF governs the aerosol processes in this coastal region at this time of the year.
-
Pacific marine. The Pacific Ocean aerosol size distributions showed a trimodal size distribution at 56±3 nm, 130±3 nm and 220±6 nm. The lowest peak, at ∼56 nm (i.e. Aitken mode), is likely a combination of primary and secondary marine aerosol components, whereas the largest peak, at ∼220 nm, might be caused by cloud processing and aged aerosols. The mode at ∼130 nm could originate from primary sea spray aerosols in the Pacific atmosphere (Quinn et al., 2015). When the distribution is fitted with log-normal modes, the inter-modal minimum is calculated to be ∼120 nm – often known as the Hoppel minimum, a signature of cloud processing (Hoppel et al., 1994) – although it is difficult to draw a firm conclusion due to the overlap with the third mode at ∼130 nm.
This study shows that aerosols originating from higher and lower marine latitudes – although both types are treated as marine air masses – have very different features, as pointed out in several previous studies (Dall'Osto et al., 2010; Frossard et al., 2014). A key conclusion of this study is that we also need to separate different bioregions in the Arctic, especially given the current results showing very different aerosol size distributions in the Arctic study areas (Fig. 7; Arctic marine and Arctic terrestrial). The reasons for the much higher aerosol concentrations near the coast of Alaska relative to the open-ocean sympagic and pelagic regions may be multiple. We discuss at least two major sources that may contribute to the high aerosol concentrations recorded.
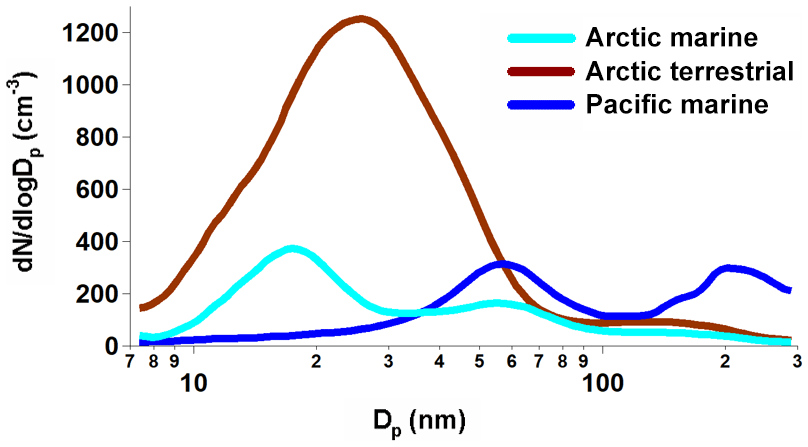
Figure 7Average size distributions of aerosol particles for Arctic marine, Arctic terrestrial and Pacific marine air masses.
Table 1A summary of meteorology, total number concentrations of particles (measured with TSI 3776 CPC, TSI 3772 CPC, standard SMPS, nano-SMPS), growth rate (GR) and condensation sink (CS) for the three selected periods. CN2.5 and CN10 represents the total number concentration of particles larger than 2.5 and 10 nm, respectively. The NNUC, NAIT, NACC and NOPS represent total aerosol nucleation-mode (3–20 nm), Aitken-mode (20–100 nm), accumulation-mode (100–300 nm) and coarse-mode (>300 nm from OPS) number concentrations.
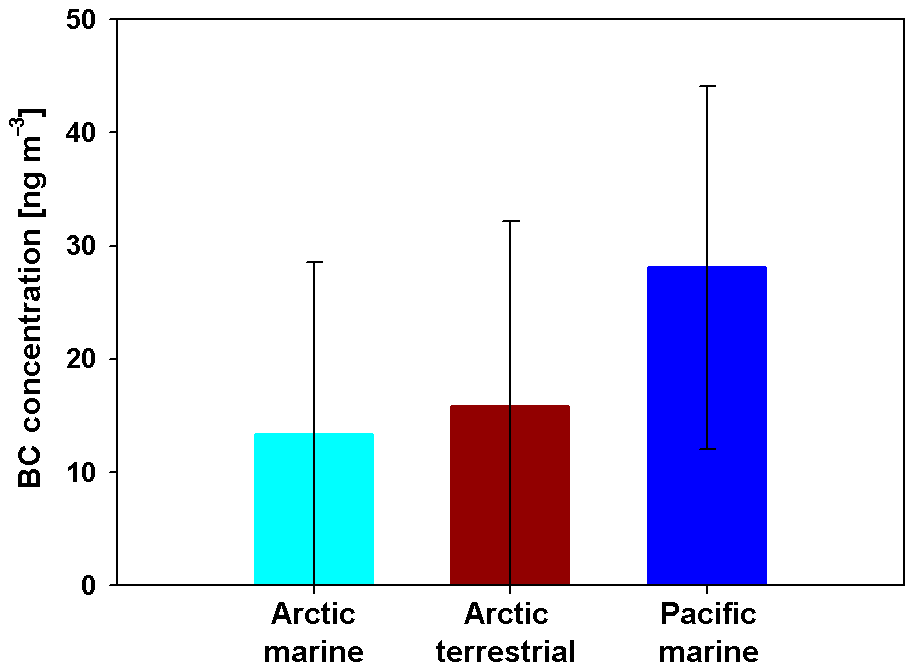
The first source of aerosols in the late-summer terrestrial Arctic air masses may be due to anthropogenic sources. Due to sea-ice retreat and better technologies, the Arctic is now easily accessible to human activities, including oil and gas extraction (Law and Stohl, 2007; Peters et al., 2011). These Arctic oil fields can emit the large amounts of aerosols, and with ongoing Arctic development, such local combustion emissions may increase in the future, possibly affecting local air quality (Gunsch et al., 2017; Schmale et al., 2018a). In fact, some NPF events were reported on the North Slope of Alaska (e.g. Prudhoe Bay oil fields) during August and September 2016 at Oliktok Point, Alaska. This observation was suggested to be linked with oil-field emissions (Kolesar et al., 2017). However, our measurements were conducted in the open ocean, quite far from any land oil-field local emissions. BC data were collected as shown in Fig. 8; they revealed very high standard deviations due to high detection limit of the instrument used relative to the concentrations detected. However, no remarkable differences can be seen, all pointing to pristine clean marine air masses with BC values of approximately 20±10 ng m−3. The two Arctic categories (marine and terrestrial) show similar BC values, whereas higher values can be seen for the Pacific marine aerosol category, probably due to contamination from nearby Asian high-pollutant sources.
The second source of aerosol in the late-summer terrestrial Arctic air masses may be due to terrestrial natural sources. We believe that this may be a much more probable reason. For ∼50 % of its area, the Arctic Ocean is submerged under areas of relatively shallow water known as a shelf sea. It is a relatively small ocean, characterised by pronounced riverine influence and a complex hydrography. Up to 11 % of the entire global river discharge ends up in the Arctic Ocean (Shiklomanov et al., 2000), which is only 1 % of the global ocean volume. The discharge of freshwater is increasing (Peterson et al., 2002), impacting coastal salinity and carbon cycle. Indeed, this continental runoff is a major source of freshwater, nutrients and terrigenous material to the Arctic Ocean (Benner et al., 2005; Fichot et al., 2013; Massicotte et al., 2017). The warming climate in the region causes permafrost degradation, alterations to regional hydrology, and shifting amounts and composition of dissolved organic matter (DOM) transported by streams and rivers (Mann et al., 2016; Chen et al., 2017). Overall, there is considerable spatial and temporal heterogeneity in the distribution of the DOC in the Arctic, owing to strong biological and physicochemical processes. It is important to remember that sea-ice formation and melting also affect the concentrations and distributions of DOC, although their impact is still difficult to determine (Fichot et al., 2013; Shen et al., 2012).
In a recent paper (Park et al., 2019), we suggested that the large amount of freshwater from river runoff may have a substantial impact on primary aerosol production mechanisms, possibly affecting the cloud radiative forcing. We showed that the Arctic riverine organic matter can be directly emitted from surface seawater into the atmosphere via bubble bursting (Park et al., 2019). The high amount of DOC populating the sea-surface microlayer (SML) in the Arctic waters – including UV-absorbing humic substances – can also produce VOCs (Ciuraru et al., 2015; Fu et al., 2015), which are known precursors of secondary organic aerosols. Recently, Mungall et al. (2016) reported that the marine microlayer in the Canadian Arctic Archipelago is a source of oxidised VOCs (OVOCs), which could be an important source of biogenic secondary organic aerosol (Croft et al., 2019). Previous studies also reported fluorescent water-soluble organic aerosols in the High Arctic atmosphere (Fu et al., 2015). It is worth noting that terrestrial VOCs from tundra and lakes at elevated concentrations were reported (Potosnak et al., 2013; Lindwall et al., 2016; Steinke et al., 2018).
Figure 9 shows DOC concentrations from water samples taken in the areas where the NPF marine and terrestrial case studies (Sects. 3.2.1 and 3.2.2) were detected. It is clear that concentrations as much as 2 times higher are seen for the coastal marine areas, relative to the open-ocean marine regions. The origin of this organic matter can be obtained by the fluorescent DOM (FDOM) analysis. Figure 9 (bottom) shows specific peaks attributed to different chemical features. The relative intensity of terrestrial–humic substances (peak A) was 3.5 for the terrestrial and marine samples. By striking contrast, marine–fulvic substances (peak M) and proteinaceous substances (peak T) had an intensity of 0.45 and 0.27, respectively, showing two very distinct chemical compounds. This suggests that coastal oceanic water enriched in river organic material as well as freshwater tundra and lakes may be a source of VOCs (both from biotic and abiotic emission processes) that may be responsible for the high secondary aerosols detected near these areas.
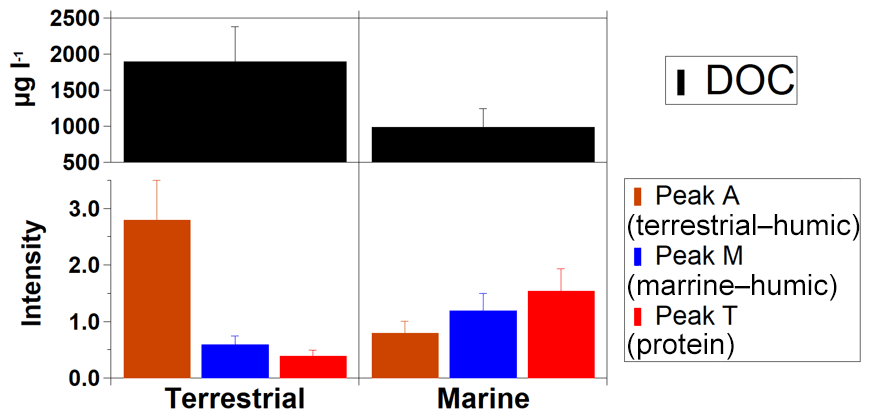
Figure 9Average DOC concentrations for surface seawater samples collected during this cruise, simultaneous with the atmospheric measurements reported herein. Peak A, M and T represent terrestrial–humic substances, marine–fulvic substances and protein, respectively.
3.4 Particle growth rates and condensation sink
Table 1 shows the particle growth rate (GR) and condensation sink (CS) for Arctic marine, Arctic terrestrial and Pacific marine air masses. The GR was calculated by fitting a linear regression to the peak diameter of the aerosol size distribution for the nucleation mode between 4 and 20 nm against time during the NPF cases (Dal Maso et al., 2005; Pierce et al., 2014). The GR observed during the Arctic marine and Arctic terrestrial air masses was 0.4±0.3 nm h−1 and 0.8±0.2 nm h−1, respectively, which was similar to the values previously observed from other Arctic regions. A shipboard expedition conducted during the summers of 2014 and 2016 throughout the Canadian Arctic indicated that the GR varied widely, from 0.2 to 15.3 nm h−1 (Collins et al., 2017). The GR observed at Summit, Greenland, was 0.2±0.1 nm h−1 (range of 0.09 to 0.3 nm h−1; Ziemba et al., 2010). Similarly, in Utqiaġvik, Alaska, the GR was 1.0 nm h−1 in the air mass influenced by Beaufort Sea, whereas the value was 11.1 nm h−1 in the air mass influenced by Prudhoe Bay (i.e. oil-field area; Kolesar et al., 2017). Particularly, simultaneous growth of multiple modes was present in some cases (13–21 September 2017). We calculated the GR of the distinct modes, as shown in Fig. S6. The results showed that growth of the larger mode (e.g. pre-existing mode) was faster than the smaller mode (e.g. nucleation mode), consistent with ship-based aerosol measurements in the summertime Arctic by Burkart et al. (2017b). They proposed that growth was largely via condensation of semi-volatile organic material because lower volatile organics could lead to faster growth of the smaller mode.
The CS is a key parameter assessing the NPF and growth and determines how rapidly gaseous molecules condense onto pre-existing particles. The CS was calculated following Dal Maso et al. (2002) and Collins et al. (2017). The resulting CS values are given in Table 1. The CS observed during the Arctic marine and Arctic terrestrial air masses was 0.5±0.4 nm h−1 and 0.9±0.5 nm h−1, respectively. The CS in this study is on the low end of the values observed during the summer in the Arctic marine boundary layer (shipborne expeditions; Collins et al., 2017); Utqiaġvik, Alaska (Kolesar et al., 2017); and Ny-Ålesund, Svalbard (Giamarelou et al., 2016). In the case when air mass passed over the Pacific Ocean, the CS was 2 or 4 times higher than that of Arctic air masses. It seems that such a higher CS for Pacific marine air masses lowered the concentration of condensable vapours, thereby resulting in the non-event days in Pacific marine air masses.
3.5 Impact on CCN number concentrations
Figure 10a illustrates the CCN concentrations for the three selected periods under different supersaturation conditions. For a given SS of 0.4 %, CCN concentrations for Arctic marine, Arctic terrestrial and Pacific marine air masses were 35±40 cm−3, 71±47 cm−3 and 204±87 cm−3, respectively. Higher concentrations of CCN were observed when the air mass originated from the Pacific marine for a SS of 0.2 %–1.0 %. This may have occurred due to the differences in the CCN sources between the Arctic and Pacific oceans. It was noted that that accumulation- and coarse-mode particles, which are predominant over the Pacific Ocean (Fig. 7), can easily act as CCN. Our results agreed well with values reported in previous studies that measured CCN at a ground-based Arctic station (Jung et al., 2018) but were slightly higher than those measured from High Arctic expeditions (Leck et al., 2002; Martin et al., 2011; Mauritsen et al., 2011). For example, Jung et al. (2018) reported seasonal variations in the CCN concentration over 7 years (2007–2013) at the Zeppelin station and found that the monthly mean CCN concentrations ranged from 17 cm−3 in October 2007 to 198 cm−3 in March 2008 at a SS value of 0.4 %. However, Mauritsen et al. (2011) observed CCN concentrations lower than ∼100 cm−3 at five different supersaturations (SS=0.10 %, 0.15 %, 0.20 %, 0.41 % and 0.73 %), with median values ranging from 15 to 50 cm−3, in four High Arctic expeditions during the Arctic Summer Cloud Ocean Study. Such values were also in line with the long-term measurement at an Arctic station in Utqiaġvik, which indicated that the median CCN concentrations at a 0.2 % SS were smaller than 100 cm−3 (Schmale et al., 2018b).
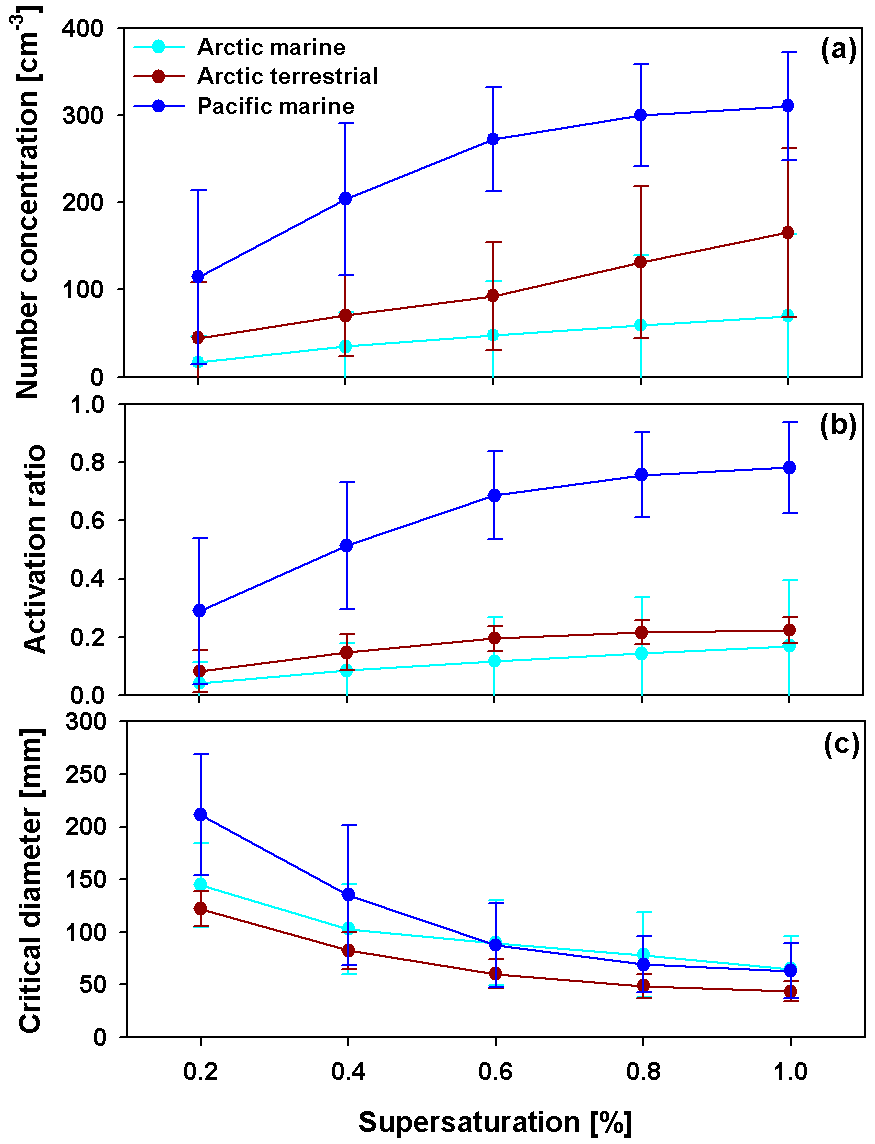
Figure 10Comparisons of (a) CCN number concentrations; (b) CCN activity; and (c) critical diameter for Arctic marine, Arctic terrestrial and Pacific marine air masses under different supersaturation conditions. The error bars represent a standard deviation.
We also compared CCN activity and critical diameter for the three selected periods, as shown in Fig. 10b and c. The CCN activity is defined as the ratio of the number concentration of particles that activated to become CCN at a given supersaturation to the total number concentration of particles larger than 2.5 nm (CN2.5). The CCN activity followed a similar pattern to the CCN concentration. Furthermore, the critical diameter (Dc; i.e. the diameter at which the integration of aerosol size distribution from the largest particle diameter to the lower ones matches with the measured CCN concentration) was estimated using the measured aerosol size distribution, CN2.5, and CCN concentrations with a time resolution of 1 h, as described by Furutani et al. (2018). The Dc at a SS of 0.4 % was found to be 103±43 nm, 83±18 nm and 136±67 nm for Arctic marine, Arctic terrestrial and Pacific marine periods, respectively. These values are comparable to previous studies obtained in the Arctic and subarctic regions. For instance, the Dc of 80 nm at a 0.6 % SS was observed during the aircraft measurement in July 2014 in the High Arctic marine boundary layer of Resolute Bay, Nunavut, Canada (Burkart et al., 2017a). Jaatinen et al. (2014) reported the Dc value of 98±16 nm (SS=0.4 %) from the subarctic area of Finland (Pallas-Sodankylä Global Atmospheric Watch station). Anttile et al. (2012) also showed that a Dc value was in the range of 90 to 120 nm at a SS of 0.4 % during the same filed campaign as reported in Jaatinen et al. (2014). For a maximum SS between 0.18 % and 0.26 %, Dc varied between 110 and 140 nm at the same measurement sites.
This study presents the physical properties of aerosol particles measured aboard the R/V Araon icebreaker during 2017 throughout the Arctic and Pacific oceans. The CN2.5 value commonly ranged between 13 and 2000 cm−3, with an average of 505±280 cm−3. An elevated CN2.5 concentration reaching ∼6016 cm−3 was observed from 13 to 20 September. The temporal variations in the CN2.5 concentration followed a similar pattern to those of NNUA and NAIT. We also found that the CN2.5 concentration was strongly correlated with NNUA (r2=0.69), suggesting that CN was mainly derived from nucleation-mode particles.
NPF events caused by gas-to-particle conversion frequently occurred over the Arctic Ocean. Overall, two major NPF sources (i.e. Arctic marine and Arctic terrestrial) were identified based on the air mass back trajectory analysis. NPF events were associated with Arctic marine air masses, indicating the impact of marine biogenic emissions from the Arctic Ocean. Strong NPF events with particle growth were associated with Arctic terrestrial air masses, which may be due to the biogenic precursor gases emitted by terrestrial ecosystems including river discharge and Alaskan tundra in the Arctic coastal areas. In contrast, relatively larger particles with broad Aitken- and accumulation-mode peaks were observed over the Pacific Ocean. Our study confirmed that no NPF was detected during the Pacific transect. We also compared the average CCN concentrations for each of the cases. Our data showed that the impact of aerosols on CCN concentrations (SS=0.4 %) was significant: 35±40 cm−3, 71±47 cm−3 and 204±87 cm−3 for Arctic marine, Arctic terrestrial and Pacific marine periods, respectively. Our interpreted data showed that river outflows and tundra strongly influence Arctic aerosol properties. Further detailed measurements of the chemical characteristics of marine aerosols are required to provide more direct evidence for the contribution of biogenic precursors to the NPF and CCN in the remote Arctic atmosphere.
Arctic areas are currently experiencing drastic climate change, with air temperatures increasing at twice the rate of the global average. This warming is causing clear changes, such as the increases in biogenic emissions from tundra vegetation and changes in vegetation cover (Faubert et al., 2010; Peñuelas and Staudt, 2010; Potosnak et al., 2013; Lindwall et al., 2016). Lindwall et al. (2016) observed a 280 % increase in VOC emissions relative to the ambient level in response to a 4 ∘C increase in the summer temperature of the subarctic. Increases in VOC emissions from river discharge and tundra vegetation in the Arctic are critical factors that induce NPF and particle growth events, which may impact the CCN concentrations during the Arctic summer.
We uploaded five datasets, including BC (https://doi.org/10.22663/KOPRI-KPDC-00001140.4; Park and Yoon, 2020a), CN10 and CN2.5 (https://doi.org/10.22663/KOPRI-KPDC-00001137.4; Park and Yoon, 2020b), standard SMPS and nano-SMPS (https://doi.org/10.22663/KOPRI-KPDC-00001136.5; Park and Yoon, 2020c), OPC (https://doi.org/10.22663/KOPRI-KPDC-00001138.4; Park and Yoon, 2020d), and CCN (https://doi.org/10.22663/KOPRI-KPDC-00001141.5; Park and Yoon, 2020e) in the KPDC.
The supplement related to this article is available online at: https://doi.org/10.5194/acp-20-5573-2020-supplement.
JP and YJY designed the study; JP, MD'O, KP, YG, HJK, EJ, K-TP, MP, SSY, JJ and BYL analysed data. JP, MD'O, K-TP and YJY prepared the paper, with contributions from all co-authors.
The authors declare that they have no conflict of interest.
This article is part of the special issue “Marine organic matter: from biological production in the ocean to organic aerosol particles and marine clouds (ACP/OS inter-journal SI)”. It is not associated with a conference.
We are grateful to the captain and crew of R/V Araon for their enthusiastic assistance during the cruise ARA08C. This work was supported by a Korea Grant from the Korean government (MSIT; grant no. NRF-2016M1A5A1901769, KOPRI-PN20081) and the KOPRI projects (PE17390 and PE20060). Kihong Park was supported by the National Leading Research Laboratory programme (grant no. NRF-2019R1A2C3007202). Minsu Park and Seong Soo Yum were supported by National Research Foundation of Korea (NRF; grant no. NRF-20180R1A2B2006965). Jinyoung Jung was supported by the “Korea-Arctic Ocean Observing System (K-AOOS)”, KOPRI (grant no. 20160245), funded by the Ministry of Oceans and Fisheries, South Korea.
This research has been supported by the National Research Foundation of Korea (grant no. NRF-2016M1A5A1901769, NRF-2019R1A2C3007202 and NRF-20180R1A2B2006965), the KOPRI project (grant no. PE17390), and the Ministry of Oceans and Fisheries (grant no. 20160245).
This paper was edited by Manuela van Pinxteren and reviewed by two anonymous referees.
Abbatt, J. P. D., Leaitch, W. R., Aliabadi, A. A., Bertram, A. K., Blanchet, J.-P., Boivin-Rioux, A., Bozem, H., Burkart, J., Chang, R. Y. W., Charette, J., Chaubey, J. P., Christensen, R. J., Cirisan, A., Collins, D. B., Croft, B., Dionne, J., Evans, G. J., Fletcher, C. G., Galí, M., Ghahremaninezhad, R., Girard, E., Gong, W., Gosselin, M., Gourdal, M., Hanna, S. J., Hayashida, H., Herber, A. B., Hesaraki, S., Hoor, P., Huang, L., Hussherr, R., Irish, V. E., Keita, S. A., Kodros, J. K., Köllner, F., Kolonjari, F., Kunkel, D., Ladino, L. A., Law, K., Levasseur, M., Libois, Q., Liggio, J., Lizotte, M., Macdonald, K. M., Mahmood, R., Martin, R. V., Mason, R. H., Miller, L. A., Moravek, A., Mortenson, E., Mungall, E. L., Murphy, J. G., Namazi, M., Norman, A.-L., O'Neill, N. T., Pierce, J. R., Russell, L. M., Schneider, J., Schulz, H., Sharma, S., Si, M., Staebler, R. M., Steiner, N. S., Thomas, J. L., von Salzen, K., Wentzell, J. J. B., Willis, M. D., Wentworth, G. R., Xu, J.-W., and Yakobi-Hancock, J. D.: Overview paper: New insights into aerosol and climate in the Arctic, Atmos. Chem. Phys., 19, 2527–2560, https://doi.org/10.5194/acp-19-2527-2019, 2019.
ACIA: Arctic Climate Impact Assessment, Chap. 2, 23, Cambridge University Press, New York, USA, 2005.
Allan, J. D., Williams, P. I., Najera, J., Whitehead, J. D., Flynn, M. J., Taylor, J. W., Liu, D., Darbyshire, E., Carpenter, L. J., Chance, R., Andrews, S. J., Hackenberg, S. C., and McFiggans, G.: Iodine observed in new particle formation events in the Arctic atmosphere during ACCACIA, Atmos. Chem. Phys., 15, 5599–5609, https://doi.org/10.5194/acp-15-5599-2015, 2015.
Anttila, T., Brus, D., Jaatinen, A., Hyvärinen, A.-P., Kivekäs, N., Romakkaniemi, S., Komppula, M., and Lihavainen, H.: Relationships between particles, cloud condensation nuclei and cloud droplet activation during the third Pallas Cloud Experiment, Atmos. Chem. Phys., 12, 11435–11450, https://doi.org/10.5194/acp-12-11435-2012, 2012.
Asmi, E., Kondratyev, V., Brus, D., Laurila, T., Lihavainen, H., Backman, J., Vakkari, V., Aurela, M., Hatakka, J., Viisanen, Y., Uttal, T., Ivakhov, V., and Makshtas, A.: Aerosol size distribution seasonal characteristics measured in Tiksi, Russian Arctic, Atmos. Chem. Phys., 16, 1271–1287, https://doi.org/10.5194/acp-16-1271-2016, 2016.
Benner, R., Louchouarn, P., and Amon, R. M. W.: Terrigenous dissolved organic matter in the Arctic Ocean and its transport to surface and deep waters of the North Atlantic, Global Biogeochem. Cy., 19, GB2025, https://doi.org/10.1029/2004GB002398, 2005.
Burkart, J., Willis, M. D., Bozem, H., Thomas, J. L., Law, K., Hoor, P., Aliabadi, A. A., Köllner, F., Schneider, J., Herber, A., Abbatt, J. P. D., and Leaitch, W. R.: Summertime observations of elevated levels of ultrafine particles in the high Arctic marine boundary layer, Atmos. Chem. Phys., 17, 5515–5535, https://doi.org/10.5194/acp-17-5515-2017, 2017a.
Burkart, J., Hodshire, A. L., Mungall, E. L., Pierce, J. R., Collins, D. B., Ladino, L. A., Lee, A. K. Y., Irish, V., Wentzell, J. J. B., Liggio, J., Papakyriakou, T., Murphy, J., and Abbatt, J.: Organic condensation and particle growth to CCN sizes in the summertimemarine Arctic is driven by materials more semivolatile than at continental sites, Geophys. Res. Lett., 44, 10725–10734, https://doi.org/10.1002/2017GL075671, 2017b.
Chang, R. Y.-W., Sjostedt, S. J., Pierce, J. R., Papakyriakou, T. N., Scarratt, M. G., Michaud, S., Levasseur, M., Leaitch, W. R., and Abbatt, J. P. D.: Relating atmospheric and oceanic DMS levels to particle nucleation events in the Canadian Arctic, J. Geophys. Res.-Atmos., 116, D00S03, https://doi.org/10.1029/2011JD015926, 2011.
Chen, X., Zhang, X., Church, J. A., Watson, C. S., King, M. A., Monselesan, D., Legresy, B., and Harig, C.: The increasing rate of global mean sea-level rise during 1993–2014, Nat. Clim. Change, 7, 492, https://doi.org/10.1038/nclimate3325, 2017.
Ciuraru, R., Fine, L., van Pinxteren, M., D'Anna, B., Herrmann, H., and George, C.: Photosensitized production of functionalized and unsaturated organic compounds at the air-sea interface, Sci. Rep., 5, 12741, https://doi.org/10.1038/srep12741, 2015.
Coble, P. G.: Marine Optical Biogeochemistry: The Chemistry of Ocean Color, Chem. Rev., 107, 402–418, https://doi.org/10.1021/cr050350+, 2007.
Collins, D. B., Burkart, J., Chang, R. Y.-W., Lizotte, M., Boivin-Rioux, A., Blais, M., Mungall, E. L., Boyer, M., Irish, V. E., Massé, G., Kunkel, D., Tremblay, J.-É., Papakyriakou, T., Bertram, A. K., Bozem, H., Gosselin, M., Levasseur, M., and Abbatt, J. P. D.: Frequent ultrafine particle formation and growth in Canadian Arctic marine and coastal environments, Atmos. Chem. Phys., 17, 13119–13138, https://doi.org/10.5194/acp-17-13119-2017, 2017.
Croft, B., Martin, R. V., Leaitch, W. R., Tunved, P., Breider, T. J., D'Andrea, S. D., and Pierce, J. R.: Processes controlling the annual cycle of Arctic aerosol number and size distributions, Atmos. Chem. Phys., 16, 3665–3682, https://doi.org/10.5194/acp-16-3665-2016, 2016.
Croft, B., Martin, R. V., Leaitch, W. R., Burkart, J., Chang, R. Y.-W., Collins, D. B., Hayes, P. L., Hodshire, A. L., Huang, L., Kodros, J. K., Moravek, A., Mungall, E. L., Murphy, J. G., Sharma, S., Tremblay, S., Wentworth, G. R., Willis, M. D., Abbatt, J. P. D., and Pierce, J. R.: Arctic marine secondary organic aerosol contributes significantly to summertime particle size distributions in the Canadian Arctic Archipelago, Atmos. Chem. Phys., 19, 2787–2812, https://doi.org/10.5194/acp-19-2787-2019, 2019.
Dall'Osto, M., Ceburnis, D., Martucci, G., Bialek, J., Dupuy, R., Jennings, S. G., Berresheim, H., Wenger, J., Healy, R., Facchini, M. C., Rinaldi, M., Giulianelli, L., Finessi, E., Worsnop, D., Ehn, M., Mikkilä, J., Kulmala, M., and O'Dowd, C. D.: Aerosol properties associated with air masses arriving into the North East Atlantic during the 2008 Mace Head EUCAARI intensive observing period: an overview, Atmos. Chem. Phys., 10, 8413–8435, https://doi.org/10.5194/acp-10-8413-2010, 2010.
Dall'Osto, M., Beddows, D. C. S., Tunved, P., Krejci, R., Ström, J., Hansson, H. C., Yoon, Y. J., Park, K.-T., Becagli, S., Udisti, R., Onasch, T., O'Dowd, C. D., Simó, R., and Harrison, R. M.: Arctic sea ice melt leads to atmospheric new particle formation, Sci. Rep., 7, 3318, https://doi.org/10.1038/s41598-017-03328-1, 2017.
Dall'Osto, M., Beddows, D. C. S., Tunved, P., Harrison, R. M., Lupi, A., Vitale, V., Becagli, S., Traversi, R., Park, K.-T., Yoon, Y. J., Massling, A., Skov, H., Lange, R., Strom, J., and Krejci, R.: Simultaneous measurements of aerosol size distributions at three sites in the European high Arctic, Atmos. Chem. Phys., 19, 7377–7395, https://doi.org/10.5194/acp-19-7377-2019, 2019.
Dal Maso, M.: Condensation and coagulation sinks and formation of nucleation mode particles in coastal and boreal forest boundary layers, J. Geophys. Res., 107, 8097, https://doi.org/10.1029/2001jd001053, 2002.
Dal Maso, M., Kulmala, M., Riipinen, I., Wagner, R., Hussein, T., Aalto, P. P., and Lehtinen, K. E. J.: Formation and growth of fresh atmospheric aerosols: Eight years of aerosol size distribution data from SMEAR II, Hyytiälä, Finland, Boreal Environ. Res., 10, 323–336, 2005.
Dong, X., Xi, B., Crosby, K., Long, C. N., Stone, R. S., and Shupe, M.: A 10 year climatology of Arctic cloud fraction and radiative forcing at Barrow, Alaska, J. Geophys. Res.-Atmos., 115, D17212, https://doi.org/10.1029/2009JD013489, 2010.
Ehn, M., Vuollekoski, H., Petäjä, T., Kerminen, V.-M., Vana, M., Aalto, P., de Leeuw, G., Ceburnis, D., Dupuy, R., O'Dowd, C. D., and Kulmala, M.: Growth rates during coastal and marine new particle formation in western Ireland, J. Geophys. Res.-Atmos., 115, D18218, https://doi.org/10.1029/2010JD014292, 2010.
Faubert, P., Tiiva, P., Rinnan, Å., Michelsen, A., Holopainen, J. K., and Rinnan, R.: Doubled volatile organic compound emissions from subarctic tundra under simulated climate warming, New Phytol., 187, 199–208, https://doi.org/10.1111/j.1469-8137.2010.03270.x, 2010.
Fichot, C. G., Kaiser, K., Hooker, S. B., Amon, R. M. W., Babin, M., Bélanger, S., Walker, S. A., and Benner, R.: Pan-Arctic distributions of continental runoff in the Arctic Ocean, Sci. Rep., 3, 1053, https://doi.org/10.1038/srep01053, 2013.
Freud, E., Krejci, R., Tunved, P., Leaitch, R., Nguyen, Q. T., Massling, A., Skov, H., and Barrie, L.: Pan-Arctic aerosol number size distributions: seasonality and transport patterns, Atmos. Chem. Phys., 17, 8101–8128, https://doi.org/10.5194/acp-17-8101-2017, 2017.
Frossard, A. A., Russell, L. M., Burrows, S. M., Elliott, S. M., Bates, T. S., and Quinn, P. K.: Sources and composition of submicron organic mass in marine aerosol particles, J. Geophys. Res.-Atmos., 119, 12977–913003, https://doi.org/10.1002/2014jd021913, 2014.
Fu, P., Kawamura, K., Chen, J., Qin, M., Ren, L., Sun, Y., Wang, Z., Barrie, L. A., Tachibana, E., Ding, A., and Yamashita, Y.: Fluorescent water-soluble organic aerosols in the High Arctic atmosphere, Sci. Rep., 5, 9845, https://doi.org/10.1038/srep09845, 2015.
Furutani, H., Dall’osto, M., Roberts, G. C., and Prather, K. A.: Assessment of the relative importance of atmospheric aging on CCN activity derived from field observations, Atmos. Environ., 42, 3130–3142, 2008.
Giamarelou, M., Eleftheriadis, K., Nyeki, S., Tunved, P., Torseth, K., and Biskos, G.: Indirect evidence of the composition of nucleation mode atmospheric particles in the high Arctic, J. Geophys. Res.-Atmos., 121, 965–975, https://doi.org/10.1002/2015JD023646, 2016.
Gunsch, M. J., Kirpes, R. M., Kolesar, K. R., Barrett, T. E., China, S., Sheesley, R. J., Laskin, A., Wiedensohler, A., Tuch, T., and Pratt, K. A.: Contributions of transported Prudhoe Bay oil field emissions to the aerosol population in Utqiaġvik, Alaska, Atmos. Chem. Phys., 17, 10879–10892, https://doi.org/10.5194/acp-17-10879-2017, 2017.
Heintzenberg, J., Leck, C., and Tunved, P.: Potential source regions and processes of aerosol in the summer Arctic, Atmos. Chem. Phys., 15, 6487–6502, https://doi.org/10.5194/acp-15-6487-2015, 2015.
Heintzenberg, J., Tunved, P., Galí, M., and Leck, C.: New particle formation in the Svalbard region 2006–2015, Atmos. Chem. Phys., 17, 6153–6175, https://doi.org/10.5194/acp-17-6153-2017, 2017.
Hinds, W. C.: Aerosol Technology: Properties, Behavior, and Measurement of Airborne Particles, 2nd edn., Wiley-Interscience, New York, 1999.
Hoppel, W. A., Frick, G. M., Fitzgerald, J. W., and Larson, R. E.: Marine boundary layer measurements of new particle formation and the effects nonprecipitating clouds have on aerosol size distribution, J. Geophys. Res.-Atmos., 99, 14443–14459, https://doi.org/10.1029/94jd00797, 1994.
Hudson, J. G. and Yum, S. S.: Cloud condensation nuclei spectra and polluted and clean clouds over the Indian Ocean, J. Geophys. Res.-Atmos., 107, INX221-21–INX2221-12, https://doi.org/10.1029/2001jd000829, 2002.
IPCC: Climate change 2013: The physical science basis, Intergovernmental panel on Climate Change, Cambridge University Press, New York, USA, 571–740, 2013.
Jang, E., Park, K.-T., Yoon, Y. J., Kim, T.-W., Hong, S.-B., Becagli, S., Traversi, R., Kim, J., and Gim, Y.: New particle formation events observed at the King Sejong Station, Antarctic Peninsula – Part 2: Link with the oceanic biological activities, Atmos. Chem. Phys., 19, 7595–7608, https://doi.org/10.5194/acp-19-7595-2019, 2019.
Jung, C. H., Yoon, Y. J., Kang, H. J., Gim, Y., Lee, B. Y., Ström, J., Krejci, R., and Tunved, P.: The seasonal characteristics of cloud condensation nuclei (CCN) in the arctic lower troposphere, Tellus B: Chem. Phys. Meteorol., 70, 1–13, https://doi.org/10.1080/16000889.2018.1513291, 2018.
Kalivitis, N., Kerminen, V.-M., Kouvarakis, G., Stavroulas, I., Bougiatioti, A., Nenes, A., Manninen, H. E., Petäjä, T., Kulmala, M., and Mihalopoulos, N.: Atmospheric new particle formation as a source of CCN in the eastern Mediterranean marine boundary layer, Atmos. Chem. Phys., 15, 9203–9215, https://doi.org/10.5194/acp-15-9203-2015, 2015.
Kerminen, V.-M., Chen, X., Vakkari, V., Petäjä, T., Kulmala, M., and Bianchi, F.: Atmospheric new particle formation and growth: review of field observations, Environ. Res. Lett., 13, 103003, https://doi.org/10.1088/1748-9326/aadf3c, 2018.
Kim, G., Cho, H.-j., Seo, A., Kim, D., Gim, Y., Lee, B. Y., Yoon, Y. J., and Park, K.: Comparison of Hygroscopicity, Volatility, and Mixing State of Submicrometer Particles between Cruises over the Arctic Ocean and the Pacific Ocean, Environ. Sci. Technol., 49, 12024–12035, https://doi.org/10.1021/acs.est.5b01505, 2015.
Kim, J., Yoon, Y. J., Gim, Y., Kang, H. J., Choi, J. H., Park, K.-T., and Lee, B. Y.: Seasonal variations in physical characteristics of aerosol particles at the King Sejong Station, Antarctic Peninsula, Atmos. Chem. Phys., 17, 12985–12999, https://doi.org/10.5194/acp-17-12985-2017, 2017.
Kim, J., Yoon, Y. J., Gim, Y., Choi, J. H., Kang, H. J., Park, K.-T., Park, J., and Lee, B. Y.: New particle formation events observed at King Sejong Station, Antarctic Peninsula – Part 1: Physical characteristics and contribution to cloud condensation nuclei, Atmos. Chem. Phys., 19, 7583–7594, https://doi.org/10.5194/acp-19-7583-2019, 2019.
Kolesar, K. R., Cellini, J., Peterson, P. K., Jefferson, A., Tuch, T., Birmili, W., Wiedensohler, A., and Pratt, K. A.: Effect of Prudhoe Bay emissions on atmospheric aerosol growth events observed in Utqiagvik (Barrow), Alaska, Atmos. Environ., 152, 146–155, https://doi.org/10.1016/j.atmosenv.2016.12.019, 2017.
Kulmala, M., Vehkamäki, H., Petäjä, T., Dal Maso, M., Lauri, A., Kerminen, V. M., Birmili, W., and McMurry, P. H.: Formation and growth rates of ultrafine atmospheric particles: a review of observations, J. Aerosol Sci., 35, 143–176, https://doi.org/10.1016/j.jaerosci.2003.10.003, 2004.
Law, K. S. and Stohl, A.: Arctic Air Pollution: Origins and Impacts, Science, 315, 1537–1540, https://doi.org/10.1126/science.1137695, 2007.
Leaitch, W. R., Sharma, S., Huang, L., Toom-Sauntry, D., Chivulescu, A., Macdonald, A. M., von Salzen, K., Pierce, J. R., Bertram, A. K., Schroder, J. C., Shantz, N. C., Chang, R. Y.-W., and Norman, A.-L.: Dimethyl sulfide control of the clean summertime Arctic aerosol and cloud, Elem. Sci. Anth., 1, 000017, https://doi.org/10.12952/journal.elementa.000017, 2013.
Leck, C., Norman, M., Bigg, E. K., and Hillamo, R.: Chemical composition and sources of the high Arctic aerosol relevant for cloud formation, 107, AAC1-1–AAC1-17, https://doi.org/10.1029/2001jd001463, 2002.
Levasseur, M.: Impact of Arctic meltdown on the microbial cycling of sulphur, Nat. Geosci., 6, 691, https://doi.org/10.1038/ngeo1910, 2013.
Lindwall, F., Schollert, M., Michelsen, A., Blok, D., and Rinnan, R.: Fourfold higher tundra volatile emissions due to arctic summer warming, 121, 895–902, https://doi.org/10.1002/2015jg003295, 2016.
Mann, P. J., Spencer, R. G. M., Hernes, P. J., Six, J., Aiken, G. R., Tank, S. E., McClelland, J. W., Butler, K. D., Dyda, R. Y., and Holmes, R. M.: Pan-Arctic Trends in Terrestrial Dissolved Organic Matter from Optical Measurements, Front. Earth Sci., 4, 25, https://doi.org/10.3389/feart.2016.00025, 2016.
Martin, M., Chang, R. Y.-W., Sierau, B., Sjogren, S., Swietlicki, E., Abbatt, J. P. D., Leck, C., and Lohmann, U.: Cloud condensation nuclei closure study on summer arctic aerosol, Atmos. Chem. Phys., 11, 11335–11350, https://doi.org/10.5194/acp-11-11335-2011, 2011.
Massicotte, P., Asmala, E., Stedmon, C., and Markager, S.: Global distribution of dissolved organic matter along the aquatic continuum: Across rivers, lakes and oceans, Sci. Total Environ., 609, 180–191, https://doi.org/10.1016/j.scitotenv.2017.07.076, 2017.
Mauritsen, T., Sedlar, J., Tjernström, M., Leck, C., Martin, M., Shupe, M., Sjogren, S., Sierau, B., Persson, P. O. G., Brooks, I. M., and Swietlicki, E.: An Arctic CCN-limited cloud-aerosol regime, Atmos. Chem. Phys., 11, 165–173, https://doi.org/10.5194/acp-11-165-2011, 2011.
Merikanto, J., Spracklen, D. V., Mann, G. W., Pickering, S. J., and Carslaw, K. S.: Impact of nucleation on global CCN, Atmos. Chem. Phys., 9, 8601–8616, https://doi.org/10.5194/acp-9-8601-2009, 2009.
Mungall, E. L., Croft, B., Lizotte, M., Thomas, J. L., Murphy, J. G., Levasseur, M., Martin, R. V., Wentzell, J. J. B., Liggio, J., and Abbatt, J. P. D.: Dimethyl sulfide in the summertime Arctic atmosphere: measurements and source sensitivity simulations, Atmos. Chem. Phys., 16, 6665–6680, https://doi.org/10.5194/acp-16-6665-2016, 2016.
Németh, Z. and Salma, I.: Spatial extension of nucleating air masses in the Carpathian Basin, Atmos. Chem. Phys., 14, 8841–8848, https://doi.org/10.5194/acp-14-8841-2014, 2014.
Nguyen, Q. T., Glasius, M., Sørensen, L. L., Jensen, B., Skov, H., Birmili, W., Wiedensohler, A., Kristensson, A., Nøjgaard, J. K., and Massling, A.: Seasonal variation of atmospheric particle number concentrations, new particle formation and atmospheric oxidation capacity at the high Arctic site Villum Research Station, Station Nord, Atmos. Chem. Phys., 16, 11319–11336, https://doi.org/10.5194/acp-16-11319-2016, 2016.
O'Dowd, C., Ceburnis, D., Ovadnevaite, J., Vaishya, A., Rinaldi, M., and Facchini, M. C.: Do anthropogenic, continental or coastal aerosol sources impact on a marine aerosol signature at Mace Head?, Atmos. Chem. Phys., 14, 10687–10704, https://doi.org/10.5194/acp-14-10687-2014, 2014.
O'Dowd, C. D., Jimenez, J. L., Bahreini, R., Flagan, R. C., Seinfeld, J. H., Hämeri, K., Pirjola, L., Kulmala, M., Jennings, S. G., and Hoffmann, T.: Marine aerosol formation from biogenic iodine emissions, Nature, 417, 632, https://doi.org/10.1038/nature00775, 2002.
Oziel, L., Neukermans, G., Ardyna, M., Lancelot, C., Tison, J.-L., Wassmann, P., Sirven, J., Ruiz-Pino, D., and Gascard, J.-C.: Role for Atlantic inflows and sea ice loss on shifting phytoplankton blooms in the Barents Sea, J. Geophys. Res.-Oceans, 122, 5121–5139, https://doi.org/10.1002/2016jc012582, 2017.
Pang, X., Pu, J., Zhao, X., Ji, Q., Qu, M., and Cheng, Z.: Comparison between AMSR2 Sea Ice Concentration Products and Pseudo-Ship Observations of the Arctic and Antarctic Sea Ice Edge on Cloud-Free Days, Remote Sens., 10, 317, 2018.
Park, J. and Yoon, Y. J.: Concentration of Black Carbon on ARAON, Arctic Cruise, 2017, https://doi.org/10.22663/KOPRI-KPDC-00001140.4, 2020a.
Park, J. and Yoon, Y. J.: Condensation Particle Counter concentration (CPC3776, CPC3772) on ARAON 2017 Arctic Cruise, https://doi.org/10.22663/KOPRI-KPDC-00001137.4, 2020b.
Park, J. and Yoon, Y. J.: Concentration for each diameter (nano and normal SMPS) Data on ARAON Arctic Cruise, 2017, https://doi.org/10.22663/KOPRI-KPDC-00001136.5, 2020c.
Park, J. and Yoon, Y. J.: Concentration of Optical Particle Counter for each diameter on ARAON, Arctic ocean, 2017, https://doi.org/10.22663/KOPRI-KPDC-00001138.4, 2020d.
Park, J. and Yoon, Y. J.: Cloud Condensation Nuclei concentration of 2017 Arctic Cruise, ARAON, 2017, https://doi.org/10.22663/KOPRI-KPDC-00001141.5, 2020e.
Park, J., Dall'Osto, M., Park, K., Kim, J.-H., Park, J., Park, K.-T., Hwang, C. Y., Jang, G. I., Gim, Y., Kang, S., Park, S., Jin, Y. K., Yum, S. S., Simó, R., and Yoon, Y. J.: Arctic Primary Aerosol Production Strongly Influenced by Riverine Organic Matter, Environ. Sci. Technol., 53, 8621–8630, https://doi.org/10.1021/acs.est.9b03399, 2019.
Park, K.-T., Jang, S., Lee, K., Yoon, Y. J., Kim, M.-S., Park, K., Cho, H.-J., Kang, J.-H., Udisti, R., Lee, B.-Y., and Shin, K.-H.: Observational evidence for the formation of DMS-derived aerosols during Arctic phytoplankton blooms, Atmos. Chem. Phys., 17, 9665–9675, https://doi.org/10.5194/acp-17-9665-2017, 2017.
Park, K.-T., Lee, K., Kim, T.-W., Yoon, Y. J., Jang, E.-H., Jang, S., Lee, B.-Y., and Hermansen, O.: Atmospheric DMS in the Arctic Ocean and Its Relation to Phytoplankton Biomass, Global Biogeochem. Cy., 32, 351–359, https://doi.org/10.1002/2017gb005805, 2018.
Peñuelas, J. and Staudt, M.: BVOCs and global change, Trend. Plant Sci., 15, 133–144, https://doi.org/10.1016/j.tplants.2009.12.005, 2010.
Peters, G. P., Nilssen, T. B., Lindholt, L., Eide, M. S., Glomsrød, S., Eide, L. I., and Fuglestvedt, J. S.: Future emissions from shipping and petroleum activities in the Arctic, Atmos. Chem. Phys., 11, 5305–5320, https://doi.org/10.5194/acp-11-5305-2011, 2011.
Peterson, B. J., Holmes, R. M., McClelland, J. W., Vörösmarty, C. J., Lammers, R. B., Shiklomanov, A. I., Shiklomanov, I. A., and Rahmstorf, S.: Increasing River Discharge to the Arctic Ocean, Science, 298, 2171–2173, https://doi.org/10.1126/science.1077445, 2002.
Pierce, J. R., Leaitch, W. R., Liggio, J., Westervelt, D. M., Wainwright, C. D., Abbatt, J. P. D., Ahlm, L., Al-Basheer, W., Cziczo, D. J., Hayden, K. L., Lee, A. K. Y., Li, S.-M., Russell, L. M., Sjostedt, S. J., Strawbridge, K. B., Travis, M., Vlasenko, A., Wentzell, J. J. B., Wiebe, H. A., Wong, J. P. S., and Macdonald, A. M.: Nucleation and condensational growth to CCN sizes during a sustained pristine biogenic SOA event in a forested mountain valley, Atmos. Chem. Phys., 12, 3147–3163, https://doi.org/10.5194/acp-12-3147-2012, 2012.
Pierce, J. R., Westervelt, D. M., Atwood, S. A., Barnes, E. A., and Leaitch, W. R.: New-particle formation, growth and climate-relevant particle production in Egbert, Canada: analysis from 1 year of size-distribution observations, Atmos. Chem. Phys., 14, 8647–8663, https://doi.org/10.5194/acp-14-8647-2014, 2014.
Potosnak, M. J., Baker, B. M., LeStourgeon, L., Disher, S. M., Griffin, K. L., Bret-Harte, M. S., and Starr, G.: Isoprene emissions from a tundra ecosystem, Biogeosciences, 10, 871–889, https://doi.org/10.5194/bg-10-871-2013, 2013.
Quinn, P. K. and Bates, T. S.: The case against climate regulation via oceanic phytoplankton sulphur emissions, Nature, 480, 51–56, https://doi.org/10.1038/nature10580, 2011.
Quinn, P. K., Collins, D. B., Grassian, V. H., Prather, K. A., and Bates, T. S.: Chemistry and Related Properties of Freshly Emitted Sea Spray Aerosol, Chem. Rev., 115, 4383–4399, https://doi.org/10.1021/cr500713g, 2015.
Raso, A. R. W., Custard, K. D., May, N. W., Tanner, D., Newburn, M. K., Walker, L., Moore, R. J., Huey, L. G., Alexander, L., Shepson, P. B., and Pratt, K. A.: Active molecular iodine photochemistry in the Arctic, P. Natl. Acad. Sci. USA, 114, 10053–10058, https://doi.org/10.1073/pnas.1702803114, 2017.
Schmale, J., Arnold, S. R., Law, K. S., Thorp, T., Anenberg, S., Simpson, W. R., Mao, J., and Pratt, K. A.: Local Arctic Air Pollution: A Neglected but Serious Problem, Earth's Future, 6, 1385–1412, https://doi.org/10.1029/2018ef000952, 2018a.
Schmale, J., Henning, S., Decesari, S., Henzing, B., Keskinen, H., Sellegri, K., Ovadnevaite, J., Pöhlker, M. L., Brito, J., Bougiatioti, A., Kristensson, A., Kalivitis, N., Stavroulas, I., Carbone, S., Jefferson, A., Park, M., Schlag, P., Iwamoto, Y., Aalto, P., Äijälä, M., Bukowiecki, N., Ehn, M., Frank, G., Fröhlich, R., Frumau, A., Herrmann, E., Herrmann, H., Holzinger, R., Kos, G., Kulmala, M., Mihalopoulos, N., Nenes, A., O'Dowd, C., Petäjä, T., Picard, D., Pöhlker, C., Pöschl, U., Poulain, L., Prévôt, A. S. H., Swietlicki, E., Andreae, M. O., Artaxo, P., Wiedensohler, A., Ogren, J., Matsuki, A., Yum, S. S., Stratmann, F., Baltensperger, U., and Gysel, M.: Long-term cloud condensation nuclei number concentration, particle number size distribution and chemical composition measurements at regionally representative observatories, Atmos. Chem. Phys., 18, 2853–2881, https://doi.org/10.5194/acp-18-2853-2018, 2018b.
Schollert, M., Burchard, S., Faubert, P., Michelsen, A., and Rinnan, R. J. P. B.: Biogenic volatile organic compound emissions in four vegetation types in high arctic Greenland, Polar Biol., 37, 237–249, https://doi.org/10.1007/s00300-013-1427-0, 2014.
Sellegri, K., O'Dowd, C. D., Yoon, Y. J., Jennings, S. G., and Leeuw, G. d.: Surfactants and submicron sea spray generation, J. Geophys. Res.-Atmos., 111, D22215, https://doi.org/10.1029/2005JD006658, 2006.
Shen, Y., Fichot, C. G., and Benner, R.: Dissolved organic matter composition and bioavailability reflect ecosystem productivity in the Western Arctic Ocean, Biogeosciences, 9, 4993–5005, https://doi.org/10.5194/bg-9-4993-2012, 2012.
Shiklomanov, I. A., Shiklomanov, A. I., Lammers, R. B., Peterson, B. J., and Vorosmarty, C. J.: The Dynamics of River Water Inflow to the Arctic Ocean, in: The Freshwater Budget of the Arctic Ocean, edited by: Lewis, E. L., Jones, E. P., Lemke, P., Prowse, T. D., and Wadhams, P., Springer Netherlands, Dordrecht, 281–296, 2000.
Spracklen, D. V., Carslaw, K. S., Kulmala, M., Kerminen, V.-M., Sihto, S.-L., Riipinen, I., Merikanto, J., Mann, G. W., Chipperfield, M. P., Wiedensohler, A., Birmili, W., and Lihavainen, H.: Contribution of particle formation to global cloud condensation nuclei concentrations, Geophys. Res. Lett., 35, L06808, https://doi.org/10.1029/2007GL033038, 2008.
Steinke, M., Hodapp, B., Subhan, R., Bell, T. G., and Martin-Creuzburg, D.: Flux of the biogenic volatiles isoprene and dimethyl sulfide from an oligotrophic lake, Sci. Rep., 8, 630, https://doi.org/10.1038/s41598-017-18923-5, 2018.
Stier, P., Seinfeld, J. H., Kinne, S., and Boucher, O.: Aerosol absorption and radiative forcing, Atmos. Chem. Phys., 7, 5237–5261, https://doi.org/10.5194/acp-7-5237-2007, 2007.
Stroeve, J. C., Serreze, M. C., Holland, M. M., Kay, J. E., Malanik, J., and Barrett, A. P.: The Arctic's rapidly shrinking sea ice cover: a research synthesis, Clim. Change, 110, 1005–1027, https://doi.org/10.1007/s10584-011-0101-1, 2012.
Ström, J., Umegård, J., Tørseth, K., Tunved, P., Hansson, H. C., Holmén, K., Wismann, V., Herber, A., and König-Langlo, G.: One year of particle size distribution and aerosol chemical composition measurements at the Zeppelin Station, Svalbard, March 2000–March 2001, Phys. Chem. Earth, Parts A/B/C, 28, 1181–1190, https://doi.org/10.1016/j.pce.2003.08.058, 2003.
Suni, T., Kulmala, M., Hirsikko, A., Bergman, T., Laakso, L., Aalto, P. P., Leuning, R., Cleugh, H., Zegelin, S., Hughes, D., van Gorsel, E., Kitchen, M., Vana, M., Hõrrak, U., Mirme, S., Mirme, A., Sevanto, S., Twining, J., and Tadros, C.: Formation and characteristics of ions and charged aerosol particles in a native Australian Eucalypt forest, Atmos. Chem. Phys., 8, 129–139, https://doi.org/10.5194/acp-8-129-2008, 2008.
Svenningsson, B., Arneth, A., Hayward, S., Holst, T., Massling, A., Swietlicki, E., Hirsikko, A., Junninen, H., Riipinen, I., Vana, M., Maso, M. D., Hussein, T., and Kulmala, M.: Aerosol particle formation events and analysis of high growth rates observed above a subarctic wetland–forest mosaic, Tellus B: Chem. Phys. Meteorol., 60, 353–364, https://doi.org/10.1111/j.1600-0889.2008.00351.x, 2008.
Tape, K., Sturm, M., and Racine, C.: The evidence for shrub expansion in Northern Alaska and the Pan-Arctic, Glob. Change Biol., 12, 686–702, https://doi.org/10.1111/j.1365-2486.2006.01128.x, 2006.
Tremblay, S., Picard, J.-C., Bachelder, J. O., Lutsch, E., Strong, K., Fogal, P., Leaitch, W. R., Sharma, S., Kolonjari, F., Cox, C. J., Chang, R. Y.-W., and Hayes, P. L.: Characterization of aerosol growth events over Ellesmere Island during the summers of 2015 and 2016, Atmos. Chem. Phys., 19, 5589–5604, https://doi.org/10.5194/acp-19-5589-2019, 2019.
Tunved, P., Ström, J., and Krejci, R.: Arctic aerosol life cycle: linking aerosol size distributions observed between 2000 and 2010 with air mass transport and precipitation at Zeppelin station, Ny-Ålesund, Svalbard, Atmos. Chem. Phys., 13, 3643–3660, https://doi.org/10.5194/acp-13-3643-2013, 2013.
Twomey, S.: Pollution and the planetary albedo, Atmos. Environ., 8, 1251–1256, https://doi.org/10.1016/0004-6981(74)90004-3, 1974.
Väänänen, R., Kyrö, E.-M., Nieminen, T., Kivekäs, N., Junninen, H., Virkkula, A., Dal Maso, M., Lihavainen, H., Viisanen, Y., Svenningsson, B., Holst, T., Arneth, A., Aalto, P. P., Kulmala, M., and Kerminen, V.-M.: Analysis of particle size distribution changes between three measurement sites in northern Scandinavia, Atmos. Chem. Phys., 13, 11887–11903, https://doi.org/10.5194/acp-13-11887-2013, 2013.
Vana, M., Kulmala, M., Dal Maso, M., Hõrrak, U., and Tamm, E.: Comparative study of nucleation mode aerosol particles and intermediate air ions formation events at three sites, J. Geophys. Res.-Atmos., 109, D17201, https://doi.org/10.1029/2003jd004413, 2004.
Vehkamäki, H., Dal Maso, M., Hussein, T., Flanagan, R., Hyvärinen, A., Lauros, J., Merikanto, P., Mönkkönen, M., Pihlatie, K., Salminen, K., Sogacheva, L., Thum, T., Ruuskanen, T. M., Keronen, P., Aalto, P. P., Hari, P., Lehtinen, K. E. J., Rannik, Ü., and Kulmala, M.: Atmospheric particle formation events at Värriö measurement station in Finnish Lapland 1998–2002, Atmos. Chem. Phys., 4, 2015–2023, https://doi.org/10.5194/acp-4-2015-2004, 2004.
Wang, M. and Overland, J. E.: A sea ice free summer Arctic within 30 years?, Geophys. Res. Lett., 36, L07502, https://doi.org/10.1029/2009GL037820, 2009.
Watson, J. G., Chow, J. C., Sodeman, D. A., Lowenthal, D. H., Chang, M. C. O., Park, K., and Wang, X.: Comparison of four scanning mobility particle sizers at the Fresno Supersite, Particuology, 9, 204–209, 2011.
Westervelt, D. M., Pierce, J. R., and Adams, P. J.: Analysis of feedbacks between nucleation rate, survival probability and cloud condensation nuclei formation, Atmos. Chem. Phys., 14, 5577–5597, https://doi.org/10.5194/acp-14-5577-2014, 2014.
Willis, M. D., Burkart, J., Thomas, J. L., Köllner, F., Schneider, J., Bozem, H., Hoor, P. M., Aliabadi, A. A., Schulz, H., Herber, A. B., Leaitch, W. R., and Abbatt, J. P. D.: Growth of nucleation mode particles in the summertime Arctic: a case study, Atmos. Chem. Phys., 16, 7663–7679, https://doi.org/10.5194/acp-16-7663-2016, 2016.
Willis, M. D., Leaitch, W. R., and Abbatt, J. P. D.: Processes Controlling the Composition and Abundance of Arctic Aerosol, Rev. Geophys., 56, 621–671, https://doi.org/10.1029/2018rg000602, 2018.
Yum, S. S., Hudson, J. G., and Xie, Y.: Comparisons of cloud microphysics with cloud condensation nuclei spectra over the summertime Southern Ocean, J. Geophys. Res.-Atmos., 103, 16625–16636, https://doi.org/10.1029/98jd01513, 1998.
Zhang, R., Khalizov, A., Wang, L., Hu, M., and Xu, W.: Nucleation and Growth of Nanoparticles in the Atmosphere, Chem. Rev., 112, 1957–2011, https://doi.org/10.1021/cr2001756, 2012.
Ziemba, L. D., Dibb, J. E., Griffin, R. J., Huey, L. G., and Beckman, P.: Observations of particle growth at a remote, Arctic site, Atmos. Environ., 44, 1649–1657, https://doi.org/10.1016/j.atmosenv.2010.01.032, 2010.