the Creative Commons Attribution 4.0 License.
the Creative Commons Attribution 4.0 License.
 | 11 May 2020
Contribution of nitrous acid to the atmospheric oxidation capacity in an industrial zone in the Yangtze River Delta region of China
Xiaowen Shi
Yan Ma
Xinrong Ren
Halim Jabbour
Yiwei Diao
Weiwei Wang
Yifeng Ge
Yuchan Zhang
Wenhui Zhu
A suite of instruments was deployed to simultaneously measure nitrous acid (HONO), nitrogen oxides (NOx = NO + NO2), carbon monoxide (CO), ozone (O3), volatile organic compounds (VOCs – including formaldehyde, HCHO) and meteorological parameters near a typical industrial zone in Nanjing in the Yangtze River Delta (YRD) region of China from 1 to 31 December 2015. High levels of HONO were detected using a wet-chemistry-based method. HONO ranged from 0.03 to 7.04 ppbv with an average of 1.32±0.92 ppbv. Elevated daytime HONO was frequently observed with a minimum of several hundred parts per trillion by volume (pptv) on average, which cannot be explained by the homogeneous OH + NO reaction (POH+NO) and primary emissions (Pemission), especially during periods with high particulate matter (PM2.5) loadings. HONO chemistry and its impact on the atmospheric oxidation capacity in the study area were further investigated using a Master Chemical Mechanism (MCM) box model. The results show that the average hydroxyl radical (OH) production rate was dominated by the photolysis of HONO (7.13×10⁶ molec. cm−3 s−1), followed by the ozonolysis of alkenes (3.94×10⁶ molec. cm−3 s−1), the photolysis of O3 (2.46×10⁶ molec. cm−3 s−1) and the photolysis of HCHO (1.60×10⁶ molec. cm−3 s−1) during the campaign period, especially within plumes that originated from the industrial zone. Model simulations indicated that heterogeneous chemistry played an important role in HONO formation. The average nighttime NO2 to HONO conversion rate was determined to be ∼0.8 % h−1. A good correlation between nocturnal HONO∕NO2 and the product of particle surface area density (S∕V) and relative humidity (RH), , supports the heterogeneous NO2∕H2O reaction mechanism. The other HONO source, designated as Punknonwn, was about twice as high as POH+NO on average and displayed a diurnal profile with an evidently photo-enhanced feature, i.e., photosensitized reactions of NO2 may be an important daytime HONO source. Nevertheless, our results suggest that daytime HONO formation was mostly due to the light-induced conversion of NO2 on aerosol surfaces, whereas heterogeneous NO2 reactions on the ground surface dominated nocturnal HONO production. Our study indicated that an elevated PM2.5 level during haze events can promote the conversion of NO2 to HONO by providing more heterogeneous reaction sites, thereby increasing the atmospheric oxidation capacity, which may further promote the formation of secondary air pollutants.
Highlights:
-
High levels of HONO, with an average of 1.32±0.92 ppbv, were observed near one of the largest industrial zones in the YRD region of China.
-
HONO photolysis and alkene ozonolyses contributed the most to OH production and, hence, the atmospheric oxidation capacity.
-
High loading of PM2.5 provided additional reaction surfaces for HONO formation.
-
Heterogeneous formation mechanisms were the most important daytime HONO sources and were further enhanced by sunlight.
- Article
(7540 KB) - Full-text XML
-
Supplement
(135 KB) - BibTeX
- EndNote


Nitrous acid (HONO) plays an important role in tropospheric photochemistry because its fast photolysis contributes to the formation of the hydroxyl (OH) radical, which is an essential atmospheric oxidant that initiates the oxidation of volatile organic compounds (VOC) to form organic peroxy radicals (RO2) and hydroperoxyl radicals (HO2). In the presence of nitrogen oxides (NOx = NO + NO2), these free radicals are the fundamental driving force of photochemical reaction cycles that lead to the formation of ground-level ozone (O3) and secondary organic aerosols (SOAs; Finlayson-Pitts and Pitts, 1999; Xue et al., 2016). Besides HONO photolysis (Reaction R1), the major known OH radical initiation sources include the photolysis of O3 (Reactions R2 and R3) and formaldehyde (HCHO; Reactions R4 to R8) and the ozonolysis of alkenes (Reaction R9; Finlayson-Pitts and Pitts, 1999). Nevertheless, many field studies have demonstrated that HONO may strongly affect the atmospheric oxidation capacity in various environments (Bernard et al., 2016; Elshorbany et al., 2009, 2010; Zhou et al., 2002). In early studies, HONO was only believed to be an important NOx reservoir during nighttime, when HONO can accumulate in the atmosphere and subsequently boost photochemistry in the following early morning (Platt et al., 1980). However, recent field studies have demonstrated that high concentrations of HONO are often present in the relatively polluted urban areas during the day. Due to high levels of HONO, the photolysis of HONO becomes an important OH source not only in the early morning but also throughout the day and can contribute up to 30 %–90 % of OH radicals during daytime (Acker et al., 2006; Hendrick et al., 2014; Kleffmann et al., 2005; Neftel et al., 1996; Spataro et al., 2013; Su et al., 2008; Zhou et al., 2002).
Despite the significance of HONO in daytime photochemistry, the sources and formation mechanisms of HONO, especially during daytime, are still uncertain. Traditionally, the reaction between NO and OH was thought to be the most important homogeneous source for HONO (Perner and Platt, 1979):
However, Reaction (R10) alone cannot sustain the high HONO level observed during daytime in many studies, in which the observed HONO levels were often an order of magnitude greater than the modeled HONO when only homogeneous HONO sources (Reaction R10) were included in the model (Ren et al., 2010; Tang et al., 2015). Nevertheless, the higher than expected OH observed in several studies (Hofzumahaus et al., 2009) may partially explain the higher observed HONO levels compared with those predicted by the model. It has been suggested that HONO may be emitted directly by incomplete combustion processes, such as vehicle exhaust (Kirchstetter et al., 1996; Kurtenbach et al., 2001; Liang et al., 2017; Nakashima and Kajii, 2017; Trinh et al., 2017; Xu et al., 2015) and biomass burning (Müller et al., 2016; Neuman et al., 2016; Nie et al., 2015; Rondon and Sanhueza, 1989). However, such strong but sporadic point sources could not account for the widely observed daytime HONO in the polluted areas (Elshorbany et al., 2012; Wang et al., 2017). Recently, many other HONO formation pathways have been proposed. Su et al. (2011) pointed out that HONO can be released from soil nitrite, which is formed through biological nitrification and denitrification processes; moreover, recent studies have demonstrated that the pH and organic content of soil could influence the HONO emission rate (Scharko et al., 2017; Sörgel et al., 2015). In addition, vertical profiles of HONO measurements have indicated that HONO very likely originated from the ground surface (Kleffmann et al., 2003; VandenBoer et al., 2013; Wong et al., 2011, 2013). However, the presence of in situ HONO sources in the air masses aloft cannot be ruled out (Wong et al., 2013; Zhang et al., 2009).
Several heterogeneous processes have drawn substantial attention and are proposed as the major HONO sources, including (1) the heterogeneous conversion of NO2 on wet surfaces (Finlayson-Pitts et al., 2003), which could be an important nocturnal HONO source; (2) NO2 heterogeneous reaction with fresh soot particles (Ammann et al., 1998; Gerecke et al., 1998; Han et al., 2017a; Monge et al., 2010) and semi-volatile organic compounds emitted from diesel exhausts (George et al., 2005; Gutzwiller et al., 2002), which could be an important process because it is 1 to 2 orders of magnitude faster than the typically proposed heterogeneous reaction of 2NO2 + H2O; (3) the photosensitized reaction of NO2 on surfaces of mineral dust (Ndour et al., 2008), humic acid (Han et al., 2017b; Wall and Harris, 2016) and the ground surface (i.e., certain reactions such as NO2 + humic acids on ground surfaces) (Wong et al., 2012), which has been considered as an important daytime HONO source (Lee et al., 2016); (4) the photolysis of adsorbed nitric acid (HNO3) and nitrate () (Ye et al., 2016, 2017; Zhou et al., 2002, 2003, 2011; Ziemba et al., 2010); and (5) the VOC-mediated conversion of HNO3 to HONO (Gall et al., 2016).
Since the first atmospheric HONO measurement by Nash (1974) and the first use of the long-path differential optical absorption technique (LP-DOAS) for in situ measurements of atmospheric HONO (Perner and Platt, 1979), various measurement techniques for HONO have been developed, such as spectroscopic techniques, wet-chemistry-based techniques and chemical ionization mass spectrometry (CIMS). Besides the DOAS technique, other spectroscopic techniques such as cavity ring-down spectroscopy (Rairoux et al., 2002), incoherent broadband cavity-enhanced absorption spectroscopy (IBBCEAS; Gherman et al., 2008) and cavity-enhanced absorption spectrometry (CEAS; Scharko et al., 2017) have been applied in HONO measurements. Wet chemistry techniques, including instruments such as the long-path absorption photometer (LOPAP; Heland et al., 2001; Kleffmann et al., 2003, 2005, 2006; Kleffmann and Wiesen, 2008; Vecera and Dasgupta, 1991), the AIM-IC analysis system and the wet-rotating-denuder (WRD; Makkonen et al., 2012), have the advantages of higher sensitivity and a lower detection limit. Very recently, CIMS techniques have been developed for fast online HONO measurements (Bernard et al., 2016; Pinto et al., 2014; Ren et al., 2010).
The Yangtze River Delta (YRD) region is the largest industrial zone in China and is experiencing ever increasing air pollution events that are characterized by high ozone (O3) and fine particulate matter (PM2.5) concentrations (Ding et al., 2013). Despite great efforts to reduce sulfur dioxide (SO2) and NOx emissions from industrial activities, high levels of NOx as well as ammonia and amines have been observed near an industrial park in this region (Zheng et al., 2015b). In addition, high levels of HCHO have frequently been observed near industrial zones in China (Ma et al., 2016; M. Wang et al., 2015), providing an extra radical source. HONO concentrations calculated using a photostationary state (PSS) approach that included homogeneous sources have been found to be much lower than measured values during daytime (Kleffmann et al., 2005; Michoud et al., 2014). Lee et al. (2016) conducted a detailed analysis of the HONO budget and proposed that the missing daytime HONO source was related to NO2 and sunlight. A four-season measurement campaign was carried out at an urban site in Beijing, and the results showed monthly averaged HONO concentrations between 1.05 and 2.27 ppbv with a pronounced seasonal profile (Wang et al., 2017). In a recent study, Nie et al. (2015) revealed the influence of biomass burning on HONO formation at a suburban site in Nanjing and demonstrated the contribution of the heterogeneous conversion of NO2 to HONO formation. However, so far, no comprehensive study on the oxidizing capability, i.e., the major contributors of OH radicals, has ever been conducted in the industrial zone of the YRD region.
In this work, we performed HONO measurements using a custom-built wet-chemistry-based method at an industrial site in Nanjing, China, in December 2015. In addition, HCHO, O3, photolysis frequencies, and other trace gases and meteorological parameters were also measured. The contributions of HONO and other OH sources to the OH budget were investigated using a box model based on Master Chemical Mechanism (MCM). The mechanisms of possible daytime HONO formation and their consequent impacts on air pollutants formation were also explored.
2.1 HONO measurement
The field measurements were carried out from 1 to 31 December 2015 on the campus of the Nanjing University of Information Science and Technology (NUIST) in Nanjing, China. More details about the observation site have been provided in our previous work (Ma et al., 2016; Zheng et al., 2015b). Briefly, the site is located to the west of clusters of steel mills and petrochemical refinery facilities and is about 15 km to the north of downtown Nanjing. All instruments were placed inside an air-conditioned trailer. In this study, a custom-built wet-chemistry-based HONO instrument, which was originally developed by Ren et al. (2010), was utilized for HONO measurements. Figure 1 shows the schematics of the HONO instrument, which consists of two sample collection glass coils connected successively, a 10-port injection valve (Valco Instruments Co. Inc.), a 1 m long liquid waveguide capillary cell (LWCC, World Precision Instruments), and a mini spectrometer (USB4000, Ocean Optics). Two coil samplers were used in series: total signals were measured in the first sampler, and the background was measured in the second sampler. The difference between the two samplers is the net HONO signal. The background signal is usually only a few percent of the total signal.

To minimize the sampling artifacts, the sampling coils were set up about 3.5 m above the ground (1.5 m above the trailer rooftop) and no inlet was used. Ambient air was pulled through the coils by a vacuum pump at 1 L min−1, which was controlled by a mass flow controller (MKS, model M100B). In the first coil, HONO along with some interfering species in the air sample were separated from the gas phase and transformed into nitrite solution by a 1.0 mmol L−1 phosphate buffer scrubbing solution. Potential interfering species (e.g., NO2) would also interact with scrubbing solution in the second coil in a similar way as in the first coil. The nitrite solutions from the two coils were then respectively mixed with sulfanilamide/N-(1-naphthyl)ethylenediamine (SA/NED) reagents in Teflon derivatization tubing, and nitrite was converted via the two reactions (see SR1 and SR2 in the Supplement for details; Huang et al., 2002). The aqueous sample was injected into the LWCC and the azo dye produced was quantified by its absorption at 560 nm using a mini USB spectrometer. The difference between the absorbance signals of the two coils was treated as the actual HONO signal. The HONO mixing ratio in ambient air was calculated using Eq. (1):
where Cl is the nitrite concentration (mol L−1) in the scrubbing solution, Fl is the liquid flow rate (mL min−1) of the scrubbing solution, Fg is the sampling air flow rate (L min−1), R is the ideal gas constant (8.314 m3 Pa K−1 mol−1), and T and P are the respective ambient temperature (294 K) and atmospheric pressure (101 325 Pa) under which the mass flow controller (MFC) that was used to control the sample flow rate was calibrated (Ren et al., 2010). The instrument calibration was carried out once every 4 d by injecting standard sodium nitrite (NaNO2) solution into the instrument right after the sampling coil. According to the calibration curve, the HONO mixing ratio in ambient air can be quantified. The detection limit of the HONO instrument was about 3 pptv with a time resolution of 2 min. The measurement accuracy was about ±15 % at a 95 % confidence level (Ren et al., 2010).
2.2 Other measurements
As the observation site was part of a national standard meteorology observatory facility, meteorological parameters, including wind direction, wind speed, ambient temperature, pressure and RH, were continuously measured. Trace gases, CO (Thermo Scientific, Model 48i), O3 (Thermo Scientific, Model 49i), SO2 (Thermo Scientific, Model 43i) and NOx (Thermo Scientific, Model 17i) were also measured at the observation site. The Thermo Scientific 17i is designed as an ammonia (NH3) analyzer. It basically consists of a typical NOx analyzer and an external high-temperature (700 ∘C) NH3 converter, which is disabled and bypassed in this work. Therefore, it was used as a typical NOx analyzer. It is well known that a NO–NOx analyzer with a molybdenum-based converter can convert a portion of NOz (= NOy − NOx) to NO, which can then be detected as NO2 and cause an interference in the NO2 measurement (Villena et al., 2012). However, an aircraft study conducted in the eastern US in the winter of 2015 found that, within 6 h of transport time, NOx accounts for more than 90 % of NOy in an urban outflow (Salmon et al., 2018). A sensitivity analysis showed that by decreasing the NO2 level of 10 % (an upper limit assuming all NOz is converted into NO with an efficiency of 100 %), the modeled HONO only decreased by 5.3 %, indicating that the abovementioned possible small interference in the NO2 measurement did not impact significantly on the modeled HONO results. Details regarding the operation and calibration of these instruments have been described in previous work (Zheng et al., 2015b). PM2.5 was observed using an online PM2.5 particulate monitor (METONE, BAM-1020) with a time resolution of 1 h. Aerosol surface area density was calculated using data from a wide particle spectrometer (MSP model 1000XP) with a time resolution of 5 min. HCHO was measured using the DNPH method from 19 to 30 December 2015, and the sampling time was 2 h during the campaign. For detailed operation procedures regarding the DNPH method in this study, readers are referred to our previous work (Ma et al., 2016). Photolysis frequencies (J values), including J(O1D), J(NO2), J(HONO), J(H2O2), J(HCHO) and J(NO3), were calculated based on measurements by an ultrafast charge-coupled device (CCD) detector spectrometer (Meteorologie Consult GmbH, Germany). The acquisition time for J values was 1 min. Other photolysis frequencies (such as carbonyls with more than two carbons) used in the model were calculated using Eq. (2) (Jenkin et al., 1997):
where χ is the solar zenith angle, and Li, Mi and Ni are photolysis parameters that are taken from Jenkin et al. (1997) for clear-sky conditions. The calculated photolysis frequencies were then scaled by the measured J(NO2) for cloudiness correction.
Volatile organic compound (VOC) measurements were conducted using a commercial gas chromatograph equipped with a flame ionization detector (GC-FID; AMA, GC5000). A total of 60 VOC species including C2–C12 hydrocarbons were detected with a time resolution of 1 h. A total of 10 of the most reactive alkenes were used in the ozonolysis reaction in the box model simulations. Although oxygenated VOCs (OVOCs), other than formaldehyde and some other carbonyls (using the DNPH method), were not measured in this study, they were simulated in the box model that was constrained to measured VOCs. Our results indicated that OVOCs only accounted for a small portion of the total VOCs in this industrial area and even contributed much less to the total VOC OH reactivity. Therefore, the limited VOCs detected in this work would not significantly affect the following model simulation results.
2.3 Box model
To evaluate the effect of HONO on the daytime atmospheric oxidation capacity, a chemical box model with the Master Chemical Mechanism (MCMv3.2) (Jenkin et al., 2012) was applied to calculate the concentrations of OH, HO2 radicals, and their production and loss rates using the FACSIMILE software package (MCPA Software Ltd., UK). Kinetic rate coefficients were taken from the MCM website (http://mcm.leeds.ac.uk/MCM/, last access: 1 July 2019). In this study, the model simulation was constrained with hourly averaged measurement results, including HONO, O3, NO, NO2, CO, SO2, HCHO, VOCs, and water vapor, temperature, pressure and photolysis frequencies.
Monte Carlo sensitivity analyses were conducted to assess the model performance. In each Monte Carlo simulation, the input variables of the model, including HONO, O3, NO, NO2, CO, SO2, HCHO, VOCs, reaction rate constants, photolysis frequencies and the planetary boundary layer (PBL) height were independently set to vary within ±10 % of the mean value of the individual variable with a normal probability distribution.
3.1 Data overview
Figure 2 shows the time series of NO, NO2, O3, PM2.5, HONO, HCHO, J(HONO) and meteorological parameters, including wind direction, wind speed, temperature and RH. During the entire campaign period, the wind speed ranged from 0.1 to 8.1 m s−1 with an average of 1.7 m s−1; the temperature varied between −4.1 and 16.1 ∘C with an average of 6.1 ∘C; RH varied from 17 % to 96 % with an average of 68 %.
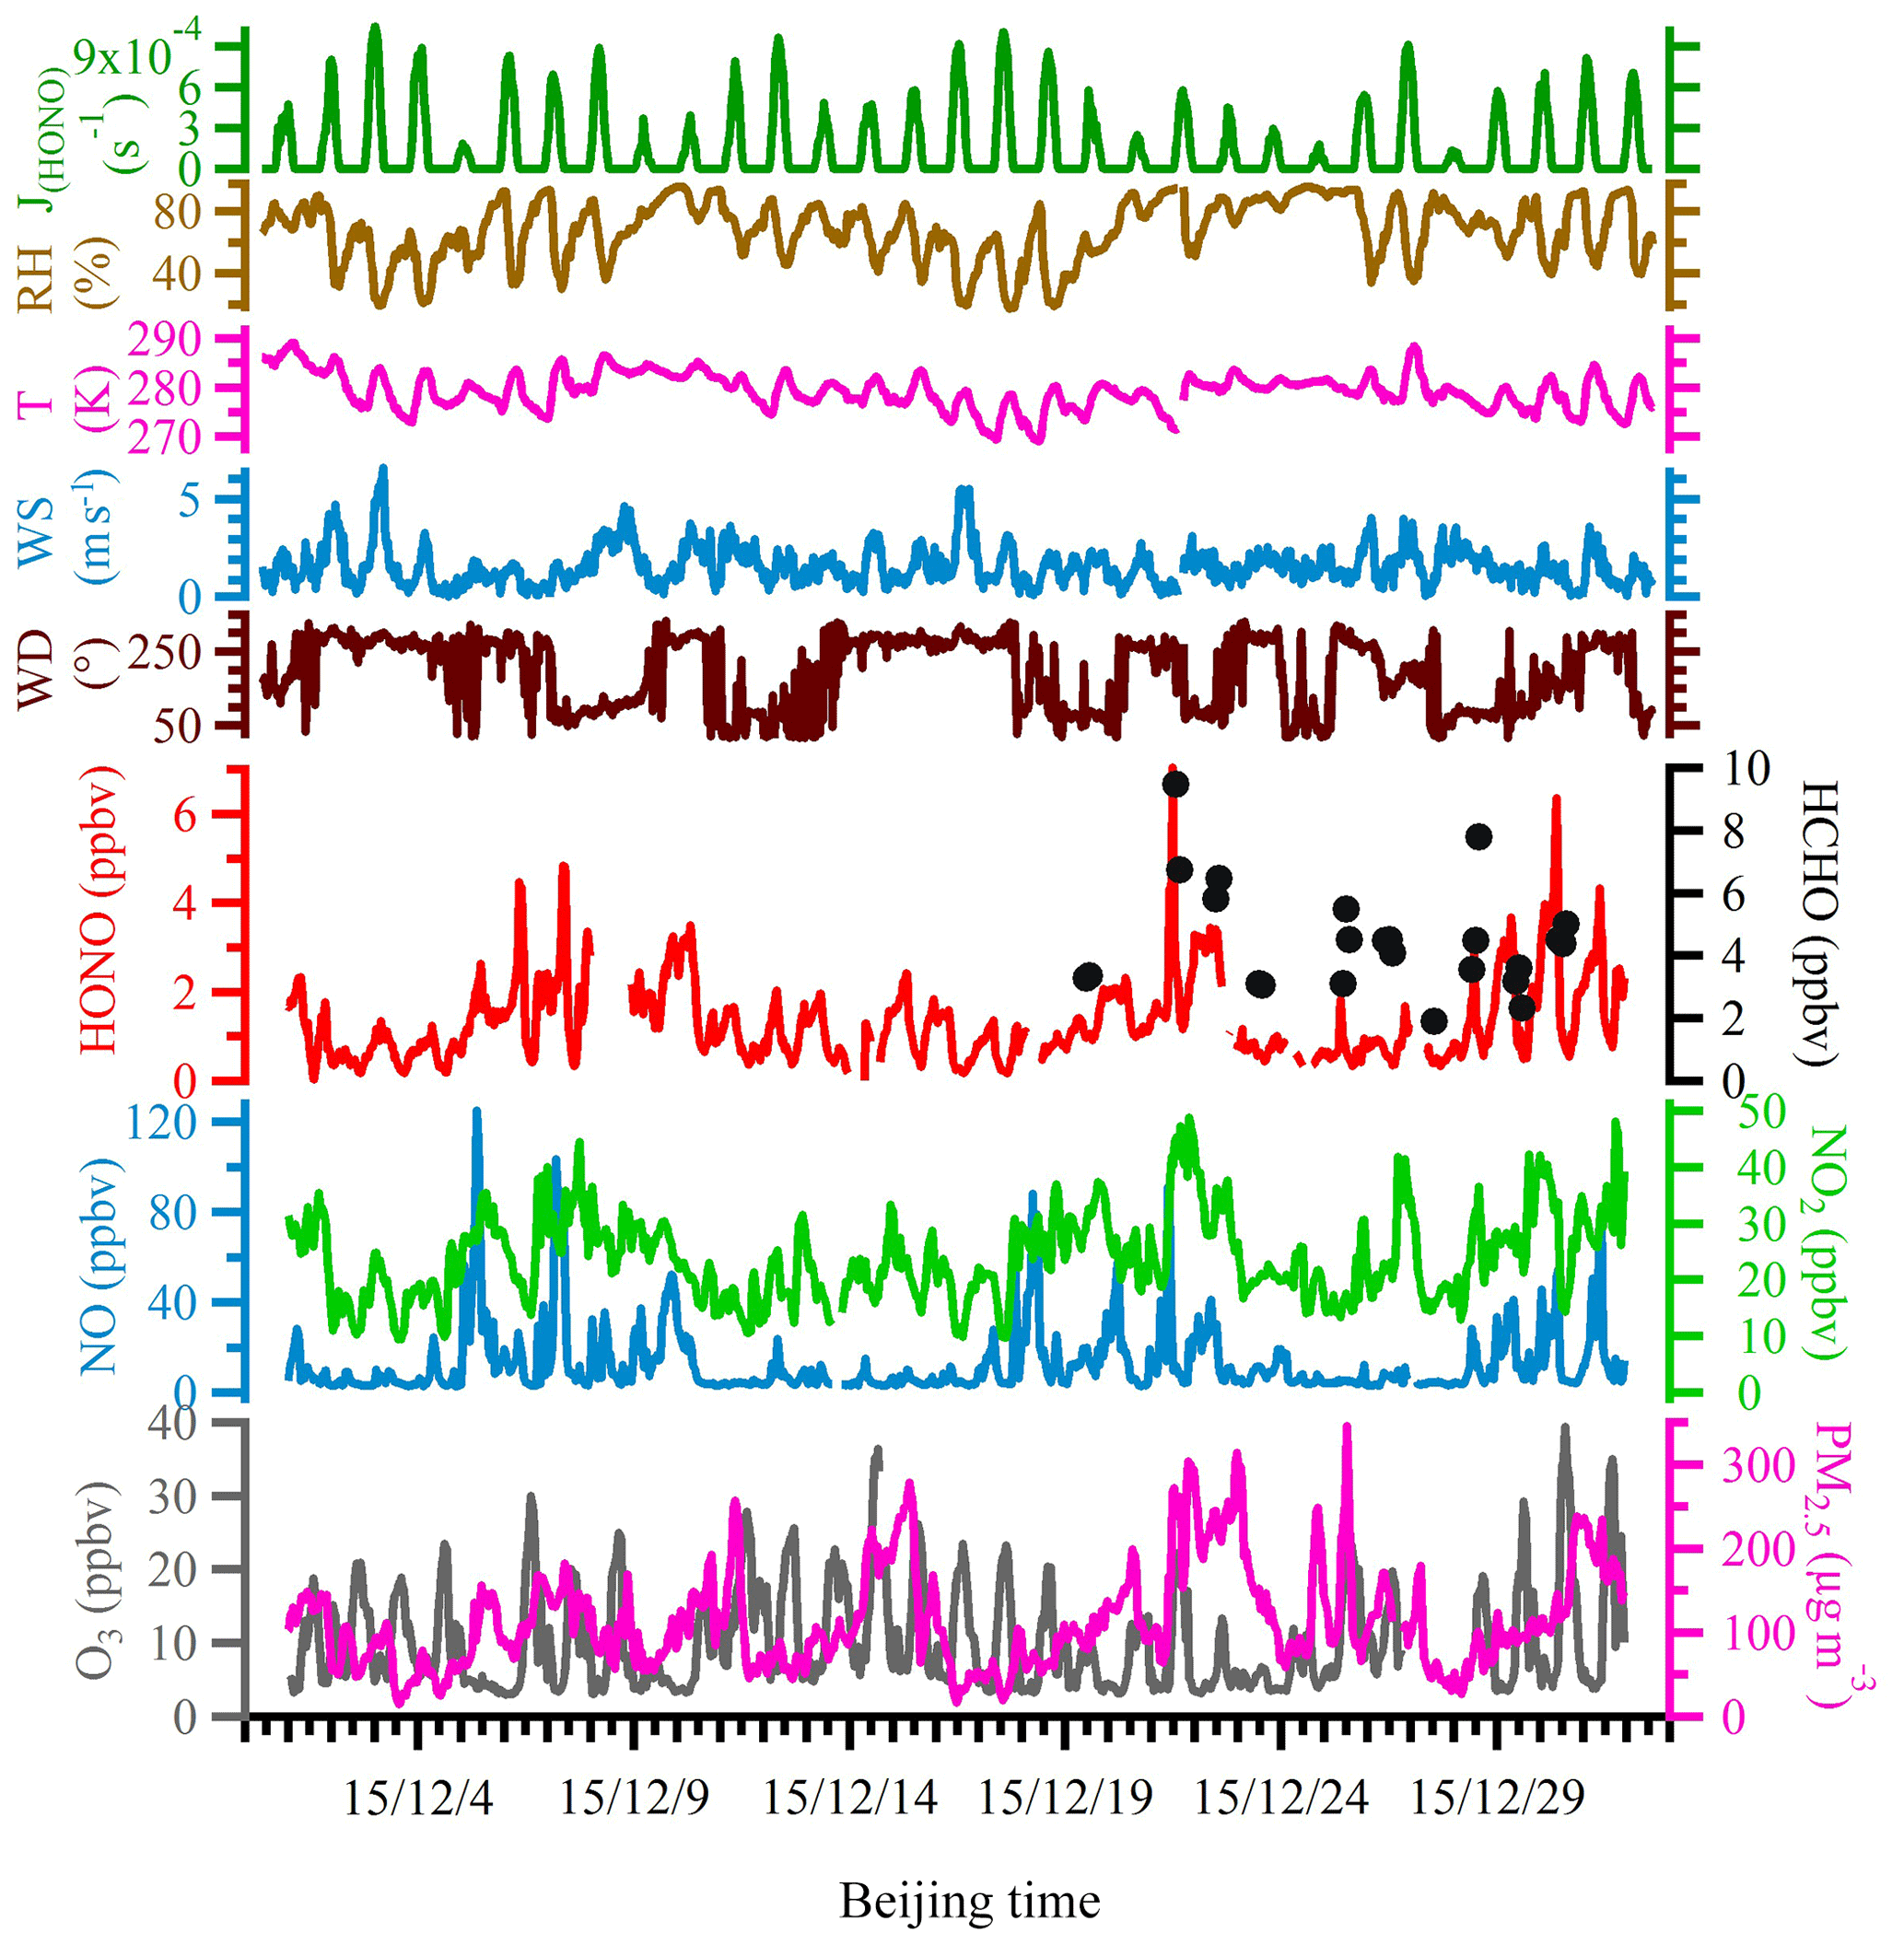
Figure 2Time series of meteorological parameters, including HONO photolysis frequency (J(HONO)), relative humidity (RH), ambient temperature, wind speed and wind direction, as well as mixing ratios of measured HONO, HCHO, NO, NO2, O3 and PM2.5 during the observation period.
During the entire measurement period, the HONO mixing ratios ranged from 0.03 to 7.04 ppbv with a mean value of 1.32±0.92 ppbv. Table 1 lists recent HONO observations conducted in China. Our result was comparable to HONO observed in Xinken (Su et al., 2008) and Beijing (Spataro et al., 2013; Wang et al., 2017) but higher than Xianghe, Beijing (Hendrick et al., 2014), Jinan (L. Wang et al., 2015), Hong Kong (Xu et al., 2015) and Shanghai (Wang et al., 2013). Clearly, the general trend of HONO closely followed that of NO2, which is the dominant precursor of HONO. More markedly, the buildup of HONO frequently proceeded the accumulations of PM2.5, e.g., on the 7 December and from 21 to 22 December 2015, indicating that HONO may promote the formation of secondary aerosol by contributing to OH production, which will be further analyzed in detail in the following sections. The campaign-averaged diurnal variations of HONO, NO2, the HONO∕NO2 ratio and aerosol S∕V are showed in Fig. 3. HONO started to accumulate after sunset and reached its daily averaged maxima of ∼2.0 ppbv at 08:00 LT (local time). Later in the day, the HONO mixing ratio decreased rapidly due to its fast photolysis and the increase in the PBL height. Evidently, daytime HONO was sustained at a relatively high level. The daily averaged minimum of ∼0.6 ppbv was observed around 16:00 LT. The mixing ratio of NO2 varied from 9.5 to 48.7 ppbv with an average of 23.9±7.5 ppbv and a daily averaged maximum of 27.7±8.8 ppbv. The NO, O3 and PM2.5 mixing ratios were in the range of 2.7 to 124.9 ppbv, 3 to 39 ppbv and 15 to 345 µg m−3, respectively. Meanwhile, the HONO∕NO2 ratios ranged from 0.02 to 0.07, with an average of 0.05±0.03.
Table 1Overview of HONO measurements performed in Nanjing and other cities in China.
a Campaign-averaged value; b Yearly average value; c Only range and mean values are reported.
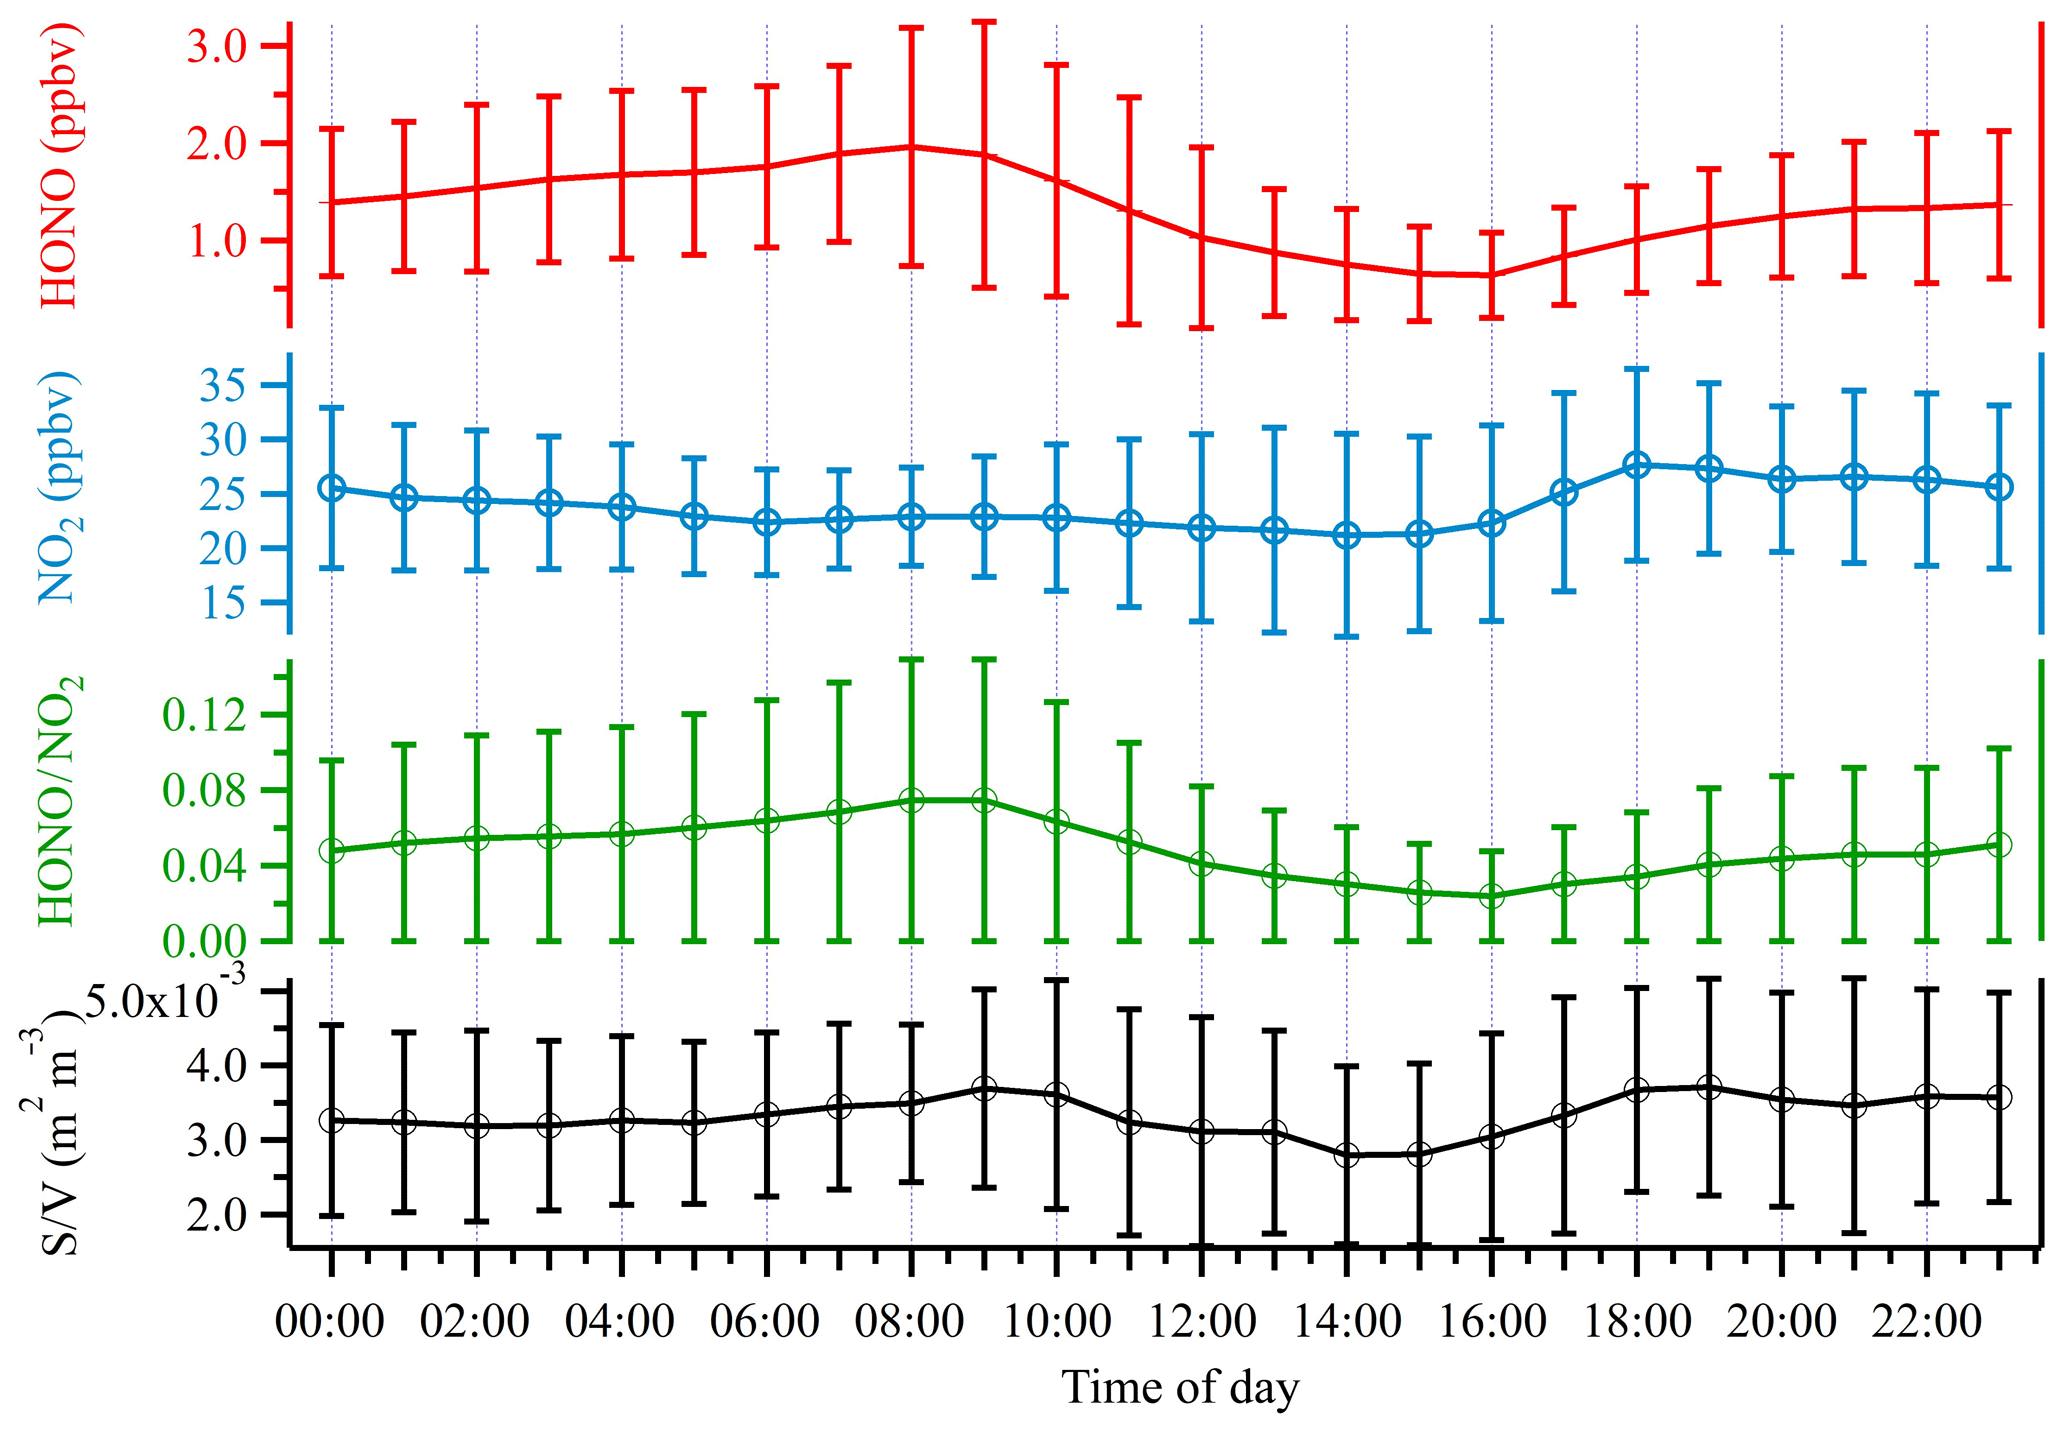
Figure 3Average diurnal profiles of HONO, NO2, the HONO∕NO2 ratio and S∕V. Error bars represent the standard deviations in hourly bins.
3.2 OH simulation
Although the atmospheric oxidation capacity is determined by the levels of all major oxidants in the atmosphere (e.g., OH, O3 and NO3), the OH radical is the primary oxidant in the atmosphere, and series of reactions initiated by the OH radical can lead to the formation of other major secondary oxidants, such as O3 and NO3. Fully understanding the budget of the OH radical, especially the sources of OH radical, is of paramount importance for the purpose of controlling the atmosphere oxidation capacity and, in turn, to establish effective air pollution mitigation strategies.
In situ measurement of the OH radical is often limited by the availability of suitable measurement techniques, which frequently suffer from large unresolved uncertainties (Tanner and Eisele, 1995), and the observation values often disagree with the modeling results to a large extent. Nevertheless, theoretically, some critical parameters that govern the OH radical budget in the atmosphere are difficult to measure directly, such as the formation rates of OH. Accordingly, a box model is often utilized to simulate these highly reactive species in order to investigate their photochemistry.
In order to assess the relative contributions of potential OH sources in this study, we utilized a box model based on the Master Chemical Mechanism (MCMv3.2; Jenkin et al., 2012) to simulate the OH concentration and the OH formation rates from various sources. The model simulation was constrained by the measurement results, including HONO, O3, NO, NO2, CO, SO2, VOCs, and water vapor, temperature, pressure and photolysis frequencies. As HCHO measurement was only available from 19 to 30 December, simulated HCHO was used for the entire campaign period. We found that the ratio of simulated to measured HCHO was 1.4 with a correlation coefficient of R=0.77. Therefore, we applied a factor of 1.4 to the simulated HCHO in the model to better represent the HCHO concentration in the atmosphere.
The simulated OH time series during the campaign period is shown in Fig. 4. Because the simulation is constrained by the observations, simulations were only conducted for periods when all data were available. The simulated OH concentration was in the range of 1.06×10⁶ to 5.26×10⁶ molec. cm−3, which was similar to the concentration observed in London (Emmerson et al., 2007) but lower than that measured in New York City (3×10⁶ to 3.3×10⁷; Ren et al., 2003) and Guangzhou (1.5×10⁷ to 2.6×10⁷; Lu et al., 2012).
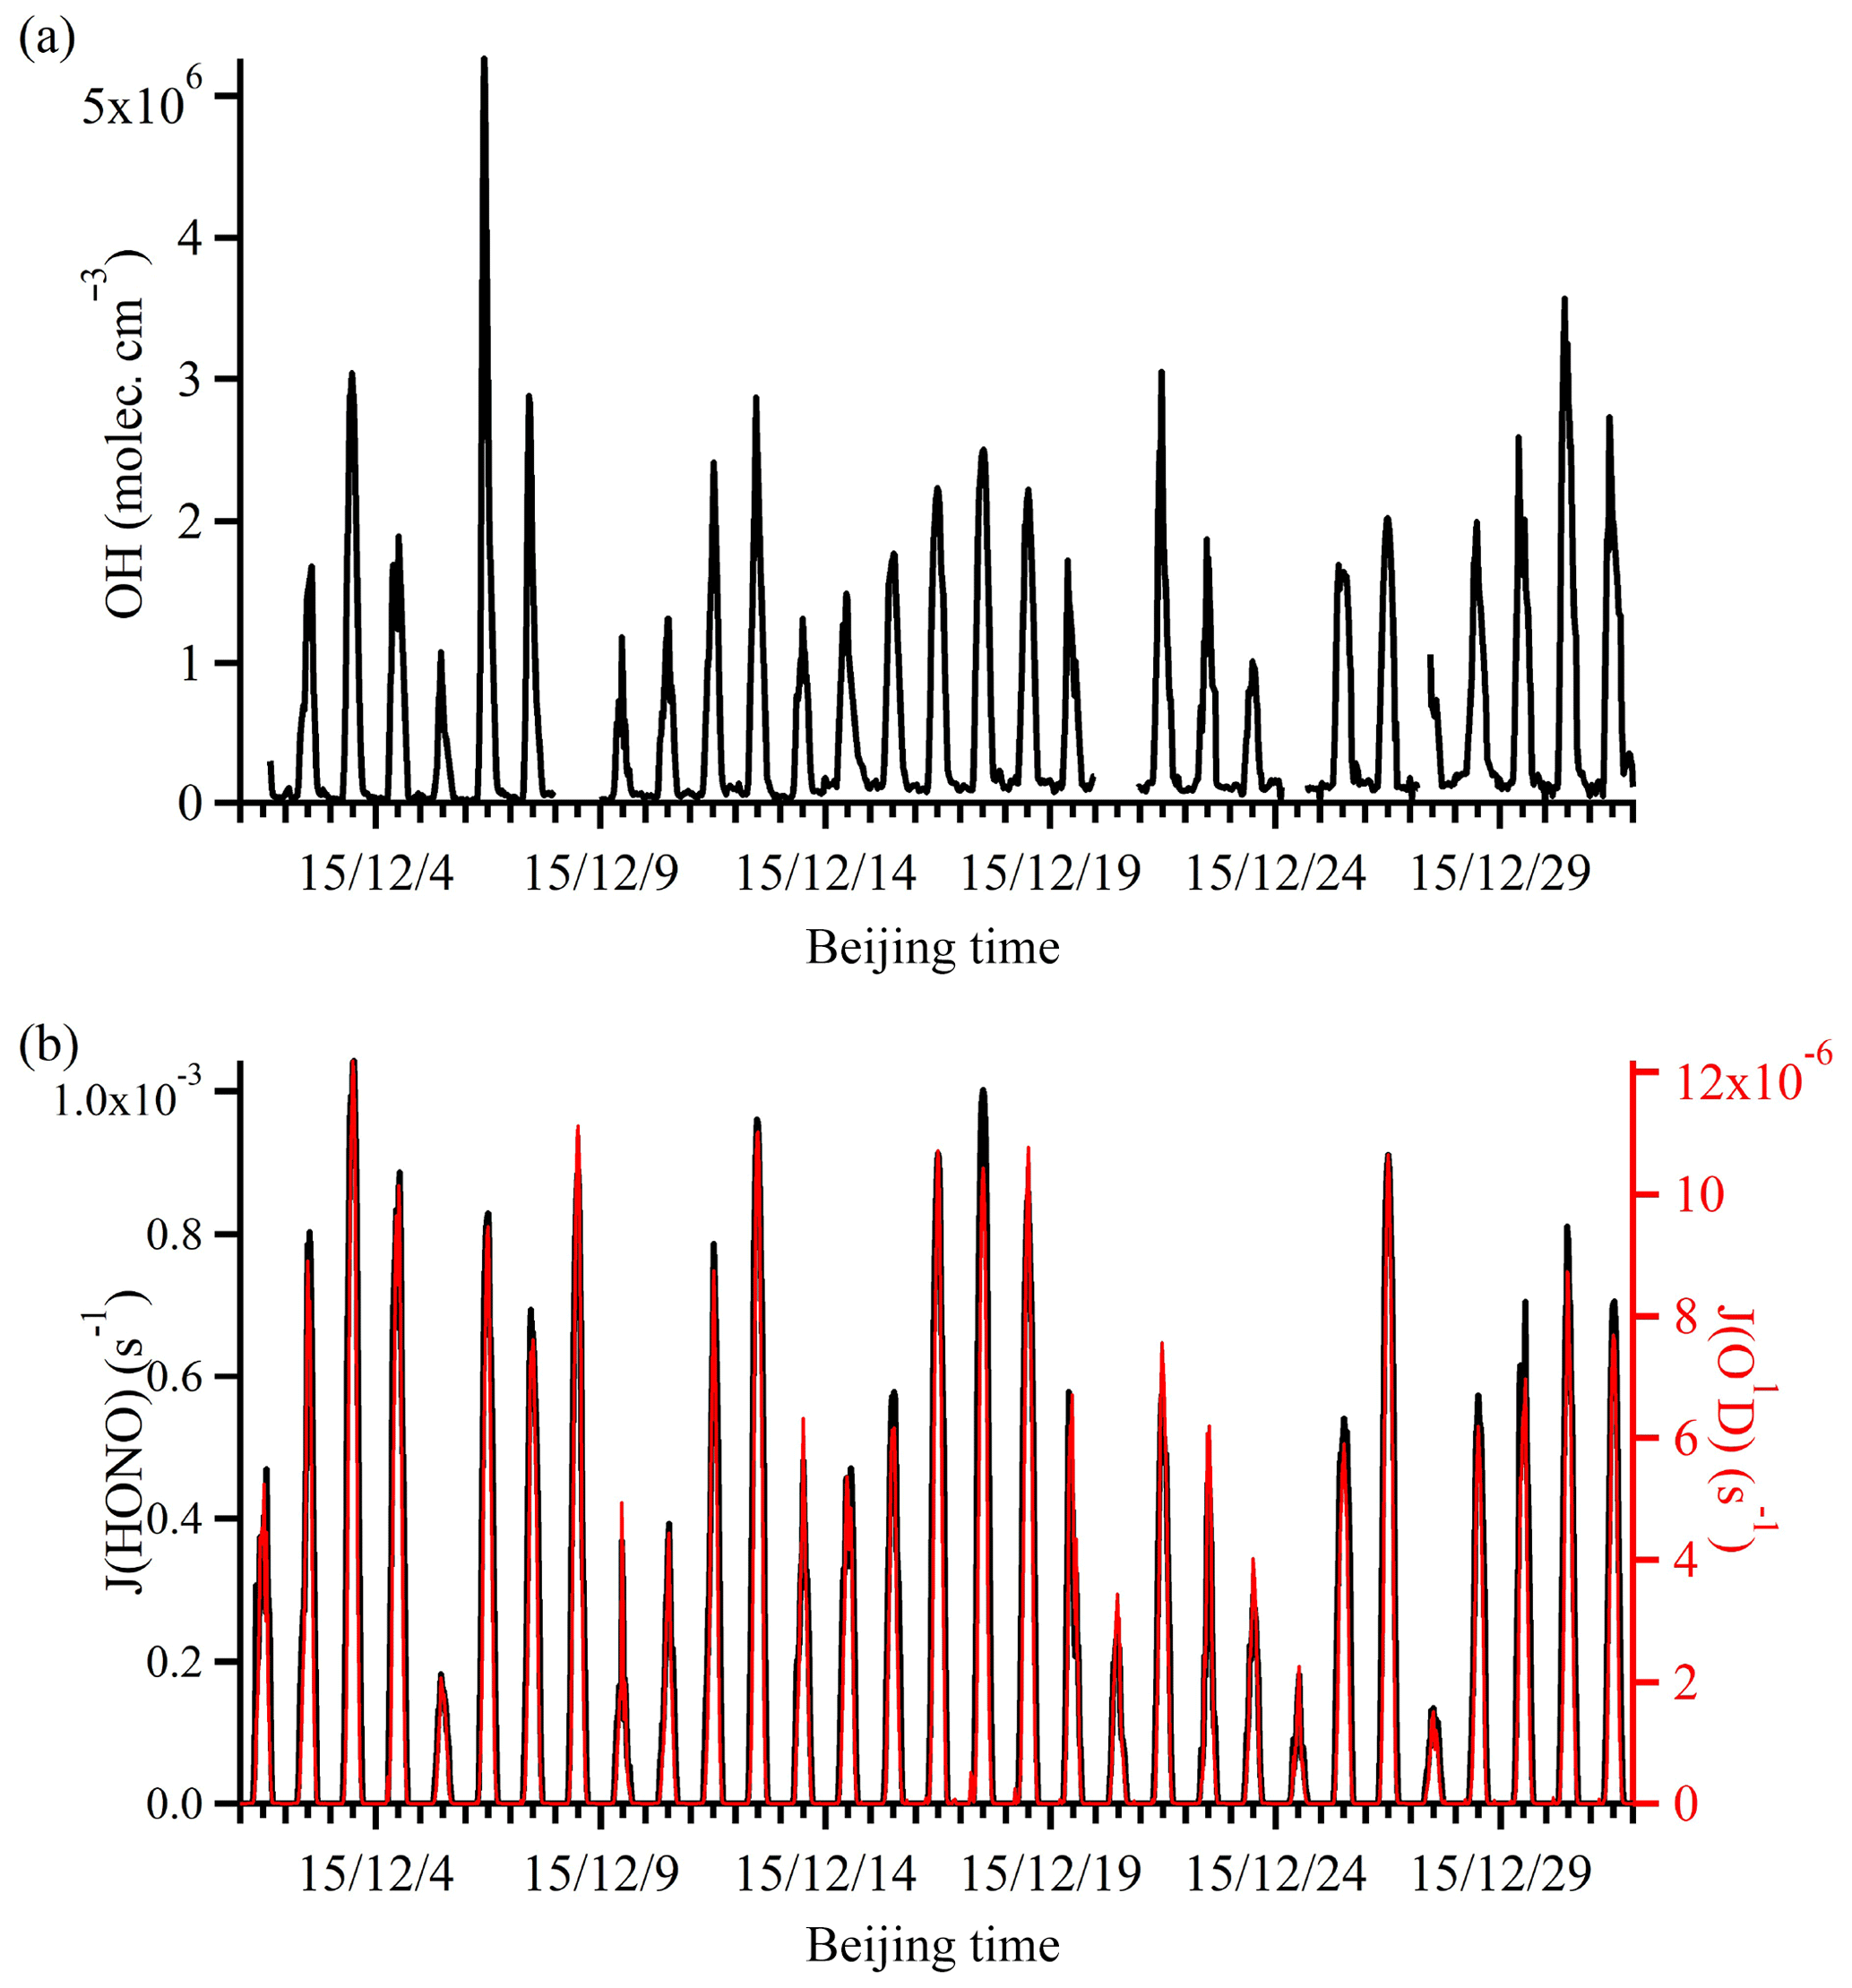
Figure 4Time series of (a) simulated OH and (b) observed photolysis rates (J(HONO) and J(O1D)). The gaps in the OH time series were the time periods when some observational data were not available.
It should be noted that the absolute values of the simulated OH may differ from the actual ambient concentration. However, the general trend of OH evidently followed the solar radiation intensity, indicating its photochemical production origin. Clearly, the diurnal variation of the OH profile is more complicated than that of the photolysis rates, because OH production can be affected not only by photochemical processes but also by both primary emissions (e.g., HONO and HCHO) and other non-photochemical heterogeneous processes (e.g., HONO production on various surfaces and the ozonolysis of alkenes). These processes will be further discussed in the following sections.
3.3 OH formation rates
Previous field studies have demonstrated that HONO photolysis can contribute substantially to OH production during daytime (Elshorbany et al., 2009; Hendrick et al., 2014; Kleffmann et al., 2005; Su et al., 2008). In this study, we evaluated the OH formation rates from the photolysis of HONO (Eq. 3), ozone (Eq. 4), formaldehyde (Eq. 5) and hydrogen peroxide (H2O2; Eq. 6), as well as the ozonolysis of alkenes (Eq. 7). The second term in Eq. (3) is to account for the loss of OH due to HONO formation from OH + NO, where the OH concentration was simulated using the box model, so that the net OH formation from the photolysis of HONO is considered. J values are the photolysis frequencies of the corresponding species, and φOH is the fraction of O(1D) that reacts with H2O instead of being quenched by nitrogen (N2) or oxygen (O2). OH production by the photolysis of formaldehyde was calculated assuming that HO2 formed from Reaction (R4) was immediately converted into OH by Reaction (R8) due to high NO levels in this polluted environment. In Eq. (7), YOH_i is the yield of OH from the gas-phase reaction of O3 and alkene(i), and is the reaction rate constant for the reaction of O3 with alkene(i). The rate constants of the ozonolysis reactions and the corresponding OH yields used in this work are listed in Table 2. As H2O2 was not measured during this campaign, H2O2 was estimated from literature values, i.e., 0.5 to 5 ppbv (Guo et al., 2014; Hua et al., 2008; Ren et al., 2009), and a constant of 3 ppbv H2O2 was used.
Table 2Ozonolysis reaction rate constants and OH formation yields of the volatile organic compounds (VOC) used in the calculation.
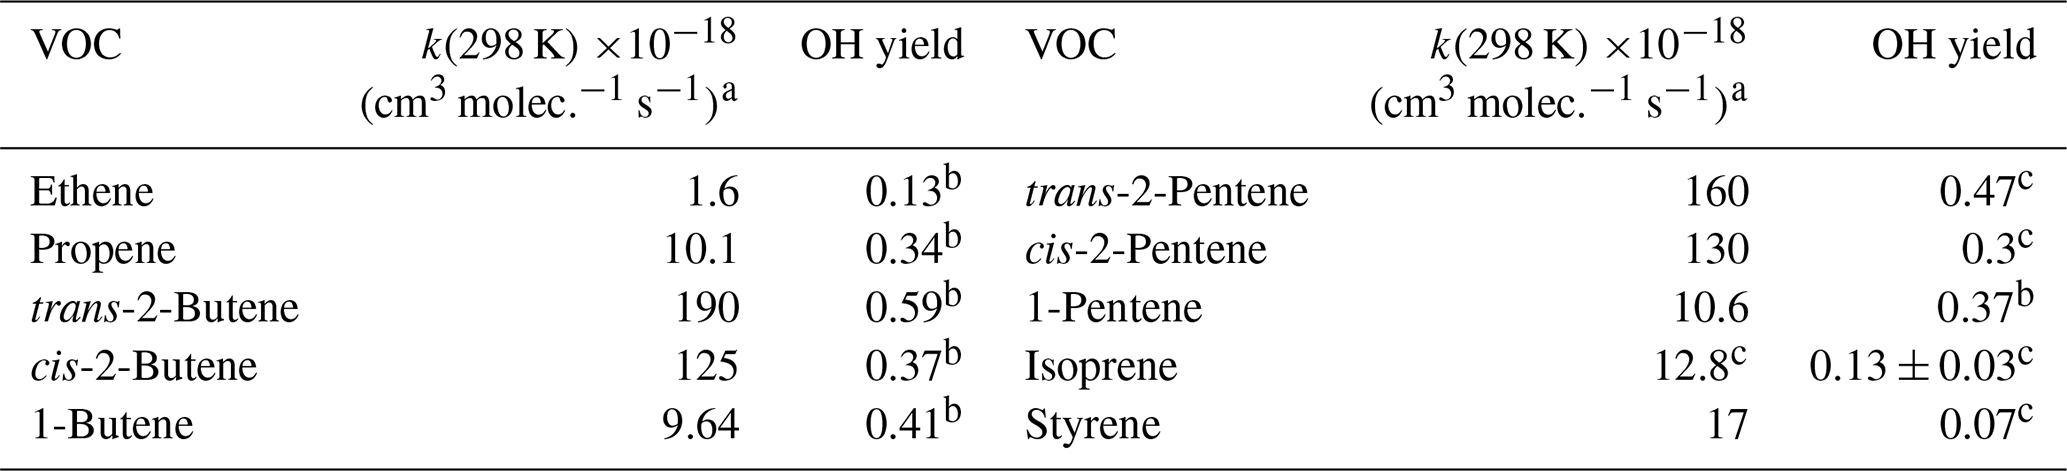
a Atkinson and Arey (2003); b Rickard et al. (1999); c Alicke et al. (2002).
The calculated campaign-averaged OH production rates from the photolysis of HONO, O3, HCHO and H2O2 along with the ozonolysis of alkenes were 7.13×10⁶, 2.46×10⁶, 1.60×10⁶, 2.39×10⁵ and 3.94×10⁶ molec. cm−3 s−1, respectively, which were comparable with the literature values (Alicke et al., 2002; Chan et al., 2017; Su et al., 2008). As shown in Fig. 5, the contribution of HONO photolysis to OH production from 07:00 to 16:00 LT varied from 23.6 % to 63.3 % with a mean value of 44.8 %. The ozonolysis of 10 highly reactive alkenes (listed in Table 2) by ozone was the second largest contributor to OH radicals and the contribution varied from 16.1 % to 60.9 % with a mean of 30.3 %. The contribution of ozone photolysis was in the range of 1.3 % to 24.7 % with a mean of 14.9 %. The contribution of HCHO photolysis varied between 0.9 % and 12.5 % with a mean of 8.1 %, and the contribution of H2O2 photolysis was negligible with an average contribution of 1.9 %. The contributions from different OH sources in this study were similar to those found in two wintertime studies. In a study conducted in New York City in winter 2004, it was found that 48 % of the net HOx production was from HONO photolysis, 36 % was from the ozonolysis of alkenes, only 6 % was from HCHO photolysis and 1 % was from O3 photolysis (Ren et al., 2006). In another study conducted in London in winter 2000, 62 % of the OH production was found from the ozonolysis of alkenes, 35 % was from HONO photolysis, only 6 % was from HCHO photolysis and less than 1 % was from O3 photolysis (Heard et al., 2004).
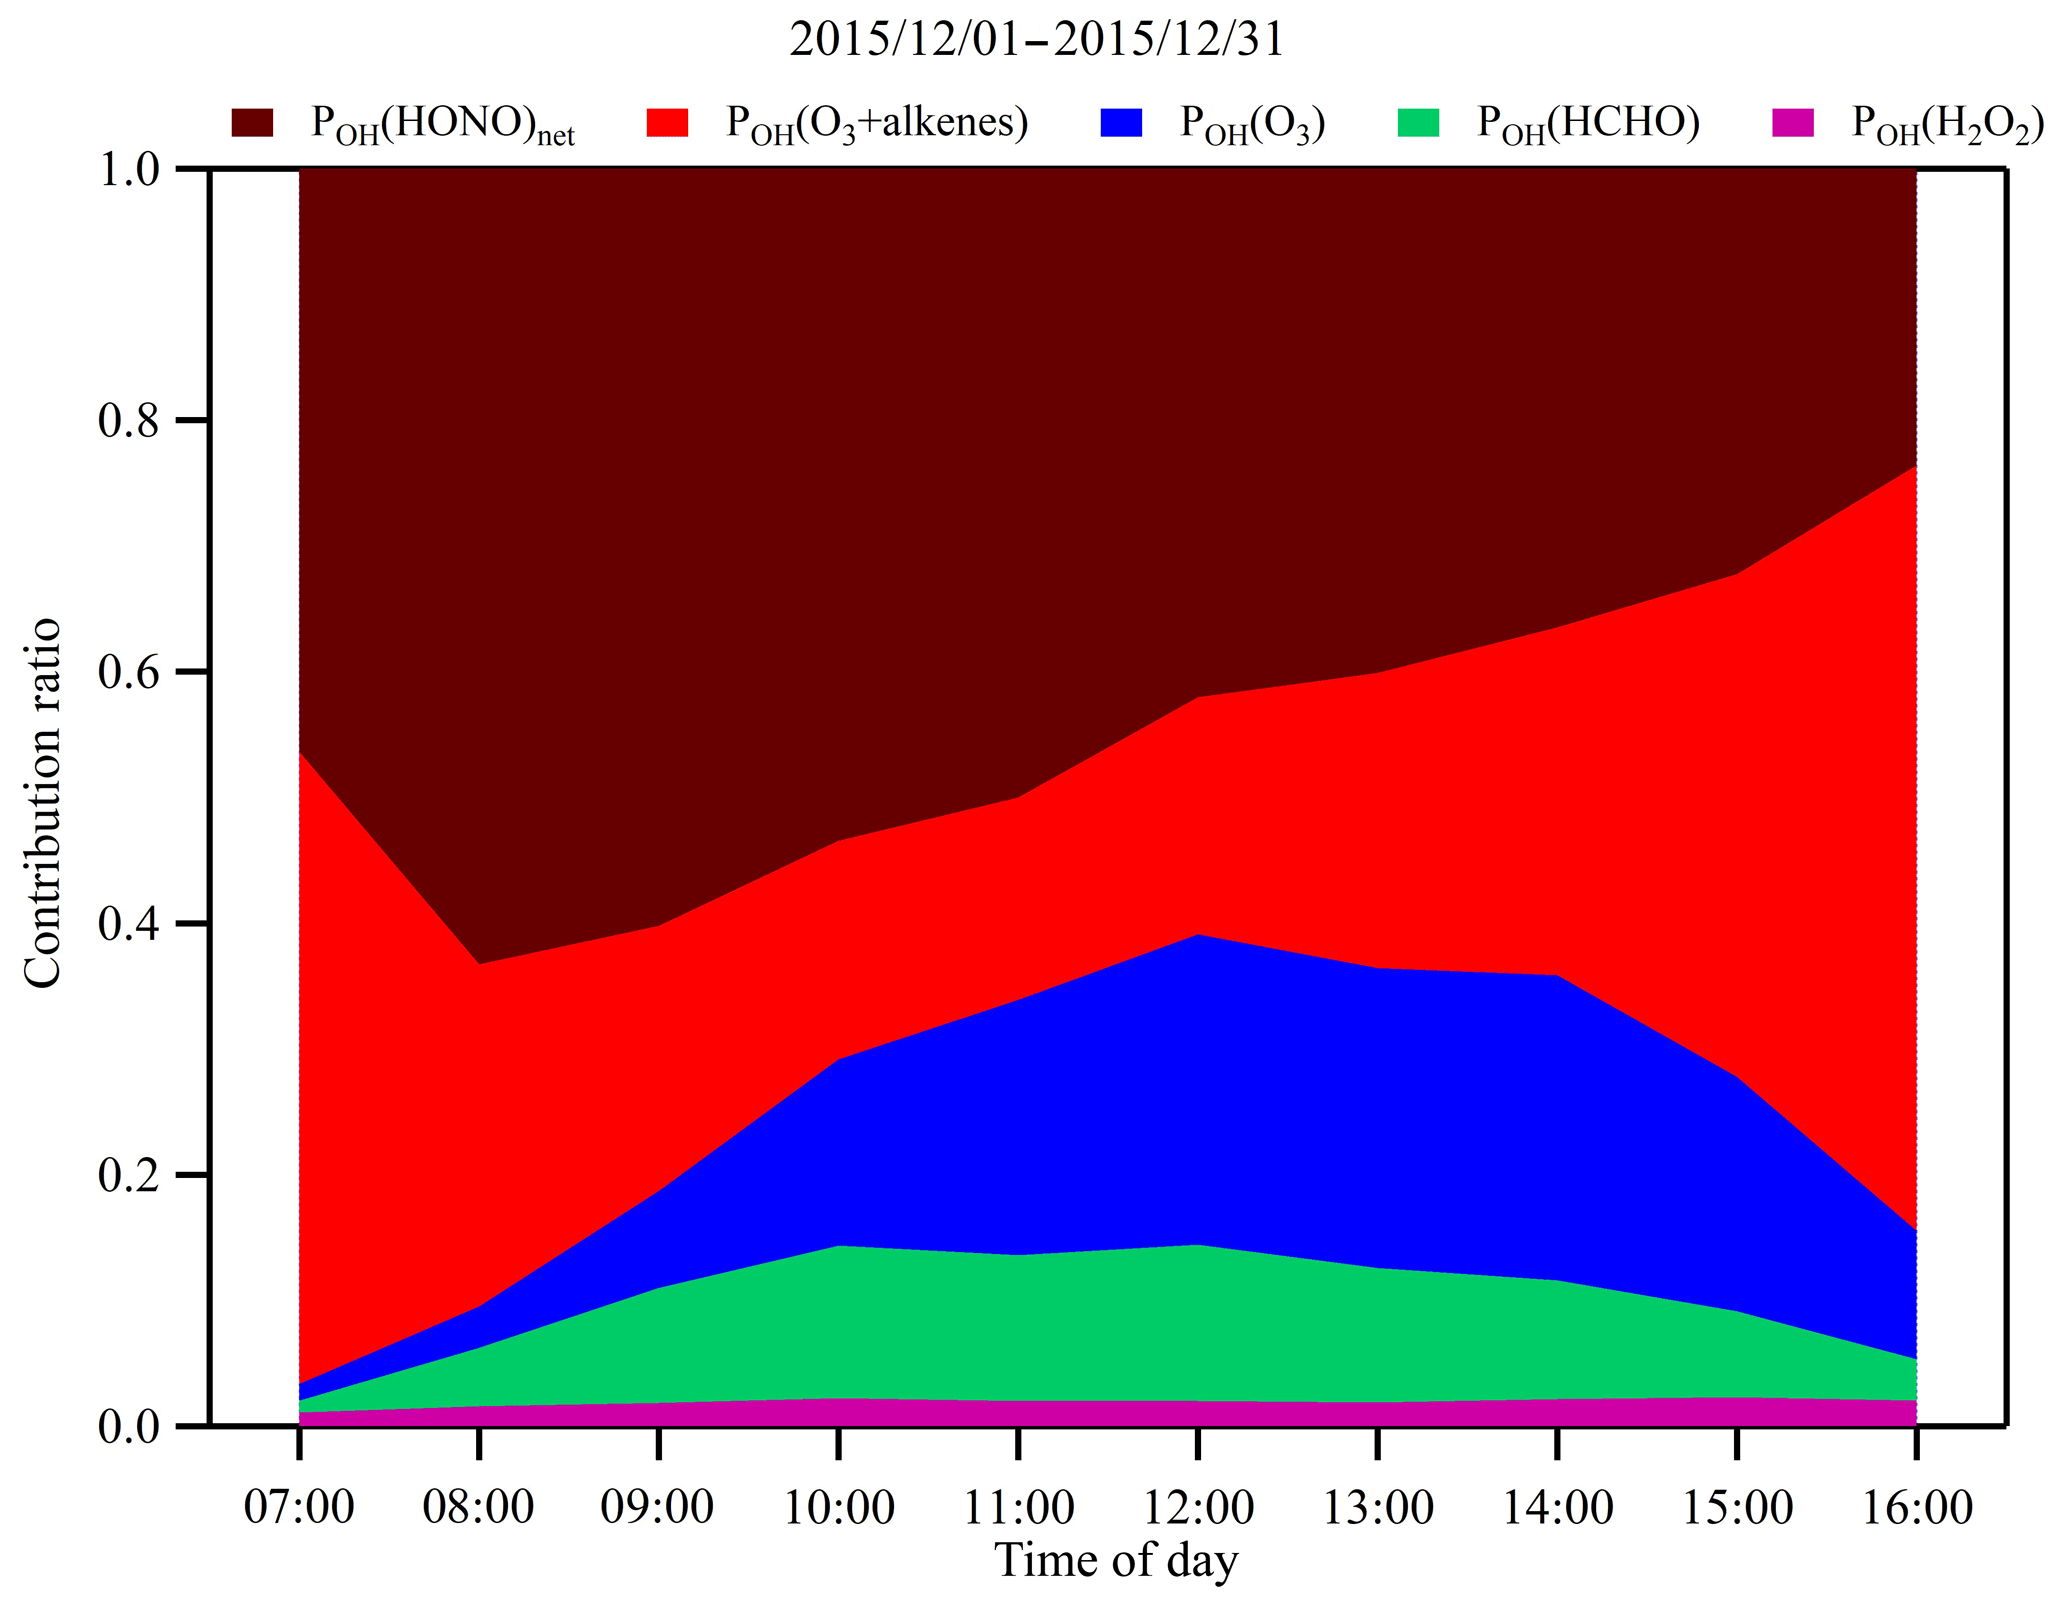
Figure 5Campaign-averaged diurnal variations of contribution fractions of OH production rates from HONO photolysis (brown), alkene ozonolysis (red), O3 photolysis (blue), HCHO photolysis (green) and H2O2 photolysis (purple).
The striking feature of Fig. 5 is that HONO photolysis and ozonolysis of alkenes contributed more than 70 % of the OH production rate on average. In the early morning, HONO photolysis was the dominant source of OH and may have boosted the photochemistry right after sunrise. As O3 accumulated, alkene ozonolysis and O3 photolysis became more and more important. The higher percentage of HONO photolysis in this study is most likely because of the higher concentrations of HONO observed in the study area, and its sources will be further investigated in the following sections.
3.4 Industrial plumes
Industrial emissions are responsible for a large portion of the haze formation in China. With the implementation of more and more strict mitigation strategies, primary emissions have been reduced substantially. However, the observation site was located just ∼5 km from the Nanjing industry park, one of the largest industrial zones in the YRD region, which is populated by various heavy industry facilities, including steel mills, power generation stations and petrochemical refineries. Despite great efforts to reduce primary industrial emissions from these facilities, industrial plumes have often been detected at the site, carrying fair amounts of NH3, NOx, SO2 and VOCs (Ma et al., 2016; Zheng et al., 2015a). To investigate the effects of industrial emissions on local and regional air quality and particularly the role of HONO on the transformation of primary emissions into secondary air pollutants, we paid special attention to the air masses that originated from the industrial zone. Figure 6 depicts the contribution fractions of the OH production rates from HONO photolysis, alkene ozonolysis, O3 photolysis, HCHO photolysis and H2O2 photolysis during two industrial plume events. The wind rose plots in Fig. 6 indicate that the origins of these air masses were all from the nearby industry zone. Unlike the situation depicted in Fig. 5, during the two industry pollution events HONO photolysis along with the ozonolysis of alkenes dominated the OH production throughout the day. This was most likely due to the high concentrations of NOx and VOCs within the industrial plumes. More interestingly, the average PM2.5 concentrations during the two events were 139 and 239 µg m−3, respectively. Evidently, HONO photolysis and ozonolysis may play an even more important role in OH production during severe haze events. Although ambient OH concentrations during these events may not be high (see Fig. 4a), the high levels of HONO can boost active photochemical oxidation and, thus, promote the formation of other secondary air pollutants.

Figure 6The same plots as Fig. 5 but for two industrial plume events on 7 December (a, b) and from 21 to 22 December (c, d) 2015. The corresponding wind rose plots indicate the origin of these plumes, i.e., the industry park to the east of the observation site.
3.5 HONO sources
3.5.1 Primary HONO emissions
Previous studies have demonstrated that HONO can be emitted directly from vehicle exhaust (Kirchstetter et al., 1996; Kurtenbach et al., 2001). However, the NO∕NOx ratio measured in this work was relatively low with an average of 0.25±0.06, which is much lower than that of freshly emitted exhausts obtained from tunnel experiments (>0.9; Kurtenbach et al., 2001); this indicates that the air masses sampled in this work had been considerably aged and mixed with other air masses, and that primary HONO from direct emissions (if there was any) had been diluted substantially (less than a few percent) before reaching the observation site. In addition, our sampling site is located near the industrial zone; thus, the high concentration of NOx mainly originated from industrial activities, and the influence of traffic sources on HONO was expected to be small. To further evaluate the potential impact of primary emissions on the HONO concentration, we incorporated the contribution of primary HONO emissions into the MCM box model. The HONO emission ratios, i.e., HONO∕NOx, was taken as 0.3 % (Kirchstetter et al., 1996), representing a gasoline-fueled vehicle fleet, which was typically encountered in the study area. On average, the primary emissions from vehicle exhaust can only account for 11 % of the total HONO concentration, indicating that secondary mechanisms still dominated HONO level in the study area. This will be further analyzed in the following sections.
3.5.2 HONO conversion rate
In addition to primary emission, heterogeneous reactions of NO2 on surfaces are believed to be a major formation pathway of nocturnal HONO. In order to discuss the influence of secondary mechanisms on HONO, the observed HONO was corrected by removing the portion of primary emissions (HONOemis) and was then denoted as HONOcorr (= HONO − HONOemis).
The HONO conversion rate k(het) (h−1) is an important parameter to compare HONO formation under various NO2 levels (Xu et al., 2015). In this work, we calculate the HONO conversion rate using Eq. (8) (Alicke et al., 2003):
where [HONOcorr] and [HONOcorr] are the corrected HONO concentrations at two different times, t1 and t2, respectively; and [NO2] is the average NO2 concentration between time t1 and t2. The time periods used to calculate the HONO∕NO2 conversion ratio were selected when both HONO and NO2 increased monotonically with a correlation coefficient higher than 0.8. Note that Eq. (8) is a simplified demonstration to calculate the reaction rate coefficient of the heterogeneous conversion from NO2 to HONO at night, which can be dependent on different pollution levels. In this study, the averaged k(het) was determined to be ∼0.8 % h−1, which was comparable to the results at the urban sites of Xi'an (0.91 % h−1; Huang et al., 2017) and Shanghai (0.7 % h−1; Wang et al., 2013), China, but much less than some other observations, such as Back Garden, Guangdong, China (2.4 % h−1; Li et al., 2012), Xinken, Guangdong, China (1.6 % h−1; Li et al., 2012) and Rossfeld, Rhine Valley, France (2.2 % h−1; Acker and Möller, 2007). Nevertheless, the high level of NOx observed in this work may still lead to high levels of HONO via various mechanisms.
3.5.3 Heterogeneous conversion of NO2
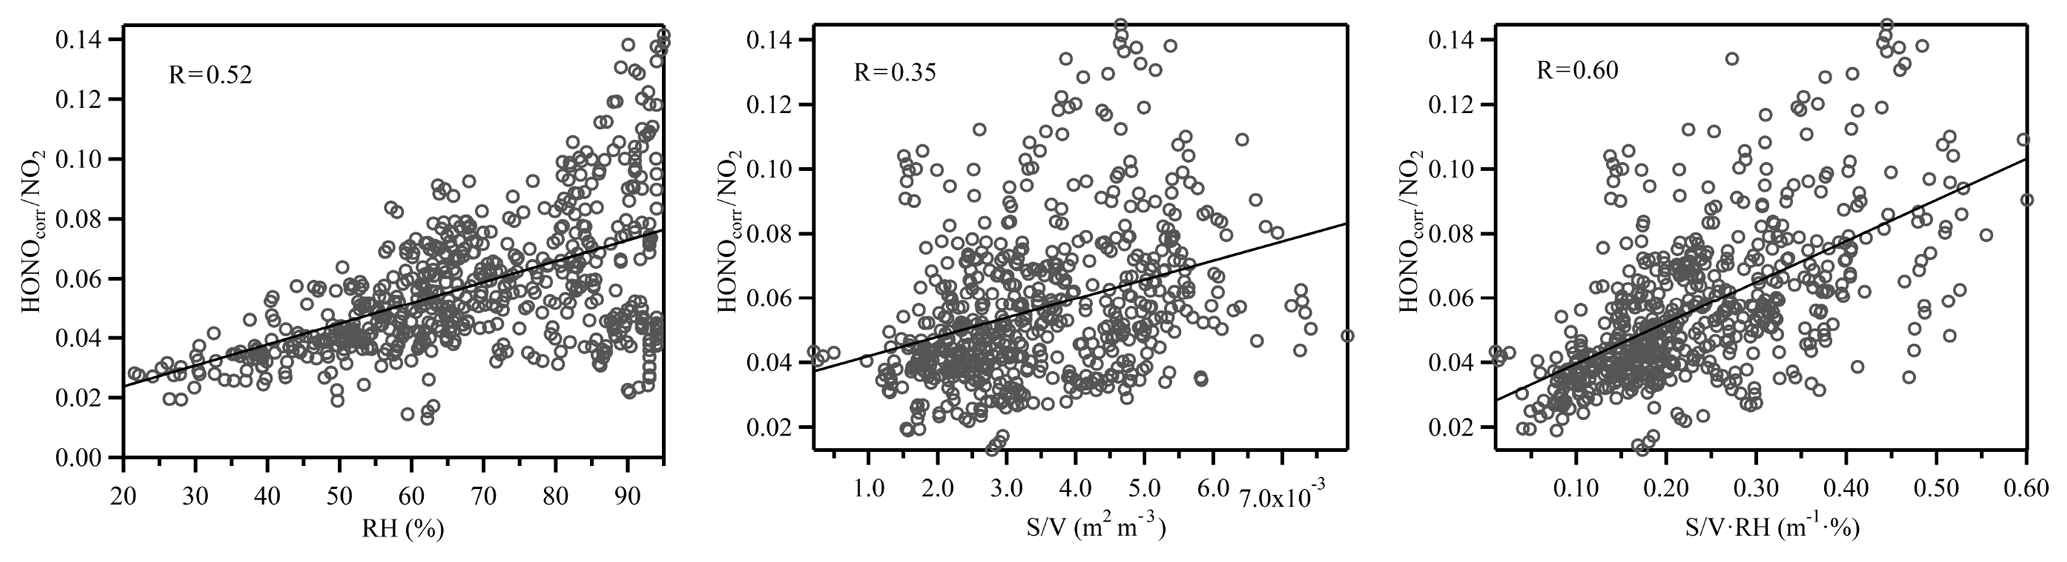
Previous studies have suggested that the heterogeneous conversion of NO2 on wet surfaces could be an important nocturnal HONO source (Finlayson-Pitts et al., 2003; Wang et al., 2017). However, it appears that the proposed reaction mechanism (2NO2 + H2O) was limited by the uptake of NO2 on wet surfaces (of the order of 10−6) and was therefore too slow to account for the observed NO2 to HONO conversion ratio (Kleffmann et al., 1998). Instead, the reaction between NO2 and adsorbed semi-volatile organic compounds on soot or aerosol surfaces has been suggested to be 1–2 orders of magnitudes faster than the aforementioned reaction (George et al., 2005; Gutzwiller et al., 2002), although the actual reaction mechanism is still under active research. It also should be noted that as the ambient temperature decreased during nighttime, the PBL height also decreased, causing the ground surface to air volume ratio to increase, which may also have contributed to the higher NO2 to HONO conversion efficiency (Stutz et al., 2004). However, as shown in Fig. 7, HONOcorr∕NO2 correlated with S∕V to some extent, and the correlation increased with the product of RH and S∕V. Therefore, even though the contribution of HONO formation on the ground surface was present, the aerosol surface was certainly involved in the HONO formation process. The impact of RH on the heterogeneous formation of HONO was further investigated. Figure 8 shows the relationship between the HONOcorr∕NO2 ratio and RH at night. The linearity of the bin points clearly displays the linear correlations between the HONO conversion ratio and RH. Following the method introduced by Stutz et al. (2004), we plotted the top five values of the HONOcorr∕NO2 ratio (representing steady-state conditions) in each 10 % RH interval. The conversion efficiency of NO2 to HONO correlates very well with RH (R=0.98), strongly indicating the dependence of HONO formation on RH. A similar phenomenon was also observed at an urban site (Qin et al., 2009) and a rural site (Li et al., 2012) in Guangzhou, China.
3.5.4 Daytime HONO budget
High concentrations of daytime HONO were frequently observed during the campaign, especially within industrial plumes. If we assume that HONO was in a photostationary state involving only gas-phase homogeneous HONO production and photolysis loss, the calculated daytime HONO concentration would be 8.1×10⁹ molec. cm−3, which is only 24.5 % of the observed mean HONO concentration during daytime. As the gas-phase reaction between OH and NO (i.e., POH+NO) and primary emissions (i.e., Pemission) were unable to explain the observed high HONO concentrations, the daytime HONO budget was further examined in detail. Here, we denote the unexplained HONO source as Punknown. The temporal variation of the measured HONO concentration can be expressed by the following equation (Wang et al., 2017):
Thus, Punknown can be calculated as follows:
where d[HONO]∕dt represents the variation of observed HONO concentrations; Lphotolysis represents the loss rate of HONO by photolysis; JHONO is the measured photolysis frequency of HONO; PNO+OH and LOH+HONO are the gas-phase formation and loss rates of HONO, respectively; kOH+NO and kOH+HONO are the corresponding reaction rate constants; Ldeposition is the dry deposition rate of HONO; vHONO represents deposition velocity of HONO; H is the mixing height; and the last term represents direct emissions of HONO. For vHONO, a value of 0.48 cm s−1 was adopted (Lee et al., 2016), and the observed mixing height varied from 73 to 600 m diurnally. A sensitivity analysis with and without HONO deposition shows that the modeled HONO concentration with HONO deposition loss is 3.5 % lower than that without HONO deposition during daytime, indicating that the dry deposition of HONO plays a minor role in HONO losses. The impact of HONO direct emissions was relatively small at daytime. The daytime OH concentration was not measured in this work but was simulated by the MCM box model.
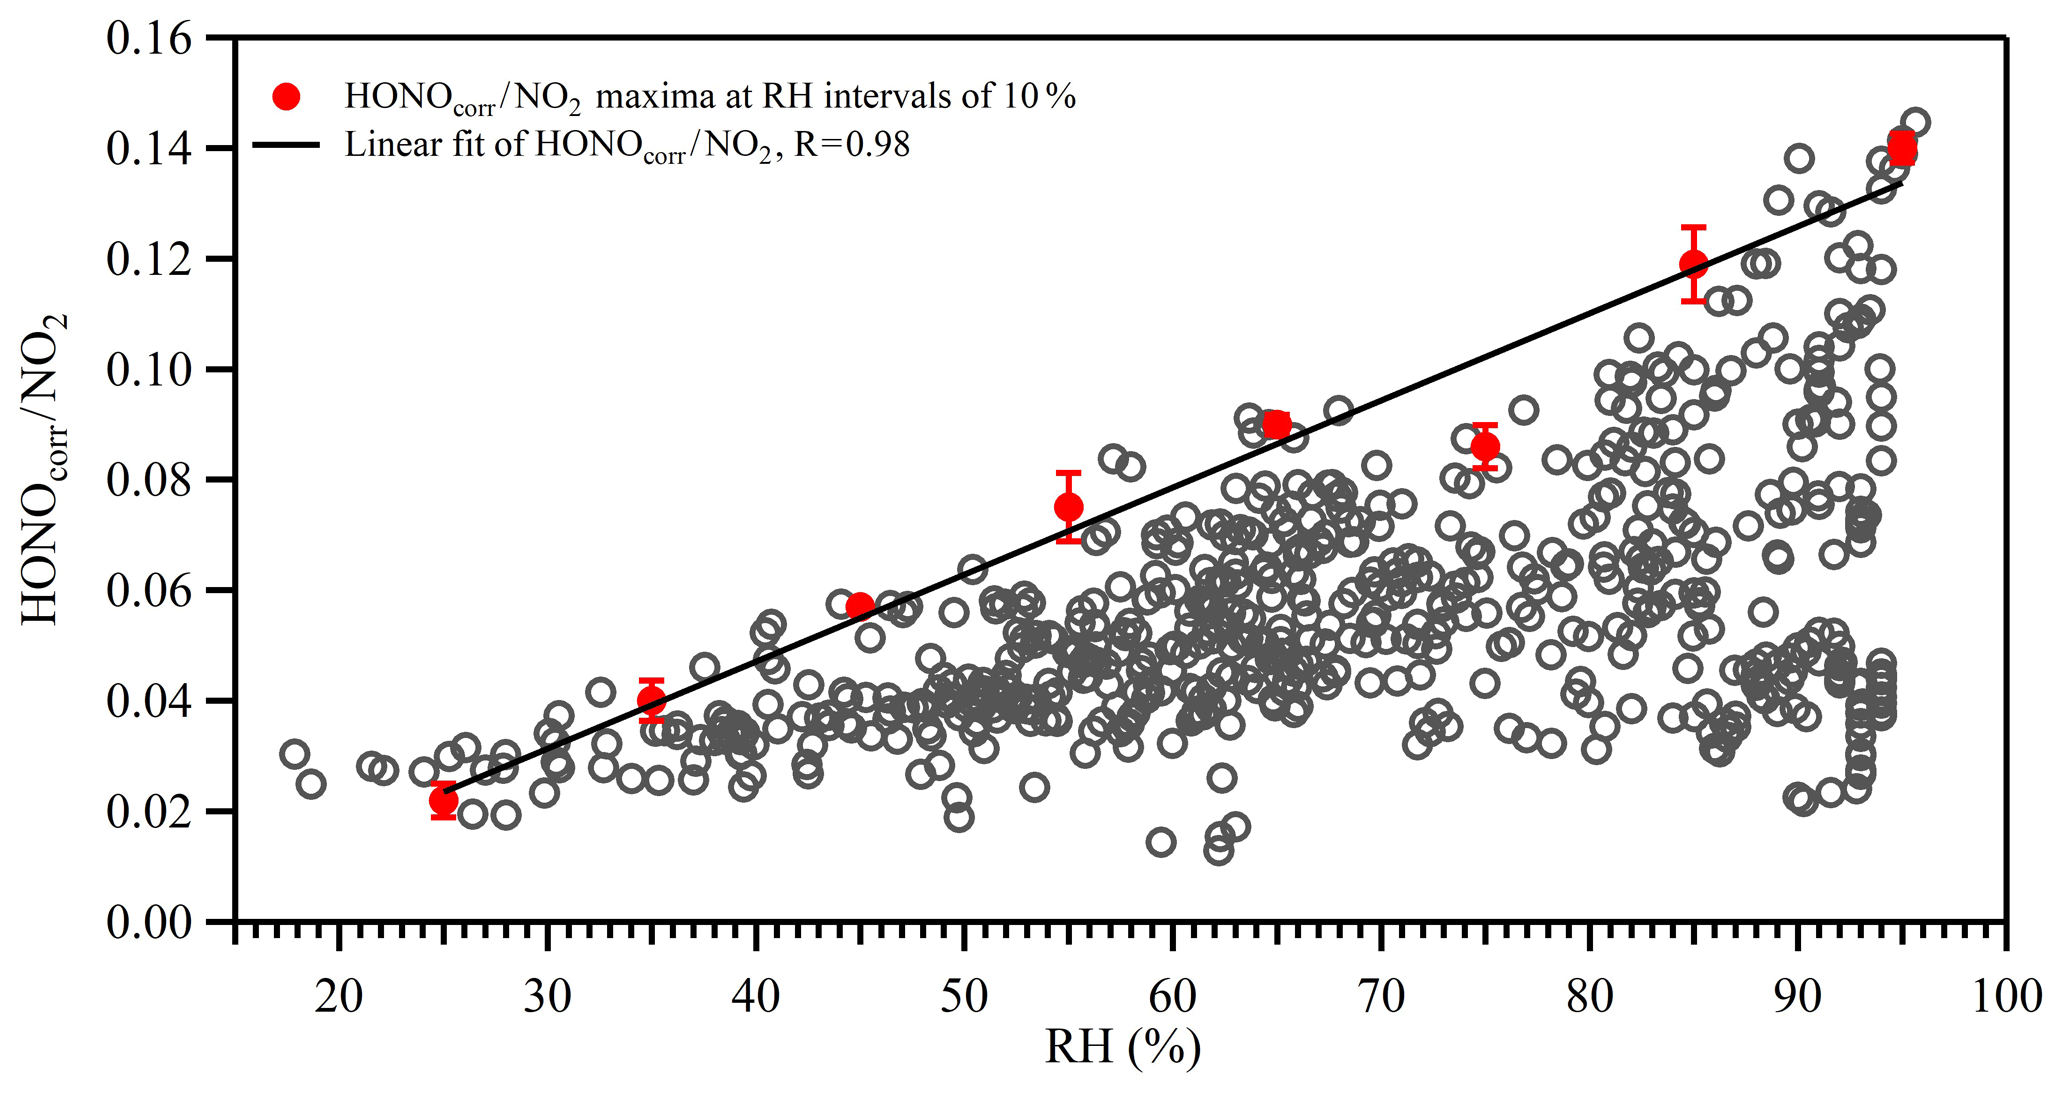
Figure 8Correlation between HONO∕NO2 and relative humidity (RH) at night. The open gray circles are 30 min averages. The red circles represent the averages of the top five maxima of the HONO∕NO2 ratios in 10 % RH bins. Error bars represent standard deviations of the top five HONO∕NO2 ratios in 10 % RH bins. The black line is the linear fit of the red circles for HONO∕NO2 with RH.
Figure 9 shows the average diurnal variation of each individual term in Eq. (10). Compared with Lphotolysis, the gas-phase reaction between OH and HONO and HONO dry deposition contributed very little to the HONO sink during daytime. However, POH+NO and Punknown both contributed significantly to the HONO production and displayed a completely distinct diurnal pattern. Homogeneous reaction between OH and NO reached a maximum of 1.04 ppbv h−1 in the early morning (09:00 LT) due to high concentrations of NO in the morning. The unknown source reached a maximum of 1.22 ppbv h−1 around noontime with an average of 0.73 ppbv h−1, which was about twice as high as the averaged POH+NO. The diurnal profile of Punknown showed a strong photo-enhanced feature, which is consistent with that observed by Michoud et al. (2014) in wintertime in Europe.
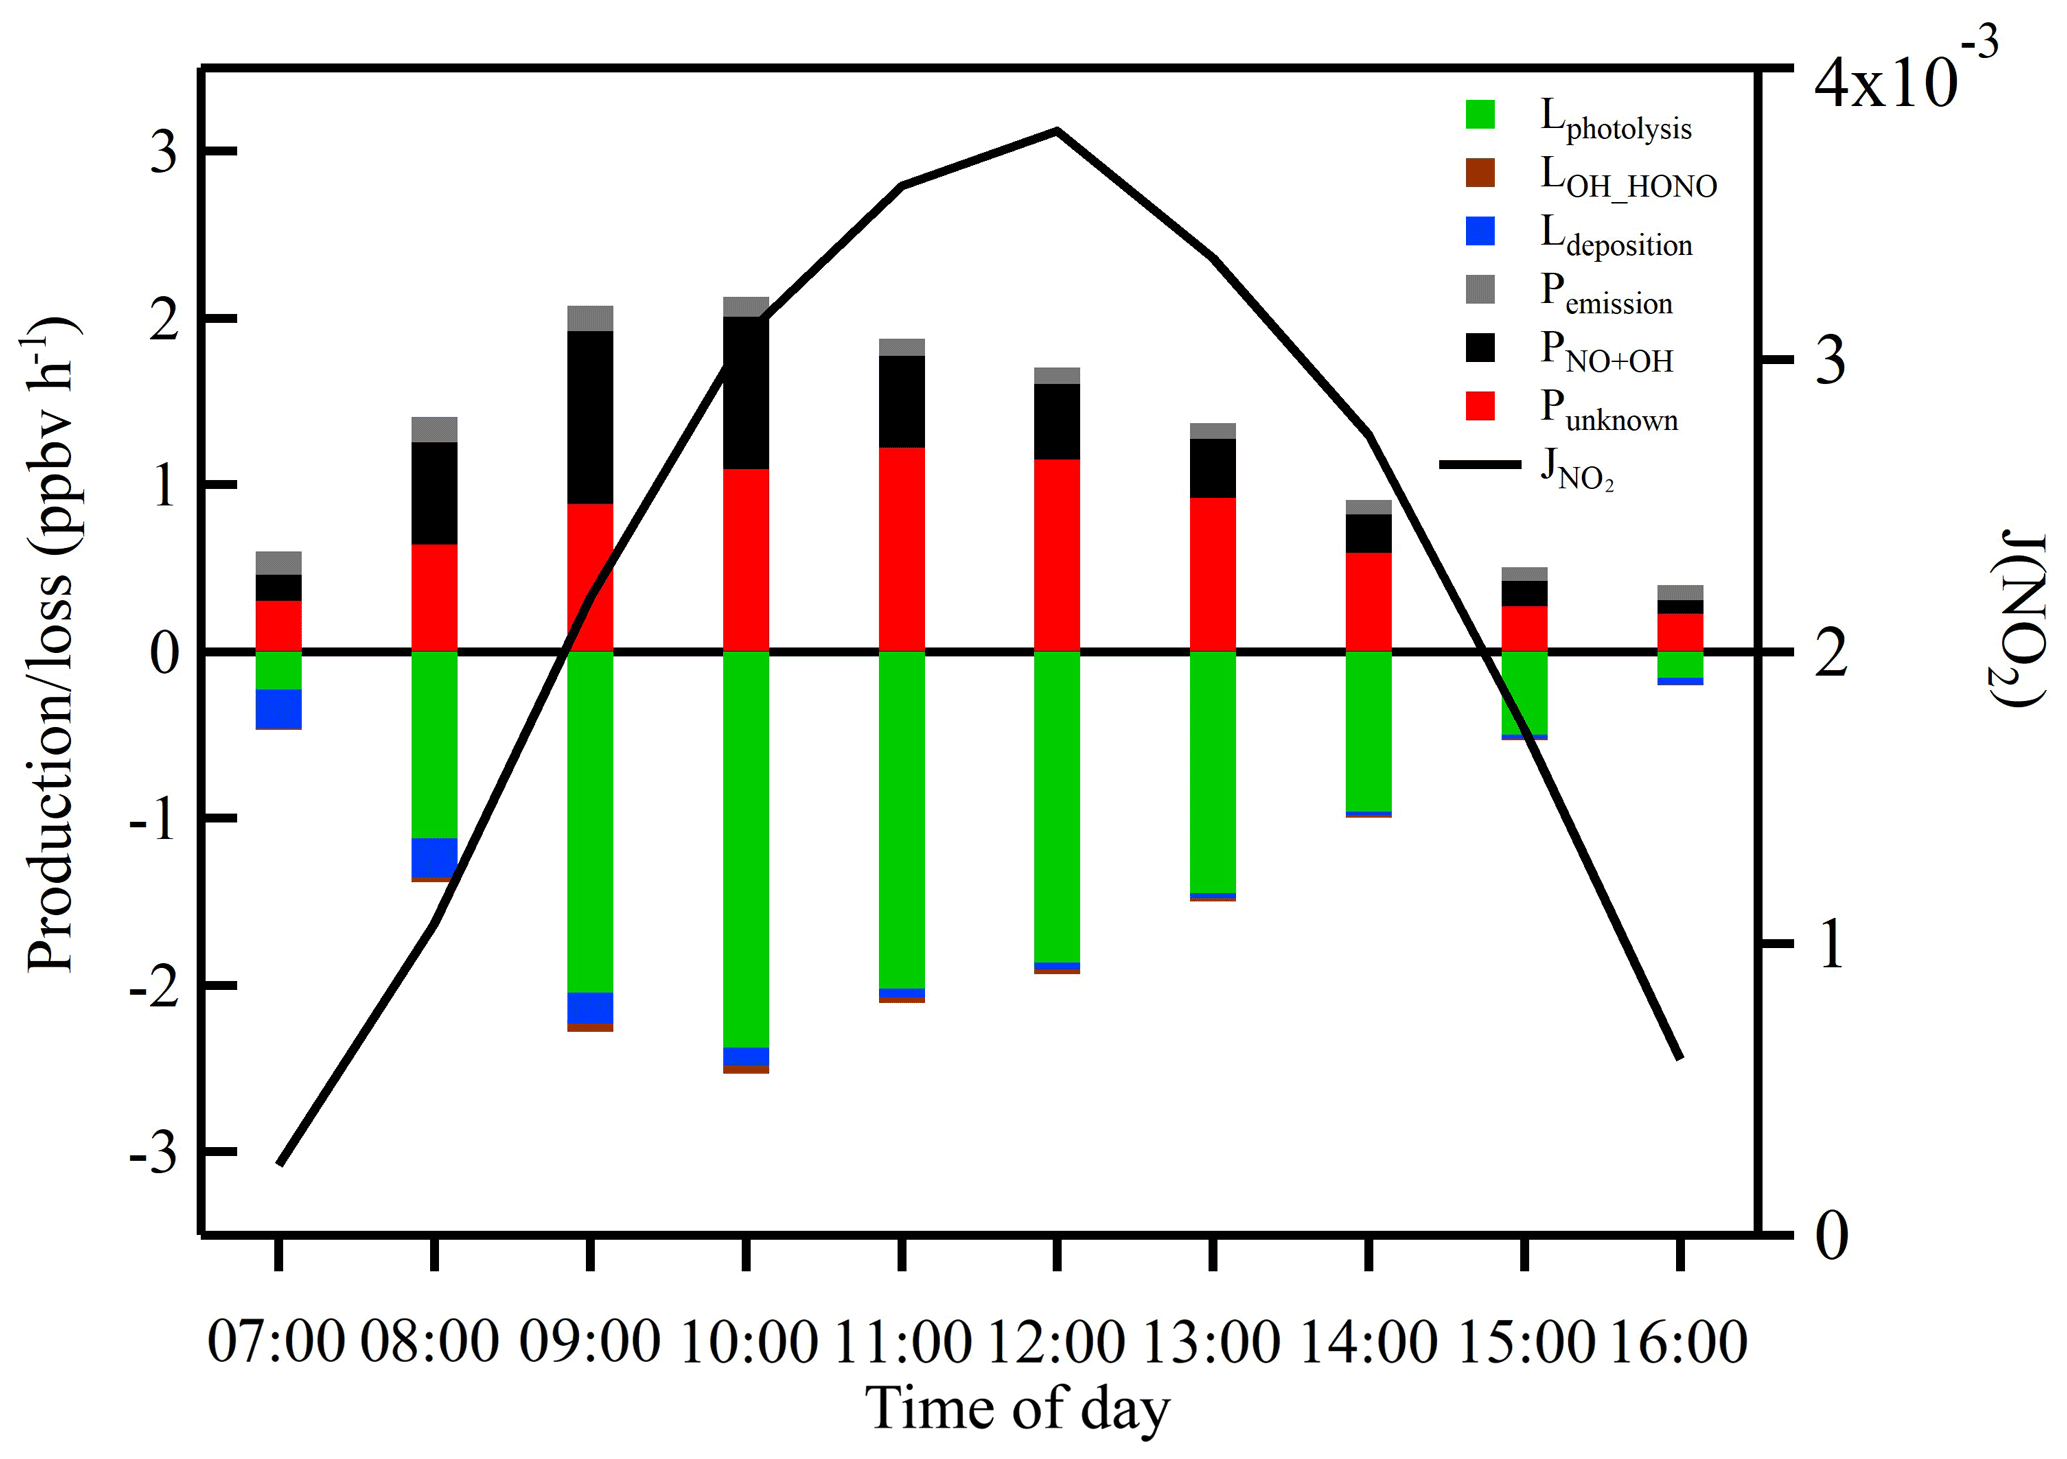
Figure 9Averaged production and loss rates of daytime HONO and J(NO2) during the measurement period. The black line shows the photolysis rate of NO2.
3.5.5 Photo-enhanced conversion of NO2
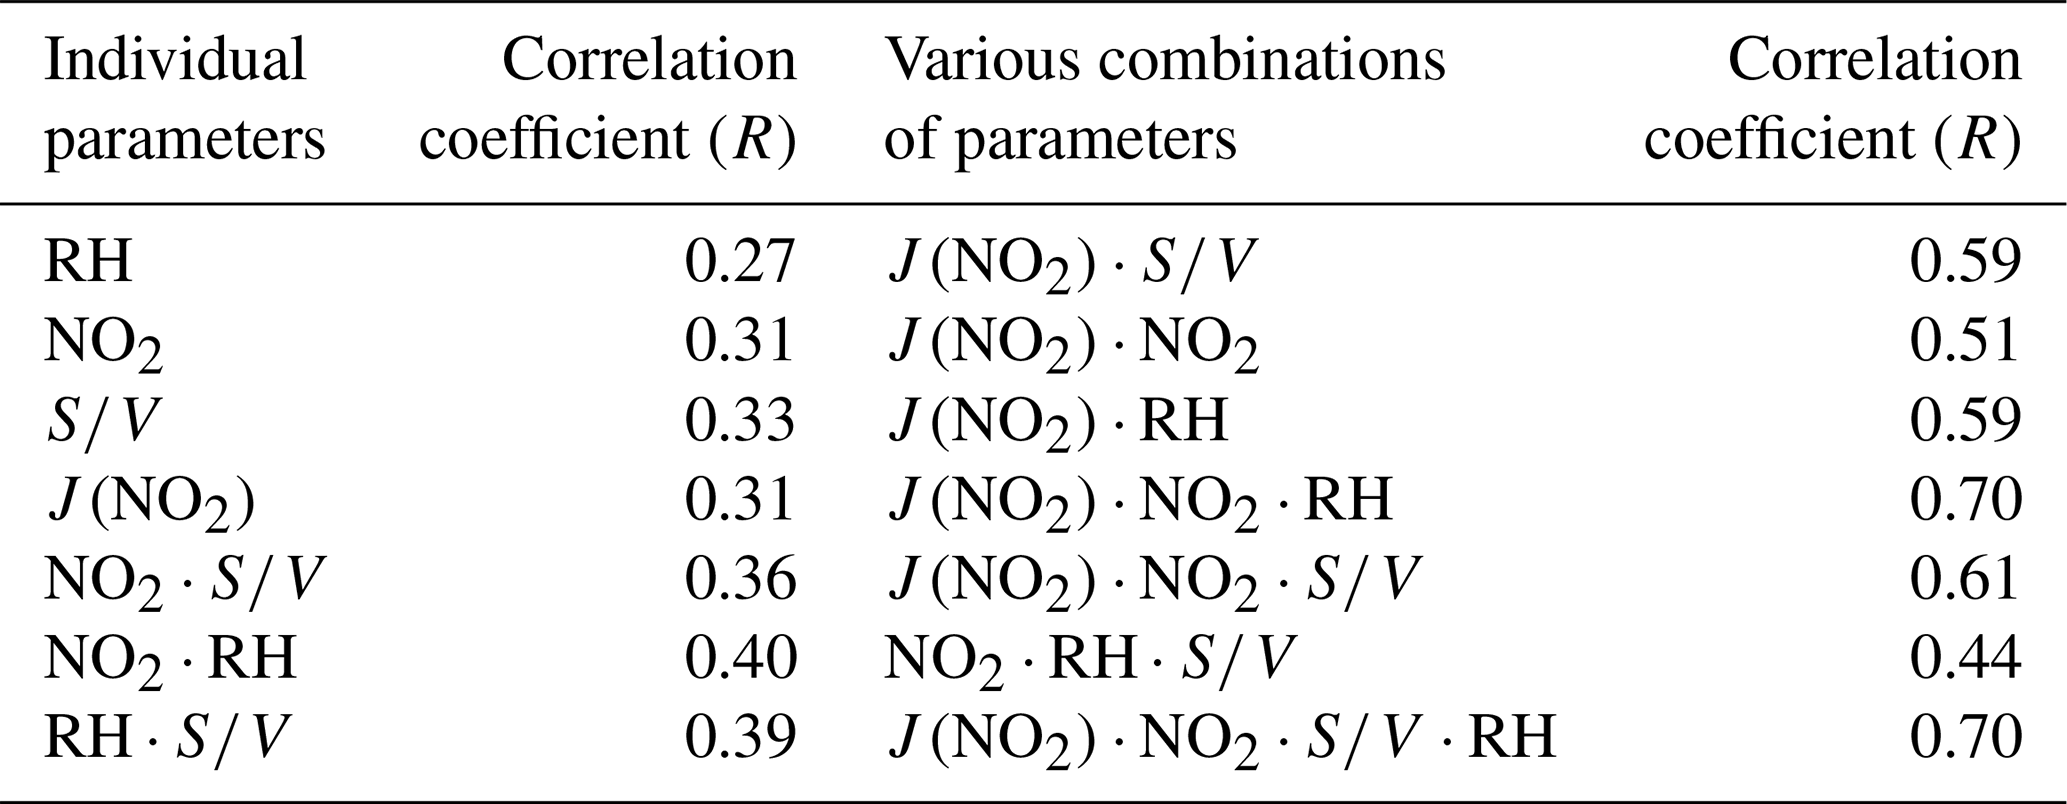
The nature of the unknown source was explored using a correlation analyses between Punknown and other parameters related to HONO production (see Table 3). Punknown does not correlate well with RH, NO2, S∕V or with correlation coefficients (R) of 0.27, 0.31, 0.33 and 0.31, respectively. The correlation only slightly increased when the heterogeneous conversion of NO2 (NO2⋅RH, R=0.40) was taken into consideration. It appeared that the unknown HONO source could not be well explained by the heterogeneous reactions on wet surfaces alone. Previous studies have suggested that light intensity could be an important parameter influencing the heterogeneous conversion of NO2 to HONO (Han et al., 2017b; Lee et al., 2016). The photo-enhanced HONO source during the daytime has also been identified in different environments ranging from remote (Villena et al., 2011; Zhou et al., 2002) to urban conditions (Lee et al., 2016). When photo-enhancement was also considered (, R=0.70), a significantly better correlation was achieved (Table 3). This suggests that the photosensitized reaction of NO2 on wet surfaces may be an important source of HONO during daytime. Thus, the improvement in the correlation between HONO and other parameters indicates that photochemistry might indeed play an important role in daytime HONO formation (George et al., 2005; Stemmler et al., 2006). As the correlation coefficient between Punknown and is comparable with the value between Punknown and (R=0.70), either ground or aerosol surfaces can be the dominant reaction site for the photosensitized conversion of NO2.
Table 3Linear correlation coefficients (Pearson correlation, R) of the unknown source to parameters related to HONO production.
As aerosol chemical composition was not measured in this work, we cannot demonstrate any possible direct connection between aerosol composition and the photo-enhanced HONO formation on aerosol surfaces. Nevertheless, the actual mechanism underlying the photo-enhanced HONO formation on aerosol surfaces requires further investigation. It has been found that the photosensitized NO2 conversion rate coefficient on different surfaces can vary substantially (Han et al., 2017a; Stemmler et al., 2006). Furthermore, studies have shown that this type of surface reaction is not catalytic in nature, and the surface reaction rate may vary with the availability and aging state of the surface reaction sites (Stemmler et al., 2006). Therefore, the aerosol chemical composition alone may not be sufficient to reveal the actual HONO formation processes.
3.5.6 Model simulation of HONO
The relative contributions of potential HONO sources were assessed using a box model based on the Master Chemical Mechanism (MCMv3.2; Jenkin et al., 2012). In addition to the homogeneous reaction of NO with OH and primary emission, four sources of HONO were included: heterogeneous HONO formation from NO2 reactions on aerosol surfaces and the ground surface and light-induced conversion of NO2 on aerosols and the ground surface. Dry deposition of HONO was also considered, and a deposition velocity of 0.48 cm s−1 was used here (Lee et al., 2016).
Most laboratory studies suggest that the heterogeneous reaction on surfaces that leads to HONO is proportional to the first order of NO2 (Finlayson-Pitts and Pitts, 1999); therefore, HONO formation can be represented by the following reactions (Li et al., 2010):
where ka and kg are the first-order rate constants for aerosol and ground surface reactions, respectively. For the heterogeneous reaction on aerosols, the first-order rate constant was estimated as follows:
where is the root-mean-square (RMS) velocity of NO2; S∕V is the aerosol surface area-to-volume ratio; and is the reactive uptake coefficient on the aerosol surface, with a value of under dark conditions (Aumont et al., 2003; Li et al., 2010). Under sunlight, however, a significant enhancement of the NO2 conversion to HONO has been found for various types of aerosol surfaces, such as humic acid and similar organic materials (Stemmler et al., 2007), soot (Monge et al., 2010) and mineral dusts (Ndour et al., 2008). To account for this photo-enhancement, a higher uptake coefficient value () was used for solar radiation less than 400 W m−2, and an uptake coefficient scaled by (light intensity)∕400 was used for solar radiation larger than 400 W m−2 (as suggested by Li et al., 2010). Accordingly, in this work, the photo-enhanced uptake coefficient was taken as around the morning hours (∼09:00 LT) and was scaled by the measured photolysis rate of NO2, i.e., for higher than (the value of at ∼09:00 LT.).
Equation (14) was used to denote heterogeneous reactions on ground surfaces, where represents the deposition velocity of NO2, H is the PBL height and is the reactive uptake coefficient on the ground. Here, we assume an NO2 reactive uptake coefficient of (Trick, 2004) in the dark on ground surfaces with a yield of 50 % and increase it to in the daytime, given that the photosensitized reactivity of NO2 on the ground surface is the same as on aerosol surfaces. The observed boundary layer height varied from 73 to 600 m diurnally. The same scale factor was also applied to the daytime ground surface reactions.
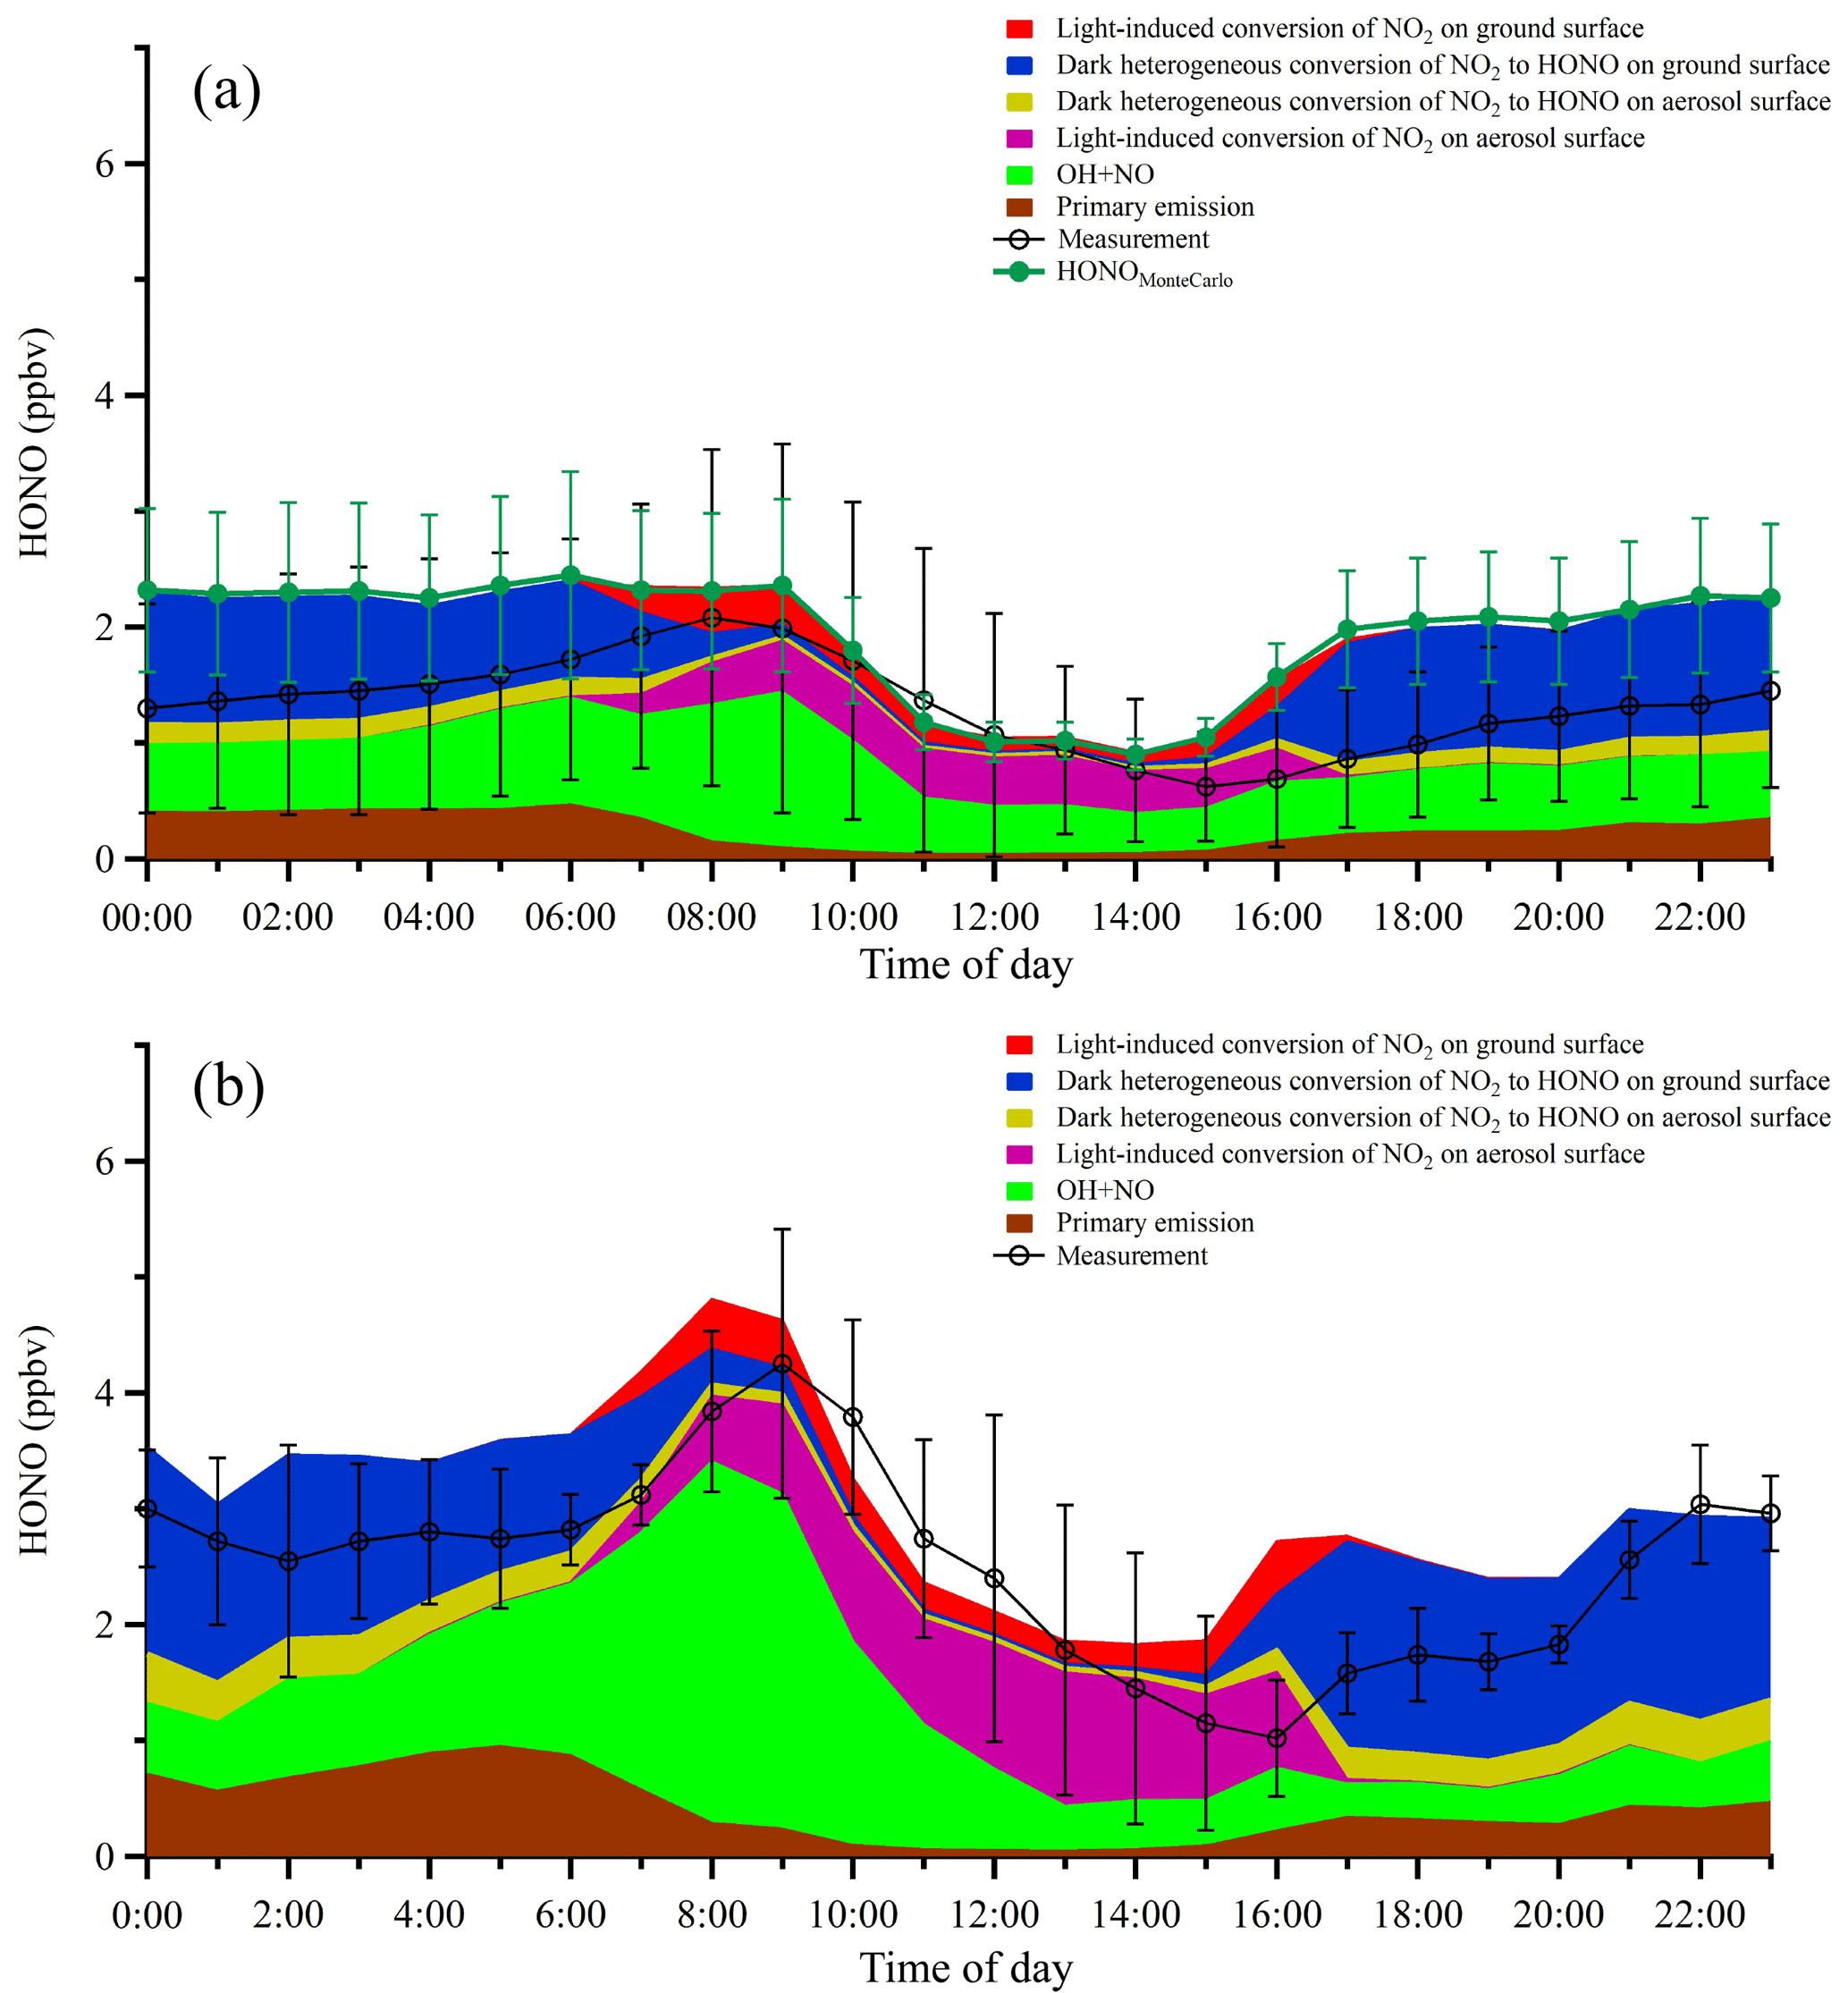
Figure 10(a) Averaged diurnal profiles of the measured HONO and the modeled HONO from different sources. Error bars on the black line represent the standard deviations of HONO measurements in hourly bins. Error bars on the green markers denote the Monte Carlo analysis results. (b) The same plot as panel (a) except that only the two industrial plume events (7 December and 21–22 December 2015) were considered in the model.
Figure 10a shows the averaged diurnal profiles of the measured and simulated HONO concentrations from different sources. In general, the box model can capture the observed HONO trend with a very similar magnitude of concentration, with a modeled-to-observed HONO ratio of 1.26 during the day and 1.66 at night. In the early morning, the ground surface appeared to play an important role in HONO heterogeneous production while the PBL was still relatively shallow. However, after ∼09:00 LT, despite of the swift development of the PBL, the fine particle loading started to increase substantially (as shown in Fig. 3), indicating the strong secondary formation of aerosols. Meanwhile, HONO production on aerosol surfaces also increased moderately. We found that higher daytime values were mostly due to the light-induced conversion of NO2 on aerosol surfaces in addition to the homogeneous reaction of NO with OH. In contrast, heterogeneous HONO production on ground surfaces dominated nocturnal HONO sources, and the nighttime aerosol surfaces only contributed slightly (2.2 % and 7.9 %, respectively) to the total nighttime HONO. The box model tended to underpredict HONO during daytime, which also led to a ∼1 h delay in the peak of the simulated HONO. The most likely reason for these disagreements is the fact that the heterogeneous conversion of NO2 on various surfaces is too complicated to be fully represented by a single scaling parameter in a linear form. Nevertheless, the general agreement between observation and simulation values in this work demonstrated that photoinduced NO2 conversion on aerosol surfaces was the most important HONO source in the study area during the daytime.
A Monte Carlo sensitivity analysis was also conducted to assess the model simulation uncertainty of the HONO concentration. For each of the 24 h, 100 independent runs were performed. The Monte Carlo sensitivity analysis showed that the model uncertainty of HONO ranged from ±13 % to ±38 %. The sensitivity analysis reinforced the conclusion that the proposed heterogeneous sources can generally capture the observed HONO trend.
To investigate the interaction between HONO chemistry and secondary aerosol formation within industrial plumes, we simulated HONO within the two industrial plume events (see Fig. 6; the results of the simulations are given in Fig. 10b). Clearly, HONO was much higher within the industrial plumes compared with the campaign average (Fig. 10a). In addition, we performed a model sensitivity study with respect to the aerosol surface density by varying S∕V from 50 % to 200 % of the average value. The results showed that the contribution from the heterogeneous photosensitized conversion of NO2 on aerosol surfaces varied correspondingly from 18 % to 40 % of the total HONO budget, demonstrating that aerosol surface chemistry played an important role during HONO formation in the study area. Indeed, aerosol surfaces were the most important HONO source during daytime (07:00–16:00 LT), especially in the afternoon. Within the industrial plumes, aerosol surfaces contributed around 35 % of the observed daytime HONO, whereas only about 11 % of the total HONO was from ground surfaces. The fact that ground surfaces were less important during daytime than at nighttime was most likely due to the much higher daytime PBL, which caused substantial dilution of HONO formed on ground surfaces. Meanwhile, secondary particulate matter was rapidly produced within the PBL, providing additional heterogeneous reaction sites for HONO formation and a strong OH source to further promote the atmospheric oxidative capacity. It should be noted that the reactive uptake of NO2 on various surfaces can be highly variable depending on the surface. The value used here () is toward the lower end of values reported in the literature, which is likely the reason that the simulated HONO is generally less than the observation values within industrial plumes. The heterogeneous NO2 uptake kinetics and HONO yields of real atmospheric substrates are still under active study and may be different from the artificial surfaces studied in the laboratory setting. Nevertheless, the enhanced photosensitized conversion of NO2 on aerosol surfaces is demonstrated here as a major HONO source in the plumes influenced by industrial emissions.
Nitrous acid was measured using a custom-built wet-chemistry-based HONO analyzer, along with other atmospheric OH precursors (O3 and HCHO) at a suburban site in Nanjing, China, in December 2015. The mixing ratios of HONO varied from 0.03 to 7.04 ppbv with an average of 1.32±0.92 ppbv. Daytime HONO was sustained at a relatively high concentration, with a minimum diurnal hourly average of ∼0.6 ppbv observed around 16:00 LT. A MCM box model was used to investigate the HONO chemistry and its impact on atmospheric oxidation capacity in the study area. The results show that the average OH production rates from the photolysis of HONO, the ozonolysis of alkenes, the photolysis of O3, HCHO, and H2O2 were 7.13×10⁶, 3.94×10⁶, 2.46×10⁶, 1.60×10⁶ and 2.39×10⁵ molec. cm−3 s−1, respectively. The box model results show that the average total OH production rate was 1.54×10⁷ molec. cm−3 s−1 during the daytime, which was about 45 % from the photolysis of HONO, 30 % from the ozonolysis of alkenes, 15 % from the photolysis of O3, 8 % from the photolysis of HCHO and 2 % from the photolysis of H2O2 on average.
Elevated daytime HONO evidently played an important role in sustaining the atmospheric oxidative capability in the study area, which cannot be explained by the typical OH+NO homogeneous formation mechanism. The observed similarity between the diurnal profiles of the HONO∕NO2 ratio and HONO strongly suggests that HONO most likely originated from NO2 heterogeneous reactions. In this study, the averaged NO2 to HONO conversion rate was determined to be ∼0.8 % h−1 at night. A good correlation between the nocturnal HONO∕NO2 ratio and the product of supports the heterogeneous NO2∕H2O reaction mechanism.
To fully assess the HONO chemistry in the study area, a MCM box model was developed to examine the HONO budget. In general, the box model can capture the observed HONO trend with a modeled-to-observed HONO ratio of 1.26 during the day and 1.66 at night. The model suggests that higher daytime levels of HONO were mainly produced by the light-induced conversion of NO2 on aerosol surfaces (28.2 %) and ground surfaces (17.8 %), except in the early morning. While the heterogeneous HONO production on ground surfaces dominated nocturnal HONO sources, heterogeneous reactions on various surfaces only contributed a small portion of the total HONO at daytime (2.2 % on aerosol surfaces and 7.9 % on ground surfaces). The box model tends to overpredict HONO at night. The most possible reason for these discrepancies is the fact that the heterogeneous conversion of NO2 on various surfaces was too complicated to be fully represented by a single scaling parameter in a linear form. Nevertheless, the general agreement between the observations and simulations in this work reiterated that photoinduced NO2 conversion on ground and aerosol surfaces was the most important HONO source in the study area. In the industrial plume case study, it was demonstrated that heterogeneous photosensitized conversion of NO2 on aerosol surfaces was particularly intensified when the rapid growth of secondary particulate matter was simultaneously observed. Our results indicate that the heterogeneous photosensitized conversion of NO2 on aerosol surfaces becomes the largest HONO source during the daytime, which, in turn, can enhance OH production, increase the oxidative capacity of atmosphere and further strengthen the formation of SOA during the daytime in this environment.
The field observation data and modeling parameters used in this study have been given as time series plots (Figs. 1, 3 and 4) and Table 2 in the paper. The reaction rate coefficients used in the box model were taken from http://mcm.leeds.ac.uk/MCM (last access: 1 July 2019). High resolution data sets can be obtained from the author upon request (zheng.jun@nuist.edu.cn).
The supplement related to this article is available online at: https://doi.org/10.5194/acp-20-5457-2020-supplement.
JZ, YM and XR designed the experiments. XS, HJ, YG, WW, YZ, WZ and YD carried out the field measurements and data analysis. XS and XR performed the MCM box model simulation. JZ, XS and YM prepared the paper with comments from all coauthors.
The authors declare that they have no conflict of interest.
This article is part of the special issue “Multiphase chemistry of secondary aerosol formation under severe haze”. It is not associated with a conference.
This work was supported by the National Natural Science Foundation of China (grant nos. 41730106, 41575122, 41675126 and 41975172) and the National Key Research and Development Project (grant no. 2017YFC0209501).
This paper was edited by Aijun Ding and reviewed by three anonymous referees.
Acker, K. and Möller, D.: Atmospheric variation of nitrous acid at different sites in Europe, Environ. Chem., 4, 242–255, https://doi.org/10.1071/EN07023, 2007.
Acker, K., Möller, D., Wieprecht, W., Meixner, F. X., Bohn, B., Gilge, S., Plass-Dülmer, C., and Berresheim, H.: Strong daytime production of OH from HNO2 at a rural mountain site, Geophys. Res. Letts., 33, L02809, https://doi.org/10.1029/2005GL024643, 2006.
Alicke, B., Platt, U., and Stutz, J.: Impact of nitrous acid photolysis on the total hydroxyl radical budget during the Limitation of Oxidant Production/Pianura Padana Produzione di Ozono study in Milan, J. Geophys. Res.-Atmos., 107, 8196, https://doi.org/10.1029/2000JD000075, 2002.
Alicke, B., Geyer, A., Hofzumahaus, A., Holland, F., Konrad, S., Patz, H. W., Schafer, J., Stutz, J., Volz-Thomas, A., and Platt, U.: OH formation by HONO photolysis during the BERLIOZ experiment, J. Geophys. Res.-Atmos., 108, 17, 8247, https://doi.org/10.1029/2001jd000579, 2003.
Ammann, M., Kalberer, M., Jost, D. T., Tobler, L., Rossler, E., Piguet, D., Gaggeler, H. W., and Baltensperger, U.: Heterogeneous production of nitrous acid on soot in polluted air masses, Nature, 395, 157–160, https://doi.org/10.1038/25965, 1998.
Atkinson, R. and Arey, J.: Atmospheric degradation of volatile organic compounds, Chem. Rev., 103, 4605–4638, https://doi.org/10.1021/cr0206420, 2003.
Aumont, B., Chervier, F., and Laval, S.: Contribution of HONO sources to the chemistry in the polluted boundary layer, Atmos. Environ., 37, 487–498, https://doi.org/10.1016/S1352-2310(02)00920-2, 2003.
Bernard, F., Cazaunau, M., Grosselin, B., Zhou, B., Zheng, J., Liang, P., Zhang, Y., Ye, X., Daele, V., Mu, Y., Zhang, R., Chen, J., and Mellouki, A.: Measurements of nitrous acid (HONO) in urban area of Shanghai, China, Environ. Sci. Pollut. R., 23, 5818–5829, https://doi.org/10.1007/s11356-015-5797-4, 2016.
Chan, K. L., Wang, S., Liu, C., Zhou, B., Wenig, M. O., and Saiz-Lopez, A.: On the summertime air quality and related photochemical processes in the megacity Shanghai, China, Sci. Total Environ., 580, 974–983, https://doi.org/10.1016/j.scitotenv.2016.12.052, 2017.
Ding, A. J., Fu, C. B., Yang, X. Q., Sun, J. N., Zheng, L. F., Xie, Y. N., Herrmann, E., Nie, W., Petäjä, T., Kerminen, V.-M., and Kulmala, M.: Ozone and fine particle in the western Yangtze River Delta: an overview of 1 yr data at the SORPES station, Atmos. Chem. Phys., 13, 5813–5830, https://doi.org/10.5194/acp-13-5813-2013, 2013.
Elshorbany, Y. F., Kurtenbach, R., Wiesen, P., Lissi, E., Rubio, M., Villena, G., Gramsch, E., Rickard, A. R., Pilling, M. J., and Kleffmann, J.: Oxidation capacity of the city air of Santiago, Chile, Atmos. Chem. Phys., 9, 2257–2273, https://doi.org/10.5194/acp-9-2257-2009, 2009.
Elshorbany, Y. F., Kleffmann, J., Kurtenbach, R., Lissi, E., Rubio, M., Villena, G., Gramsch, E., Rickard, A. R., Pilling, M. J., and Wiesen, P.: Seasonal dependence of the oxidation capacity of the city of Santiago de Chile, Atmos. Environ., 44, 5383–5394, https://doi.org/10.1016/j.atmosenv.2009.08.036, 2010.
Elshorbany, Y. F., Steil, B., Brühl, C., and Lelieveld, J.: Impact of HONO on global atmospheric chemistry calculated with an empirical parameterization in the EMAC model, Atmos. Chem. Phys., 12, 9977–10000, https://doi.org/10.5194/acp-12-9977-2012, 2012.
Emmerson, K. M., Carslaw, N., Carslaw, D. C., Lee, J. D., McFiggans, G., Bloss, W. J., Gravestock, T., Heard, D. E., Hopkins, J., Ingham, T., Pilling, M. J., Smith, S. C., Jacob, M., and Monks, P. S.: Free radical modelling studies during the UK TORCH Campaign in Summer 2003, Atmos. Chem. Phys., 7, 167–181, https://doi.org/10.5194/acp-7-167-2007, 2007.
Finlayson-Pitts, B. J. and Pitts, J. N.: Chemistry of the upper and lower atmosphere: theory, experiments and applications, Academic Press, San Diego, Calif., xxii, 969 pp., 1999.
Finlayson-Pitts, B. J., Wingen, L. M., Sumner, A. L., Syomin, D., and Ramazan, K. A.: The heterogeneous hydrolysis of NO2 in laboratory systems and in outdoor and indoor atmospheres: An integrated mechanism, Phys. Chem. Chem. Phys., 5, 223–242, https://doi.org/10.1039/b208564j, 2003.
Gall, E. T., Griffin, R. J., Steiner, A. L., Dibb, J., Scheuer, E., Gong, L., Rutter, A. P., Cevik, B. K., Kim, S., Lefer, B., and Flynn, J.: Evaluation of nitrous acid sources and sinks in urban outflow, Atmos. Environ., 127, 272–282, https://doi.org/10.1016/j.atmosenv.2015.12.044, 2016.
George, C., Strekowski, R. S., Kleffmann, J., Stemmler, K., and Ammann, M.: Photoenhanced uptake of gaseous NO2 on solid organic compounds: a photochemical source of HONO?, Faraday Discuss., 130, 195–210, https://doi.org/10.1039/B417888M, 2005.
Gerecke, A., Thielmann, A., Gutzwiller, L., and Rossi, M. J.: The chemical kinetics of HONO formation resulting from heterogeneous interaction of NO2 with flame soot, Geophys. Res. Lett., 25, 2453–2456, https://doi.org/10.1029/98GL01796, 1998.
Gherman, T., Venables, D. S., Vaughan, S., Orphal, J., and Ruth, A. A.: Incoherent Broadband Cavity-Enhanced Absorption Spectroscopy in the near-Ultraviolet: Application to HONO and NO2, Environ. Sci. Technol., 42, 890–895, https://doi.org/10.1021/es0716913, 2008.
Guo, J., Tilgner, A., Yeung, C., Wang, Z., Louie, P. K. K., Luk, C. W. Y., Xu, Z., Yuan, C., Gao, Y., Poon, S., Herrmann, H., Lee, S., Lam, K. S., and Wang, T.: Atmospheric Peroxides in a Polluted Subtropical Environment: Seasonal Variation, Sources and Sinks, and Importance of Heterogeneous Processes, Environ. Sci. Technol., 48, 1443–1450, https://doi.org/10.1021/es403229x, 2014.
Gutzwiller, L., Arens, F., Baltensperger, U., Gäggeler, H. W., and Ammann, M.: Significance of Semivolatile Diesel Exhaust Organics for Secondary HONO Formation, Environ. Sci. Technol., 36, 677–682, https://doi.org/10.1021/es015673b, 2002.
Han, C., Liu, Y., and He, H.: Heterogeneous reaction of NO2 with soot at different relative humidity., Environ. Sci. Pollut. R., 24, 21248–21255, https://doi.org/10.1007/s11356-017-9766-y, 2017a.
Han, C., Yang, W., Yang, H., and Xue, X.: Enhanced photochemical conversion of NO2 to HONO on humic acids in the presence of benzophenone, Environ. Pollut., 231, 979–986, https://doi.org/10.1016/j.envpol.2017.08.107, 2017b.
Heard, D. E., Carpenter, L. J., Creasey, D. J., Hopkins, J. R., Lee, J. D., Lewis, A. C., Pilling, M. J., Seakins, P. W., Carslaw, N., and Emmerson, K. M.: High levels of the hydroxyl radical in the winter urban troposphere, Geophys. Res. Letts., 31, L18112, https://doi.org/10.1029/2004gl020544, 2004.
Heland, J., Kleffmann, J., Kurtenbach, R., and Wiesen, P.: A New Instrument To Measure Gaseous Nitrous Acid (HONO) in the Atmosphere, Environ. Sci. Technol., 35, 3207–3212, https://doi.org/10.1021/es000303t, 2001.
Hendrick, F., Müller, J.-F., Clémer, K., Wang, P., De Mazière, M., Fayt, C., Gielen, C., Hermans, C., Ma, J. Z., Pinardi, G., Stavrakou, T., Vlemmix, T., and Van Roozendael, M.: Four years of ground-based MAX-DOAS observations of HONO and NO2 in the Beijing area, Atmos. Chem. Phys., 14, 765–781, https://doi.org/10.5194/acp-14-765-2014, 2014.
Hofzumahaus, A., Rohrer, F., Lu, K., Bohn, B., Brauers, T., Chang, C. C., Fuchs, H., Holland, F., Kita, K., Kondo, Y., Li, X., Lou, S., Shao, M., Zeng, L., Wahner, A., and Zhang, Y.: Amplified trace gas removal in the troposphere, Science, 324, 1702–1704, https://doi.org/10.1126/science.1164566, 2009.
Hua, W., Chen, Z. M., Jie, C. Y., Kondo, Y., Hofzumahaus, A., Takegawa, N., Chang, C. C., Lu, K. D., Miyazaki, Y., Kita, K., Wang, H. L., Zhang, Y. H., and Hu, M.: Atmospheric hydrogen peroxide and organic hydroperoxides during PRIDE-PRD'06, China: their concentration, formation mechanism and contribution to secondary aerosols, Atmos. Chem. Phys., 8, 6755–6773, https://doi.org/10.5194/acp-8-6755-2008, 2008.
Huang, G., Zhou, X., Deng, G., Qiao, H., and Civerolo, K.: Measurements of atmospheric nitrous acid and nitric acid, Atmos. Environ., 36, 2225–2235, https://doi.org/10.1016/S1352-2310(02)00170-X, 2002.
Huang, R.-J., Yang, L., Cao, J., Wang, Q., Tie, X., Ho, K.-F., Shen, Z., Zhang, R., Li, G., Zhu, C., Zhang, N., Dai, W., Zhou, J., Liu, S., Chen, Y., Chen, J., and O'Dowd, C. D.: Concentration and sources of atmospheric nitrous acid (HONO) at an urban site in Western China, Sci. Total Environ., 593–594, 165–172, https://doi.org/10.1016/j.scitotenv.2017.02.166, 2017.
Jenkin, M. E., Saunders, S. M., and Pilling, M. J.: The tropospheric degradation of volatile organic compounds: a protocol for mechanism development, Atmos. Environ., 31, 81–104, https://doi.org/10.1016/S1352-2310(96)00105-7, 1997.
Jenkin, M. E., Wyche, K. P., Evans, C. J., Carr, T., Monks, P. S., Alfarra, M. R., Barley, M. H., McFiggans, G. B., Young, J. C., and Rickard, A. R.: Development and chamber evaluation of the MCM v3.2 degradation scheme for β-caryophyllene, Atmos. Chem. Phys., 12, 5275–5308, https://doi.org/10.5194/acp-12-5275-2012, 2012.
Kirchstetter, T. W., Harley, A. R., and Littlejohn, D.: Measurement of nitrous acid in motor vehicle exhaust, Environ. Sci. Technol., 30, 2843–2849, https://doi.org/10.1021/es960135y, 1996.
Kleffmann, J. and Wiesen, P.: Technical Note: Quantification of interferences of wet chemical HONO LOPAP measurements under simulated polar conditions, Atmos. Chem. Phys., 8, 6813–6822, https://doi.org/10.5194/acp-8-6813-2008, 2008.
Kleffmann, J., Becker, K. H., and Wiesen, P.: Heterogeneous NO2 conversion processes on acid surfaces: possible atmospheric implications, Atmos. Environ., 32, 2721–2729, https://doi.org/10.1016/S1352-2310(98)00065-X, 1998.
Kleffmann, J., Kurtenbach, R., Lörzer, J., Wiesen, P., Kalthoff, N., Vogel, B., and Vogel, H.: Measured and simulated vertical profiles of nitrous acid-Part I: Field measurements, Atmos. Environ., 37, 2949–2955, https://doi.org/10.1016/s1352-2310(03)00242-5, 2003.
Kleffmann, J., Gavriloaiei, T., Hofzumahaus, A., Holland, F., Koppmann, R., Rupp, L., Schlosser, E., Siese, M., and Wahner, A.: Daytime formation of nitrous acid: A major source of OH radicals in a forest, Geophys. Res. Letts., 32, L05818, https://doi.org/10.1029/2005GL022524, 2005.
Kleffmann, J., Lörzer, J. C., Wiesen, P., Kern, C., Trick, S., Volkamer, R., Rodenas, M., and Wirtz, K.: Intercomparison of the DOAS and LOPAP techniques for the detection of nitrous acid (HONO), Atmos. Environ., 40, 3640–3652, https://doi.org/10.1016/j.atmosenv.2006.03.027, 2006.
Kurtenbach, R., Becker, K. H., Gomes, J. A. G., Kleffmann, J., Lörzer, J. C., Spittler, M., Wiesen, P., Ackermann, R., Geyer, A., and Platt, U.: Investigations of emissions and heterogeneous formation of HONO in a road traffic tunnel, Atmos. Environ., 35, 3385–3394, https://doi.org/10.1016/S1352-2310(01)00138-8, 2001.
Lee, J. D., Whalley, L. K., Heard, D. E., Stone, D., Dunmore, R. E., Hamilton, J. F., Young, D. E., Allan, J. D., Laufs, S., and Kleffmann, J.: Detailed budget analysis of HONO in central London reveals a missing daytime source, Atmos. Chem. Phys., 16, 2747–2764, https://doi.org/10.5194/acp-16-2747-2016, 2016.
Li, G., Lei, W., Zavala, M., Volkamer, R., Dusanter, S., Stevens, P., and Molina, L. T.: Impacts of HONO sources on the photochemistry in Mexico City during the MCMA-2006/MILAGO Campaign, Atmos. Chem. Phys., 10, 6551–6567, https://doi.org/10.5194/acp-10-6551-2010, 2010.
Li, X., Brauers, T., Häseler, R., Bohn, B., Fuchs, H., Hofzumahaus, A., Holland, F., Lou, S., Lu, K. D., Rohrer, F., Hu, M., Zeng, L. M., Zhang, Y. H., Garland, R. M., Su, H., Nowak, A., Wiedensohler, A., Takegawa, N., Shao, M., and Wahner, A.: Exploring the atmospheric chemistry of nitrous acid (HONO) at a rural site in Southern China, Atmos. Chem. Phys., 12, 1497–1513, https://doi.org/10.5194/acp-12-1497-2012, 2012.
Liang, Y., Zha, Q., Wang, W., Cui, L., Lui, K. H., Ho, K. F., Wang, Z., Lee, S.-C., and Wang, T.: Revisiting nitrous acid (HONO) emission from on-road vehicles: A tunnel study with a mixed fleet, J. Air Waste Manage., 67, 797–805, https://doi.org/10.1080/10962247.2017.1293573, 2017.
Lu, K. D., Rohrer, F., Holland, F., Fuchs, H., Bohn, B., Brauers, T., Chang, C. C., Häseler, R., Hu, M., Kita, K., Kondo, Y., Li, X., Lou, S. R., Nehr, S., Shao, M., Zeng, L. M., Wahner, A., Zhang, Y. H., and Hofzumahaus, A.: Observation and modelling of OH and HO2 concentrations in the Pearl River Delta 2006: a missing OH source in a VOC rich atmosphere, Atmos. Chem. Phys., 12, 1541–1569, https://doi.org/10.5194/acp-12-1541-2012, 2012.
Ma, Y., Diao, Y., Zhang, B., Wang, W., Ren, X., Yang, D., Wang, M., Shi, X., and Zheng, J.: Detection of formaldehyde emissions from an industrial zone in the Yangtze River Delta region of China using a proton transfer reaction ion-drift chemical ionization mass spectrometer, Atmos. Meas. Tech., 9, 6101–6116, https://doi.org/10.5194/amt-9-6101-2016, 2016.
Makkonen, U., Virkkula, A., Mäntykenttä, J., Hakola, H., Keronen, P., Vakkari, V., and Aalto, P. P.: Semi-continuous gas and inorganic aerosol measurements at a Finnish urban site: comparisons with filters, nitrogen in aerosol and gas phases, and aerosol acidity, Atmos. Chem. Phys., 12, 5617–5631, https://doi.org/10.5194/acp-12-5617-2012, 2012.
Michoud, V., Colomb, A., Borbon, A., Miet, K., Beekmann, M., Camredon, M., Aumont, B., Perrier, S., Zapf, P., Siour, G., Ait-Helal, W., Afif, C., Kukui, A., Furger, M., Dupont, J. C., Haeffelin, M., and Doussin, J. F.: Study of the unknown HONO daytime source at a European suburban site during the MEGAPOLI summer and winter field campaigns, Atmos. Chem. Phys., 14, 2805–2822, https://doi.org/10.5194/acp-14-2805-2014, 2014.
Monge, M. E., D'Anna, B., Mazri, L., Giroir-Fendler, A., Ammann, M., Donaldson, D. J., and George, C.: Light changes the atmospheric reactivity of soot, P. Natl. Acad. Sci. USA, 107, 6605–6609, https://doi.org/10.1073/pnas.0908341107, 2010.
Müller, M., Anderson, B. E., Beyersdorf, A. J., Crawford, J. H., Diskin, G. S., Eichler, P., Fried, A., Keutsch, F. N., Mikoviny, T., Thornhill, K. L., Walega, J. G., Weinheimer, A. J., Yang, M., Yokelson, R. J., and Wisthaler, A.: In situ measurements and modeling of reactive trace gases in a small biomass burning plume, Atmos. Chem. Phys., 16, 3813–3824, https://doi.org/10.5194/acp-16-3813-2016, 2016.
Nakashima, Y. and Kajii, Y.: Determination of nitrous acid emission factors from a gasoline vehicle using a chassis dynamometer combined with incoherent broadband cavity-enhanced absorption spectroscopy, Sci. Total Environ., 575, 287–293, https://doi.org/10.1016/j.scitotenv.2016.10.050, 2017.
Nash, T.: Nitrous acid in the atmosphere and laboratory experiments on its photolysis, Tellus, 26, 175–179, https://doi.org/10.3402/tellusa.v26i1-2.9768, 1974.
Ndour, M., D'Anna, B., George, C., Ka, O., Balkanski, Y., Kleffmann, J., Stemmler, K., and Ammann, M.: Photoenhanced uptake of NO2 on mineral dust: Laboratory experiments and model simulations, Geophys. Res. Letts., 35, L05812, https://doi.org/10.1029/2007gl032006, 2008.
Neftel, A., Blatter, A., Hesterberg, R., and Staffelbach, T.: Measurements of concentration gradients of HNO2 and HNO3 over a semi-natural ecosystem Atmos. Environ., 30, 3017–3025, 1996.
Neuman, J. A., Trainer, M., Brown, S. S., Min, K.-E., Nowak, J. B., Parrish, D. D., Peischl, J., Pollack, I. B., Roberts, J. M., Ryerson, T. B., and Veres, P. R.: HONO emission and production determined from airborne measurements over the Southeast U.S., J. Geophys. Res.-Atmos., 121, 9237–9250, https://doi.org/10.1002/2016JD025197, 2016.
Nie, W., Ding, A. J., Xie, Y. N., Xu, Z., Mao, H., Kerminen, V.-M., Zheng, L. F., Qi, X. M., Huang, X., Yang, X.-Q., Sun, J. N., Herrmann, E., Petäjä, T., Kulmala, M., and Fu, C. B.: Influence of biomass burning plumes on HONO chemistry in eastern China, Atmos. Chem. Phys., 15, 1147–1159, https://doi.org/10.5194/acp-15-1147-2015, 2015.
Perner, D. and Platt, U.: Detection of nitrous-acid in the atmosphere by differential optical-absorption, Geophys. Res. Lett., 6, 917–920, https://doi.org/10.1029/GL006i012p00917, 1979.
Pinto, J. P., Dibb, J., Lee, B. H., Rappenglück, B., Wood, E. C., Levy, M., Zhang, R. Y., Lefer, B., Ren, X. R., Stutz, J., Tsai, C., Ackermann, L., Golovko, J., Herndon, S. C., Oakes, M., Meng, Q. Y., Munger, J. W., Zahniser, M., and Zheng, J.: Intercomparison of field measurements of nitrous acid (HONO) during the SHARP campaign, J. Geophys. Res.-Atmos., 119, 5583–5601, https://doi.org/10.1002/2013JD020287, 2014.
Platt, U., Perner, D., Harris, G. W., Winer, A. M., and Pitts Jr., J. N.: Observations of nitrous acid in an urban atmosphere by differential optical absorption, Nature, 285, 312–314, https://doi.org/10.1038/285312a0, 1980.
Qin, M., Xie, P., Su, H., Gu, J., Peng, F., Li, S., Zeng, L., Liu, J., Liu, W., and Zhang, Y.: An observational study of the HONO-NO2 coupling at an urban site in Guangzhou City, South China, Atmos. Environ., 43, 5731–5742, https://doi.org/10.1016/j.atmosenv.2009.08.017, 2009.
Rairoux, P., Koch, B., Moller, D., Göritz, G., Warmbier, G., and Czyzewski, A.: Atmospheric traces monitoring applying Cavity Ring-Down Spectroscopy, Environ. Sci. Pollut. R., 4, 68–71, 2002.
Ren, X., Brune, W. H., Mao, J., Mitchell, M. J., Lesher, R. L., Simpas, J. B., Metcalf, A. R., Schwab, J. J., Li, Y., Demerjian, K. L., Felton, H. D., Boynton, G., Adams, A., Perry, J., He, Y., Zhou, X., and Hou, J.: Behavior of OH and HO2 in the winter atmosphere in New York City: Observations and model comparison, Atmos. Environ., 40, S252–S263, https://doi.org/10.1016/j.atmosenv.2005.11.073, 2006.
Ren, X., Gao, H., Zhou, X., Crounse, J. D., Wennberg, P. O., Browne, E. C., LaFranchi, B. W., Cohen, R. C., McKay, M., Goldstein, A. H., and Mao, J.: Measurement of atmospheric nitrous acid at Bodgett Forest during BEARPEX2007, Atmos. Chem. Phys., 10, 6283–6294, https://doi.org/10.5194/acp-10-6283-2010, 2010.
Ren, X. R., Harder, H., Martinez, M., Lesher, R. L., Oliger, A., Simpas, J. B., Brune, W. H., Schwab, J. J., Demerjian, K. L., He, Y., Zhou, X. L., and Gao, H. G.: OH and HO2 chemistry in the urban atmosphere of New York City, Atmos. Environ., 37, 3639–3651, https://doi.org/10.1016/s1352-2310(03)00459-x, 2003.
Ren, Y., Ding, A., Wang, T., Shen, X., Guo, J., Zhang, J., Wang, Y., Xu, P., Wang, X., and Gao, J.: Measurement of gas-phase total peroxides at the summit of Mount Tai in China, Atmos. Environ.t, 43, 1702–1711, https://doi.org/10.1016/j.atmosenv.2008.12.020, 2009.
Rickard, A. R., Johnson, D., McGill, C. D., and Marston, G.: OH Yields in the Gas-Phase Reactions of Ozone with Alkenes, J. Phys. Chem. A, 103, 7656–7664, https://doi.org/10.1021/jp9916992, 1999.
Rondon, A. and Sanhueza, E.: High HONO atmospheric concentrations during vegetation burning in the tropical savannah, Tellus B, 41, 474–477, https://doi.org/10.3402/tellusb.v41i4.15102, 1989.
Salmon, O. E., Shepson, P. B., Ren, X., He, H., Hall, D. L., Dickerson, R. R., Stirm, B. H., Brown, S. S., Fibiger, D. L., McDuffie, E. E., Campos, T. L., Gurney, K. R., and Thornton, J. A.: Top-Down Estimates of NOx and CO Emissions From Washington, D.C.-Baltimore During the WINTER Campaign, J. Geophys. Res.-Atmos., 123, 7705–7724, https://doi.org/10.1029/2018jd028539, 2018.
Scharko, N. K., Martin, E. T., Losovyj, Y., Peters, D. G., and Raff, J. D.: Evidence for Quinone Redox Chemistry Mediating Daytime and Nighttime NO2-to-HONO Conversion on Soil Surfaces, Environ. Sci. Technol., 51, 9633–9643, https://doi.org/10.1021/acs.est.7b01363, 2017.
Sörgel, M., Trebs, I., Wu, D., and Held, A.: A comparison of measured HONO uptake and release with calculated source strengths in a heterogeneous forest environment, Atmos. Chem. Phys., 15, 9237–9251, https://doi.org/10.5194/acp-15-9237-2015, 2015.
Spataro, F., Ianniello, A., Esposito, G., Allegrini, I., Zhu, T., and Hu, M.: Occurrence of atmospheric nitrous acid in the urban area of Beijing (China), Sci. Total Environ., 447, 210–224, https://doi.org/10.1016/j.scitotenv.2012.12.065, 2013.
Stemmler, K., Ammann, M., Donders, C., Kleffmann, J., and George, C.: Photosensitized reduction of nitrogen dioxide on humic acid as a source of nitrous acid, Nature, 440, 195–198, https://doi.org/10.1038/nature04603, 2006.
Stemmler, K., Ndour, M., Elshorbany, Y., Kleffmann, J., D'Anna, B., George, C., Bohn, B., and Ammann, M.: Light induced conversion of nitrogen dioxide into nitrous acid on submicron humic acid aerosol, Atmos. Chem. Phys., 7, 4237–4248, https://doi.org/10.5194/acp-7-4237-2007, 2007.
Stutz, J., Alicke, B., Ackermann, R., Geyer, A., Wang, S. H., White, A. B., Williams, E. J., Spicer, C. W., and Fast, J. D.: Relative humidity dependence of HONO chemistry in urban areas, J. Geophys. Res.-Atmos., 109, D03307, https://doi.org/10.1029/2003jd004135, 2004.
Su, H., Cheng, Y. F., Shao, M., Gao, D. F., Yu, Z. Y., Zeng, L. M., Slanina, J., Zhang, Y. H., and Wiedensohler, A.: Nitrous acid (HONO) and its daytime sources at a rural site during the 2004 PRIDE-PRD experiment in China, J. Geophys. Res.-Atmos., 113, D14312, https://doi.org/10.1029/2007JD009060, 2008.
Su, H., Cheng, Y., Oswald, R., Behrendt, T., Trebs, I., Meixner, F. X., Andreae, M. O., Cheng, P., Zhang, Y., and Pöschl, U.: Soil nitrite as a source of atmospheric HONO and OH radicals, Science, 333, 1616–1618, https://doi.org/10.1126/science.1207687, 2011.
Tang, Y., An, J., Wang, F., Li, Y., Qu, Y., Chen, Y., and Lin, J.: Impacts of an unknown daytime HONO source on the mixing ratio and budget of HONO, and hydroxyl, hydroperoxyl, and organic peroxy radicals, in the coastal regions of China, Atmos. Chem. Phys., 15, 9381–9398, https://doi.org/10.5194/acp-15-9381-2015, 2015.
Tanner, D. J. and Eisele, F. L.: Present oh measurement limits and associated uncertainties, J. Geophys. Res.-Atmos., 100, 2883–2892, 1995.
Trick, S.: Formation of nitrous acid on urban surfaces – a physicalchemical perspective, PhD thesis, University of Heidelberg, 2004.
Trinh, H. T., Imanishi, K., Morikawa, T., Hagino, H., and Takenaka, N.: Gaseous nitrous acid (HONO) and nitrogen oxides (NOx) emission from gasoline and diesel vehicles under real-world driving test cycles, J. Air Waste Manage., 67, 412–420, https://doi.org/10.1080/10962247.2016.1240726, 2017.
VandenBoer, T. C., Brown, S. S., Murphy, J. G., Keene, W. C., Young, C. J., Pszenny, A. A. P., Kim, S., Warneke, C., de Gouw, J. A., Maben, J. R., Wagner, N. L., Riedel, T. P., Thornton, J. A., Wolfe, D. E., Dubé, W. P., Öztürk, F., Brock, C. A., Grossberg, N., Lefer, B., Lerner, B., Middlebrook, A. M., and Roberts, J. M.: Understanding the role of the ground surface in HONO vertical structure: High resolution vertical profiles during NACHTT-11, J. Geophys. Res.-Atmos., 118, 10155–110171, https://doi.org/10.1002/jgrd.50721, 2013.
Vecera, Z. and Dasgupta, P. K.: Measurement of ambient nitrous acid and a reliable calibration source for gaseous nitrous acid, Environ. Sci. Technol., 25, 255–260, https://doi.org/10.1021/es00014a006, 1991.
Villena, G., Kleffmann, J., Kurtenbach, R., Wiesen, P., Lissi, E., Rubio, M. A., Croxatto, G., and Rappenglück, B.: Vertical gradients of HONO, NOx and O3 in Santiago de Chile, Atmos. Environ., 45, 3867–3873, https://doi.org/10.1016/j.atmosenv.2011.01.073, 2011.
Villena, G., Bejan, I., Kurtenbach, R., Wiesen, P., and Kleffmann, J.: Interferences of commercial NO2 instruments in the urban atmosphere and in a smog chamber, Atmos. Meas. Tech., 5, 149–159, https://doi.org/10.5194/amt-5-149-2012, 2012.
Wall, K. J. and Harris, G. W.: Uptake of nitrogen dioxide (NO2) on acidic aqueous humic acid (HA) solutions as a missing daytime nitrous acid (HONO) surface source, J. Atmos. Chem., 74, 283–321, https://doi.org/10.1007/s10874-016-9342-8, 2016.
Wang, J., Zhang, X., Guo, J., Wang, Z., and Zhang, M.: Observation of nitrous acid (HONO) in Beijing, China: Seasonal variation, nocturnal formation and daytime budget, Sci. Total Environ., 587–588, 350–359, https://doi.org/10.1016/j.scitotenv.2017.02.159, 2017.
Wang, L., Wen, L., Xu, C., Chen, J., Wang, X., Yang, L., Wang, W., Yang, X., Sui, X., Yao, L., and Zhang, Q.: HONO and its potential source particulate nitrite at an urban site in North China during the cold season, Sci. Total Environ., 538, 93–101, https://doi.org/10.1016/j.scitotenv.2015.08.032, 2015.
Wang, M., Chen, W. T., Shao, M., Lu, S. H., Zeng, L. M., and Hu, M.: Investigation of carbonyl compound sources at a rural site in the Yangtze River Delta region of China, J. Environ. Sci.-China, 28, 128–136, https://doi.org/10.1016/j.jes.2014.12.001, 2015.
Wang, S., Zhou, R., Zhao, H., Wang, Z., Chen, L., and Zhou, B.: Long-term observation of atmospheric nitrous acid (HONO) and its implication to local NO2 levels in Shanghai, China, Atmos. Environ., 77, 718–724, https://doi.org/10.1016/j.atmosenv.2013.05.071, 2013.
Wong, K. W., Oh, H.-J., Lefer, B. L., Rappenglück, B., and Stutz, J.: Vertical profiles of nitrous acid in the nocturnal urban atmosphere of Houston, TX, Atmos. Chem. Phys., 11, 3595–3609, https://doi.org/10.5194/acp-11-3595-2011, 2011.
Wong, K. W., Tsai, C., Lefer, B., Haman, C., Grossberg, N., Brune, W. H., Ren, X., Luke, W., and Stutz, J.: Daytime HONO vertical gradients during SHARP 2009 in Houston, TX, Atmos. Chem. Phys., 12, 635–652, https://doi.org/10.5194/acp-12-635-2012, 2012.
Wong, K. W., Tsai, C., Lefer, B., Grossberg, N., and Stutz, J.: Modeling of daytime HONO vertical gradients during SHARP 2009, Atmos. Chem. Phys., 13, 3587–3601, https://doi.org/10.5194/acp-13-3587-2013, 2013.
Xu, Z., Wang, T., Wu, J., Xue, L., Chan, J., Zha, Q., Zhou, S., Louie, P. K. K., and Luk, C. W. Y.: Nitrous acid (HONO) in a polluted subtropical atmosphere: Seasonal variability, direct vehicle emissions and heterogeneous production at ground surface, Atmos. Environ., 106, 100-109, https://doi.org/10.1016/j.atmosenv.2015.01.061, 2015.
Xue, L., Gu, R., Wang, T., Wang, X., Saunders, S., Blake, D., Louie, P. K. K., Luk, C. W. Y., Simpson, I., Xu, Z., Wang, Z., Gao, Y., Lee, S., Mellouki, A., and Wang, W.: Oxidative capacity and radical chemistry in the polluted atmosphere of Hong Kong and Pearl River Delta region: analysis of a severe photochemical smog episode, Atmos. Chem. Phys., 16, 9891–9903, https://doi.org/10.5194/acp-16-9891-2016, 2016.
Ye, C., Zhou, X., Pu, D., Stutz, J., Festa, J., Spolaor, M., Tsai, C., Cantrell, C., Mauldin, R. L., Campos, T., Weinheimer, A., Hornbrook, R. S., Apel, E. C., Guenther, A., Kaser, L., Yuan, B., Karl, T., Haggerty, J., Hall, S., Ullmann, K., Smith, J. N., Ortega, J., and Knote, C.: Rapid cycling of reactive nitrogen in the marine boundary layer, Nature, 532, 489–491, https://doi.org/10.1038/nature17195, 2016.
Ye, C., Zhang, N., Gao, H., and Zhou, X.: Photolysis of Particulate Nitrate as a Source of HONO and NOx, Environ. Sci. Technol., 51, 6849–6856, https://doi.org/10.1021/acs.est.7b00387, 2017.
Zhang, N., Zhou, X., Shepson, P. B., Gao, H., Alaghmand, M., and Stirm, B.: Aircraft measurement of HONO vertical profiles over a forested region, Geophys. Res. Lett., 36, L15820, https://doi.org/10.1029/2009gl038999, 2009.
Zheng, J., Ma, Y., Chen, M., Zhang, Q., Wang, L., Khalizov, A. F., Yao, L., Wang, Z., Wang, X., and Chen, L.: Measurement of atmospheric amines and ammonia using the high resolution time-of-flight chemical ionization mass spectrometry, Atmos. Environ., 102, 249–259, https://doi.org/10.1016/j.atmosenv.2014.12.002, 2015a.
Zheng, J., Ma, Y., Chen, M., Zhang, Q., Wang, L., Khalizov, A. F., Yao, L., Wang, Z., Wang, X., and Chen, L.: Measurement of atmospheric amines and ammonia using the high resolution time-of-flight chemical ionization mass spectrometry, Atmos. Environ., 102, 249–259, https://doi.org/10.1016/j.atmosenv.2014.12.002, 2015b.
Zhou, X., Civerolo, K., Dai, H., Huang, G., Schwab, J., and Demerjian, K.: Summertime nitrous acid chemistry in the atmospheric boundary layer at a rural site in New York State, J. Geophys. Res.-Atmos., 107, ACH 13-11–ACH 13-11, https://doi.org/10.1029/2001jd001539, 2002.
Zhou, X., Gao, H., He, Y., Huang, G., Bertman, S. B., Civerolo, K., and Schwab, J.: Nitric acid photolysis on surfaces in low-NOx environments: Significant atmospheric implications, Geophys. Res. Lett., 30, 2217, https://doi.org/10.1029/2003gl018620, 2003.
Zhou, X., Zhang, N., TerAvest, M., Tang, D., Hou, J., Bertman, S., Alaghmand, M., Shepson, P. B., Carroll, M. A., Griffith, S., Dusanter, S., and Stevens, P. S.: Nitric acid photolysis on forest canopy surface as a source for tropospheric nitrous acid, Nat. Geosci., 4, 440–443, https://doi.org/10.1038/ngeo1164, 2011.
Ziemba, L. D., Dibb, J. E., Griffin, R. J., Anderson, C. H., Whitlow, S. I., Lefer, B. L., Rappenglück, B., and Flynn, J.: Heterogeneous conversion of nitric acid to nitrous acid on the surface of primary organic aerosol in an urban atmosphere, Atmos. Environ., 44, 4081–4089, https://doi.org/10.1016/j.atmosenv.2008.12.024, 2010.