the Creative Commons Attribution 4.0 License.
the Creative Commons Attribution 4.0 License.
 | 28 Apr 2020
Supercooled drizzle development in response to semi-coherent vertical velocity fluctuations within an orographic-layer cloud
Adam Majewski
Jeffrey R. French
Observations of supercooled liquid water are nearly ubiquitous within wintertime orographic-layer clouds over the Intermountain West; however, observations of regions containing supercooled drizzle drops (SCDDs) are much rarer and the factors controlling SCDD development and location less well understood. As part of the Seeded and Natural Orographic Wintertime clouds – the Idaho Experiment (SNOWIE) and its goal of improving understanding of natural cloud structure, this study examines the role of fine-scale (sub-kilometer) vertical velocity fluctuations on the microphysical evolution and location of SCDDs within the observed mixed-phase, wintertime orographic clouds from one research flight in SNOWIE.
For the case examined, SCDDs developed in an elevated, postfrontal-layer cloud with cold cloud tops ( ∘C) and low number concentrations of both ice (less than 0.5 L−1) and cloud droplets (less than 30 cm−3). Regions of supercooled drizzle at flight level extended more than a kilometer along the mean wind direction and were first located at and below layers of semi-coherent vertical velocity fluctuations (SCVVFs) embedded within the cloud and subsequently below cloud top. The microphysical development of SCDDs in this environment is catalogued using size and mass distributions derived from in situ probe measurements. Regions corresponding to hydrometeor growth are determined from radar reflectivity profiles retrieved from an airborne W-band cloud radar. Analysis suggests that SCVVF layers are associated with local SCDD development in response to the kinematic perturbation pattern. This drizzle development and subsequent growth by collision–coalescence is inferred from vertical reflectivity enhancements (−20 dBZ km−1), with drizzle production confirmed by in situ measurements within one of these SCVVF layers. The SCDD production and growth occurs embedded within cloud over shallow (km or less) layers before transitioning to drizzle production at cloud top further downwind, indicating that wind shear and resultant vertical velocity fluctuations may act to enhance or speed up SCDD development compared to classic cloud top broadening mechanisms in orographic (or similarly sheared) cloud environment(s).
- Article
(18796 KB) - Full-text XML
- BibTeX
- EndNote


Over the last 40 years, there have been numerous field campaigns either directly or indirectly examining mixed-phase, orographic-layer clouds over the American Intermountain West (Hobbs, 1975; Cooper and Saunders, 1980; Heggli and Reynolds, 1985; Rasmussen et al., 1992; Ikeda et al., 2007; Rosenfeld et al., 2013). At cloud top temperatures between 0 and −20 ∘C, these clouds frequently contain extensive regions of supercooled liquid water (SLW), especially near cloud top, making such clouds a prime meteorological environment for aircraft icing (Hindman, 1986; Ashenden et al., 1996; Marwitz et al., 1997). In some instances, SLW mass may be distributed entirely across cloud droplets, i.e., those liquid hydrometeors that are relatively small and have not attained appreciable fall speeds, and taken to have diameters less than 50 µm for the purpose of this study. On the other hand, drizzle drops, with diameters 50 to 500 µm, have appreciable fall velocities (0 to 2 m s−1) relative to cloud droplets and can consequently grow rapidly via collision–coalescence in the presence of cloud droplets (Lamb and Verlinde, 2011). Supercooled drizzle drops (SCDDs) are of special concern in aircraft icing because of the collection and subsequent freezing of these drops on aircraft wings aft of deicing devices, such as pneumatic boots (Ashenden et al., 1996). This study aims to catalogue the effect of local, kilometer-scale kinematic perturbation patterns on the development and location of SCDDs for one such mixed-phase cloud system.
Recent climatologies (Rauber et al., 2000; Bernstein et al., 2007) describe SCDD development as occurring predominantly through collision–coalescence growth in supercooled clouds largely devoid of ice hydrometeors. Studies explicitly examining the microphysical development of SCDDs with in situ aircraft data confirmed the primacy of the collision–coalescence growth mechanism (Cober et al., 2001), as opposed to the “classical” mechanism – which sees ice hydrometeors melt as they fall through an embedded warm layer (T>0 ∘C) before subsequent supercooling as fully melted drizzle drops. Wintertime orographic-layer clouds are frequently too shallow and too cold (outside of cold air damming events on the east coast of the US) to support a warm nose (Rauber et al., 2000) – therefore, the climatologies suggest that collision–coalescence is the dominant SCDD development mechanism in the clouds of interest in this study.
Collision–coalescence growth is favored in clouds with low cloud droplet number concentrations. For clouds with similar condensate supply rates, those with fewer cloud droplets will more quickly produce droplets of larger diameter (D∼30–40 µm) that approach sizes with appreciable terminal fall velocities, subsequently stimulating further growth through collision–coalescence compared to clouds with more numerous droplets. For this reason, clouds formed in clean air masses (i.e., with lower numbers of cloud condensation nuclei, CCN) or in less vigorous updrafts (where saturation ratio remains nearer unity with fewer activated CCN) are kinetically favored for drizzle formation (Freud and Rosenfeld, 2012). In agreement, the conditions of limited CCN abundance and gradual ascent are linked to high frequency of SCDD observation (Rauber et al., 2000; Bernstein et al., 2007). Regions that see shallow clouds form from warm, moist air gradually lifted over an arctic cold front or orography frequently see SCDD formation that is faster and more extensive if the clouds form in clean, maritime air masses (Rasmussen et al., 2002). A region that has uplift mechanisms in both orography and surface frontal passage, as well as the required cloud level moisture supply, is the American Intermountain West (IMW) during the winter storm season.
The presence and amount of ice act as additional factors influencing SCDD development in mixed-phase orographic clouds. Ice-phase hydrometeors typically acquire mass more rapidly than liquid species, owing to both a greater diffusional vapor pressure gradient and increased individual linear growth rates due to crystal geometry and riming. This places an upper limit on active ice-nucleating particle (INP) and ice crystal number for SCDD formation, otherwise ice will more rapidly scavenge the available vapor and cloud water, inhibiting growth of cloud droplets to drizzle sizes (Rasmussen et al., 2002; Geresdi and Rasmussen, 2005). A byproduct is that SCDD observations are infrequent in clouds with cloud tops colder than −15 ∘C, with few observations of SCDD formation found in the literature, with cloud tops colder than −20 ∘C (Lawson et al. 2001; Korolev et al., 2002; Rosenfeld et al., 2013; Silber et al., 2019).
Collision–coalescence initiation and growth often depend on broadening mechanisms for the largest droplets to begin collection of smaller droplets in the population in all but the cleanest of clouds (Wood et al., 2018), and this is true regardless if clouds are supercooled. Steady condensational growth alone leads to a narrowing of the drop size distribution (DSD) around a large drop mode (D∼30–40 µm), such that DSD broadening mechanisms (e.g., turbulent or isobaric mixing and eddy hopping) are necessary to provide the differential fall speed conducive to collision–coalescence onset and subsequent rapid collective growth. Pobanz et al. (1994) found that when SCDDs formed in clouds with cloud droplet number concentrations of more than 100 cm−3, layers of cloud top shear were correlated with vertical location of drizzle development, presumably due to turbulent broadening or mixing. Shear-induced turbulent mixing, especially at cloud top, is thought to be responsible for relatively rapid DSD broadening (Grabowski and Abade, 2017). Any isobaric mixing of different temperature parcels near the cloud boundary (e.g., for clouds with a strong capping inversion) is expected to further accelerate this process. This is why the warm rain process is understood to start at or near cloud top, with drizzle mass principally increasing with cloud layer depth (Comstock et al., 2007).
Supersaturation history provides an analytical framework for understanding several mechanisms (e.g., vertical velocity fluctuations, turbulent eddy hopping, mixing events) that may be responsible for the rapid spectral broadening and subsequent collision–coalescence enhancement in warm stratiform clouds (Cooper, 1989; Politovitch and Cooper, 1988; Korolev and Mazin, 1993; Korolev, 1995). For instance, Korolev found that when modeled cloud parcels are subjected to repeated vertical velocity fluctuations, DSDs broaden and may even see a second small-diameter droplet mode develop from interstitial CCN activation (hereafter, secondary droplet activation). Turbulence and wave motions were both suggested as possible sources for these vertical velocity fluctuations, but the lack of parcel-following in situ measurements made validating these behaviors an observational challenge (Pobanz et al., 1994).
Between the orographic SLW case studies (Rauber and Grant, 1986; Rauber, 1992), SCDD climatologies (Rauber et al., 2000; Bernstein et al., 2007), mechanistic understandings of SCDD production (Rosenfeld et al., 2013), and exceptional cases (Korolev and Isaac, 2000; Pobanz et al., 1994), a clear picture of SCDD formation develops: clouds formed in gradual updrafts within low CCN and INP populations are most likely to produce SCDD. The frequency, spatial extent, and thermodynamic extremity of SCDD production is a function of CCN and INP abundance (Rosenfeld et al., 2013). Wind shear and dynamic instability appear to lead to SCDD development in clouds with exceptionally high CCN concentrations given low enough ice concentrations (Korolev and Isaac, 2000; Pobanz et al., 1994). Mixed-phase clouds throughout the western US in which the phase partitioning is mostly liquid are common even well away from the coast (Hindman, 1986). Such clouds must contain low concentrations of cloud droplets and ice to develop SCDDs (Saleeby et al., 2011). Where encountered in orographic environments, these supercooled, relatively clean clouds are expected to encounter vertical and turbulent motions at both broadscales and fine scales (Houze and Medina, 2005).
This study examines an individual case from a field campaign located in the IMW in which SCDDs developed in a winter orographic cloud system despite cold cloud tops ( ∘C), which are typically associated with more active ice nucleation and more abundant natural ice (DeMott et al., 2010). Persistently low droplet number concentrations (less than 50 cm−3) and frequent SCDD observations from about half of the cases throughout the field campaign (Tessendorf et al., 2018) inspired this analysis and are consistent with the climatological maxima of wintertime SCDD frequency that stretches from the coastal barrier mountains into Idaho (Bernstein et al., 2007). The analysis focuses on the spatial kinematic patterns and their effect on the liquid-phase precipitation development in these mixed-phase clouds.
The Seeded and Natural Orographic Wintertime clouds – the Idaho Experiment (SNOWIE) was designed to observe and analyze the evolving wintertime orographic cloud structure in a series of prescribed airborne cloud-seeding experiments (Tessendorf et al., 2018). As part of this process, it was necessary to establish the evolution of the natural cloud structure and microphysics as a baseline for evaluating cloud-seeding effects. Separately, the extensive dataset and state-of-the-art measurements were expected to yield new insights toward the natural cloud structure, microphysical evolution, and precipitation patterns of mixed-phase winter orographic clouds. Understanding how fine-scale (km or less) dynamical processes impact cloud microphysical development and spatial distribution, amount, and phase of observed precipitation in such clouds is at the forefront of the remote sensing and cloud microphysics observational literature (e.g., Houze and Medina, 2005) and further provides valuable insight to cloud modeling and microphysical parameterizations.
To characterize and describe the development of precipitation hydrometeors (e.g., SCDDs) at flight level requires direct measurements of cloud hydrometeor spectra, thermodynamic and dynamic conditions (which govern the development of the spectra), and characterization of the spatial variability of each of these variables. Remote profiling radar, in situ cloud probes, temperature and humidity sensors, and gust probes, on board the University of Wyoming King Air (UWKA) research aircraft, catalogued the evolving cloud structure and precipitation patterns for repeated fixed flight legs oriented along the mean wind direction through cloud (Fig. 1), at as low an altitude as practical. UWKA legs, anchored above the Packer John (PJ; see Fig. 1) ground site, recurrently sampled coincident spatial cross sections through the evolving orographic cloud structure, often between the −10 to −15 ∘C level. Flight legs (blue line in Fig. 1) were generally no longer than 100 km, with the western end located over the valley and the eastern end extending over the Sawtooth Range. Soundings launched at Crouch, ID (KCRH, Fig. 1), before and during each flight were used to characterize bulk thermodynamic and dynamic conditions.
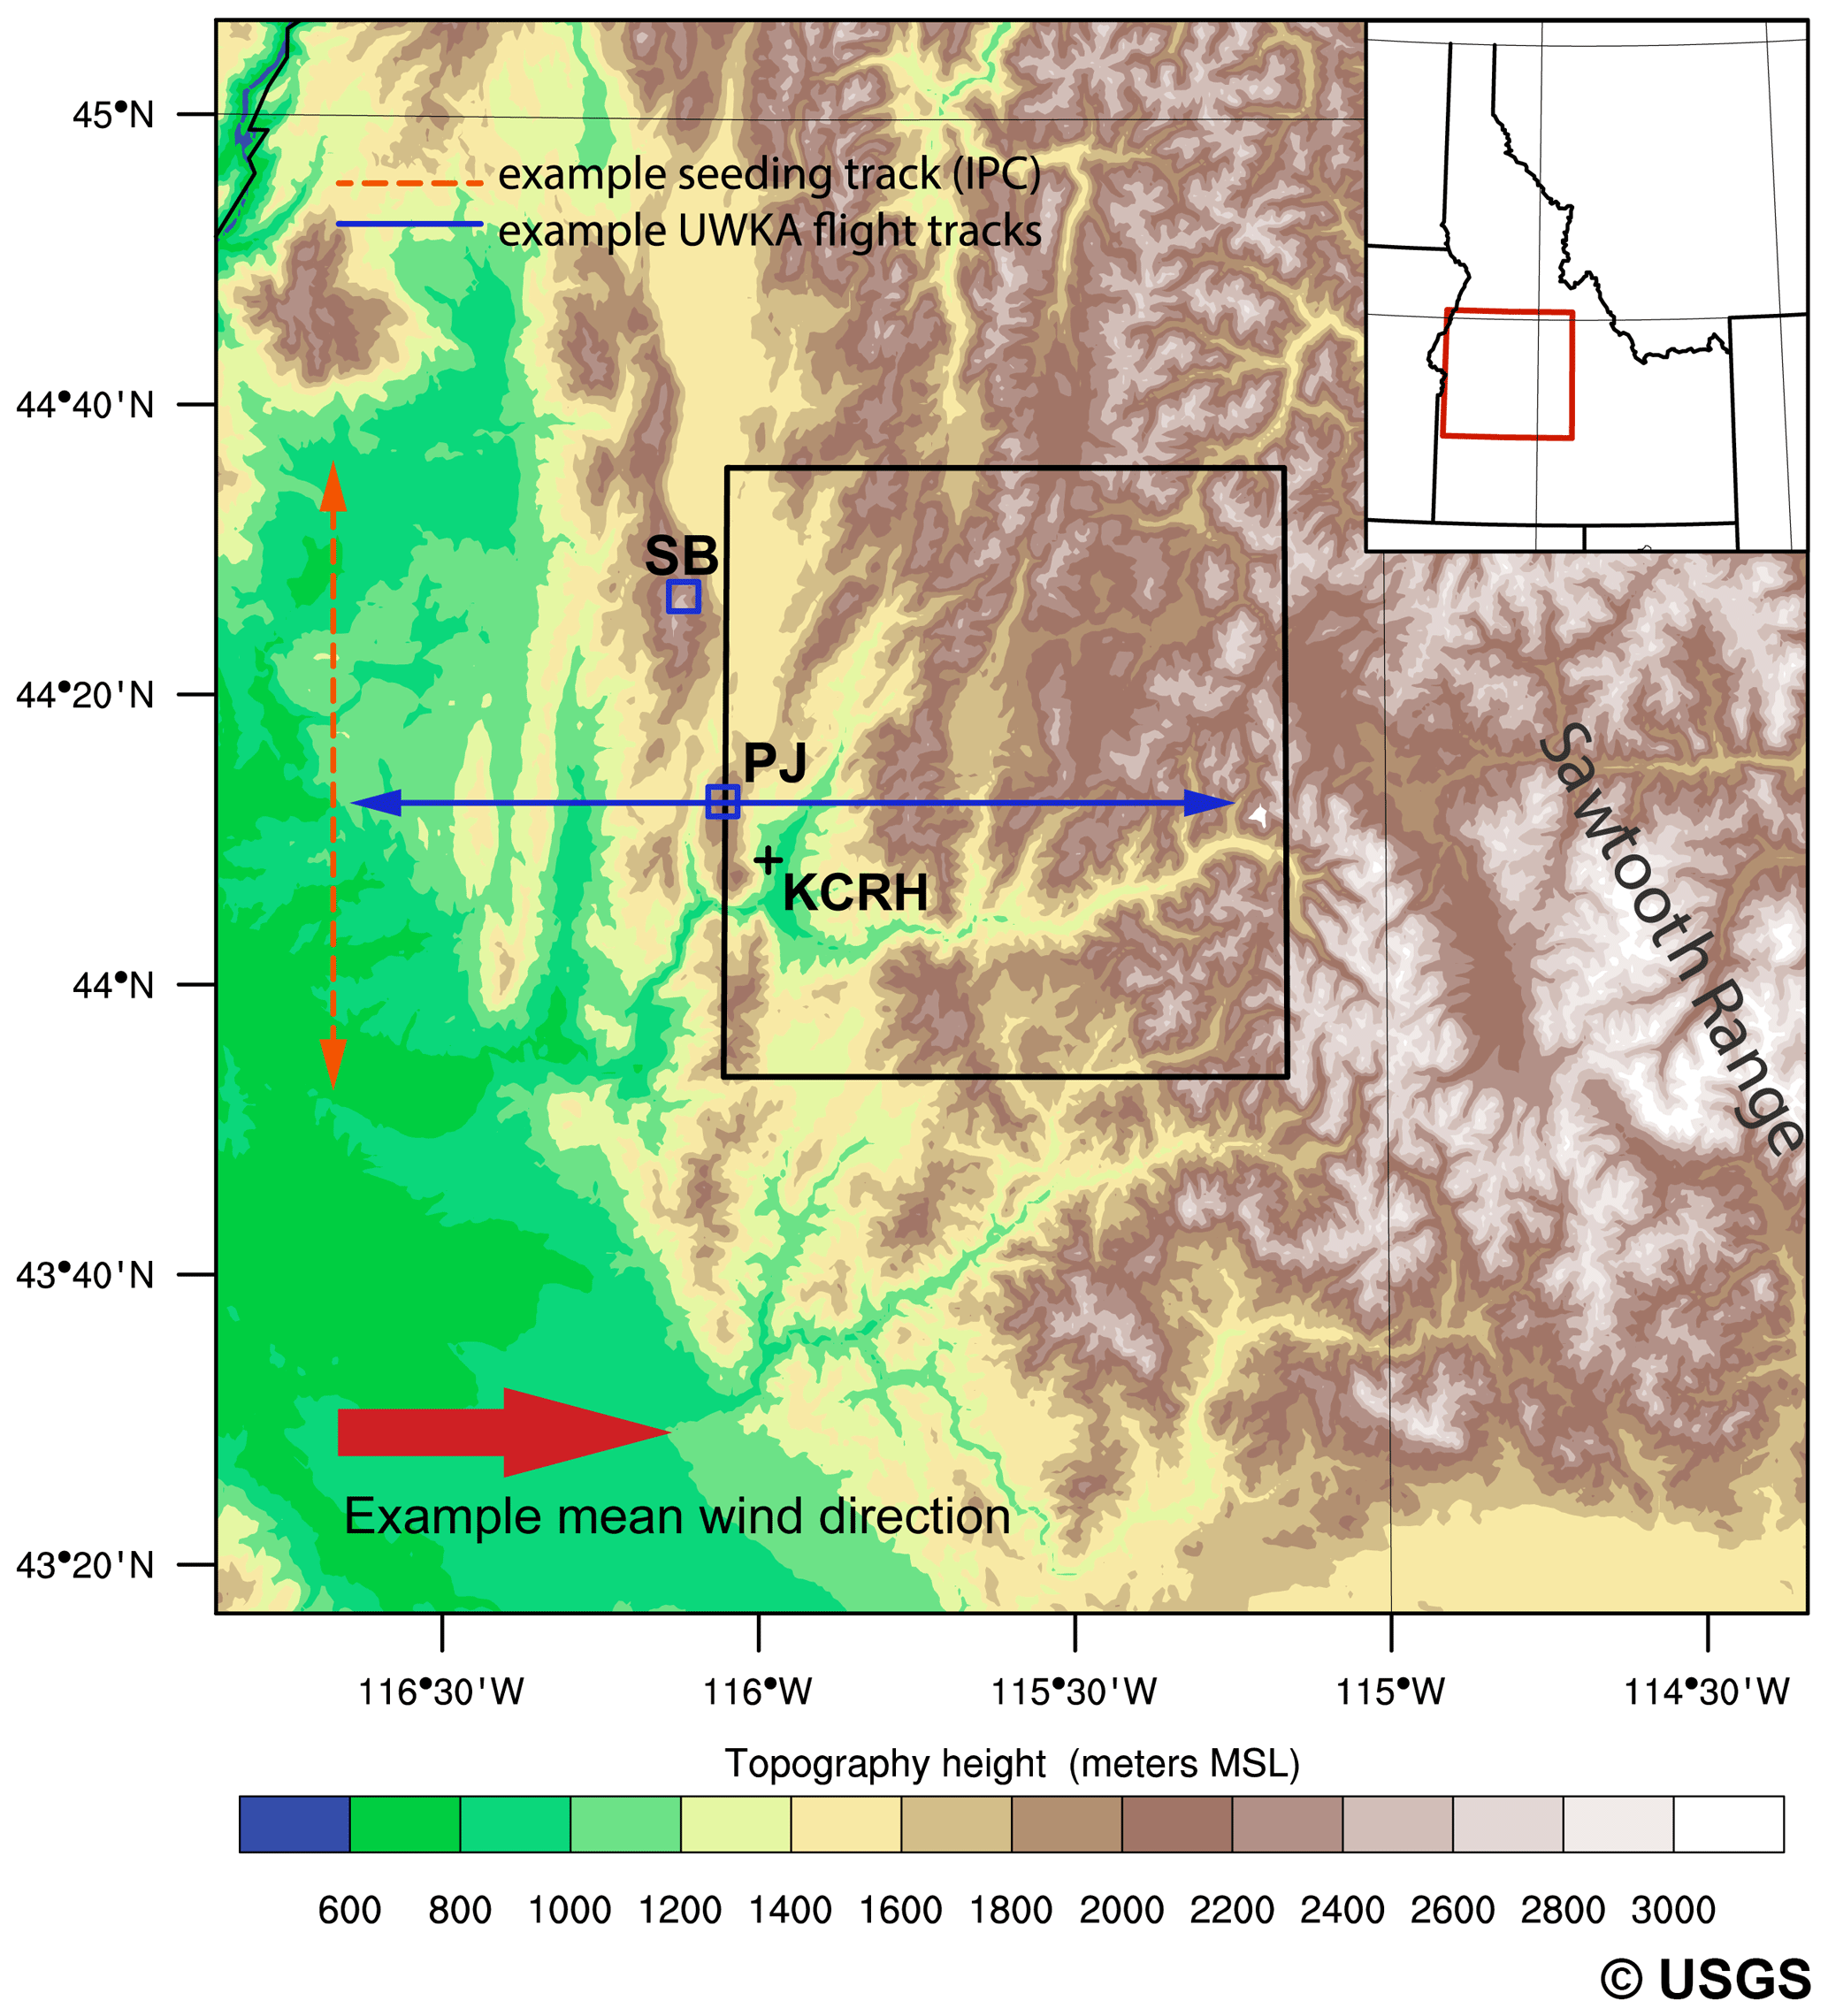
Figure 1SNOWIE experimental setup, showing a plan view schematic for an example case of westerly winds. Blue squares (□) correspond to the Snowbank (SB) and Packer John (PJ) ground sites and the plus sign (+) indicates the Crouch (KCRH) sounding launch site. The rendered topography domain is the same as in the orange inset in the upper right-hand corner of the figure. The black bounding box indicates the target seeding domain.
Measurements from the W-Band Wyoming Cloud Radar (WCR) documented the orographic cloud structure above and below flight level and provided context for the in situ cloud microphysics measurements (as in Vali et al., 1998; Wang and Geerts, 2003; Wang et al., 2012). Previous studies demonstrated that the WCR resolves fine-scale details of orographic clouds (∼30 m spatial resolution), observing aspects of their dynamical and microphysical structure technologically impossible in previous decades (Aikins et al., 2016). The WCR is sensitive to cloud droplets and drizzle in the Rayleigh regime, with Mie effects starting at around 600 µm and reflectivity increasing monotonically with diameter up to millimetric sizes (D>0.95 mm). Radar reflectivity for volumes containing even large drizzle drops was therefore dominated by the contribution of the largest drops, and throughout SNOWIE no drizzle drops larger than 0.5 mm diameter were observed, such that Mie effects were nonexistent for purely liquid volumes. Doppler velocity measurements from the WCR captured the near-vertical, reflectivity-weighted motions of the distributed hydrometeor targets. In the data presented here, no attempt has been made to separate hydrometeor terminal fall velocity with vertical air motions. Since the antennas point nearly vertically, the influence of horizontal wind in the Doppler measurements is negligible for straight and level flight.
In situ probes on the UWKA-measured cloud hydrometeors with diameters from a few micrometers to several millimeters (Table 1). Two probe types were used to collect these data – a forward-scattering cloud probe (i.e., the Cloud Droplet Probe, CDP), and two optical array probes (OAPs) for larger hydrometeors. The CDP (Lance et al., 2010) provided 5 Hz cloud droplet (1 to 50 µm) size spectra in bins 1 to 2 µm wide. The CDP rms accuracy of mean droplet diameter of 0.7 µm was determined after the campaign using the University of Wyoming droplet generator (Faber et al., 2018).
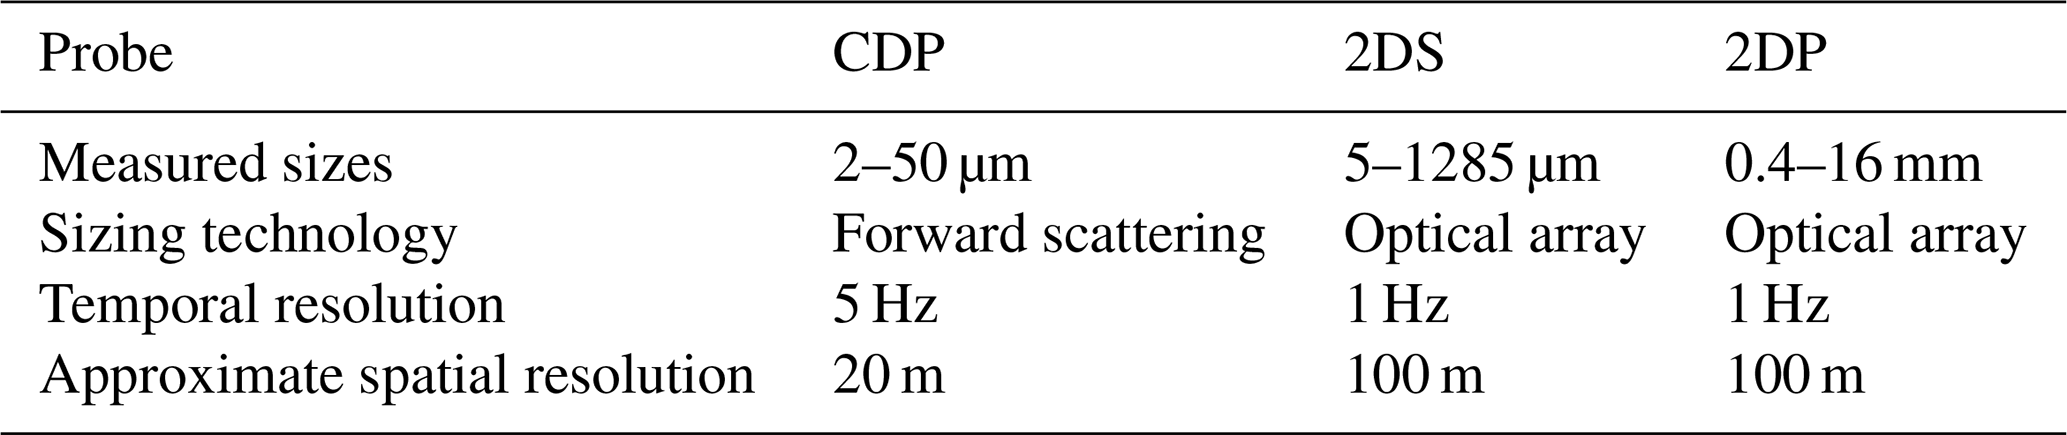
The OAPs image larger hydrometeors ( µm) as particles pass through an illuminated sample volume and shadow individual members of a linear photodiode array. The 2D stereo probe (2DS; Lawson et al., 2006) imaged particles at a 10 µm resolution across a 1.28 mm diode array, accurately resolving the hydrometeor spectra for particles mm. The 2D precipitation probe (2DP) measured hydrometeors larger than a millimeter, with an image resolution of 200 µm. The data from the OAPs were processed using the University of Illinois OAP Processing Software (Jackson et al., 2014; Finlon et al., 2016), to perform standard image rejection and dimension corrections. Image-derived size and particle timing information and a sample volume estimate following Heymsfield and Parrish (1978) were used to produce particle size distributions. Shattering artifacts were avoided using anti-shattering tips on the 2DS and by filtering of particles with a short, static inter-arrival time threshold in the software processing.
From these 1 Hz particle size spectra, several integrated water content metrics were calculated to estimate the mass distribution within certain drop size categories. The total liquid water content – i.e., across the entire measured liquid hydrometeor size spectrum – was integrated from the combined CDP and 2DS size spectra and is hereafter referred to as LWCtot. The cloud water content (CWC) and drizzle water content (DWC) metrics contain the mass from the 2 to 50 µm and 50 µm to 1 mm parts of the cloud hydrometeor spectrum, respectively, and hence sum to LWCtot. The calculated LWCtot was compared to the bulk estimate from the Rosemount icing probe, which is sensitive to all sizes of SLW drops. A comparison performed over two flight legs validated these estimation methods. The only remarkable disagreement between the metrics came for LWC values of the Rosemount greater than 0.4 g m−3, where the integrated LWCtot was larger compared to the Rosemount icing probe measurement. This may be an overestimation of LWCtot related to mis-sizing of drizzle drops that are near the edge of the depth-of-field in the 2DS and appear as hollow images. Conversely, this may also be due to an underestimation from the Rosemount probe due to splashing of SCDDs that are not completely captured by the probe's icing rod. Regardless, the error is almost certainly associated with the liquid mass of SCDDs and the Rosemount and integrated LWCtot estimates provide a lower and upper bound, respectively.
The following results and analysis produced from the WCR profiles, in situ bulk probes, and cloud microphysics datasets from the first UWKA flight in SNOWIE highlight the role of sub-kilometer vertical velocity fluctuations in the spatiotemporal distribution of SCDDs and the inferred cloud microphysical response.
The results presented are from the period of 02:45 to 04:05 UTC (legs 1, 2, and 5) during the first flight of the field campaign on 8 January 2017. Two distinct layer clouds developed in the wake of a precipitating frontal cloud system. Of these two clouds, the elevated cellular cloud layer contained both low background number concentrations of ice and cloud droplets and embedded kilometer or longer regions of SCDDs that formed in a larger pattern of orographic lift.
3.1 Synoptic and thermodynamic context
The UWKA research flight followed the passage of a deep snow band associated with a weak jet streak in the 500 mb wind field. The deep, saturated atmosphere present in the upstream sounding during the heavily precipitating period roughly 4 h prior to the start of leg 1 (Fig. 2a) experienced mid-tropospheric drying and veering and strengthening of the winds above 8 km m.s.l. This led to lowered cloud tops and a pronounced dry slot from 7 to 9 km in the preflight sounding just 3 h later (Fig. 2b). This dry layer contained thin layers of expected dynamic instabilities – defined by bulk Richardson number from 0 to 0.5 (Fig. 2b; blue shading). The layer below, between 4 and 7 km, saw several vertical humidity variations accompanied by evaporational cooling of the radiosonde upon exiting cloud layer tops, resembling conditional instabilities (orange shading). These layers were not expected to correspond to real convective motions in cloud.

Figure 2Thermodynamic and dynamic profiles from radiosondes launched at Crouch, ID (KCRH; Fig. 1). Shaded levels correspond to relaxed critical values of the bulk Richardson number, Ribulk<0.5, after 10 pt (∼50 m) vertical smoothing of the field. Orange shading indicates negative bulk Richardson values – corresponding to static instability – and blue corresponds to purely dynamic instability, . Relative times (T±) reference the 02:45 UTC leg 1 start time.
By the start of the first flight leg at 02:45 UTC, a shallow orographic cloud layer persisted over the study region on the western end of the flight track, with cloud tops around 4 km m.s.l. (Fig. 3a) – matching the top of the lower saturated layer in the preflight sounding (Fig. 2b). This orographic cloud layer was capped on the eastern end by a layer of broken cellular cloud structures roughly 1 to 3 km wide – hereafter the elevated cellular layer – resembling, at times, either coherent Kelvin–Helmholtz (K-H) billows or incoherent generating cells. This elevated cellular layer was consistently strongest in terms of layer depth and highest radar reflectivities over the highest terrain at the eastern end of the leg.
The final upstream sounding, launched 1 h after the start of leg 1 (Fig. 2c), indicated a deeper saturated layer through 6.5 km and further strengthening and veering of the wind above, with more vertically homogeneous, near-zonal winds between 3 and 6 km. This shear profile resulted in several layers of possible dynamic instability within 500 m, both above and below the top of the saturated layer, and matched well with the 6 to 6.5 km cloud tops observed with the WCR during flight legs 4 and 5 (Fig. 3d and e).
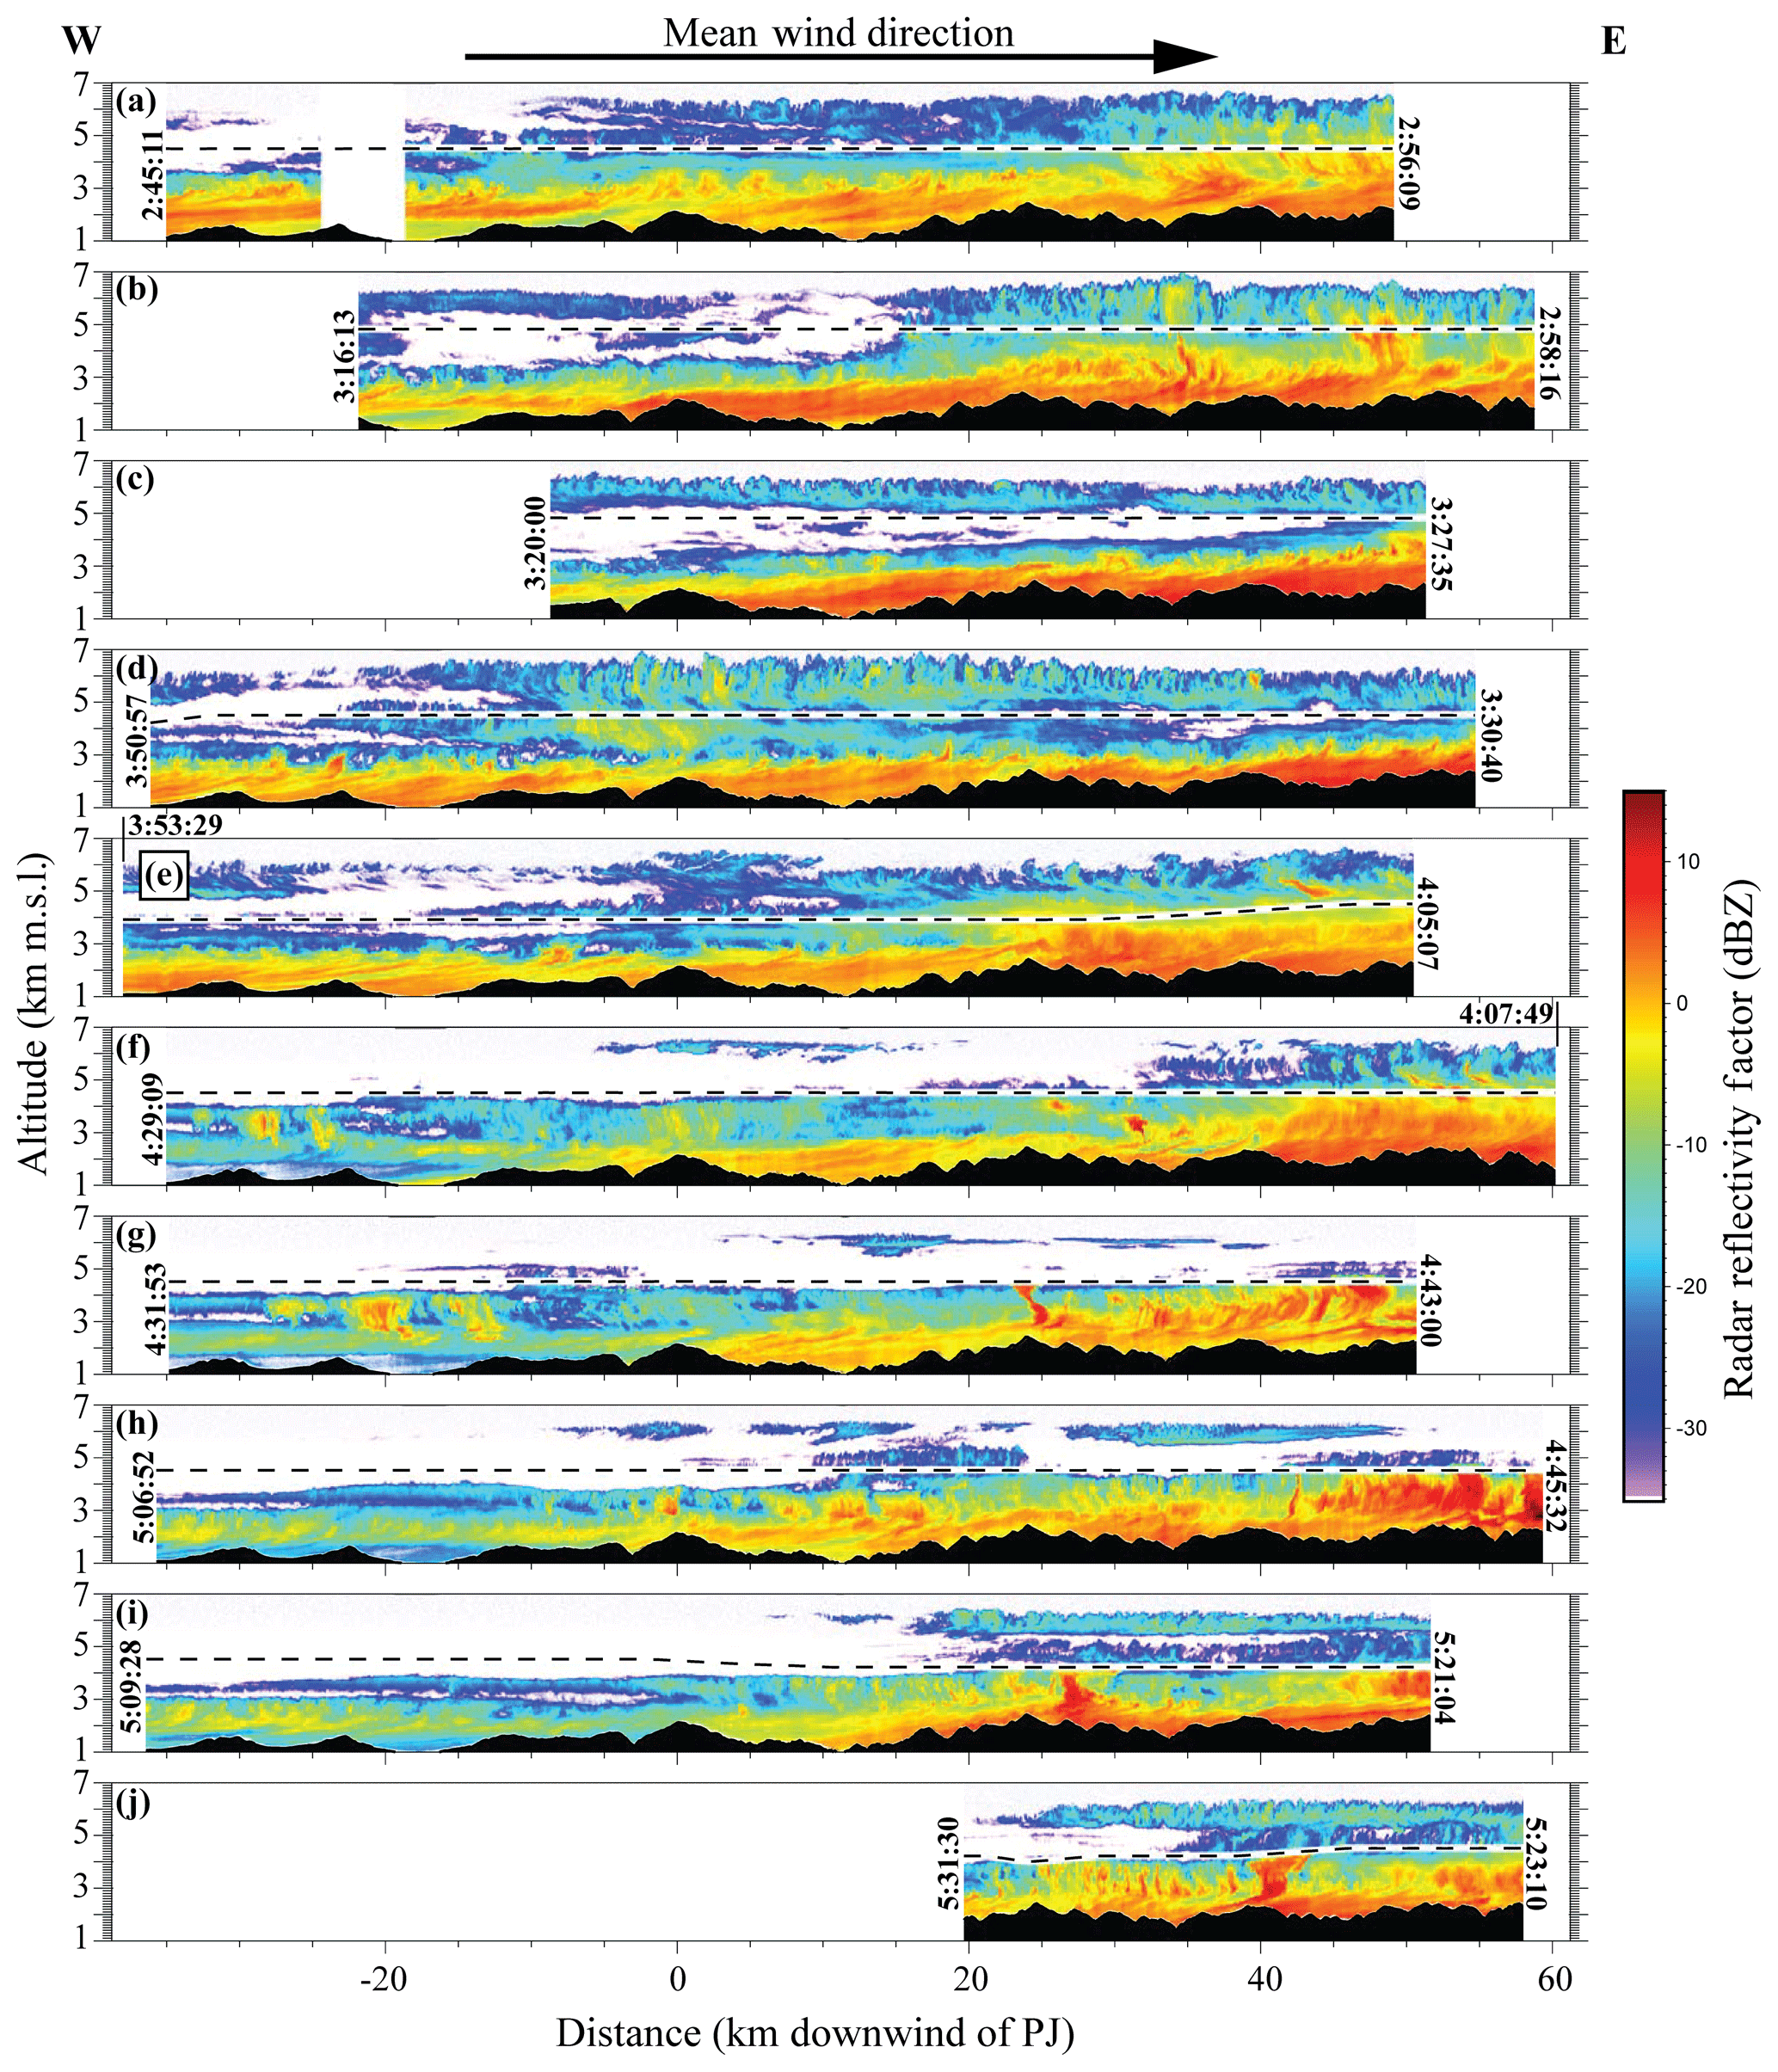
Figure 3Terrain-referenced W-band radar reflectivity cross sections for all 10 flight legs. All distances are relative to Packer John Mountain, with positive (negative) values downwind (upwind). Leg start and end times are in UTC, with (a) through (j) corresponding to legs 1 through 10, respectively.
Variations in humidity and wind, superimposed on the background zonal winds and low-level orographic clouds, appeared responsible for an elevated cloud layer that was at times unstable and variable in vertical location and depth (Fig. 2b). Additionally, a surface inversion and attendant low-level static stability was present in all the upstream soundings around the time of the flight (Fig. 2a, b and c). As a result, calculated bulk Froude numbers were consistent with blocked flow below 2 km m.s.l., matching the overall low-level static stability pattern that was present through much of the field campaign (Tessendorf et al., 2018). The stability from this surface inversion may have helped to decouple the surface air mass from the free troposphere above the Sawtooth Range barrier.
3.2 General cloud structure and vertical motions
There were several differences between the orographic cloud layer (4.5 km m.s.l. and below) and the cellular layer above. The orographic cloud layer persisted over the nearest 1 to 2 km above the terrain, with cloud tops that rose slightly (no more than 500 m) from west to east with the average height of the topography beneath (e.g., Fig. 3a). The cellular layer, however, was transient – discrete layers of cells advected into the target area at varying altitudes. Some of these layers appeared coupled to the lower orographic cloud layer (as in legs 1, 2, 4, and 5), while others appeared totally separate (as in legs 3, 9, and 10). This behavior is consistent with the large vertical variations in wind shear and humidity between the three soundings in this layer (Fig. 2), including several dynamically unstable layers. Consistent with this, several of the elevated layers appeared to contain overturning (or breaking) cells in the reflectivity profiles, for example, within the elevated cellular layer of leg 4 from 10 to 15 km downwind of PJ (Fig. 3d).
Across the entire research flight, the radar reflectivity within the upper cloud layer was less than −5 dBZ, except for discrete, individual fall streaks. This behavior suggests mostly liquid cloud species in the elevated layer, confirmed by the 99th percentile of precipitation-sized ice number (integrated from the 2DP probe) for each of the first four legs remaining below 0.1 L−1 and being only marginally higher for leg 5, with a 99th percentile value of 0.3 L−1. Some of the higher-reflectivity fall streaks, especially towards the end of the flight, may have corresponded to seeding lines (French et al., 2018; Tessendorf et al., 2018; Hatt, 2019) after the seeding period started at the end of leg 2 but are otherwise beyond the scope of this study. The radar reflectivity within the lower orographic cloud layer, by comparison, was greater than in the cellular layer above. Large regions within 1 km of the surface contained reflectivity greater than 5 dBZ, suggesting the presence of ice below the orographic cloud top. This conjecture is consistent with a significant reduction of about 4 m s−1 in downward Doppler velocity in the lowest ∼1 km above the surface (Fig. 4). This reduction often occurred at a level corresponding to an increase in the radar reflectivity. The inferred relative abundance of ice in this shallow orographic layer may be due to more abundant aerosol (and INP) presumed to reside below the strong surface inversion (Fig. 2b) or from secondary ice multiplication in the warm ( ∘C) temperatures in the lower layer, but no direct in situ measurements were available in cloud below flight level.
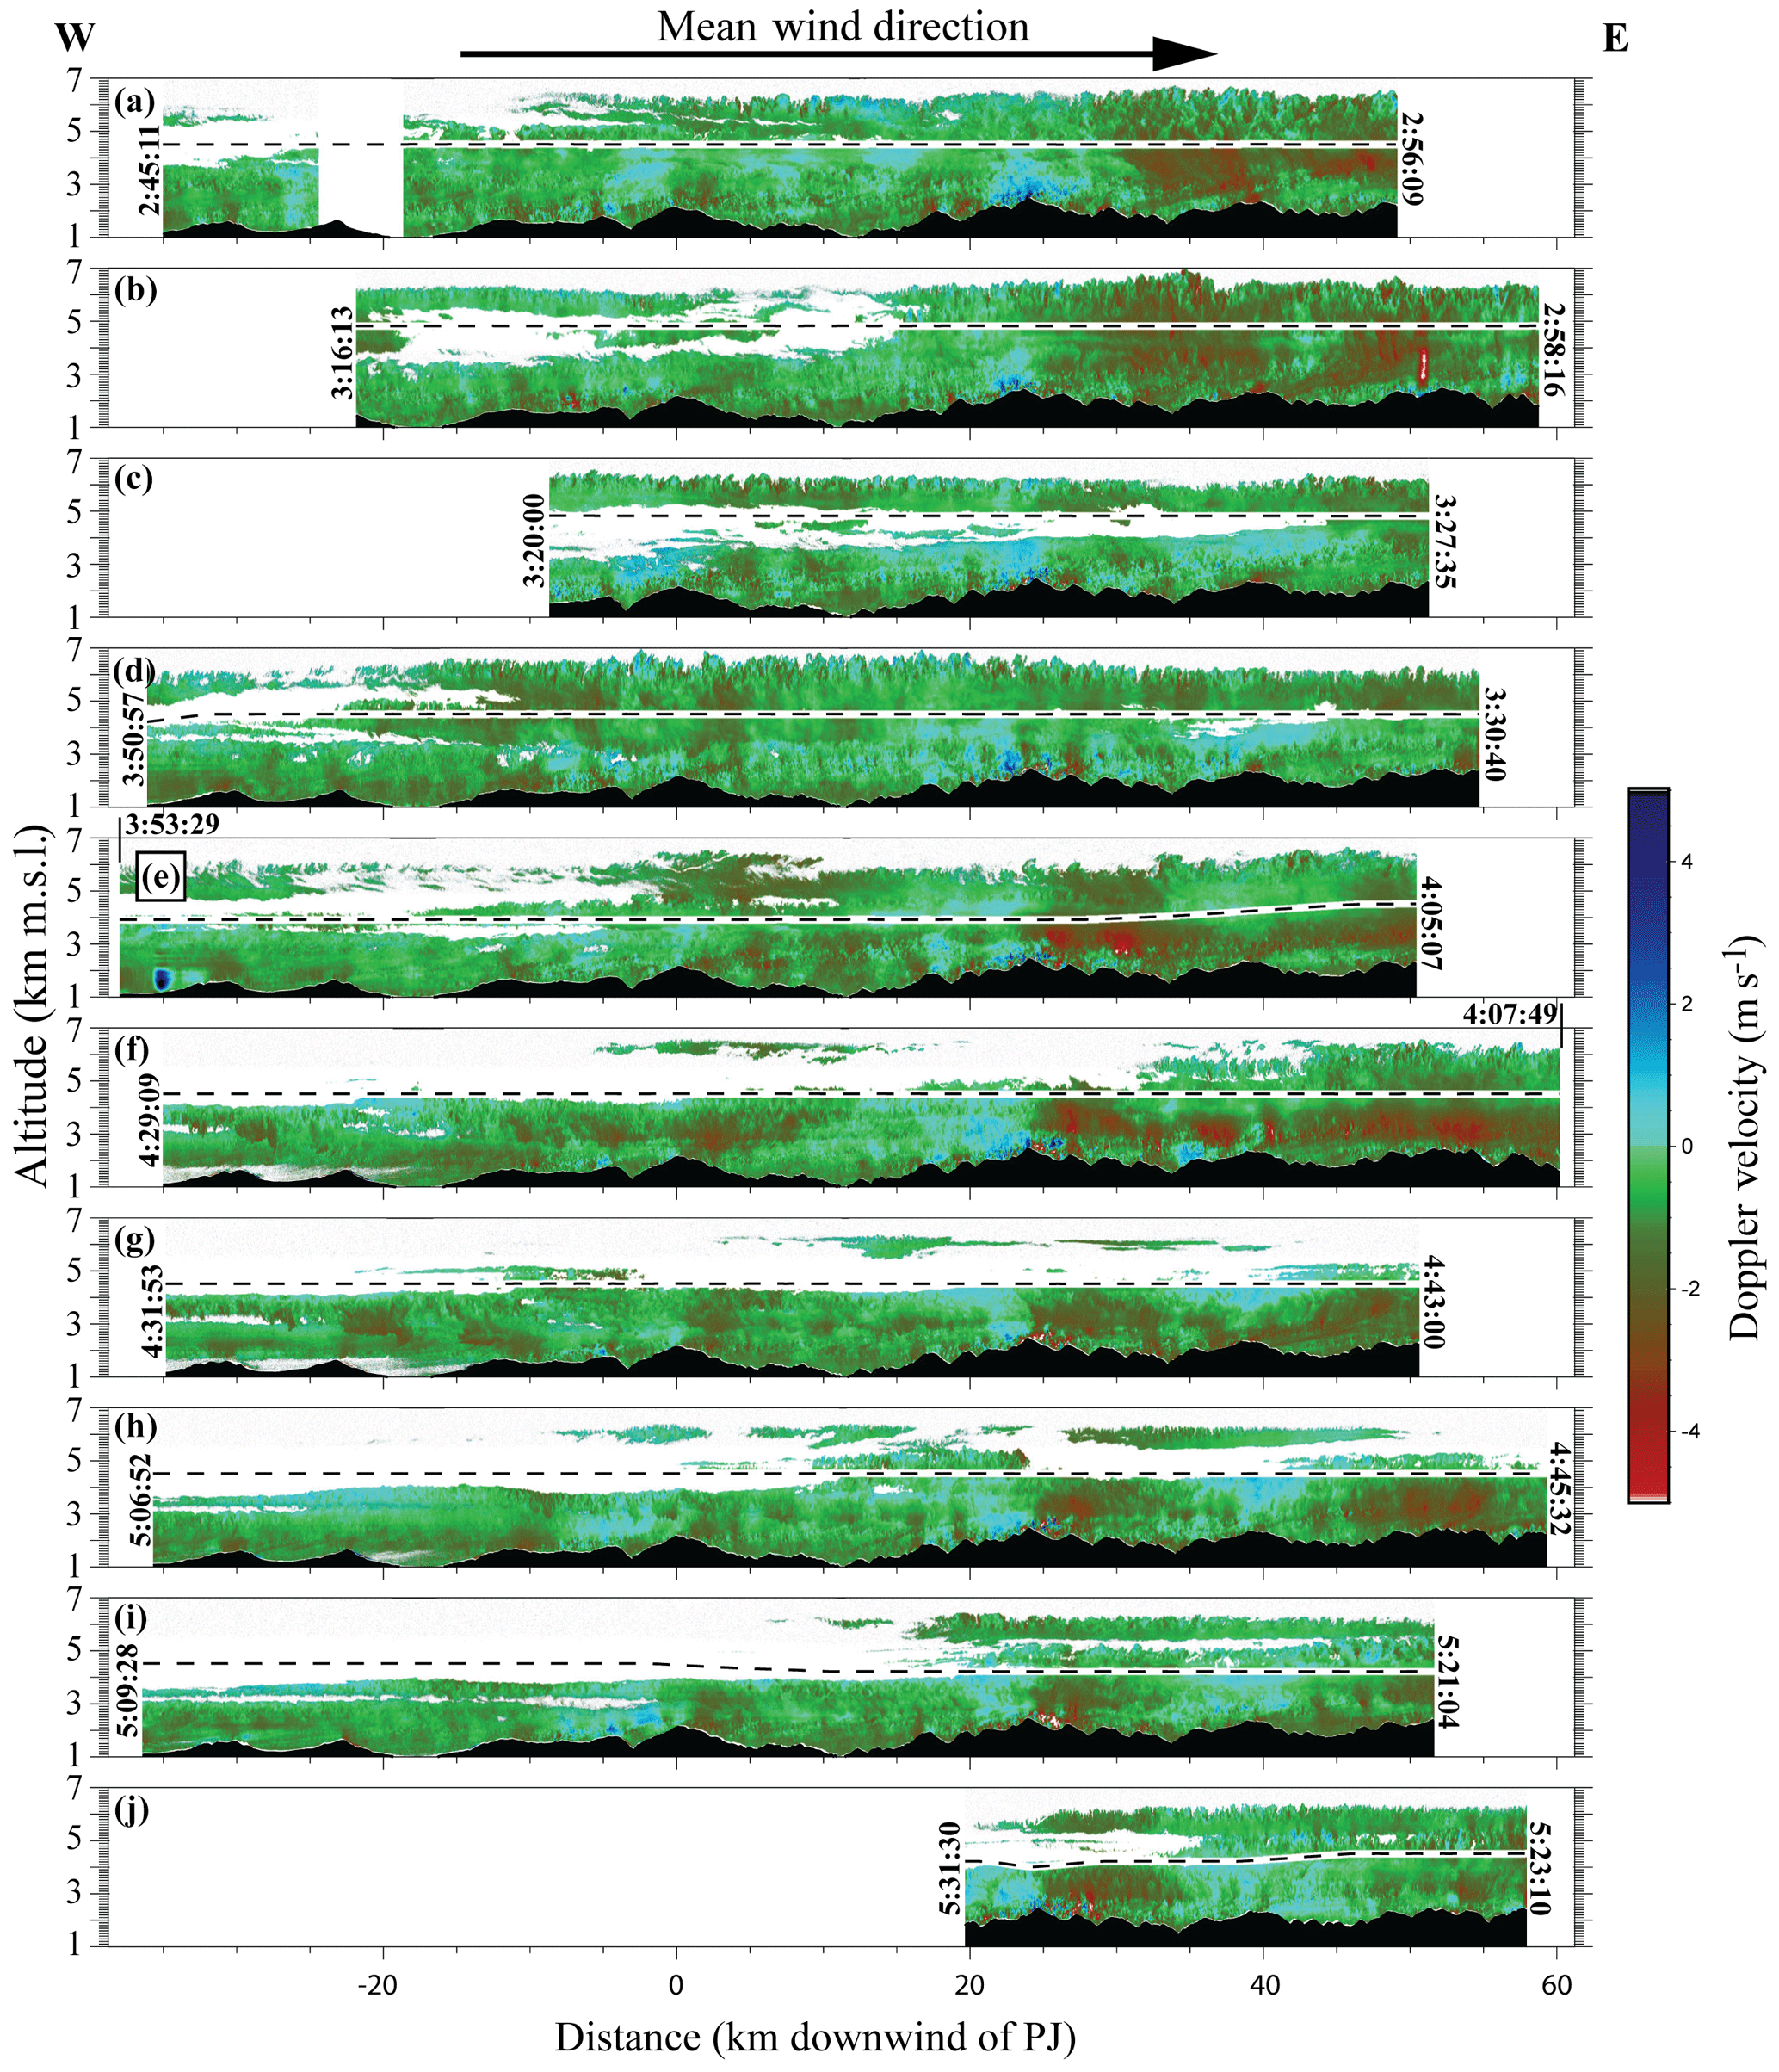
Figure 4Terrain-referenced W-band Doppler velocity spatiotemporal cross sections for all 10 flight legs. All distances are relative to Packer John Mountain, with positive (negative) values downwind (upwind). Positive values of Doppler velocity indicate upward motion. Leg start and end times are in UTC, with (a) through (j) corresponding to legs 1 through 10, respectively.
Mean reflectivity-weighted, near-vertical Doppler velocities (hereafter, hydrometeor vertical velocities or Doppler velocities) were available from the WCR to quantify cloud vertical motions (i.e., the convolution of vertical air motions and reflectivity-weighted population terminal fall speed). Unfortunately, complex dynamics at sub-kilometer scales and hydrometeor size and phase inhomogeneity convoluted the observed Doppler velocities, making assumptions about a constant hydrometeor fall speed specious. In fact, the spread of fall speeds associated with observed hydrometeor size distributions were greater than the spread of air motions observed in the dynamic structures of focus (<1.5 m s−1 amplitude, where sampled at flight level).
Despite this complexity, there were several obvious and consistent trends in the observed Doppler velocities: nearly all legs showed a distinct terrain-induced vertical velocity couplet centered roughly 24 km downwind of Packer John and directly above a pronounced north–south ridge, oriented perpendicular to the mean wind and flight direction (Fig. 4). This couplet consisted of up to 2 m s−1 upward Doppler velocities over the upwind slope, immediately followed by as much as 4 m s−1 downward Doppler velocities on the downwind side, and frequently extended up to cloud top (as in leg 5). Despite the wave-like signatures present in the reflectivity profiles, Doppler velocity couplets away from flight level and phase relationships at flight level between perturbation kinematic and thermodynamic quantities (not shown) were inconsistent with K-H waves. For this reason, care was taken separately in (1) quantifying the effects of spatial variations in hydrometeor fall speed and (2) adopting the label of semi-coherent vertical velocity fluctuations (SCVVFs) to distinguish layers of these regularly spaced, vertically oriented velocity perturbations from the more isotropic turbulent motions found elsewhere. Probable meteorological sources for SCVVFs in this environment include K-H waves, shear-driven mechanical overturning (Houze and Medina, 2005), and shallow convective overturning with some regular triggering mechanism; however, the actual sources did not seem to uniquely affect the microphysics and therefore remain undistinguished. What follows are descriptions of how SCVVFs affected the evolution and spatial distribution of precipitation in the elevated cellular cloud layer, significant for where drizzle development deviated from the expectation of starting at cloud top and collecting through the depth of SLW cloud.
3.3 Comparisons between drizzling legs (1, 2, and 5)
The three flight legs of interest, 1, 2, and 5 (Table 2), were flown at altitudes ranging from 3.9 to 4.5 km m.s.l. During each of the legs the UWKA encountered kilometer-or-longer stretches of SCDD measured at flight level within the elevated cellular cloud layer. Significantly larger drops were observed on the first two legs compared to leg 5 despite similar cloud water contents across all three. The regions containing SCDDs were all located at or downwind of Packer John Mountain (PJ; the start of prominent terrain features along this transect), where reflectivities and cloud layer thicknesses were consistently near the leg maxima. Above the windward slope of the Sawtooth Range, from 10 to 25 km downwind of PJ, was a broad region of ascent observed on most legs (0 to 1 m s−1 hydrometeor upward velocities) which contributed to the relatively high reflectivities and cloud layer thicknesses compared to cloud further upwind (Fig. 4). From 10 to 60 km downwind of PJ, where SCDDs were encountered on all three legs, flight level vertical velocities varied from −0.5 to 2 m s−1, with perturbation magnitudes on legs 1 and 2 of up to 0.6 m s−1 and less than 0.2 m s−1 for leg 5 (Table 2). The flight level temperatures on these legs ranged from −16 ∘C on legs 2 and 5 to −11 ∘C for the lowest altitude leg 5.
Table 2Flight level cloud characterization information between legs 1, 2, and 5.
Cloud water content (CWC) measured at flight level was similar for these drizzling sections of cloud across all three flight legs, with maximum values approaching 0.6 g m−3 in legs 1 and 5. Slightly lower maximum CWCs were measured in the drizzling sections of leg 2, i.e., only as high as 0.4 g m−3, possibly reduced due to scavenging and removal of cloud water by drizzle in the time between legs 1 and 2 (Table 2). Cloud droplet number concentration measured at flight level during all three legs never exceeded 35 cm−3 and decreased to values less than 5 cm−3 within portions of cloud in which there appeared significant SCDD sedimentation from above. Within these plumes of SCDDs, which appeared only in flight legs 1 and 2, DWC measured at flight level was at times as high as 1 g m−3. Additionally, within SCDD plumes, the mean volume diameter of the DSD approached 80 µm (Table 2). Unlike the first two legs, the SCDDs sampled in leg 5 were much smaller, and the DSD mean volume diameter did not exceed 45 µm.
The primary microphysical differences for these three legs were the smaller SCDDs in leg 5 relative to legs 1 and 2. The following section provides an analysis of where SCVVFs may have acted to enhance hydrometeor growth and the subsequent evolution of cloud downwind.
3.4 Semi-coherent vertical velocity fluctuations
The primary structural difference within the elevated cellular cloud layer across these three legs, which appeared responsible for cloud microphysical characteristics and SCDD development, were the presence and vertical location of layers of SCVVFs. A train of these velocity fluctuations were sampled at flight level during leg 1 from 24 to 35 km downwind of PJ (Fig. 5). The SCVVFs appeared as a series of ±0.5 m s−1 vertical velocity perturbations with a wavelength of roughly 1 to 2 km (Fig. 5b). The vertical velocity fluctuations drove both a thermodynamic (Fig. 5e) and microphysical response (Fig. 5c and d), which saw positive perturbation vertical velocities paired with lower temperatures, higher cloud droplet number, and lower CWC relative to the mean trend. Appreciable drizzle mass was only present in the perturbation downdrafts (Fig. 5c, pink curve).

Figure 5Detailed radar and in situ measurements for the drizzling portion of leg 1. Spatiotemporal vertical cross sections of radar reflectivity are shown in (a). Panels (b) through (e) are derived from flight-level in situ measurements and show (b) vertical air velocity (w), computed perturbation vertical velocity (w′), and the variance of the perturbation vertical velocity (); (c) liquid water content derived from cloud droplets (CWC), drizzle drops (DWC), and both combined (LWCtot); (d) cloud droplet number concentration (Ncld) and DSD mean volume diameter (MVD) for all hydrometeors with D<1.2 mm; and (e) temperature (T), dew point (TD), and relative humidity (RH). The CFAD bounds shown in (a) correspond to the columns for Fig. 8a–c. Perturbation vertical velocities in (b) were calculated by subtracting a boxcar-smoothed (over 10 s or roughly 1 km) vertical velocity field from the measured vertical velocity and represent the sub-kilometer vertical velocity perturbations.
From size distributions averaged across individual perturbation updrafts and downdrafts (Fig. 6), it is apparent that secondary droplet activation was primarily responsible for the increased droplet number concentration within perturbation updrafts. DSDs corresponding to perturbation updrafts show that much of the increased droplet number concentration can be explained by an increased number of 6 to 8 µm droplets, which are an order of magnitude more abundant than within the perturbation downdrafts and nearly as abundant as the number of droplets in the primary mode from 25 to 35 µm. Given that these legs were flown at a constant altitude, the secondary droplet activation in perturbation updrafts, paired with a reduction in the CWC, may indicate kinetically limited parcel behavior and is examined in the discussion. The perturbation downdrafts contained increased DWC, larger droplets, and lower total number concentration relative to perturbation updrafts. The decreased number and increased DWC are likely explained by scavenging by the larger drops, which were as large as 150 µm (Fig. 6), and indicate an active collision–coalescence process. Furthermore, collision–coalescence likely began very near or just above flight level, as the reflectivity values between −25 and −15 dBZ within the nearest 400 m above flight level are indicative of populations of cloud droplets with very few, if any, drizzle drops (Fig. 5a).
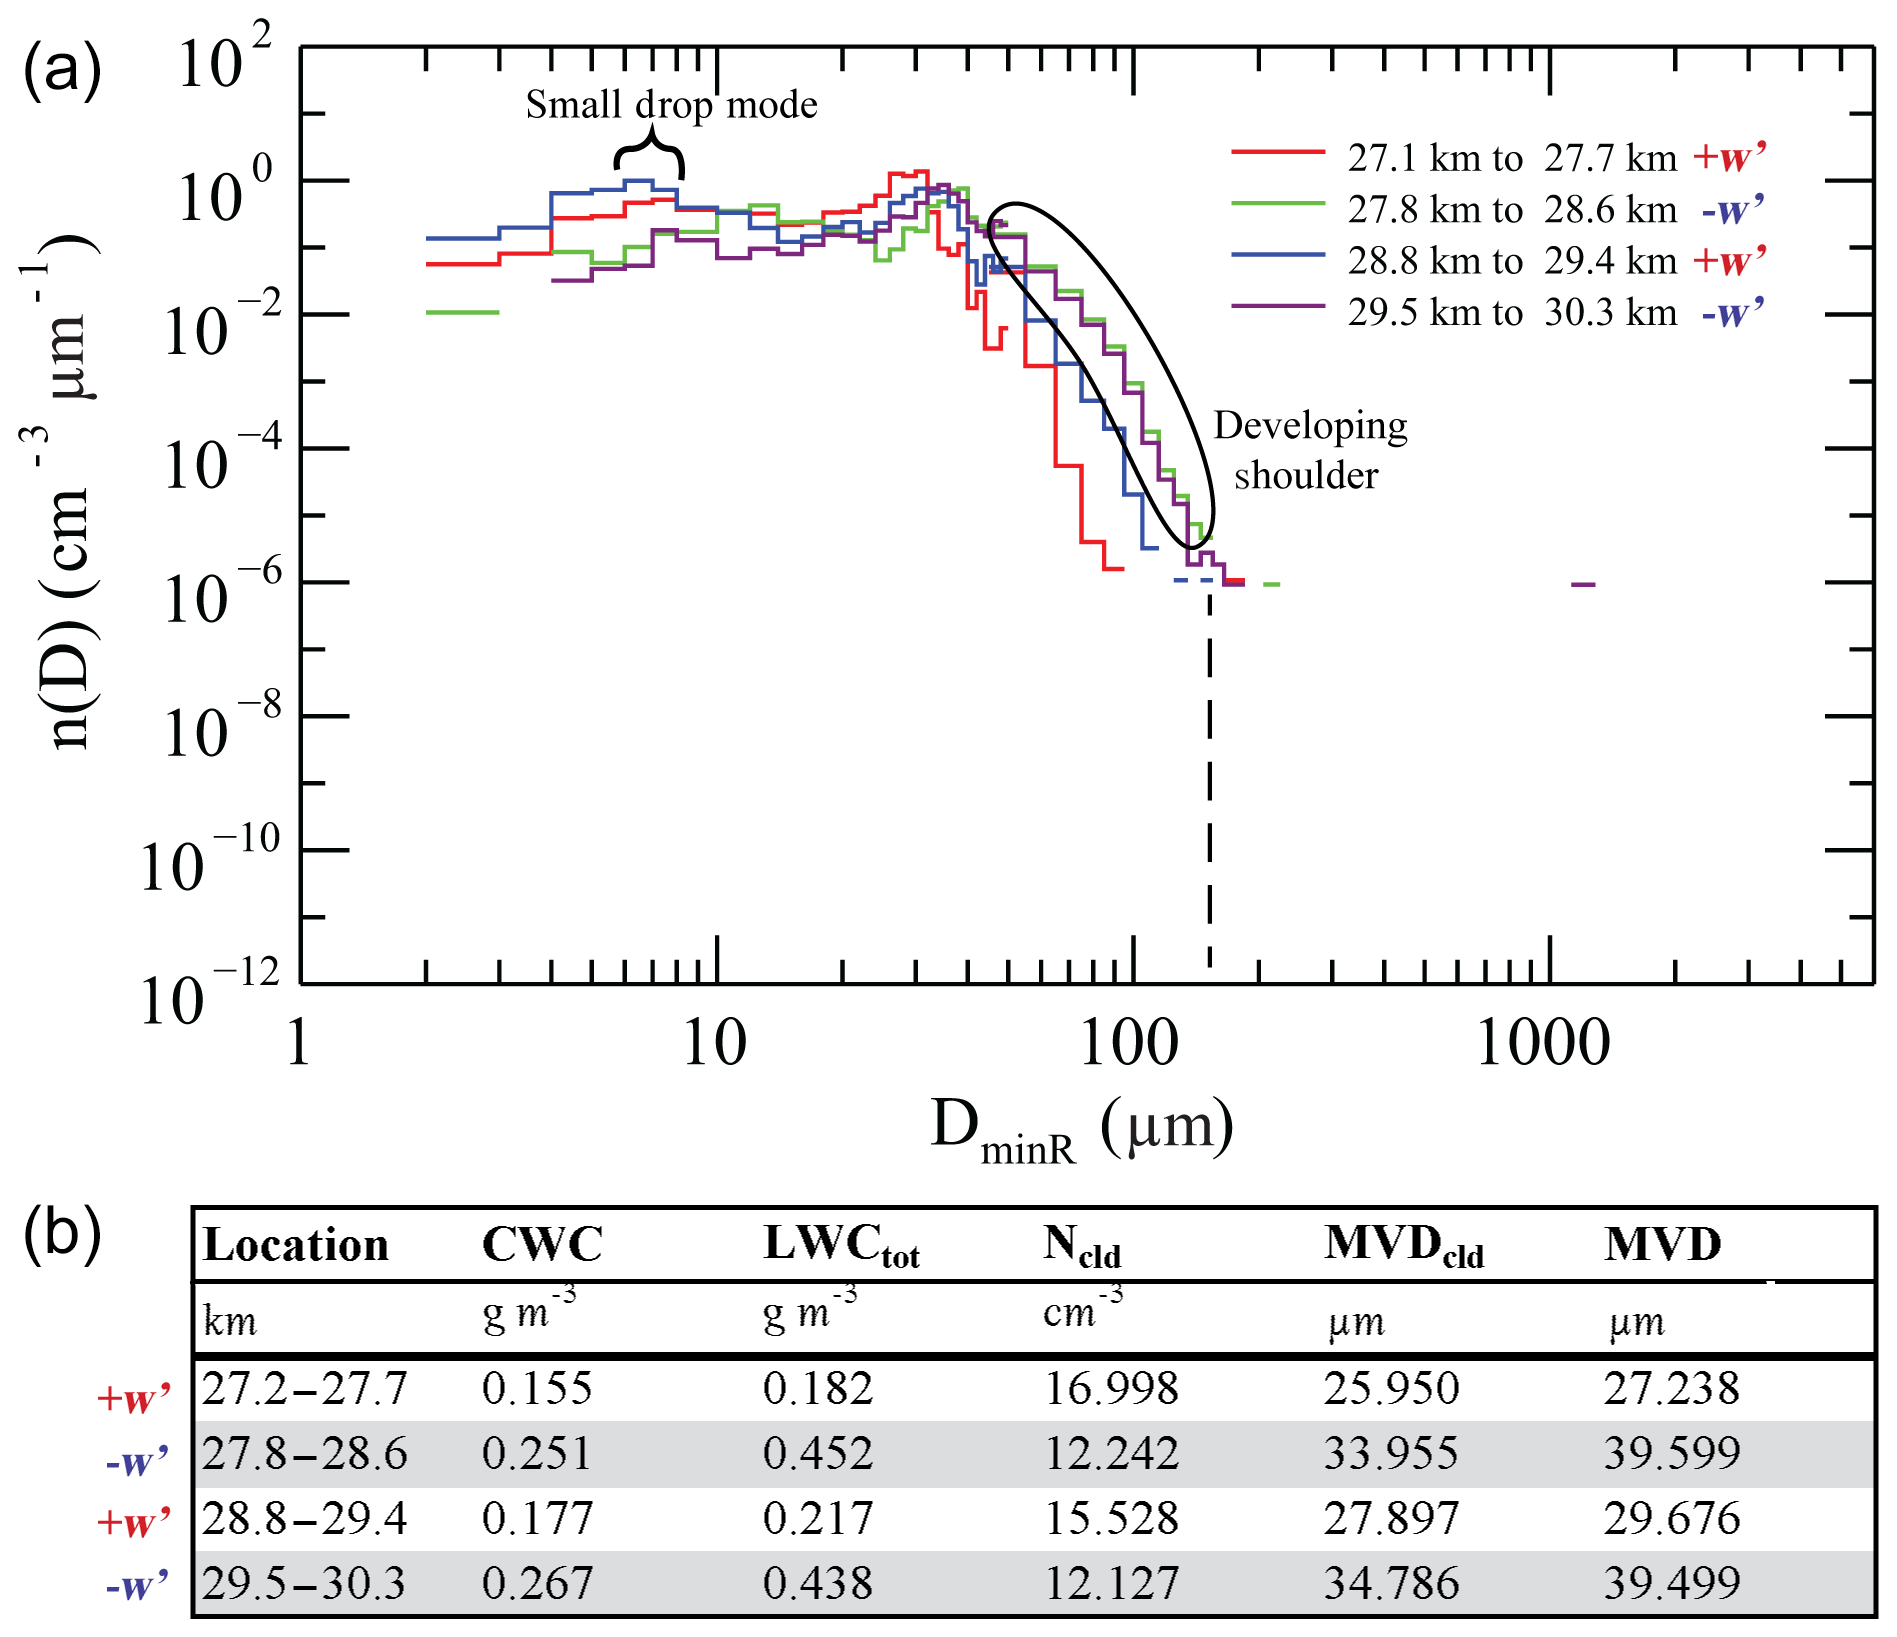
Figure 6Bin-width-normalized averaged size distributions for representative perturbation updrafts and downdrafts within the flight-level-sampled SCVVF train from leg 1. Table (b) contains calculated distribution parameters for the curves shown in (a). The corresponding location downwind of Packer John is given in the legend in (a).
Spatiotemporal cross sections of Doppler velocity (Fig. 7) highlight the difficulty in identifying layers of SCVVFs away from the aircraft using the WCR. During leg 1, from 25 to 30 km downwind of PJ, a region where in situ measurements indicate a regular perturbation velocity pattern with 1 to 2 km spacing (Fig. 5b), no similar Doppler velocity pattern appears from the WCR within the nearest few hundred meters of flight level (Fig. 7a). However, within 200 m of cloud top, from 30 to 35 km downwind of PJ, a clear train of vertical velocity fluctuations can be seen (Fig. 7a). These Doppler velocity fluctuations match the crests of the wavelike reflectivity structures near cloud top in the corresponding reflectivity profile (Fig. 5a, top circled) but do not extend as far downward into cloud as the reflectivity structures. This perturbation velocity pattern is clearest in the highest 200 m of cloud, presumably due to the smaller sizes and resulting lower terminal velocities of scatterers there. In regions lower in cloud, the radar volumes contain more and larger drizzle drops and the resulting Doppler velocities become gradually more negative, eventually dominating the overall Doppler velocity pattern. Very near flight level, it is possible to estimate the hydrometeor terminal fall speed by subtracting the in situ measured air velocity from the WCR-measured Doppler velocity in the nearest range gates. Near flight level, 29 km downwind of PJ, we note an increase in hydrometeor terminal velocity (Fig. 7b, red and blue lines). This matches well with increases in DWC and DSD mean volume diameter beginning at nearly the same location illustrated in Fig. 5c and e.
The link between SCVVFs and hydrometeor growth is also apparent in Contoured Frequency by Altitude Diagrams (CFADs) generated from WCR radar reflectivity measurements. For the region in leg 1 corresponding to the sampled SCVVF train at flight level, 25 to 30 km downwind of PJ (Fig. 8a), the median reflectivity rapidly increased from a roughly constant −25 dBZ above 5 km m.s.l. (∼500 m above flight level) to greater than −15 dBZ just below flight level, suggesting rapid growth from cloud droplets to drizzle drop sizes for the low number concentrations observed in these clouds. This increase was characterized by a roughly −20 dBZ km−1 slope in the reflectivity CFAD, which appeared consistently within layers of SCVVFs elsewhere in cloud this day. For example, in a layer of SCVVFs near cloud top at 6 km m.s.l., located at 30 to 35 km downwind of PJ, a similar reflectivity slope with altitude is measured (Fig. 8b). The reflectivity enhancement tied to both of these layers of SCVVFs is discrete in comparison to the more gradual growth (roughly −7 dBZ km−1) that occurred further downwind on this leg, starting at cloud top and extending through the entire cloud layer (Fig. 8c).
The impact that SCVVF layers had on the broader microphysical character of cloud during leg 1 was a trend of increasing hydrometeor size with distance downwind. At the location of broad 0.5 to 1 m s−1 updraft 20 to 25 km downwind of PJ (Fig. 5b), the DSD contained mostly cloud droplets with diameters less than 40 µm (Fig. 9a, red). In the region of SCVVFs at flight level 25 to 35 km downwind of PJ, the diameter of the cloud droplet mode shifts to larger sizes and the steep exponential tail flattens out into a drizzle shoulder (Fig. 9a, green and blue). Even further downwind (Fig. 9a, orange and purple), a mature drizzle shoulder ( µm) becomes apparent. Here, downwind of the SCVVFs at flight level, the sampled drizzle originates from the layer near cloud top.
Observations from flight leg 2 indicate that the SCVVF layers present in leg 1 had broken down into incoherent turbulence. A prominent drizzle precipitation plume was present from 45 to 53 km downwind of PJ, capped by a turbulent and variable cloud top height (circled, Fig. 10a). Still present were juxtaposed perturbation updrafts and downdrafts, especially near cloud top (Fig. 10b), but these were neither well organized nor layered as observed in leg 1 and did not have a unifying spatial scale. Within the drizzle plume clearly evident in the reflectivity field (Fig. 10a), in situ measurements revealed DWCs in excess of 0.4 g m−3 (Fig. 10d). While several short wavelength perturbations appeared in the flight level vertical velocity profile (Fig. 10c), a consistent correlation for either the thermodynamic (Fig. 10e) or the bulk microphysical measurements (Fig. 10d) did not appear, unlike leg 1.
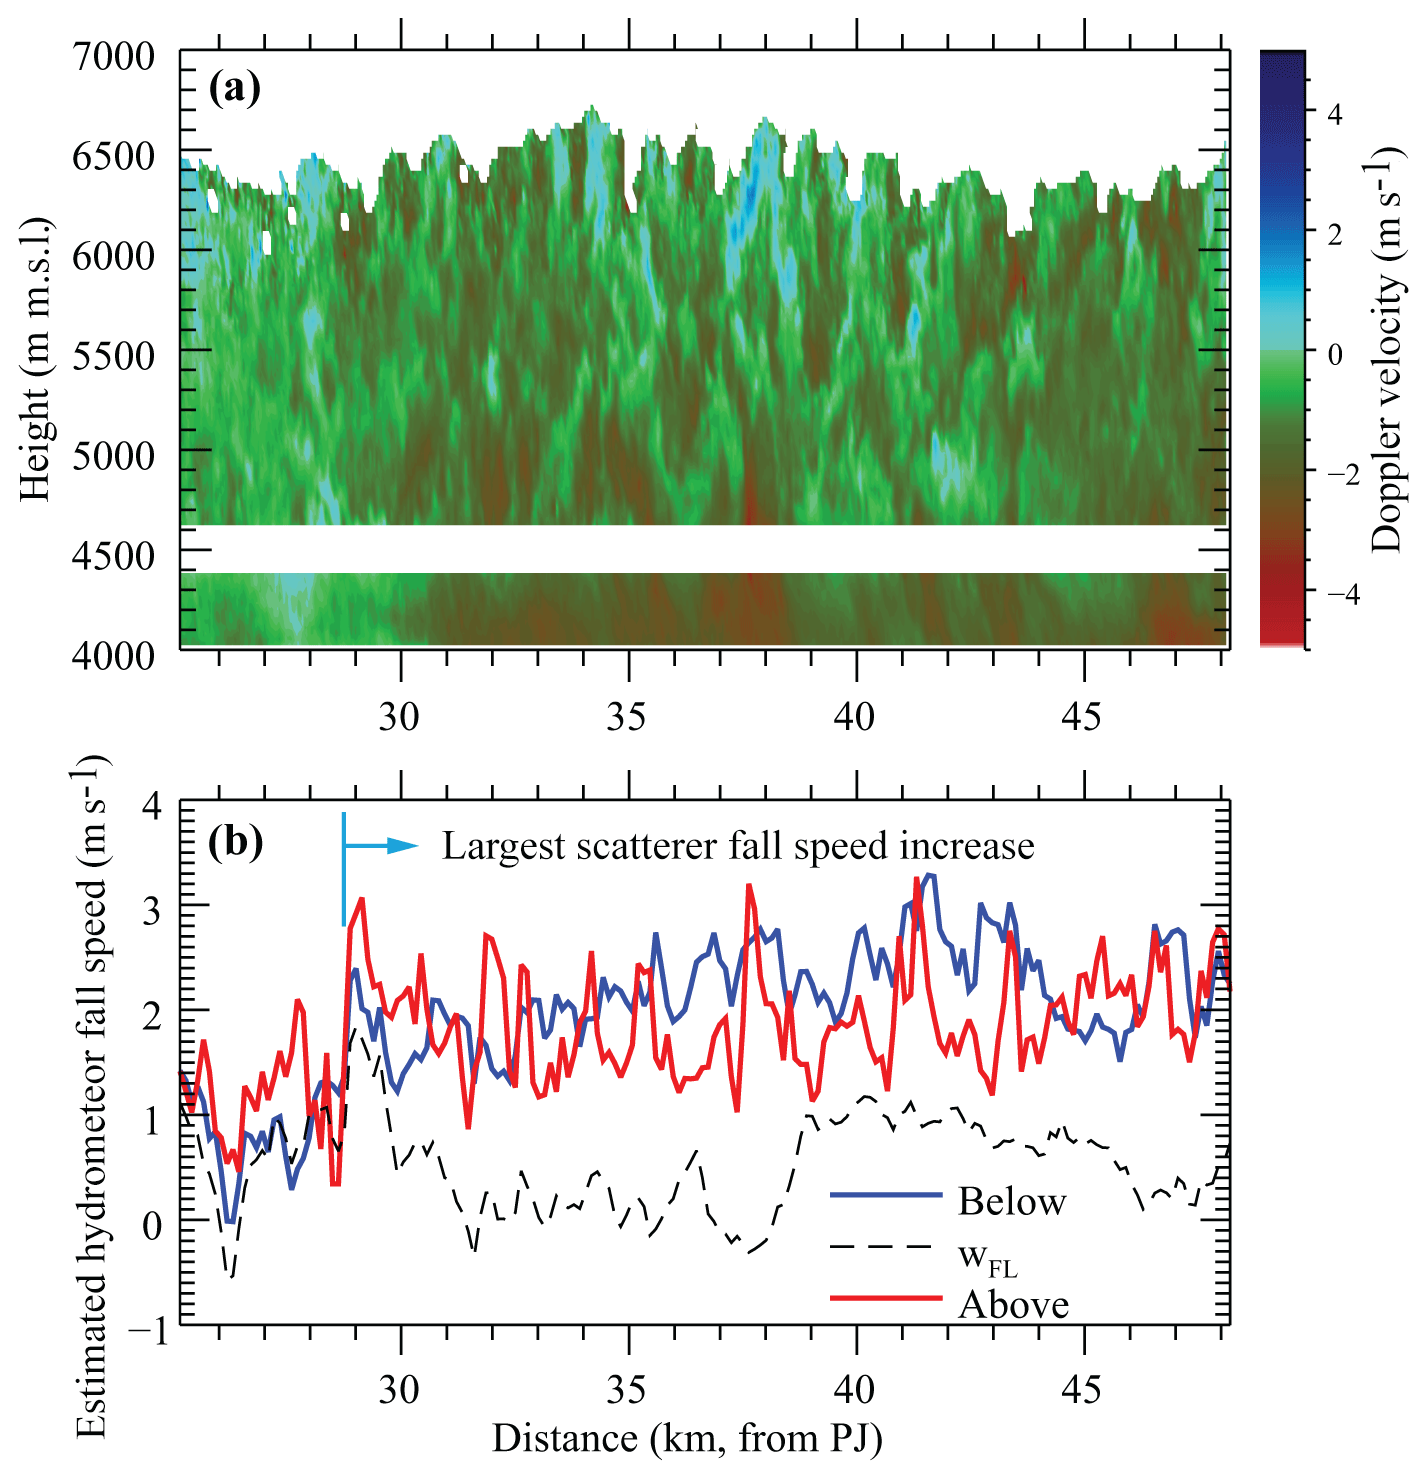
Figure 7Doppler velocity and estimated hydrometeor terminal fall speed for a portion of leg 1. Vertical cross section of Doppler velocity (a) and reflectivity-weighted hydrometeor population terminal fall speed (b) estimated by flight level gust probe vertical velocity (dashed black) minus averaged Doppler velocity of the three nearest useable radar gates above (red) and below (blue) flight level.
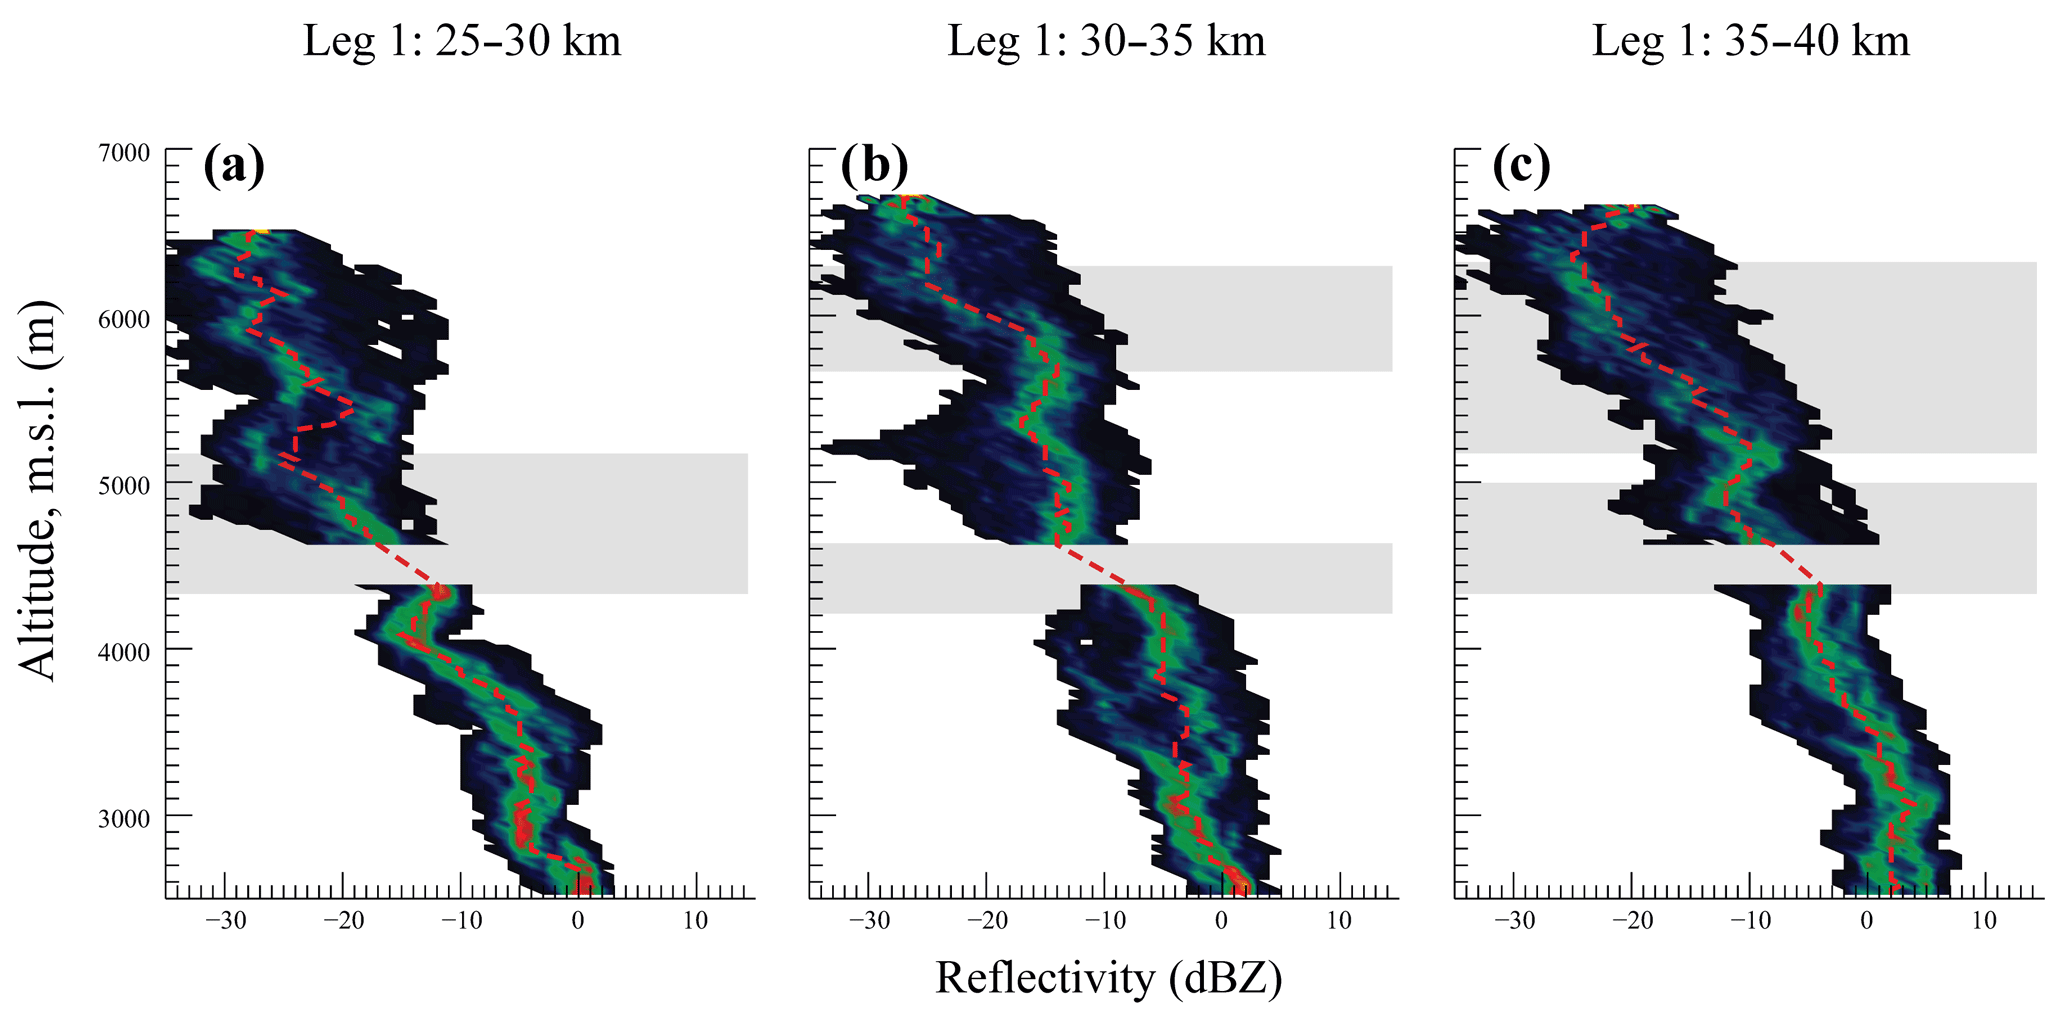
Figure 8CFAD of radar reflectivity for three 5 km wide columns from leg 1, with relative location in km downwind of PJ indicated at the top of each panel. The dashed red line is the median reflectivity for a vertical level, and frequency is normalized for each vertical level (same colors at the top as any other level). Shading indicates the primary inferred-growth regions within the elevated cellular layer.
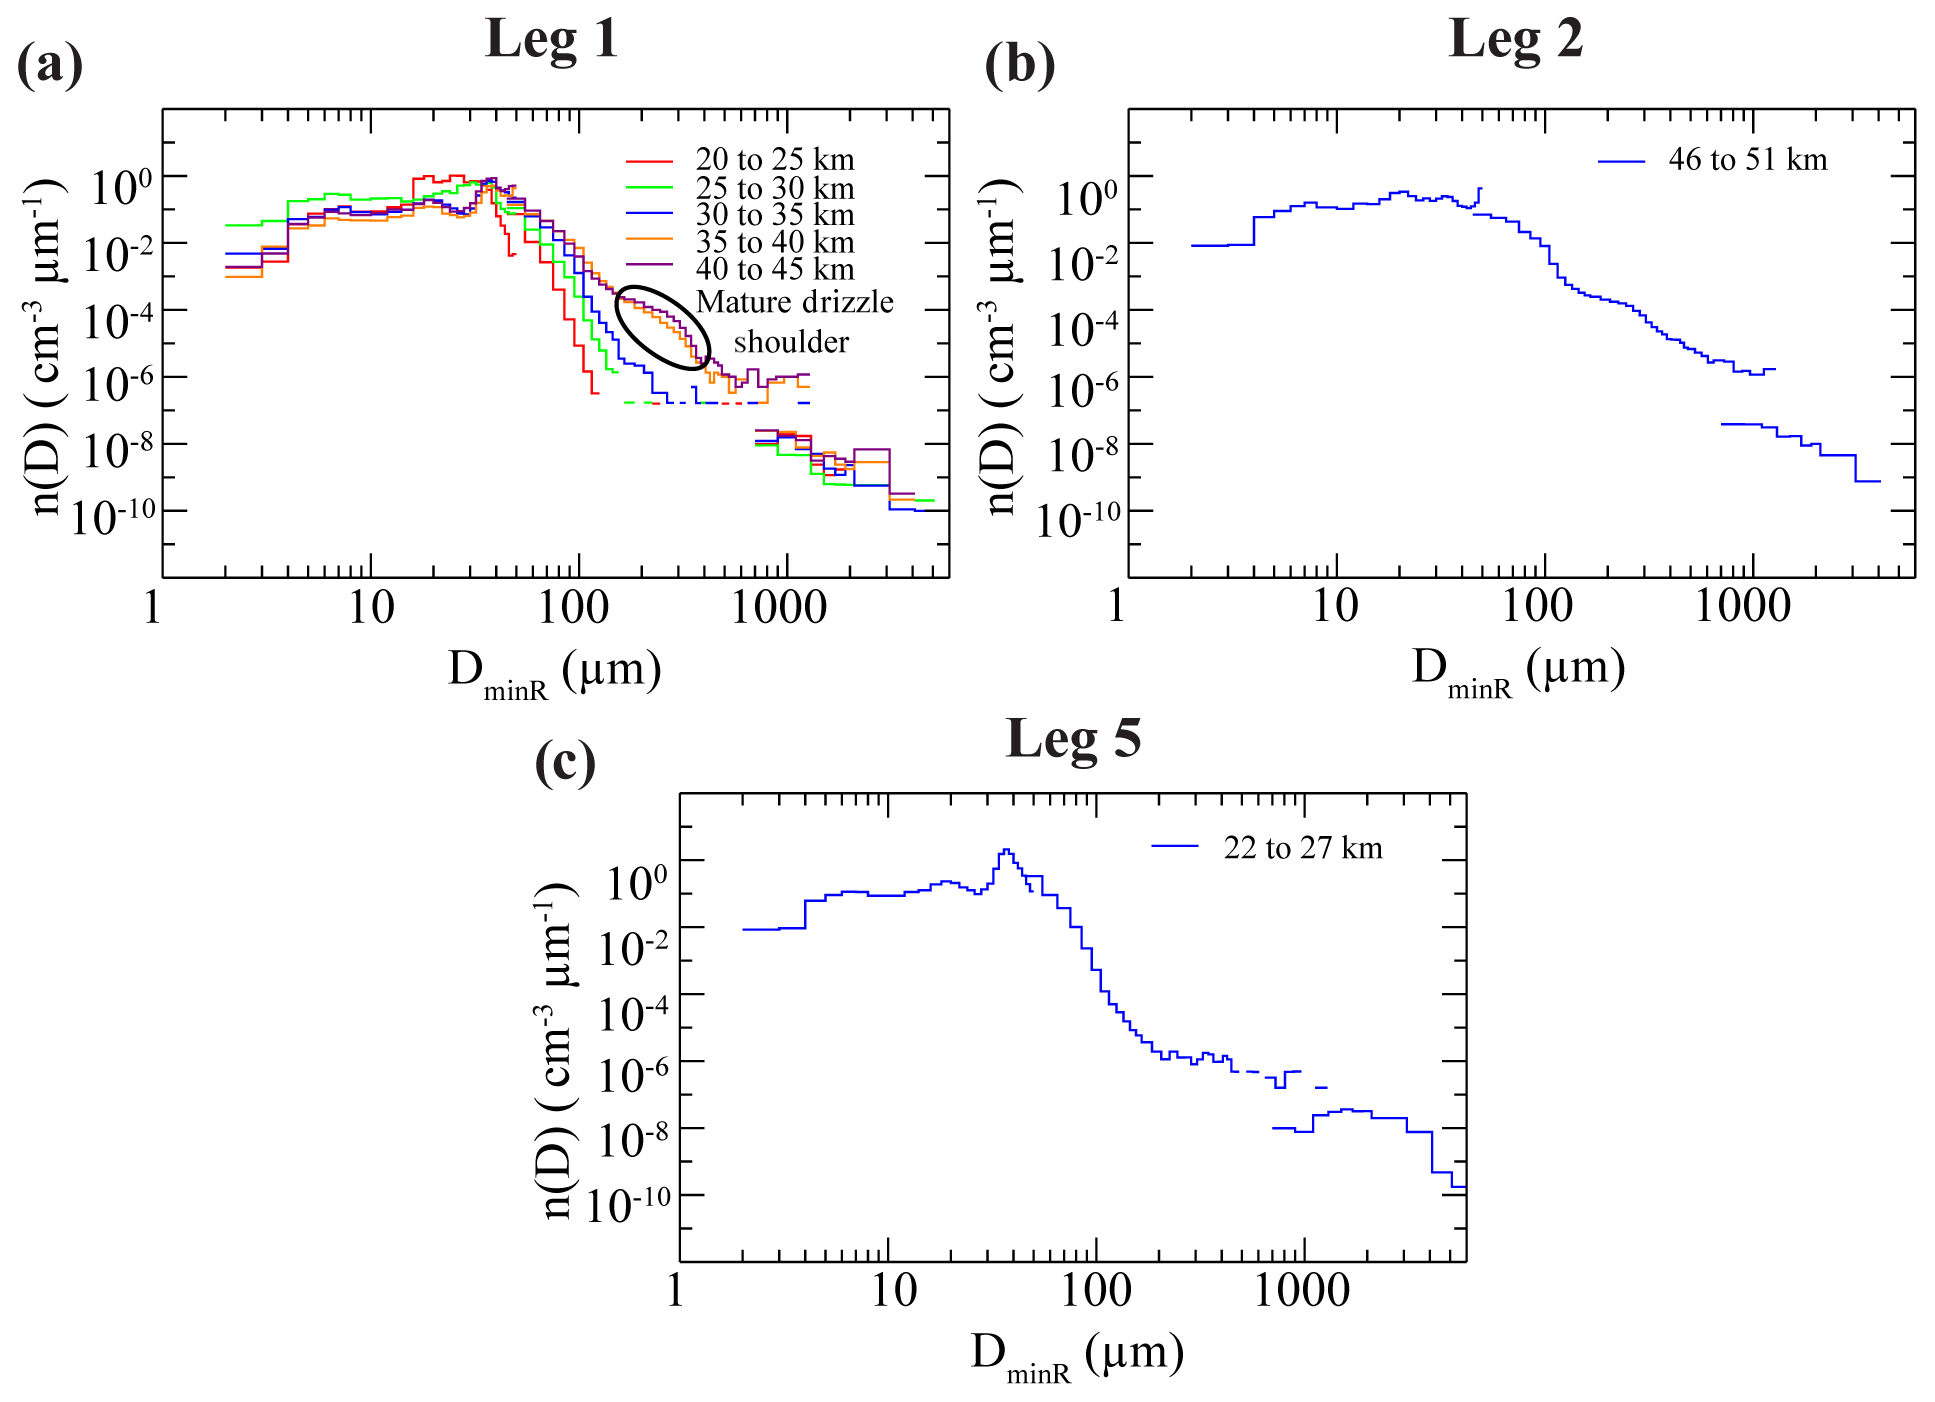
Figure 9Averaged size distributions for legs 1, 2, and 5 (a, b, and c, respectively) from the CDP, 2DS, and 2DP cloud and precipitation probes. Each of the blue composite size spectra correspond to the averaged size distributions at flight level during the CFADs in Fig. 12.
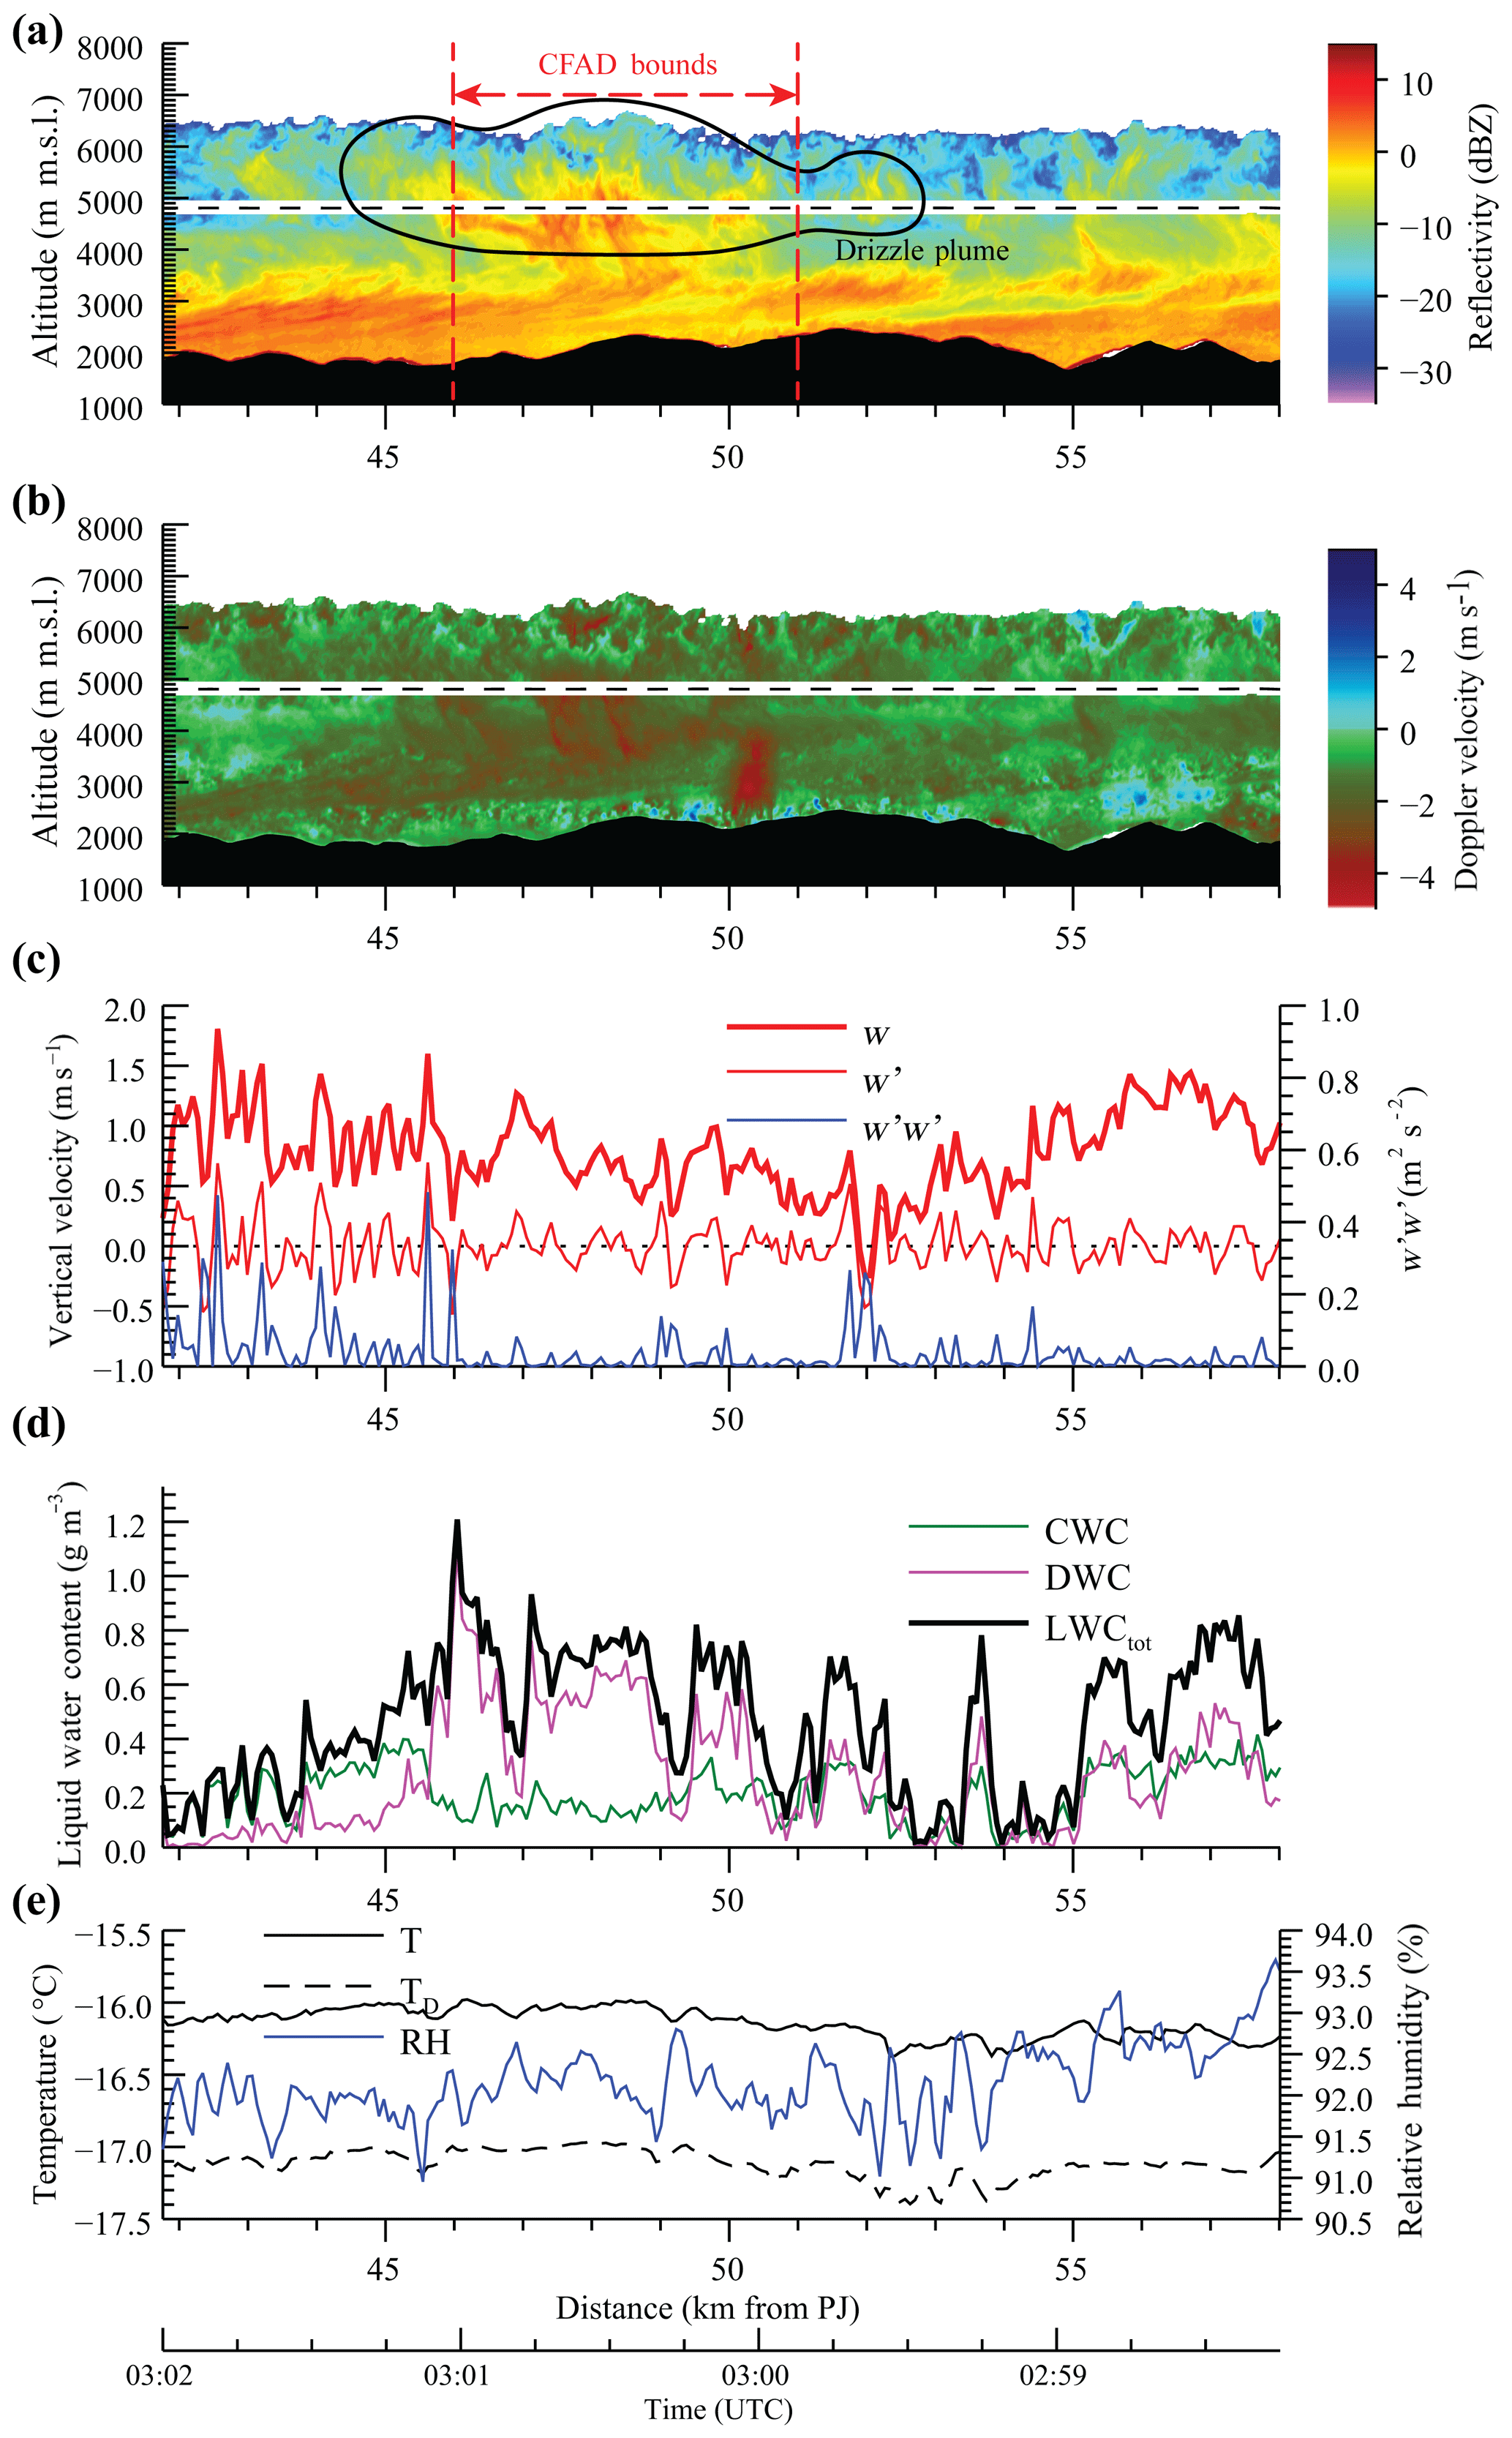
Figure 10Detailed radar and in situ measurements for the drizzling portion of leg 2. Spatiotemporal vertical cross sections of radar reflectivity are shown in (a) and vertical Doppler velocity is shown in (b). Panels (c) through (e) are derived from flight-level in situ measurements and show (c) vertical air velocity (w), computed perturbation vertical velocity (w′), and the variance of the perturbation vertical velocity (); (d) liquid water content derived from cloud droplets (CWC), drizzle drops (DWC), and both combined (LWCtot); and (e) temperature (T), dew point (TD), and relative humidity (RH). The CFAD bounds shown in (a) correspond to Fig. 12d–f. Perturbation vertical velocities in (c) were calculated as described in Fig. 5.
Leg 5, by comparison, contained a long and shallow layer of SCVVFs located 12 to 33 km downwind of PJ between 4.5 and 4.8 km m.s.l., about 500 to 1000 m below cloud top (Fig. 11a, circled) and just above the flight level. The horizontal scale of these fluctuations was smaller than in leg 1, with the width of a complete up and down perturbation couplet less than 1 km (Fig. 11b). Perhaps because of both the thinness of the SCVVF layer and its nearness to flight level, drops were much smaller compared to those observed in leg 1. The DSD mean volume diameter remained below 45 µm (Table 2) and size distributions at flight level just below these SCVVFs reveal significantly lower concentration of drizzle drops with D>100 µm compared to those observed in both legs 1 and 2 (Fig. 9c). Unlike observations in legs 1 and 2, however, a relatively even partitioning of mass distribution between CWC and DWC (Fig. 11d) did appear. Also, the presence of ice was corroborated by 2DS probe images (not shown), indicating that any vertical reflectivity enhancements from layers of SCVVFs for this leg are complicated by the increased linear growth rates (and hence reflectivity response) of ice in a mixed-phase environment.

Figure 11The same as in Fig. 10 except for the drizzling portion of leg 5. The CFAD bounds correspond to Fig. 12g–i.
Reflectivity and Doppler velocity CFADs for three 5 km wide drizzling columns from legs 1, 2, and 5 were generated for comparison (Fig. 12). The incoherent turbulence at cloud top for leg 2, seen in the large spread of Doppler velocities in the highest 1 km of cloud (Fig. 12e), produced a similar vertical reflectivity enhancement pattern as at the eastern end of leg 1 (Fig. 8c), where reflectivity gradually increases with distance downward through the elevated cellular layer. This pattern also appears in drizzling marine stratocumulus clouds where drizzle production typically occurs at cloud top and drizzle drops grow throughout the entire cloud layer (e.g., Comstock et al., 2007). The broadening processes associated with incoherent turbulence and entrainment at cloud top are sufficient for drizzle production and subsequent accretional growth through the whole cloud layer. By comparison, the thin embedded layer of SCVVFs present in leg 5 led to a shallow growth layer with larger reflectivity–altitude gradients (i.e., more horizontal slope in the thinner shaded growth region; Fig. 12g) than in either legs 1 or 2. The larger ice particles present in the tail of the corresponding size distribution for the column from leg 5 (Fig. 9c) explain the similar median radar reflectivity up to 0 dBZ at flight level observed in legs 2 and 5 (Fig. 12d and g), despite the comparatively smaller, more numerous drizzle drops in leg 5 compared to legs 1 and 2. All three drizzling columns contained reverse S correlation patterns between reflectivity and Doppler velocity in the vertical, associated with hydrometeor growth and fallout over the layer (Fig. 12c, f, and i).
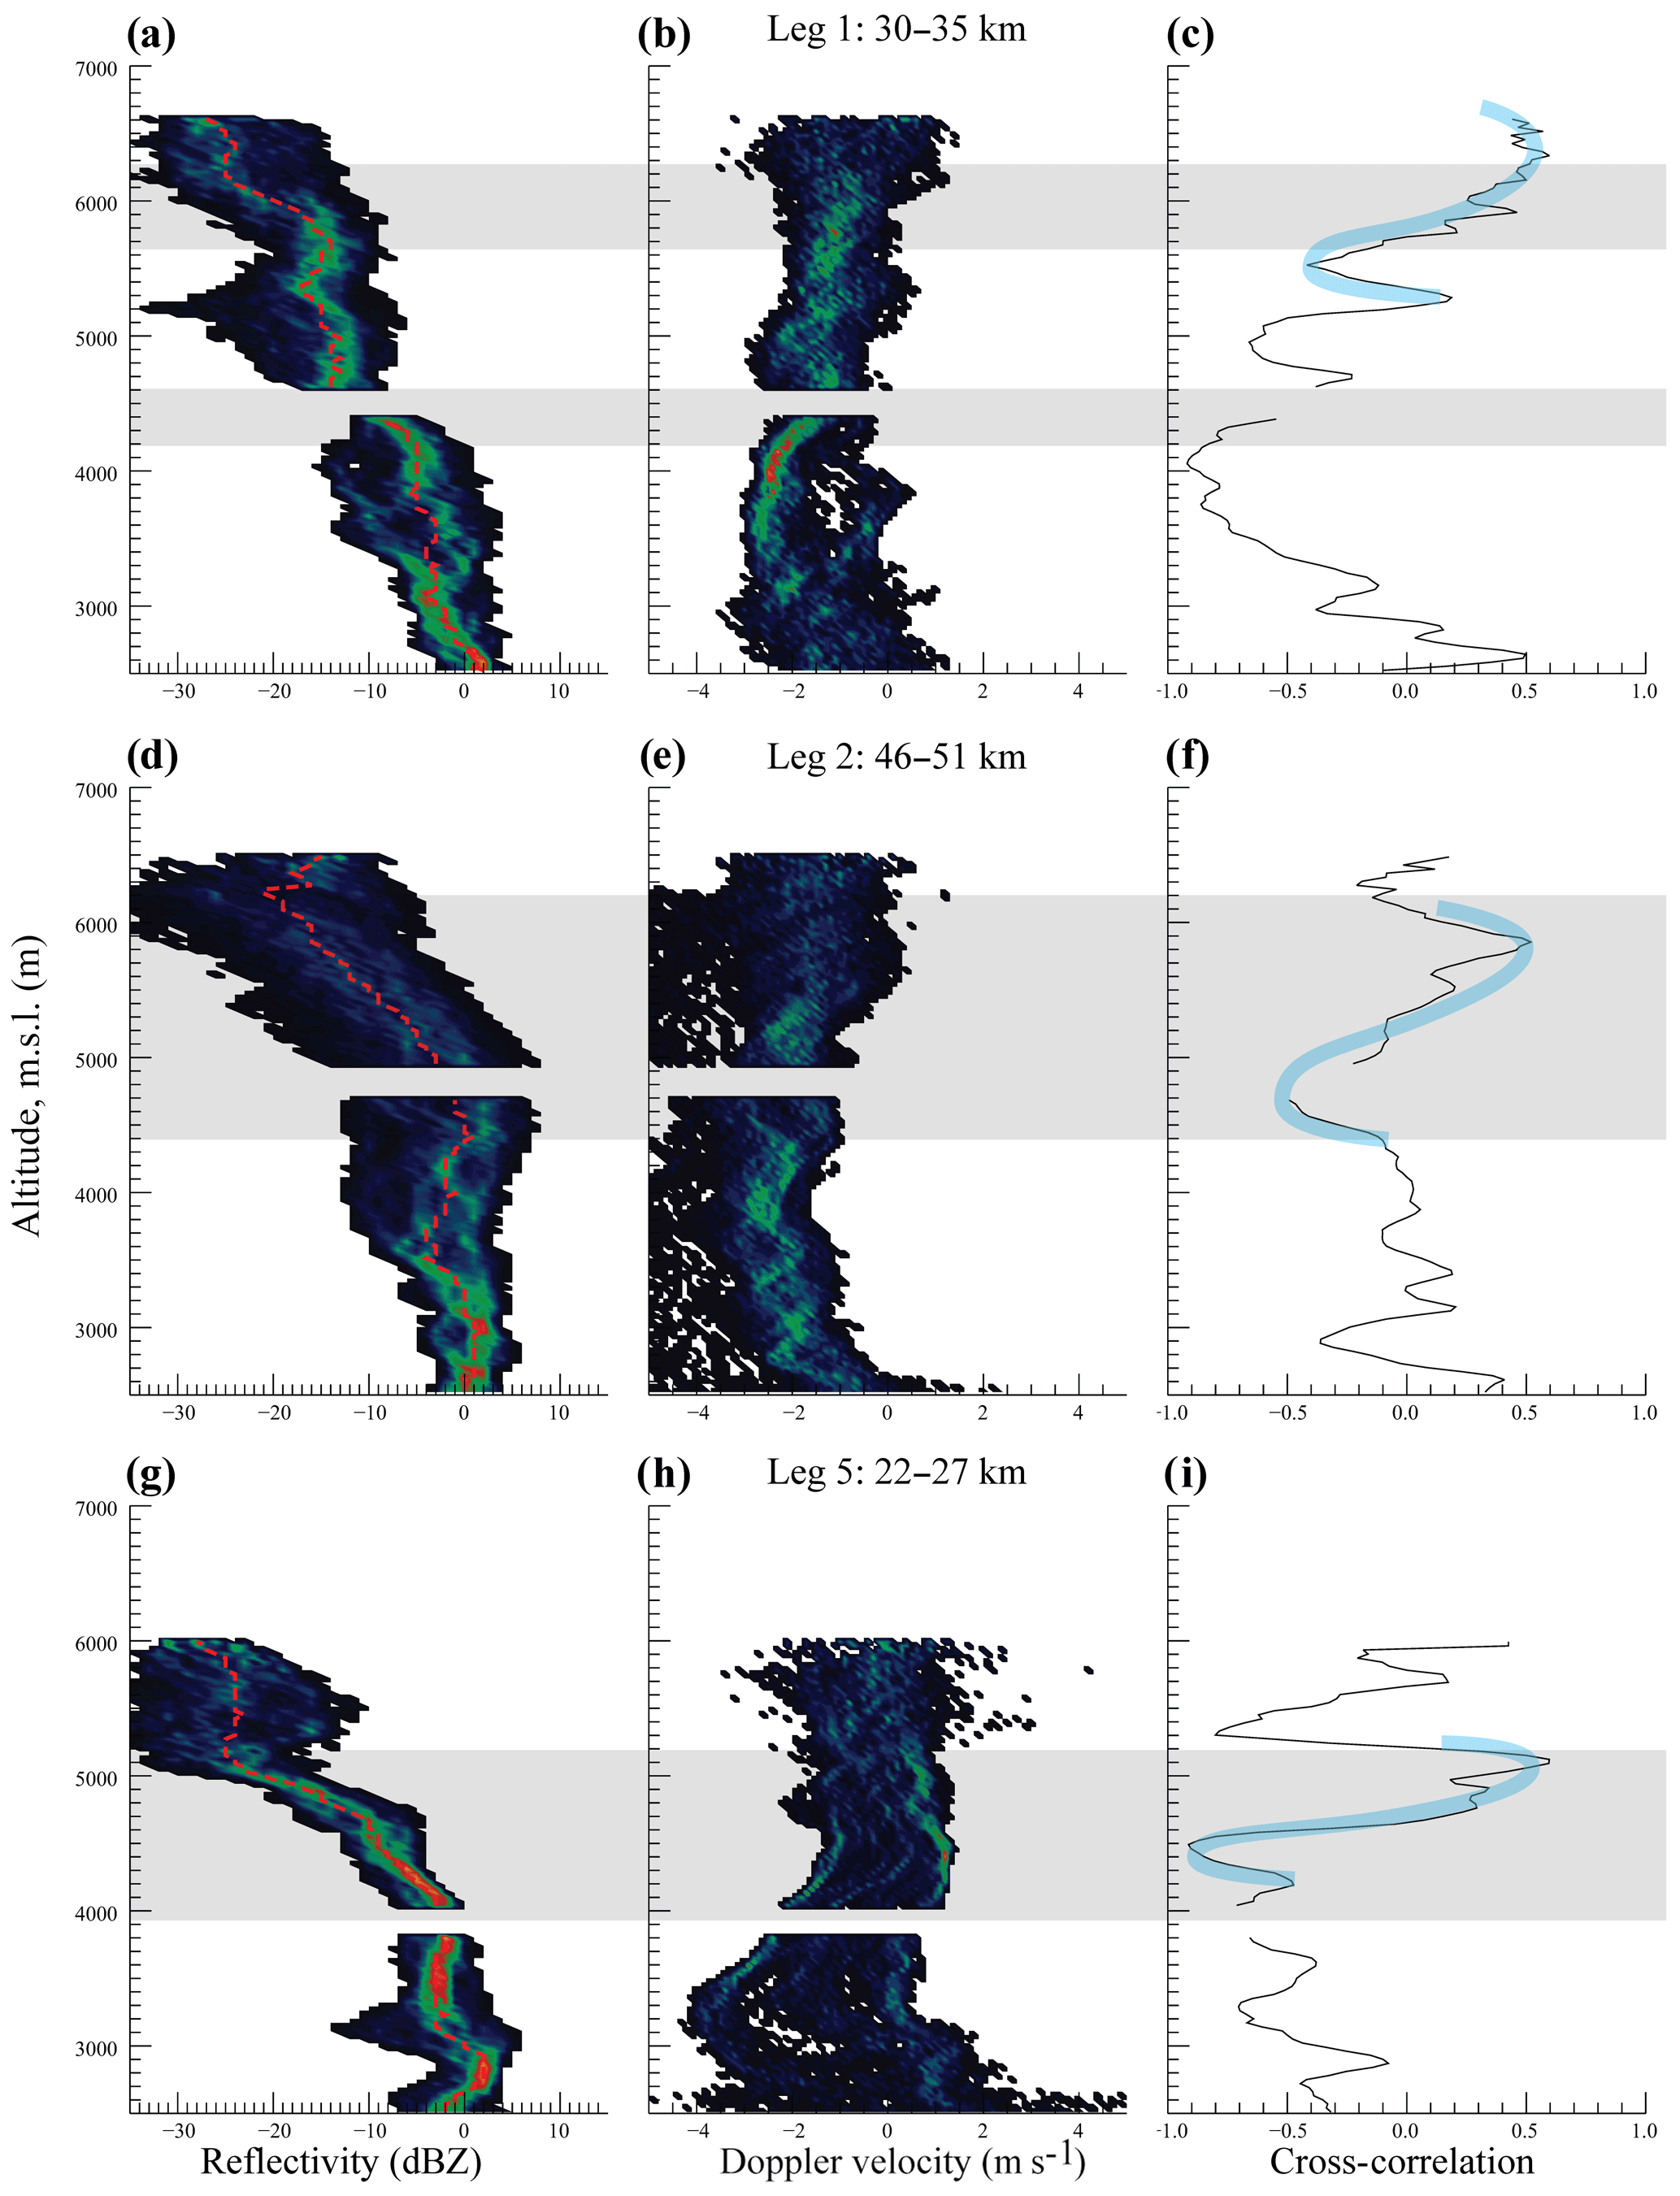
Figure 12CFADs of reflectivity; Doppler velocity; and their zero-lag cross-correlation for the legs 1, 2, and 5 (from top row to bottom row, respectively, with relative distances downwind of PJ indicated at the top of each row). The dashed red line (left column) is median reflectivity for a vertical level and frequency is normalized for each vertical level (the same colors at the top as any other level). Vertical profiles of zero-lag cross correlation between reflectivity and Doppler velocity are shown in the right column, with reverse S correlation patterns highlighted in light blue. Shading indicates the primary inferred-growth regions within the elevated cellular layer.
Much of the previous work describing SCDD development in orographic, mixed-phase cloud systems focused on the necessary conditions for development – namely the low cloud droplet and ice number concentrations coupled with condensate supply rates sufficient to support condensational growth to the droplet sizes required for active collision–coalescence (Rauber, 1992; Ikeda et al., 2007). Several other studies suggest conditions, which may be responsible for accelerated drizzle development or for relaxing these necessary conditions, introducing broadening mechanisms important for SCDD production in cloud (Pobanz et al., 1994; Korolev and Isaac, 2000). Of these, the relationship between fine wind shear levels, spatial supersaturation fluctuations, and SCDD development has yet to be connected mechanistically by in situ measurements, despite being identified both as associated with SCDD development (Pobanz et al., 1994) and, separately, as important for the spectral broadening seen in certain layer clouds (Cooper, 1989; Korolev, 1995; Korolev and Mazin, 1993). The observations here seem to be an important continuation of the work by Pobanz et al. (1994), which called for further airborne research investigating the link between layers of strong wind shear and SCDD development. While their explanation called for observations of K-H billows to understand the production mechanisms, the microphysical behavior in layers of SCVVFs here seems to provide similar insight towards understanding these mechanisms.
4.1 Microphysical response to SCVVF layers
The insight provided from sampling one of these SCVVF trains with the in situ cloud hydrometeor probes (Fig. 5) allows for some characterization of the microphysical processes in clouds of this type. Based on the flight level measurements, a conceptual model is presented to consistently describe the microphysical response to SCVVFs (Fig. 13). The kinematic structure and LWC response for leg 1 saw positive (negative) perturbation updrafts (downdrafts) paired with negative (positive) CWC perturbations from the trend and positive (negative) cloud droplet number concentration perturbations associated with droplet activation (evaporation). For these regular vertical velocity fluctuations in clouds with sufficiently low concentrations of cloud droplets, the supersaturation response to vertical velocity fluctuations as described by Korolev (1995) is responsible for (re)activating interstitial CCN as small (6 to 8 µm) droplets in the sub-adiabatic perturbation updrafts and separately broadening the primary droplet mode from repeated supersaturation fluctuations. Sub-adiabatic implies LWC values below what is expected from the adiabatic LWC formulation,
where ΓLWC represents the adiabatic lapse rate of liquid water content determined by cloud base temperature and pressure (Albrecht et al., 1990) and z−zCB is the height above cloud base. The mean CWC for the SCVVFs sampled at flight level was 0.25 g m−3 with regularly spaced oscillations ±0.05 to 0.08 g m−3 about that mean (Fig. 5c).
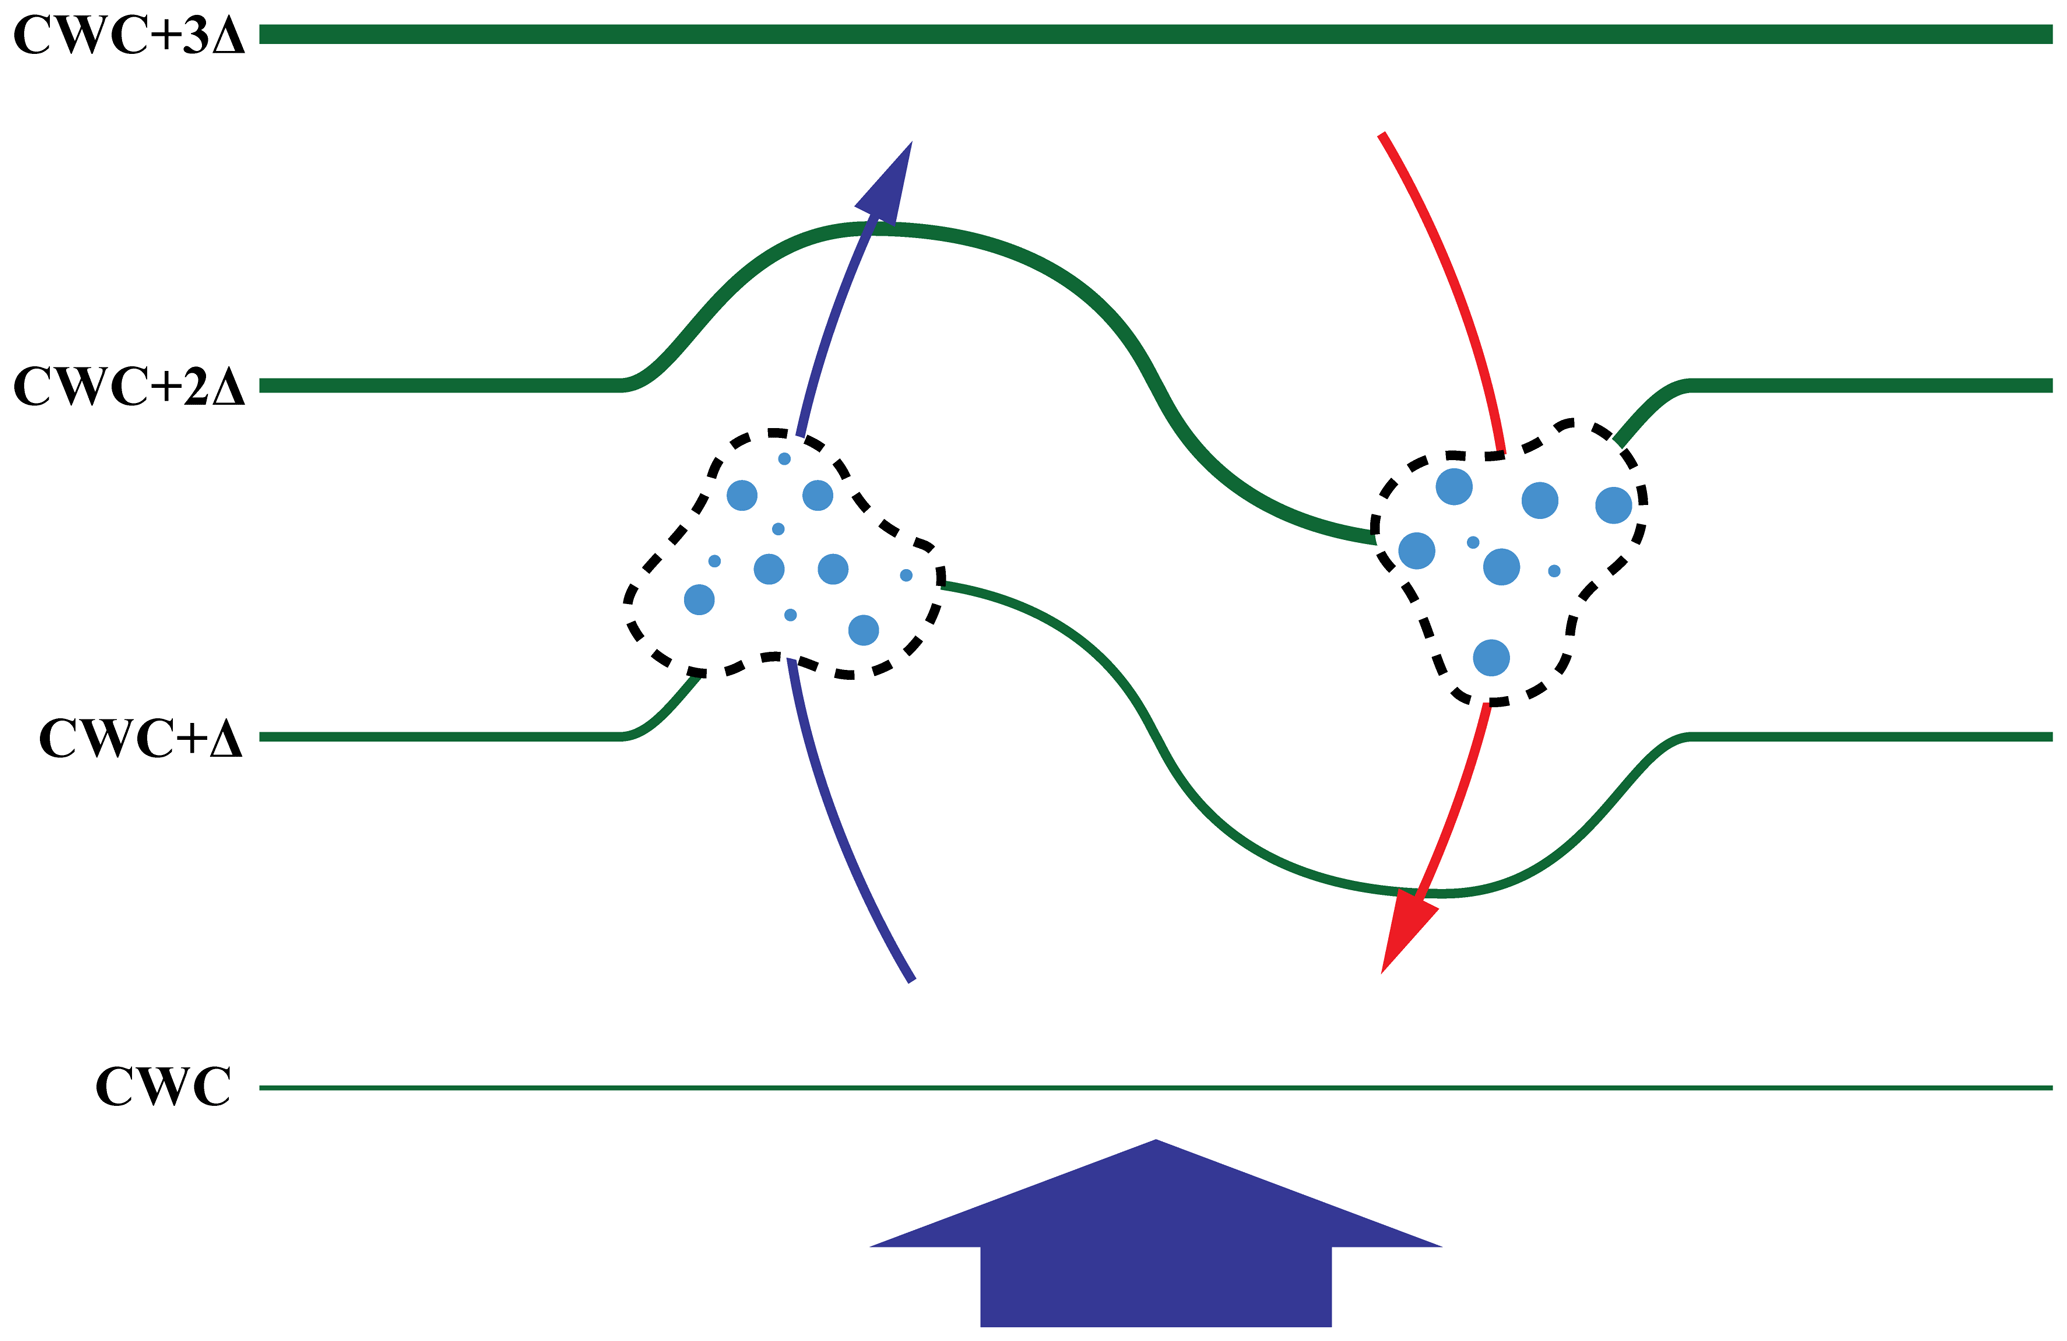
Figure 13Simplified schematic of spatial responses to the perturbation updraft (blue) and downdraft (red) pattern superimposed on broader orographic lift (broad blue arrow). The colored trajectories indicate the approximate path of parcels passing through the kinematic pattern, following the schema of Houze and Medina (2005). Lines of constant cloud water content (green) indicating the expected deformations due to condensational kinetic effects, with line weight corresponding to relative condensate mass. Cloud parcels circulate within the vertical velocity perturbation pattern and more and smaller drops are located in perturbation updrafts than downdrafts. CWC contours appear flat and unperturbed above and below the vertical velocity fluctuation pattern, as they are determined by the adiabatic ascent in the broader uplift pattern.
In a well-mixed (i.e., nearly constant equivalent potential temperature; Fig. 2), non-precipitating orographic-layer cloud, the adiabatically constrained CWC is expected to remain nearly constant at a given altitude, with only small perturbations that are the result of variations in cloud base thermodynamic conditions. Back of the envelope calculations estimate the specific adiabatic CWC lapse rate of this elevated cellular-layer cloud is about 0.001 g m−4, taking the thermodynamic conditions from the sounding at the interface between the orographic and elevated cellular layers as a pseudo cloud base for this upper layer. Given mean CWC of 0.25 g m−3 observed at flight level, this indicates roughly 250 m of ascent for the cloud parcels sampled at this altitude. Variations of ±5 ∘C at cloud base would then correspond to ±0.05 g m−3 perturbations in CWC, and variations of ±50 mb would correspond to ±0.01 g m−3 perturbations, respectively. While the orographic environment does predispose clouds to experience more variation in cloud base conditions than similar layer clouds associated with fronts or boundary layers, cloud base thermodynamic variations of this magnitude are not expected over spatial scales of 0.5 to 2 km and are therefore insufficient to explain the regular CWC perturbation observed. Instead, the perturbations of up to 40 % of the mean CWC at a constant altitude were likely the result of dynamic and/or precipitation processes that were tied to the SCVVFs.
The primary effect on CWC if only condensational effects are considered and where drizzle is not falling through parcels from above may be explained by kinetic effect, as described by Korolev (1995). The negative CWC perturbations in leg 1 were accompanied by local supersaturation sufficient for secondary droplet activation (i.e., saturation ratio large enough to activate interstitial CCN), inferred from the presence of small droplets (6 to 8 µm) within perturbation updrafts (Fig. 6a, red and blue curves). Such sub-adiabatic behavior is linked to the kinetic limitation on condensational growth. As noted earlier, cloud droplet number concentrations were less than 30 cm−3 and the “condensational inertia” of droplet populations to condense excess water vapor supply governed the supersaturation response, associated CWC response, and secondary droplet activation behavior. For the droplet populations less than 30 cm−3 and mean count diameter of between 20 and 30 µm, the corresponding phase relaxation time is around 10 s (using estimation methodology by Fukuta and Walter, 1970; Polotivitch and Cooper, 1988; Korolev, 1995). This phase relaxation time corresponds to expected perturbations from the adiabatic mean of as much as 0.02 g m−3 at flight level, indicating that while the kinetic effect cannot fully explain the perturbation magnitude in the CWC field, it acts in the proper observed direction and explains the primary adiabatic (i.e., closed parcel) effect in these clouds. This zero-lag anticorrelation between vertical velocity and CWC perturbations results in the spatial pattern illustrated in Fig. 13.
The remaining magnitude of CWC variation is likely related to the precipitation dynamics. Removal of cloud water by scavenging from drizzle in perturbation updrafts would lead to lower CWCs and reduced cloud droplet number. While the lower CWCs are indeed observed, and this may account for the greater magnitude reduction expected from the kinetic–adiabatic model alone, cloud droplet number concentrations increase. However, the increase in activation due to the kinetic limitation as noted previously is likely greater than the reduction in number concentration due to scavenging. Within the interspersed perturbation downdrafts, greater DWC and larger drizzle drops are observed, indicating active collision–coalescence. CWC and cloud droplet number concentrations are therefore expected to be further depressed relative to the mean than expected from the kinetic condensational effect alone. These regions are the likely origin of drizzle fall streaks observed in the WCR profiles and are represented by slightly larger drizzle drops in the downdraft region in Fig. 13.
4.2 Reflectivity-inferred hydrometeor growth in SCVVF layers
Comparisons between vertical reflectivity, Doppler velocity, and their cross correlation suggest two main microphysical behaviors within layers of SCVVFs. The first is rapid, and often discrete, drop growth in the vertical tied to layers of vertical velocity fluctuations and not confined to cloud top. This vertical growth rate appears as large for these SCVVF layers in leg 1 as for the drizzle production at cloud top in leg 2. The second behavior is a reverse S cross-correlation pattern (see Vali et al., 1998) in layers of SCVVFs, irrespective of hydrometeor phase differences, which further corroborates the local hydrometeor growth and fallout tied to these layers.
Layers of SCVVFs in legs 1 and 5 were responsible for vertical reflectivity enhancements similar in magnitude, roughly −20 dBZ km−1, as those produced by the drizzling cloud in leg 2 where layers of SCVVFs were not present. However, these SCVVF layers, especially in the relatively upwind cloud elements closer to PJ, were responsible for discrete growth layers that did not begin at cloud top. This indicates that the vertical velocity fluctuations were likely responsible for the initiation of collision–coalescence and drizzle production that occurred earlier and at a different location in cloud compared to the classic idea of production at cloud top. Further downwind, corresponding to later in time from the upwind edge, drizzle production and growth did occur at cloud top and subsequent growth of the SCDDs occurred through the depth of the SLW layer, even without the presence of SCVVFs. This was most apparent in the transition between legs 1 and 2 from discrete growth at the level of these SCVVFs to growth over the entire layer, starting at cloud top, in leg 2. While qualitative, this observation suggests the importance of SCVVFs in other layered liquid clouds where embedded shear or shallow layers of static instabilities may be responsible for enhancing the collision–coalescence process. Layers of SCVVFs may also be important in clouds where condensational growth and cloud top spectral broadening occur too slowly for active warm rain production, although with the caveat that any condensational kinetic effects are bound to be smaller than reported here. This, however, agrees with the observations of both Pobanz et al. (1994) and Korolev and Isaac (2005).
A distinct feature of the layers of SCVVFs is the bimodal DSD with populations of large (D>30 µm) and small (D<10 µm) droplets of similar number that were not present elsewhere in cloud. This small droplet mode contains much less mass compared to the large droplet mode, and collisions between the large and small droplets are likely inefficient (E∼1 % to 3 % for drops of these sizes in laminar flow; Rogers and Yau, 1996), but the effect of such numerous possible collision events, especially given the large fall speed separations, in a turbulent environment may be enough to break the colloidal stability of the narrow large drop mode for a few lucky drops, such that subsequent self-collection within this mode becomes favored. Furthermore, parcel model results (Korolev, 1995) have shown that repeated supersaturation variations driven by vertical velocity fluctuations produce a local broadening about the larger droplet mode. This broadening may provide enough fall speed separation for self-collection without the need for larger droplets to physically interact with the newly activated smaller droplets. The increases in drop size and drizzle mass with distance downwind within SCVVF layers where parcels have undergone repeated supersaturation fluctuations are in qualitative agreement with this hypothesis.
A reverse S cross correlation pattern between reflectivity and Doppler velocity with altitude across these SCVVF layers further corroborates the drop growth in these layers. Vali et al. (1998) demonstrated this pattern in drizzling coastal stratus as the result of upward transport of drizzle and dilution of downward-moving parcels near cloud top (region of positive correlation) that transitioned to the dominance of precipitation terminal fall speed increases below (region of negative correlation). Here the same trend is present in leg 5 (Fig. 12g), where the very low background reflectivities (−25 dBZ) above the growth layer transition to rapid reflectivity increases below 5 km m.s.l. correlated with positive Doppler velocities (Fig. 12i). As the Doppler velocities become more negative below this layer (Fig. 12h), the pattern reverses to the falling drizzle (and ice) dominating the reflectivity signature – with strong anticorrelation between reflectivity and Doppler velocity. This strong anticorrelation is dominated by the terminal fall speed–size relationship (e.g., terminal fall speed is proportional to the square of the diameter for drizzle drops). At the top of the growth layer, where weaker positive correlation exists between reflectivity and Doppler velocity, it is important to consider both the contribution of hydrometeor terminal velocity and air motion to the observed Doppler velocities. For the populations just above the growth layer, terminal velocities for the largest cloud droplets are much lower than the magnitude of the vertical velocity perturbations (±0.5 to 1.0 m s−1) and therefore the Doppler velocity signal is dominated by air motions. This suggests that the regions of upward relative air motion are correlated with higher reflectivities near the top of SCVVF layers, though without in situ measurements nearer the top of these layers it is impossible to determine whether this is due primarily size or concentration. A more expansive conceptual model (cf. Fig. 13) would incorporate the vertical gradient of these growth and fallout effects across the SCVVF layer but is too conjectural without more penetrations through SCVVF trains at different altitudes.
Low cloud droplet number concentrations of less than 30 cm−3 and precipitation-sized ice number concentrations of less than 0.5 L−1, despite cold cloud top temperatures ( ∘C), provided favorable conditions for the development of SCDDs in a postfrontal orographic-layer cloud forming over the Sawtooth Range in the American Intermountain West. This cloud, while transient and variable in vertical location and depth, was consistently strongest over the prominent terrain features downwind of Packer John Mountain and frequently contained layers of SCVVFs. Where present, SCVVFs were associated with local enhancement of the development and growth of SCDDs in response to the kinematic perturbation pattern. This was demonstrated by strong vertical enhancements in CFADs of reflectivity, on the order of −20 dBZ km−1, and attributed to hydrometeor growth through collision–coalescence. This drizzle production and growth occurred embedded within cloud and over relatively shallow layers before transitioning to drizzle production at cloud top and growth over the entire elevated cellular-layer cloud. Compared to quiescent clouds, those containing SCVVFs will have more active DSD broadening processes and larger CWC gradients coincident with regions of probable turbulent mixing. This appears to explain the observation that initial SCDD production can be enhanced by SCVVF layers and can lead to SCDD production in vertical regions other than just cloud top.
Data presented here were collected during the NSF SNOWIE Campaign and are publicly available through the SNOWIE data archive website maintained by the Earth Observing Laboratory at the National Center for Atmospheric Research, flight level aircraft data can be accessed at: https://doi.org/10.15786/M2MW9F (University of Wyoming – Research Flight Center, 2017). The microphysical size spectra data can be accessed at: https://doi.org/10.5065/D6GT5KXK (French and Majewski, 2017) and WCR L2 data can be accessed at: https://doi.org/10.15786/M2CD4J (Haimov and Tripp, 2017).
AM performed the analysis and prepared the manuscript. JRF contributed to interpretation of results and provided critical edits in preparing the manuscript.
The authors declare that they have no conflict of interest.
We would like to acknowledge the contributions of both Coltin Grasmick and Phil Bergmaier for both feedback on the ideas present herein and the shared access to their IDL libraries used in several figures. Finally, the feedback and suggestions from the SNOWIE principal investigators and senior scientists (Sarah Tessendorf, Lulin Xue, Kyoko Ikeda, and Roy Rasmussen of NCAR; Katja Friedrich of CU Boulder; and Bob Rauber of the University of Illinois) were invaluable in honing in on the important elements of this analysis.
Observations from and participation in the SNOWIE field campaign were funded through NSF AGS (grant no. 1547101), with UWKA participation supported by NSF AGS (grant no. 1441831).
This paper was edited by Ottmar Möhler and reviewed by two anonymous referees.
Aikins, J., Friedrich, K., Geerts, B., and Pokharel, B.: Role of a Cross-Barrier Jet and Turbulence on Winter Orographic Snowfall, Mon. Weather Rev., 144, 3277–3300, https://doi.org/10.1175/MWR-D-16-0025.1, 2016.
Albrecht, B. A., Fairall, C. W., Thomson, D. W., White, A. B., Snider, J. B., and Schubert, W. H.: Surface-based remote sensing of the observed and the Adiabatic liquid water content of stratocumulus clouds, Geophys. Res. Lett., 17, 89–92, https://doi.org/10.1029/GL017i001p00089, 1990.
Ashenden, R., Lindberg, W., Marwitz, J. D., and Hoxie, B.: Airfoil performance degradation by supercooled cloud, drizzle, and rain drop icing, J. Aircraft, 33, 1040–1046, https://doi.org/10.2514/3.47055, 1996.
Bernstein, B. C., Wolff, C. A., and McDonough, F.: An Inferred Climatology of Icing Conditions Aloft, Including Supercooled Large Drops. Part I: Canada and the Continental United States, J. Appl. Meteorol. Clim., 46, 1857–1878, https://doi.org/10.1175/2007JAMC1607.1, 2007.
Cober, S. G., Isaac, G. A., and Strapp, J. W.: Characterizations of Aircraft Icing Environments that Include Supercooled Large Drops, J. Appl. Meteorol., 40, 1984–2002, https://doi.org/10.1175/1520-0450(2001)040<1984:COAIET>2.0.CO;2, 2001.
Comstock, K. K., Yuter, S. E., Wood, R., and Bretherton, C. S.: The Three-Dimensional Structure and Kinematics of Drizzling Stratocumulus, Mon. Weather Rev., 135, 3767–3784, https://doi.org/10.1175/2007MWR1944.1, 2007.
Cooper, W. A.: Effects of Variable Droplet Growth Histories on Droplet Size Distributions, Part I: Theory, J. Atmos. Sci., 46, 1301–1311, https://doi.org/10.1175/1520-0469(1989)046<1301:EOVDGH>2.0.CO;2, 1989.
Cooper, W. A. and Saunders, C. P. R.: Winter Storms over the San Juan Mountains. Part II: Microphysical Processes, J. Appl. Meteorol., 19, 927–941, https://doi.org/10.1175/1520-0450(1980)019<0927:WSOTSJ>2.0.CO;2, 1980.
DeMott, P. J., Prenni, A. J., Liu, X., Kreidenweis, S. M., Petters, M. D., Twohy, C. H., Richardson, M. S., Eidhammer, T., and Rogers, D. C.: Predicting global atmospheric ice nuclei distributions and their impacts on climate, P. Natl. Acad. Sci. USA, 107, 11217–11222, https://doi.org/10.1073/pnas.0910818107, 2010.
Faber, S., French, J. R., and Jackson, R.: Laboratory and in-flight evaluation of measurement uncertainties from a commercial Cloud Droplet Probe (CDP), Atmos. Meas. Tech., 11, 3645–3659, https://doi.org/10.5194/amt-11-3645-2018, 2018.
Finlon, J. A., McFarquhar, G. M., Rauber, R. M., Plummer, D. M., Jewett, B. F., Leon, D., and Knupp, K. R.: A comparison of X-band polarization parameters with in situ microphysical measurements in the comma head of two winter cyclones, J. Appl. Meteorol. Clim., 55, 2549–2574, 2016.
French, J. R. and Majewski, A.: UW King Air Hydrometeor Size Spectra Data, UCAR/NCAR – Earth Observing Laboratory, https://doi.org/10.5065/D6GT5KXK, 2019.
French, J. R., Friedrich, K., Tessendorf, S. A., Rauber, R. M., Geerts, B., Rasmussen, R. M., Xue, L., Kunkel, M. L., and Blestrud, D. R.: Precipitation formation from orographic cloud seeding, P. Natl. Acad. Sci. USA, 115, 1168–1173, https://doi.org/10.1073/pnas.1716995115, 2018.
Freud, E. and Rosenfeld, D.: Linear relation between convective cloud drop number concentration and depth for rain initiation, J. Geophys. Res.-Atmos., 117, 148–227, https://doi.org/10.1029/2011JD016457, 2012.
Fukuta, N. and Walter, L. A.: Kinetics of Hydrometeor Growth from a Vapor-Spherical Model, J. Atmos. Sci., 27, 1160–1172, https://doi.org/10.1175/1520-0469(1970)027<1160:KOHGFA>2.0.CO;2, 1970.
Geresdi, I. and Rasmussen, R.: Freezing Drizzle Formation in Stably Stratified Layer Clouds. Part II: The Role of Giant Nuclei and Aerosol Particle Size Distribution and Solubility, J. Atmos. Sci., 62, 2037–2057, https://doi.org/10.1175/JAS3452.1, 2005.
Grabowski, W. W. and Abade, G. C.: Broadening of Cloud Droplet Spectra through Eddy Hopping: Turbulent Adiabatic Parcel Simulations, J. Atmos. Sci., 74, 1485–1493, https://doi.org/10.1175/JAS-D-17-0043.1, 2017.
Haimov, S. and Tripp, A.: Wyoming Cloud Radar data from the University of Wyoming King Air during the Seeded and Natural Orographic Wintertime clouds-the Idaho Experiment (SNOWIE) project, University of Wyoming – Reseach Flight Center, https://doi.org/10.15786/M2CD4J, 2019.
Hatt, M.: Microphysical Impact of Cloud Seeding on Wintertime Orographic Clouds Observed During SNOWIE, University of Wyoming, 2019.
Heggli, M. F. and Reynolds, D. W.: Radiometric Observations of Supercooled Liquid Water within a Split Front over the Sierra Nevada, J. Clim. Appl. Meteorol., 24, 1258–1261, https://doi.org/10.1175/1520-0450(1985)024<1258:ROOSLW>2.0.CO;2, 1985.
Heymsfield, A. J. and Parrish, J. L.: A Computational Technique for Increasing the Effective Sampling Volume of the PMS Two-Dimensional Particle Size Spectrometer, J. Appl. Meteorol., 17, 1566–1572, https://doi.org/10.1175/1520-0450(1978)017<1566:ACTFIT>2.0.CO;2, 1978.
Hindman, E. E.: Characteristics of Supercooled Liquid Water in Clouds at Mountaintop Sites in the Colorado Rockies, J. Clim. Appl. Meteorol., 25, 1271–1279, https://doi.org/10.1175/1520-0450(1986)025<1271:COSLWI>2.0.CO;2, 1986.
Hobbs, P. V.: The Nature of Winter Clouds and Precipitation in the Cascade Mountains and their Modification by Artificial Seeding. Part I: Natural Conditions, J. Appl. Meteorol., 14, 783–804, https://doi.org/10.1175/1520-0450(1975)014<0783:TNOWCA>2.0.CO;2, 1975.
Houze, R. A. and Medina, S.: Turbulence as a Mechanism for Orographic Precipitation Enhancement, J. Atmos. Sci., 62, 3599–3623, https://doi.org/10.1175/JAS3555.1, 2005.
Ikeda, K., Rasmussen, R. M., Hall, W. D., and Thompson, G.: Observations of Freezing Drizzle in Extratropical Cyclonic Storms during IMPROVE-2, J. Atmos. Sci., 64, 3016–3043, https://doi.org/10.1175/JAS3999.1, 2007.
Jackson, R. C., McFarquhar, G. M., Stith, J., Beals, M., Shaw, R. A., Jensen, J., Fugal, J., and Korolev, A.: An Assessment of the Impact of Antishattering Tips and Artifact Removal Techniques on Cloud Ice Size Distributions Measured by the 2D Cloud Probe, J. Atmos. Ocean. Tech., 31, 2567–2590, https://doi.org/10.1175/JTECH-D-13-00239.1, 2014.
Korolev, A. V. and Mazin, I. P.: Zones of Increased and Decreased Droplet Concentration in Stratiform Clouds, J. Appl. Meteorol., 32, 760–773, https://doi.org/10.1175/1520-0450(1993)032<0760:ZOIADD>2.0.CO;2, 1993.
Korolev, A. V.: The Influence of Supersaturation Fluctuations on Droplet Size Spectra Formation, J. Atmos. Sci., 52, 3620–3634, https://doi.org/10.1175/1520-0469(1995)052<3620:TIOSFO>2.0.CO;2, 1995.
Korolev, A. V. and Isaac, G. A.: Drop Growth Due to High Supersaturation Caused by Isobaric Mixing, J. Atmos. Sci., 57, 1675–1685, https://doi.org/10.1175/1520-0469(2000)057<1675:DGDTHS>2.0.CO;2, 2000.
Korolev, A. V., Issac, G. A., Strapp, J. W., and Cober, S. G.: Observation of Drizzle at Temperatures below −20 ∘C, in: Proceedings of 40th Aerospace Sciences Meeting & Exhibit, 14 January 2002.
Lamb, D. and Verlinde, J.: Physics and Chemistry of Clouds, Cambridge University Press, 384–392, 2011.
Lance, S., Brock, C. A., Rogers, D., and Gordon, J. A.: Water droplet calibration of the Cloud Droplet Probe (CDP) and in-flight performance in liquid, ice and mixed-phase clouds during ARCPAC, Atmos. Meas. Tech., 3, 1683–1706, https://doi.org/10.5194/amt-3-1683-2010, 2010.
Lawson, R. P., Baker, B. A., Schmitt, C. G., and Jensen, T. L.: An overview of microphysical properties of Arctic clouds observed in May and July 1998 during FIRE ACE, J. Geophys. Res., 106, 14989–15014, https://doi.org/10.1029/2000JD900789, 2001.
Lawson, R. P., O'Connor, D., Zmarzly, P., Weaver, K., Baker, B., Mo, Q., and Jonsson, H.: The 2D-S (Stereo) Probe: Design and Preliminary Tests of a New Airborne, High-Speed, High-Resolution Particle Imaging Probe, J. Atmos. Ocean. Tech., 23, 1462–1477, https://doi.org/10.1175/JTECH1927.1, 2006.
Marwitz, J., Politovich, M., Bernstein, B., Ralph, F., Neiman, P., Ashenden, R., and Bresch, J.: Meteorological Conditions Associated with the ATR72 Aircraft Accident near Roselawn, Indiana, on 31 October 1994, B. Am. Meteorol. Soc., 78, 41–52, https://doi.org/10.1175/1520-0477(1997)078<0041:MCAWTA>2.0.CO;2, 1997.
Pobanz, B. M., Marwitz, J. D., and Politovich, M. K.: Conditions Associated with Large-Drop Regions, J. Appl. Meteorol., 33, 1366–1372, https://doi.org/10.1175/1520-0450(1994)033<1366:CAWLDR>2.0.CO;2, 1994.
Rasmussen, R., Politovich, M., Sand, W., Stossmeister, G., Bernstein, B., Elmore, K., Marwitz, J., McGinley, J., Smart, J., Westwater, E., Stankov, B. B., Pielke, R., Rutledge, S., Wesley, D., Powell, N., and Burrows, D.: Winter Icing and Storms Project (WISP), B. Am. Meteorol. Soc., 73, 951–974, https://doi.org/10.1175/1520-0469(2002)059<0837:FDFISS>2.0.CO;2, 1992.
Rauber, R. M.: Microphysical Structure and Evolution of a Central Sierra Nevada Orographic Cloud System, J. Appl. Meteorol., 31, 3–24, https://doi.org/10.1175/1520-0469(2002)059<0837:FDFISS>2.0.CO;2, 1992.
Rauber, R. M. and Grant, L. O.: The Characteristics and Distribution of Cloud Water over the Mountains of Northern Colorado during Wintertime Storms. Part II: Spatial Distribution and Microphysical Characteristics, J. Clim. Appl. Meteorol., 25, 489–504, https://doi.org/10.1175/1520-0450(1986)025<0489:TCADOC>2.0.CO;2, 1986.
Rauber, R. M., Olthoff, L. S., Ramamurthy, M. K., and Kunkel, K. E.: The Relative Importance of Warm Rain and Melting Processes in Freezing Precipitation Events, J. Appl. Meteorol., 39, 1185–1195, https://doi.org/10.1175/1520-0450(2000)039<1185:TRIOWR>2.0.CO;2, 2000.
Rogers, R. R. and Yau, M. K.: A Short Course in Cloud Physics, 3rd Edn., International Series in Natural Philosophy, Butterworth Heinemann, US, 121–130, 1989.
Rosenfeld, D., Chemke, R., DeMott, P., Sullivan, R. C., Rasmussen, R., McDonough, F., Comstock, J., Schmid, B., Tomlinson, J., Jonsson, H., Suski, K., Cazorla, A., and Prather, K.: The common occurrence of highly supercooled drizzle and rain near the coastal regions of the western United States, J. Geophys. Res.-Atmos., 118, 9819–9833, https://doi.org/10.1002/jgrd.50529, 2013.
Saleeby, S. M., Cotton, W. R., and Fuller, J. D.: The Cumulative Impact of Cloud Droplet Nucleating Aerosols on Orographic Snowfall in Colorado, J. Appl. Meteorol. Clim., 50, 604–625, https://doi.org/10.1175/2010JAMC2594.1, 2011.
Silber, I., Fridlind, A. M., Verlinde, J., Ackerman, A. S., Chen, Y., D. H., Bromwich, Wang, S., Cadeddu, M., and Eloranta, E. W.: Persistent Supercooled Drizzle at Temperatures Below −25∘C Observed at McMurdo Station, Antarctica, J. Geophys. Res.-Atmos., 124, 10878–10895, https://doi.org/10.1029/2019JD030882, 2019.
Tessendorf, S. A., French, J. R., Friedrich, K., Geerts, B., Rauber, R. M., Rasmussen, R. M., Xue, L., Ikeda, K., Blestrud, D. R., Kunkel, M. L., Parkinson, S., Snider, J. R., Aikins, J., Faber, S., Majewski, A., Grasmick, C., Bergmaier, P. T., Janiszeski, A., Springer, A., Weeks, C., Serke, D. J., and Bruintjes, R.: A transformational approach to winter orographic weather modification research: The SNOWIE Project, B. Am. Meteorol. Soc., 100, 71–92, https://doi.org/10.1175/BAMS-D-17-0152.1, 2018.
University of Wyoming – Research Flight Center: Flight Level Data from the University of Wyoming King Air during the Seeded and Natural Orographic Wintertime clouds-the Idaho Experiment (SNOWIE) project, https://doi.org/10.15786/M2MW9F, 2019.
Vali, G., Kelly, R. D., French, J., Haimov, S.. Leon, D., McIntosh, R. E., and Pazmany, A.: Finescale Structure and Microphysics of Coastal Stratus, J. Atmos. Sci., 55, 3540–3564, https://doi.org/10.1175/1520-0469(1998)055<3540:FSAMOC>2.0.CO;2, 1998.
Wang, J. and Geerts, B.: Identifying drizzle within marine stratus with W-band radar reflectivity, Atmos. Res., 69, 1–27, https://doi.org/10.1016/j.atmosres.2003.08.001, 2003.
Wang, Z., French, J., Vali, G., Wechsler, P., Haimov, S., Rodi, A., Deng, M., Leon, D., Snider, J., Peng, L., and Pazmany, A. L.: Single Aircraft Integration of Remote Sensing and In Situ Sampling for the Study of Cloud Microphysics and Dynamics, B. Am. Meteorol. Soc., 93, 653–668, https://doi.org/10.1175/BAMS-D-11-00044.1, 2012.
Wood, R., K. O, Bretherton, C. S., Mohrmann, J., Albrecht, B. A., Zuidema, P., Ghate, V., Schwartz, C., Eloranta, E., Glienke, S., Shaw, R. A., Fugal, J., and Minnis, P.: Ultraclean Layers and Optically Thin Clouds in the Stratocumulus-to-Cumulus Transition, Part I: Observations, J. Atmos. Sci., 75, 1631–1652, https://doi.org/10.1175/JAS-D-17-0213.1, 2018.