the Creative Commons Attribution 4.0 License.
the Creative Commons Attribution 4.0 License.
 | 28 Apr 2020
Biodegradation of phenol and catechol in cloud water: comparison to chemical oxidation in the atmospheric multiphase system
Saly Jaber
Audrey Lallement
Martine Sancelme
Martin Leremboure
Gilles Mailhot
Anne-Marie Delort
The sinks of hydrocarbons in the atmosphere are usually described by oxidation reactions in the gas and aqueous (cloud) phases. Previous lab studies suggest that in addition to chemical processes, biodegradation by bacteria might also contribute to the loss of organics in clouds; however, due to the lack of comprehensive data sets on such biodegradation processes, they are not commonly included in atmospheric models. In the current study, we measured the biodegradation rates of phenol and catechol, which are known pollutants, by one of the most active strains selected during our previous screening in clouds (Rhodococcus enclensis). For catechol, biodegradation is about 10 times faster than for phenol. The experimentally derived biodegradation rates are included in a multiphase box model to compare the chemical loss rates of phenol and catechol in both the gas and aqueous phases to their biodegradation rate in the aqueous phase under atmospheric conditions. Model results show that the degradation rates in the aqueous phase by chemical and biological processes for both compounds are similar to each other. During day time, biodegradation of catechol is even predicted to exceed the chemical activity in the aqueous phase and to represent a significant sink (17 %) of total catechol in the atmospheric multiphase system. In general, our results suggest that atmospheric multiphase models may be incomplete for highly soluble organics as biodegradation may represent an unrecognized efficient loss of such organics in cloud water.
- Article
(1473 KB) - Full-text XML
-
Supplement
(1310 KB) - BibTeX
- EndNote


Monocyclic aromatic compounds in the atmosphere are of great interest due to their influence on ozone formation (Hsieh et al., 1999) and their potential to form secondary organic aerosol (Ng et al., 2007). Their main sources include combustion processes of coal, oil and gasoline. Substituted monocyclic aromatics are semivolatile and partition between the atmospheric gas and particulate phases. Among those, phenol is of particular interest for air quality as it is considered one of the main pollutants listed by the US Environmental Protection Agency (US EPA list) since it represents a risk for both humans and the environmental biota (TOXNET Toxicology Data Network, 2019). Measurements of gas-phase mixing ratios of phenol in the atmosphere are sparse. The few available measurements show rather low values, with 4–40 ppt at the Great Dun Fell continental site (Lüttke and Levsen, 1997) and 0.4, 2.6 and 2.7 ppt at suburban, rural and urban locations (Delhomme et al., 2010), respectively. However, phenol's much higher water solubility (KH=647 M atm−1) as compared to benzene (KH∼0.2 M atm−1) leads to nanomolar levels in cloud water: 5.5–7.7 nM at the Puy de Dôme (France) (Lebedev et al., 2018), 30–95 nM at Great Dun Fell (Lüttke et al., 1997), and 37 nM in the Vosges Mountains (Levsen et al., 1993). The further hydroxylated catechol is even less volatile and more water soluble and, based on its Henry's law constant of M atm−1, expected to be nearly fully dissolved (>80 %) in cloud water, which might explain the lack of its detection in the gas phase. Phenolic compounds have been shown to comprise 2 %–4 % of the total organic particulate matter at several locations in the northeastern US (Bahadur et al., 2010). In the same study, a strong correlation between seawater-derived organics and phenolic compounds was found, which suggests direct sources in addition to hydroxylation of the unsubstituted aromatics.
The oxidation of phenol by •OH radicals leads to catechol in the gas (Xu and Wang, 2013) and aqueous (Hoffmann et al., 2018) phases and at the gas–aqueous interface (Pillar et al., 2014); further •OH oxidation of catechol leads to ring-opening products. A recent multiphase model study suggests that the main aqueous-phase loss processes of aromatics with two hydroxyl groups include not only •OH and reactions in clouds, but also reactions with O3 and (Hoffmann et al., 2018). The nitration of phenols represents the major atmospheric source of nitrophenols in the gas phase (Yuan et al., 2016) and aqueous phase (Harrison et al., 2005; Vione et al., 2003). Nitrophenols can be phytotoxic (Harrison et al., 2005) and also contribute to light absorption of atmospheric particles (“brown carbon”; Xie et al., 2017). They have been found in atmospheric particles (Chow et al., 2016) and in the aqueous phases of clouds, fog and lakes (Lebedev et al., 2018). In addition, phenols add to secondary organic aerosol formation in the aqueous phase by oligomerization reactions (Yu et al., 2014).
Not only chemical reactions, but also microbial processes in the aqueous phase of clouds, act as sinks for organic compounds (Delort et al., 2010). Biodegradation rates for several bacteria strains and aliphatic mono- and di-carboxylic acids/carboxylates as well as for formaldehyde and methanol (Ariya et al., 2002; Fankhauser et al., 2019; Husárová et al., 2011; Vaïtilingom et al., 2010, 2011, 2013) have been measured in laboratory experiments. Comparison of such rates to those of chemical radical (•OH or ) reactions in the aqueous phase show comparable rates of chemical and microbial processes under atmospherically relevant conditions. Such a comparison has not been performed yet for phenolic compounds in the aqueous phase due to the lack of data on their biodegradation rates.
Our previous metagenomic and metatranscriptomic study, directly performed on cloud water samples collected at the Puy de Dôme station in France, showed convincing evidence of the in-cloud expression of gene coding for enzymes involved in phenol biodegradation (Lallement et al., 2018b). We found transcripts for phenol monooxygenases and phenol hydroxylases responsible for the hydroxylation of phenol into catechol and transcripts for catechol 1,2-dioxygenases leading to the opening of the aromatic ring. These genes originated from the genera Acinetobacter and Pseudomonas belonging to Gamma-proteobacteria, a major class of bacteria in clouds (Lallement et al., 2018b). In the same study, a large screening of bacteria in parallel isolated from cloud water samples (Pseudomonas spp., Rhodococcus spp. and strains from the Moraxellaceae family) showed that 93 % of the strains could biodegrade phenol. Altogether, these results indicate a high potential of cloud microorganisms to biotransform phenol and catechol in cloud water.
In the current study, we designed lab experiments in microcosms mimicking cloud water conditions in terms of light, bacteria and temperature. Under these conditions, we measured the biodegradation rates of phenol and catechol by Rhodococcus enclensis PDD-23b-28, isolated from cloud water and one of the most efficient strains able to degrade phenol during our previous screening (Lallement et al., 2018b). The derived biodegradation rates for Rhodococcus, together with literature data on phenol and catechol biodegradation by Pseudomonas, were implemented in a box model to compare chemical and microbial degradation rates in the atmospheric multiphase system.
2.1 Experiments in microcosms
The transformation rates of phenol and catechol were measured in microcosms mimicking cloud water conditions at the Puy de Dôme station (1465 m). Solar light was fitted to that measured directly under cloudy conditions (Fig. S1 in the Supplement); 17 ∘C is the average temperature in the summer at this location. Rhodococcus bacterial strains belong to the most abundant bacteria in cloud waters and are very active phenol biodegraders (Lallement et al., 2018b; Vaïtilingom et al., 2012). Fe(EDDS) was used to mimic organic ligands of Fe(III), in particular siderophores (Vinatier et al., 2016). In addition, this complex is stable at the working pH of 6.0 (Li et al., 2010).
2.1.1 Cell preparation for further incubations
Rhodococcus enclensis PDD-23b-28 was grown in 25 mL of R2A medium for 48 h at 17 ∘C, 130 rpm (Reasoner and Geldreich, 1985). Then cultures were centrifuged at 4000 rpm for 15 min at 4 ∘C. Bacteria pellets were rinsed first with 5 mL of NaCl 0.8 % and after with Volvic® mineral water (pH =7.0), previously sterilized by filtration under sterile conditions using a 0.22 µm PES filter. The bacterial cell concentration was estimated by optical density at 600 nm using a UV3100 spectrophotometer to obtain a concentration close to 109 cell mL−1. Finally, the concentration of cells was precisely determined by counting the colonies on R2A Petri dishes.
2.1.2 Phenol transformation
Biotransformation. Rhodococcus enclensis PDD-23b-28 cells were re-suspended in 5 mL of 0.1 mM phenol (Fluka >99 %) solution, prepared in Volvic® mineral water, and incubated at 17 ∘C, 130 rpm agitation for 48 h in the dark; 0.5 mL of this culture was incubated in 25 mL of the same medium and under the same conditions. In order to determine the concentration, the optical density for each strain was measured at 600 nm during the experiment. The strain concentration was ∼109 cells mL−1. The concentration ratio of bacterial cells to phenol was kept similar to that as measured in cloud water (Lallement et al., 2018b). We showed in the past that in repeated experiments identical cell ∕ substrate ratios lead to the same biodegradation rates (Vaïtilingom et al., 2010).
A control experiment was performed by incubating phenol without bacteria; phenol concentration remained stable over time (0.1 mM of phenol was obtained at the end of the experiment). For phenol quantification over time in the incubation experiments, 600 µL samples were centrifuged at 12 500 rpm for 3 min and the supernatants were kept frozen until HPLC analysis. Complementary experiments were also performed consisting of incubation of the cells and 0.1 mM phenol in the presence of light without Fe(EDDS).
Phototransformation. A 0.1 mM phenol solution (Fluka >99 %), prepared in Volvic® mineral water, was incubated at 17 ∘C, 130 rpm agitation for 48 h in photo-bioreactors designed by Vaïtilingom et al. (2011). OH radicals were generated by photolysis adding 0.5 mM Fe(EDDS) complex solution. The Fe(EDDS) solution (iron complex with 1 : 1 stoichiometry) was prepared from iron(III) chloride hexahydrate (FeCl3, 6H2O; Sigma-Aldrich) and (S,S)-ethylenediamine-N,N'-disuccinic acid trisodium salt (EDDS, 35 % in water). A complementary experiment was also performed consisting of incubation of a 0.1 mM phenol solution in the presence of light without an Fe(EDDS) complex.
The experimental conditions of the irradiation experiments (Sylvania Reptistar lamps; 15 W; 6500 K) are described by Wirgot et al. (2017). They mimic the solar light measured under cloudy conditions at the Puy de Dôme station (Fig. S1). The mechanism of the •OH radical production under light irradiation is as follows (Brigante and Mailhot, 2015).
Using the specifications of the lamp, an overall rate constant of the photolysis of the Fe(III)-EDDS complex s−1 was calculated (Sect. S2).
Assuming steady-state conditions for •OH at the beginning of the experiments (i.e., equal •OH production and loss rates), an •OH concentration of M can be calculated. This concentration is at the upper limit of •OH concentrations as derived from various measurements and model studies (Arakaki et al., 2013; Lallement et al., 2018a).
Photo-biotransformation. The protocols for biotransformation and photo-transformation of phenol in the presence of Fe(EDDS) as described above were combined.
2.1.3 Catechol transformation
Biotransformation. As for phenol, Rhodococcus enclensis PDD-23b-28 cells were re-suspended in 5 mL of 0.1 mM catechol (Fluka >99 %) solution, prepared in Volvic® mineral water, and incubated at 17 ∘C, 130 rpm agitation for 48 h in the dark. Four experiments were carried out with different cell concentrations (109, 108, 107 and 106 cell mL−1). For catechol quantification over time in the incubation experiments, 600 µL samples were centrifuged at 12500 rpm for 3 min and the supernatants were kept frozen until LC-HRMS analysis.
2.2 Analytical methods
2.2.1 Phenol HPLC analysis
Before analysis, all samples were filtered on an H-PTFE filter (pore size at 0.2 µm and diameter of 13 mm from Macherey-Nagel, Germany). Phenol detection was done on an HPLC VWR Hitachi Chromaster apparatus fitted with a DAD detector and driven by Chromaster software. Isocratic mode was used with a reverse-phase end-capped column (LiChrospher® RP-18, 150 mm × 4.6 mm, 5 µm, 100 Å). The mobile phase was composed of acetonitrile and filtered water (Durapore® membrane filters, 0.45 µm HVLP type, Ireland) in 25∕75 ratio with a flow rate at 1.2 mL min−1. Sample injection volume was 50 µL, spectra were recorded at 272 nm and the runtime was 10 min.
2.2.2 Catechol LC-HRMS analyses
LC-HRMS analyses of catechol were performed using an RSLCnano UltiMate™ 3000 (Thermo Scientific™) UHPLC equipped with an Q-Exactive™ Plus Hybrid Quadrupole-Orbitrap™ Mass Spectrometer (Thermo Scientific™) ionization chamber. The same conditions were used for analyzing EDDS. Chromatographic separation of the analytes was performed on a Kinetex® EVO C18 (1.7 µm, 100 mm × 2.1 mm, Phenomenex) column with a column temperature of 30 ∘C. The mobile phases consisted of 0.1 % formic acid and water (A) and 0.1 % formic acid and acetonitrile (B). A three-step linear gradient of 95 % A and 5 % B in 7.5 min, 1 % A and 99 % B in 1 min, and 95 % A and 5 % B in 2.5 min was used throughout the analysis. This device was associated with a Thermo Scientific™ Dionex™ UltiMate™ DAD 3000 detector (200–400 nm).
The Q-Exactive ion source was equipped with an electrospray ionization (ESI) and the Q-Orbitrap™. The Q-Exactive was operated in either full MS-SIM; the full MS scan range was set from m∕z 80 to 1200. The mass resolution was set to 70 000 fwhm, and the instrument was tuned for maximum ion throughput. The AGC (automatic gain control) target or the number of ions to fill the C-Trap was set to 106 with a maximum injection time (IT) of 50 ms. The C-Trap is used to store ions and then transfer them to the Orbitrap mass analyzer. Other Q-Exactive generic parameters were gas (N2) flow rate set at 10 a.u. (arbitrary units), sheath gas (N2) flow rate set at 50 a.u., sweep gas flow rate set at 60 a.u., spray voltage at 3.2 kV in positive mode and 3 kV in negative mode, capillary temperature at 320 ∘C, and heater temperature at 400 ∘C. Analysis and visualization of the data set were performed using Xcalibur™ 2.2 software from Thermo Scientific™.
2.2.3 Derivation of phenol and catechol degradation rates
The degradation rates of phenol and catechol were calculated after normalization based on the ratio of the concentration at time t (C) and the concentration at time t=0 (C0). The pseudo-first-order rate constants (kphenol and kcatechol) were determined using Eq. (1):
2.3 Description of the multiphase box model
2.3.1 Chemical and biological processes
We use a multiphase box model to compare the loss rates of phenol and catechol in the gas and aqueous phases by radicals (•OH, ) in both phases and bacteria only in the aqueous phase over a processing time of 15 min to simulate chemical and biological processing in a single cloud cycle. For each set of processes (•OH/, phenol/catechol), the three terms in the following equation are calculated and the relative importance of each process is determined:
where [Aromatic] denotes the phenol or catechol concentration, [Radical] the •OH or concentration in the gas or aqueous phase, respectively, and kchem,gas, kchem,aq and kbact are the rate constants as listed in Table S1 in the Supplement. The units of the aqueous-phase processes are converted into the same units as the gas-phase processes (molec cm−3 s−1), with LWC (liquid water content L(aq) L(gas)−1), molecules mol−1 (Avogadro constant) and 0.001 to convert from L to cm3.
The pH value of cloud water is assumed to be constant (pH =4) to represent conditions of a continental, moderately polluted cloud. It should be pointed out that the choice of the pH value in the simulations does not affect the results for a wide range of pH values (), as this is typical of clouds influenced by marine and continental air masses (Deguillaume et al., 2014). None of the parameters in Eq. (2) is pH dependent within the range relevant for cloud water (cf. Sect. S3.3). In addition to the data for Rhodococcus obtained in the current study, we also include literature data on the biodegradation of phenol and catechol by Pseudonomas putida and Pseudonomas aeruginosa (Sect. 3.2), which are usually more abundant in the atmosphere than Rhodococcus.
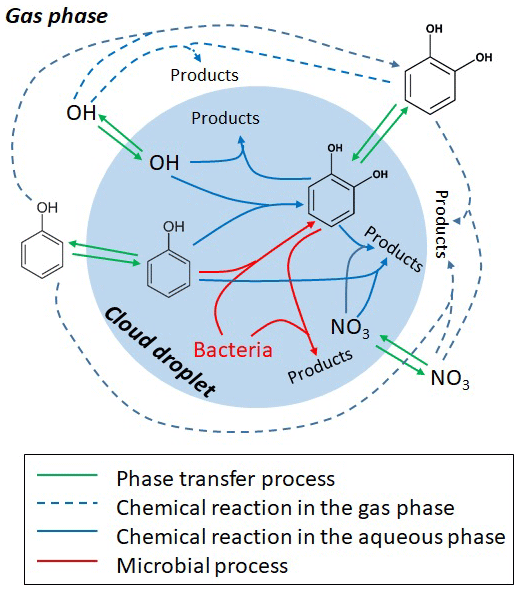
The processes considered in the gas and aqueous phases are summarized in Table S1 and Fig. 1. In both phases, the reaction of phenol with •OH is assumed to yield 50 % catechol; other products of these reactions are not further tracked in the model. The reaction of phenol with results in nitrophenols (Bolzacchini et al., 2001; Harrison et al., 2005); the loss of these products is not explicitly included in the model either as we solely focus on the comparison of the degradation rates. Recently, it was suggested that the reactions with ozone and might represent major sinks (∼50 % and ∼20 %, respectively) of catechol in the aqueous phase (Hoffmann et al., 2018). However, the only available rate constant for the ozone reaction was derived at pH =1.5 by Gurol and Nekouinaini (1984), who postulate that at higher pH (∼5–6), the reaction with •OH likely dominates the overall loss. Therefore, in our base case simulations, we limit the reactions of phenol and catechol to the reactions with •OH and radicals. Sensitivity studies including the and O3 reactions are discussed in the Supplement (Sect. S4).
Microbial activity in the aqueous phase by Rhodococcus and Pseudonomas is usually expressed as rates (mol per cell per hour) (Vaïtilingom et al., 2013). We converted these experimentally derived rates into “rate constants” (liters per cell per hour) in order to adjust them to the substrate and cell concentrations as assumed in the aqueous phase in the model (Sect. S3.2), equivalent to the treatment of chemical processes. In order to account for the numerous additional loss processes of •OH(aq) and (aq) in clouds, sinks for both radicals have been added: a general rate constant of •OH with total water-soluble organic carbon (WSOC) ( M−1 s−1) lumps the main loss processes of •OH in cloud water (Arakaki et al., 2013); assuming an average WSOC concentration of 5 mM results in a first-order loss process of s−1. The main losses of (aq) are likely reactions with halides (Herrmann et al., 2000); as a proxy, we assume here a first-order loss process ( s−1), reflecting the sum of the major (aq) sinks. These lumped sink processes lead to aqueous-phase radical concentrations of [•OH(aq)] M and [(aq)] M, respectively, in agreement with predictions from previous model studies (Ervens et al., 2003). Kinetic-phase transfer processes between the two phases are described for the radicals and aromatics based on the resistance model by Schwartz (1986); all phase transfer parameters (Henry's law constants KH, mass accommodation coefficients α and gas-phase diffusion coefficients Dg) are summarized in Table S1.
2.3.2 Initial concentrations
Initial concentrations of 4 ppt catechol and phenol are assumed in the gas phase that partition between both phases and are chemically consumed over the course of the simulation (15 min). These initial mixing ratios correspond to equivalent aerosol mass concentrations on the order of several 10s ng m−3, in agreement with measurements of phenol compounds in aerosol samples (Bahadur et al., 2010; Delhomme et al., 2010) and nanomolar concentrations in cloud water (Lebedev et al., 2018). It should be noted that the assumption about the initial aromatic concentrations does not affect any conclusions of our model studies, as we compare the loss fluxes of all processes in a relative sense. Two simulations are performed for each set of conditions to simulate day- or night-time conditions, respectively, that only differ by the radical concentrations ( cm−3; cm−3) that are constant throughout the simulations. Two types of bacteria are assumed (Rhodococcus and Pseudomonas). They have been found to contribute 3.6 % and 19.5 % to the total number concentration of bacteria cells isolated from cloud waters and present in our lab collection. Using a typical cell concentration in cloud water of 6.8×10⁷ cell L−1 (Amato et al., 2017), the assumed bacteria cell concentrations in the model are 2.7×10⁶ cell L−1 and 1.3×10⁷ cell L−1 for Rhodococcus and Pseudomonas, respectively. The simulations are performed for the conditions for monodisperse droplets with a diameter of 20 µm. The drop number concentration of 220 cm−3 results in a total liquid water content of 0.9 g m−3. These parameters do not change over the course of the simulation.
3.1 Incubations in microcosms
The transformation rates described in this work were measured at pH =7.0 as observed at the Puy de Dome (, Deguillaume et al., 2014), but we expect that our results can be extrapolated to the full range of pH values as encountered in clouds. In our previous studies, we have demonstrated that pH variation has a low impact on microbial biodegradation ability, as was shown in the case of carboxylic acids by 17 strains isolated from clouds (Vaïtilingom et al., 2011) or phenol by Pseudomonas aeruginosa (Razika et al., 2010). This insensitivity to the solution pH can be explained by the fact that the biodegradation experiments are performed with bacteria and not purified enzymes. The enzymatic activities take place inside the cell and are not impacted by the external pH. It is well known that bacteria are able to regulate their internal pH (which is usually in the range of when exposed to external pHs between 4 and 8). Yeasts, molds or acidophilic and alcalinophilic bacteria are even active in a range of pH of (Beales, 2004). The mechanisms involved in the intracellular pH regulation of microorganisms facing acid stress are very complex and have been reviewed recently (Guan and Liu, 2020).
3.1.1 Transformation of phenol
Abiotic degradation. In the presence of light and Fe(EDDS), phenol concentration decreases with time in the first 2 h of the experiments and then remains rather stable (Fig. 2). In parallel, catechol, the first intermediate of phenol transformation, is formed (Fig. S2a) and accumulates over time. Catechol concentration is quite low because it is further oxidized over time to yield CO2. Phenol degradation slows down after 2 h due to the lack of OH radical production resulting from the destruction of the EDDS ligand with time (Fig. S2b). Phenol is not directly photolyzed in the presence of light, while it is oxidized in the presence of Fe(EDDS) complex (Figs. 2 and S2).
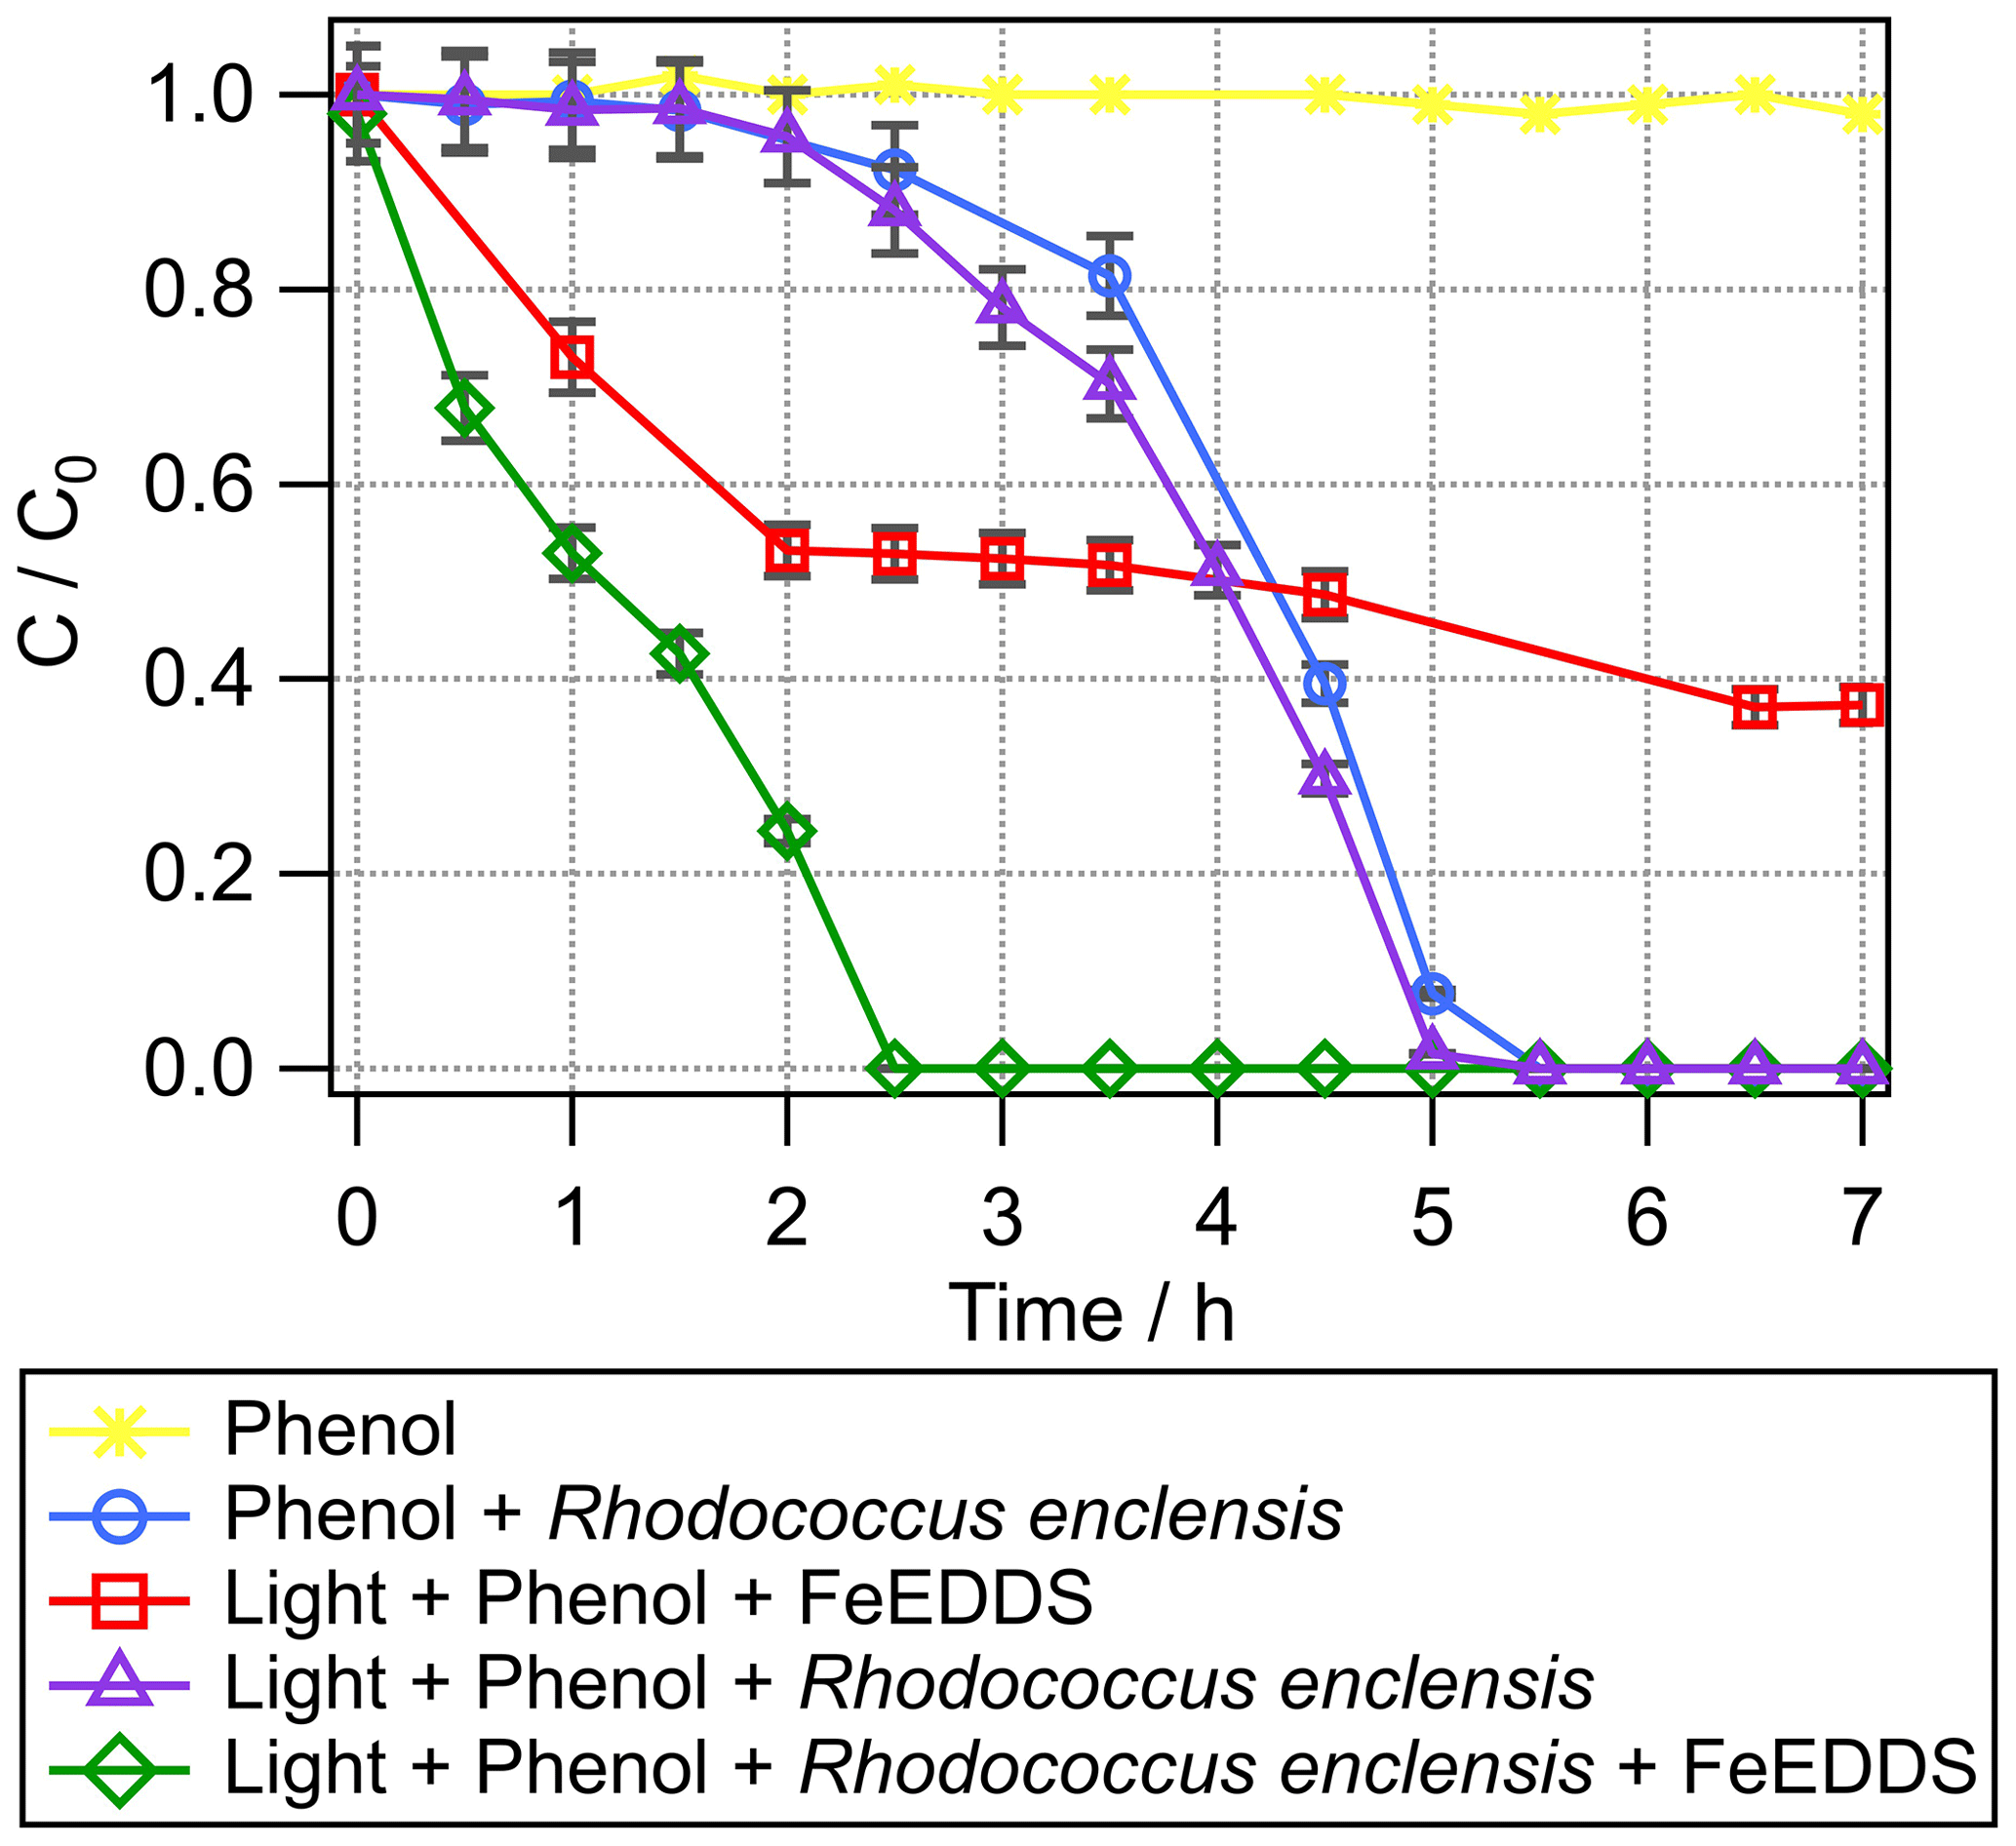
Figure 2Transformation of phenol with time under different conditions. Phenol + light + Fe(EDDS) (red squares), phenol + R. enclensis + dark (blue circles), phenol + R. enclensis + light (purple triangles), and phenol + R. enclensis + light + Fe(EDDS) (green line). Rhodococcus enclensis cell concentration was 109 cells mL−1.
Biotic degradation. In the dark, phenol is biotransformed by Rhodococcus enclensis cells (Fig. 2) and completely degraded after 5.5 h. A lag time of about 2.5 h is observed, during which phenol is degraded extremely slowly. This is a well-known phenomenon under lab conditions corresponding to the induction period of the gene expression (Al-Khalid and El-Naas, 2012). Catechol is slowly formed in parallel until t=3.5 h and is further biodegraded when bacteria have started to be more active (Fig. S2a).
Abiotic and biotic combined transformation. When light (in the absence of Fe(EDDS)) is present, no major change is observed for the biodegradation of phenol by Rhodococcus enclensis (Fig. 2); the lag time is still observed. When light and Fe(EDDS) are present, the lag time is no longer observed and the degradation of phenol is completed within 2.5 h instead of 5.5 h when the bacteria are in the dark. The microbial activity compensates for the limitation of radical processes due to the destruction of the Fe(EDDS) complex (after 2 h). In parallel, the production of catechol is increased compared to biotic or abiotic conditions alone (Fig. S2a). Catechol accumulates over approximately 3 h, after which it decreases. As observed previously, this decrease is likely a result of the bacterial activity.
Table 1Transformation rates (10−5 mol L−1 h−1) of catechol and phenol under abiotic and biotic conditions. The rates were measured from three biological or chemical replicates (independent experiments), respectively. They were derived based on the steepest slopes in Fig. 2.

Comparison of the rates of phenol transformation under the different conditions. If we consider the numerous uncertainties, the rates of transformation under abiotic, biotic and combined conditions are within the same order of magnitude, namely mol L−1 h−1 (Table 1). Biotic and combined conditions can be further compared in more detail by normalizing the transformation rates with the exact number of cells present in the different incubations (three biological replicates for each condition). Note that the number of cells varied from 4×10⁸ to 8×10⁹ cell mL−1. After normalisation to the cell concentration used in the individual experiments, it is evident that the rates of phenol transformation are very close to each other and in the range of 10−16 mol per cell per hour (Table 2).
Table 2Biodegradation rates (mol per cell per hour) of catechol and phenol of Rhodococcus and Pseudomonas strains normalized to the exact number of cells present in the incubations. The calculations of biodegradation rates for the Pseudomonas strains are detailed in Sect. S1.

a Not determined. b This rate was estimated based on the value for phenol (Razika et al., 2010) and the ratio (∼12) for phenol/catechol biodegradation rates as determined for
Pseudomonas putida by Hinteregger et al. (1992) (cf. also Sect. S1 in the Supplement).
3.1.2 Biotransformation of catechol
As catechol is an intermediate of phenol transformation, we measured its biotransformation rate by Rhodococcus enclensis under dark conditions. When the cell concentration was 108 or 109 cell mL−1, the catechol biodegradation was too fast to be detected within the time resolution of the experiments (Fig. 3). We performed various experiments with reduced cell concentrations, from 107 to 106 cell mL−1 (Fig. 3). Finally, we used the results corresponding to 107 cell mL−1 to derive the initial rate of catechol biotransformation. It was estimated as mol per cell per hour. This value is 8.5 times higher than the biodegradation rate of phenol and was used in the model (Sect. 3.2).
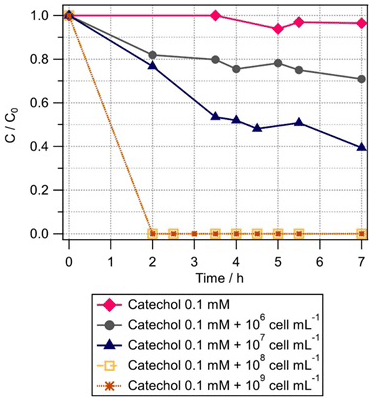
Figure 3Biotransformation of catechol with time by different concentrations of Rhodococcus enclensis: 109 cell mL−1 (brown stars), 108 cell mL−1 (brown squares), 107 cell mL−1 (blue triangles), and 106 cell mL−1 (black circles). C: phenol concentration at time t; C0: initial phenol concentration. C∕C0 was extrapolated from the ratio of the integrals of the catechol signal detected in mass spectra at time t=0 and t, respectively. Initial catechol concentration was 0.1 mM.
Straube (1987) showed that the activity of the catechol-1, 2-dioxygenase of Rhodococcus sp. P1 was higher than that of its phenol hydroxylase. This trend is in agreement with our results, as we know from the genome sequencing of our Rhodococcus enclensis strain that a catechol-1,2-dioxygenase is involved (and not a catechol-2,3-dioxygenase) (Lallement et al., 2017). As opposed to the results for phenol in Fig. 2, it can be seen in Fig. 3 that no lag time is observed for catechol biodegradation. This suggests that the first step of oxidation of phenol to catechol by a phenol hydroxylase might be a limiting step as it needs to be induced, while the second step – corresponding to the opening of the ring cycle by a catechol-dioxygenase – is not induced and, thus, is faster.
3.2 Comparison of biodegradation rates by Rhodococcus to literature data for Pseudomonas strains
As we previously have shown that Pseudomonas is one of the most dominant and active genera in cloud waters (Amato et al., 2019) and that these strains are very active for phenol biodegradation (Lallement et al., 2018b, and references therein), we compare in the following biodegradation rates of Pseudomonas from the literature (Table 2) to the data for Rhodococcus derived in the current study (Sect. 4). These rates differ among Pseudomonas strains: for Pseudomonas putida EKII a value of mol per cell per hour was found (Hinteregger et al., 1992), while it was mol per cell per hour for Pseudomonas aeruginosa (Razika et al., 2010). These values are both on the same order of magnitude as the one measured here for Rhodococcus enclensis PDD-23b-28. Finally, we used an average value ( mol per cell per hour) for Pseudomonas strains to derive the rates used in the model (Sect. S3.2).
As in the case of phenol, we also calculated catechol biodegradation rates with Pseudomonas strains based on literature data (Table 2). Values are only available for Pseudomonas putida EKII (Hinteregger et al., 1992) and show a biodegradation rate that is 12 times higher compared to that of phenol biodegradation. This confirms that catechol dioxygenases are much more active than phenol hydroxylases, as observed for Rhodococcus enclensis. Similarly to phenol, catechol biodegradation rates for Pseudomonas are within the same order of magnitude as those for Rhodococcus. The same ratio (∼12) as for the Pseudomonas putida was applied to estimate the biodegradation rate of catechol by Pseudomonas aeruginosa, for which only the rate for phenol was experimentally determined by Razika et al. (2010).
3.3 Model results
Model results are expressed as the relative contributions of each loss pathway in the gas and aqueous phases; they are summarized in Table S4. Both during day and night, the gas-phase reactions of •OH and dominate the loss of phenol by >99 % (light red and blue bars in Fig. 4a and b, respectively). The contributions of Pseudomonas to the phenol loss are approximately a factor of 3 higher than those of Rhodococcus, in accordance with their higher cell concentration and comparable microbial activity (Table S3). However, during day time, the contribution of bacteria to the total loss in the aqueous phase is about 1 order of magnitude smaller than that of the chemical (•OH(aq)) reactions; during night time, this difference is even larger and the (aq) reactions dominate by far (factor >100) the loss in the aqueous phase (Fig. 4b).
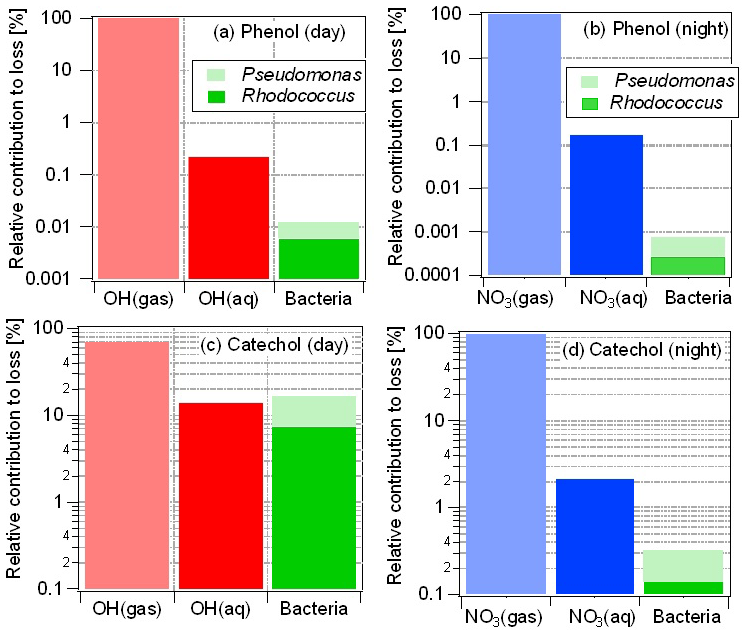
Figure 4Relative contributions of multiphase processes to total loss of phenol (a, b) and catechol (c, d) during day (a, c) and night (b, d) time. Loss by bacteria processes only occurs in the aqueous phase. Note that the ordinate is shown as a logarithmic scale which might falsely lead to the impression of larger contributions of Rhodococcus compared to Pseudomonas.
While the microbial activity is the same during day and night time (i.e., there were no significant differences in experiments with and without light, respectively; Fig. 2), the night-time (aq) concentration is about 10 times higher ( M) than that of •OH(aq) ( M) during the day, and the chemical rate constants also differ by a factor of 4 ( M−1 s−1; M−1 s−1, Table S1). These differences in radical concentrations and rate constants lead to much higher radical reaction rates during night than during the day and, thus, to a relatively lower importance of microbial activity during night time. Overall, the loss in the aqueous phase by both chemical and microbial processes contributes ∼0.1 % to the total loss of phenol during night time.
The catechol fraction dissolved in the aqueous phase is much greater (≥85 %) as its Henry's law constant is about 1000 times larger than that of phenol (Table S1), of which only ∼2 % partitions to the aqueous phase. Its enhanced solubility leads to a more important role of aqueous-phase processes. During day time, the loss by aqueous-phase processes (chemical and microbial) is >30 % for catechol (Fig. 4c), with contributions by •OH(aq), Pseudomonas and Rhodococcus of 14 %, 10 % and 7 %, respectively, when •OH as the only oxidant for the phenols in the aqueous phase is considered. Thus, for this case, the total microbial activity in the aqueous phase exceeds that of the chemical reactions (Fig. 4c) and contributes up to 17 % to the total loss of catechol in the multiphase system. The relatively higher gas-phase rate constants and concentrations as compared to the corresponding values for •OH during day time are reflected in the much higher contributions by the gas-phase reactions to catechol loss during night (>97 %) than during day time (Fig. 4d).
The model results in Fig. 4 imply that the only chemical loss reactions of phenol and catechol are the reactions with the •OH and radicals. In agreement with findings from a recent multiphase modeling study that discussed possible contributions of aqueous-phase reactions with additional oxidants (O3 and ) (Hoffmann et al., 2018), we show that including these reactions might add significant sinks for catechol (Sect. S4). However, we caution that these results of the model sensitivity study including the ozone and reactions likely represent an upper estimate. The rate constant used in the model was determined at pH =1.5. In the original study, a decreasing trend with increasing pH was suggested; however, the exact pH dependence was not given. Thus, the prediction shown in Fig. S3 might not correspond to the moderate pH values as encountered in clouds and thus might be an overestimate of the role of the ozone reaction.
Both experimental and modeling approaches show that, in the water phase of clouds, phenol and catechol degradation by microbial and chemical •OH(aq) processes may be within 1 order of magnitude. When the complete multiphase system is taken into account, phenol chemical transformation is largely dominant in the gas phase, whereas the more water-soluble catechol is efficiently biodegraded in the aqueous phase.
Our estimates are only based on a limited number of cloud microorganisms (Pseudomonas and Rhodococcus). These microorganisms represent strains which are very efficient, and previous works showed that these genera are active in clouds (Amato et al., 2017; Lallement et al., 2018b). However, they only comprise a fraction of the total microfora, i.e., about 22 % of all prokaryotes in clouds. Even if other bacterial genera are less metabolically active, their combined metabolic activity might contribute substantially to the total biodegradation of phenols (and likely other water-soluble organics) in clouds. In addition, other microorganisms could be active as well, such as fungi and yeasts. The relative importance of radical chemistry compared to biodegradation will also depend on the radical concentrations in both phases which, in turn, are a function of numerous factors such as air mass characteristics, pollution levels that affect OH concentrations and of microphysical cloud properties (e.g., drop diameters, liquid water content) (Ervens et al., 2014). In general, the importance of aqueous-phase processes increases with increasing solubility (Henry's law constants). Our recent FT-ICR-MS analyses of cloud water samples have shown that about 50 % of ∼2100 identified compounds were utilized by cloud microorganisms (Bianco et al., 2019). Thus, microbial processes in cloud water may represent efficient sinks for numerous organics and might even result in products different from those of chemical reactions (Husárová et al., 2011). Thus, atmospheric models may be incomplete in describing the loss of some organic compounds and should be complemented by microbial processes in order to give a complete representation of the atmospheric multiphase system. While it has been recognized for a long time that microbial remediation in the environment is a common process (Kumar et al., 2011; Watanabe, 2001), we suggest that the atmosphere represents an additional medium for such processes.
The newly derived biodegradation data for Rhodococcus with phenol and catechol were implemented in a multiphase box model, together with additional literature data for Pseudomonas degradation of the two aromatics and their chemical radical processes in the gas and aqueous phases. Model results reveal that for the chosen model conditions ( cm−3; cm−3; M; M; [Bacteria cell] cell mL−1) the chemical and microbial activities in the aqueous phase are comparable. However, for catechol the loss processes in the aqueous phase are relatively more important (∼30 % of total loss) than for phenol (0.1 % of total loss) due to its much greater water solubility ( M atm−1; M atm−1). It can be concluded that under some atmospheric conditions, the loss of highly soluble organics may be underestimated by chemical reactions only as the biodegradation of these organics by bacteria (and possibly other microorganisms) could represent additional sinks resulting in different products. Our model approach is highly simplified and limited in terms of biological, chemical and cloud microphysical conditions. More comprehensive experimental and model studies are needed to explore parameter spaces for relevant cloud water constituents (highly water soluble, relatively low chemical reactivity) in order to better quantify the role of bacteria and other microorganisms in clouds as active entities that take part in the conversion of organics in the atmospheric multiphase system.
All experimental and additional model data can be obtained from the authors upon request.
The supplement related to this article is available online at: https://doi.org/10.5194/acp-20-4987-2020-supplement.
AMD and GM designed the experiments in microcosms. SJ, AL, MS and ML performed the experiments. BE performed the model simulations. BE and AMD wrote the manuscript.
The authors declare that they have no conflict of interest.
This research has been supported by a school grant to the first author from the Walid Joumblatt Foundation for University Studies (WJF), Beirut, Lebanon, and the French National Research Agency (ANR) (grant nos. ANR-17-MPGA-0013 and ANR-13-BS06-004-01).
This paper was edited by Ryan Sullivan and reviewed by two anonymous referees.
Al-Khalid, T. and El-Naas, M. H.: Aerobic Biodegradation of Phenols: A Comprehensive Review, Crit. Rev. Environ. Sci. Technol., 42, 1631–1690, https://doi.org/10.1080/10643389.2011.569872, 2012.
Amato, P., Joly, M., Besaury, L., Oudart, A., Taib, N., Moné, A. I., Deguillaume, L., Delort, A., and Debroas, D.: Active microorganisms thrive among extremely diverse communities in cloud water, PLOS One, 12, e0182869, https://doi.org/10.1371/journal.pone.0182869, 2017.
Amato, P., Besaury, L., Joly, M., Penaud, B., Deguillaume, L., and Delort, A.-M.: Metatranscriptomic exploration of microbial functioning in clouds, Sci. Rep., 9, 4383, https://doi.org/10.1038/s41598-019-41032-4, 2019.
Arakaki, T., Anastasio, C., Kuroki, Y., Nakajima, H., Okada, K., Kotani, Y., Handa, D., Azechi, S., Kimura, T., Tsuhako, A., and Miyagi, Y.: A general scavenging rate constant for reaction of hydroxyl radical with organic carbon in atmospheric waters, Environ. Sci. Technol., 47, 8196–8203, https://doi.org/10.1021/es401927b, 2013.
Ariya, P. A., Nepotchatykh, O., Ignatova, O., and Amyot, M.: Microbiological degradation of atmospheric organic compounds, Geophys. Res. Lett., 29, 2077, https://doi.org/10.1029/2002GL015637, 2002.
Bahadur, R., Uplinger, T., Russell, L. M., Sive, B. C., Cliff, S. S., Millet, D. B., Goldstein, A., and Bates, T. S.: Phenol Groups in Northeastern U.S. Submicrometer Aerosol Particles Produced from Seawater Sources, Environ. Sci. Technol., 44, 2542–2548, https://doi.org/10.1021/es9032277, 2010.
Beales, N.: Adaptation of Microorganisms to Cold Temperatures, Weak Acid Preservatives, Low pH, and Osmotic Stress: A Review, Compr. Rev. Food Sci. F., 3, 1–20, https://doi.org/10.1111/j.1541-4337.2004.tb00057.x, 2004.
Bianco, A., Deguillaume, L., Chaumerliac, N., Vaïtilingom, M., Wang, M., Delort, A.-M., and Bridoux, M. C.: Effect of endogenous microbiota on the molecular composition of cloud water: a study by Fourier-transform ion cyclotron resonance mass spectrometry (FT-ICR MS), Sci. Rep., 9, 7663, https://doi.org/10.1038/s41598-019-44149-8, 2019.
Bolzacchini, E., Bruschi, M., Hjorth, J., Meinardi, S., Orlandi, M., Rindone, B., and Rosenbohm, E.: Gas-Phase Reaction of Phenol with NO3, Environ. Sci. Technol., 35, 1791–1797, https://doi.org/10.1021/es001290m, 2001.
Brigante, M. and Mailhot, G.: Chapter 9: Phototransformation of Organic Compounds Induced by Iron Species, in: Surface Water Photochemistry, edited by: Calza, P. and Vione, D., Royal Society of Chemistry, Cambridge, UK, 167–195, 2015.
Chow, K. S., Huang, X. H. H., and Yu, J. Z.: Quantification of nitroaromatic compounds in atmospheric fine particulate matter in Hong Kong over 3 years: field measurement evidence for secondary formation derived from biomass burning emissions, Environ. Chem., 13, 665–673, 2016.
Deguillaume, L., Charbouillot, T., Joly, M., Vaïtilingom, M., Parazols, M., Marinoni, A., Amato, P., Delort, A.-M., Vinatier, V., Flossmann, A., Chaumerliac, N., Pichon, J. M., Houdier, S., Laj, P., Sellegri, K., Colomb, A., Brigante, M., and Mailhot, G.: Classification of clouds sampled at the puy de Dôme (France) based on 10 yr of monitoring of their physicochemical properties, Atmos. Chem. Phys., 14, 1485–1506, https://doi.org/10.5194/acp-14-1485-2014, 2014.
Delhomme, O., Morville, S., and Millet, M.: Seasonal and diurnal variations of atmospheric concentrations of phenols and nitrophenols measured in the Strasbourg area, France, Atmos. Pollut. Res., 1, 16–22, https://doi.org/10.5094/APR.2010.003, 2010.
Delort, A.-M., Vaïtilingom, M., Amato, P., Sancelme, M., Parazols, M., Mailhot, G., Laj, P., and Deguillaume, L.: A short overview of the microbial population in clouds: Potential roles in atmospheric chemistry and nucleation processes, Atmos. Res., 98, 249–260, https://doi.org/10.1016/j.atmosres.2010.07.004, 2010.
Ervens, B., George, C., Williams, J. E., Buxton, G. V., Salmon, G. A., Bydder, M., Wilkinson, F., Dentener, F., Mirabel, P., Wolke, R., and Herrmann, H.: CAPRAM2.4 (MODAC mechanism): An extended and condensed tropospheric aqueous phase mechanism and its application, J. Geophys. Res., 108, 4426, https://doi.org/10.1029/2002JD002202, 2003.
Ervens, B., Sorooshian, A., Lim, Y. B., and Turpin, B. J.: Key parameters controlling OH-initiated formation of secondary organic aerosol in the aqueous phase (aqSOA), J. Geophys. Res.-Atmos, 119, 3997–4016, https://doi.org/10.1002/2013JD021021, 2014.
Fankhauser, A. M., Antonio, D. D., Krell, A., Alston, S. J., Banta, S., and McNeill, V. F.: Constraining the Impact of Bacteria on the Aqueous Atmospheric Chemistry of Small Organic Compounds, ACS Earth Space Chem., 3, 1485–1491, https://doi.org/10.1021/acsearthspacechem.9b00054, 2019.
Guan, N. and Liu, L.: Microbial response to acid stress: mechanisms and applications, Appl. Microbiol. Biot., 104, 51–65, https://doi.org/10.1007/s00253-019-10226-1, 2020.
Gurol, M. D. and Nekouinaini, S.: Kinetic behavior of ozone in aqueous solutions of substituted phenols, Ind. Eng. Chem. Fund., 23, 54–60, https://doi.org/10.1021/i100013a011, 1984.
Harrison, M. A. J., Barra, S., Borghesi, D., Vione, D., Arsene, C., and Olariu, R. I.: Nitrated phenols in the atmosphere: A review, Atmos. Environ., 39, 231–248, 2005.
Herrmann, H., Ervens, B., Jacobi, H.-W., Wolke, R., Nowacki, P., and Zellner, R.: CAPRAM2.3: A Chemical Aqueous Phase Radical Mechanism for Tropospheric Chemistry, J. Atmos. Chem., 36, 231–284, 2000.
Hinteregger, C., Leitner, R., Loidl, M., Ferschl, A., and Streichsbier, F.: Degradation of phenol and phenolic compounds by Pseudomonas putida EKII, Appl. Microbiol. Biot., 37, 252–259, https://doi.org/10.1007/BF00178180, 1992.
Hoffmann, E. H., Tilgner, A., Wolke, R., Böge, O., Walter, A., and Herrmann, H.: Oxidation of substituted aromatic hydrocarbons in the tropospheric aqueous phase: kinetic mechanism development and modelling, Phys. Chem. Chem. Phys., 20, 10960–10977, https://doi.org/10.1039/C7CP08576A, 2018.
Hsieh, C.-C., Chang, K.-H., and Kao, Y.-S.: Estimating the ozone formation potential of volatile aromatic compounds in vehicle tunnels, Chemosphere, 39, 1433–1444, https://doi.org/10.1016/S0045-6535(99)00045-4, 1999.
Husárová, S., Vaïtilingom, M., Deguillaume, L., Traikia, M., Vinatier, V., Sancelme, M., Amato, P., Matulová, M., and Delort, A.-M.: Biotransformation of methanol and formaldehyde by bacteria isolated from clouds. Comparison with radical chemistry, Atmos. Environ., 45, 6093–6102, https://doi.org/10.1016/j.atmosenv.2011.06.035, 2011.
Kumar, A., Bisht, B. S., Joshi, V. D., and Dhewa, T.: Review on Bioremediation of Polluted Environment: A Management Tool, Int. J. Environ. Sci., 1, 1079–1093, 2011.
Lallement, A., Besaury, L., Eyheraguibel, B., Amato, P., Sancelme, M., Mailhot, G., and Delort, A. M.: Draft Genome Sequence of Rhodococcus enclensis 23b-28, a Model Strain Isolated from Cloud Water, Genome Announc., 5, e01199-17, https://doi.org/10.1128/genomeA.01199-17, 2017.
Lallement, A., Vinatier, V., Brigante, M., Deguillaume, L., Delort, A. M., and Mailhot, G.: First evaluation of the effect of microorganisms on steady state hydroxyl radical concentrations in atmospheric waters, Chemosphere, 212, 715–722, https://doi.org/10.1016/j.chemosphere.2018.08.128, 2018a.
Lallement, A., Besaury, L., Tixier, E., Sancelme, M., Amato, P., Vinatier, V., Canet, I., Polyakova, O. V., Artaev, V. B., Lebedev, A. T., Deguillaume, L., Mailhot, G., and Delort, A.-M.: Potential for phenol biodegradation in cloud waters, Biogeosciences, 15, 5733–5744, https://doi.org/10.5194/bg-15-5733-2018, 2018b.
Lebedev, A. T., Polyakova, O. V., Mazur, D. M., Artaev, V. B., Canet, I., Lallement, A., Vaïtilingom, M., Deguillaume, L., and Delort, A.-M.: Detection of semi-volatile compounds in cloud waters by GC×GC-TOF-MS. Evidence of phenols and phthalates as priority pollutants, Environ. Pollut., 241, 616–625, https://doi.org/10.1016/j.envpol.2018.05.089, 2018.
Levsen, K., Behnert, S., Mußmann, P., Raabe, M., and Prieß, B.: Organic Compounds In Cloud And Rain Water, Int. J. Environ. An. Ch., 52, 87–97, https://doi.org/10.1080/03067319308042851, 1993.
Li, J., Mailhot, G., Wu, F., and Deng, N.: Photochemical efficiency of Fe(III)-EDDS complex: OH radical production and 17β-estradiol degradation, J. Photochem. Photobiol. Chem., 212, 1–7, https://doi.org/10.1016/j.jphotochem.2010.03.001, 2010.
Lüttke, J. and Levsen, K.: Phase partitioning of phenol and nitrophenols in clouds, Atmos. Environ., 31, 2649–2655, https://doi.org/10.1016/S1352-2310(96)00228-2, 1997.
Lüttke, J., Scheer, V., Levsen, K., Wünsch, G., Neil Cape, J., Hargreaves, K. J., Storeton-West, R. L., Acker, K., Wieprecht, W., and Jones, B.: Occurrence and formation of nitrated phenols in and out of cloud, Atmos. Environ., 31, 2637–2648, https://doi.org/10.1016/S1352-2310(96)00229-4, 1997.
Ng, N. L., Kroll, J. H., Chan, A. W. H., Chhabra, P. S., Flagan, R. C., and Seinfeld, J. H.: Secondary organic aerosol formation from m-xylene, toluene, and benzene, Atmos. Chem. Phys., 7, 3909–3922, https://doi.org/10.5194/acp-7-3909-2007, 2007.
Pillar, E. A., Camm, R. C., and Guzman, M. I.: Catechol Oxidation by Ozone and Hydroxyl Radicals at the Air–Water Interface, Environ. Sci. Technol., 4824), 14352–14360, https://doi.org/10.1021/es504094x, 2014.
Razika, B., Abbes, C., Messaoud, C., and Soufi, K.: Phenol and Benzoic Acid Degradation by Pseudomonas aeruginosa, J. Water Resour. Prot., 2, 788–791, 2010.
Reasoner, D. J. and Geldreich, E. E.: A new medium for the enumeration and subculture of bacteria from potable water, Appl. Environ. Microb., 49, 1–7, 1985.
Schwartz, S.: Mass transport considerations pertinent to aqueous phase reactions of gases in liquid water clouds, in: Chemistry of Multiphase Atmospheric Systems, vol. 6, edited by: Jaeschke, W., Springer, Berlin, Germany, 415–471, 1986.
Straube, G.: Phenol hydroxylase from Rhodococcus sp. P 1, J. Basic Microbiol., 27, 229–232, https://doi.org/10.1002/jobm.3620270415, 1987.
TOXNET Toxicology Data Network: TOXNET, Toxicol. Data Netw, available at: https://toxnet.nlm.nih.gov/ newtoxnet/hsdb.htm, last access: 6 November 2019.
Vaïtilingom, M., Amato, P., Sancelme, M., Laj, P., Leriche, M., and Delort, A.-M.: Contribution of Microbial Activity to Carbon Chemistry in Clouds, Appl. Environ. Microb., 76, 23–29, https://doi.org/10.1128/AEM.01127-09, 2010.
Vaïtilingom, M., Charbouillot, T., Deguillaume, L., Maisonobe, R., Parazols, M., Amato, P., Sancelme, M., and Delort, A.-M.: Atmospheric chemistry of carboxylic acids: microbial implication versus photochemistry, Atmos. Chem. Phys., 11, 8721–8733, https://doi.org/10.5194/acp-11-8721-2011, 2011.
Vaïtilingom, M., Attard, E., Gaiani, N., Sancelme, M., Deguillaume, L., Flossmann, A. I., Amato, P., and Delort, A.-M.: Long-term features of cloud microbiology at the puy de Dôme (France), Atmos. Environ., 56, 88–100, https://doi.org/10.1016/j.atmosenv.2012.03.072, 2012.
Vaïtilingom, M., Deguillaume, L., Vinatier, V., Sancelme, M., Amato, P., Chaumerliac, N., and Delort, A.-M.: Potential impact of microbial activity on the oxidant capacity and organic carbon budget in clouds, P. Natl. Acad. Sci. USA, 110, 559–564, https://doi.org/10.1073/pnas.1205743110, 2013.
Vinatier, V., Wirgot, N., Joly, M., Sancelme, M., Abrantes, M., Deguillaume, L., and Delort, A.-M.: Siderophores in Cloud Waters and Potential Impact on Atmospheric Chemistry: Production by Microorganisms Isolated at the Puy de Dôme Station, Environ. Sci. Technol., 50, 9315–9323, https://doi.org/10.1021/acs.est.6b02335, 2016.
Vione, D., Maurino, V., Minero, C., Vincenti, M., and Pelizzetti, E.: Aromatic photonitration in homogeneous and heterogeneous aqueous systems, Environ. Sci. Pollut. R., 10, 321–324, https://doi.org/10.1065/espr2001.12.104.1, 2003.
Watanabe, K.: Microorganisms relevant to bioremediation, Curr. Opin. Biotechnol., 12, 237–241, https://doi.org/10.1016/S0958-1669(00)00205-6, 2001.
Wirgot, N., Vinatier, V., Deguillaume, L., Sancelme, M., and Delort, A.-M.: H2O2 modulates the energetic metabolism of the cloud microbiome, Atmos. Chem. Phys., 17, 14841–14851, https://doi.org/10.5194/acp-17-14841-2017, 2017.
Xie, M., Chen, X., Hays, M. D., Lewandowski, M., Offenberg, J., Kleindienst, T. E., and Holder, A. L.: Light Absorption of Secondary Organic Aerosol: Composition and Contribution of Nitroaromatic Compounds, Environ. Sci. Technol., 51, 11607–11616, https://doi.org/10.1021/acs.est.7b03263, 2017.
Xu, C. and Wang, L.: Atmospheric Oxidation Mechanism of Phenol Initiated by OH Radical, J. Phys. Chem. A, 117, 2358–2364, https://doi.org/10.1021/jp308856b, 2013.
Yu, L., Smith, J., Laskin, A., Anastasio, C., Laskin, J., and Zhang, Q.: Chemical characterization of SOA formed from aqueous-phase reactions of phenols with the triplet excited state of carbonyl and hydroxyl radical, Atmos. Chem. Phys., 14, 13801–13816, https://doi.org/10.5194/acp-14-13801-2014, 2014.
Yuan, B., Liggio, J., Wentzell, J., Li, S.-M., Stark, H., Roberts, J. M., Gilman, J., Lerner, B., Warneke, C., Li, R., Leithead, A., Osthoff, H. D., Wild, R., Brown, S. S., and de Gouw, J. A.: Secondary formation of nitrated phenols: insights from observations during the Uintah Basin Winter Ozone Study (UBWOS) 2014, Atmos. Chem. Phys., 16, 2139–2153, https://doi.org/10.5194/acp-16-2139-2016, 2016.