the Creative Commons Attribution 4.0 License.
the Creative Commons Attribution 4.0 License.
 | 21 Apr 2020
Haze pollution under a high atmospheric oxidization capacity in summer in Beijing: insights into formation mechanism of atmospheric physicochemical processes
Dandan Zhao
Guangjing Liu
Jinyuan Xin
Jiannong Quan
Yuesi Wang
Lindong Dai
Wenkang Gao
Guiqian Tang
Yongxiang Ma
Xiaoyan Wu
Lili Wang
Zirui Liu
Fangkun Wu
Under a high atmospheric oxidization capacity, the synergistic effect of the physicochemical processes in the atmospheric boundary layer (ABL) caused summer haze pollution in Beijing. The southern and southwestern areas, generally 60–300 km away from Beijing, were seriously polluted in contrast to Beijing, which remained clean. Southerly winds moving faster than 20–30 km h−1 since the early morning primarily caused haze pollution initiation. The PM2.5 (particulate matter with a dynamic equivalent diameter smaller than 2.5 µm) level increased to 75 µg m−3 over several hours during the daytime, which was simultaneously affected by the ABL structure. Additionally, the O3 concentration was quite high during the daytime (250 µg m−3), corresponding to a high atmospheric oxidation capacity. Much sulfate and nitrate were produced through active atmospheric chemical processes, with sulfur oxidation ratios (SORs) up to ∼0.76 and nitrogen oxidation ratios (NORs) increasing from 0.09 to 0.26, which further facilitated particulate matter (PM) level enhancement. However, the increase in sulfate was mainly linked to southerly transport. At midnight, the PM2.5 concentration sharply increased from 75 to 150 µg m−3 over 4 h and remained at its highest level until the next morning. Under an extremely stable ABL structure, secondary aerosol formation dominated by nitrate was quite intense, driving the haze pollution outbreak. The PM levels in the southern and southeastern areas of Beijing were significantly lower than those in Beijing at this time, even below air quality standards; thus, the contribution of pollution transport had almost disappeared. With the formation of a nocturnal stable boundary layer (NSBL) at an altitude ranging from 0–0.3 km, the extremely low turbulence kinetic energy (TKE) ranging from 0 to 0.05 m2 s−2 inhibited the spread of particles and moisture, ultimately resulting in elevated near-surface PM2.5 and relative humidity (∼90 %) levels. Due to the very high humidity and ambient oxidization capacity, NOR rapidly increased from 0.26 to 0.60, and heterogeneous hydrolysis reactions at the moist particle surface were very notable. The nitrate concentration steeply increased from 11.6 to 57.8 µg m−3, while the sulfate and organics concentrations slightly increased by 6.1 and 3.1 µg m−3, respectively. With clean and strong winds passing through Beijing, the stable ABL dissipated with the potential temperature gradient becoming negative and the ABL height (ABLH) increasing to ∼2.5 km. The high turbulence activity with a TKE ranging from 3 to 5 m2 s−2 notably promoted pollution diffusion. The self-cleaning capacity of the atmosphere is commonly responsible for air pollution dispersion. However, reducing the atmospheric oxidization capacity, through strengthening collaborative control of nitrogen oxide (NOx) and volatile organic compounds (VOCs), as well as continuously deepening regional joint air pollution control, is urgent.
Please read the corrigendum first before continuing.
-
Notice on corrigendum
The requested paper has a corresponding corrigendum published. Please read the corrigendum first before downloading the article.
-
Article
(30910 KB)
-
The requested paper has a corresponding corrigendum published. Please read the corrigendum first before downloading the article.
- Article
(30910 KB) - Full-text XML
- Corrigendum
- BibTeX
- EndNote


Due to a series of stringent emission control measures (China's State Council 2013 Action Plan for Air Pollution Prevention and Control available at http://www.gov.cn/zhengce/content/2013-09/13/content_4561.htm, last access: 13 April 2020), including shutting down heavily polluting factories and replacing coal with clean energy sources, the annual mean PM2.5 (particulate matter with a dynamic equivalent diameter smaller than 2.5 µm) concentration in major regions, especially in Beijing, has continuously decreased in recent years (Chen et al., 2019; G. Liu et al., 2019; J. Cheng et al., 2019; Ding et al., 2019). However, the ground-level O3 concentration across China has increased rapidly in recent years, especially in summer, despite recent reductions in SO2 and nitrogen oxide (NOx) emissions (Chen et al., 2018; Anger et al., 2016; Wang et al., 2018; T. Wang et al., 2017a). This discrepancy in the variation trend between O3 and PM2.5 may be attributed to inappropriate reduction ratios of NOx and volatile organic compounds (VOCs) in PM2.5-control-oriented emission reduction measures, which mainly focus on NOx reduction (H. Liu et al., 2013; N. Cheng et al., 2019). In addition, a number of studies have demonstrated that reducing ambient particles influences surface ozone generation by affecting heterogeneous reactions and decreasing the photodecomposition rate (O3 and its precursors) through aerosol–radiation interactions (Q. Liu et al., 2019; W. Wang et al., 2019; He and Carmichael, 1999; Dickerson et al., 1997; Tie et al., 2001, 2005; Martin et al., 2003). Recently, even though the PM2.5 level in Beijing has generally been low due to stringent emission control measures, several haze pollution episodes with alternating and synchronous high ozone concentrations have still occurred in the summer of 2019. Regarding the causes of particulate matter (PM) pollution, numerous previous studies have reported that stationary synoptic conditions, local emissions and regional transport, an adverse atmospheric boundary layer (ABL) structure, and meteorological conditions as well as secondary aerosol formation are major factors in haze pollution formation (Li et al., 2019; Sun et al., 2012; Wang et al., 2016; Z. Liu et al., 2019; Huang et al., 2017; Luan et al., 2018; Han et al., 2019). Huang et al. (2017) demonstrated that haze pollution in Beijing–Tianjin–Hebei usually occurred when air masses originating from polluted industrial regions in the south prevailed and are characterized by high PM2.5 loadings with considerable contributions from secondary aerosols. Bi et al. (2017) stated that the strong winds and vertical mixing in the daytime scavenged pollution, and the weak winds and stable inversion layer in the nighttime promoted air pollutant accumulation near the surface. Zhong et al. (2018) showed that positive ABL meteorological feedback on the PM2.5 mass concentration explains over 70 % of the outbreak of pollution. Zhao et al. (2019) also revealed that the constant feedback effect between aerosol radiative forcing and ABL stability continually reduced the atmospheric environmental capacity and aggravated air pollution. The dominant PM components, including sulfate, nitrate, ammonium and organics (Org), are mostly formed via the homogeneous and heterogeneous reactions of gas-phase precursors in the atmosphere (Orrling et al., 2011; Wang et al., 2016), and they account for over 50 % of the PM2.5 mass (Wang et al., 2013; G. Liu et al., 2019; Sun et al., 2015; Yao et al., 2002). Ming et al. (2017) proved that the contribution of secondary aerosol formation during haze pollution episodes was much higher than that before and after haze pollution episodes.
Although the causes of high PM2.5 loadings have been widely examined, most of these studies have focused on haze pollution in winter and only involved one or several key factors. In summer in Beijing, with high solar radiation, O3 can be quickly formed via photochemical reactions among precursors, including volatile organic compounds (VOCs) and nitrogen oxides (NOx), which contributes to an increase in the ambient oxidizing capacity (T. Wang et al., 2017b; Ainsworth et al., 2012; Hassan et al., 2013; Trainer et al., 2000; Sillman, 1999). Meteorological conditions, including solar radiation, temperature, relative humidity (RH), wind speed and direction, and cloud cover, also play an important role in short-term ozone variations, further affecting the atmospheric oxidization capacity (Lu et al., 2019; N. Cheng et al., 2019; Toh et al., 2013; Z. Wang et al., 2017; Zeng et al., 2018). As ozone pollution is increasingly becoming prominent and the atmospheric oxidation capacity is gradually increasing, the formation mechanism of haze pollution under a high atmospheric oxidization capacity needs to be addressed. Previous studies have demonstrated that intense atmospheric photochemical reactions in summer enhanced secondary aerosol formation and led to the synchronous occurrence of high PM2.5 and O3 concentrations on a regional scale (Pathak et al., 2009; Wang et al., 2016; Shi et al., 2015). Nevertheless, the mechanisms of how the overall regional transport, ABL structure, meteorological conditions and secondary aerosol formation interact to quantitatively influence haze pollution under a high atmospheric oxidization capacity in summer remain unclear. Therefore, by closely monitoring air temperature, relative and absolute humidity (AH) profiles, vertical velocity, horizontal wind vector profiles, atmospheric backscattering coefficient (BSC) profiles, and the ABL height (ABLH) – as well as the mass concentration and composition of PM2.5; aerosol optical depth (AOD); and mass concentrations of gas pollutants including O3, SO2, and NO2 – this paper comprehensively examines the formation mechanism of haze pollution under a high ambient oxidization capacity. This provides insights into atmospheric physics and chemistry to propose selected recommendations for model forecasting and the analysis of complex air pollution in summer in Beijing.
2.1 Instruments and related data
Figure 1 presents the location of observe site and relevant measurement instruments in this paper. The observation site is located at the Tower Branch of the Institute of Atmospheric Physics (IAP), Chinese Academy of Sciences (39∘58′ N, 116∘22′ E; altitude: 58 m). The IAP site is located at the intersection of the North 3rd Ring Road and North 4th Ring Road in Beijing, China, among educational, commercial and residential areas, and it represents a typical urban site in Beijing (hereinafter BJ site). All the sampling instruments are placed at the same location to conduct simultaneous monitoring. All the data used in this paper were recorded from 22 to 27 July 2019, and they are reported in Beijing Standard Time (local time).
Air temperature and relative and absolute humidity profiles were collected with a microwave radiometer (RPG-HATPRO-G5 0030109, Germany). The microwave radiometer (hereinafter MWR) produces profiles with a resolution ranging from 10 to 30 m up to 0.5 km, profiles with a resolution ranging from 40 to 70 m between 0.5 and 2.5 km, and profiles with a resolution ranging from 100 to 200 m from 2 to 10 km at a temporal resolution of 1 s. A detailed description of RPG-HATPRO-type instruments can be found at https://www.radiometer-physics.de/ (last access: 13 April 2020).
Vertical wind speed and horizontal wind vector profiles were retrieved with a 3D Doppler wind lidar (Windcube 100s, Leosphere, France). The wind measurement results have a spatial resolution ranging from 1 to 20 m up to 0.3 km and one of 25 m from 0.3 to 3 km, with a temporal resolution of 1 s. More instrument details can be found at https://www.leosphere.com/ (last access: 13 April 2020).
A ceilometer (CL51, Vaisala, Finland) recorded atmospheric BSC profiles. The CL51 ceilometer digitally sampled the return backscattering signal from 0 to 100 µs and provided BSC profiles with a spatial resolution of 10 m from the ground to a height of 15 km. As PM mostly suspends in the ABL and is barely present in the free atmosphere, the ABLH was determined by the sharp change in the negative gradient of BSC profiles (Muenkel et al., 2007). More detailed information on the ABLH calculation and screening can be found in previous studies (Tang et al., 2015, 2016; Zhu et al., 2018).
The aerosol optical depth (AOD) is observed by a CIMEL sun photometer (CE318, France), and the AOD at 500 nm is adopted in this paper. The CE318 instrument is a multichannel, automatic sun-and-sky-scanning radiometer and only acquires measurements during daylight hours (with the sun above the horizon). Detailed information on the AOD inversion method and the CE318 instrument had been presented in Gregory (2011).
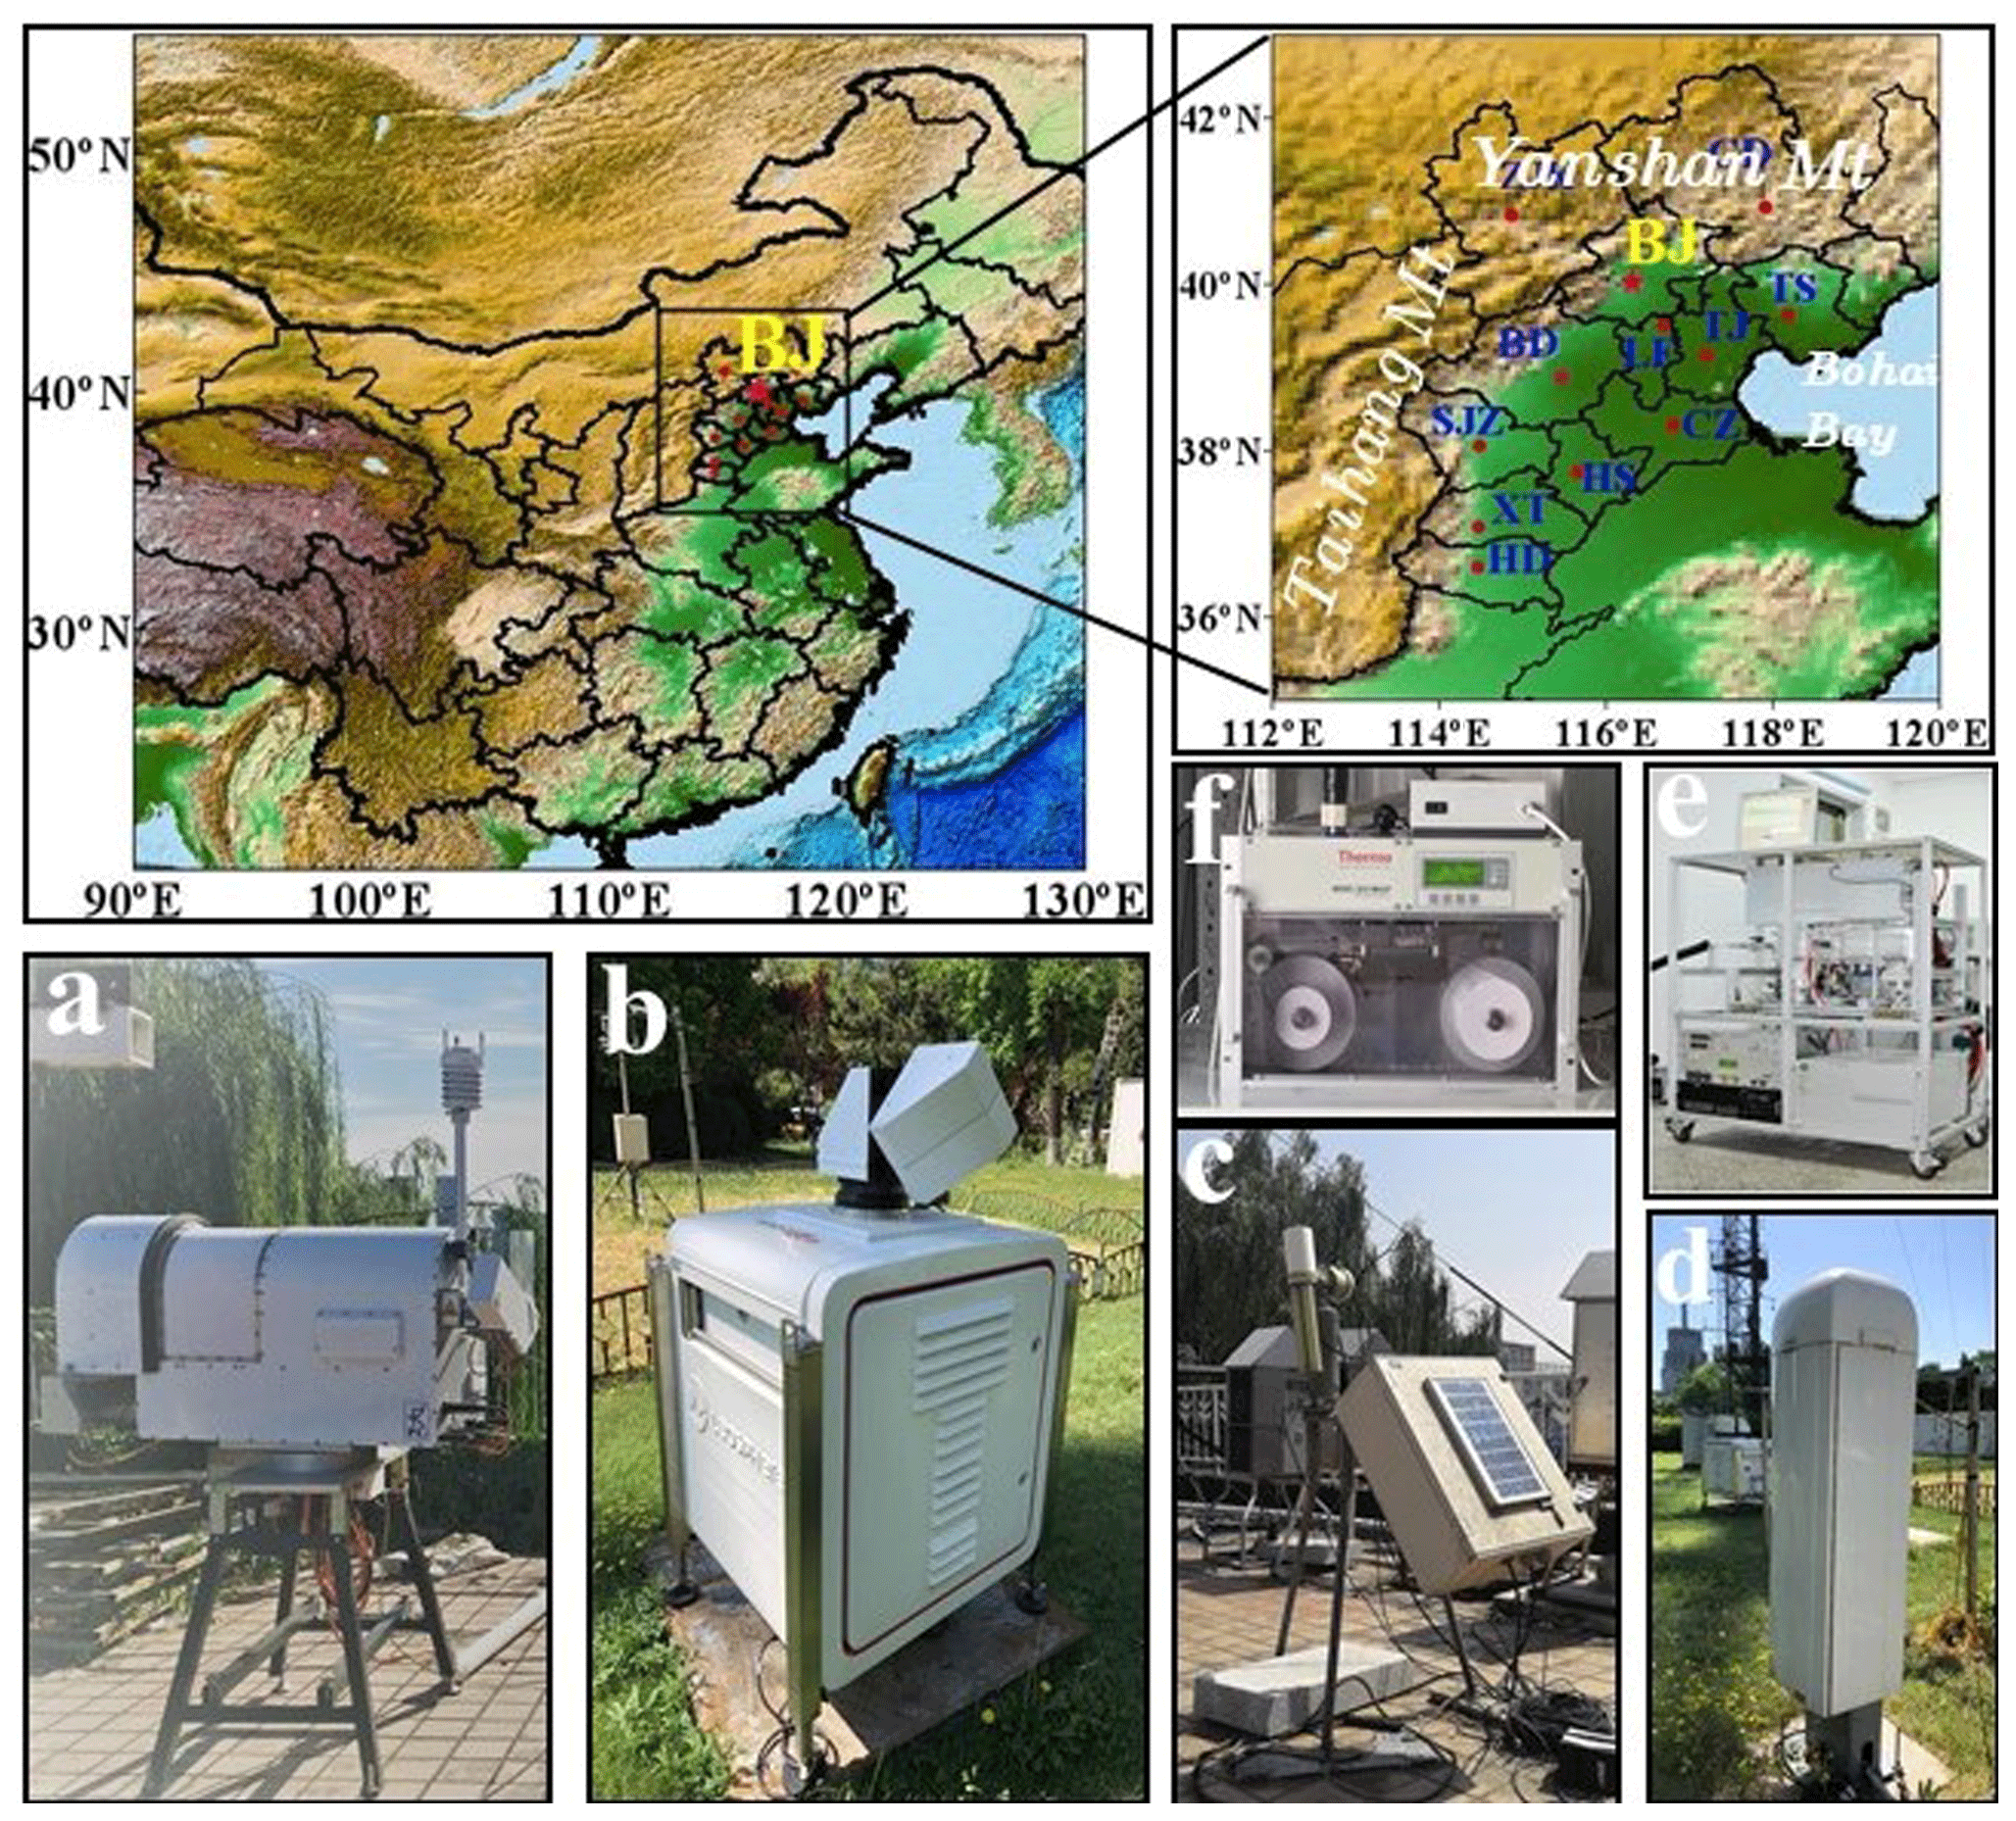
Figure 1The geographical location of Beijing city (BJ) marked with a red star as well as surrounding regions and relevant measurement instruments implemented in this paper. The top-left panel is the topographic distribution of most of China with Beijing and surrounding areas marked, and the top-right panel is the topographic distribution of the Beijing–Tianjin–Hebei (BTH) region, with the Yan Mountains to the north, the Taihang Mountains to the west and Bohai Bay to the east. The blue letters are abbreviations of city names in the BTH region (a: microwave radiometer; b: 3D Doppler wind lidar; c: CIMEL sun photometer; d: ceilometer; e: Aerodyne aerosol chemical speciation monitor (ACSM); f: multiangle absorption photometer).
The real-time hourly-mean PM2.5, PM10, O3, NO2 and SO2 ground levels were downloaded from the China National Environmental Monitoring Center (CNEMC) (available at http://106.37.208.233:20035/, last access: 13 April 2020). All operational procedures are strictly conducted following the Specification of Environmental Air Quality Automatic Monitoring Technology (HJ/T193-2005, available at http://www.mee.gov.cn/, last access: 13 April 2020). The PM chemical species, including the organics (Org), sulfate (), nitrate (), ammonium () and chloride (Cl−), were measured every hour with an aerosol chemical speciation monitor (ACSM). More detailed descriptions of the ACSM have been given in Ng et al. (2011). The black carbon (BC) mass concentration was measured with a multiangle absorption photometer (MAAP5012, Thermo Electron). A more detailed description of the MAAP5012 instrument can be found in Petzold and Schonlinner (2004). As shown in Fig. 2, the ACSM-measured PM2.5 mass concentration (= organics + sulfate + nitrate + ammonium + chloride + BC) tracked the online PM2.5 mass concentration well, which was directly measured with a PM analyzer (from CNEMC), with a correlation coefficient (R2) of 0.82. On average, the ACSM-measured PM2.5 mass concentration accounts for 80 % of the online PM2.5 mass concentration. All chemical compositions measured by the ACSM, including organics, sulfate, nitrate, ammonium and chloride, as well as BC, represent the dominant species of PM2.5.
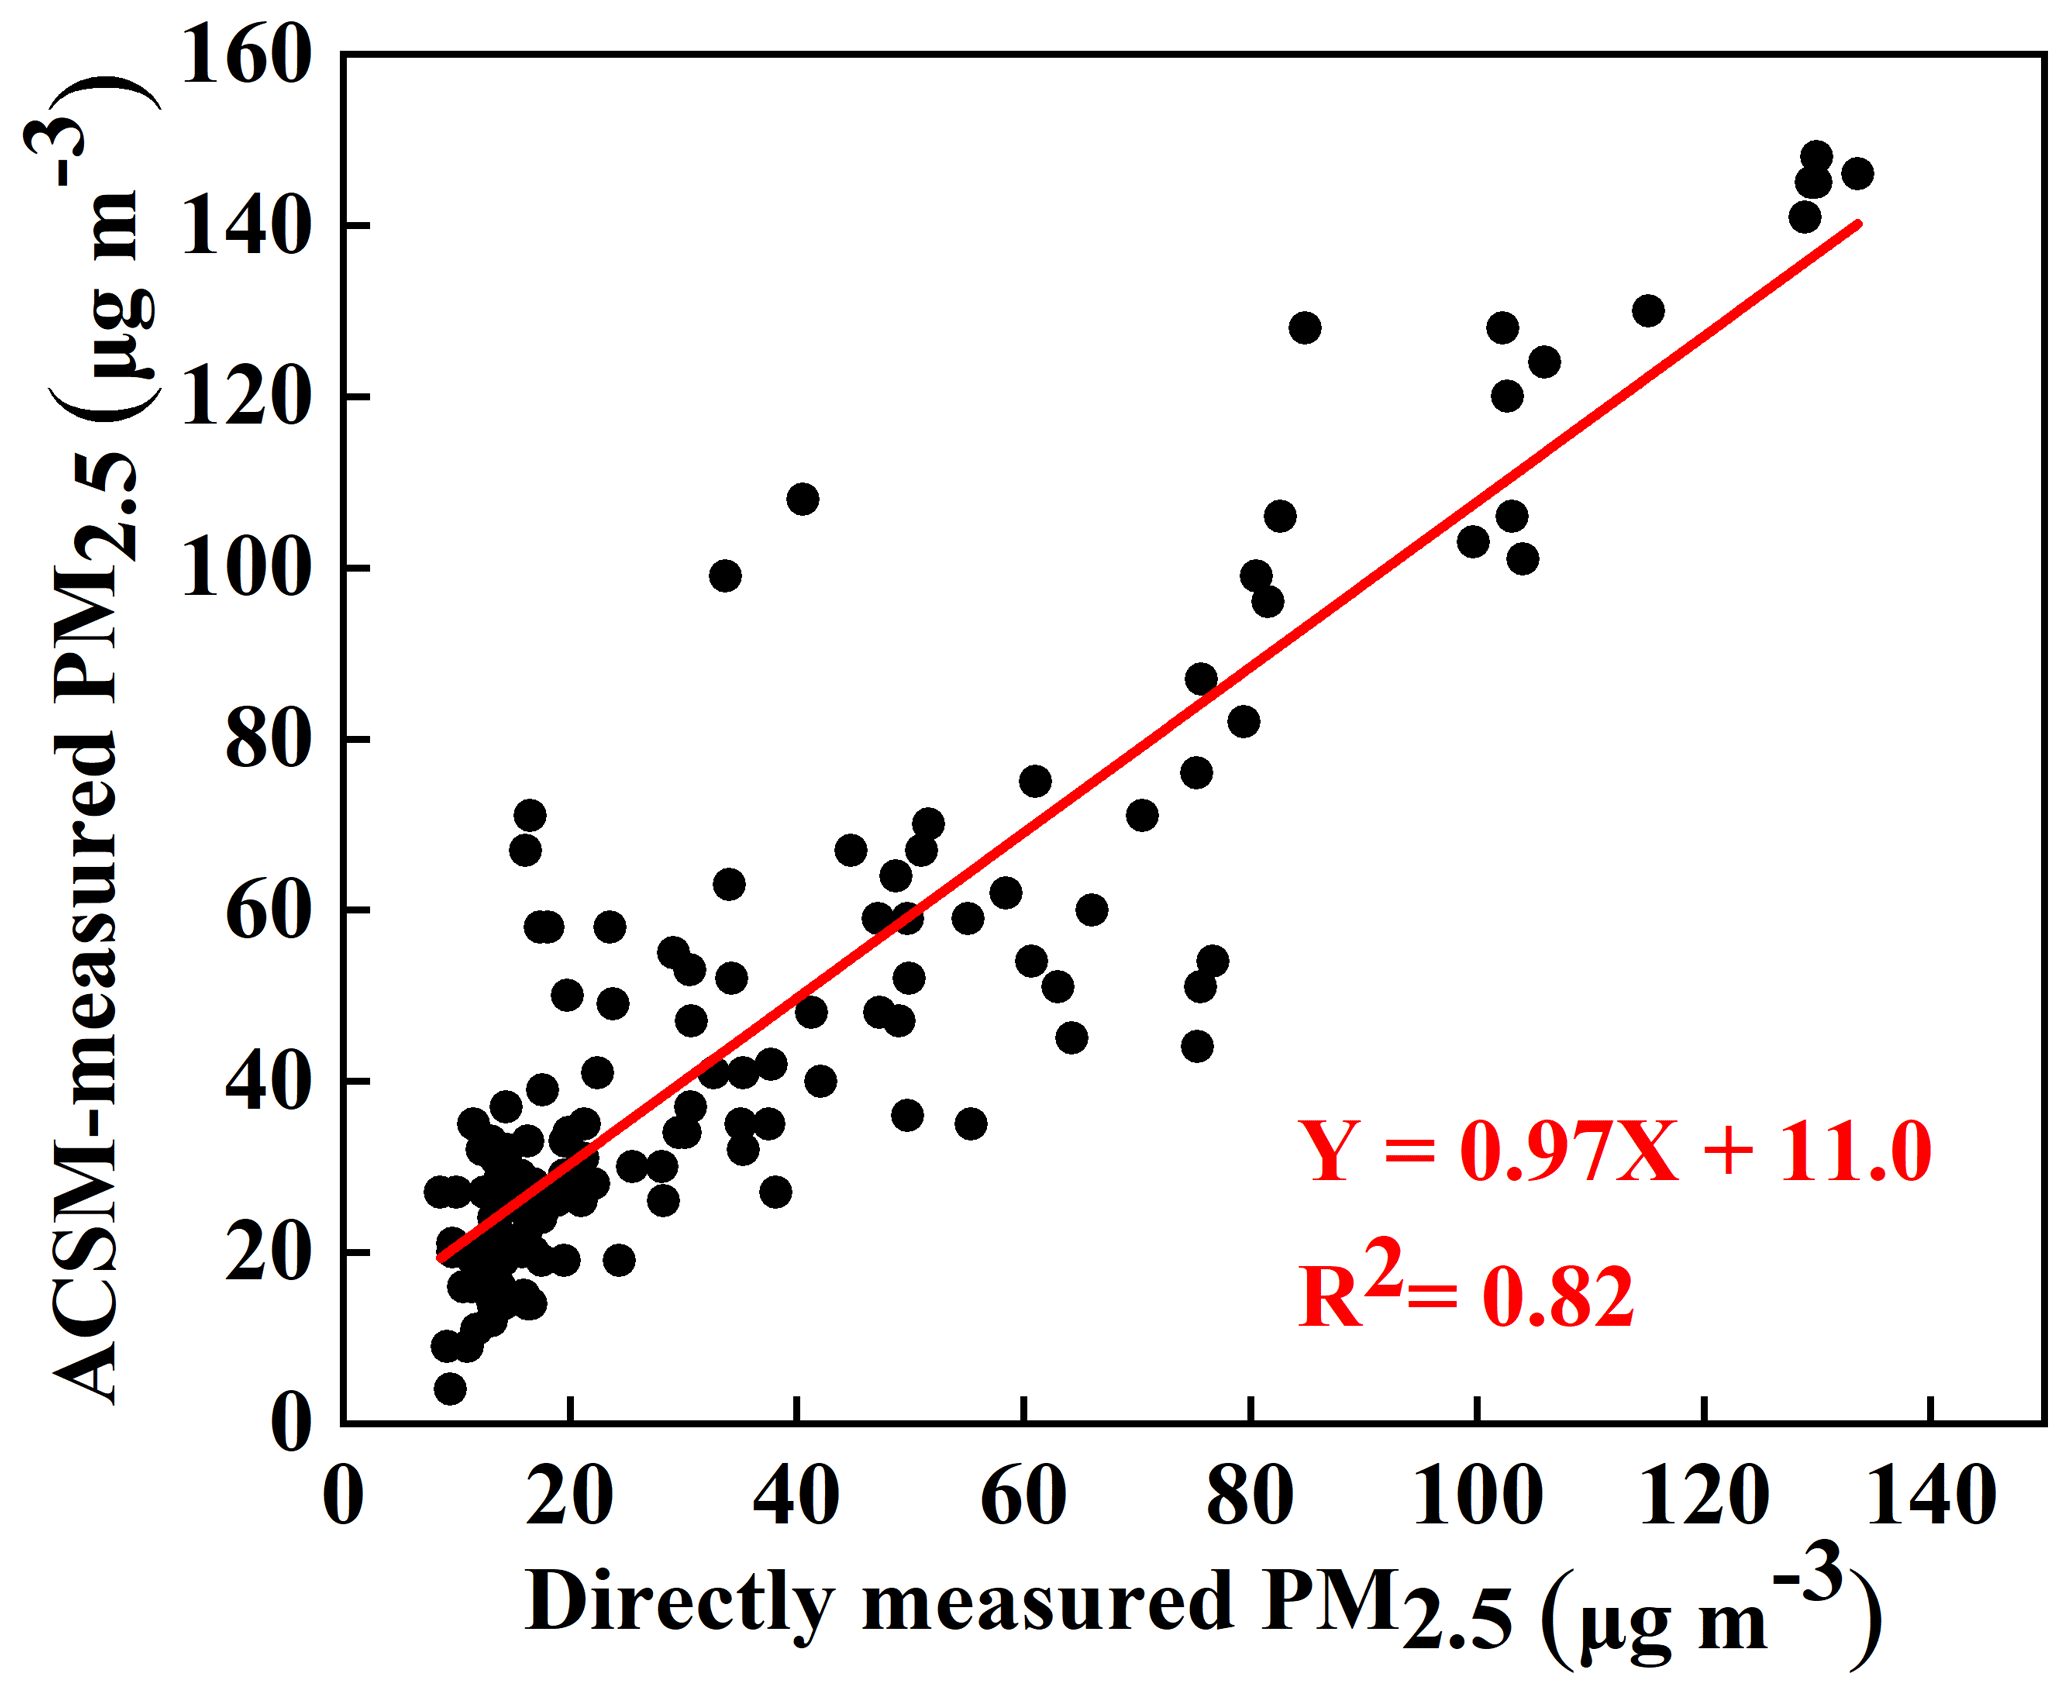
Figure 2Scatter plot of the relationship between the directly measured PM2.5 mass concentration (with the particulate matter analyzer of the China National Environmental Monitoring Center) and the ACSM-measured PM2.5 mass concentration (the sum of the chemical constituent mass concentrations measured with the aerosol chemical speciation monitor (ACSM) and the black carbon (BC) mass concentration measured with the multiangle absorption photometer).
2.2 Other datasets
The virtual potential temperature (θv) and pseudoequivalent potential temperature (θse) are calculated by Eqs. (1) and (2), respectively:
where T is the air temperature; q is the specific humidity; p is the air pressure; rs is the saturation mixing ratio; Lv is the latent heat of vaporization, i.e., 2.5×10⁶ J kg−1; and Cpd is the specific heat of air, i.e., 1005 J kg−1 K−1. All the relevant parameters can be calculated from the MWR-measured temperature and humidity profile data, and the θv and θse values at the different altitudes can then be further obtained. The hourly turbulence kinetic energy (TKE) is calculated as
The 1 h vertical velocity standard deviation () and the 1 h horizontal wind component standard deviations ( and ) are calculated with Eqs. (4), (5) and (6), respectively:
where N is the number of records each hour, wi is the ith vertical wind velocity (m s−1), ui (vi) is the ith horizontal wind speed (m s−1), is the mean vertical wind speed (m s−1), and is the mean horizontal wind speed (m s−1) (L. Wang et al., 2019; Banta et al., 2006). Atmospheric reanalysis data from the National Centers for Environmental Prediction (NCEP) were collected four times a day at 02:00, 08:00, 14:00 and 20:00 LT (local time) at a horizontal resolution of .
3.1 Typical air pollution episodes in summer in Beijing
Considering that the daily mean PM2.5 mass concentration on both 22 and 26–27 July exceeded the national secondary standard (75 µg m−3) (GB3095-2012) with maximum hourly averages up to 131 and 152 µg m−3, respectively, two severe PM pollution processes occurred, defined as Haze I and Haze II. During these two haze periods, high atmospheric BSC levels mainly occurred below an altitude of 0.5 km, with values ranging from 4 to 6 Mm−1 sr−1. This reflects the vertical distribution of ambient particles from the aspect of aerosol scattering to a certain degree, i.e., only the suspended particles concentrated in the lower layer of the atmosphere. Besides, an ozone pollution day is any day when the hourly-mean O3 concentration is higher than 160 µg m−3; thus, during the observation periods, each day was a severe ozone pollution day. As reported by the Ministry of Ecology and Environment, in 2018, the number of motor vehicles reached 327 million, up by 5.5 % year on year (available at http://www.mee.gov.cn/xxgk2018/xxgk/xxgk15/201909/t20190904_732374.html, last access: 13 April 2020). Although stringent pollution control measures have been implemented regarding factories, motor vehicles still discharge large amounts of primary pollutants into the atmosphere, including NOx, HC, VOCs, and CO. Under high solar radiation and temperature levels in summer, photochemical processes are prominent, contributing to a high O3 concentration along with many highly reactive radicals, which further enhance the oxidizing capacity of the atmosphere (Frischer et al., 1999; Sharma et al., 2013). Haze pollution under a high atmospheric oxidation capacity had likely occurred on 22 and 26–27 July. Generally, due to the stringent pollutant emission control measures, the emission of primary aerosols is low, with a very low PM2.5 level in summer in Beijing. The sudden elevated ambient particle concentration (the Haze I and Haze II periods) resulted in the worst PM pollution in Beijing that summer and has been widely concerned by the public. Thus, the formation mechanism of the Haze I and Haze II periods during which the PM2.5 and O3 concentrations were simultaneously/alternately high should be systematically examined. The key point is to determine the oxidation capacity of the regional atmosphere and to clarify the formation mechanism of secondary aerosols. In addition, the occurrence and evolution patterns of these two haze processes were different, which could refer to the diverse accumulation mechanisms, regional transfer contributions, ABL structures and removal processes. Therefore, by clarifying the various pollution processes, it should be possible to determine the leading factors of these haze phenomena in Beijing in summer. In summary, we will examine the haze pollution causes under a high atmospheric oxidization capacity in terms of the physical processes, such as pollutant sources and sinks, ABL structure influence, and chemical processes, namely aerosol transformation processes.
3.2 The formation mechanism of haze pollution in summer in Beijing
3.2.1 The occurrence stage
Figure 3a reveals that the PM level in Beijing gradually increased from 08:00 to 22:00 LT on 26 July (the Haze II episode) and from 04:00 to 22:00 LT on 22 July (the Haze I episode), with the PM2.5 mass concentration eventually reaching 75 and 131 µg m−3, respectively. These two stages are regarded as the Haze I and Haze II occurrence stages.
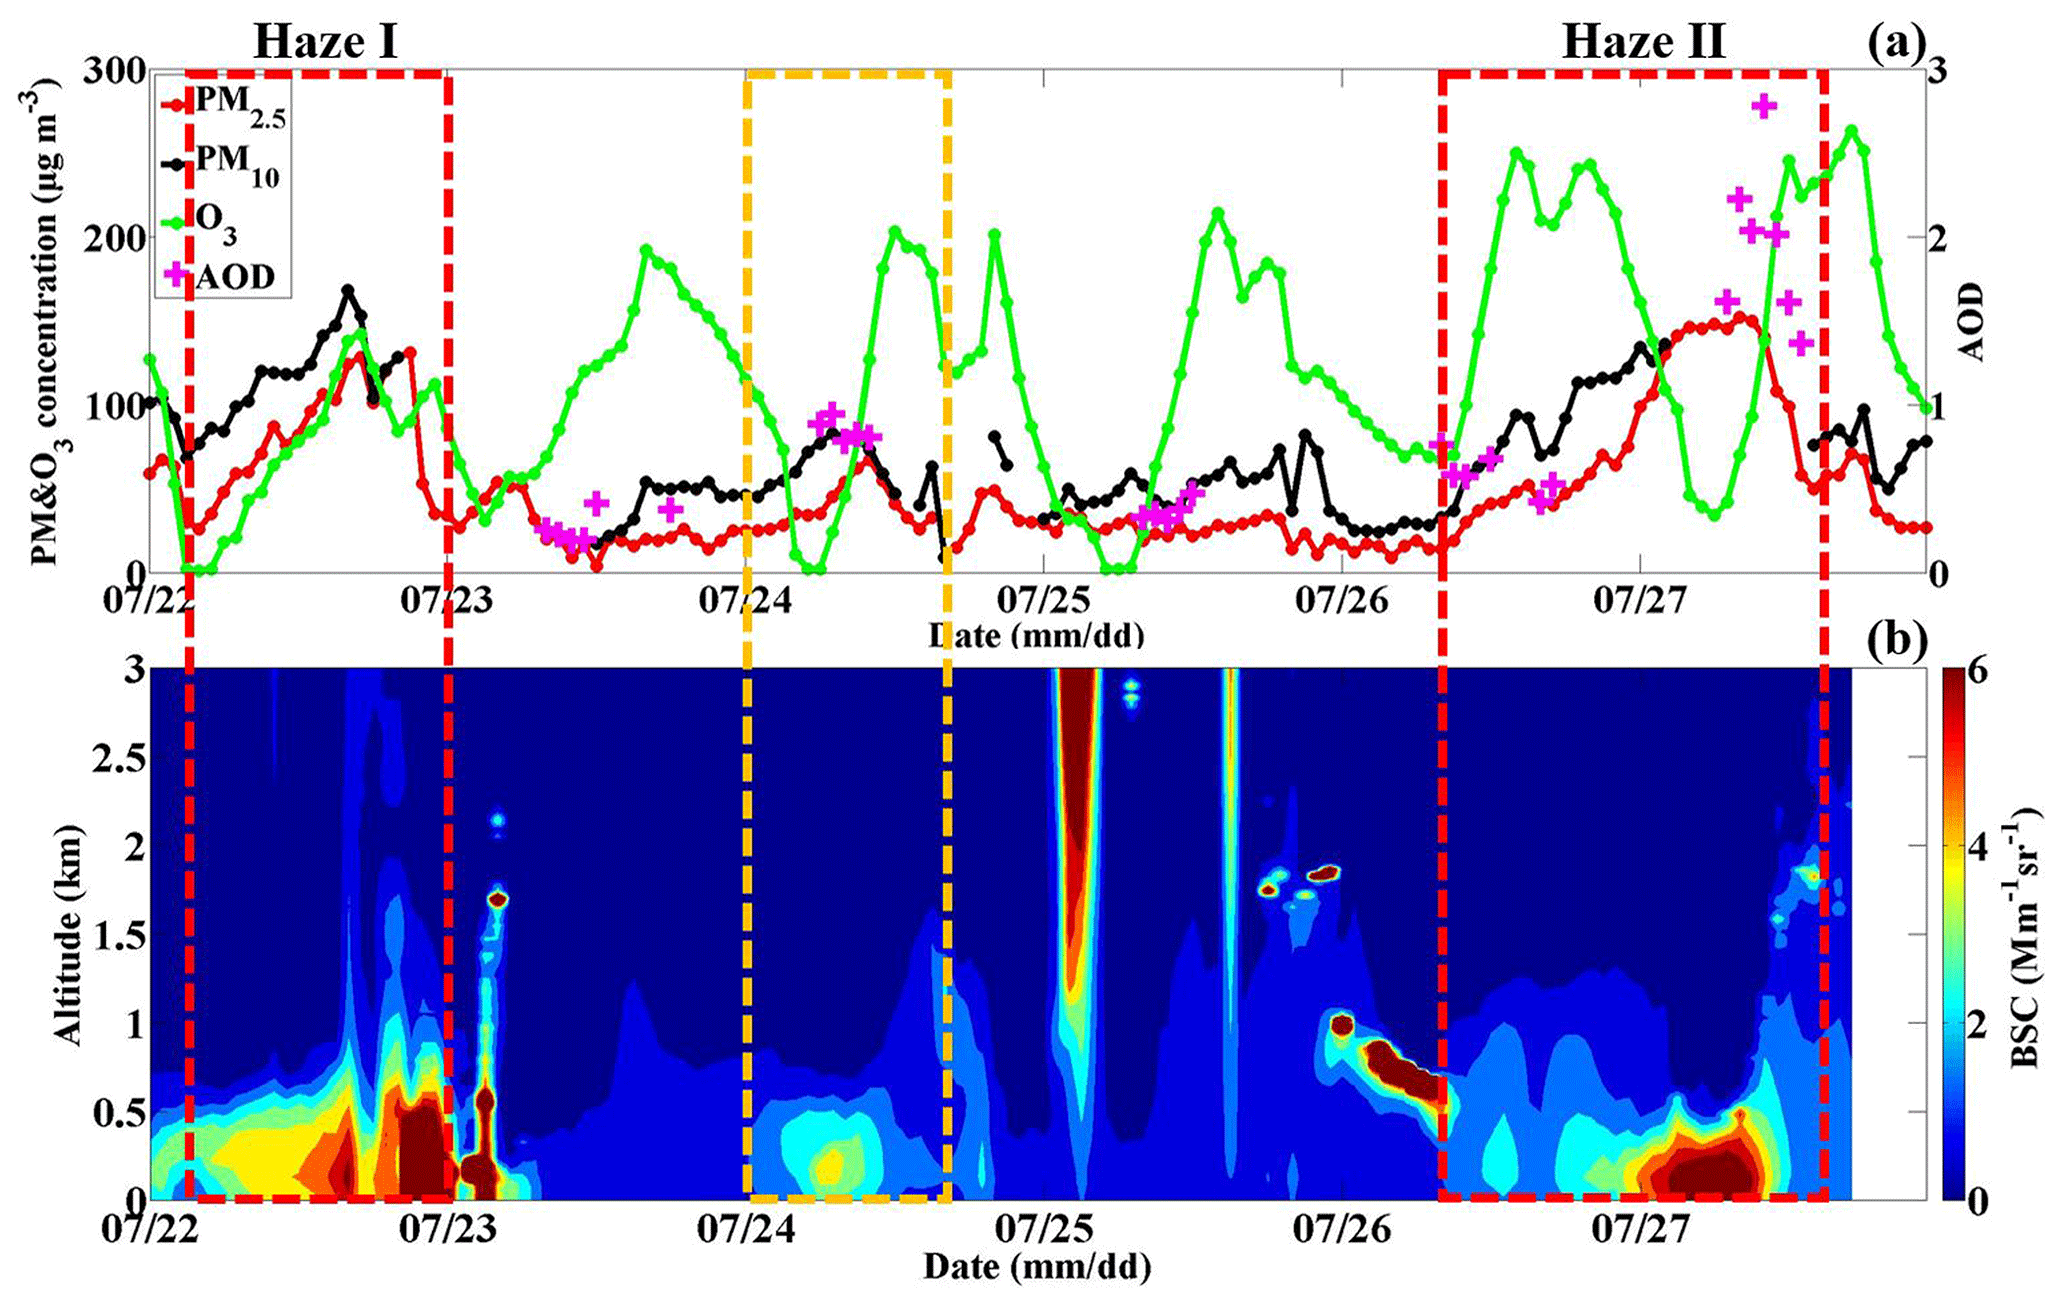
Figure 3(a) Temporal variations in the PM2.5, PM10 and O3 mass concentrations as well as in the aerosol optical depth (AOD) at the BJ site from 22 to 27 July 2019; (b) temporal variations in the vertical atmospheric backscattering coefficient (BSC) profiles at the BJ site from 22 to 27 July 2019 (the yellow box represents the light-haze pollution period, and the red box represents the heavy-haze pollution episode).
a. The contribution of pollution transport
Owing to the notable control measures in summer in Beijing, the sudden elevated PM levels very likely originated from an outside region. Clearly, since the early hours on 22 and 26 July, Beijing was located behind the northwest–southeast trough of the 850 hPa potential height field, which bordered the Sichuan Basin to the west (Fig. 7a–d and i–l). Therefore, Beijing was always controlled by strong southerly winds at high altitudes. With the Taihang Mountains to the east and the Yan Mountains to the north (Fig. 2), Beijing is a semi-enclosed area; thus, the southern wind belt passing through the North China Plain to Beijing will be strengthened (Su et al., 2004). The southerly wind speeds ranged from 8 to 10 m s−1 (the Haze II period) and from 5 to 7 m s−1 (the Haze I period) at altitudes >0.5 km. Under persistent southerly winds, water vapor was carried to Beijing forming a moisture transport channel which increasingly intensified. (Fig. 7a–d; i–l). In response, the humidity in Beijing increased in the morning of 26 July with the AH (RH) ranging from 15 to 17 g m−3 (∼75 %), while the AH (RH) decreased to ∼13 g m−3 (∼70 %) from 10:00 LT on (Fig. 4c and d). The air temperature during the daytime was extremely high, ranging from 30 to 35∘ (Fig. 4b), and these high-temperature weather conditions reduced the humidity by evaporation to a certain degree. Considering that the air temperature was always very high (∼30∘) since the early morning on 22 July, the AH (RH) was ∼13 g m−3 (∼65 %) during the occurrence stage.

Figure 4Temporal variation in the vertical profiles of the (a) horizontal wind vector (the white arrows denote wind vectors), (b) temperature (T), (c) absolute humidity (AH) and (d) relative humidity (RH) at the BJ site from 22 to 27 July 2019 (the yellow box represents the light-haze pollution period, and the red box represents the heavy-haze pollution episode).
With the more densely populated industrial regions located in the south of Beijing, the strong winds blowing from the south were also highly likely to transport large amounts of anthropogenic aerosols to Beijing (Chang et al., 2018; X. G. Liu et al., 2013). To examine the potential PM transportation, we generated PM2.5 mass concentration distribution maps for most parts of China (Fig. 8), and we combined them with corresponding background circulation fields to elucidate the pollution transportation phenomenon. The regional distribution of the PM2.5 mass concentration was obtained by interpolating PM2.5 data from more than 1000 stations of the China National Environmental Monitoring Center into a grid (). Notably, at 02:00 LT on 26 and 22 July, high PM2.5 mass concentrations (∼70 µg m−3 during the Haze I episode and ∼50 µg m−3 during the Haze II episode) mainly occurred in the southern and southwestern areas of Beijing, which were substantially higher than that in Beijing city (∼10 µg m−3) (Fig. 8a–b and i–l). The heavily polluted southern area of Beijing mainly included Baoding, Langfang and Shijiazhuang, which are generally 60–300 km away from Beijing (Fig. 2). The southerly air mass above ∼0.5 km moved faster than 20–30 km h−1 (estimated from the measured wind speed) on 26 and 22 July, which was fast enough to transport pollutants to Beijing in several hours. As expected, the area with a high PM2.5 mass concentration gradually spread northward corresponding to the southerly winds; consequently, the highest PM2.5 level occurred in Beijing at 20:00 on both 26 July (reaching ∼65 µg m−3) and 22 July (reaching ∼80 µg m−3). This was consistent with the PM2.5 increase trends at this time, as shown in Fig. 3a. The average increase rate of the PM2.5 concentration (∼5.8 ) on 22 July was higher than that on the 26 July (∼3.73 ), possibly related to the large difference in the PM2.5 concentration between Beijing city and the southern area of Beijing. These results are consistent with the findings reported by Zhong et al. (2019). Thus, multiple results implied that PM transportation by southerly winds was primarily responsible for the PM increase at the occurrence stage.
b. The effect of the atmospheric boundary layer structure
As shown in Fig. 5a and b, in the mornings on 26 and 22 July, the positive values of the virtual potential temperature gradient () and pseudoequivalent potential temperature gradient () at altitudes ranging from 0 to 2 km (the Haze II period) and from 0 to 1 km altitude (the Haze I period) indicated that a stable atmosphere layer was present. Generally, with no solar radiation reaching the ground and more upward longwave radiation emitted from the ground at night, the surface cools faster than the upper atmosphere, thus promoting a stable atmosphere. In response, the turbulent kinetic energy (TKE) was extremely low (0–1 m2 s−2) along with a low ABLH of ∼0.5 km (Fig. 5c, d). This means that on both 26 and 22 July, southern winds persisted as the ABL structure was not conducive to vertical substance diffusion. The stable ABL structure suppressing vertical pollution diffusion also contributed to the occurrence of PM pollution to a certain degree. Both and at an altitude ranging from 0 to 1.5 km became negative from 14:00 to 16:00 LT on 26 July, indicating an unstable atmosphere layer. Generally, the high daytime solar radiation reaching the surface may rebuild the vertical temperature structure and disrupt the stable ABL, especially in summer (Andrews, 2000). Thus, turbulence was quickly generated by the thermodynamic activity with the TKE increasing to 2–3 s2 m−2 and continuing to develop upwards, causing the ABLH to gradually increase to ∼1.2 km. This ABL process explained the slight fluctuations in the PM increase at this time in which the PM10 mass concentration sharply decreased from 100 to 73 µg m−3. In contrast to the ABL condition on 26 July (the Haze II stage), was negative, but was positive below ∼1.5 km in the afternoon on 22 July (the Haze I stage). Combined with a low TKE (0–0.5 m2 s−2) similar to that in the morning, the atmospheric stratification below ∼1.5 km remained absolutely stable. Maybe due to the low solar radiation gradually heating the ground in the afternoon under cloudy weather conditions, the original stable ABL structure previously formed in the nighttime could not be disrupted. All the above results imply that the ABL structure also plays a role in the PM increase at the occurrence stage.
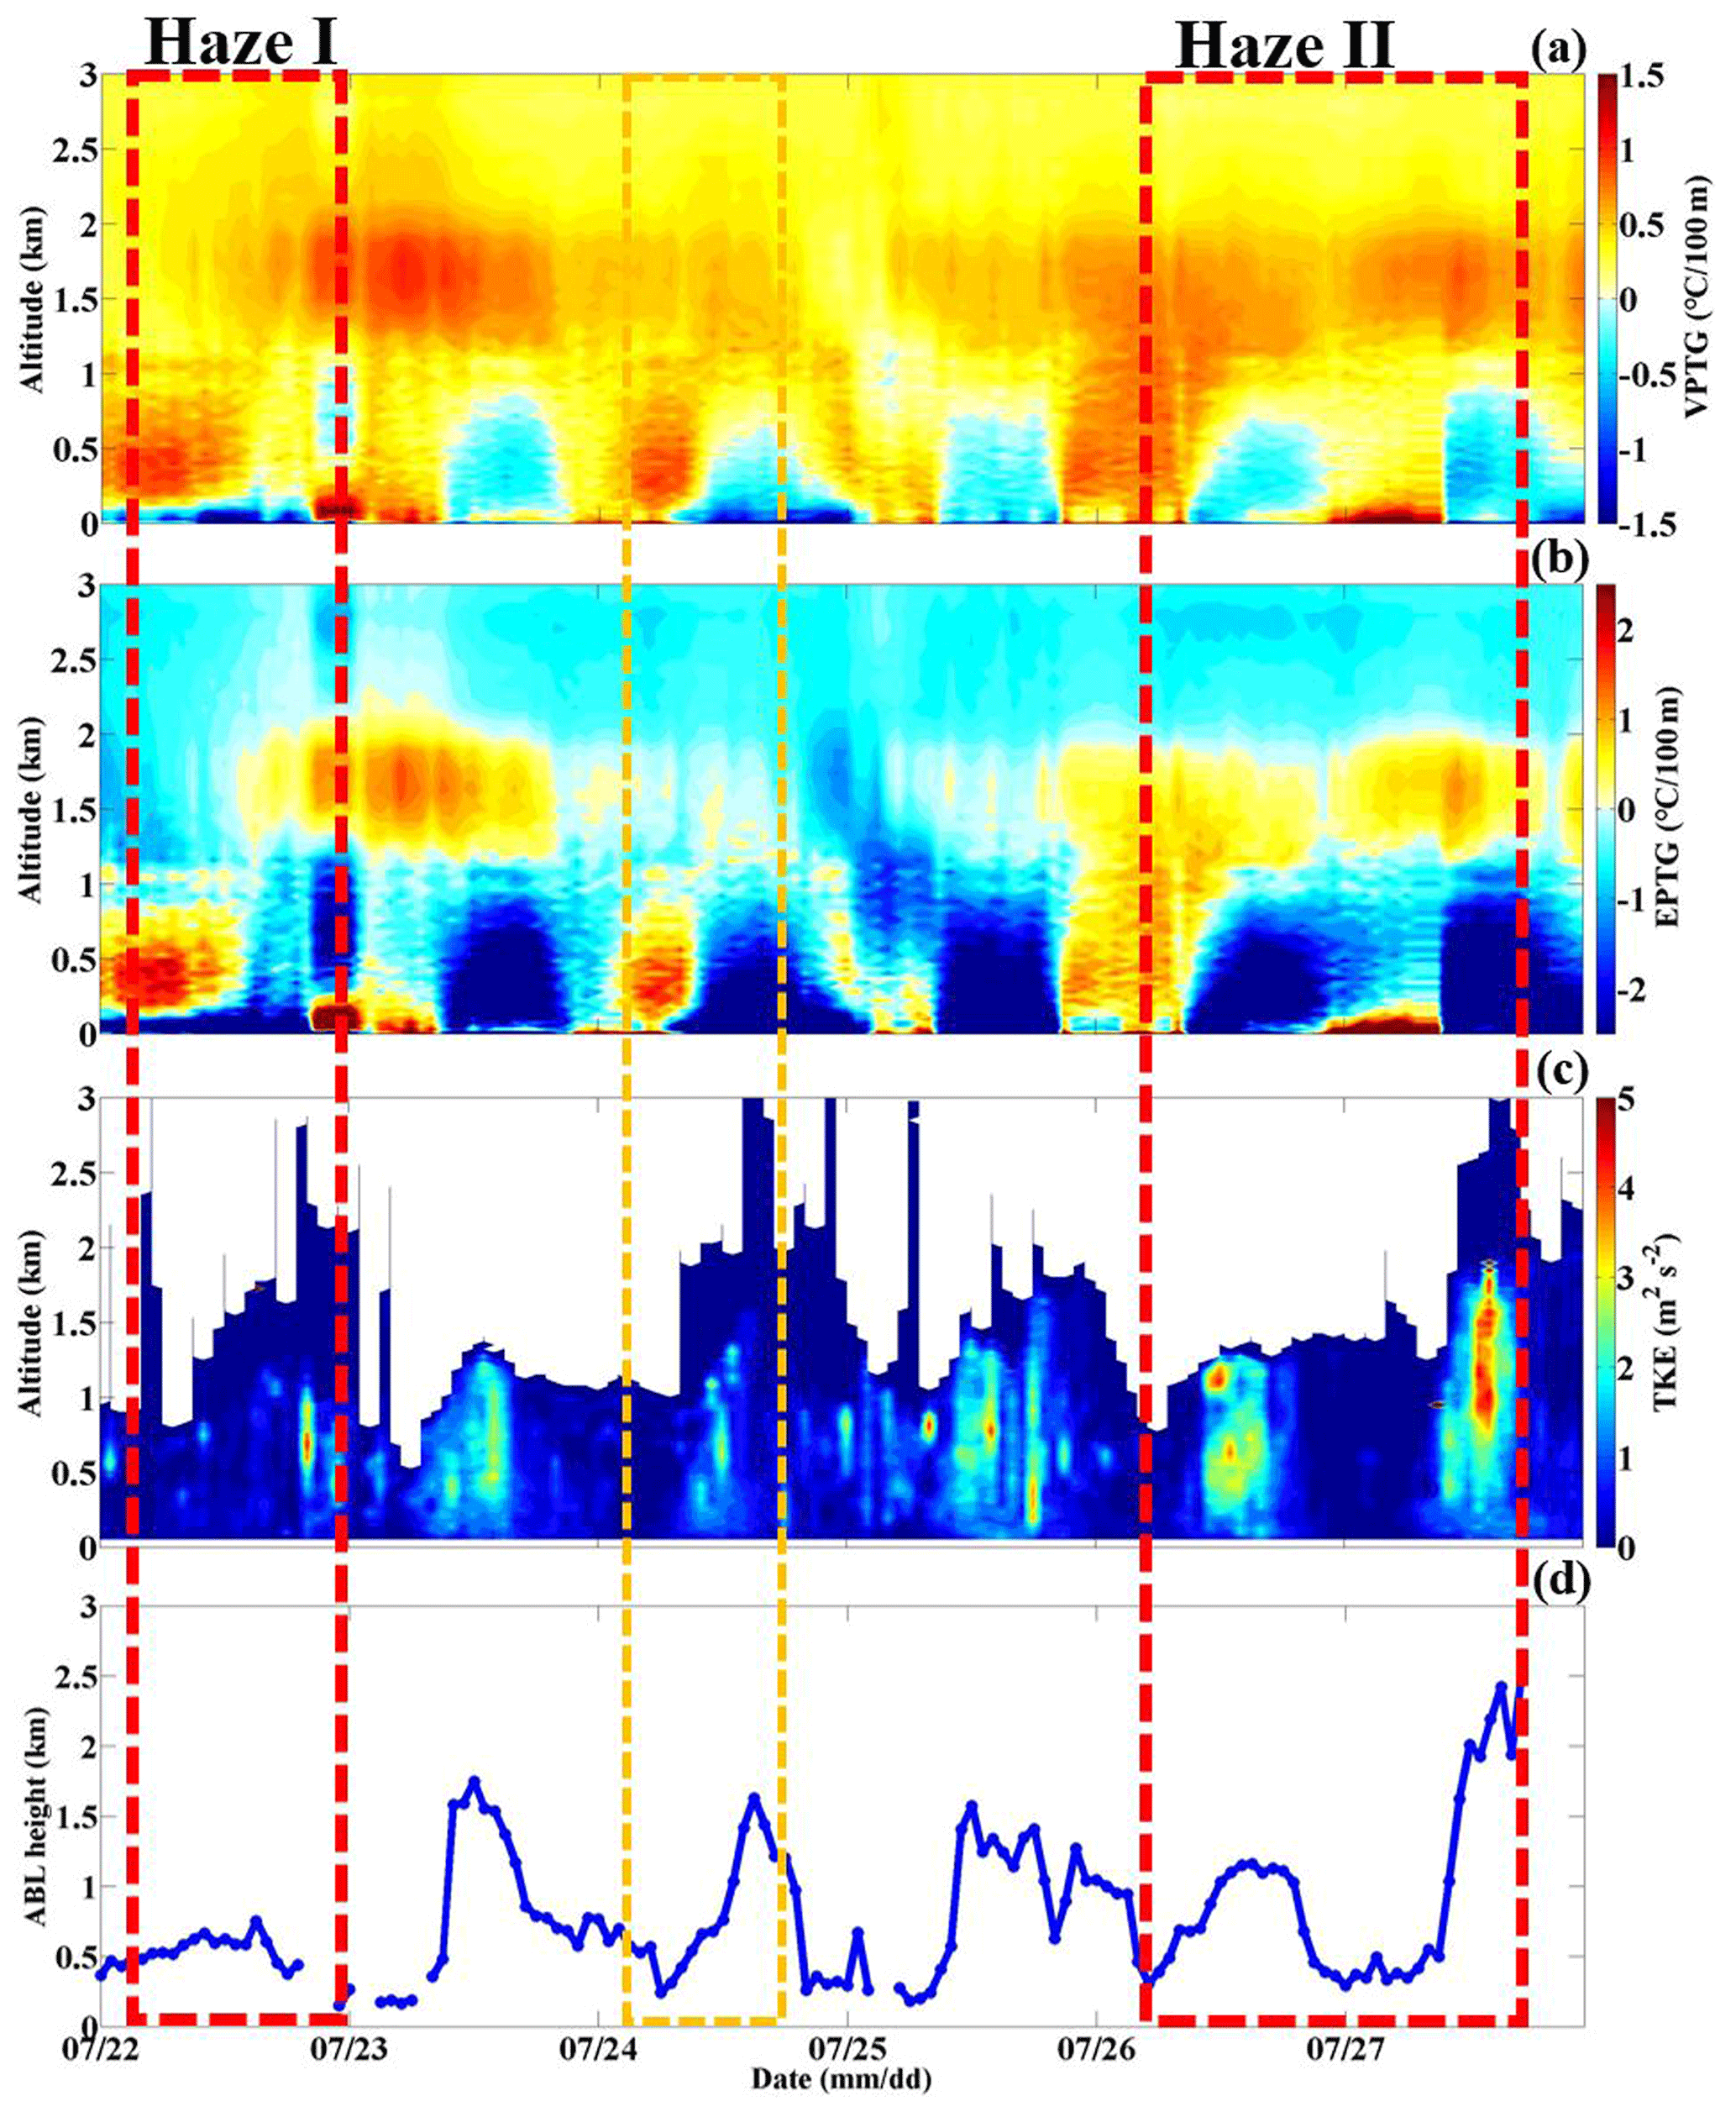
Figure 5Temporal variation in the vertical profiles of the (a) virtual potential temperature gradient (VPTG: ), (b) pseudoequivalent potential temperature gradient (EPTG: ) and (c) turbulent kinetic energy (TKE), along with the corresponding (d) atmospheric boundary layer height (ABLH) at the BJ site from 22 to 27 July, 2019 (the yellow box represents the light-haze pollution period, and the red box represents the heavy-haze pollution episode).
c. Secondary aerosol formation driven by a high atmospheric oxidation capacity
When the PM2.5 concentration increased due to the strong southerly winds in Beijing during the Haze II (Haze I) occurrence stage, O3 increased sharply, rapidly increasing from 67 (26) µg m−3 and peaking at 250 (131) µg m−3. As mentioned in Sect. 3.1, a high O3 concentration indicates a high atmospheric photochemical reactivity (Li et al., 2012; Seinfeld, 1986); thus, the atmosphere had a high oxidizing capacity with large amounts of free radicals (e.g., OH) and ozone, which promoted secondary aerosol formation (Pathak et al., 2009; Shi et al., 2015; Wang et al., 2016). Figure 6b shows that along with the increase in PM2.5 concentration during the occurrence stage, the organics, sulfate and nitrate concentrations in PM2.5 also gradually increased. The average organics, sulfate and nitrate concentrations during the Haze II (Haze I) occurrence stage were 15.6 (23.0), 10.0 (8.0) and 4.3 (24.7) µg m−3, respectively, and accounted for 40.7 (32.1) %, 25.3 (11.2) % and 12.2 (31.5) %, respectively, of the PM2.5 concentration. The total sulfate, organics, and nitrate (SON) concentration accounted for more than 75 % of the PM2.5 concentration during both the Haze II and Haze I occurrence stages (Fig. 6c), implying that the SON increase was the leading cause of the PM2.5 concentration increase. Secondary organic aerosols can be formed by the photochemical oxidation reactions of the VOCs emitted by vehicles (Hennigan et al., 2011). Thus, the high concentration and relative contribution of organics are mainly attributed to the notably active photochemical reactions in summer and high VOC emissions by vehicles in Beijing city. Due to the lack of VOC data, the detailed formation mechanism of secondary organics will be studied in the future. To examine the possible formation mechanism of secondary inorganic aerosols, the sulfur oxidation ratio (SOR) and nitrogen oxidation ratio (NOR) – defined as and , respectively, where [ ] indicates the molar concentration – were adopted in this paper. Higher SOR and NOR values suggest a higher oxidation efficiency of sulfur and nitrogen, which means that more secondary inorganic aerosols occur in the atmosphere (Z. Liu et al., 2019; Han et al., 2019; Yao et al., 2002; Kong et al., 2018; Sun et al., 2006).
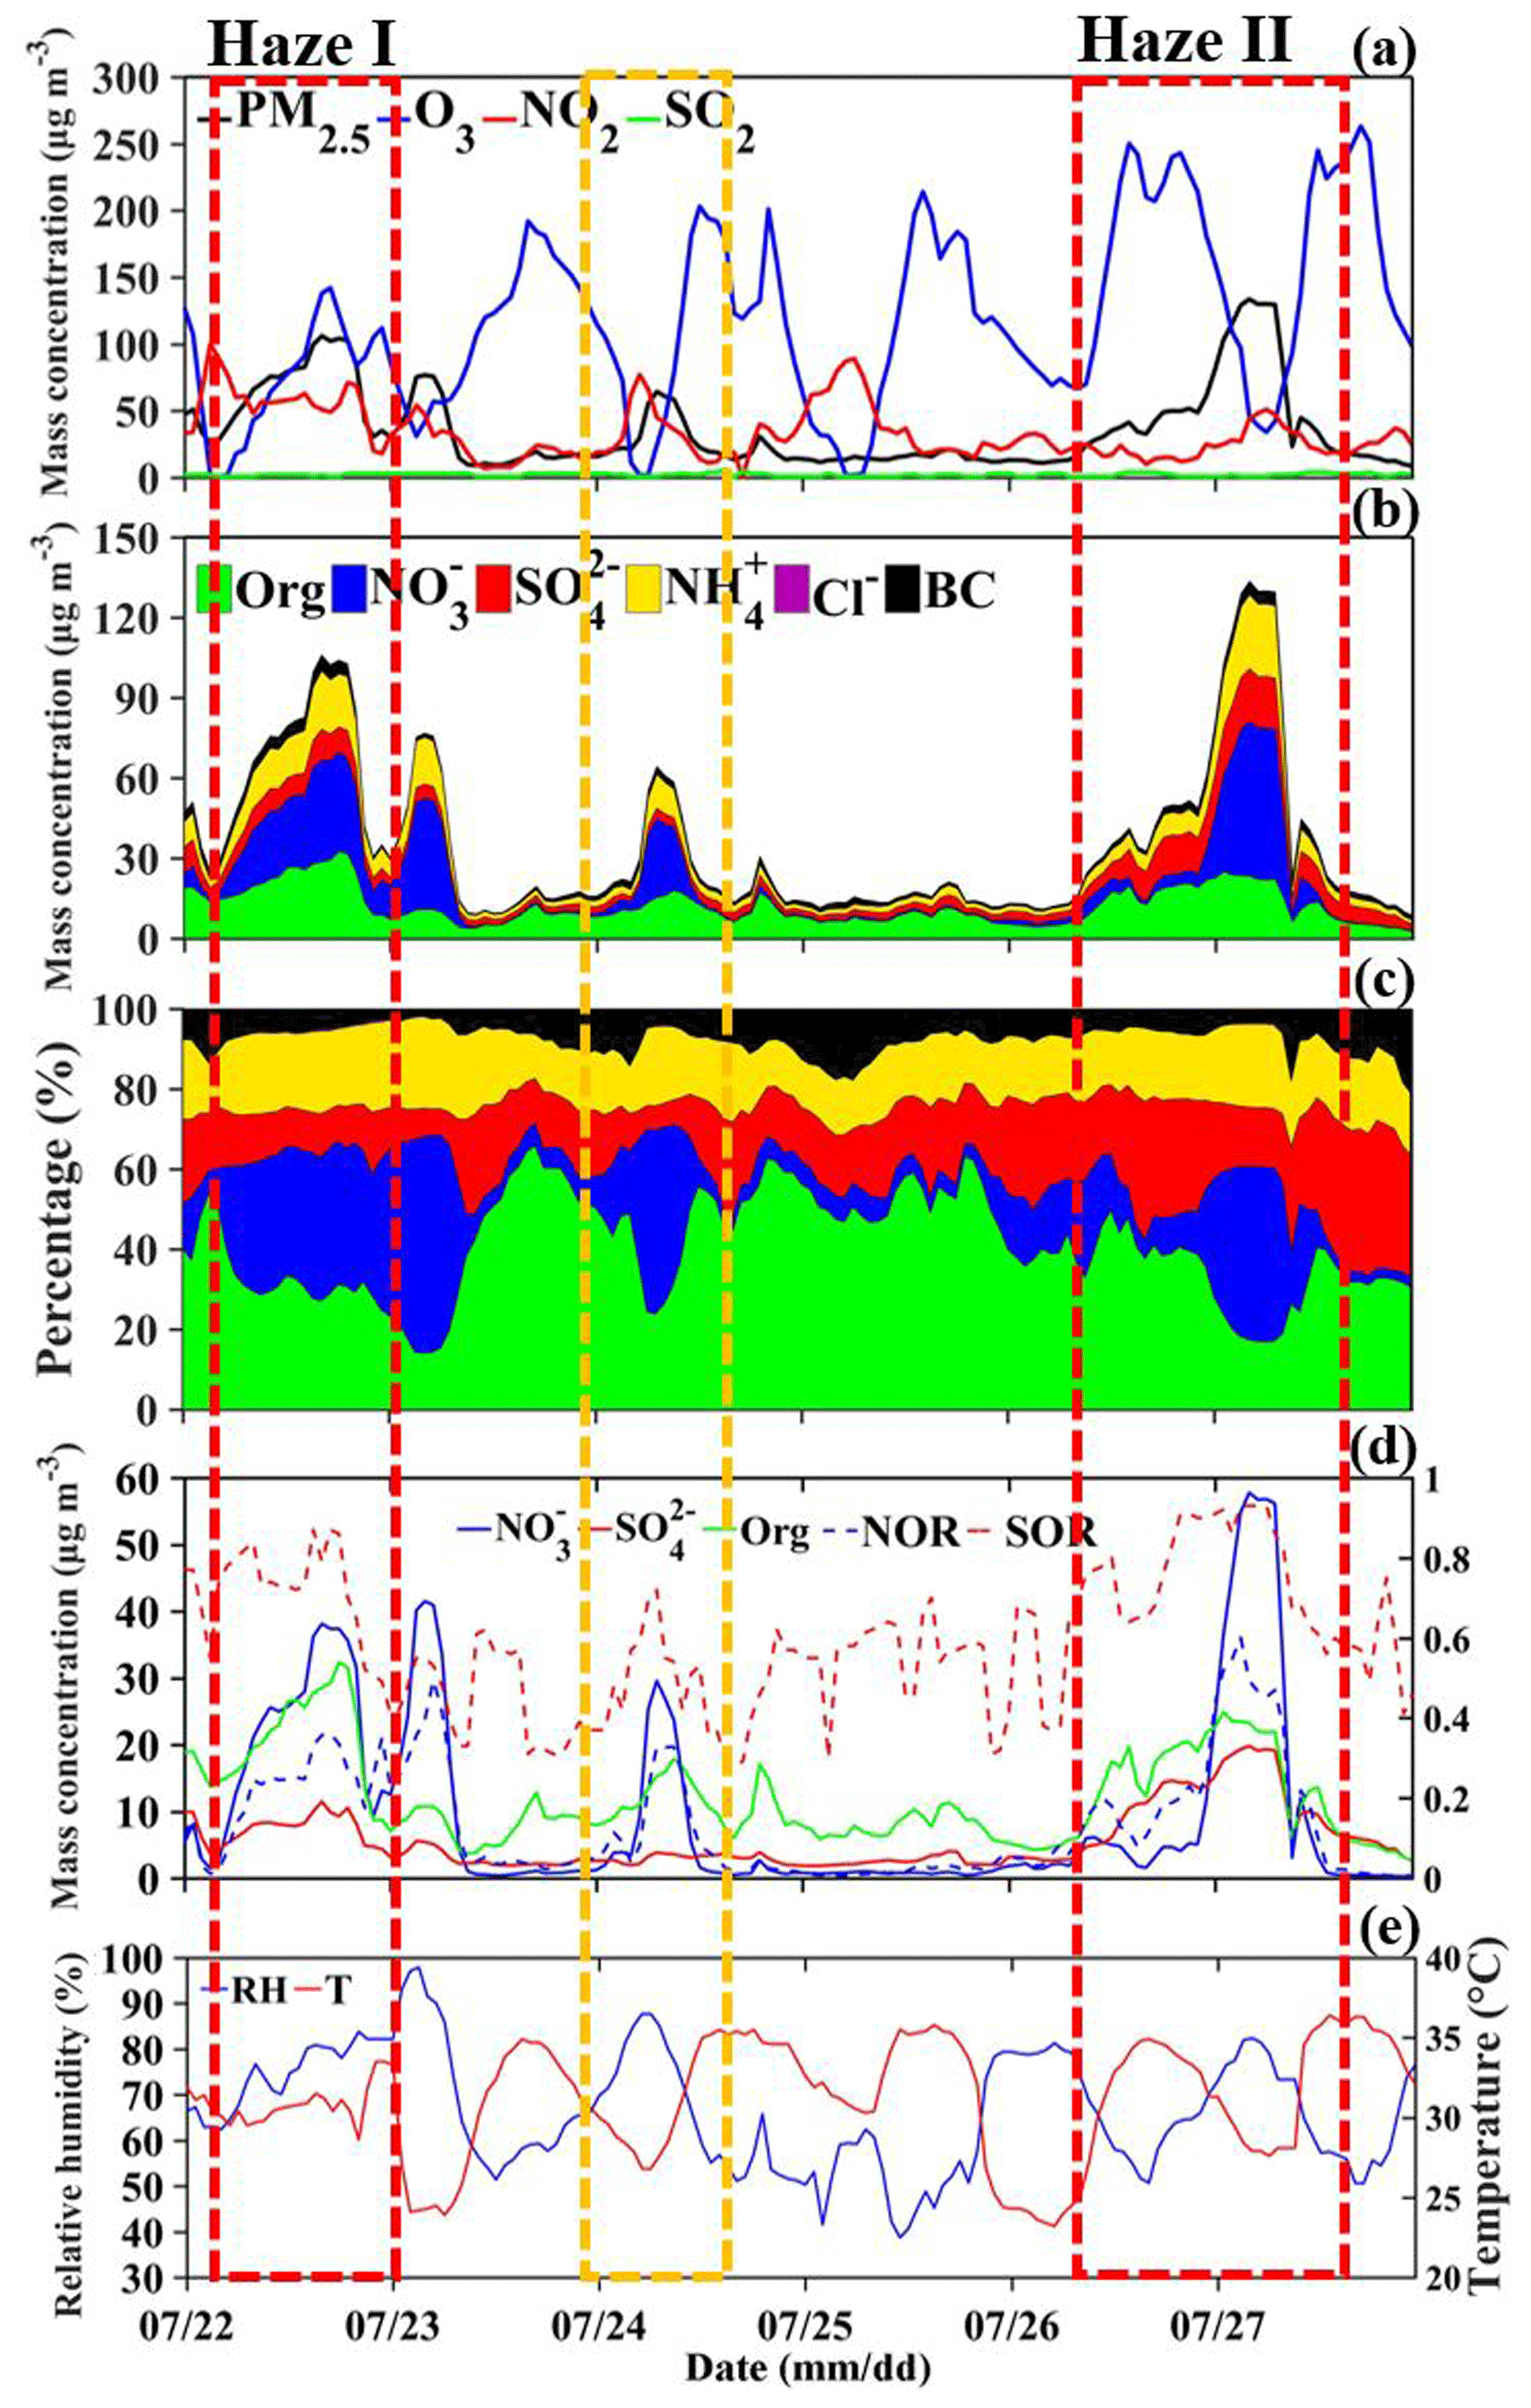
Figure 6Temporal variation in the (a) PM2.5, O3, NO2 and SO2 mass concentrations; (b) PM2.5 chemical composition, including organics (Org), sulfate (), nitrate (), ammonium salt (), chlorine salt (Cl−) and black carbon (BC) at the BJ site from 22 to 27 July 2019. (c) Temporal variation in the relative contributions of the chemical components to the PM2.5 mass concentration at the BJ site from 22 to 27 July 2019. (d) Temporal variation in the mass concentrations of the dominant PM2.5 chemical components, sulfur oxidation ratio (SOR) and nitrogen oxidation ratio (NOR) at the BJ site from 22 to 27 July 2019. (e) Temporal variation in the relative humidity (RH) and temperature (T) at the BJ site from 22 to 27 July 2019 (the yellow box represents the light-haze pollution period, and the red box represents the heavy-haze pollution episode).
Both homogeneous gas-phase and heterogeneous reactions can promote the formation of sulfate from SO2 during haze episodes (Khoder, 2002; Harris et al., 2013), thereby increasing the SOR. Notably, the SOR values during the whole observation period (from 22 to 27 July) were relatively high, averaging 0.62, along with relatively low SO2 levels, averaging 2.2 µg m−3 (Fig. 6a; d). The observed high SOR values could be attributed to the relatively high RH (an average of ∼66.6 %) (Fig. 6e) and the ubiquitous photochemical reactions in summer in Beijing (Han et al., 2019). Nevertheless, compared to the very low PM level on clean days (on 25 July) (Fig. 6d), the temporal variation in the sulfate concentration on 26 July (the Haze II period) and 22 July (the Haze I period) exhibited a distinct increasing trend during the occurrence stage, gradually increasing from 3.7 to 14.4 µg m−3 and from 4.2 to 11.5 µg m−3, respectively. Moreover, the SOR values also averaged ∼0.76 at higher levels during both the Haze II and Haze I occurrence stages compared to clean days, which attained an average of ∼0.55 (Fig. 6c). The results indicated enhanced secondary sulfate aerosol formation during the occurrence stage. However, the PM level and sulfate concentration on clean days were very low, but the O3 concentration was relatively high (Fig. 6a), reaching up to 214 µg m−3, which implied highly active photochemical reactions. Thus, although the notable photochemical reactions occurring during the daytime on 26 and 22 July facilitated homogeneous gas-phase SO2 oxidation to a certain extent, it was not the dominant reason for the sulfate increase during the occurrence stage. Notably, the PM level and total chemical component mass concentration slowly increased on 24 July with no pollution transportation by southern winds (Figs. 3a, b; 7e–h; 8e–h), while the average sulfate concentration was 2.8 µg m−3 and only accounted for 10.7% of the PM2.5 concentration, which is far lower than that during the Haze II period and similar to that on clean days. The average RH values were 61.4 % and 75.3 % during the Haze II and Haze I occurrence stages, respectively, which were also higher than those on clean days (54.5 %). According to the results mentioned above, the strong winds blowing from the south and southwest of Beijing transport much moisture and particles, and we infer that the increase in sulfate aerosols during the Haze II and Haze I periods can be mainly attributed to regional transport. Hence, the moisture and particles transported to Beijing further facilitated the heterogeneous reactions of SO2 on the moist aerosol surface. This highlights the importance and urgency of enhancing joint regional pollution emission control.
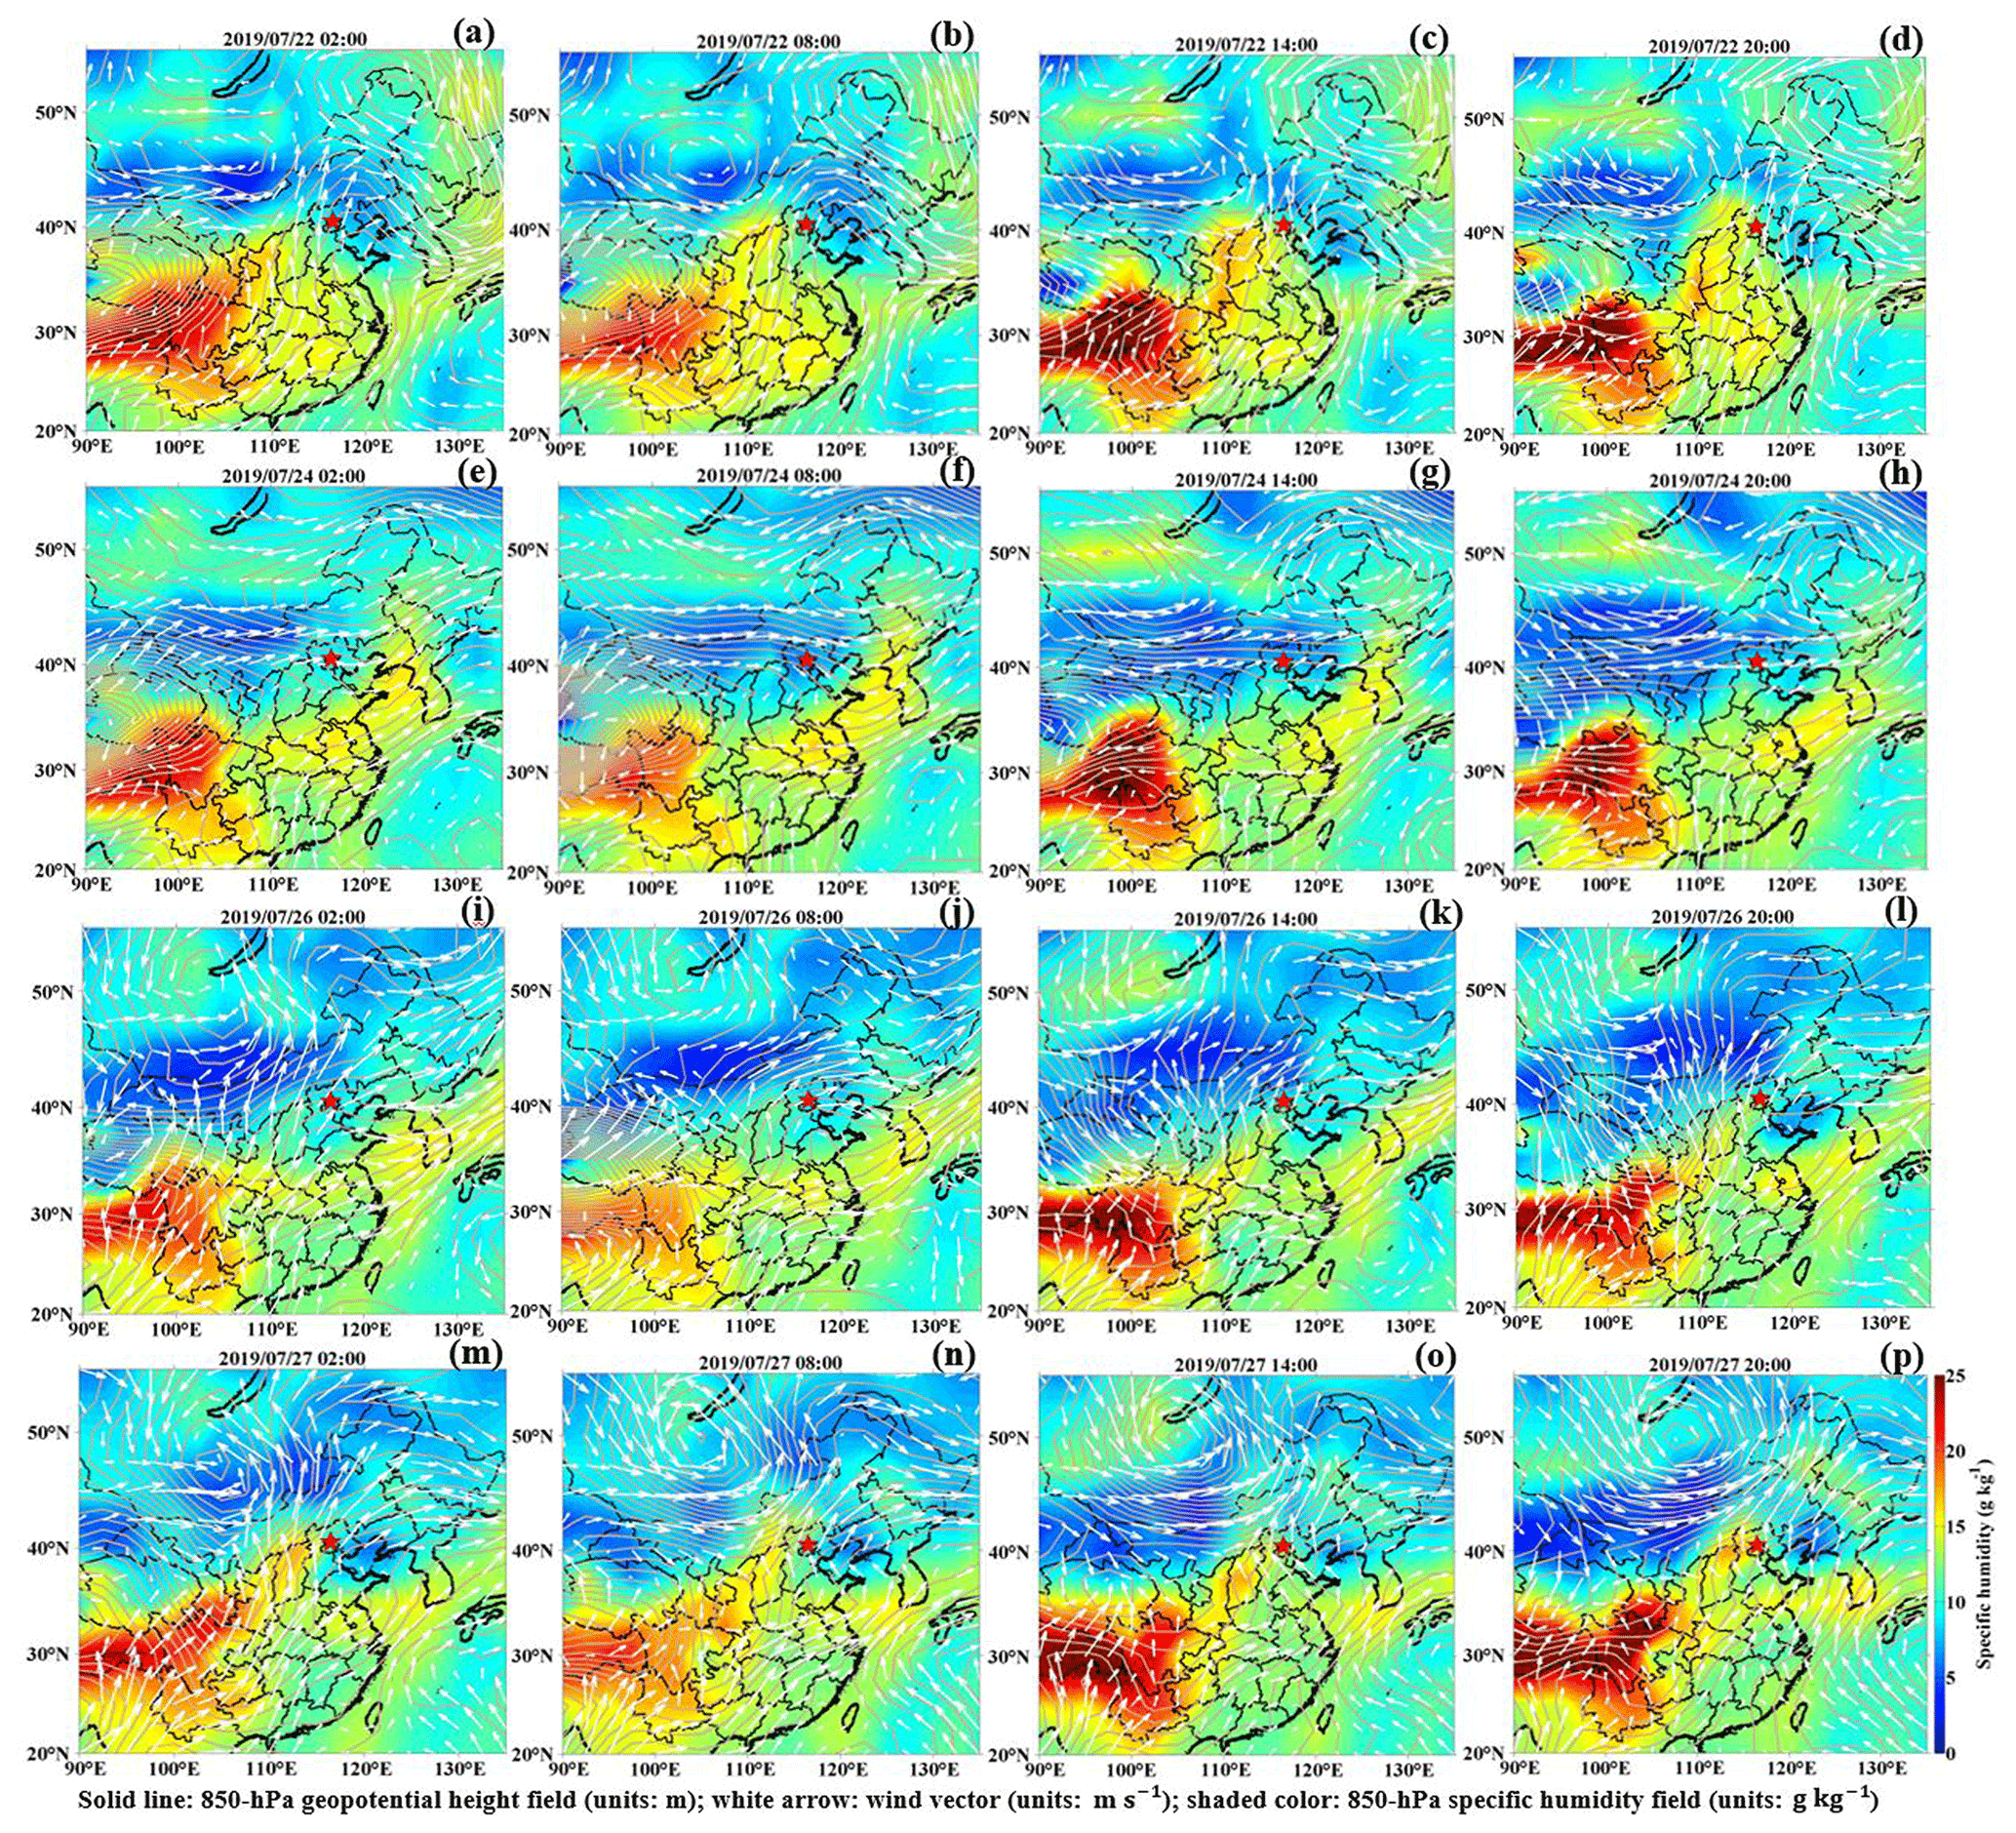
Figure 7Composites of the 850 hPa horizontal wind vector field (units: m s−1; white arrows), 850 hPa geopotential height field (units: m; solid lines) and 850 hPa specific humidity field (units: g kg−1; shaded colors) at 02:00, 08:00, 14:00 and 20:00 LT on 22, 24 and 26–27 July, labeled as (a–p). The star shows the location of the BJ site.
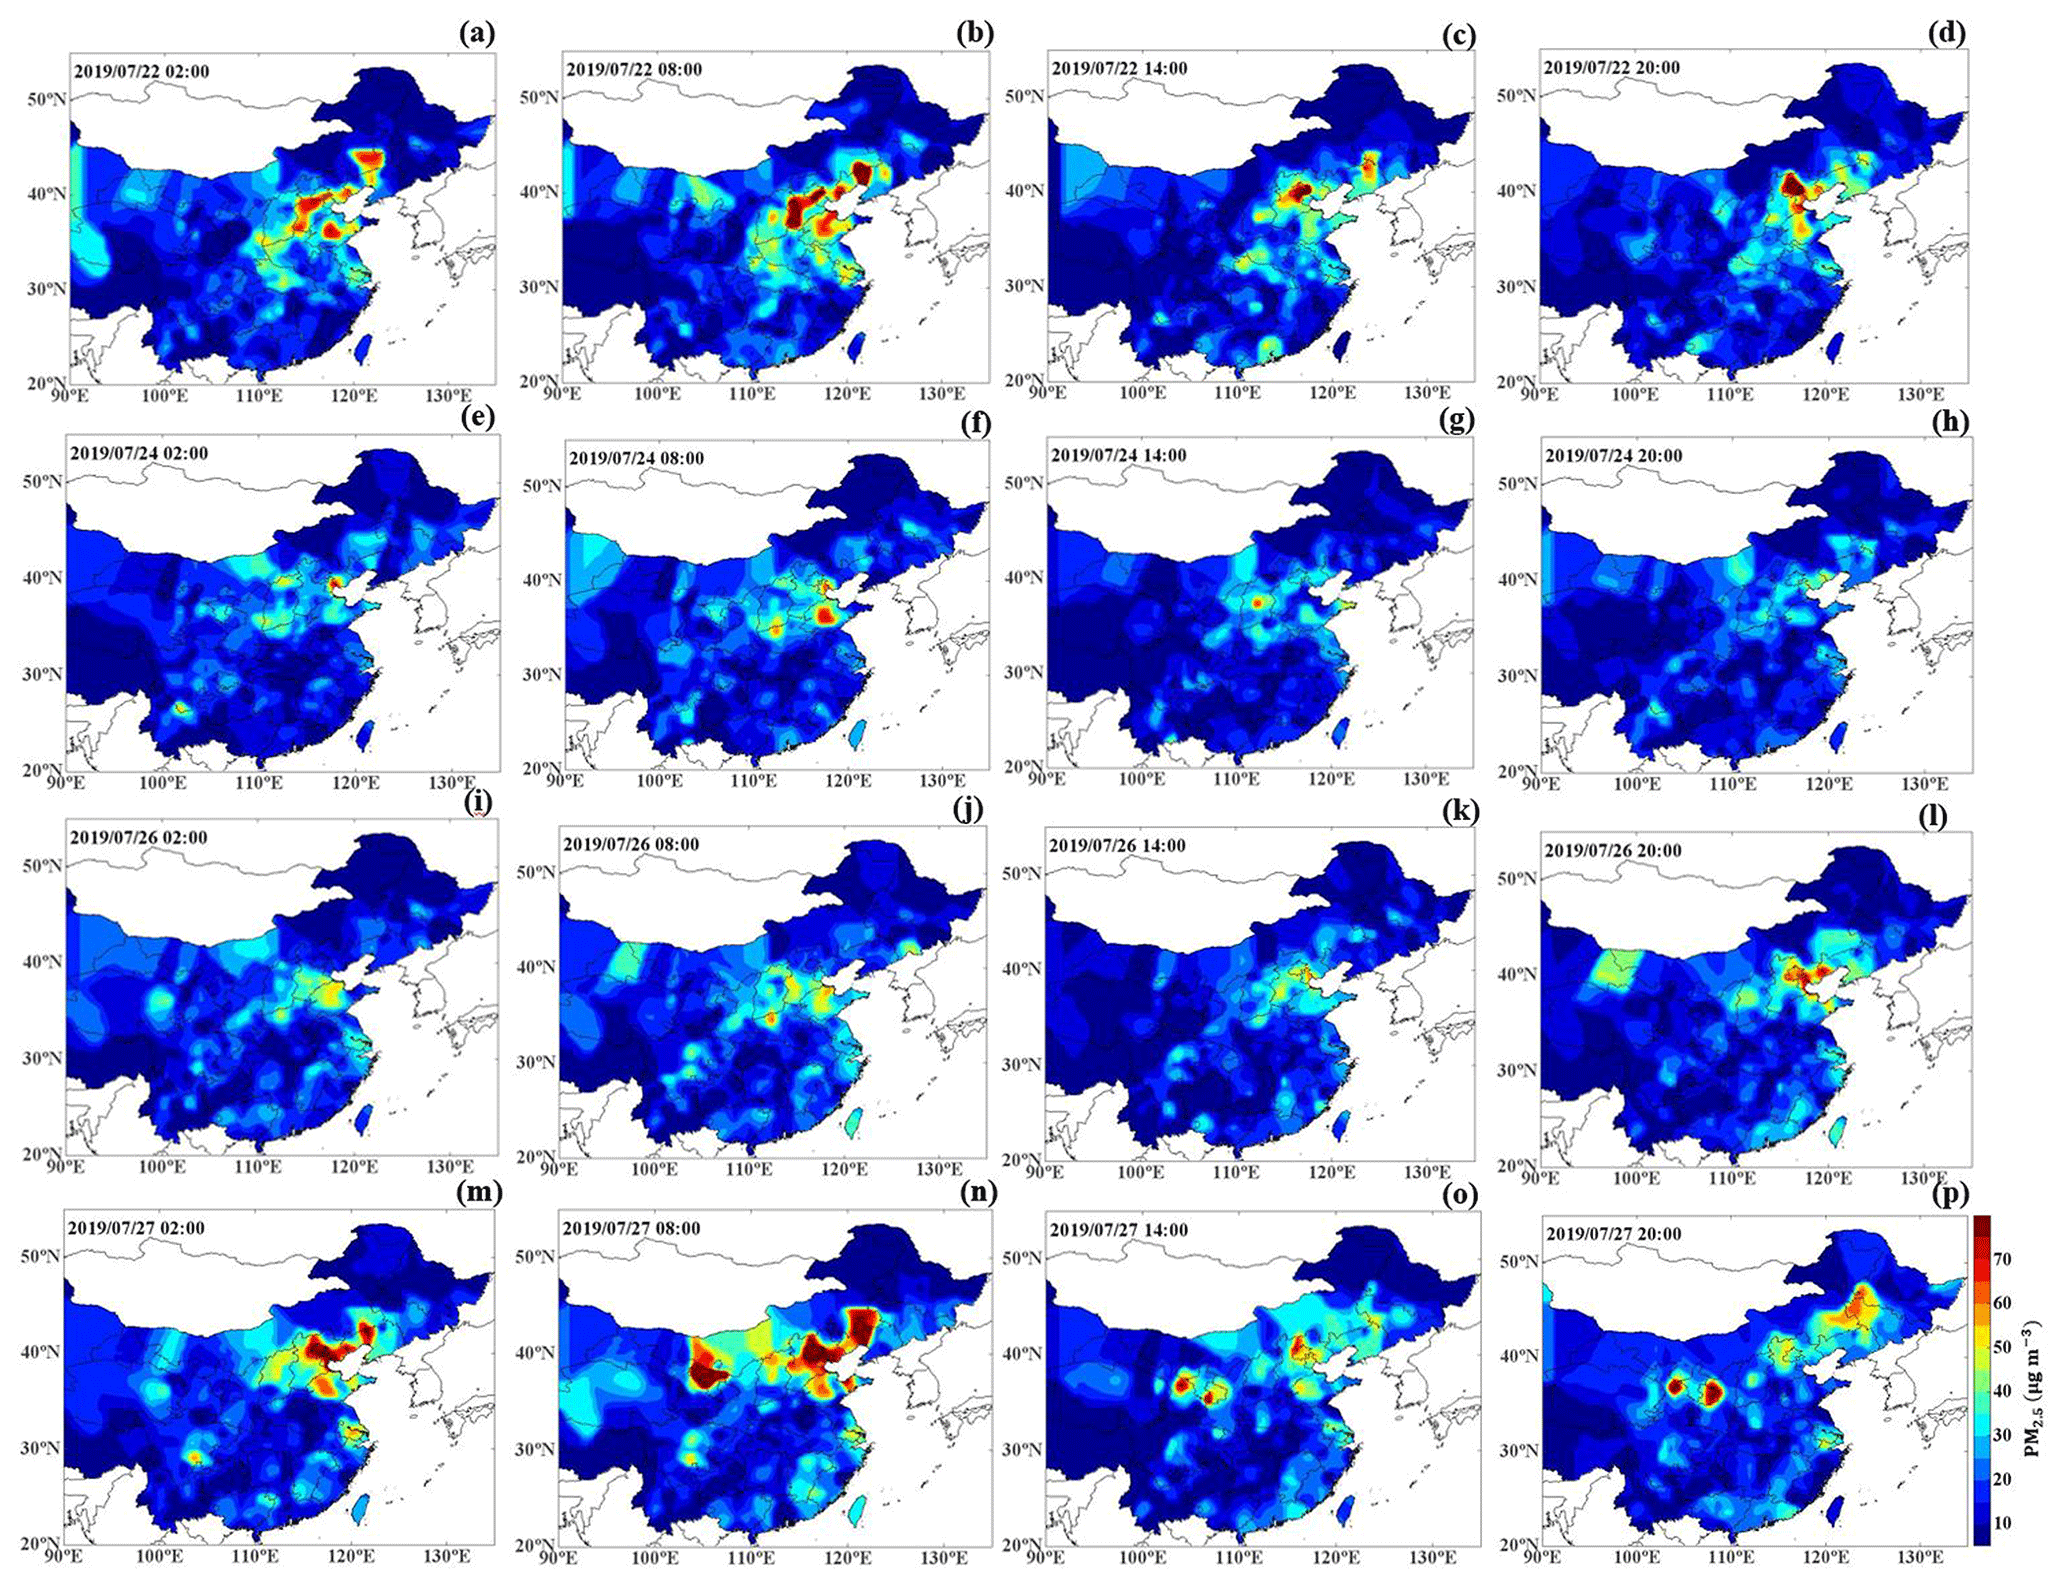
Figure 8The PM2.5 mass concentration distribution (units: µg m−3; shaded colors) over most of China at 02:00, 08:00, 14:00 and 20:00 LT on 22, 24 and 26–27 July, labeled as (a–p).
Nitrate is predominantly formed via both the homogeneous gas-phase photochemical reaction of NO2 with OH radicals in the daytime when the photochemical activity is high (Wang et al., 2006; Wen et al., 2018; Seinfeld and Pandis, 2006) and the heterogeneous hydrolysis reaction of NO3 and N2O5 in the atmosphere in the nighttime (Richards, 1983; Russell et al., 1986; Wang et al., 2009; H. Wang et al., 2017; Pathak et al., 2011). In addition, there exists an equilibrium between particulate nitrate and gaseous HNO3 and NH3 in the atmosphere, because ammonium nitrate is semivolatile (Seinfeld, 1986). A high temperature could promote ammonium nitrate decomposition; thus, the regional transport of ammonium nitrate in summer was not considered (Li et al., 2019). Figure 6b and d reveal that the nitrate concentration (NOR) during the occurrence of the Haze II stage slightly increased from 3.2 µg m−3 (0.09) at 08:00 LT to 5.2 µg m−3 (0.23) at 22:00 LT. The nitrate concentration (NOR) during the Haze I occurrence stage sharply increased from 2.7 µg m−3 (0.02) at 08:00 LT to 38.1 µg m−3 (0.36) at 16:00 LT. The nitrate concentration and relative contribution to PM during the Haze I period were markedly higher than those during the Haze II period (Fig. 6c). This inconsistency could be attributed to the higher temperature (averaging ∼34∘) during the Haze II period than that during the Haze I period (averaging ∼27∘) (Fig. 6e). These results indicated that strong photochemical reactions facilitated nitrate formation, thereby increasing the PM2.5 level, while nitrate decomposed into gaseous HNO3 and NH3 once the temperature was high enough. After 15:00 LT, the nitrate concentration increased in the presence of large amounts of radicals, and the temperature drop inhibited the reverse reaction. In the nighttime, the increase in nitrate aerosols was predominantly attributed to the heterogeneous hydrolysis reactions of NO3 and N2O5 in the atmosphere; more details are provided in the next section.
3.2.2 The outbreak stage
The PM2.5 mass concentration suddenly increased from 75 µg m−3 at 22:00 LT on 26 July to 146 µg m−3 at 04:00 LT on 27 July and remained high at ∼150 µg m−3 until 10:00 LT, which was identified as the outbreak stage of haze pollution (Fig. 3a). Compared to the atmospheric BSC ranging from 2.5 to 3 Mm−1 sr−1 on 26 July, the ambient particle concentration below the ∼0.5 km altitude sharply increased the atmospheric scattering coefficient, exceeding 6 Mm−1 sr−1 (Fig. 3b).
a. The almost negligible contribution of southerly transport
There were still strong southerly winds controlling Beijing at high altitudes (>0.5 km), accompanied by a more notable vapor transportation channel below (Fig. 7m, n). However, the PM levels in the southern and southeastern areas of Beijing, ranging from 0 to ∼60 µg m−3, were significantly lower than those (>80 µg m−3) in Beijing, even below air quality standards (Fig. 8m, n). It was unlikely that the explosive PM growth and the persistent high PM level in Beijing were caused by pollution transportation.
b. Extremely stable ABL structures are a prerequisite for pollution outbreaks
Without pollution transportation, more attention was focused on the interior of the local ABL, and Fig. 5 shows the temporal variation in the ABL structure. Both the and values became positive (∼1.5 and ∼2.5∘ per 100 m, respectively) below the ∼0.3 km altitude, as depicted in Fig. 5a and b. This implied that a very stable lower layer defined as the nocturnal stable boundary layer (NSBL) had formed with an ABLH of ∼0.3 km. Due to the notable radiation effect of the already high aerosol loading during the daytime, the surface solar radiation was greatly blocked and reduced, which promoted stable stratification at midnight (Zhao et al., 2019; Zhong et al., 2017). In such a thermally stable state, the buoyancy transport heat flux in the atmosphere continuously consumes turbulent energy, suppressing the development of turbulence. Therefore, the corresponding TKE had sharply decreased compared to that from 14:00–16:00 LT on 26 July, lower than ∼0.5 m2 s−2 and even approaching ∼0 m2 s−2 (Fig. 5c, d). However, the and values were positive and negative, respectively, from ∼0.3 to ∼1.5 km, which implies that this atmospheric layer was conditionally unstable. Considering the very low TKE like that below ∼0.3 km, this layer, referred to as the residual layer, was also absolutely stable. Thus, the ambient particles were restrained from vertically spreading and were concentrated below the NSBL, thereby increasing the ground PM level. Similarly, ambient water vapor was also not conductive to dispersed, which explained the extremely high humidity during this period. As shown in Fig. 4c and d, the atmospheric humidity during the outbreak stage was distinctly higher than that on 26 July with the AH (RH) reaching ∼20 g m−3 (∼90 %). In contrast to the role of the moisture transport channel, the unique NSBL structure has a more notable impact on the increase in air humidity.
In contrast, during the Haze I period on 22 July, no PM pollution outbreak stage occurred, as the PM2.5 mass concentration had sharply decreased from 131 to 53 µg m−3 in 1 h since 21:00 LT. The ambient particles did not accumulate and maintained a high level, similar to that during the Haze II period, because the ABL structure did not exhibit similar characteristics. The already high PM2.5 level (∼130 µg m−3) in the daytime accelerated surface cooling, causing the NSBL to more readily form at a very low height of ∼0.2 km. This situation was similar to that during the Haze II episode. Nevertheless, the TKE above the NSBL was very high, reaching 2–3 m2 s−2, in notable contrast to that during the Haze II episode, where the TKE was extremely low (∼0 m2 s−2) across the whole 0–1.5 km layer. The vertical temperature structures above the NSBL indicated that the atmosphere had attained conditional instability, while in terms of the TKE distribution the atmospheric stratification above the NSBL during the Haze I period was unstable in contrast to the stable stratification during the Haze II period. Because it rained at night with a high AH (15–20 g m−3) and RH (>90 %) extending from the surface up to an altitude of ∼3 km, the convection activity was quite strong accompanied by a wet deposition process. Due to the unstable ABL structure and the accompanying wet deposition, the ambient particle concentration did not sharply increase, but particles were instead removed from the atmosphere.
Noted is that the PM level on 24 July also tended to increase, but it suddenly decreased similar to that during the Haze I stage. There was no transportation effect contributing to the increase in PM level on 24 July under westerly circulation field control (Fig. 7e–h). Similar to the Haze I and Haze II occurrence stages, a stable atmosphere near the surface had formed with positive and values. Under this stable stratification, the PM from local emissions started increasing on 24 July. The anomalous vertical temperature structures during the nighttime were disrupted and transformed into unstable stratifications at the daytime, with negative () profiles. As observed during the Haze II episode, the ABL structure characterized by an increased TKE (2–3 m2 s−2) and elevated ABLH (∼1.5 km) resulted in rapid pollution dissipation. However, the difference between the Haze II process and the pollution process on 24 July was that the unstable atmospheric stratification with a high TKE on 24 July continued to develop until the end of the day, while, for the Haze II process, this condition lasted only 2 or 3 h at noon. Additionally, an NSBL was established at midnight during the Haze II process at an ABLH of ∼0.3 km, thus worsening the near-stratum vertical diffusion conditions. Therefore, the subsequent stable atmospheric stratification on 26 July was a prerequisite for the pollution outbreak during the Haze II process. Particles would not accumulate and cause pollution outbreak without a stable ABL structure but were easily removed by the self-cleaning capacity of the atmosphere.
c. Intense secondary aerosol formation driven by the atmospheric oxidation capacity causing the pollution outbreak
Heterogeneous aqueous reactions refer to the secondary formation of sulfates and nitrates largely related to the ambient humidity (Wang et al., 2012). The accumulation of water vapor in the NSBL facilitated secondary aerosol formation and further promoted the outbreak of PM pollution. To investigate the explosive growth mechanisms, we divided the PM pollution outbreak stage during the Haze II process into two stages: stage I from 22:00 on 26 July to 04:00 LT on 27 July and stage II from 05:00 to 10:00 LT on 27 July. During stage I, along with the explosive growth in PM2.5, the nitrate concentration rapidly increased from 11.6 to 57.8 µg m−3, while sulfate and organics slightly increased from 13.7 to 19.8 and from 21.8 to 24.9 µg m−3, respectively (Fig. 6d). During stage II, the nitrate concentration remained at its highest level of ∼57 µg m−3, and the sulfate level remained at ∼19 µg m−3, with the organics slowly decreasing (Fig. 6d). The explosive growth trend of nitrate is the most consistent with that of PM2.5. In addition, the average organics, sulfate and nitrate concentrations during the whole outbreak stage were 20.6, 15.9 and 43.0 µg m−3, respectively, and accounted for 22.0 %, 17.8 % and 34.9 %, respectively, of the PM2.5 concentration. Compared to the occurrence stage, the relative contributions of organics and sulfate to PM2.5 decreased significantly, while the contribution of nitrate notably increased. These results indicated that the explosive PM2.5 concentration growth was driven by the sharp increase in nitrate concentration. With strong photochemical reactions during the daytime, the O3 mass concentration was very high before the outbreak stage (up to 214 µg m−3). NO2 was produced by O3 reacting with a large amount of NO, which was discharged by vehicles during evening hours. NO2 reacted with O3 aloft to form NO3, which rapidly reacted with NO2 to form N2O5 at night. During stage I, NOR rapidly increased from 0.26 to 0.60, which implied that the NO2 oxidization rate sharply increased within a few hours. Considering that NO2 remained relatively low at ∼25 µg m−3 and O3 rapidly decreased from 214 to 46 µg m−3 during stage I (Fig. 6a), the consumption process of NO2 was more significant than its generation process. The NO2 produced through O3 consumption was constantly oxidized by O3 to generate a large amount of N2O5, resulting in a sharp decline in the O3 concentration. Once N2O5 was produced, it would be adsorbed onto moist particle surfaces and react with water droplets to form nitrate, resulting in a sudden nitrate increase from 11.6 to 57.8 µg m−3. During stage II, O3 slowly decreased to 34 µg m−3 at 06:00 LT on 27 July, and NO2 remained relatively high (44–51 µg m−3), which meant that the NO2 generation process dominated. Thus, the oxidization of NO2 did not further increase as the NOR remained at ∼0.45 during stage II. Hence, nitrate, formed along the pathway whereby N2O5 was adsorbed onto surfaces and reacted with water droplets, did not further increase, maintaining its highest mass concentration of ∼57 µg m−3. The processes mentioned above were unimportant during the daytime, because N2O5 was in equilibrium with NO3; that is, NO3 was photolyzed and rapidly destroyed by NO, which in turn occurred whenever NOx and sunlight were present. During stages I and II, the SOR always remained relatively high at ∼0.95, accompanied by a high RH of ∼90 %. A high SOR and RH signified that heterogeneous reactions dominated the formation of particulate sulfate during the outbreak stage. The increased sulfate amount, which was lower than that of nitrate, may be related to the low SO2 emissions and massive NO emissions from the large number of vehicles. This highlights the importance and urgency of enhancing NOx (vehicle) emission control.
Contrary to expectations, after the wet deposition process during the Haze I period, the PM2.5 and NO2 concentrations and the total chemical composition abruptly increased at 00:00 LT on 23 July, accompanied by a sharp increase in nitrate and NOR (from 9.3 to 41.5 µg m−3 and from 0.26 to 0.49, respectively). These results may be related to the high RH (higher than 93 %), which facilitated the heterogeneous hydrolysis reaction of NO3 and N2O5, formed from gas pollutants NOx and O3 not completely removed in the wet deposition process.
3.2.3 The diffusion stage
After 10:00 LT on 27 July, the PM2.5 mass concentration sharply decreased to 50 µg m−3 over 3 h, during which the atmospheric BSC decreased to Mm−1 sr−1 across the whole ABL (Figs. 3 and 8o and p). This represented the pollution diffusion stage. As no wet deposition process occurred, the Haze II diffusion stage was different from that of Haze I. Generally, the arrival of strong and clean air masses from the south is the main factor dissipating air pollution in Beijing (Zhong et al., 2017, 2018; Zhao et al., 2019). Calm and light winds in the lower layer dominated during the outbreak stage, while sudden increased southeastern winds persisted in the 0–2 km layer after 08:00 LT on 27 July, with a wind speed of 6–9 m s−1 (Figs. 7n–q and 4a). The southeastern winds originated from the Bohai Sea and the Yellow Sea. Moreover, during this diffusion stage, the air quality of the southeast of Beijing was basically clean or much better than that in Beijing (Fig. 8n–p). Therefore, strong southeastern winds would not bring pollutants aggravating the pollution in Beijing but instead played a role in the horizontal diffusion of the accumulated PM at the surface. On the other hand, accompanied by the horizontal diffusion, the strong solar radiation at noon reached the surface and changed the vertical temperature structure. The ABL was extremely unstable in terms of both and , which were negative below ∼1.0 km with values of −0.5 and −2.5∘ per 100 m, respectively (Fig. 5a and b). Along with this instability, the development of turbulence in the ABL was very strong and quick, with the TKE suddenly increasing to 3–5 m2 s−2 (Fig. 5c). Accompanied by pronounced turbulence development, the ABL continuously developed upward with the ABLH up to ∼2.5 km over a short time (Fig. 5d). The ABL structure quickly became extremely suitable for vertical pollutant diffusion; thus, the PM level sharply decreased during this time.
In contrast to PM2.5, the O3 concentration rapidly increased with increasing radiation, along with the high NO2 and NO concentrations attributed to morning traffic emissions. Along with the decline in PM2.5, organics and sulfate slowly decreased to below ∼3 µg m−3, and nitrate decreased to below 1.0 µg m−3. The average organics, sulfate, and nitrate concentrations were as low as 6.8, 6.2 and 1.9 µg m−3, respectively, and accounted for 33.0 %, 32.3 % and 6.0 %, respectively, of the PM2.5 concentration. As the significant turbulence activity caused vertical transportation of vapor, heat and particles, the RH decreased to ∼60 %, accompanied by a decline in SOR (∼0.75). This emphasized the notable correlation between the humidity and the heterogeneous formation mechanism of sulfate. In addition, the NOR rapidly decreased from 0.22 to 0.01, coinciding with the change in nitrate. At this stage, the temperature always remained high at ∼35∘. Thus, similar to the occurrence stage, ammonium nitrate evaporated at high temperatures, contributing to a decline in nitrate. In summary, during the diffusion stage, the unstable ABL structure was not only conducive to pollution diffusion but also affected T and RH to inhibit secondary aerosol formation and further reduced secondary aerosols.
Regardless of the wet deposition process during the Haze I period or the horizontal and vertical diffusion during the Haze II period, air pollution eventually dissipated as long as the atmosphere was in a specific state. In other words, this implies that the self-cleaning capacity of the atmosphere was responsible for air pollution dispersion. When the atmosphere attains a specific state, its self-cleaning capacity removes pollution. To examine this phenomenon, the key factors characterizing the self-cleaning capacity of the atmosphere should be determined first. As analyzed above, once the TKE increased to >1.5–2 m2 s−2, the ABLH increased and exceeded ∼1 km and the and values became negative, as well as no calm or light winds persisted. The atmosphere was unstable with notable turbulence activities and advection transport, and air pollution was immediately dissipated. Owing to the limited observation time, the results regarding the characteristics of the self-cleaning capacity of the atmosphere may not be universal, and a more comprehensive investigation on the self-cleaning capacity of the atmosphere will be conducted in the future.
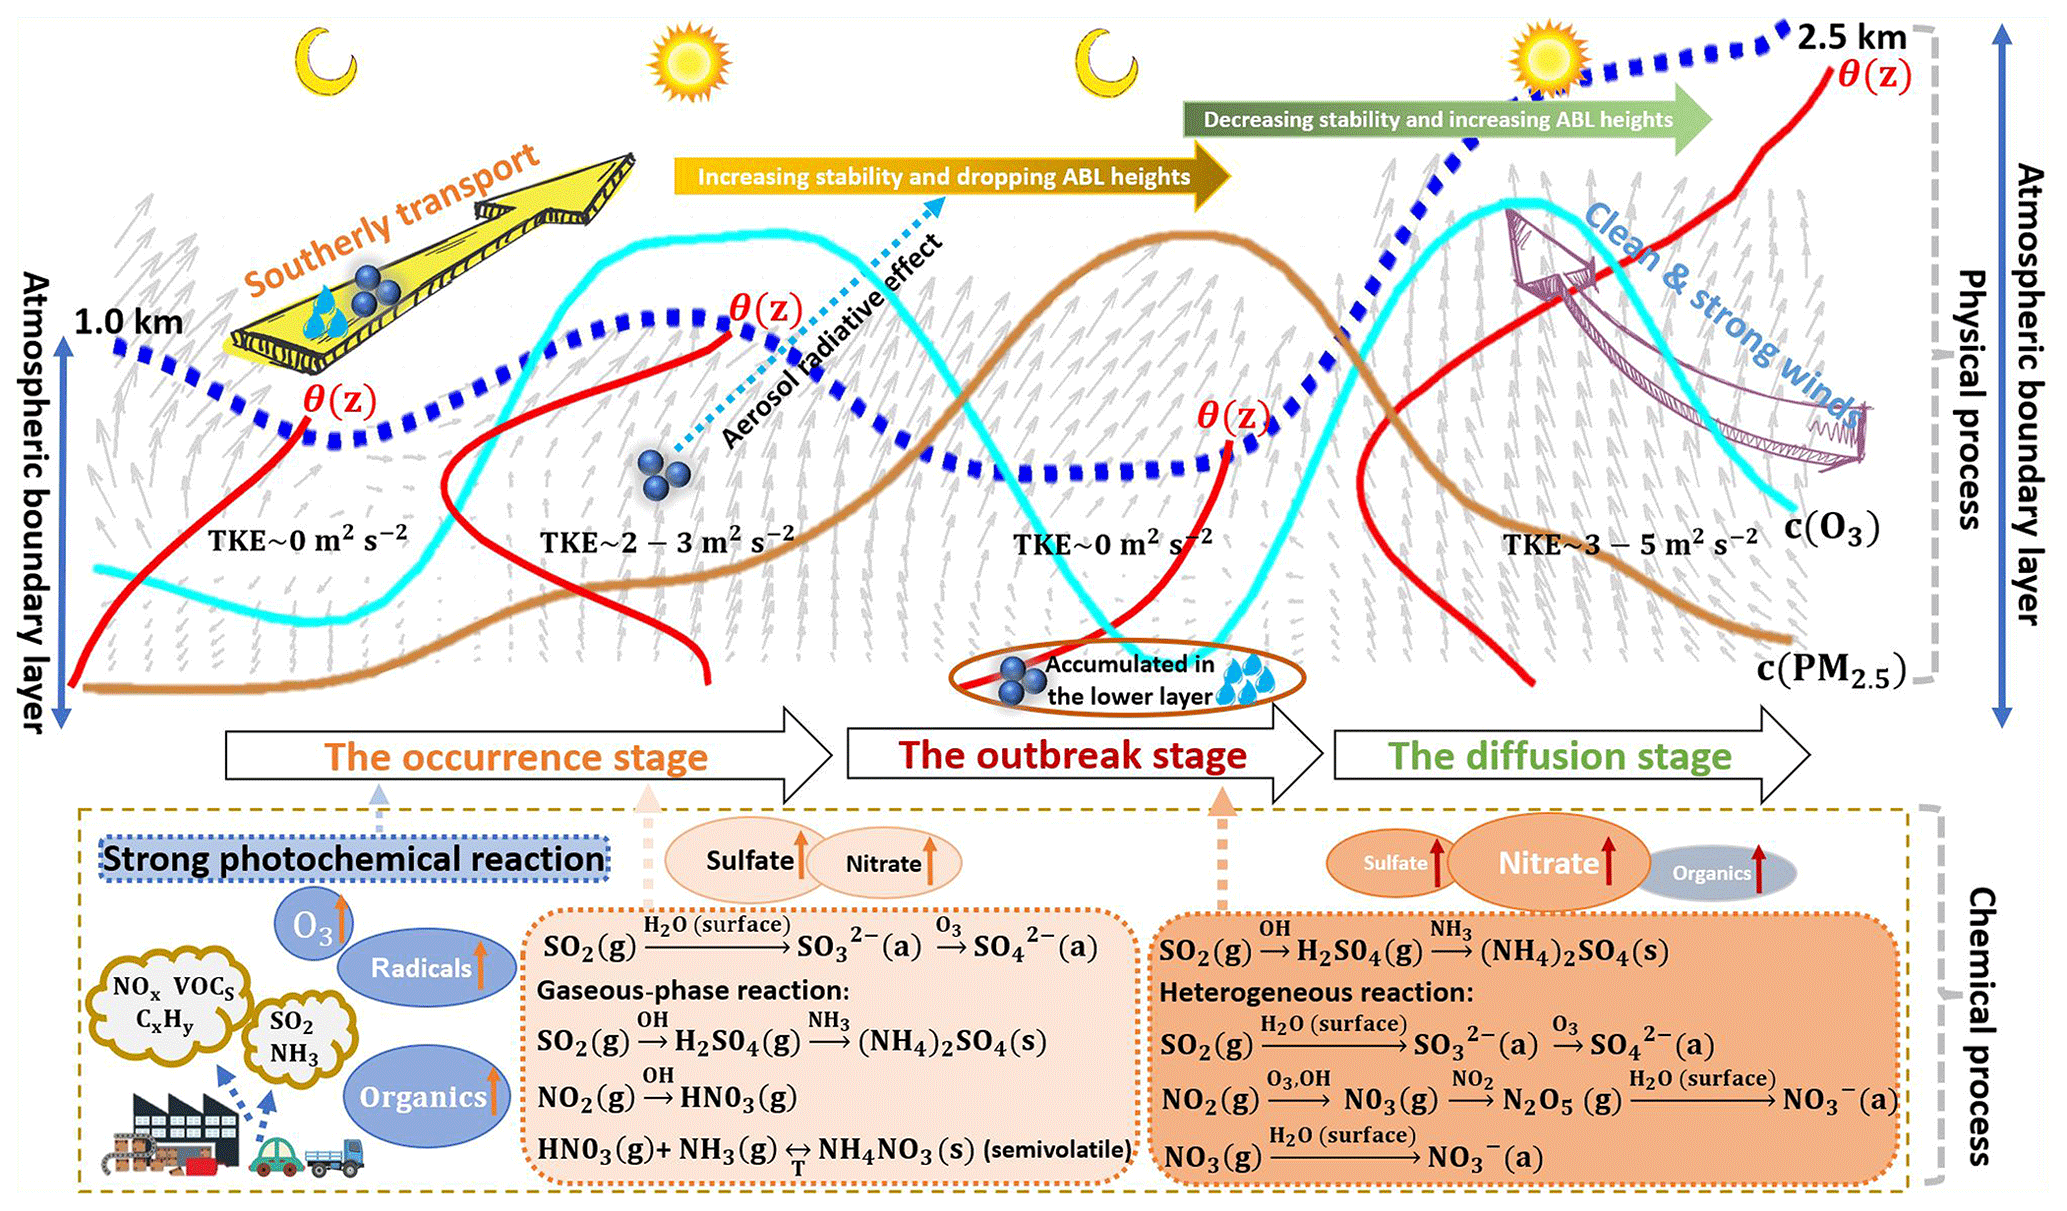
Figure 9Schematic diagram for the formation mechanism of haze pollution under a high atmospheric oxidization capacity in summer in Beijing (dashed blue line: atmospheric boundary layer; solid red lines: potential temperature gradient profiles; solid brown line: temporal change curve of the ozone concentration; solid cyan line: temporal change curve of the PM2.5 mass concentration; gray arrow sectors: temporal change in the wind vector profiles; TKE: turbulence kinetic energy; solid dots: particulate matter in the atmosphere; and droplets: water vapor).
The extremely serious haze pollution episode characterized by alternating and synchronous heavy PM loadings and high ozone concentrations occurred in summer in Beijing. Combined with a series of observations, the formation mechanism of haze pollution under a high atmospheric oxidization capacity has been systematically analyzed in terms of the atmospheric physical and chemical processes and schematically depicted in Fig. 9. The occurrence of haze pollution in summer in Beijing was mainly attributed to southerly transport and influenced by the ABL structure to a certain degree (physical process), which was further promoted by intense secondary aerosol formation under a high atmospheric oxidation capacity (chemical process). On the one hand, the physical process, where large amounts of moisture and particles were transported to Beijing by strong southerly winds, caused haze pollution initiation in Beijing, consistent with previous studies, e.g., Huang et al. (2017) and Zhong et al. (2019). Moreover, we found that haze pollution occurred when the ABL structure was extremely stable with a low TKE and a positive potential temperature gradient (), which increased the PM level in Beijing. The stable ABL was disrupted and transformed into an unstable structure (negative ) with high solar radiation in the afternoon (Andrews, 2000), responsible for the fluctuations in the PM increase process. On the other hand, the concentration of secondary aerosols such as sulfate, nitrate, and organics quickly increased. The very high O3 concentration in the daytime indicates an active atmospheric photochemical reactivity (Li et al., 2012; Seinfeld, 1986) and a high atmospheric oxidizing capacity with large amounts of free radicals (e.g., OH) and ozone, which promotes secondary aerosol formation (Pathak et al., 2009; Shi et al., 2015; Wang et al., 2016). However, we found that the distinct increase in sulfate concentration was mainly linked to southerly transport, which carried heavy sulfate aerosol loadings to Beijing. The physical process – where the extremely stable ABL inhibited PM and moisture diffusion, thus increasing the ambient humidity and ground-level PM2.5 – was a prerequisite for haze pollution outbreak. Under a stable ABL, secondary aerosol formation dominated by nitrate was quite intense, driving the pollution outbreak. The PM levels in the southern and southeastern areas of Beijing were significantly lower than those in Beijing, even below air quality standards. The contribution of pollution transport was negligible. Owing to the already high PM2.5 level during the daytime, the strong aerosol radiation effect cooled the surface and heated the above layer (Dickerson et al., 1997; Stone et al., 2008; Wilcox et al., 2016), which facilitated NSBL formation. The value in the NSBL was thus found to be positive, thus increasing the atmospheric stability, decreasing the ABLH and decreasing the TKE. The ambient particles and moisture would be restrained from vertically spreading and became concentrated below the NSBL (Stone et al., 2008), resulting in elevated PM and humidity levels at the surface. In addition, there was a large increase in NOR and an explosive growth in the nitrate concentration during the outbreak stage. Due to the high O3 level produced by the intense photochemical reactions during the daytime and the NOx discharged by vehicles during evening peak hours, vast amounts of N2O5 and NO3 were formed through oxidization reactions (Chang et al., 1967; Wilson Jr et al., 1972). Under a very high humidity, the heterogeneous hydrolysis reactions of N2O5 and NO3 at the moist particle surface were very notable, resulting in the formation of large amounts of nitrate aerosols (Richards, 1983; Russell et al., 1986; Wang et al., 2009; H. Wang et al., 2017; Pathak et al., 2011). Considering that pollutant transport from outside considerably affected haze formation in Beijing, especially during the occurrence stage, continuous regional joint control of air pollution should be enhanced. In addition, as reported in previous studies (Li et al., 2012; Pathak et al., 2009; Seinfeld, 1986; Shi et al., 2015; Wang et al., 2016; Zhong et al., 2018) and confirmed in this study, the atmospheric oxidization capacity, enhanced by photochemical reactions, largely facilitated secondary aerosol formation, which further aggravated pollution. In this study, secondary organic aerosols and secondary nitrate aerosols significantly increased and were the most important constituents of particles during the haze episodes. Photolysis of NOx triggers photochemical reactions, in which the reactions with VOCs are important (Hennigan et al., 2011; Seinfeld and Pandis, 2006; Wang et al., 2006; Wen et al., 2018). Additionally, NOx and VOCs are precursors of nitrate and organics, respectively. Thus, controls should be strengthened for supervising heavy diesel vehicles and collaboratively controlling NOx and VOC emissions. As the PM level gradually increased, a wet deposition process and an extremely unstable ABL structure were observed on 22 July (the Haze I period) and 24 July, respectively, and the ambient particles sharply decreased before the outbreak stage. This emphasized that the ABL structure extremely restrained the diffusion of substances and was a prerequisite for pollution outbreaks, with clean and strong winds passing through Beijing, the ABL becoming unstable with a negative value and an increased ABLH. The high turbulence activity promoted pollution diffusion. Regardless of the wet deposition process or the high turbulence activity, air pollution would eventually dissipate once the atmosphere was in a specific state. The self-cleaning capacity of the atmosphere was responsible for air pollution diffusion. When the atmosphere is in a specific state, its self-cleaning capacity becomes dominant, which is worthy of further study.
The surface PM2.5 and PM10 data and observation data of the other trace gases in this study can be accessed at http://106.37.208.233:20035/ (last access: 13 April 2020, China National Environmental Monitoring Center, 2020). Atmospheric reanalysis data were obtained from the National Centers for Environmental Prediction (NCEP) (https://www.esrl.noaa.gov/psd/data/, last access: 13 April 2020, NOAA Physical Sciences Laboratory, 2020). The other datasets can be obtained upon request from the corresponding author.
XJ had the original idea and designed the whole structure of this work. ZD and LG performed the research and wrote the paper, contributing equally to this study. QJ, WY and WX provided writing guidance, revised and polished the paper. GC, LZ, TG, HB and WL designed the experiments and DL, MY, WX and WF carried them out. All the authors have made substantial contributions to the work reported in the article.
The authors declare that they have no conflict of interest.
This article is part of the special issue “In-depth study of air pollution sources and processes within Beijing and its surrounding region (APHH-Beijing) (ACP/AMT inter-journal SI)”. It is not associated with a conference.
This study was supported by the Ministry of Science and Technology of China (grant no. 2016YFC0202001), the CAS Strategic Priority Research Program (grant no. XDA23020301), the Ministry of Science and Technology of China (grant no. 2017YFC0210000) and the National Natural Science Foundation of China (grant no. 41375036). The authors are grateful for services rendered by the National Oceanic and Atmospheric Administration (NOAA) and National Centers for Environmental Prediction (NCEP). The authors are thankful for the data support from the National Earth System Science Data Sharing Infrastructure, National Science & Technology Infrastructure of China (http://www.geodata.cn/, last access: last access: 13 April 2020).
This research has been supported by the Ministry of Science and Technology of China (grant nos. 2016YFC0202001, 2017YFC0210000), the CAS Strategic Priority Research Program (grant no. XDA23020301), and the National Natural Science Foundation of China (grant no. 41375036).
This paper was edited by Tim Butler and reviewed by three anonymous referees.
Andrews, D. G.: An Introduction to Atmospheric Physics, Cambridge University Press, Cambridge, https://doi.org/10.1017/CBO9780511800788, 2000.
Ainsworth, E. A., Yendrek, C. R., Sitch, S., Collins, W. J., and Emberson, L. D.: The effects of tropospheric ozone on net primary productivity and implications for climate change, Annu. Rev. Plant Biol., 63, 637–661, https://doi.org/10.1146/annurev-arplant-042110-103829, 2012.
Anger, A., Dessens, O., Xi, F., Barker, T., and Wu, R.: China's air pollution reduction efforts may result in an increase in surface ozone levels in highly polluted areas, Ambio, 45, 254–265, https://doi.org/10.1007/s13280-015-0700-6, 2016.
Banta, R. M., Pichugina, Y. L., and Brewer, W. A.: Turbulent velocity-variance profiles in the stable boundary layer generated by a nocturnal low-level jet, J. Atmos. Sci., 63, 2700–2719, https://doi.org/10.1175/jas3776.1, 2006.
Bi, J., Huang, J., Shi, J., Hu, Z., Zhou, T., Zhang, G., Huang, Z., Wang, X., and Jin, H.: Measurement of scattering and absorption properties of dust aerosol in a Gobi farmland region of northwestern China – a potential anthropogenic influence, Atmos. Chem. Phys., 17, 7775–7792, https://doi.org/10.5194/acp-17-7775-2017, 2017.
Chang, T. Y., Kuntasal, G., and Pierson, W. R.: Night-time N2O5∕NO3 chemistry and nitrate in dew water, Atmos. Environ., 21, 1345–1351, https://doi.org/10.1016/0004-6981(67)90081-9, 1967.
Chang, X., Wang, S., Zhao, B., Cai, S., and Hao, J.: Assessment of inter-city transport of particulate matter in the Beijing–Tianjin–Hebei region, Atmos. Chem. Phys., 18, 4843–4858, https://doi.org/10.5194/acp-18-4843-2018, 2018.
Chen, L., Guo, B., Huang, J., He, J., Wang, H., Zhang, S., and Chen, S. X.: Assessing air-quality in Beijing-Tianjin-Hebei region: The method and mixed tales of PM2.5 and O3, Atmos. Environ., 193, 290–301, https://doi.org/10.1016/j.atmosenv.2018.08.047, 2018.
Chen, Z., Chen, D., Wen, W., Zhuang, Y., Kwan, M.-P., Chen, B., Zhao, B., Yang, L., Gao, B., Li, R., and Xu, B.: Evaluating the “2+26” regional strategy for air quality improvement during two air pollution alerts in Beijing: variations in PM2.5 concentrations, source apportionment, and the relative contribution of local emission and regional transport, Atmos. Chem. Phys., 19, 6879–6891, https://doi.org/10.5194/acp-19-6879-2019, 2019.
Cheng, J., Su, J., Cui, T., Li, X., Dong, X., Sun, F., Yang, Y., Tong, D., Zheng, Y., Li, Y., Li, J., Zhang, Q., and He, K.: Dominant role of emission reduction in PM2.5 air quality improvement in Beijing during 2013–2017: a model-based decomposition analysis, Atmos. Chem. Phys., 19, 6125–6146, https://doi.org/10.5194/acp-19-6125-2019, 2019.
Cheng, N., Li, R., Xu, C., Chen, Z., Chen, D., Meng, F., Cheng, B., Ma, Z., Zhuang, Y., He, B., and Gao, B.: Ground ozone variations at an urban and a rural station in Beijing from 2006 to 2017: Trend, meteorological influences and formation regimes, J. Clean. Prod., 235, 11–20, https://doi.org/10.1016/j.jclepro.2019.06.204, 2019.
China National Environmental Monitoring Center: National urban air quality real-time release platform, available at: http://106.37.208.233:20035, last access: 13 April 2020.
Dickerson, R. R., Kondragunta, S., Stenchikov, G., Civerolo, K. L., Doddridge, B. G., and Holben, B. N.: The impact of aerosols on solar ultraviolet radiation and photochemical smog, Science, 278, 827–830, https://doi.org/10.1126/science.278.5339.827, 1997.
Ding, A., Huang, X., Nie, W., Chi, X., Xu, Z., Zheng, L., Xu, Z., Xie, Y., Qi, X., Shen, Y., Sun, P., Wang, J., Wang, L., Sun, J., Yang, X.-Q., Qin, W., Zhang, X., Cheng, W., Liu, W., Pan, L., and Fu, C.: Significant reduction of PM2.5 in eastern China due to regional-scale emission control: evidence from SORPES in 2011–2018, Atmos. Chem. Phys., 19, 11791–11801, https://doi.org/10.5194/acp-19-11791-2019, 2019.
Frischer, T., Studnicka, M., Gartner, C., Tauber, E., Horak, F., Veiter, A., Spengler, J., Kuhr, J., and Urbanek, R.: Lung function growth and ambient ozone – A three-year population study in school children, Am. J. Resp. Crit. Care, 160, 390–396, https://doi.org/10.1164/ajrccm.160.2.9809075, 1999.
Gregory, L.: Cimel Sunphotometer (CSPHOT) Handbook, U.S. Department of Energy Office of Scientific and Technical Information, United States, Technical Report, DOE/SC-ARM/TR-056, 22 pp., https://doi.org/10.2172/1020262, 2011.
Han, L., Xiang, X., Zhang, H., Cheng, S., Wang, H., Wei, W., Wang, H., and Lang, J.: Insights into submicron particulate evolution, sources and influences on haze pollution in Beijing, China, Atmos. Environ., 201, 360–368, https://doi.org/10.1016/j.atmosenv.2018.12.045, 2019.
Harris, E., Sinha, B., van Pinxteren, D., Tilgner, A., Fomba, K. W., Schneider, J., Roth, A., Gnauk, T., Fahlbusch, B., Mertes, S., Lee, T., Collett, J., Foley, S., Borrmann, S., Hoppe, P., and Herrmann, H.: Enhanced Role of Transition Metal Ion Catalysis During In-Cloud Oxidation of SO2, Science, 340, 727–730, https://doi.org/10.1126/science.1230911, 2013.
Hassan, I. A., Basahi, J. M., Ismail, I. M., and Habeebullah, T. M.: Spatial Distribution and Temporal Variation in Ambient Ozone and Its Associated NOx in the Atmosphere of Jeddah City, Saudi Arabia, Aerosol Air. Qual. Res., 13, 1712–1722, https://doi.org/10.4209/aaqr.2013.01.0007, 2013.
He, S. and Carmichael, G. R.: Sensitivity of photolysis rates and ozone production in the troposphere to aerosol properties, J. Geophys. Res., 104, 26307–26324, https://doi.org/10.1029/1999jd900789, 1999.
Hennigan, C. J., Miracolo, M. A., Engelhart, G. J., May, A. A., Presto, A. A., Lee, T., Sullivan, A. P., McMeeking, G. R., Coe, H., Wold, C. E., Hao, W.-M., Gilman, J. B., Kuster, W. C., de Gouw, J., Schichtel, B. A., Collett Jr., J. L., Kreidenweis, S. M., and Robinson, A. L.: Chemical and physical transformations of organic aerosol from the photo-oxidation of open biomass burning emissions in an environmental chamber, Atmos. Chem. Phys., 11, 7669–7686, https://doi.org/10.5194/acp-11-7669-2011, 2011.
Huang, X., Liu, Z., Liu, J., Hu, B., Wen, T., Tang, G., Zhang, J., Wu, F., Ji, D., Wang, L., and Wang, Y.: Chemical characterization and source identification of PM2.5 at multiple sites in the Beijing–Tianjin–Hebei region, China, Atmos. Chem. Phys., 17, 12941–12962, https://doi.org/10.5194/acp-17-12941-2017, 2017.
Khoder, M. I.: Atmospheric conversion of sulfur dioxide to particulate sulfate and nitrogen dioxide to particulate nitrate and gaseous nitric acid in an urban area, Chemosphere, 49, 675–684, https://doi.org/10.1016/s0045-6535(02)00391-0, 2002.
Kong, L., Du, C., Zhanzakova, A., Cheng, T., Yang, X., Wang, L., Fu, H., Chen, J., and Zhang, S.: Trends in heterogeneous aqueous reaction in continuous haze episodes in suburban Shanghai: An in-depth case study, Sci. Total Environ., 634, 1192–1204, https://doi.org/10.1016/j.scitotenv.2018.04.086, 2018.
Li, L., Chen, C. H., Huang, C., Huang, H. Y., Zhang, G. F., Wang, Y. J., Wang, H. L., Lou, S. R., Qiao, L. P., Zhou, M., Chen, M. H., Chen, Y. R., Streets, D. G., Fu, J. S., and Jang, C. J.: Process analysis of regional ozone formation over the Yangtze River Delta, China using the Community Multi-scale Air Quality modeling system, Atmos. Chem. Phys., 12, 10971–10987, https://doi.org/10.5194/acp-12-10971-2012, 2012.
Li, W., Liu, X., Zhang, Y., Tan, Q., Feng, M., Song, M., Hui, L., Qu, Y., An, J., and Gao, H.: Insights into the phenomenon of an explosive growth and sharp decline in haze: A case study in Beijing, J. Environ. Sci., 84, 122–132, https://doi.org/10.1016/j.jes.2019.04.015, 2019.
Liu, G., Xin, J., Wang, X., Si, R., Ma, Y., Wen, T., Zhao, L., Zhao, D., Wang, Y., and Gao, W.: Impact of the coal banning zone on visibility in the Beijing–Tianjin–Hebei region, Sci. Total Environ., 692, 402–410, https://doi.org/10.1016/j.scitotenv.2019.07.006, 2019.
Liu, H., Wang, X. M., Pang, J. M., and He, K. B.: Feasibility and difficulties of China's new air quality standard compliance: PRD case of PM2.5 and ozone from 2010 to 2025, Atmos. Chem. Phys., 13, 12013–12027, https://doi.org/10.5194/acp-13-12013-2013, 2013.
Liu, Q., Liu, T., Chen, Y., Xu, J., Gao, W., Zhang, H., and Yao, Y.: Effects of aerosols on the surface ozone generation via a study of the interaction of ozone and its precursors during the summer in Shanghai, China, Sci. Total Environ., 675, 235–246, https://doi.org/10.1016/j.scitotenv.2019.04.121, 2019.
Liu, X. G., Li, J., Qu, Y., Han, T., Hou, L., Gu, J., Chen, C., Yang, Y., Liu, X., Yang, T., Zhang, Y., Tian, H., and Hu, M.: Formation and evolution mechanism of regional haze: a case study in the megacity Beijing, China, Atmos. Chem. Phys., 13, 4501–4514, https://doi.org/10.5194/acp-13-4501-2013, 2013.
Liu, Z., Hu, B., Ji, D., Cheng, M., Gao, W., Shi, S., Xie, Y., Yang, S., Gao, M., Fu, H., Chen, J., and Wang, Y.: Characteristics of fine particle explosive growth events in Beijing, China: Seasonal variation, chemical evolution pattern and formation mechanism, Sci. Total Environ., 687, 1073–1086, https://doi.org/10.1016/j.scitotenv.2019.06.068, 2019.
Lu, X., Zhang, L., Chen, Y., Zhou, M., Zheng, B., Li, K., Liu, Y., Lin, J., Fu, T.-M., and Zhang, Q.: Exploring 2016–2017 surface ozone pollution over China: source contributions and meteorological influences, Atmos. Chem. Phys., 19, 8339–8361, https://doi.org/10.5194/acp-19-8339-2019, 2019.
Luan, T., Guo, X., Guo, L., and Zhang, T.: Quantifying the relationship between PM2.5 concentration, visibility and planetary boundary layer height for long-lasting haze and fog–haze mixed events in Beijing, Atmos. Chem. Phys., 18, 203–225, https://doi.org/10.5194/acp-18-203-2018, 2018.
Martin, R. V., Jacob, D. J., Yantosca, R. M., Chin, M., and Ginoux, P.: Global and regional decreases in tropospheric oxidants from photochemical effects of aerosols, J. Geophys. Res., 108, 4097, https://doi.org/10.1029/2002jd002622, 2003.
Ming, L., Jin, L., Li, J., Fu, P., Yang, W., Liu, D., Zhang, G., Wang, Z., and Li, X.: PM2.5 in the Yangtze River Delta, China: Chemical compositions, seasonal variations, and regional pollution events, Environ. Pollut., 223, 200–212, https://doi.org/10.1016/j.envpol.2017.01.013, 2017.
Muenkel, C., Eresmaa, N., Rasanen, J., and Karppinen, A.: Retrieval of mixing height and dust concentration with lidar ceilometer, Bound.-Lay. Meteorol., 124, 117–128, https://doi.org/10.1007/s10546-006-9103-3, 2007.
Ng, N. L., Herndon, S. C., Trimborn, A., Canagaratna, M. R., Croteau, P. L., Onasch, T. B., Sueper, D., Worsnop, D. R., Zhang, Q., Sun, Y. L., and Jayne, J. T.: An Aerosol Chemical Speciation Monitor (ACSM) for Routine Monitoring of the Composition and Mass Concentrations of Ambient Aerosol, Aerosol Sci. Tech., 45, 780–794, https://doi.org/10.1080/02786826.2011.560211, 2011.
NOAA Physical Sciences Laboratory: Reanalysis Datasets, available at: https://www.esrl.noaa.gov/psd/data, last access: 13 April 2020.
Orrling, D., Fitzgerald, E., Ivanov, A., and Molina, M.: Enhanced sulfate formation on ozone-exposed soot, J. Aerosol Sci., 42, 615–620, https://doi.org/10.1016/j.jaerosci.2011.04.004, 2011.
Pathak, R. K., Wu, W. S., and Wang, T.: Summertime PM2.5 ionic species in four major cities of China: nitrate formation in an ammonia-deficient atmosphere, Atmos. Chem. Phys., 9, 1711–1722, https://doi.org/10.5194/acp-9-1711-2009, 2009.
Pathak, R. K., Wang, T., and Wu, W. S.: Nighttime enhancement of PM2.5 nitrate in ammonia-poor atmospheric conditions in Beijing and Shanghai: Plausible contributions of heterogeneous hydrolysis of N2O5 and HNO3 partitioning, Atmos. Environ., 45, 1183–1191, https://doi.org/10.1016/j.atmosenv.2010.09.003, 2011.
Petzold, A. and Schonlinner, M.: Multi-angle absorption photometry – a new method for the measurement of aerosol light absorption and atmospheric black carbon, J. Aerosol Sci., 35, 421–441, https://doi.org/10.1016/j.jaerosci.2003.09.005, 2004.
Richards, L. W.: comments on the oxidation of NO2 to nitrate- day and night, Atmos. Environ., 17, 397–402, https://doi.org/10.1016/0004-6981(83)90057-4, 1983.
Russell, A. G., Cass, G. R., and Seinfeld, J. H.: On some aspects of nighttime atmospheric chemistry, Environ. Sci. Technol., 20, 1167–1172, https://doi.org/10.1021/es00153a013, 1986.
Seinfeld, J. H.: Atmospheric chemistry and physics of air pollution, Environ. Sci. Technol., 20, 863–863, https://doi.org/10.1021/es00151a602, 1986.
Seinfeld, J. H.: Atmospheric chemistry and physics: from air pollution to climate change, Environment: Science and Policy for Sustainable Development, 40, 26, https://doi.org/10.1080/00139157.1999.10544295, 1998.
Sharma, P., Kuniyal, J. C., Chand, K., Guleria, R. P., Dhyani, P. P., and Chauhan, C.: Surface ozone concentration and its behaviour with aerosols in the northwestern Himalaya, India, Atmos. Environ., 71, 44–53, https://doi.org/10.1016/j.atmosenv.2012.12.042, 2013.
Shi, C., Wang, S., Liu, R., Zhou, R., Li, D., Wang, W., Li, Z., Cheng, T., and Zhou, B.: A study of aerosol optical properties during ozone pollution episodes in 2013 over Shanghai, China, Atmos. Res., 153, 235–249, https://doi.org/10.1016/j.atmosres.2014.09.002, 2015.
Sillman, S.: The relation between ozone, NOx and hydrocarbons in urban and polluted rural environments, Atmos. Environ., 33, 1821–1845, https://doi.org/10.1016/s1352-2310(98)00345-8, 1999.
Stone, R. S., Anderson, G. P., Shettle, E. P., Andrews, E., Loukachine, K., Dutton, E. G., Schaaf, C., and Roman III, M. O.: Radiative impact of boreal smoke in the Arctic: Observed and modeled, J. Geophys. Res., 113, D14S16, https://doi.org/10.1029/2007jd009657, 2008.
Su, F., Gao, Q., Zhang, Z., Ren, Z., and Yang, X.: Transport pathways of pollutants from outside in atmosphere boundary layer, Research of Environmental Sciences, 17, 26–29,40, https://doi.org/10.3321/j.issn:1001-6929.2004.01.005, 2004.
Sun, Y., Zhuang, G., Tang, A., Wang, Y., and An, Z.: Chemical characteristics of PM2.5 and PM10 in haze-fog episodes in Beijing, Environ. Sci. Technol., 40, 3148–3155, https://doi.org/10.1021/es051533g, 2006.
Sun, Y., Wang, Z., Dong, H., Yang, T., Li, J., Pan, X., Chen, P., and Jayne, J. T.: Characterization of summer organic and inorganic aerosols in Beijing, China with an Aerosol Chemical Speciation Monitor, Atmos. Environ., 51, 250–259, https://doi.org/10.1016/j.atmosenv.2012.01.013, 2012.
Sun, Y. L., Wang, Z. F., Du, W., Zhang, Q., Wang, Q. Q., Fu, P. Q., Pan, X. L., Li, J., Jayne, J., and Worsnop, D. R.: Long-term real-time measurements of aerosol particle composition in Beijing, China: seasonal variations, meteorological effects, and source analysis, Atmos. Chem. Phys., 15, 10149–10165, https://doi.org/10.5194/acp-15-10149-2015, 2015.
Tang, G., Zhu, X., Hu, B., Xin, J., Wang, L., Münkel, C., Mao, G., and Wang, Y.: Impact of emission controls on air quality in Beijing during APEC 2014: lidar ceilometer observations, Atmos. Chem. Phys., 15, 12667–12680, https://doi.org/10.5194/acp-15-12667-2015, 2015.
Tang, G., Zhang, J., Zhu, X., Song, T., Münkel, C., Hu, B., Schäfer, K., Liu, Z., Zhang, J., Wang, L., Xin, J., Suppan, P., and Wang, Y.: Mixing layer height and its implications for air pollution over Beijing, China, Atmos. Chem. Phys., 16, 2459–2475, https://doi.org/10.5194/acp-16-2459-2016, 2016.
Tie, X., Brasseur, G., Emmons, L., Horowitz, L., and Kinnison, D.: Effects of aerosols on tropospheric oxidants: A global model study, J. Geophys. Res., 106, 22931–22964, https://doi.org/10.1029/2001jd900206, 2001.
Tie, X. X., Madronich, S., Walters, S., Edwards, D. P., Ginoux, P., Mahowald, N., Zhang, R. Y., Lou, C., and Brasseur, G.: Assessment of the global impact of aerosols on tropospheric oxidants, J. Geophys. Res., 110, D03204, https://doi.org/10.1029/2004jd005359, 2005.
Toh, Y. Y., Lim, S. F., and von Glasow, R.: The influence of meteorological factors and biomass burning on surface ozone concentrations at Tanah Rata, Malaysia, Atmos. Environ., 70, 435–446, https://doi.org/10.1016/j.atmosenv.2013.01.018, 2013.
Trainer, M., Parrish, D. D., Goldan, P. D., Roberts, J., and Fehsenfeld, F. C.: Review of observation-based analysis of the regional factors influencing ozone concentrations, Atmos. Environ., 34, 2045–2061, https://doi.org/10.1016/s1352-2310(99)00459-8, 2000.
Wang, D., Zhou, B., Fu, Q., Zhao, Q., Zhang, Q., Chen, J., Yang, X., Duan, Y., and Li, J.: Intense secondary aerosol formation due to strong atmospheric photochemical reactions in summer: observations at a rural site in eastern Yangtze River Delta of China, Sci. Total Environ., 571, 1454–1466, https://doi.org/10.1016/j.scitotenv.2016.06.212, 2016.
Wang, H., Lu, K., Chen, X., Zhu, Q., Chen, Q., Guo, S., Jiang, M., Li, X., Shang, D., Tan, Z., Wu, Y., Wu, Z., Zou, Q., Zheng, Y., Zeng, L., Zhu, T., Hu, M., and Zhang, Y.: High N2O5 Concentrations Observed in Urban Beijing: Implications of a Large Nitrate Formation Pathway, Environ. Sci. Tech. Let., 4, 416–420, https://doi.org/10.1021/acs.estlett.7b00341, 2017.
Wang, L., Zhang, F., Pilot, E., Yu, J., Nie, C., Holdaway, J., Yang, L., Li, Y., Wang, W., Vardoulakis, S., and Krafft, T.: Taking Action on Air Pollution Control in the Beijing-Tianjin-Hebei (BTH) Region: Progress, Challenges and Opportunities, Int. J. Environ. Res. Pu., 15, 306, https://doi.org/10.3390/ijerph15020306, 2018.
Wang, L., Liu, J., Gao, Z., Li, Y., Huang, M., Fan, S., Zhang, X., Yang, Y., Miao, S., Zou, H., Sun, Y., Chen, Y., and Yang, T.: Vertical observations of the atmospheric boundary layer structure over Beijing urban area during air pollution episodes, Atmos. Chem. Phys., 19, 6949–6967, https://doi.org/10.5194/acp-19-6949-2019, 2019.
Wang, T., Xue, L., Brimblecombe, P., Lam, Y. F., Li, L., and Zhang, L.: Ozone pollution in China: A review of concentrations, meteorological influences, chemical precursors, and effects, Sci. Total Environ., 575, 1582-1596, https://doi.org/10.1016/j.scitotenv.2016.10.081, 2017a.
Wang, T., Xue, L. K., Brimblecombe, P., Lam, Y. F., Li, L., and Zhang, L.: Ozone pollution in China: A review of concentrations, meteorological influences, chemical precursors, and effects, Sci. Total Environ., 575, 1582-1596, https://doi.org/10.1016/j.scitotenv.2016.10.081, 2017b.
Wang, W., Li, X., Shao, M., Hu, M., Zeng, L., Wu, Y., and Tan, T.: The impact of aerosols on photolysis frequencies and ozone production in Beijing during the 4-year period 2012–2015, Atmos. Chem. Phys., 19, 9413-9429, https://doi.org/10.5194/acp-19-9413-2019, 2019.
Wang, X., Zhang, Y., Chen, H., Yang, X., Chen, J., and Geng, F.: Particulate Nitrate Formation in a Highly Polluted Urban Area: A Case Study by Single-Particle Mass Spectrometry in Shanghai, Environ. Sci. Technol., 43, 3061–3066, https://doi.org/10.1021/es8020155, 2009.
Wang, X., Wang, W., Yang, L., Gao, X., Nie, W., Yu, Y., Xu, P., Zhou, Y., and Wang, Z.: The secondary formation of inorganic aerosols in the droplet mode through heterogeneous aqueous reactions under haze conditions, Atmos. Environ., 63, 68–76, https://doi.org/10.1016/j.atmosenv.2012.09.029, 2012.
Wang, Y., Zhuang, G., Zhang, X., Huang, K., Xua, C., Tang, A., Chen, J., and An, Z.: The ion chemistry, seasonal cycle, and sources of PM2.5 and TSP aerosol in Shanghai, Atmos. Environ., 40, 2935–2952, https://doi.org/10.1016/j.atmosenv.2005.12.051, 2006.
Wang, W., Li, X., Shao, M., Hu, M., Zeng, L., Wu, Y., and Tan, T.: The impact of aerosols on photolysis frequencies and ozone production in Beijing during the 4-year period 2012–2015, Atmos. Chem. Phys., 19, 9413–9429, https://doi.org/10.5194/acp-19-9413-2019, 2013.
Wang, Z., Pan, X., Uno, I., Li, J., Wang, Z., Chen, X., Fu, P., Yang, T., Kobayashi, H., Shimizu, A., Sugimoto, N., and Yamamoto, S.: Significant impacts of heterogeneous reactions on the chemical composition and mixing state of dust particles: A case study during dust events over northern China, Atmos. Environ., 159, 83–91, https://doi.org/10.1016/j.atmosenv.2017.03.044, 2017.
Wen, L., Xue, L., Wang, X., Xu, C., Chen, T., Yang, L., Wang, T., Zhang, Q., and Wang, W.: Summertime fine particulate nitrate pollution in the North China Plain: increasing trends, formation mechanisms and implications for control policy, Atmos. Chem. Phys., 18, 11261–11275, https://doi.org/10.5194/acp-18-11261-2018, 2018.
Wilcox, E. M., Thomas, R. M., Praveen, P. S., Pistone, K., Bender, F. A. M., and Ramanathan, V.: Black carbon solar absorption suppresses turbulence in the atmospheric boundary layer, P. Natl. Acad. Sci. USA, 113, 11794–11799, https://doi.org/10.1073/pnas.1525746113, 2016.
Wilson Jr., Wm. E., Levy, A., and Wimmer, D. B.: A study of sulfur dioxide in photochemical smog, JAPCA J. Air Waste Ma., 22, 27–32, https://doi.org/10.1080/00022470.1972.10469605, 1972.
Yao, X. H., Chan, C. K., Fang, M., Cadle, S., Chan, T., Mulawa, P., He, K. B., and Ye, B. M.: The water-soluble ionic composition of PM2.5 in Shanghai and Beijing, China, Atmos. Environ., 36, 4223–4234, https://doi.org/10.1016/s1352-2310(02)00342-4, 2002.
Zeng, P., Lyu, X. P., Guo, H., Cheng, H. R., Jiang, F., Pan, W. Z., Wang, Z. W., Liang, S. W., and Hu, Y. Q.: Causes of ozone pollution in summer in Wuhan, Central China, Environ. Pollut., 241, 852–861, https://doi.org/10.1016/j.envpol.2018.05.042, 2018.
Zhao, D., Xin, J., Gong, C., Quan, J., Liu, G., Zhao, W., Wang, Y., Liu, Z., and Song, T.: The formation mechanism of air pollution episodes in Beijing city: Insights into the measured feedback between aerosol radiative forcing and the atmospheric boundary layer stability, Sci. Total Environ., 692, 371–381, https://doi.org/10.1016/j.scitotenv.2019.07.255, 2019.
Zhong, J., Zhang, X., Wang, Y., Sun, J., Zhang, Y., Wang, J., Tan, K., Shen, X., Che, H., Zhang, L., Zhang, Z., Qi, X., Zhao, H., Ren, S., and Li, Y.: Relative Contributions of Boundary-Layer Meteorological Factors to the Explosive Growth of PM2.5 during the Red-Alert Heavy Pollution Episodes in Beijing in December 2016, J. Meteorol. Res., 31, 809–819, https://doi.org/10.1007/s13351-017-7088-0, 2017.
Zhong, J., Zhang, X., Dong, Y., Wang, Y., Liu, C., Wang, J., Zhang, Y., and Che, H.: Feedback effects of boundary-layer meteorological factors on cumulative explosive growth of PM2.5 during winter heavy pollution episodes in Beijing from 2013 to 2016, Atmos. Chem. Phys., 18, 247–258, https://doi.org/10.5194/acp-18-247-2018, 2018.
Zhong, J., Zhang, X., Wang, Y., Wang, J., Shen, X., Zhang, H., Wang, T., Xie, Z., Liu, C., Zhang, H., Zhao, T., Sun, J., Fan, S., Gao, Z., Li, Y., and Wang, L.: The two-way feedback mechanism between unfavorable meteorological conditions and cumulative aerosol pollution in various haze regions of China, Atmos. Chem. Phys., 19, 3287–3306, https://doi.org/10.5194/acp-19-3287-2019, 2019.
Zhu, X., Tang, G., Lv, F., Hu, B., Cheng, M., Muenkel, C., Schafer, K., Xin, J., An, X., Wang, G., Li, X., and Wang, Y.: The spatial representativeness of mixing layer height observations in the North China Plain, Atmos. Res., 209, 204–211, https://doi.org/10.1016/j.atmosres.2018.03.019, 2018.
The requested paper has a corresponding corrigendum published. Please read the corrigendum first before downloading the article.
- Article
(30910 KB) - Full-text XML