the Creative Commons Attribution 4.0 License.
the Creative Commons Attribution 4.0 License.
 | 17 Apr 2020
Atmospheric energy budget response to idealized aerosol perturbation in tropical cloud systems
Philip Stier
Matthew Christensen
Guido Cioni
Daniel Klocke
Axel Seifert
The atmospheric energy budget is analysed in numerical simulations of tropical cloud systems to better understand the physical processes behind aerosol effects on the atmospheric energy budget. The simulations include both shallow convective clouds and deep convective tropical clouds over the Atlantic Ocean. Two different sets of simulations, at different dates (10–12 and 16–18 August 2016), are simulated with different dominant cloud modes (shallow or deep). For each case, the cloud droplet number concentration (CDNC) is varied as a proxy for changes in aerosol concentrations without considering the temporal evolution of the aerosol concentration (for example due to wet scavenging, which may be more important under deep convective conditions). It is shown that the total column atmospheric radiative cooling is substantially reduced with CDNC in the deep-cloud-dominated case (by ∼10.0 W m−2), while a much smaller reduction (∼1.6 W m−2) is shown in the shallow-cloud-dominated case. This trend is caused by an increase in the ice and water vapour content at the upper troposphere that leads to a reduced outgoing longwave radiation, an effect which is stronger under deep-cloud-dominated conditions. A decrease in sensible heat flux (driven by an increase in the near-surface air temperature) reduces the warming by ∼1.4 W m−2 in both cases. It is also shown that the cloud fraction response behaves in opposite ways to an increase in CDNC, showing an increase in the deep-cloud-dominated case and a decrease in the shallow-cloud-dominated case. This demonstrates that under different environmental conditions the response to aerosol perturbation could be different.
- Article
(8214 KB) - Full-text XML
-
Supplement
(816 KB) - BibTeX
- EndNote


The negative anthropogenic radiative forcing due to aerosols acts to cool the climate and to compensate some of the warming due to an increase in greenhouse gases (Boucher et al., 2013). However, quantification of this effect is highly uncertain, with a revised uncertainty range of −1.60 to −0.65 W m−2 (Bellouin et al., 2019). The total anthropogenic aerosol radiative forcing is composed of contributions from direct interaction of aerosols with radiation (scattering and absorption) and from indirect interaction with radiation due to changes in cloud properties.
Besides its effect on the radiation budget, aerosols may affect the precipitation distribution and total amount (Levin and Cotton, 2009; Albrecht, 1989; Tao et al., 2012). A useful perspective to improve our understanding of aerosol effect on precipitation, which has become common in the last few years, arises from constraints on the energy budget (O'Gorman et al., 2012; Muller and O'Gorman, 2011; Hodnebrog et al., 2016; Samset et al., 2016; Myhre et al., 2017; Liu et al., 2018; Richardson et al., 2018; Dagan et al., 2019a). At long timescales, any precipitation perturbations by aerosol effects will have to be balanced by changes in radiation fluxes, by changes in sensible heat flux or by divergence of dry static energy. The energy budget constraint perspective was found useful to explain both the global (e.g. Richardson et al., 2018) and regional (Liu et al., 2018; Dagan et al., 2019a) precipitation response to aerosol perturbations in global-scale simulations. In this study, we investigate the energy budget response to aerosol perturbation at a regional scale using high-resolution cloud-resolving simulations. This enables an improved understanding of the microphysical processes controlling atmospheric energy budget perturbations. The strong connection between the atmospheric energy budget and convection has long been appreciated (e.g. Arakawa and Schubert, 1974; Manabe and Strickler, 1964) as well as the connection to the general circulation of the atmosphere (Emanuel et al., 1994).
The total column atmospheric energy budget can be described as follows:
Equation (1) presents a balance between the latent heating rate (LP – latent heat of condensation – L – times the surface precipitation rate – P), the surface sensible heat flux (QSH), the atmospheric radiative heating (QR), the divergence of dry static energy (div(s), which will become negligible at sufficiently large spatial scales), and the dry static energy storage term (ds∕dt, which will become negligible at long – inter-annual – temporal scales). Throughout the rest of this paper we will refer to the right-hand side of Eq. (1) () as the energy imbalance (which is calculated as the residual – R – of the left-hand side).
QR is defined as
and represents the rate of net atmospheric diabatic warming due to radiative shortwave (SW) and longwave (LW) fluxes. It is expressed by the sum of the surface (SFC) and top-of-the-atmosphere (TOA) fluxes, when all fluxes are positive downwards. As in the case of TOA radiative forcing, aerosols could modify the atmospheric energy budget by both direct interaction with radiation and microphysical effects on clouds. The latter is the focus of this study.
The microphysical effects are driven by the fact that aerosols serve as cloud condensation nuclei (CCN) and ice nuclei (IN). Larger aerosol concentrations, e.g. by anthropogenic emissions, could lead to larger cloud droplet and ice particle concentrations (Andreae et al., 2004; Twomey, 1977; Hoose and Möhler, 2012). Changes in hydrometer concentration and size distribution were shown to affect clouds' microphysical process rates (such as condensation, evaporation, freezing and collision–coalescence), which in turn could affect the dynamics of the clouds (Khain et al., 2005; Koren et al., 2005; Heikenfeld et al., 2019; Chen et al., 2017; Altaratz et al., 2014; Seifert and Beheng, 2006a), the rain production (Levin and Cotton, 2009; Albrecht, 1989; Tao et al., 2012) and the clouds' radiative effect (Koren et al., 2010; Storelvmo et al., 2011; Twomey, 1977; Albrecht, 1989). The aerosol effect, and in particular its effects on the radiation budget and the atmospheric energy budget, is dependent on cloud regime (Altaratz et al., 2014; Lee et al., 2009; Mülmenstädt and Feingold, 2018; van den Heever et al., 2011; Rosenfeld et al., 2013; Glassmeier and Lohmann, 2016; Gryspeerdt and Stier, 2012; Christensen et al., 2016), time (Dagan et al., 2017, 2018c; Gryspeerdt et al., 2015; Seifert et al., 2015; Lee et al., 2012), aerosol type and size distribution (Jiang et al., 2018; Lohmann and Hoose, 2009), and (even for a given cloud regime) meteorological conditions (Dagan et al., 2015a; Fan et al., 2009, 2007; Kalina et al., 2014; Khain et al., 2008) and was shown to be non-monotonic (Dagan et al., 2015b; Jeon et al., 2018; Gryspeerdt et al., 2019; Liu et al., 2019). Hence the quantification of the global mean radiative effect is extremely challenging (e.g. Stevens and Feingold, 2009; Bellouin et al., 2019).
Previous studies demonstrated that the mean aerosol effect on deep convective clouds can increase the upward motion of water and hence also increase the cloud anvil mass and extent (Fan et al., 2010, 2013; Chen et al., 2017; Grabowski and Morrison, 2016). The increase in mass flux to upper levels was explained by the convective invigoration hypothesis (Fan et al., 2013; Koren et al., 2005; Rosenfeld et al., 2008; Seifert and Beheng, 2006a; Yuan et al., 2011a; Williams et al., 2002), which was proposed to lead to stronger latent heat release under higher aerosol concentrations and hence stronger vertical velocities. In addition to the stronger vertical velocities, under polluted conditions the smaller hydrometers are transported higher into the atmosphere (for a given vertical velocity; Chen et al., 2017; Koren et al., 2015; Dagan et al., 2018a), and their lifetime at the upper troposphere is longer (Fan et al., 2013; Grabowski and Morrison, 2016). The invigoration mechanism can also lead to an increase in precipitation (Khain, 2009; Altaratz et al., 2014). Both the increase in precipitation and the increase in anvil coverage would act to warm the atmospheric column: the increased precipitation by latent heat release and the increased anvil mass and extent by longwave radiative warming (Koren et al., 2010; Storelvmo et al., 2011). However, it should be pointed out that the uncertainty underlying these proposed effects remains significant (White et al., 2017; Varble, 2018). In addition, aerosol effects on precipitation from deep convective cloud were shown to be non-monotonic and depend on the aerosol range (Liu et al., 2019).
In the case of shallow clouds, the aerosol effect on precipitation was also shown to be non-monotonic (Dagan et al., 2015a, 2017). However, unlike in the deep-cloud case, the mean effect on precipitation, under typical modern-day conditions, is thought to be negative (Albrecht, 1989; Rosenfeld, 2000; Jiang et al., 2006; Xue and Feingold, 2006; Dagan and Chemke, 2016). The aerosol effect on shallow cloud cover and mean water mass (measured by liquid water path – LWP) might also depend on the meteorological conditions and aerosol range (Dagan et al., 2015b, 2017; Gryspeerdt et al., 2019; Dey et al., 2011; Savane et al., 2015) and is the outcome of competition between different opposing responses of rain suppression (that could lead to an increase in cloud lifetime and coverage; Albrecht, 1989), warm cloud invigoration (that could also lead to an increase in cloud coverage and LWP; Koren et al., 2014; Kaufman et al., 2005; Yuan et al., 2011b), and an increase in entrainment and evaporation (that could lead to a decrease in cloud coverage; Small et al., 2009; Jiang et al., 2006; Costantino and Bréon, 2013; Seigel, 2014). Another addition to this complex response is the fact that the aerosol effect on warm convective clouds was shown to be time-dependent and affected by the clouds' feedbacks on the thermodynamic conditions (Seifert et al., 2015; Dagan et al., 2016, 2017, 2018b; Lee et al., 2012; Stevens and Feingold, 2009). Previous simulations that contained several tropical cloud modes demonstrate that an increase in aerosol concentrations can lead to suppression of the shallow mode and invigoration of the deep mode (van den Heever et al., 2011). Hence the domain-mean effect, even if it is demonstrated to be small, may be the result of opposing relatively large contributions from the different cloud modes (van den Heever et al., 2011). The small domain-mean effect may suggest that at large enough scales the energy (Muller and O'Gorman, 2011; Myhre et al., 2017) or water budget (Dagan et al., 2019b) constrains precipitation changes.
Previous studies, using global simulations (O'Gorman et al., 2012; Muller and O'Gorman, 2011; Hodnebrog et al., 2016; Samset et al., 2016; Myhre et al., 2017; Liu et al., 2018; Richardson et al., 2018; Dagan et al., 2019a), demonstrated the usefulness of the atmospheric energy budget perspective in constraining the aerosol effect on precipitation. However, the physical processes behind aerosol–cloud microphysical effects on the energy budget are still far from being fully understood. In this study we use cloud-resolving simulations to increase our understanding of the effect of microphysical aerosol–cloud interactions on the atmospheric energy budget.

Figure 1Domain of the ICON simulations (red rectangle) overlaid on the August 2016 ECMWF ERA-Interim reanalysis (Dee et al., 2011) mean precipitation rate.
The icosahedral nonhydrostatic (ICON) atmospheric model (Zängl et al., 2015) is used in a limited-area configuration. ICON's non-hydrostatic dynamical core was evaluated with several idealized cases (Zängl et al., 2015). The simulations are conducted such that they are aligned with the NARVAL 2 (Next-generation Aircraft Remote-Sensing for Validation Studies; Klepp et al., 2014; Stevens et al., 2019, 2016) campaign, which took place during August 2016 in the western part of the northern tropical Atlantic. We use existing NARVAL 2 convection-permitting simulations (Klocke et al., 2017) as initial and boundary conditions for our simulations.
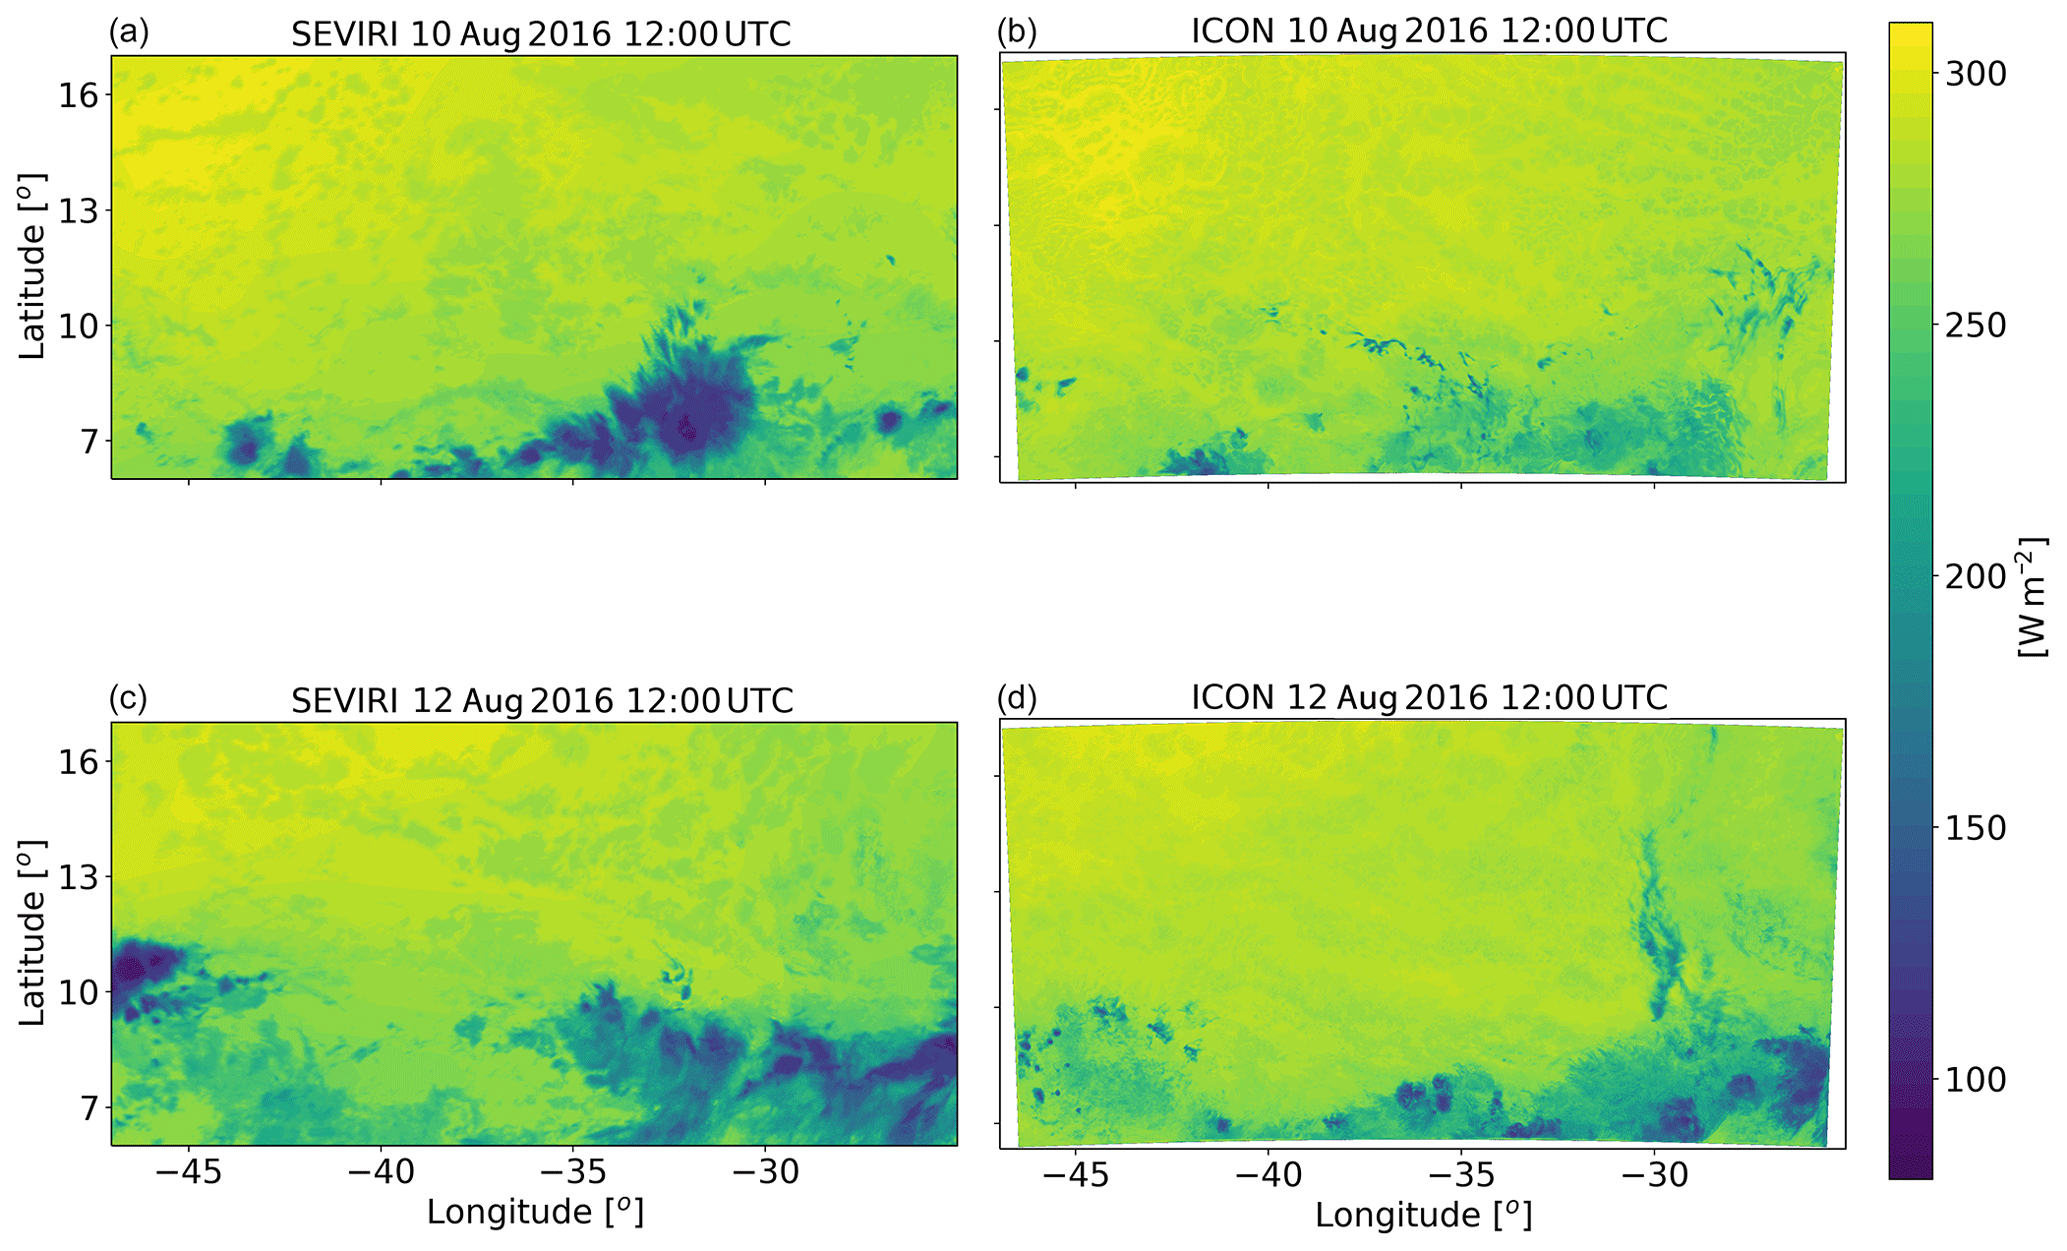
Figure 2Outgoing longwave flux at the top of atmosphere at the initial stage (a, b) and the last stage (c, d – each average over 30 min) of the simulation of the shallow-cloud-dominated case (10–12 August 2016) from geo-stationary satellite (SEVIRI-MSG – b, d) and the ICON model simulation with CDNC of 20 cm−3 (a, c).
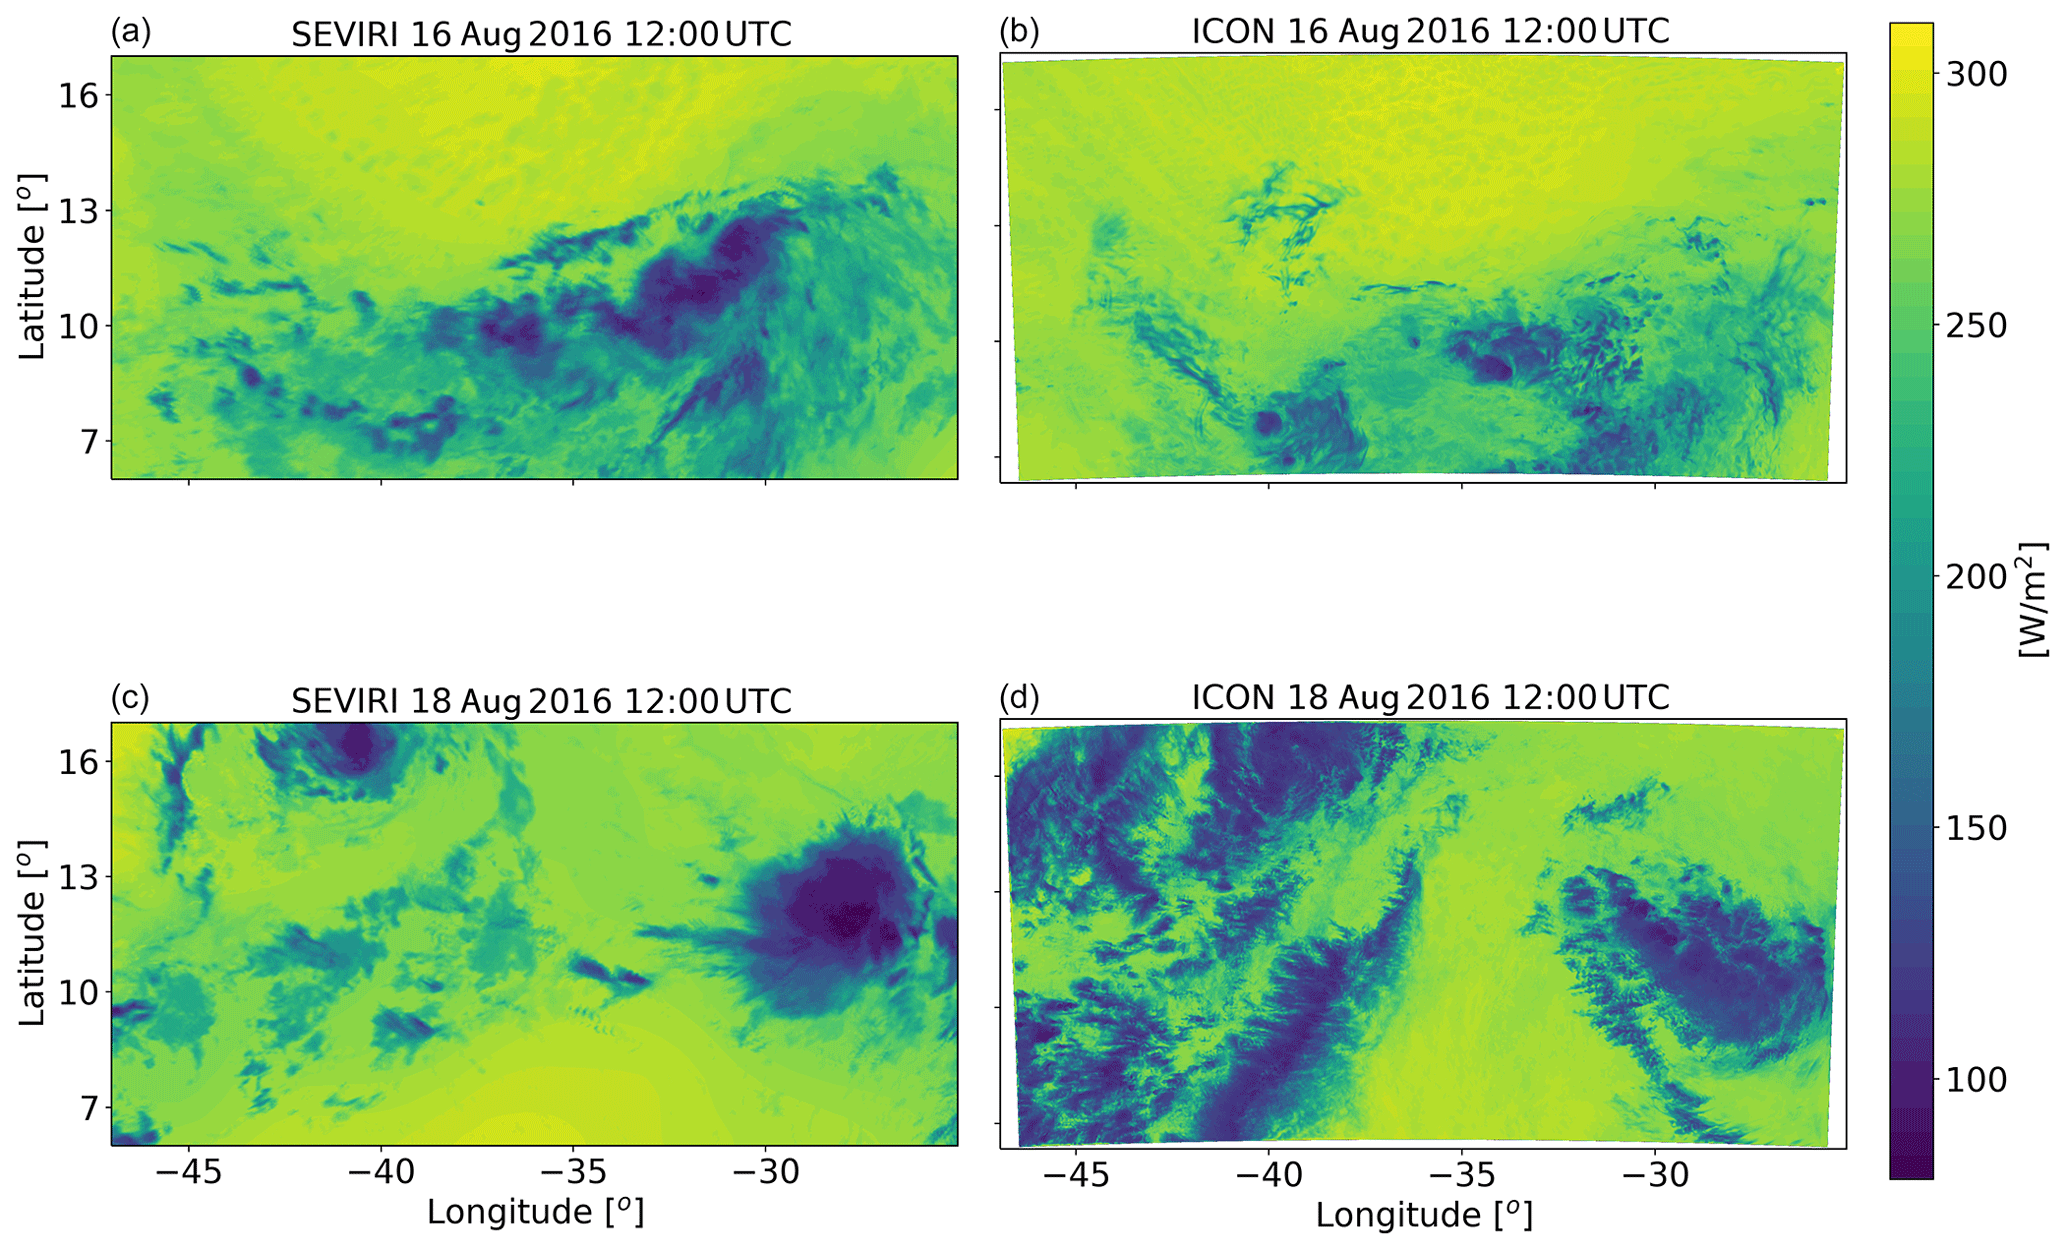
Figure 3Similar to Fig. 2 but for the deep-cloud-dominated case (16–18 August 2016).
The domain covers ∼22∘ in the zonal direction (25–47∘ W) and ∼11∘ in the meridional direction (6–17∘ N) and therefore a large fraction of the northern tropical Atlantic (Fig. 1). During August 2016, the intertropical convergence zone (ITCZ) was located in the southern part of the domain, while the northern part mostly contains trade cumulus clouds. Hence, this case study provides an opportunity to study heterogenous cloud systems. Daily variations in the deep- and shallow-cloud modes in our domain were observed, but it always included both cloud modes, albeit in different relative fractions. Two different dates are chosen: one representing a shallow-cloud-dominated mode (10–12 August 2016 – see Fig. 2 and Figs. S1 and S3 in the Supplement) and one that represents a deep-cloud-dominated mode (16–18 August 2016 – see Fig. 3 and Figs. S2 and S3). In the shallow-cloud-dominated case, most of the domain is covered by trade cumulus clouds that are advected with the trade winds from the north-east to the south-west. In the southern part of the domain, throughout most of the simulation, there is a zonal band of deep convective clouds (Fig. 2) that contribute on average ∼25 % to the total cloud cover (Fig. S3). The deep-cloud-dominated case represents the early stages of the development of Tropical Storm Fiona (Fig. 3). Fiona formed in the eastern tropical Atlantic and moved toward the west–north-west. It started as a tropical depression on 16 August 2016 at 18:00 UTC, while its centre was located at 12.0∘ N, 32.2∘ W. It kept moving towards the north-west and reached the level of a tropical storm on 17 August 2016 at 12:00 UTC, while its centre was located at 13.7∘ N, 36.0∘ W (https://www.nhc.noaa.gov/data/tcr/AL062016_Fiona.pdf, last access: 8 April 2020). The general propagation speed and direction, strength (measure by maximal surface wind speed), and location of the storm are predicted well by the model. However, the model produces more anvil clouds than what was observed from the satellite (Fig. 3). These two different cases, representing different atmospheric energy budget initial states (see also Figs. 4 and 12 below), enable the investigation of the aerosol effect on the energy budget under different initial conditions.
We use a two-moment bulk microphysical scheme (Seifert and Beheng, 2006b). For each case, four different simulations with different prescribed cloud droplet number concentrations (CDNCs) of 20, 100, 200 and 500 cm−3 are conducted. The different CDNC scenarios serve as a proxy for different aerosol conditions (as the first-order effect of increased aerosol concentration on clouds is to increase the CDNC; Andreae, 2009). This also allows separating the cloud response from the uncertainties involved in the representation of the aerosols in numerical models (Ghan et al., 2011; Simpson et al., 2014; Rothenberg et al., 2018). However, it limits potential feedbacks between clouds and aerosols, such as the removal of aerosol levels by precipitation scavenging and potential aerosol effects thereon. In addition, the fixed CDNC framework does not capture the differences in aerosol activation between shallow and deep clouds, due to differences in vertical velocity. Another aerosol effect that is not included in our simulations is the direct interaction between aerosol and radiation. In future work we plan to examine the mutual interaction between the microphysical effects and the direct aerosol radiative effects.
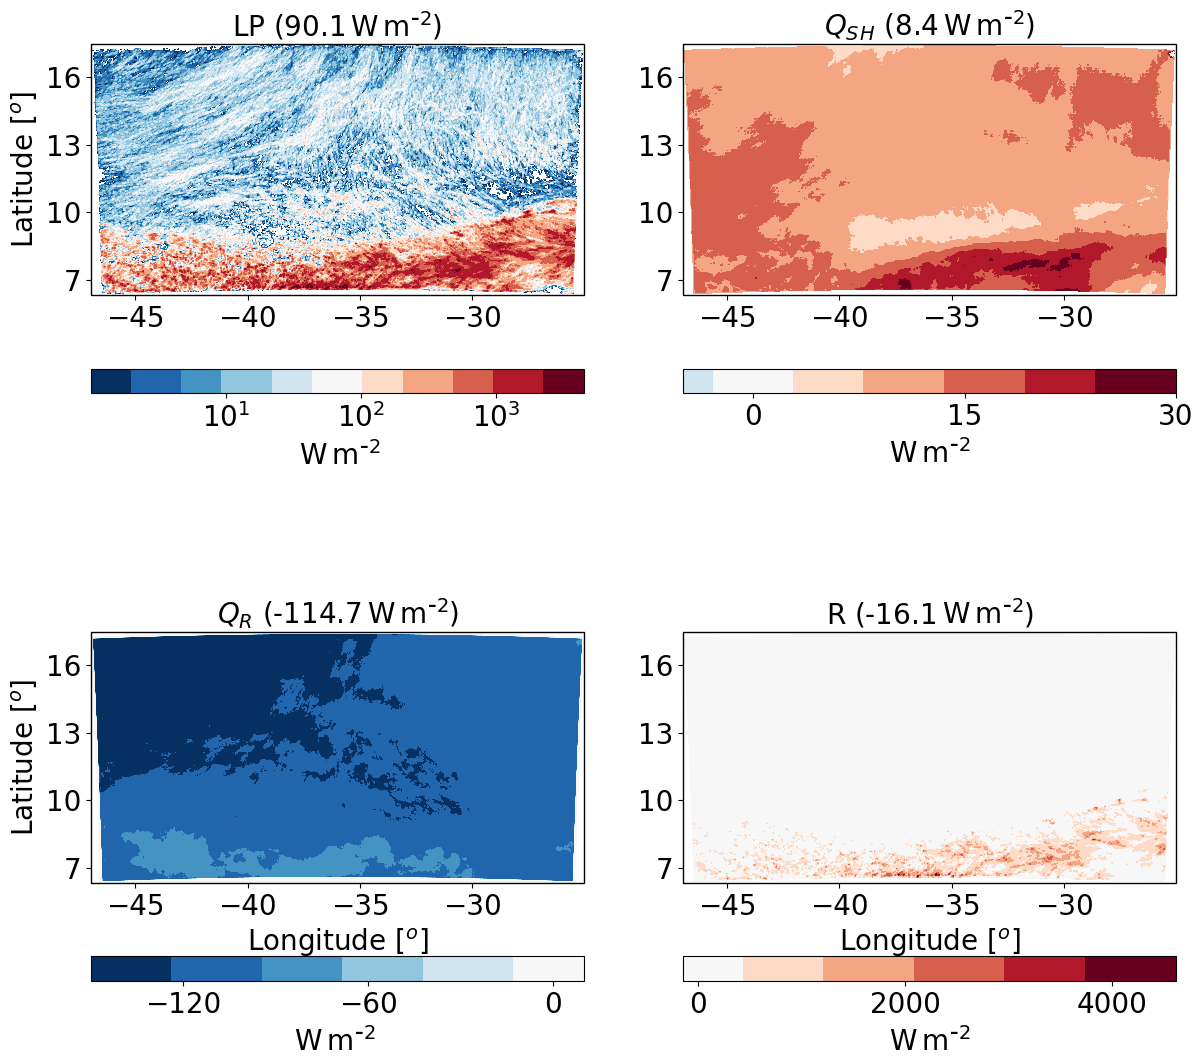
Figure 4Spatial distribution of the time mean of the different terms of the energy budget for the ICON simulation of the shallow-cloud-dominated case (10–12 August 2016) with CDNC =20 cm−3. The terms that appear here are as follows: LP – latent heat by precipitation, QSH – sensible heat flux, QR – atmospheric radiative warming – and R – the energy imbalance. The domain- and time-mean value of each term appear in brackets.
For calculation of the difference between high-CDNC (polluted) conditions and low-CDNC (clean) conditions, the simulations with CDNCs of 200 and 20 cm−3 are chosen, as they represent the range typically observed over the ocean (see for example the CDNC range presented in recent observation-based studies; Rosenfeld et al., 2019; Gryspeerdt et al., 2019). Each simulation is conducted for 48 h starting at 12:00 UTC. The horizontal resolution is set to 1200 m, and 75 vertical levels are used. The temporal resolution is 12 s, and the output interval is 30 min. Interactive radiation is calculated every 12 min using the RRTM-G (Rapid Radiative Transfer Model for GCMs) scheme (Clough et al., 2005; Iacono et al., 2008; Mlawer et al., 1997). We added a coupling between the microphysics and the radiation to include the Twomey effect (Twomey, 1977). This was done by including the information of the cloud liquid droplet effective radius, calculated in the microphysical scheme, in the radiation calculations. No Twomey effect due to changes in the ice particle size distribution was considered due to the large uncertainty involved in the ice microphysics and morphology. Additional details, such as the surface and atmospheric physics parameterizations, are described in Klocke et al. (2017) and include an interactive surface flux scheme and fixed sea surface temperature (SST). We note that using a fixed SST does not include feedbacks of aerosols on the SST evolution that could change the surface fluxes. However, due to the large heat capacity of the ocean, we do not expect the SST to dramatically change over the 2 d simulations.
For comparing the outgoing longwave flux from the simulations and observations, we use imager data from the SEVIRI instrument aboard the Meteosat Second Generation (MSG) geostationary satellite (Aminou, 2002). The outgoing longwave flux is calculated using the Optimal Retrieval for Aerosol and Cloud (ORAC) algorithm (Sus et al., 2017; McGarragh et al., 2018). Cloud optical (thickness, effective radius, water path) and thermal (cloud top temperature and pressure) properties are retrieved from ORAC using an optimal estimation-based approach. These retrievals and reanalysis profiles of temperature, humidity and ozone are then ingested into BUGSrad, a two-stream correlated-k broadband flux algorithm (Stephens et al., 2001) that outputs the fluxes at the top and bottom of the atmosphere and is shown to have excellent agreement when applied to both active (CloudSat) and passive (Advanced Along Track Scanning Radiometer) satellite sensors compared to the Clouds and the Earth's Radiant Energy System (Henderson et al., 2013; Stengel et al., 2020). In addition, offline radiative transfer sensitivity tests using vertical profiles from our model were conducted with BUGSrad to identify the source of the differences in fluxes between clean and polluted conditions.
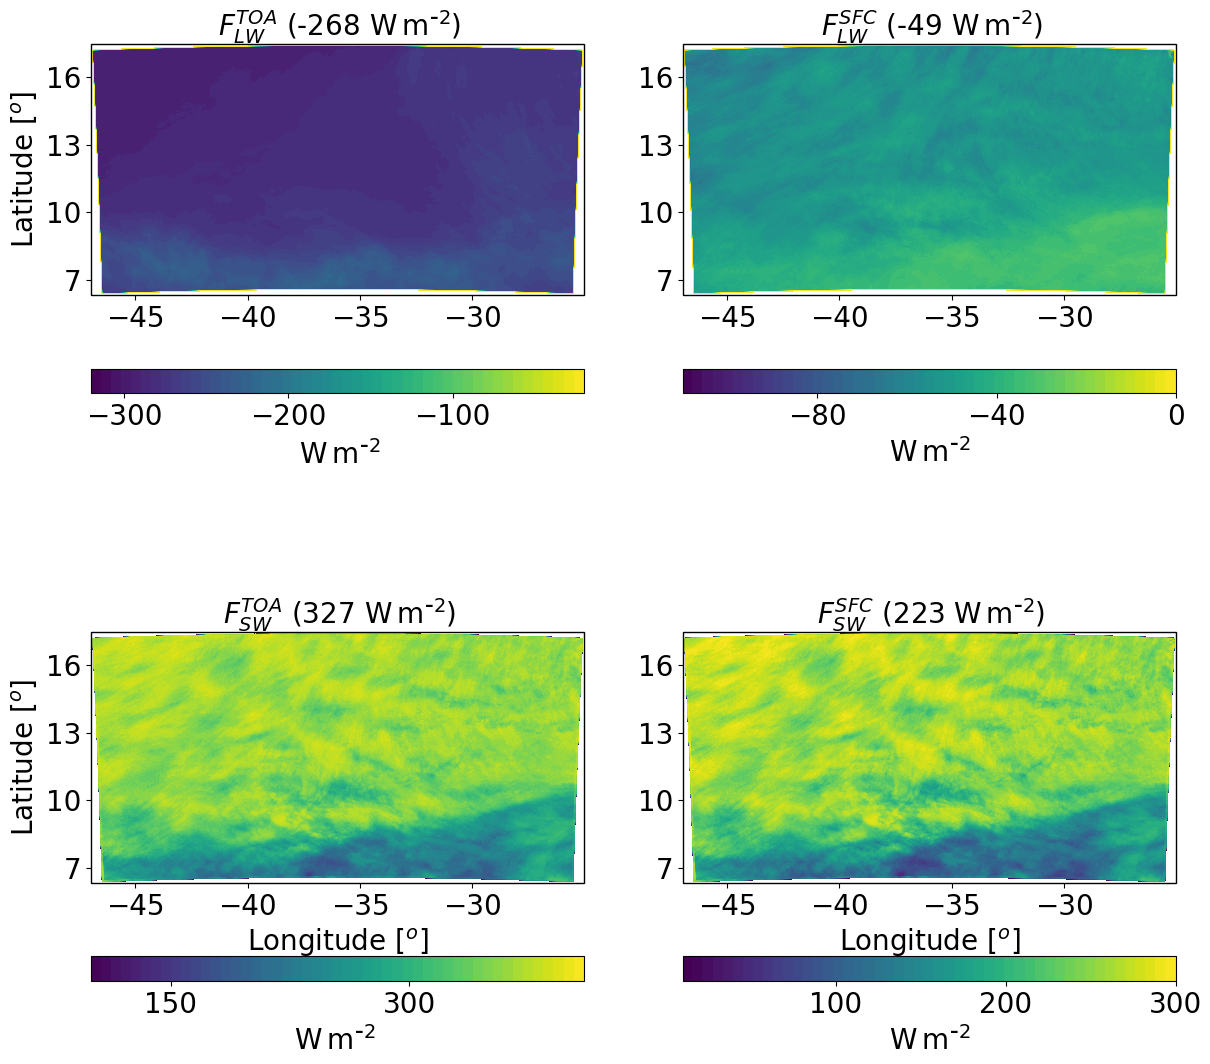
Figure 5Spatial distribution of ICON-simulated time-mean longwave (LW) and shortwave (SW) radiation fluxes at the top of atmosphere (TOA) and surface (SFC) for a simulation of the shallow-cloud-dominated case (10–12 August 2016) with CDNC =20 cm−3. The domain- and time-mean value of each term appear in brackets.
3.1 Shallow-cloud-dominated case – 10–12 August 2016
We start with energy budget analysis of the shallow-cloud-dominated case base simulations (CDNC =20 cm−3). Figure 4 presents the time mean (over the 2 d simulation) of the different terms of the energy budget (Eq. 1). As expected, LP dominates the warming of the atmosphere, while QR dominates the cooling. The sensible heat flux (QSH) is positive (acts to warm the atmosphere), but it is an order of magnitude smaller than the LP and QR magnitudes. In this shallow-cloud-dominated case the radiative cooling of the atmosphere is significantly larger than the warming due to precipitation (mean of −114.7 W m−2 compared to 90.1 W m−2); hence the energy imbalance (R) is negative. A negative R means that there must be some convergence of dry static energy into the domain and/or a decrease in the storage term; in this case it is mostly due to convergence of dry static energy.
We note that there is a significant difference in the spatial distribution of LP and QR (Jakob et al., 2019). While the QR is more uniformly distributed, the LP is mostly concentrated at the southern part of the domain (where the deep convective clouds are formed), and it has a dotted structure. Locally, at the core of a deep convective clouds, the LP contribution can reach a few 1000 W m−2 (1 mm h−1 of precipitation is equivalent to 628 W m−2); however, the vast majority of the domain contributes very little in terms of LP. QR also presents some spatial structures in which there is a weak atmospheric cooling at the southern part of the domain (the region of the deep convective clouds) and a strong cooling at the reset of the domain.
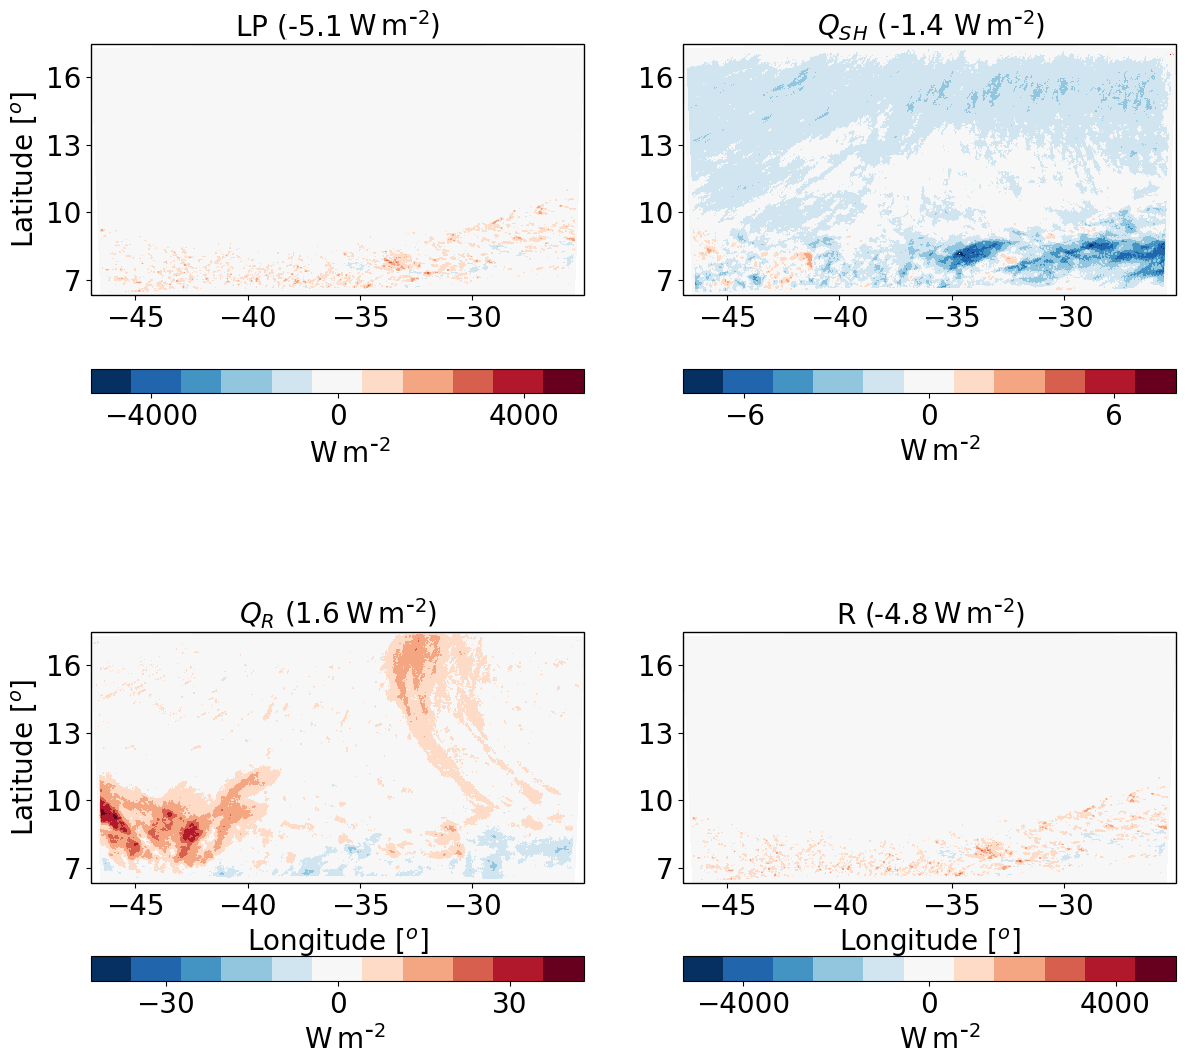
Figure 6The differences between polluted (CDNC =200 cm−3) and clean (CDNC =20 cm−3) ICON simulations of the time-mean terms of the energy budget for the shallow-cloud-dominated case (10–12 August 2016). The terms that appears here are as follows: LP – latent heat by precipitation, QSH – sensible heat flux, QR – atmospheric radiative warming – and R – the energy imbalance. The domain- and time-mean value of each term appear in brackets.
For understanding the spatial structure of QR, next we examine the spatial distribution of the LW and SW radiative fluxes at the TOA and surface (Fig. 5). We note that the smaller radiative cooling in the region of deep clouds in the south of the domain is mostly contributed by a decrease in . The SW fluxes also demonstrate a strong south–north gradient, as the deep convective clouds in the south are more reflective than the shallow trade cumulus (with the lower mean cloud fraction) in the rest of the domain.
3.2 Response to aerosol perturbation – shallow-cloud-dominated case
Next, we analyse the response of the atmospheric energy budget of this case to perturbations in CDNC. Figure 6 presents the differences in the different terms of the energy budget between a polluted simulation (CDNC =200 cm−3) and a clean simulation (CDNC =20 cm−3). It demonstrates that the LP differences between the different CDNC scenarios contribute 5.1 W m−2 less to warm the atmosphere in the polluted vs. the clean simulation. We note that this apparently large effect is caused by a small, non-statistically significant, precipitation difference (∼0.4 mm over the 2 d of simulation – see Fig. 8 below). The strong sensitivity of the atmospheric energy budget to small precipitation changes (recalling that 1 mm h−1 is equivalent to 628 W m−2) exemplifies the caution one needs to take when looking at precipitation response in terms of the energy budget perspective. The QR differences lead to relative warming of the atmosphere of the polluted case compared to the clean case by 1.6 W m−2. We note that most of the QR differences are located in the south-west part of the domain. The QSH changes counteract 1.4 W m−2 of the atmospheric warming by QR, and so the end result is a deficit of 4.8 W m−2 in the atmospheric energy budget in the polluted simulation compared to the clean simulation. The decrease in the QSH is driven by an increase in the near-surface air temperature (see Fig. 8).
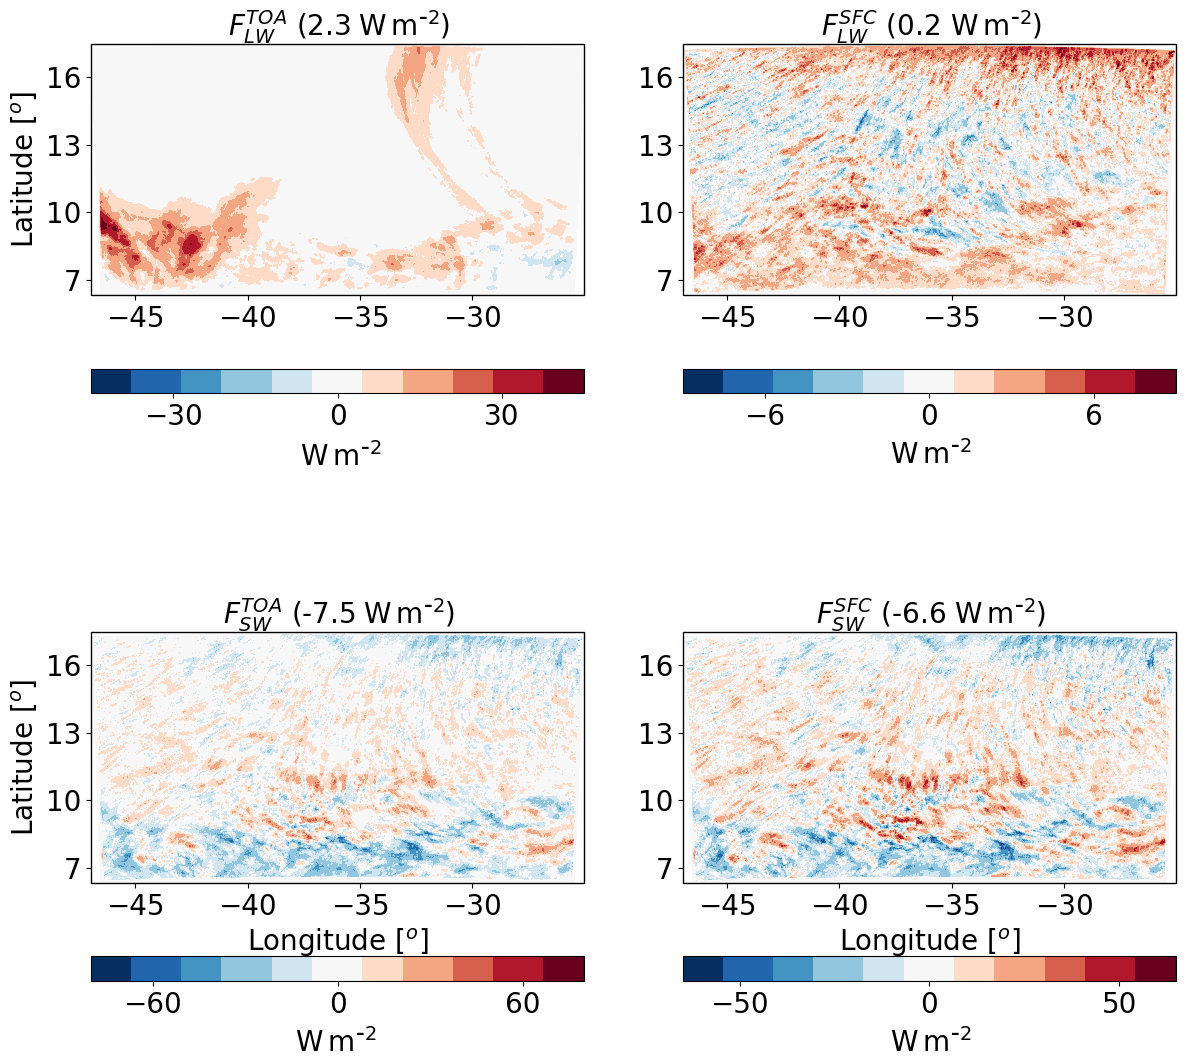
Figure 7The differences between polluted (CDNC =200 cm−3) and clean (CDNC =20 cm−3) ICON simulations of the time-mean radiative longwave (LW) and shortwave (SW) fluxes at the top of atmosphere (TOA) and surface (SFC) for the shallow-cloud-dominated case (10–12 August 2016). The domain- and time-mean value of each term appear in brackets.
To understand the response of QR to the CDNC perturbation, we next examine the response of the different radiative fluxes. Figure 7 demonstrates that most of the relative atmospheric radiative heating in the polluted case compared to the clean case is contributed by changes in the fluxes. The changes in are an order of magnitude smaller. The SW flux changes both at the TOA and SFC are larger than the changes; however, in terms of the atmospheric energy budget, they almost cancel each other out, and the net SW atmospheric effect is only −0.9 W m−2. Most of the reduction in SW fluxes (both at TOA and the surface) comes from the deep convective regions in the south of the domain, while the shallow-cloud regions experience some increase in SW fluxes. This can be attributed to the increase in the deep convective cloud fraction and a decrease in the shallow-cloud fraction with the increase in CDNC (see Fig. 9 below). The TOA net radiative effect for the entire system (as opposed to the atmospheric energy budget that takes into consideration the surface radiative flux changes) is about −5.2 W m−2.

Figure 8Domain-average properties as a function of time for the different CDNC simulations for the shallow-cloud-dominated case. The properties that are presented here are cloud fraction (CF), rain rate, temperature in 2 m, liquid water path (LWP – based on the cloud water mass, excluding the rain mass for consistency with satellite observations), ice water path (IWP) and total water path (TPW = LWP + IWP). For each property, the mean difference between all combinations of simulations, normalized to an increase in CDNC by a factor of 5, and its standard deviation appear in brackets.
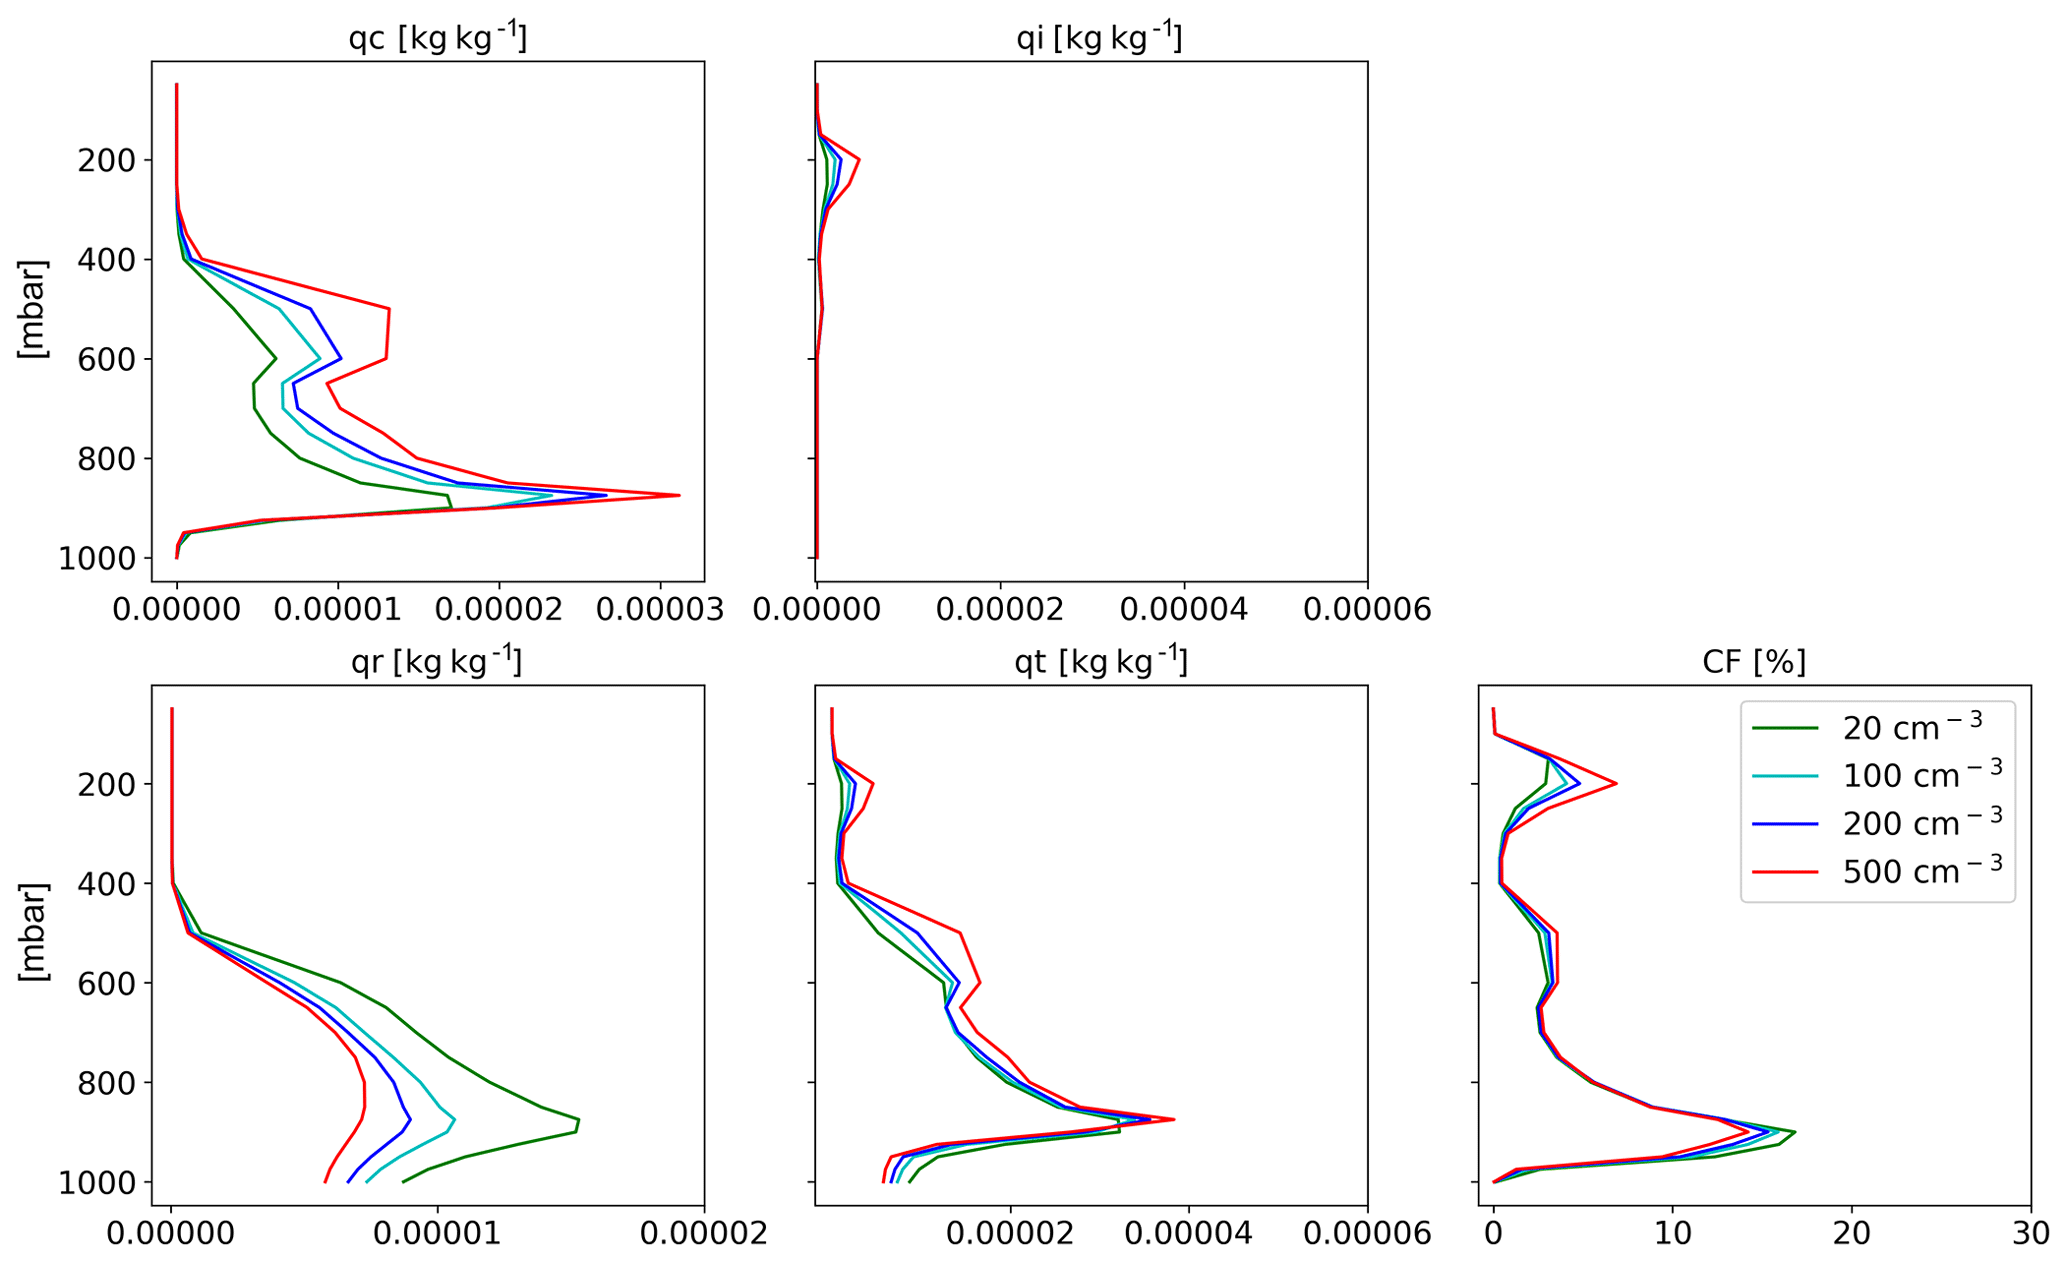
Figure 9Domain- and time-average vertical profiles for the different CDNC simulations for the shallow-cloud-dominated case. The properties that are presented here are cloud droplet mass mixing ratio (qc – for clouds' drops with radius smaller than 40 µm), ice mass mixing ratio (qi), rain mass mixing ratio (qr – for clouds' drops with radius larger than 40 µm), total water mass mixing ratio (qt = qc + qi + qr) and cloud fraction (CF). The x axis ranges are identical to the deep-cloud-dominated case – see Fig. 17.
The differences in the energy (Fig. 6) and radiation (Fig. 7) budgets between the clean and polluted cases shown above could be explained by the differences in the cloud mean properties. Figure 8 presents the time evolution of some of the domain-mean properties, while Fig. 9 presents time- and horizontal-mean vertical profiles. To examine the robustness of the trends, we add here two more CDNC cases of 100 and 500 cm−3 (on top of the two that were examined above – 20 and 200 cm−3). Figure 8 demonstrates that the domain-mean cloud fraction (CF) generally decreases with the increase in CDNC (except for the first ∼10 h of the simulations). Examining the vertical structure of the CF response (Fig. 9) demonstrates that with the increase in CDNC, there is a reduction in the low-level (below 800 mbar) CF concomitant with an increase in CF at the middle and upper troposphere. The differences in rain rate between the different simulations are small. However, both the liquid water path (LWP) and the ice water path (IWP) show a consistent increase with CDNC. Accordingly, also the total water path (TWP), which is the sum of the LWP and the IWP, substantially increases with CDNC. The vertical profiles of the different hydrometers (Fig. 9) indicate, as expected, that the cloud droplet mass mixing ratio (qc – droplet with radius smaller than 40 µm) increases with CDNC, while the rain mass mixing ratio (qr – droplets with radius larger than 40 µm) decreases due to the shift in the droplet size distribution to smaller sizes under larger CDNC conditions. As this case is dominated by shallow clouds, only a comparably small amount of the ice mixing ration exists (qi; cf. Fig. 17), but its concentration increases with the CDNC increase. The combined effect of the increase in CDNC is to monotonically increase the total water mixing ratio (qt) above 800 mbar (Fig. 9). The relative increase in qt with CDNC becomes larger at higher levels.
The increase in cloud water with increasing CDNC can explain both the reductions in the net downward SW fluxes (both at TOA and surface) and the decrease in outgoing LW flux at TOA (Fig. 7), as it results in more SW reflection concomitant with more LW trapping in the atmosphere (Koren et al., 2010). Another contributor to the SW flux reduction (more reflectance) at the TOA is the Twomey effect (Twomey, 1977), while the decrease in the low-level CF compensates some of this effect. Here we present the outcome of these contradicting effects on the SW fluxes, which shows a reduction at both the TOA and surface (Fig. 7). For estimating the relative contribution of the Twomey effect compared to the cloud adjustments (CF and TWP effects) to the SW flux changes, we reran the simulations with the Twomey effect turned off (the radiation calculations do not consider the changes in effective radius between the different simulations). This demonstrates that without the Twomey effect the TOA SW difference is only −1.7 W m−2 as compared to −7.5 W m−2 with the Twomey effect, demonstrating the predominant role of the Twomey effect. For estimating the relative contribution of the changes in CF and water content to the SW flux changes, we conducted offline radiative transfer sensitivity tests. To quantify the water content radiative effect, we feed the same CF vertical profile from the model into the offline radiative transfer model BUGSrad while allowing the water content vertical profile to change (and visa versa to compute the CF radiative effect). This approach demonstrates that the contribution from the small reduction in CF is negligible compared to the increased SW reflectance caused by the increased water content (the effect of the reduction in CF compensates only about 1 % of the effect of the increase in the water content).
We also note a monotonic increase in the near-surface temperature with CDNC (see also Fig. 10). This trend can be explained by warm rain suppression with increasing CDNC that leads to less evaporative cooling (see the decrease in the total amount of water mass mixing ratio just above the surface in Fig. 9; Dagan et al., 2016; Albrecht, 1993; Seigel, 2014; Seifert and Heus, 2013; Lebo and Morrison, 2014). In addition, it was shown that under polluted conditions the rain drops below the cloud base are larger, hence evaporating less efficiently (Lebo and Morrison, 2014; Dagan et al., 2016). The increase in the near-surface temperature drives the decrease in the QSH (Fig. 6).
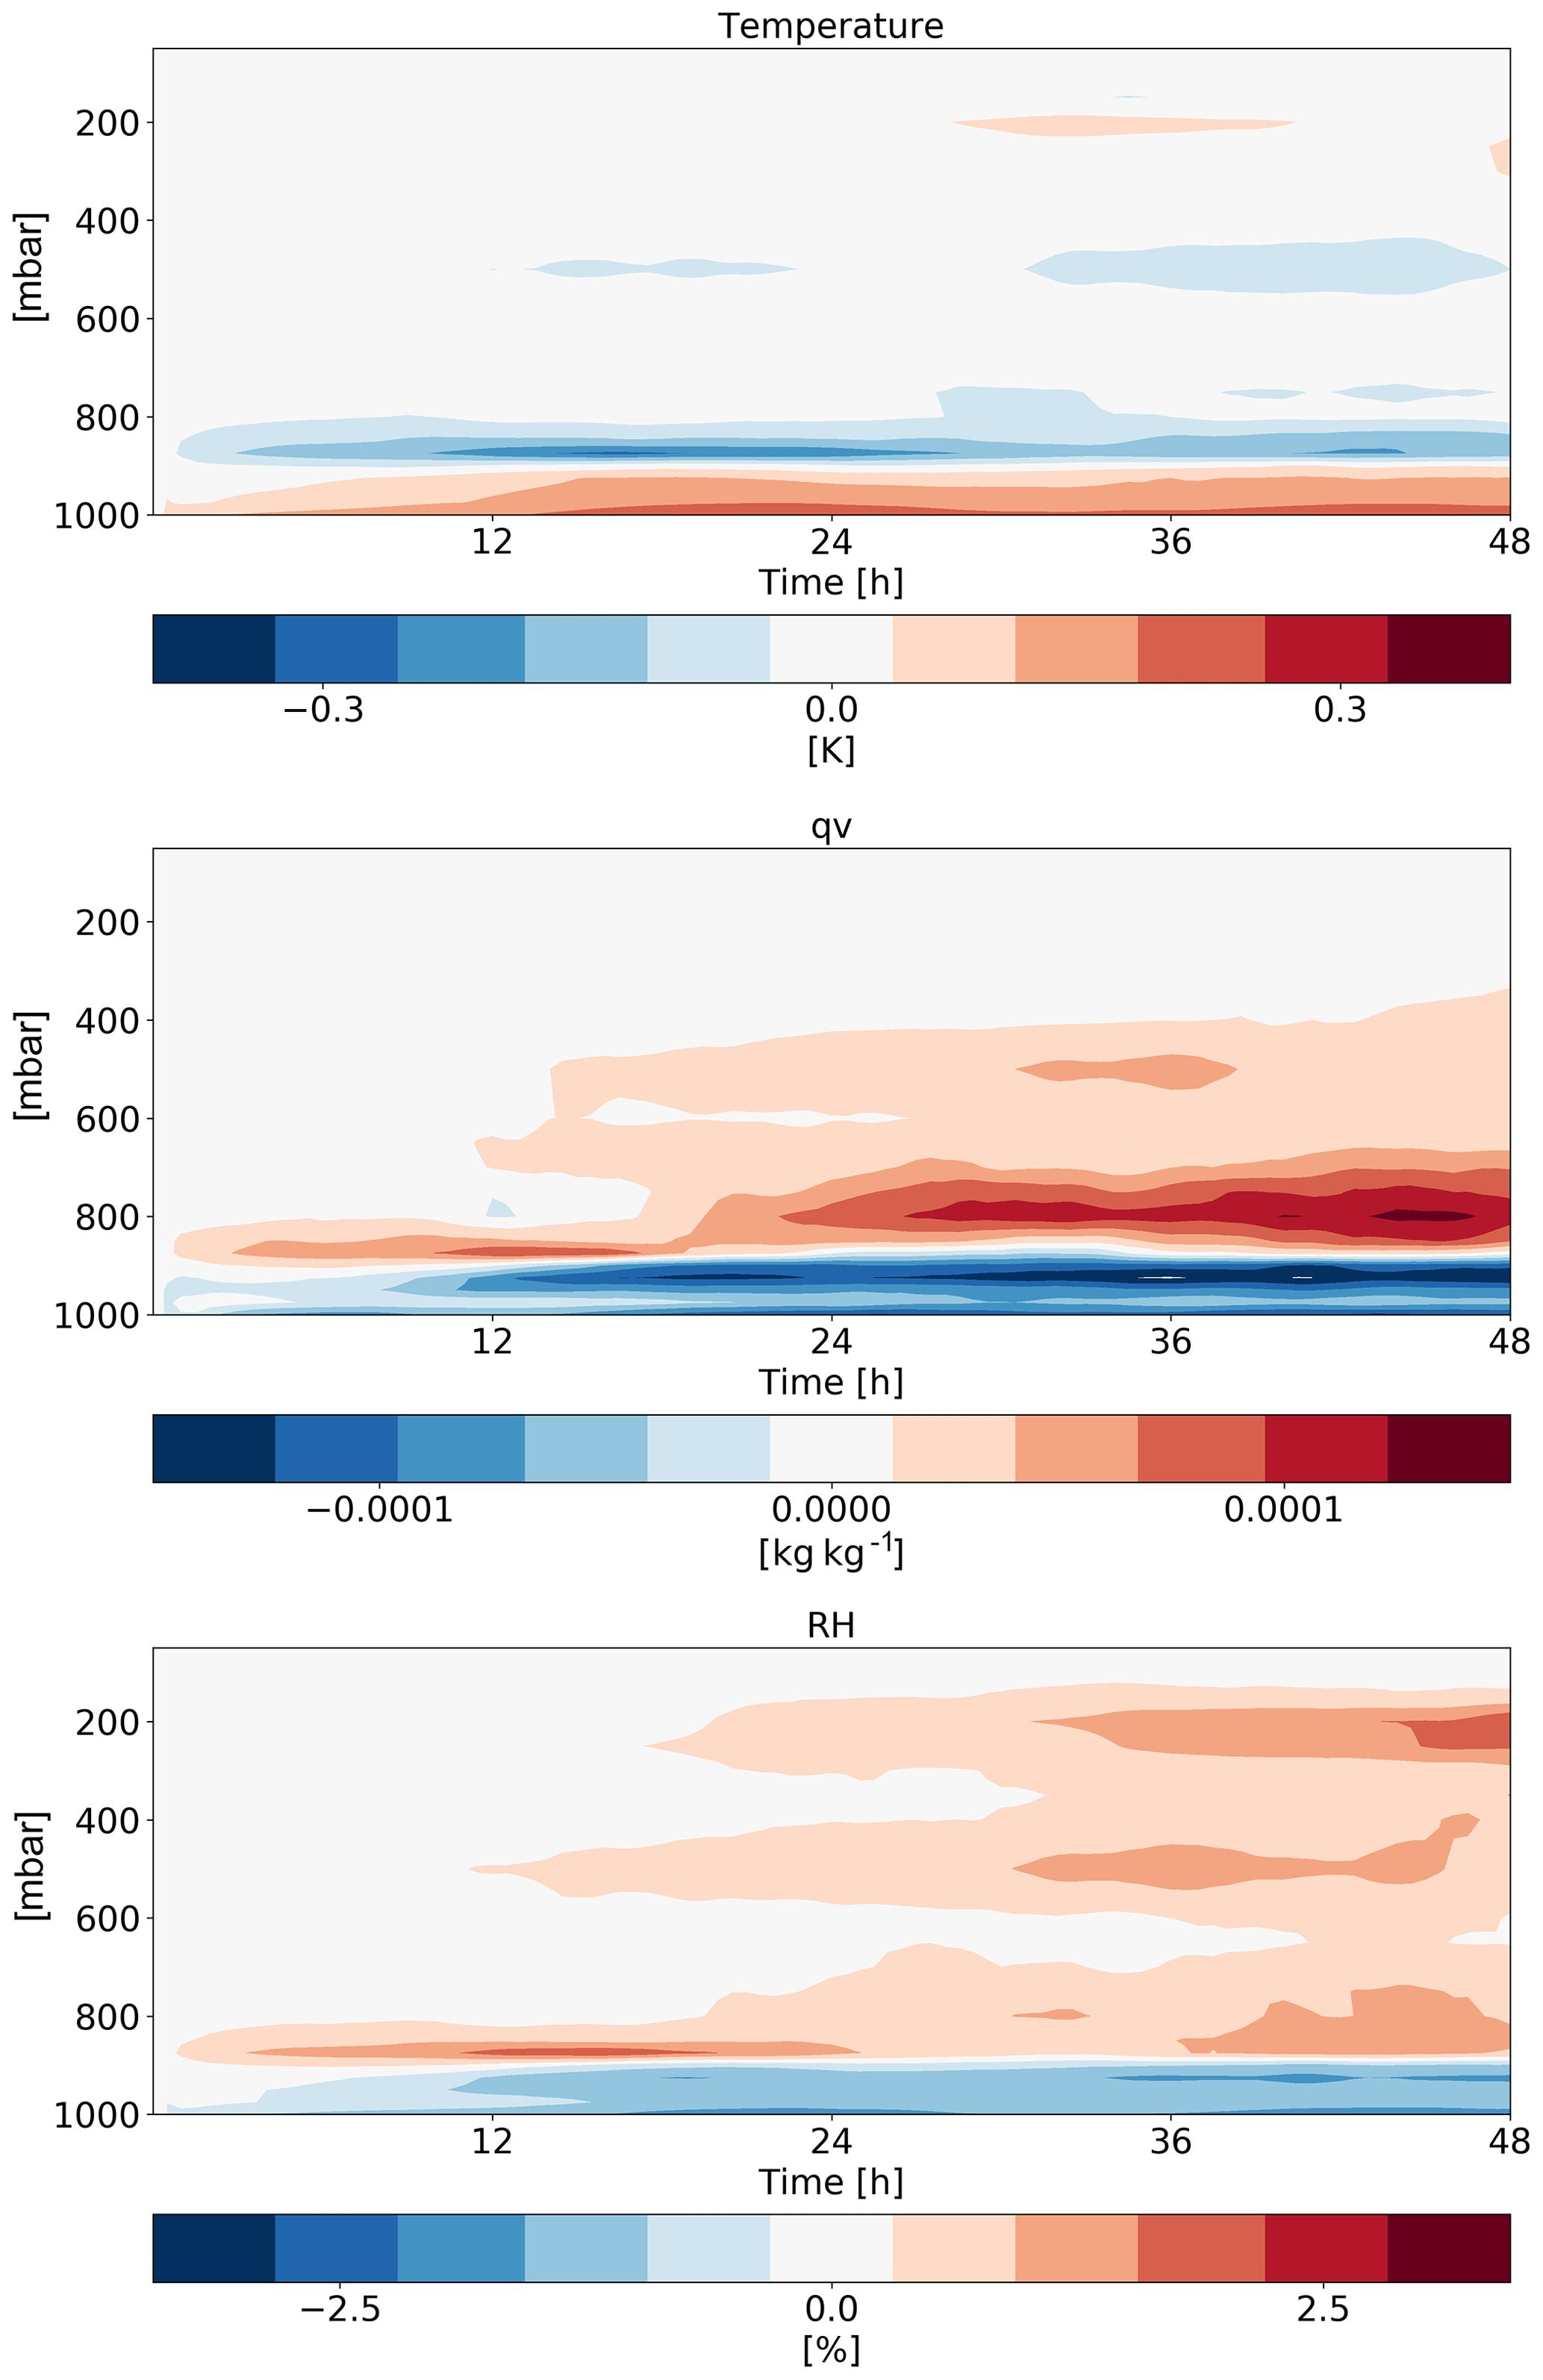
Figure 10Time–height diagrams of the differences in the domain-mean temperature, specific humidity (qv) and relative humidity (RH) vertical profiles between polluted (CDNC =200 cm−3) and clean (CDNC =20 cm−3) simulations for the shallow-cloud-dominated case (10–12 August 2016).
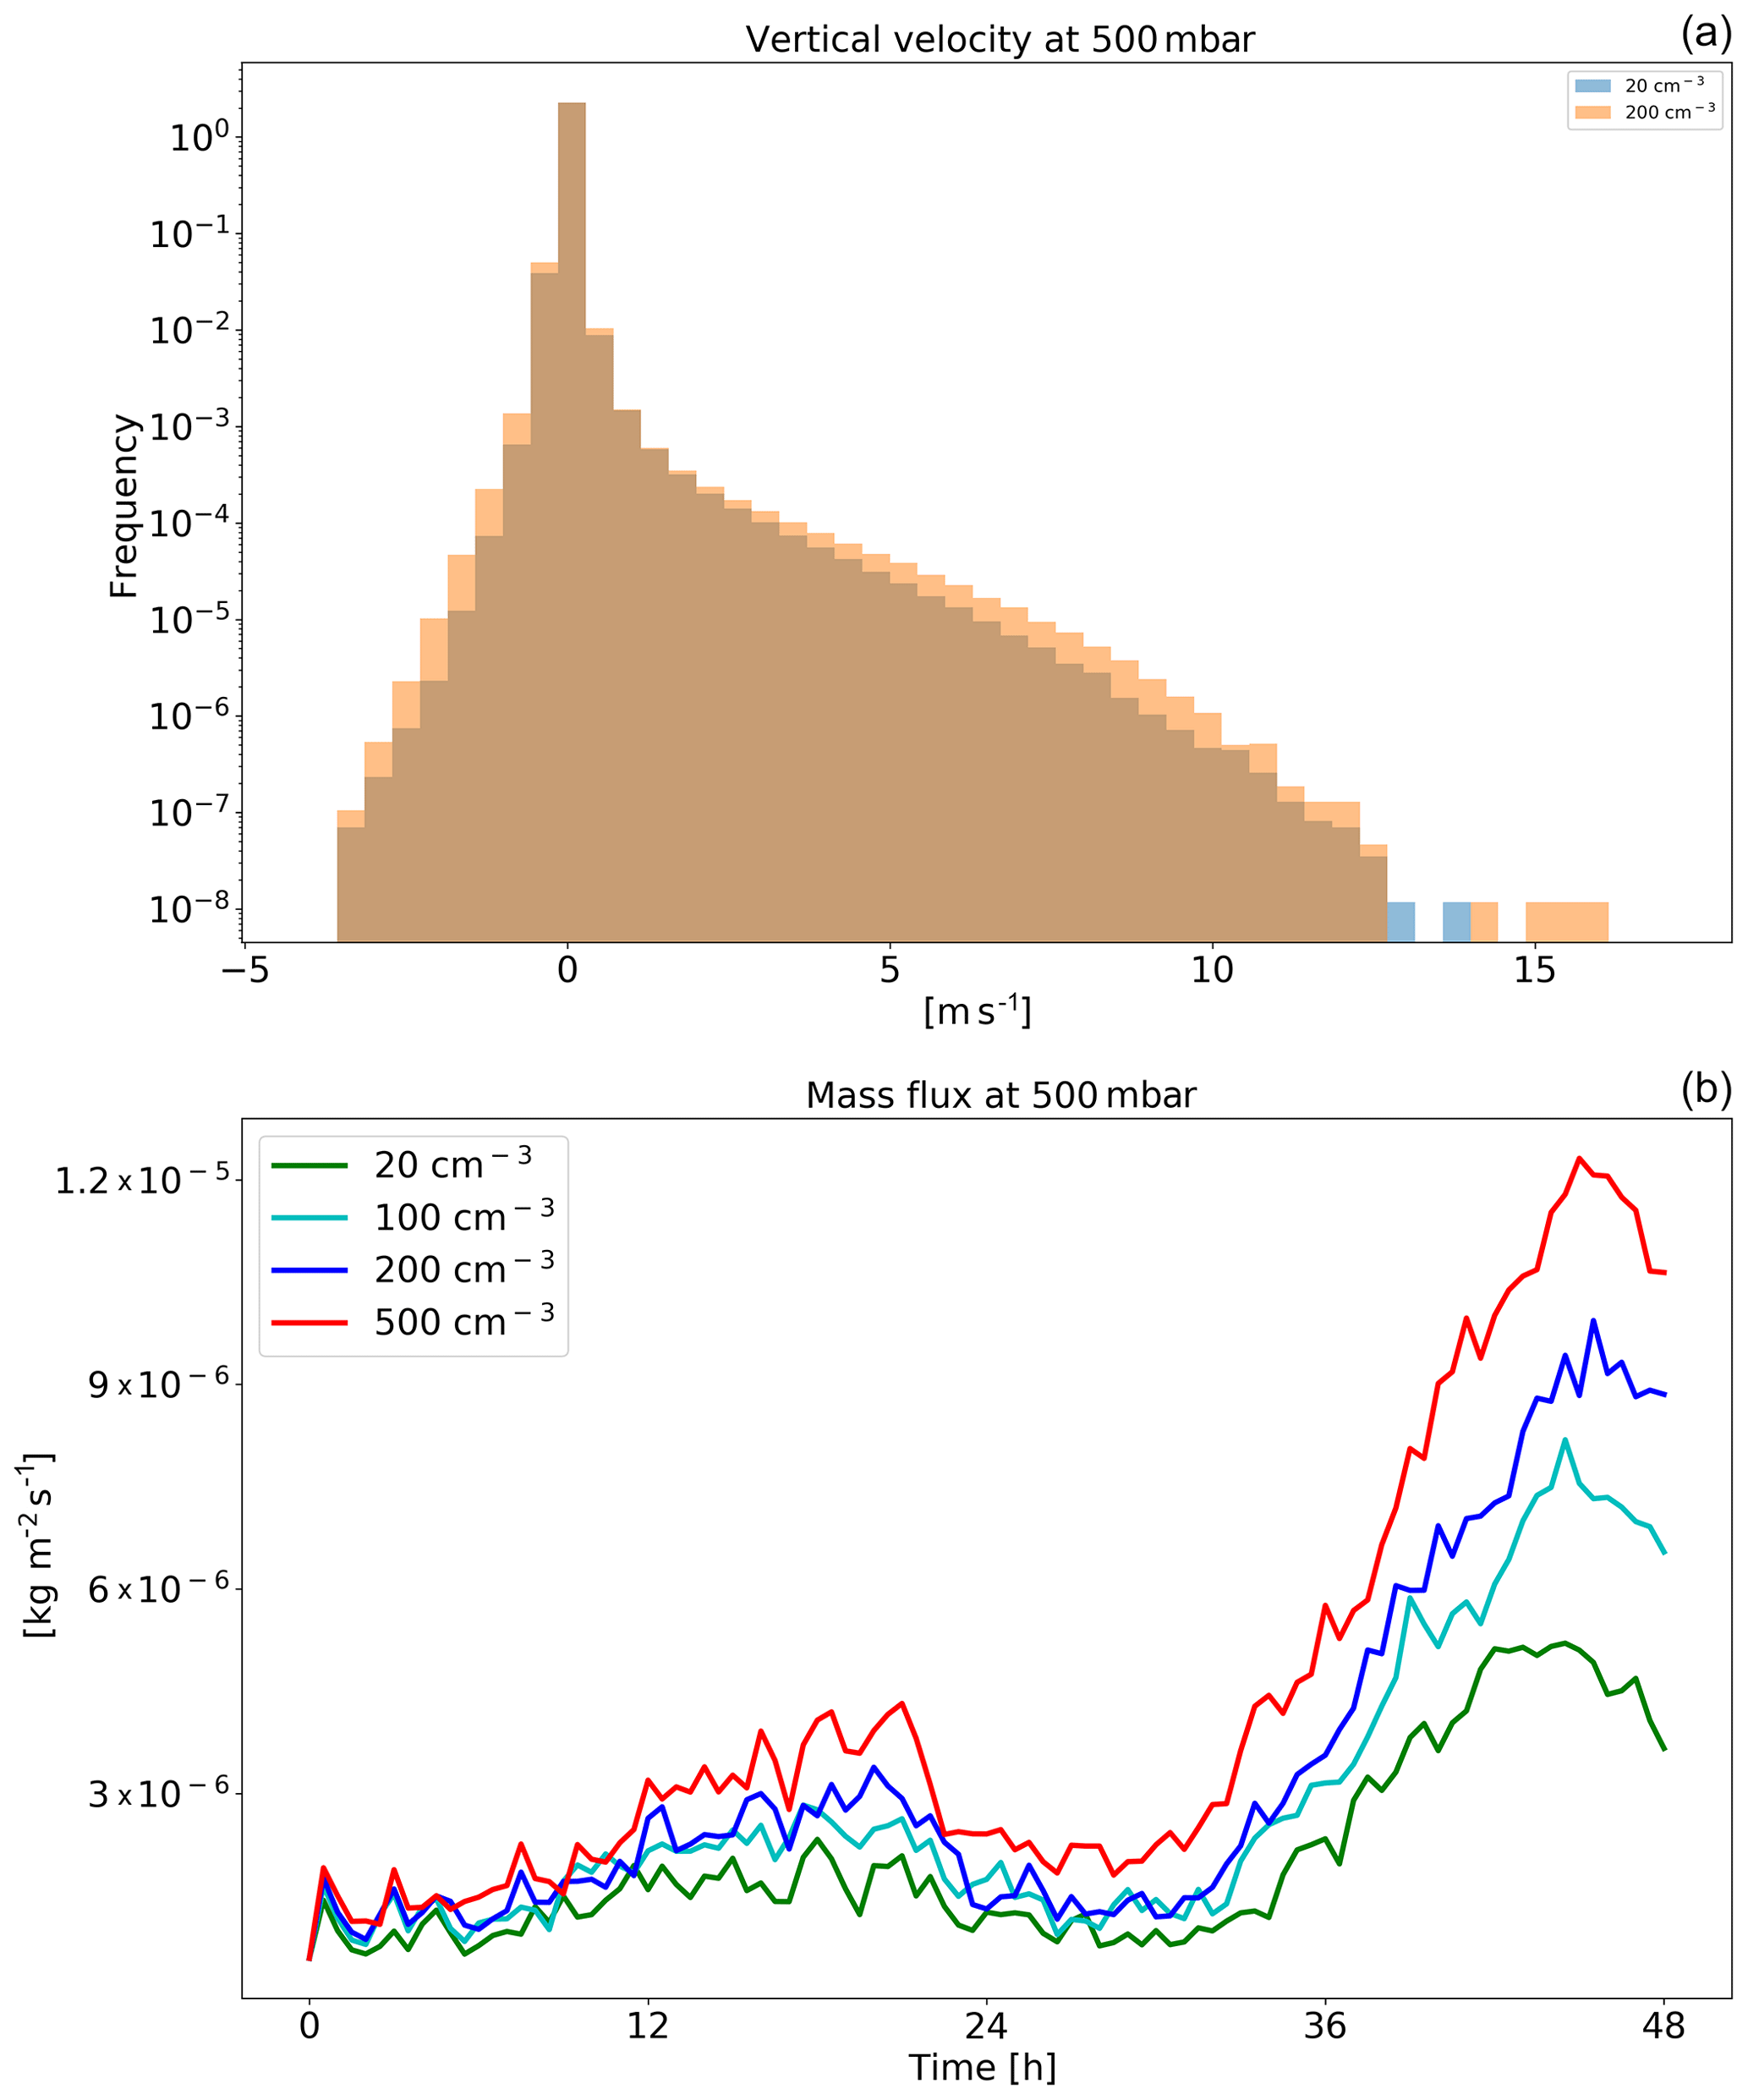
Figure 11Histograms of ICON-simulated vertical velocity at the level of 500 mbar for clean (CDNC =20 cm−3) and polluted (CDNC =200 cm−3) simulations (a), and the time evolution of the net upwards water (liquid and ice) mass flux (b) for the different CDNC simulations for the shallow-cloud-dominated case (10–12 August 2016). The 500 mbar level is chosen, as it represents the transition between the warm part to the cold part of the clouds. In the histogram only two simulations are presented for clarity.
In addition to the clouds' effect on the radiation fluxes, changes in humidity could also contribute (Fig. 10). We note that an increase in CDNC leads to an increase in relative humidity (RH) and specific humidity (qv) at the middle and upper troposphere without a significant temperature change. The increased humidity at the upper troposphere would act to decrease the outgoing LW flux, similar to the effect of the increased ice content in the upper troposphere (Fig. 9). However, sensitivity studies with offline radiative transfer calculations using BUGSrad demonstrate that the vast majority (more than 99 %) of the difference in between clean and polluted conditions emerges from the cloudy skies (rather than clear skies), suggesting that the effect of the increased ice content at the upper troposphere dominates.

Figure 12Spatial distribution of the time mean of the different terms of the energy budget for the ICON simulation of the deep-cloud-dominated case (16–18 August 2016) with CDNC =20 cm−3. The terms that appear here are as follows: LP – latent heat by precipitation, QSH – sensible heat flux, QR – atmospheric radiative warming – and R – the energy imbalance. The domain- and time-mean value of each term appear in brackets.
Both the increase in water vapour and ice content in the upper troposphere are driven by an increase in upward water (liquid and ice) mass flux with increasing CDNC (Fig. 11). An increase in mass flux could be caused by an increase in vertical velocities and/or by an increase in cloud (or updraught) fraction and/or by an increase in cloud water content. In our case, the increases in mass flux are driven partially by the small increase in vertical velocity (especially for updraught between 5 and 10 m s−1 – Fig. 11), partially by the small increase in cloud faction at this level (Fig. 9) and mostly due to the larger water mass mixing ratio (Fig. 9) that leads to an increase in mass flux even for a given vertical velocity. The increased relative humidity at the upper troposphere further increases the ice particle lifetime at these levels (in addition to the microphysical effect; Grabowski and Morrison, 2016) as the evaporation rate decreases. In addition, the differences in the thermodynamics evolution between the different simulations (Fig. 10) demonstrate drying and warming of the boundary layer with increasing CDNC due to reduction in rain evaporation below the cloud base and deepening of the boundary layer (Dagan et al., 2016; Lebo and Morrison, 2014; Seifert et al., 2015; Spill et al., 2019). The drying of the boundary layer could explain the reduction in the low-cloud fraction (Fig. 9; Seifert et al., 2015).
3.3 Deep-cloud-dominated case – 16–18 August 2016
Next, we analyse the atmospheric energy budget for the deep-cloud-dominated case (Tropical Storm Fiona – Fig. 12). As opposed to the shallow-cloud-dominated case, in this case the LP contribution dominates over the radiative cooling, and hence the energy imbalance R is positive and large, suggesting divergence of dry static energy out of the domain. This difference in the baseline atmospheric energy budget between the different cases simulated here enables an examination of the aerosol effect on the atmospheric energy budget under contrasting initial conditions. As in the shallow-cloud-dominated case, the QR values vary between small values (especially at the regions that were mostly covered by deep clouds) and larger negative values (dominated at the regions that were coved by shallow clouds). The QSH is positive and an order of magnitude smaller than the QR and LP, similar to the shallow-cloud-dominated case.
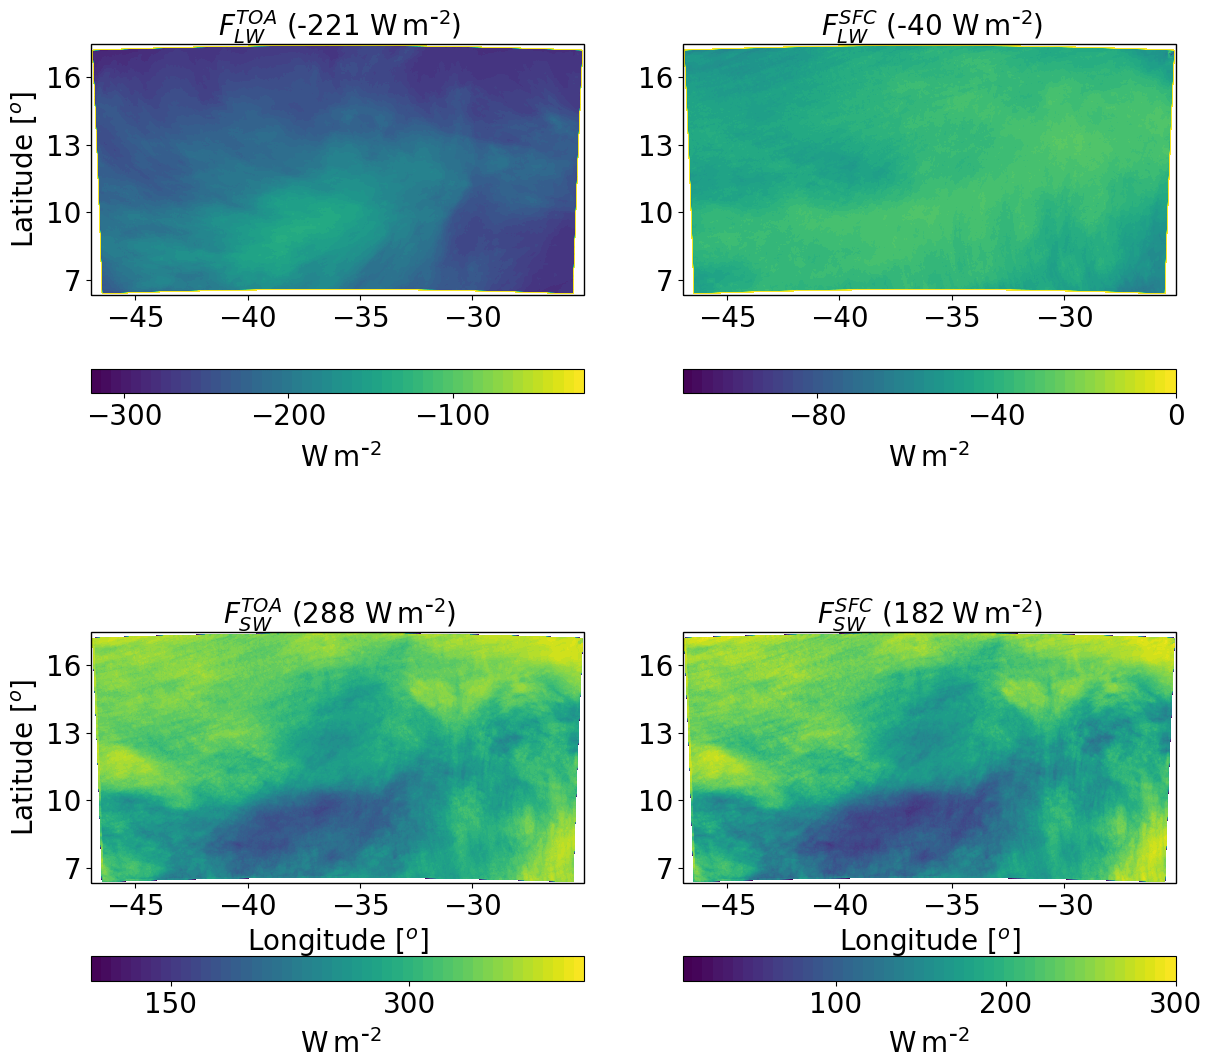
Figure 13Spatial distribution of ICON-simulated time-mean longwave (LW) and shortwave (SW) radiation fluxes at the top of atmosphere (TOA) and surface (SFC) for a simulation of the deep-cloud-dominated case (16–18 August 2016) with CDNC =20 cm−3. The domain- and time-mean value of each term appear in brackets.
Further examination of the radiative fluxes (Fig. 13) demonstrates again the resemblance in the spatial structure between QR and . As compared to the shallow-cloud-dominated case, since the clouds are more opaque and cover a larger fraction of the sky, there is a decrease in the magnitude of all fluxes (in different amounts). For example, is lower by 39 W m−2 (representing larger SW reflectance back into space) and the magnitude of by 47 W m−2 as compared to the shallow-cloud-dominated case. The combined effect of the radiative flux differences between the two cases is a decrease in the atmospheric radiative cooling by 39.6 W m−2 (−114.7 compared with −75.3 W m−2 – see Figs. 5 and 13).

Figure 14The differences between polluted (CDNC =200 cm−3) and clean (CDNC =20 cm−3) ICON simulations of the time-mean terms of the energy budget for the deep-cloud-dominated case (16–18 August 2016). The terms that appears here are as follows: LP – latent heat by precipitation, QSH – sensible heat flux, QR – atmospheric radiative warming – and R – the energy imbalance. The domain- and time-mean value of each term appear in brackets.
3.4 Response to aerosol perturbation – deep-cloud-dominated case
For the deep-cloud-dominated case, an increase in CDNC results in a decrease in LP by −0.3 W m−2. Again, this difference is due to non-statistically significant precipitation changes (see also Fig. 16 below). A similar QSH decrease to the shallow-cloud-dominated case is observed in the deep-cloud-dominated case (see Figs. 14 and 6). The predominant difference in the response between the two cases is in QR, which increases much more in the deep-cloud-dominated case: 10.0 W m−2 (Fig. 14) compared with 1.6 W m−2 in the shallow-cloud-dominated case (Fig. 6).
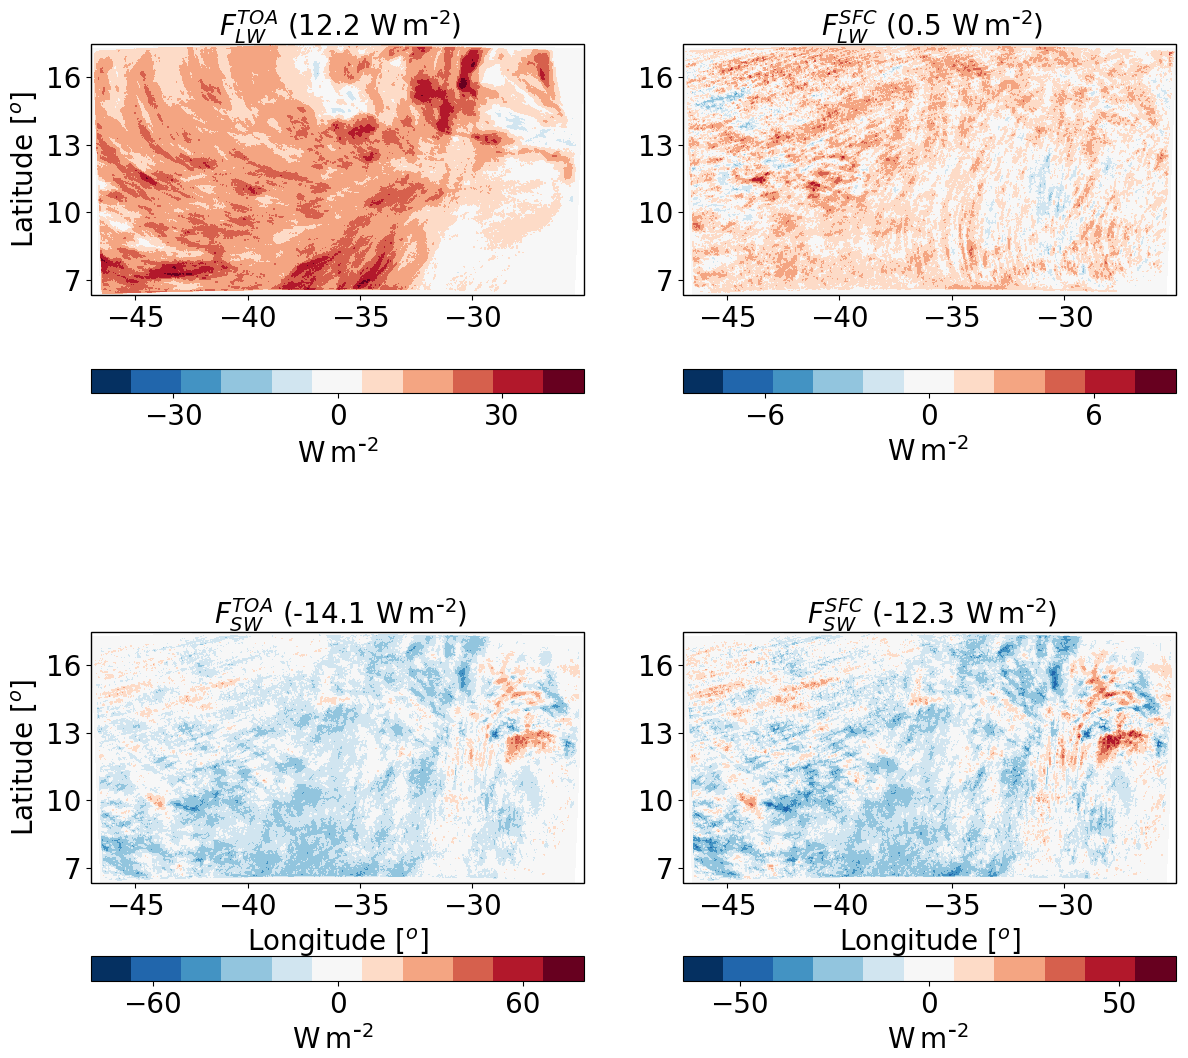
Figure 15The differences between polluted (CDNC =200 cm−3) and clean (CDNC =20 cm−3) ICON simulations of the time-mean radiative longwave (LW) and shortwave (SW) fluxes at the top of atmosphere (TOA) and surface (SFC) for the deep-cloud-dominated case (16–18 August 2016). The domain- and time-mean value of each term appear in brackets.
The large increase in QR is caused mostly by the increase in (which becomes less negative, i.e. less outgoing LW radiation under polluted conditions – Fig. 15). The CDNC effect on has a much smaller magnitude. The SW flux changes are substantial (−14.1 at TOA and −12.3 W m−2 at the surface); however, in terms of the atmospheric energy budget, since clouds do not absorb much in the SW, the TOA and surface changes almost cancel each other out, and the net effect is only ∼1.8 W m−2 of atmospheric radiative cooling (which decreases some of the LW warming). The net TOA total (SW + LW) radiative flux change is about −1.9 W m−2. The trends in the mean cloud properties (Figs. 16 and 17 below) can explain this large radiative response.
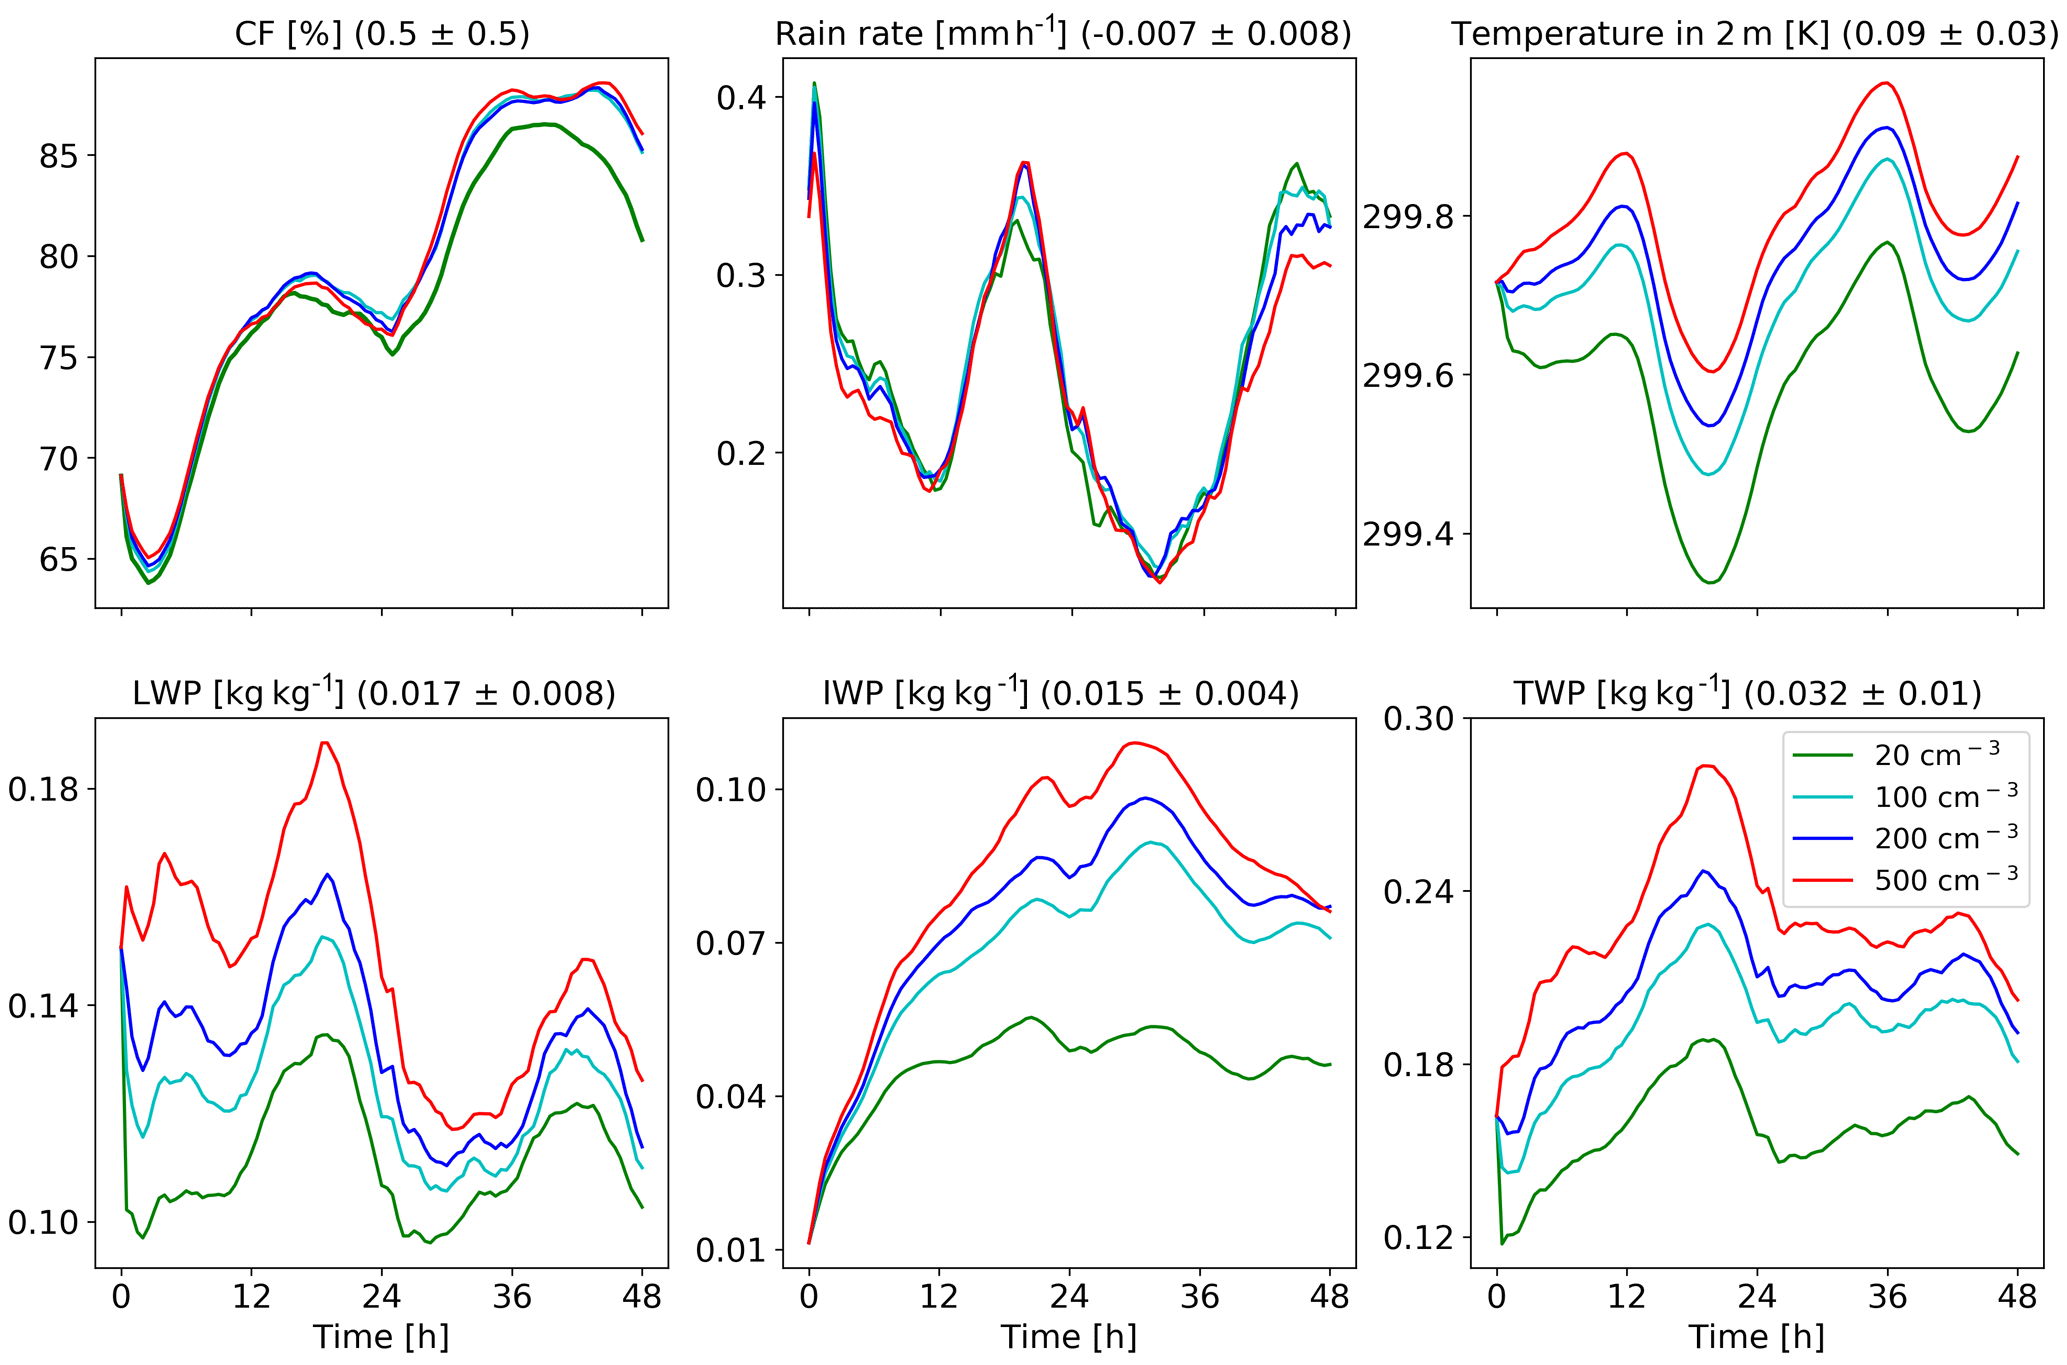
Figure 16Domain-average properties as a function of time for the different CDNC simulations for the deep-cloud-dominated case. The properties that are presented here are as follows: cloud fraction (CF), rain rate, temperature in 2 m, liquid water path (LWP – based on the cloud water mass, excluding the rain mass for consistency with satellite observations), ice water path (IWP) and total water path (TPW = LWP + IWP). For each property, the mean difference between all combinations of simulations, normalized to an increase in CDNC by a factor of 5, and its standard deviation appear in brackets.
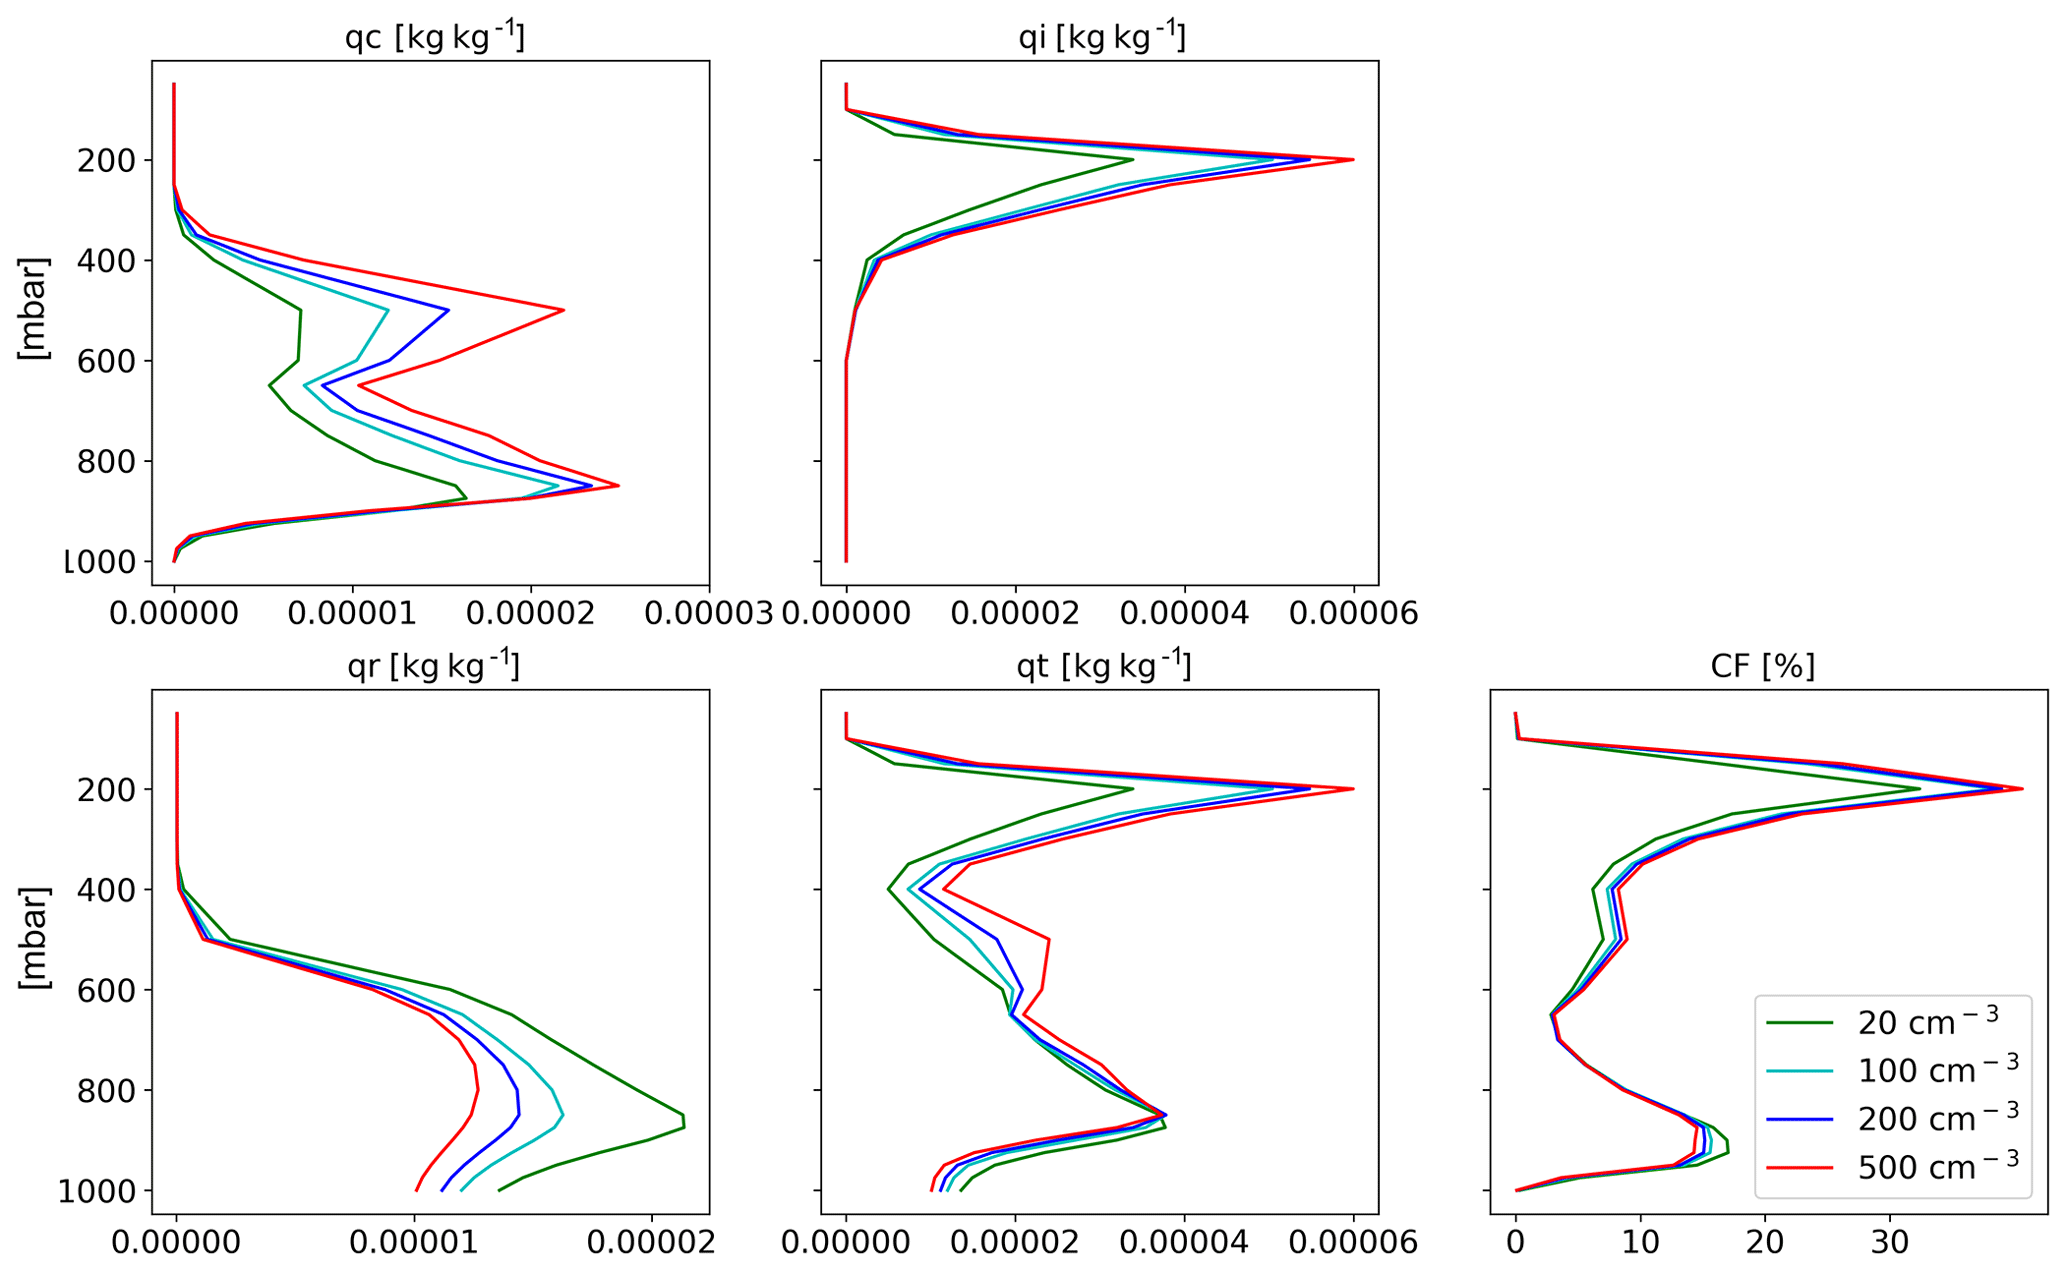
Figure 17Domain- and time-average vertical profiles for the different CDNC simulations for the shallow-cloud-dominated case. The properties that are presented here are as follows: cloud droplet mass mixing ratio (qc – for clouds' drops with radius smaller than 40 µm), ice mass mixing ratio (qi), rain mass mixing ratio (qr – for clouds' drops with radius larger than 40 µm), total water mass mixing ratio (qt = qc + qi + qr) and cloud fraction (CF).
Figure 16 presents some of the domain-mean properties as a function of time for the deep-cloud-dominated case. It demonstrates an increase in CF with CDNC which is more significant during the second day of the simulation. This is opposite to the CF reduction in the shallow-cloud-dominated case (Fig. 8). It also demonstrates a very significant increase in LWP and an even greater (in relative terms) increase in IWP and thus also in TWP. The increase in CF and water content can explain the decrease in SW fluxes both at TOA and surface (Fig. 15), as more SW is reflected back into space. The larger SW reflection under increased CDNC is also contributed to by the Twomey effect (Twomey, 1977). Rerunning the simulations without the Twomey effect results in a 9.6 W m−2 reduction in the TOA SW flux as compared to 14.1 W m−2 with the Twomey effect on. We note that the relative role of the Twomey effect (compared to the cloud adjustments – CF and TWP) is larger in the shallow-cloud-dominated case as compared to the deep-cloud-dominated case (−14.1 and −9.6 W m−2 for simulations with and without the Twomey effect in the deep-cloud-dominated case compared to −7.5 and −1.7 W m−2 in the shallow-cloud-dominated case, respectively). However, it should be noted that the Twomey effect due to changes in the ice particle size distribution was not considered. In this case, unlike in the shallow-cloud-dominated case, the three contributions to the SW changes (CF, Twomey and LWP–IWP; e.g. Goren and Rosenfeld, 2014) all contribute to the SW flux reduction (Fig. 15 presents the results of all contributors). Offline sensitivity tests demonstrate that the relative contribution of the water content and the CF to the increase in SW reflectance is roughly thee-fourths and one-fourth, respectively.
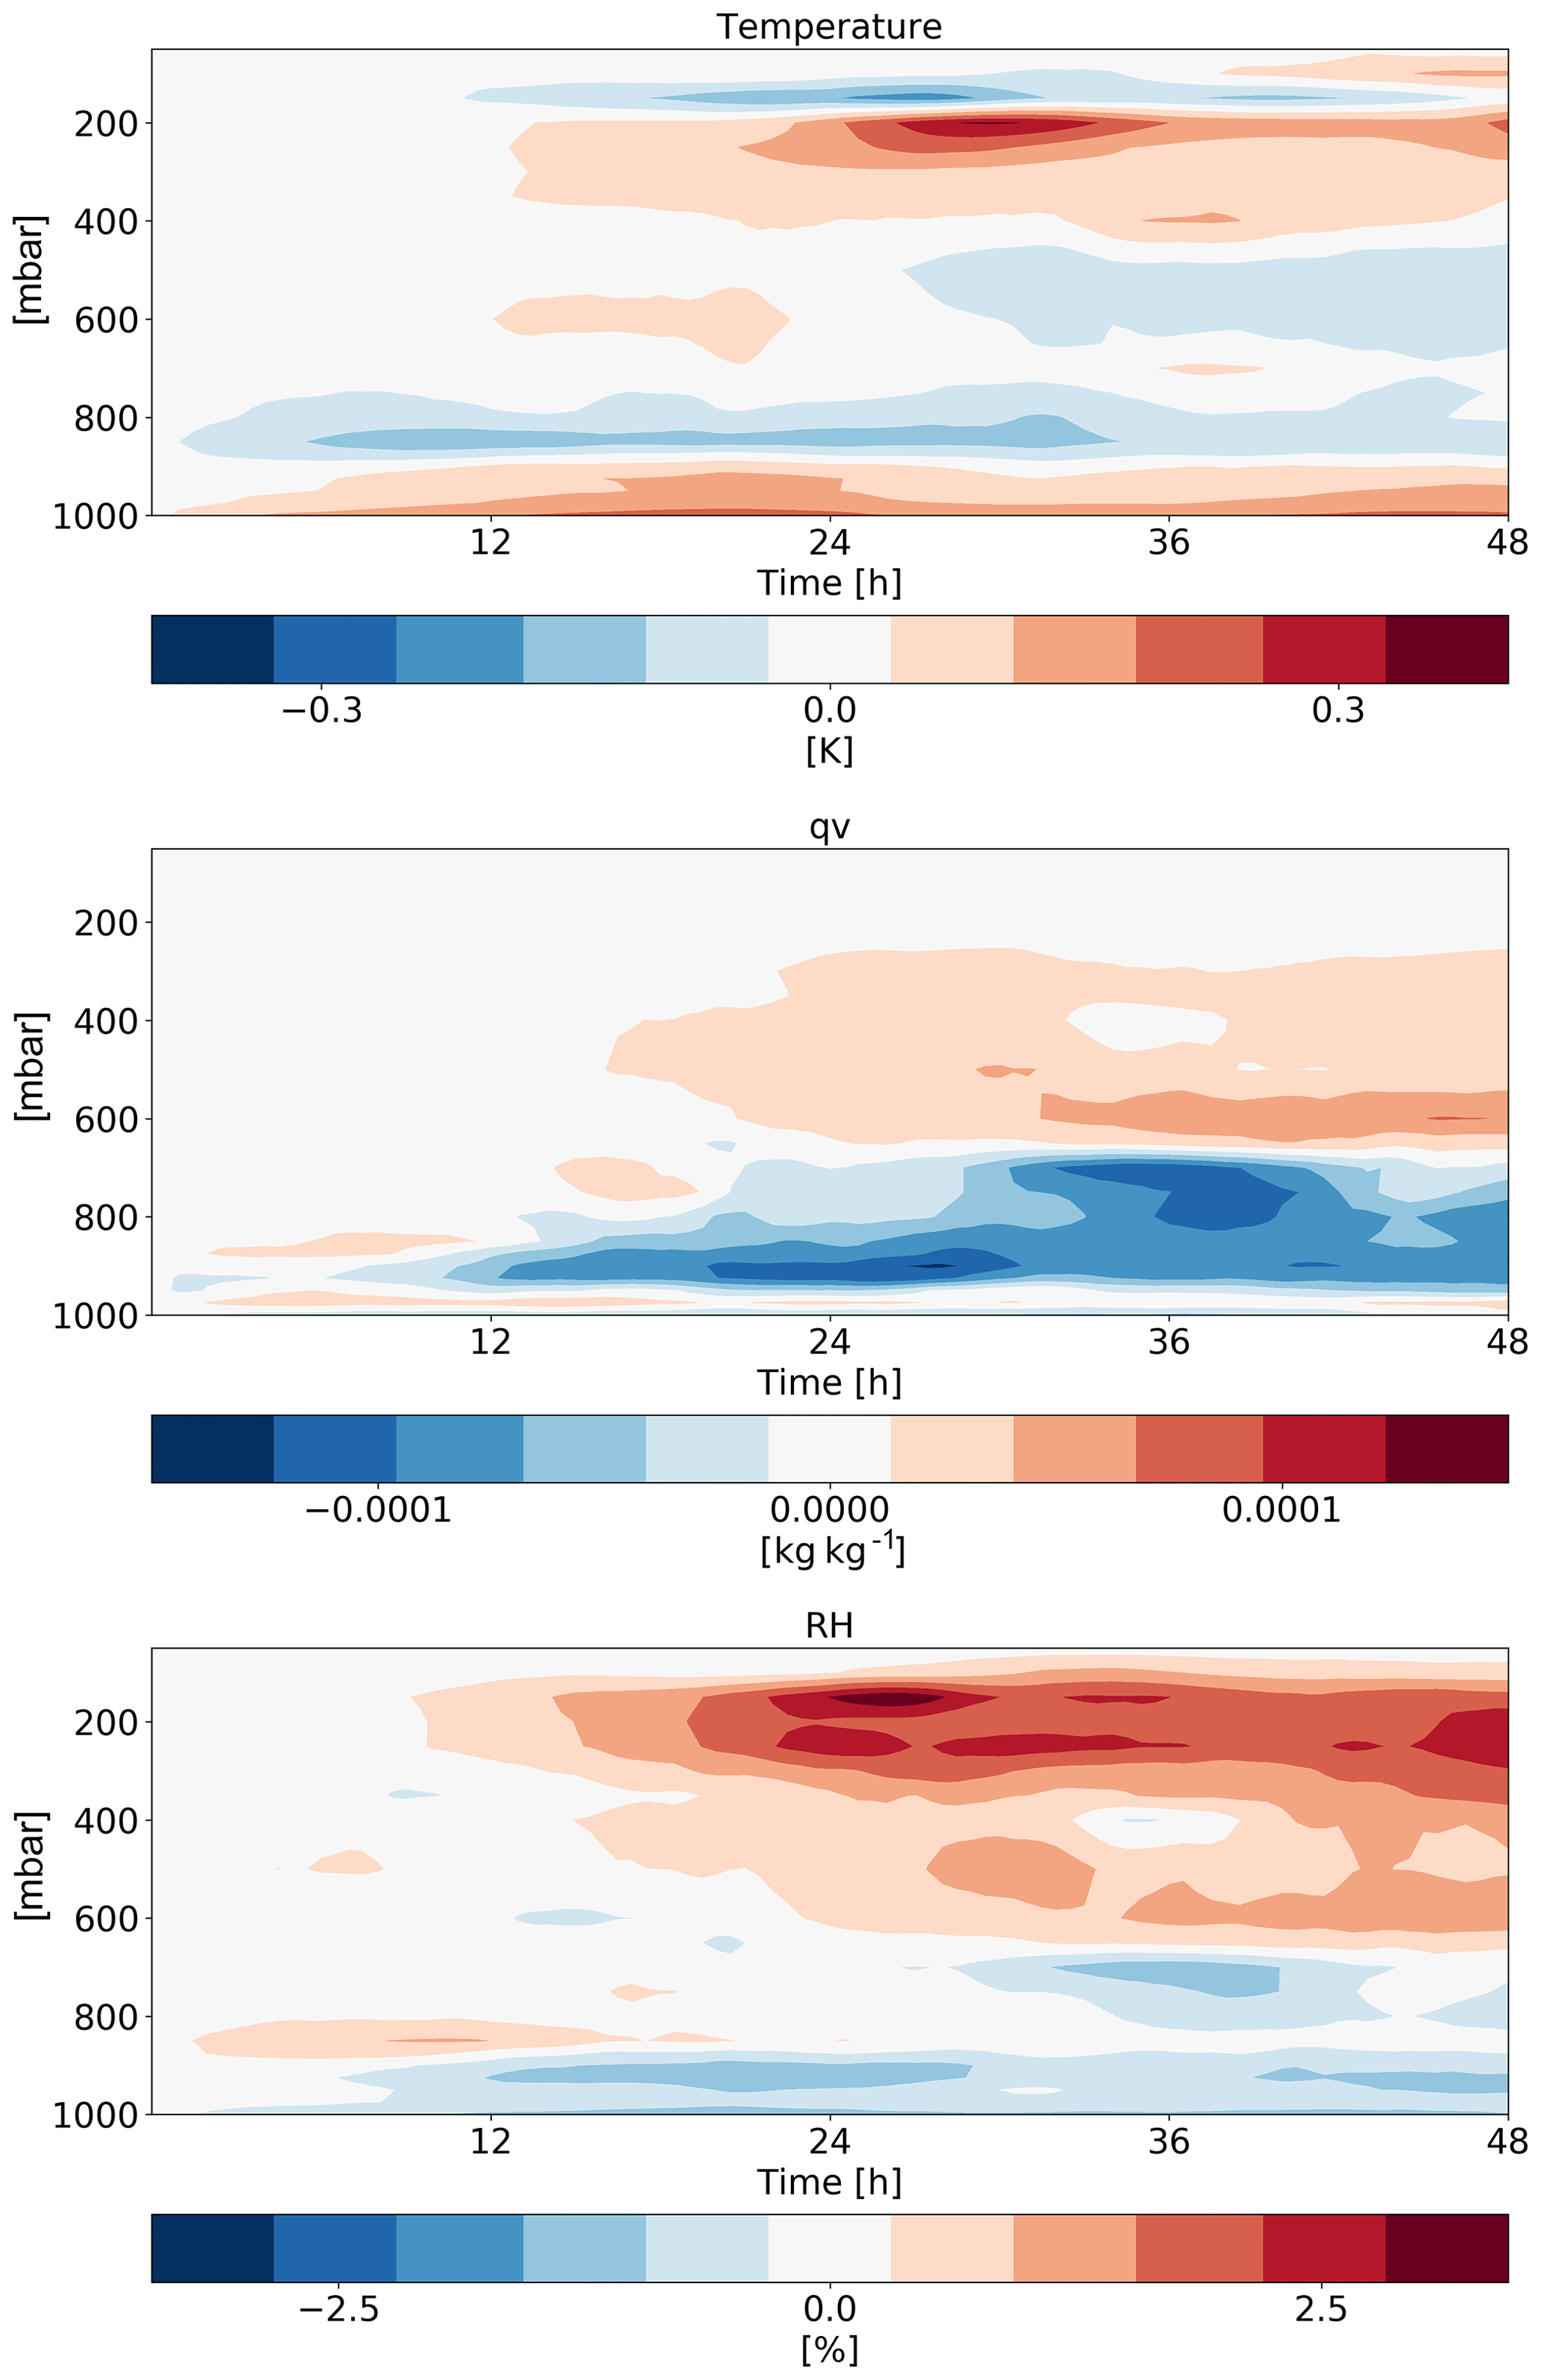
Figure 18Time–height diagrams of the differences in the domain-mean temperature, specific humidity (qv) and relative humidity (RH) vertical profiles between polluted (CDNC =200 cm−3) and clean (CDNC =20 cm−3) simulations for the deep-cloud-dominated case (16–18 August 2016).

Figure 19Histograms of ICON-simulated vertical velocity at the level of 500 mbar for clean (CDNC =20 cm−3) and polluted (CDNC =200 cm−3) simulations (a), and the time evolution of the net upwards water (liquid and ice) mass flux (b) for the different CDNC simulations for the deep-cloud-dominated case (16–18 August 2016). The 500 mbar level is chosen, as it represents the transition between the warm part to the cold part of the clouds. In the histogram only two simulations are presented for clarity.
The changes in vertical profiles with CDNC (Fig. 17) demonstrate a consistent picture of a decrease in CF in low clouds and a significant increase in CF and liquid and ice content at the middle and upper troposphere. The CF increase at the upper troposphere, and especially the increase in the ice content, can explain the decrease in the outgoing LW radiation (Fig. 15). The increase in ice content at the upper troposphere is in agreement with recent observational studies (Gryspeerdt et al., 2018; Sourdeval et al., 2018; Christensen et al., 2016). Analysis of the upward water mass flux from the warm to the cold part of the clouds (at 500 mbar) in the different simulations (Fig. 19) demonstrates a substantial increase with the increase in CDNC (Chen et al., 2017), which occurs due to the increase in the water content (Fig. 17) and the delay in the rain formation to higher levels (Heikenfeld et al., 2019), even without a large change in the vertical velocity or cloud fraction at this level (Fig. 17). Similar to the shallow-cloud-dominated case (Fig. 8), the near-surface temperature monotonically increases with CDNC, while the effect on the mean rain rate is small.
The differences in the thermodynamic evolution between polluted and clean conditions for this case (Fig. 18) demonstrate the same trend as in the shallow-cloud-dominated case (Fig. 10). Here again, we note an increase in the humidity at the middle and upper troposphere that contributes to the reduction in the outgoing LW flux. The deepening, drying and warming of the boundary layer are observed in this case as well. Both the increase in humidity at the middle–upper troposphere and the deepening of the boundary layer (Seifert et al., 2015) could cause a reduction of the outgoing LW flux. To distinguish the effect of clouds and humidity at the different levels on the outgoing LW flux, we conducted sensitivity offline radiative transfer calculations using BUGSrad. As in the shallow-cloud-dominated case, the difference in outgoing LW flux between clean and polluted conditions primarily emerges from the CDNC effect on clouds. The small remaining effect of the clear sky (∼0.2 W m−2) is contributed by the change in the humidity at the middle and upper troposphere rather than by the deepening of the boundary layer (which would lead to LW emission from lower temperatures and is expected to be more significant under lower-free-troposphere humidity conditions).
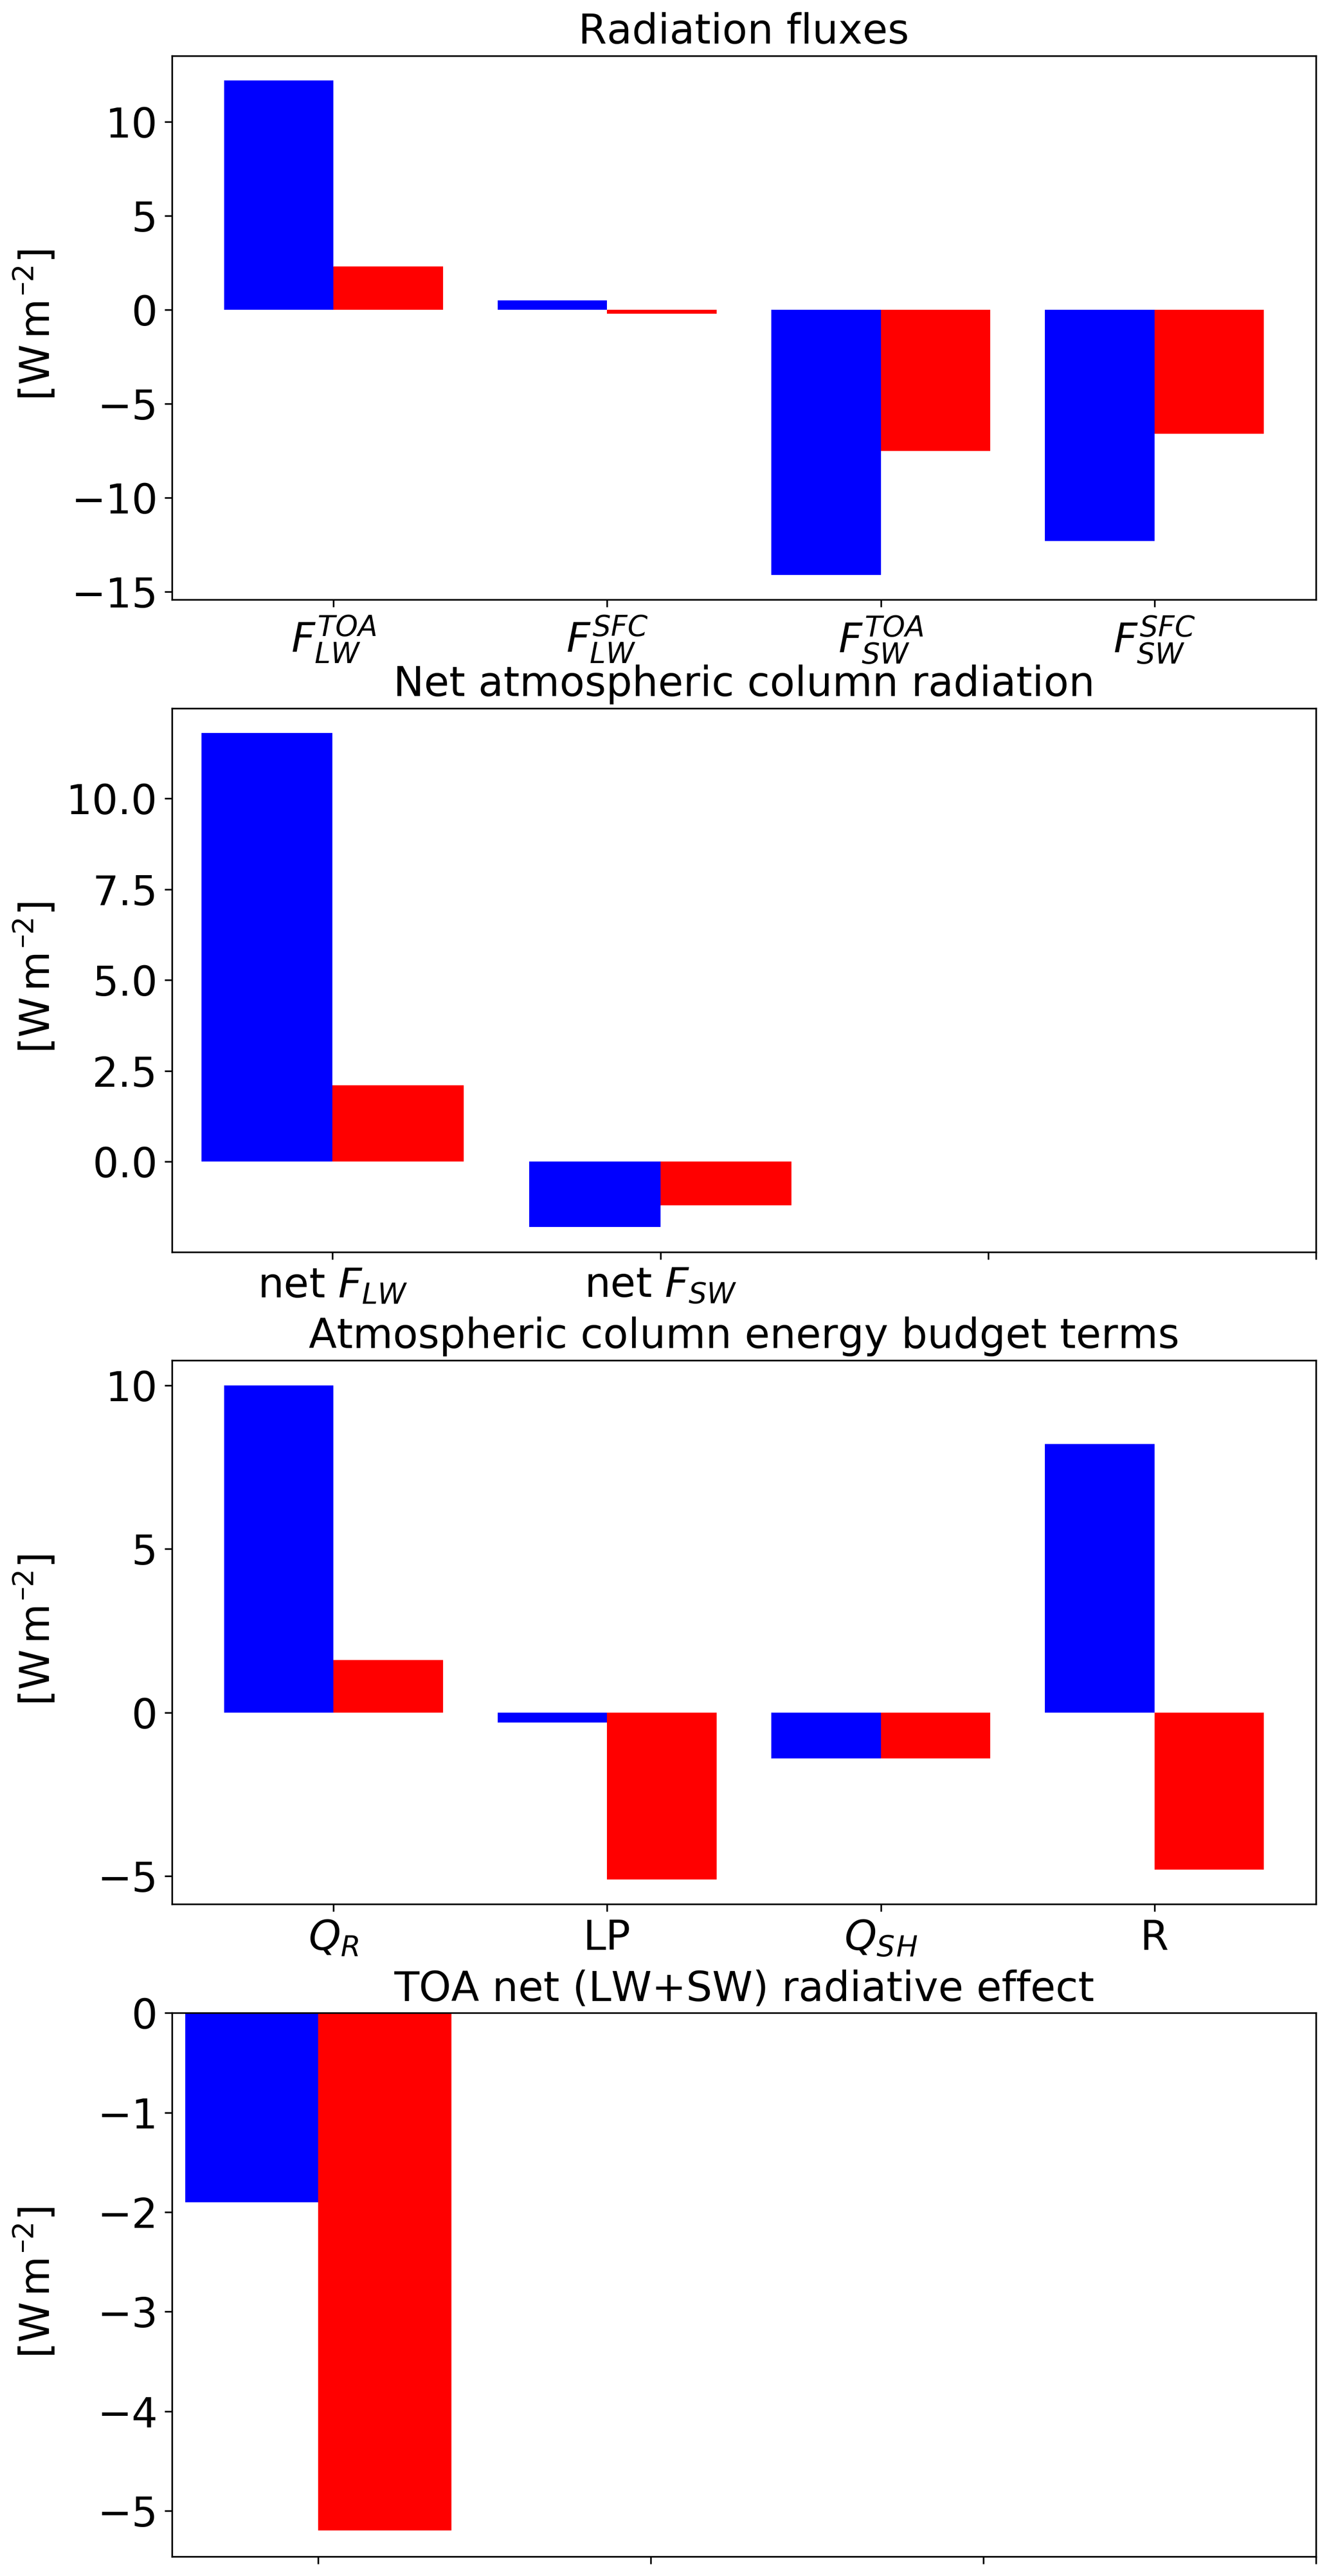
Figure 20Summary of the radiation and energy response to CDNC perturbation in the two different cases. Blue represents the deep-cloud-dominated case, while red represents the shallow-cloud-dominated case.
Two different case studies of tropical cloud systems over the Atlantic Ocean were simulated using the ICON numerical model in a cloud-resolving configuration with 1.2 km resolution and a relatively large domain (). The cases represent dates from the NARVAL 2 field campaign that took place during August 2016 and have different dominant cloud types and different dominating terms in their energy budget. The first case (10–12 August 2016) is shallow-cloud-dominated and hence dominated by radiative cooling, while the second case (16–18 August 2016) is dominated by deep convective clouds and hence dominated by precipitation warming. The main objective of this study is to analyse the response of the atmospheric energy budget to changes in cloud droplet number concentration (CDNC), which serve as a proxy for (or idealized representation of) changes in aerosol concentration. This enables better understanding of the processes acting in global-scale studies trying to constrain aerosol effect on precipitation changes using the energy budget perspective (O'Gorman et al., 2012; Muller and O'Gorman, 2011; Hodnebrog et al., 2016; Samset et al., 2016; Myhre et al., 2017; Liu et al., 2018; Richardson et al., 2018; Dagan et al., 2019a). Our results demonstrate that regional atmospheric energy budgets can be significantly perturbed by changes in CDNC and that the magnitude of the effect is cloud-regime-dependent (even for a given geographical region and given time of the year, as the two cases are separated by less than a week).
Figure 20 summarizes the energy and radiation response of the two simulated cases to CDNC perturbations. It shows that the atmosphere in the deep-cloud-dominated case experiences a very strong atmospheric warming due to an increase in CDNC (10.0 W m−2). Most of this warming is caused by a reduction in the outgoing LW radiation at the TOA. The SW radiative fluxes (both at the TOA and surface) are also significantly modified, but their net effect on the atmospheric column energy budget is small. The net TOA radiative flux change in this case is −1.9 W m−2. Besides the atmospheric radiative warming, changes in precipitation ( W m−2) and in sensible heat flux (QSH, −1.4 W m−2) also contribute to the total trend as a response to the increase in CDNC. We note that since 1 mm h−1 of rain is equivalent to 628 W m−2, even negligible changes in precipitation of less than 0.5 mm over 48 h (as seen in our simulations) can still appear as significant changes in the atmospheric energy budget and contribute a few watts per square metre.
The response of the radiative fluxes can be explained by the changes in the mean cloud and thermodynamic properties in the domain. The mean cloud fraction (CF) increases with the increase in CDNC (Fig. 16), while the vertical structure of it indicates a reduction in the low-cloud fraction (below 800 mbar) and an increase in the middle- and upper-troposphere CF (Fig. 17). The water content (both liquid and ice) also increases with the increase in CDNC (Figs. 16 and 17), with the amount increasing with height. These changes in the mean cloud properties drive both the reduction in SW fluxes at TOA and surface and LW flux at TOA as the clouds become more opaque (Koren et al., 2010; Storelvmo et al., 2011) and cover a larger fraction of the sky. In addition to cloud responses, the domain-mean thermodynamic conditions change as well (Fig. 18). Specifically, the humidity content at the middle and upper troposphere increases with higher CDNC (due to increase mass flux to the upper troposphere), which further decreases the outgoing LW flux at the TOA. However, the vast majority of the LW effect emerges from the changes in clouds.
Both the increase in water vapour and ice content in the upper troposphere are driven by an increase in water mass flux with increasing CDNC to these levels (Fig. 19; Koren et al., 2005; Rosenfeld et al., 2008; Altaratz et al., 2014; Chen et al., 2017), which is caused mostly by the increase in the water mixing ratio in the middle troposphere rather than by the increase in vertical velocity (Fig. 19) or in cloud fraction (Fig. 17). The ice content in the upper troposphere is also increased due to reduction in the ice falling speed (Grabowski and Morrison, 2016), while the increased relative humidity at these levels further increases the ice particle lifetime due to slower evaporation. However, the increase in water mass flux to the upper layers is not accompanied with an increase in precipitation as predicted by the classical “invigoration” paradigm (Altaratz et al., 2014; Rosenfeld et al., 2008), which suggests that some compensating mechanisms are operating (Stevens and Feingold, 2009).
In the shallow-cloud-dominated case (which also contains a significant amount of deep convection), the response of QR is weaker but still substantial (a total decrease in the atmospheric radiative cooling of 1.6 W m−2 – Fig. 20). The weaker total response under the shallow-cloud-dominated conditions is due to the smaller role of the ice part in this case. Here again, the changes in QSH decrease about −1.4 W m−2 of this atmospheric warming. As in the deep-cloud-dominated case, most of the atmospheric radiative warming is caused by reduction in the outgoing LW flux, while the surface and TOA SW flux changes are non-negligible but cancel each other out (in terms of the atmospheric energy budget – reflecting small SW atmospheric absorption changes). However, a significant TOA net (SW + LW) radiative flux change of W m−2 remains. In this case, the cloud-mean effect on radiation is more complicated. While CF decreases with increasing CDNC, the mean water path (both LWP and IWP) increases (Fig. 8). As in the deep-cloud-dominated case, the increase in the water content occurs mostly at the middle and upper troposphere, while the decrease in CF occurs mostly in the lower troposphere (Fig. 9). In terms of the SW fluxes, the effect of the decrease in low CF (decrease SW reflections) and the increase in water mass (increase SW reflections) would partially compensate, while the Twomey effect (Twomey, 1977) adds to the increased SW reflections. In this case, the net effect is more SW reflected back into space at TOA and a net negative flux change (including also the LW).
There exists a large spread in estimates of aerosol effects on clouds for different cloud types and different environmental conditions. In this study, as we use a relatively large domain () and two different dates (each for 2 d), we sample many different local environmental conditions and cloud types. Such more realistic set-ups (although with lower spatial resolution) could provide more reliable estimates of aerosol effects on heterogeneous cloud systems than just one-cloud-type, small-domain simulations (as was done in many previous studies; e.g. Dagan et al., 2017; Seifert et al., 2015; Ovchinnikov et al., 2014). However, the conclusions demonstrated here are based on two specific cases. In order to examine the validity of our main conclusions over a wider range of initial conditions, we conducted a large ensemble of simulations starting from realistic initial conditions (although with a smaller domain) in a companion paper (Dagan and Stier, 2019). These simulations demonstrate that the main conclusions presented in this paper are robust and hold also for a wide range of initial conditions representative of this area. In addition, the realistic set-up with the continuously changing boundary conditions and systems that pass through the domain, which are used here, prevent conclusions that might be valid only in cyclic double-periodic large-eddy simulations, as the background meteorological conditions change more realistically (Dagan et al., 2018b). Another uncertainty in the assessment of the aerosol response is the large differences between different models and microphysical schemes (White et al., 2017; Fan et al., 2016; Khain et al., 2015; Heikenfeld et al., 2019). In this study, as we use only one model, we do not address this uncertainty. In future work we intend to examine the response in multiple models. In addition, more detailed observational constraints on the models are needed. Furthermore, we do not include the temporal evolution of the aerosol concentration. Feedbacks between the aerosol concentration and clouds processes (such as wet scavenging) as well as the direct effects of aerosol on radiation would add another layer of complexity that should be accounted for in future work.
Generally, the global mean aerosol radiative forcing is estimated to be negative (Boucher et al., 2013; Bellouin et al., 2019). However, these global aerosol forcing estimates have so far not included the radiative forcing associated with potential effects of aerosols on deep convection – and these effects are not represented in most current climate models due to limitations in convection parameterizations, with only a few exceptions (Kipling et al., 2017; Labbouz et al., 2018). Here we demonstrate the existence of non-negligible aerosol radiative effects (of −5.2 and −1.9 W m−2 for the shallow- and deep-cloud-dominated cases, respectively) in tropical cloud systems that contained both deep and shallow convective clouds, with significant SW and LW contributions. From the (limited) two cases simulated here, it appears that (in agreement with previous studies) the aerosol effect may be regime-dependent and that even within a given cloud regime, the effect may vary with the meteorological conditions.
Finally, we hypothesize that the aerosol impact shown on the atmospheric energy balance, with increasing divergence of dry static energy from deep convective regions concomitant with increased convergence in shallow-clouds regions, can have effects on the large-scale circulation. This should be investigated in future work.
The data presented in the paper can be found at: https://doi.org/10.5281/zenodo.3611366 (Dagan, 2020).
The supplement related to this article is available online at: https://doi.org/10.5194/acp-20-4523-2020-supplement.
GD carried out the simulations and analyses presented. GC, DK and AS assisted with the simulations. MC assisted with the radiative transfer calculations and comparison with observations. PS and AS assisted with the design and interpretation of the analyses. GD prepared the paper, with contributions from all co-authors.
The authors declare that they have no conflict of interest.
The simulations were performed using the ARCHER UK National Supercomputing Service. ECMWF is acknowledged for providing the ERA-Interim data set (https://apps.ecmwf.int/datasets/, last access: 8 April 2020). We acknowledge MPI, DWD and DKRZ for the NARVAL simulations.
This research was supported by the European Research Council (ERC) project constRaining the EffeCts of Aerosols on Precipitation (RECAP) under the European Union’s Horizon 2020 research and innovation programme with grant agreement no. 724602.
This paper was edited by Timothy Garrett and reviewed by two anonymous referees.
Albrecht, B. A.: Aerosols, cloud microphysics, and fractional cloudiness, Science, 245, 1227, https://doi.org/10.1126/science.245.4923.1227, 1989.
Albrecht, B. A.: Effects of precipitation on the thermodynamic structure of the trade wind boundary layer, J. Geophys. Res.-Atmos., 98, 7327–7337, https://doi.org/10.1029/93JD00027, 1993.
Altaratz, O., Koren, I., Remer, L., and Hirsch, E.: Review: Cloud invigoration by aerosols–Coupling between microphysics and dynamics, Atmos. Res., 140, 38–60, https://doi.org/10.1016/j.atmosres.2014.01.009, 2014.
Aminou, D.: MSG's SEVIRI instrument, ESA Bulletin, 15–17, 2002.
Andreae, M. O.: Correlation between cloud condensation nuclei concentration and aerosol optical thickness in remote and polluted regions, Atmos. Chem. Phys., 9, 543–556, https://doi.org/10.5194/acp-9-543-2009, 2009.
Andreae, M. O., Rosenfeld, D., Artaxo, P., Costa, A. A., Frank, G. P., Longo, K. M., and Silva-Dias, M. A. F.: Smoking rain clouds over the Amazon, Science, 303, 1337–1342, https://doi.org/10.1126/science.1092779, 2004.
Arakawa, A. and Schubert, W. H.: Interaction of a cumulus cloud ensemble with the large-scale environment, Part I, J. Atmos. Sci., 31, 674–701, 1974.
Bellouin, N., Quaas, J., Gryspeerdt, E., Kinne, S., Stier, P., Watson-Parris, D., Boucher, O., Carslaw, K., Christensen, M., and Daniau, A.-L.: Bounding aerosol radiative forcing of climate change, Rev. Geophys., 58, https://doi.org/10.1029/2019RG000660, 2019.
Boucher, O., Randall, D., Artaxo, P., Bretherton, C., Feingold, G., Forster, P., Kerminen, V., Kondo, Y., Liao, H., and Lohmann, U.: Clouds and aerosols, Climate Change, in: Climate change 2013: the physical science basis. Contribution of Working Group I to the Fifth Assessment Report of the Intergovernmental Panel on Climate Change 2013, Cambridge University Press, 571–657, 2013.
Chen, Q., Koren, I., Altaratz, O., Heiblum, R. H., Dagan, G., and Pinto, L.: How do changes in warm-phase microphysics affect deep convective clouds?, Atmos. Chem. Phys., 17, 9585–9598, https://doi.org/10.5194/acp-17-9585-2017, 2017.
Christensen, M. W., Chen, Y. C., and Stephens, G. L.: Aerosol indirect effect dictated by liquid clouds, J. Geophys. Res.-Atmos., 121, 14–636, https://doi.org/10.1002/2016JD025245, 2016.
Clough, S., Shephard, M., Mlawer, E., Delamere, J., Iacono, M., Cady-Pereira, K., Boukabara, S., and Brown, P.: Atmospheric radiative transfer modeling: a summary of the AER codes, J. Quant. Spectrosc. Ra., 91, 233–244, https://doi.org/10.1016/j.jqsrt.2004.05.058, 2005.
Costantino, L. and Bréon, F.-M.: Aerosol indirect effect on warm clouds over South-East Atlantic, from co-located MODIS and CALIPSO observations, Atmos. Chem. Phys., 13, 69–88, https://doi.org/10.5194/acp-13-69-2013, 2013.
Dagan, G.: Data of the paper: Atmospheric energy budget response to idealized aerosol perturbation in tropical cloud systems [Data set], Zenodo, https://doi.org/10.5281/zenodo.3611366, 2020.
Dagan, G. and Chemke, R.: The effect of subtropical aerosol loading on equatorial precipitation, Geophys. Res. Lett., 43, 11–048, https://doi.org/10.1002/2016GL071206, 2016.
Dagan, G. and Stier, P.: Ensemble daily simulations for elucidating cloud–aerosol interactions under a large spread of realistic environmental conditions, Atmos. Chem. Phys. Discuss., https://doi.org/10.5194/acp-2019-949, in review, 2019.
Dagan, G., Koren, I., and Altaratz, O.: Aerosol effects on the timing of warm rain processes, Geophys. Res. Lett., 42, 4590–4598, https://doi.org/10.1002/2015GL063839, 2015a.
Dagan, G., Koren, I., and Altaratz, O.: Competition between core and periphery-based processes in warm convective clouds – from invigoration to suppression, Atmos. Chem. Phys., 15, 2749–2760, https://doi.org/10.5194/acp-15-2749-2015, 2015b.
Dagan, G., Koren, I., Altaratz, O., and Heiblum, R. H.: Aerosol effect on the evolution of the thermodynamic properties of warm convective cloud fields, Sci. Rep.-UK, 6, 38769, https://doi.org/10.1038/srep38769, 2016.
Dagan, G., Koren, I., Altaratz, O., and Heiblum, R. H.: Time-dependent, non-monotonic response of warm convective cloud fields to changes in aerosol loading, Atmos. Chem. Phys., 17, 7435–7444, https://doi.org/10.5194/acp-17-7435-2017, 2017.
Dagan, G., Koren, I., and Altaratz, O.: Quantifying the effect of aerosol on vertical velocity and effective terminal velocity in warm convective clouds, Atmos. Chem. Phys., 18, 6761–6769, https://doi.org/10.5194/acp-18-6761-2018, 2018a.
Dagan, G., Koren, I., Altaratz, O., and Lehahn, Y.: Shallow convective cloud field lifetime as a key factor for evaluating aerosol effects, iScience, 10, 192–202, https://doi.org/10.1016/j.isci.2018.11.032, 2018b.
Dagan, G., Koren, I., Kostinski, A., and Altaratz, O.: Organization and oscillations in simulated shallow convective clouds, J. Adv. Model. Earth Sy., 10,2287–2299, https://doi.org/10.1029/2018MS001416, 2018c.
Dagan, G., Stier, P., and Watson-Parris, D.: Contrasting response of precipitation to aerosol perturbation in the tropics and extra-tropics explained by energy budget considerations, Geophys. Res. Lett., 46, 7828–7837, https://doi.org/10.1029/2019GL083479, 2019a.
Dagan, G., Stier, P., and Watson-Parris, D.: Analysis of the atmospheric water budget for elucidating the spatial scale of precipitation changes under climate change, Geophys. Res. Lett., 46, 10504–10511, https://doi.org/10.1029/2019GL084173, 2019b
Dee, D., Uppala, S., Simmons, A., Berrisford, P., Poli, P., Kobayashi, S., Andrae, U., Balmaseda, M., Balsamo, G., and Bauer, P.: The ERA-Interim reanalysis: Configuration and performance of the data assimilation system, Q. J. Roy. Meteor. Soc., 137, 553–597, https://doi.org/10.1002/qj.828, 2011.
Dey, S., Di Girolamo, L., Zhao, G., Jones, A. L., and McFarquhar, G. M.: Satellite-observed relationships between aerosol and trade-wind cumulus cloud properties over the Indian Ocean, Geophys. Res. Lett., 38, https://doi.org/10.1029/2010GL045588, 2011.
Emanuel, K. A., Neelin, J. D., and Bretherton, C. S.: On large-scale circulations in convecting atmospheres, Q. J. Roy. Meteor. Soc., 120, 1111–1143, 1994.
Fan, J., Zhang, R., Li, G., and Tao, W.-K.: Effects of aerosols and relative humidity on cumulus clouds, J. Geophys. Res.-Atmos., 112, https://doi.org/10.1029/2006jd008136, 2007.
Fan, J., Yuan, T., Comstock, J. M., Ghan, S., Khain, A., Leung, L. R., Li, Z., Martins, V. J., and Ovchinnikov, M.: Dominant role by vertical wind shear in regulating aerosol effects on deep convective clouds, J. Geophys. Res.-Atmos., 114, https://doi.org/10.1029/2009jd012352, 2009.
Fan, J., Comstock, J. M., and Ovchinnikov, M.: The cloud condensation nuclei and ice nuclei effects on tropical anvil characteristics and water vapor of the tropical tropopause layer, Environ. Res. Lett., 5, 044005, https://doi.org/10.1088/1748-9326/5/4/044005, 2010.
Fan, J., Leung, L. R., Rosenfeld, D., Chen, Q., Li, Z., Zhang, J., and Yan, H.: Microphysical effects determine macrophysical response for aerosol impacts on deep convective clouds, P. Natl. Acad. Sci. USA, 110, E4581–E4590, https://doi.org/10.1073/pnas.1316830110, 2013.
Fan, J., Wang, Y., Rosenfeld, D., and Liu, X.: Review of aerosol–cloud interactions: Mechanisms, significance, and challenges, J. Atmos. Sci., 73, 4221–4252, https://doi.org/10.1175/JAS-D-16-0037.1, 2016.
Ghan, S. J., Abdul-Razzak, H., Nenes, A., Ming, Y., Liu, X., Ovchinnikov, M., Shipway, B., Meskhidze, N., Xu, J., and Shi, X.: Droplet nucleation: Physically-based parameterizations and comparative evaluation, J. Adv. Model. Earth Sy., 3, https://doi.org/10.1029/2011MS000074, 2011.
Glassmeier, F. and Lohmann, U.: Constraining precipitation susceptibility of warm-, ice-, and mixed-phase clouds with microphysical equations, J. Atmos. Sci., 73, 5003–5023, https://doi.org/10.1175/JAS-D-16-0008.1, 2016.
Goren, T. and Rosenfeld, D.: Decomposing aerosol cloud radiative effects into cloud cover, liquid water path and Twomey components in marine stratocumulus, Atmos. Res., 138, 378–393, https://doi.org/10.1016/j.atmosres.2013.12.008, 2014.
Grabowski, W. W. and Morrison, H.: Untangling microphysical impacts on deep convection applying a novel modeling methodology. Part II: Double-moment microphysics, J. Atmos. Sci., 73, 3749–3770, https://doi.org/10.1175/JAS-D-15-0367.1, 2016.
Gryspeerdt, E. and Stier, P.: Regime-based analysis of aerosol-cloud interactions, Geophys. Res. Lett., 39, https://doi.org/10.1029/2012GL053221, 2012.
Gryspeerdt, E., Stier, P., White, B. A., and Kipling, Z.: Wet scavenging limits the detection of aerosol effects on precipitation, Atmos. Chem. Phys., 15, 7557–7570, https://doi.org/10.5194/acp-15-7557-2015, 2015.
Gryspeerdt, E., Sourdeval, O., Quaas, J., Delanoë, J., Krämer, M., and Kühne, P.: Ice crystal number concentration estimates from lidar–radar satellite remote sensing – Part 2: Controls on the ice crystal number concentration, Atmos. Chem. Phys., 18, 14351–14370, https://doi.org/10.5194/acp-18-14351-2018, 2018.
Gryspeerdt, E., Goren, T., Sourdeval, O., Quaas, J., Mülmenstädt, J., Dipu, S., Unglaub, C., Gettelman, A., and Christensen, M.: Constraining the aerosol influence on cloud liquid water path, Atmos. Chem. Phys., 19, 5331–5347, https://doi.org/10.5194/acp-19-5331-2019, 2019.
Heikenfeld, M., White, B., Labbouz, L., and Stier, P.: Aerosol effects on deep convection: the propagation of aerosol perturbations through convective cloud microphysics, Atmos. Chem. Phys., 19, 2601–2627, https://doi.org/10.5194/acp-19-2601-2019, 2019.
Henderson, D. S., L'Ecuyer, T., Stephens, G., Partain, P., and Sekiguchi, M.: A Multisensor Perspective on the Radiative Im- pacts of Clouds and Aerosols, J. Appl. Meteorol. Clim., 52, 853–871, https://doi.org/10.1175/JAMC-D-12-025.1, 2013.
Hodnebrog, O., Myhre, G., Forster, P. M., Sillmann, J., and Samset, B. H.: Local biomass burning is a dominant cause of the observed precipitation reduction in southern Africa, Nat. Commun., 7, 1–8, https://doi.org/10.1038/ncomms11236, 2016.
Hoose, C. and Möhler, O.: Heterogeneous ice nucleation on atmospheric aerosols: a review of results from laboratory experiments, Atmos. Chem. Phys., 12, 9817–9854, https://doi.org/10.5194/acp-12-9817-2012, 2012.
Iacono, M. J., Delamere, J. S., Mlawer, E. J., Shephard, M. W., Clough, S. A., and Collins, W. D.: Radiative forcing by long-lived greenhouse gases: Calculations with the AER radiative transfer models, J. Geophys. Res.-Atmos., 113, https://doi.org/10.1029/2008JD009944, 2008.
Jakob, C., Singh, M., and Jungandreas, L.: Radiative Convective Equilibrium and Organized Convection: An Observational Perspective, J. Geophys. Res.-Atmos., 124, 5418–5430, 2019.
Jeon, Y.-L., Moon, S., Lee, H., Baik, J.-J., and Lkhamjav, J.: Non-Monotonic Dependencies of Cloud Microphysics and Precipitation on Aerosol Loading in Deep Convective Clouds: A Case Study Using the WRF Model with Bin Microphysics, Atmosphere, 9, 434, https://doi.org/10.3390/atmos9110434, 2018.
Jiang, H., Xue, H., Teller, A., Feingold, G., and Levin, Z.: Aerosol effects on the lifetime of shallow cumulus, Geophys. Res. Lett., 33, https://doi.org/10.1029/2006gl026024, 2006.
Jiang, J. H., Su, H., Huang, L., Wang, Y., Massie, S., Zhao, B., Omar, A., and Wang, Z.: Contrasting effects on deep convective clouds by different types of aerosols, Nat. Commun., 9, 3874, https://doi.org/10.1038/s41467-018-06280-4, 2018.
Kalina, E. A., Friedrich, K., Morrison, H., and Bryan, G. H.: Aerosol effects on idealized supercell thunderstorms in different environments, J. Atmos. Sci., 71, 4558–4580, https://doi.org/10.1175/JAS-D-14-0037.1, 2014.
Kaufman, Y. J., Koren, I., Remer, L. A., Rosenfeld, D., and Rudich, Y.: The effect of smoke, dust, and pollution aerosol on shallow cloud development over the Atlantic Ocean, P. Natl. Acad. Sci. USA, 102, 11207–11212, https://doi.org/10.1073/pnas.0505191102, 2005.
Khain, A., Rosenfeld, D., and Pokrovsky, A.: Aerosol impact on the dynamics and microphysics of deep convective clouds, Q. J. Roy. Meteor. Soc., 131, 2639–2663, https://doi.org/10.1256/qj.04.62, 2005.
Khain, A., Beheng, K., Heymsfield, A., Korolev, A., Krichak, S., Levin, Z., Pinsky, M., Phillips, V., Prabhakaran, T., and Teller, A.: Representation of microphysical processes in cloud-resolving models: spectral (bin) microphysics vs. bulk parameterization, Rev. Geophys., 53, 247–322, https://doi.org/10.1002/2014RG000468, 2015.
Khain, A. P.: Notes on state-of-the-art investigations of aerosol effects on precipitation: a critical review, Environ. Res. Lett., 4, 015004, https://doi.org/10.1088/1748-9326/4/1/015004, 2009.
Khain, A. P., BenMoshe, N., and Pokrovsky, A.: Factors determining the impact of aerosols on surface precipitation from clouds: An attempt at classification, J. Atmos. Sci., 65, 1721–1748, https://doi.org/10.1175/2007jas2515.1, 2008.
Kipling, Z., Stier, P., Labbouz, L., and Wagner, T.: Dynamic subgrid heterogeneity of convective cloud in a global model: description and evaluation of the Convective Cloud Field Model (CCFM) in ECHAM6–HAM2, Atmos. Chem. Phys., 17, 327–342, https://doi.org/10.5194/acp-17-327-2017, 2017.
Klepp, C., Ament, F., Bakan, S., Hirsch, L., and Stevens, B.: The NARVAL Campaign Report, 2014.
Klocke, D., Brueck, M., Hohenegger, C., and Stevens, B.: Rediscovery of the doldrums in storm-resolving simulations over the tropical Atlantic, Nat. Geosci., 10, 891–896, https://doi.org/10.1038/s41561-017-0005-4, 2017.
Koren, I., Kaufman, Y. J., Rosenfeld, D., Remer, L. A., and Rudich, Y.: Aerosol invigoration and restructuring of Atlantic convective clouds, Geophys. Res. Lett., 32, https://doi.org/10.1029/2005gl023187, 2005.
Koren, I., Remer, L. A., Altaratz, O., Martins, J. V., and Davidi, A.: Aerosol-induced changes of convective cloud anvils produce strong climate warming, Atmos. Chem. Phys., 10, 5001–5010, https://doi.org/10.5194/acp-10-5001-2010, 2010.
Koren, I., Dagan, G., and Altaratz, O.: From aerosol-limited to invigoration of warm convective clouds, Science, 344, 1143–1146, https://doi.org/10.1126/science.1252595, 2014.
Koren, I., Altaratz, O., and Dagan, G.: Aerosol effect on the mobility of cloud droplets, Environ. Res. Lett., 10, 104011, https://doi.org/10.1088/1748-9326/10/10/104011, 2015.
Labbouz, L., Kipling, Z., Stier, P., and Protat, A.: How Well Can We Represent the Spectrum of Convective Clouds in a Climate Model? Comparisons between Internal Parameterization Variables and Radar Observations, J. Atmos. Sci., 75, 1509–1524, https://doi.org/10.1175/JAS-D-17-0191.1, 2018.
Lebo, Z. J. and Morrison, H.: Dynamical effects of aerosol perturbations on simulated idealized squall lines, Mon. Weather Rev., 142, 991–1009, 2014.
Lee, S.-S., Feingold, G., and Chuang, P. Y.: Effect of aerosol on cloud–environment interactions in trade cumulus, J. Atmos. Sci., 69, 3607–3632, 2012.
Lee, S. S., Donner, L. J., and Phillips, V. T. J.: Sensitivity of aerosol and cloud effects on radiation to cloud types: comparison between deep convective clouds and warm stratiform clouds over one-day period, Atmos. Chem. Phys., 9, 2555–2575, https://doi.org/10.5194/acp-9-2555-2009, 2009.
Levin, Z. and Cotton, W. R.: Aerosol pollution impact on precipitation: A scientific review, Springer, 2009.
Liu, H., Guo, J., Koren, I., Altaratz, O., Dagan, G., Wang, Y., Jiang, J. H., Zhai, P., and Yung, Y. L.: Non-Monotonic Aerosol Effect on Precipitation in Convective Clouds over Tropical Oceans, Sci. Rep.-UK, 9, 7809, https://doi.org/10.1038/s41598-019-44284-2, 2019.
Liu, L., Shawki, D., Voulgarakis, A., Kasoar, M., Samset, B., Myhre, G., Forster, P., Hodnebrog, Ø., Sillmann, J., and Aalbergsjø, S.: A PDRMIP Multimodel Study on the impacts of regional aerosol forcings on global and regional precipitation, J. Climate, 31, 4429–4447, 2018.
Lohmann, U. and Hoose, C.: Sensitivity studies of different aerosol indirect effects in mixed-phase clouds, Atmos. Chem. Phys., 9, 8917–8934, https://doi.org/10.5194/acp-9-8917-2009, 2009.
Manabe, S. and Strickler, R. F.: Thermal equilibrium of the atmosphere with a convective adjustment, J. Atmos. Sci., 21, 361–385, 1964.
McGarragh, G. R., Poulsen, C. A., Thomas, G. E., Povey, A. C., Sus, O., Stapelberg, S., Schlundt, C., Proud, S., Christensen, M. W., Stengel, M., Hollmann, R., and Grainger, R. G.: The Community Cloud retrieval for CLimate (CC4CL) – Part 2: The optimal estimation approach, Atmos. Meas. Tech., 11, 3397–3431, https://doi.org/10.5194/amt-11-3397-2018, 2018.
Mlawer, E. J., Taubman, S. J., Brown, P. D., Iacono, M. J., and Clough, S. A.: Radiative transfer for inhomogeneous atmospheres: RRTM, a validated correlated-k model for the longwave, J. Geophys. Res.-Atmos., 102, 16663–16682, 1997.
Muller, C. and O'Gorman, P.: An energetic perspective on the regional response of precipitation to climate change, Nat. Clim. Change, 1, 266–271, https://doi.org/10.1038/nclimate1169, 2011.
Mülmenstädt, J. and Feingold, G.: The Radiative Forcing of Aerosol–Cloud Interactions in Liquid Clouds: Wrestling and Embracing Uncertainty, Current Climate Change Reports, 4, 23–40, https://doi.org/10.1007/s40641-018-0089-y, 2018.
Myhre, G., Forster, P., Samset, B., Hodnebrog, Ø., Sillmann, J., Aalbergsjø, S., Andrews, T., Boucher, O., Faluvegi, G., and Fläschner, D.: PDRMIP: a precipitation driver and response model intercomparison project–protocol and preliminary results, B. Am. Meteorol. Soc., 98, 1185–1198, 2017.
O'Gorman, P. A., Allan, R. P., Byrne, M. P., and Previdi, M.: Energetic Constraints on Precipitation Under Climate Change, Surv. Geophys., 33, 585–608, https://doi.org/10.1007/s10712-011-9159-6, 2012.
Ovchinnikov, M., Ackerman, A. S., Avramov, A., Cheng, A., Fan, J., Fridlind, A. M., Ghan, S., Harrington, J., Hoose, C., and Korolev, A.: Intercomparison of large-eddy simulations of Arctic mixed-phase clouds: Importance of ice size distribution assumptions, J. Adv. Model. Earth Sy., 6, 223–248, https://doi.org/10.1002/2013MS000282, 2014.
Richardson, T., Forster, P., Andrews, T., Boucher, O., Faluvegi, G., Fläschner, D., Hodnebrog, Ø., Kasoar, M., Kirkevåg, A., and Lamarque, J.-F.: Drivers of precipitation change: An energetic understanding, J. Climate, 31, 9641–9657, https://doi.org/10.1175/JCLI-D-17-0240.1, 2018.
Rosenfeld, D.: Suppression of rain and snow by urban and industrial air pollution, Science, 287, 1793–1796, https://doi.org/10.1126/science.287.5459.1793, 2000.
Rosenfeld, D., Lohmann, U., Raga, G. B., O'Dowd, C. D., Kulmala, M., Fuzzi, S., Reissell, A., and Andreae, M. O.: Flood or drought: How do aerosols affect precipitation?, Science, 321, 1309–1313, https://doi.org/10.1126/science.1160606, 2008.
Rosenfeld, D., Wood, R., Donner, L. J., and Sherwood, S. C.: Aerosol cloud-mediated radiative forcing: highly uncertain and opposite effects from shallow and deep clouds, in: Climate Science for Serving Society, Springer, 105–149, https://doi.org/10.1007/978-94-007-6692-1_5, 2013.
Rosenfeld, D., Zhu, Y., Wang, M., Zheng, Y., Goren, T., and Yu, S.: Aerosol-driven droplet concentrations dominate coverage and water of oceanic low-level clouds, Science, 363, eaav0566, https://doi.org/10.1126/science.aav0566, 2019.
Rothenberg, D., Avramov, A., and Wang, C.: On the representation of aerosol activation and its influence on model-derived estimates of the aerosol indirect effect, Atmos. Chem. Phys., 18, 7961–7983, https://doi.org/10.5194/acp-18-7961-2018, 2018.
Samset, B., Myhre, G., Forster, P., Hodnebrog, Ø., Andrews, T., Faluvegi, G., Flaeschner, D., Kasoar, M., Kharin, V., and Kirkevåg, A.: Fast and slow precipitation responses to individual climate forcers: A PDRMIP multimodel study, Geophys. Res. Lett., 43, 2782–2791, https://doi.org/10.1002/2016GL068064, 2016.
Savane, O. S., Vant-Hull, B., Mahani, S., and Khanbilvardi, R.: Effects of Aerosol on Cloud Liquid Water Path: Statistical Method a Potential Source for Divergence in Past Observation Based Correlative Studies, Atmosphere, 6, 273–298, https://doi.org/10.3390/atmos6030273, 2015.
Seifert, A. and Beheng, K.: A two-moment cloud microphysics parameterization for mixed-phase clouds. Part 2: Maritime vs. continental deep convective storms, Meteorol. Atmos. Phys., 92, 67–82, https://doi.org/10.1007/s00703-005-0113-3, 2006a.
Seifert, A. and Beheng, K. D.: A two-moment cloud microphysics parameterization for mixed-phase clouds. Part 1: Model description, Meteorol. Atmos. Phys., 92, 45–66, https://doi.org/10.1007/s00703-005-0112-4, 2006b.
Seifert, A. and Heus, T.: Large-eddy simulation of organized precipitating trade wind cumulus clouds, Atmos. Chem. Phys., 13, 5631–5645, https://doi.org/10.5194/acp-13-5631-2013, 2013.
Seifert, A., Heus, T., Pincus, R., and Stevens, B.: Large-eddy simulation of the transient and near-equilibrium behavior of precipitating shallow convection, J. Adv. Model. Earth Sy., 7, 1918–1937, https://doi.org/10.1002/2015MS000489, 2015.
Seigel, R. B.: Shallow Cumulus Mixing and Subcloud Layer Responses to Variations in Aerosol Loading, J. Atmos. Sci., 71, 2581–2603, https://doi.org/10.1175/JAS-D-13-0352.1, 2014.
Simpson, E., Connolly, P., and McFiggans, G.: An investigation into the performance of four cloud droplet activation parameterisations, Geosci. Model Dev., 7, 1535–1542, https://doi.org/10.5194/gmd-7-1535-2014, 2014.
Small, J. D., Chuang, P. Y., Feingold, G., and Jiang, H.: Can aerosol decrease cloud lifetime?, Geophys. Res. Lett., 36, https://doi.org/10.1029/2009GL038888, 2009.
Sourdeval, O., Gryspeerdt, E., Krämer, M., Goren, T., Delanoë, J., Afchine, A., Hemmer, F., and Quaas, J.: Ice crystal number concentration estimates from lidar–radar satellite remote sensing – Part 1: Method and evaluation, Atmos. Chem. Phys., 18, 14327–14350, https://doi.org/10.5194/acp-18-14327-2018, 2018.
Spill, G., Stier, P., Field, P. R., and Dagan, G.: Effects of aerosol in simulations of realistic shallow cumulus cloud fields in a large domain, Atmos. Chem. Phys., 19, 13507–13517, https://doi.org/10.5194/acp-19-13507-2019, 2019.
Stephens, G. L., Gabriel, P. M., and Partain, P. T.: Parameterization of atmospheric radiative transfer. Part I: Validity of simple models, J. Atmos. Sci., 58, 3391–3409, 2001.
Stengel, M., Stapelberg, S., Sus, O., Finkensieper, S., Würzler, B., Philipp, D., Hollmann, R., Poulsen, C., Christensen, M., and McGarragh, G.: Cloud_cci Advanced Very High Resolution Radiometer post meridiem (AVHRR-PM) dataset version 3: 35-year climatology of global cloud and radiation properties, Earth Syst. Sci. Data, 12, 41–60, https://doi.org/10.5194/essd-12-41-2020, 2020.
Stevens, B. and Feingold, G.: Untangling aerosol effects on clouds and precipitation in a buffered system, Nature, 461, 607–613, https://doi.org/10.1038/nature08281, 2009.
Stevens, B., Farrell, D., Hirsch, L., Jansen, F., Nuijens, L., Serikov, I., Brügmann, B., Forde, M., Linne, H., and Lonitz, K.: The Barbados Cloud Observatory: Anchoring investigations of clouds and circulation on the edge of the ITCZ, B. Am. Meteorol. Soc., 97, 787–801, 2016.
Stevens, B., Ament, F., Bony, S., Crewell, S., Ewald, F., Gross, S., Hansen, A., Hirsch, L., Jacob, M., and Kölling, T.: A high-altitude long-range aircraft configured as a cloud observatory–the NARVAL expeditions, B. Am. Meteorol. Soc., 100, 1061–1077, https://doi.org/10.1175/BAMS-D-18-0198.1, 2019.
Storelvmo, T., Hoose, C., and Eriksson, P.: Global modeling of mixed-phase clouds: The albedo and lifetime effects of aerosols, J. Geophys. Res.-Atmos., 116, https://doi.org/10.1029/2010JD014724, 2011.
Tao, W.-K., Chen, J.-P., Li, Z., Wang, C., and Zhang, C.: Impact of aerosols on convective clouds and precipitation, Rev. Geophys., 50, RG2001, https://doi.org/10.1029/2011RG000369, 2012.
Twomey, S.: The influence of pollution on the shortwave albedo of clouds, J. Atmos. Sci., 34, 1149–1152, 1977.
van den Heever, S. C., Stephens, G. L., and Wood, N. B.: Aerosol Indirect Effects on Tropical Convection Characteristics under Conditions of Radiative-Convective Equilibrium, J. Atmos. Sci., 68, 699–718, https://doi.org/10.1175/2010jas3603.1, 2011.
Varble, A.: Erroneous attribution of deep convective invigoration to aerosol concentration, J. Atmos. Sci., 75, 1351–1368, https://doi.org/10.1175/JAS-D-17-0217.1, 2018.
White, B., Gryspeerdt, E., Stier, P., Morrison, H., Thompson, G., and Kipling, Z.: Uncertainty from the choice of microphysics scheme in convection-permitting models significantly exceeds aerosol effects, Atmos. Chem. Phys., 17, 12145–12175, https://doi.org/10.5194/acp-17-12145-2017, 2017.
Williams, E., Rosenfeld, D., Madden, N., Gerlach, J., Gears, N., Atkinson, L., Dunnemann, N., Frostrom, G., Antonio, M., and Biazon, B.: Contrasting convective regimes over the Amazon: Implications for cloud electrification, J. Geophys. Res, 107, LBA-50, https://doi.org/10.1029/2001JD000380, 2002.
Xue, H. and Feingold, G.: Large-eddy simulations of trade wind cumuli: Investigation of aerosol indirect effects, J. Atmos. Sci., 63, 1605–1622, https://doi.org/10.1175/JAS3706.1, 2006.
Yuan, T., Remer, L. A., Pickering, K. E., and Yu, H.: Observational evidence of aerosol enhancement of lightning activity and convective invigoration, Geophys. Res. Lett., 38, https://doi.org/10.1029/2010gl046052, 2011a.
Yuan, T., Remer, L. A., and Yu, H.: Microphysical, macrophysical and radiative signatures of volcanic aerosols in trade wind cumulus observed by the A-Train, Atmos. Chem. Phys., 11, 7119–7132, https://doi.org/10.5194/acp-11-7119-2011, 2011b.
Zängl, G., Reinert, D., Rípodas, P., and Baldauf, M.: The ICON (ICOsahedral Non-hydrostatic) modelling framework of DWD and MPI-M: Description of the non-hydrostatic dynamical core, Q. J. Roy. Meteor. Soc., 141, 563–579, https://doi.org/10.1002/qj.2378, 2015.