the Creative Commons Attribution 4.0 License.
the Creative Commons Attribution 4.0 License.
 | 03 Jan 2020
Rapid formation of intense haze episodes via aerosol–boundary layer feedback in Beijing
Yonghong Wang
Miao Yu
Yuesi Wang
Guiqian Tang
Tao Song
Putian Zhou
Zirui Liu
Dongsheng Ji
Lili Wang
Xiaowan Zhu
Mikael Ehn
Wenkang Gao
Yuepeng Pan
Jinyuan Xin
Yang Sun
Veli-Matti Kerminen
Markku Kulmala
Tuukka Petäjä
Although much effort has been put into studying air pollution, our knowledge of the mechanisms of frequently occurring intense haze episodes in China is still limited. In this study, using 3 years of measurements of air pollutants at three different height levels on a 325 m Beijing meteorology tower, we found that a positive aerosol–boundary layer feedback mechanism existed at three vertical observation heights during intense haze polluted periods within the mixing layer. This feedback was characterized by a higher loading of PM2.5 with a shallower mixing layer. Modelling results indicated that the presence of PM2.5 within the boundary layer led to reduced surface temperature, relative humidity and mixing layer height during an intensive haze episode. Measurements showed that the aerosol–boundary layer feedback was related to the decrease in solar radiation, turbulent kinetic energy and thereby suppression of the mixing layer. The feedback mechanism can explain the rapid formation of intense haze episodes to some extent, and we suggest that the detailed feedback mechanism warrants further investigation from both model simulations and field observations.
- Article
(4537 KB) - Full-text XML
-
Supplement
(1508 KB) - BibTeX
- EndNote


With the rapid economic growth and urbanization, an increasing frequency of haze episodes along with the air pollution has become of great concern in China during the last decade (Cao et al., 2016; Huang et al., 2014; Kulmala, 2015; Y. H. Wang et al., 2014, 2015). For example, during December 2016 a series of intense haze episodes took place in eastern China, characterized by surface PM2.5 concentrations exceeding 500 µg m−3 in several measurement sites in Beijing and its surrounding sites (http://www.mep.gov.cn/gkml/hbb/qt/201701/t20170102_393745.htm, last access: 11 December 2019). Severe air pollution has serious effects on human health. A recent study reported that the particulate matter has significantly decreased the life span of residents by as many as 5.5 years in northern China (Chen et al., 2013). On a global scale, the air pollution was estimated to cause over 3 million premature deaths every year (Lelieveld et al., 2015).
Increased emissions from fossil fuel combustion due to vehicle traffic, industrial activities and power generation, along with exceptionally strong secondary aerosol formation, were thought to be responsible for these haze episodes (Cheng et al., 2016; Huang et al., 2014; Pan et al., 2016; Petäjä et al., 2016; Zhang et al., 2015; Zhao et al., 2013). Meanwhile, the formation of intense haze episodes was considered to be affected by meteorological conditions (J. Wang et al., 2014; Quan et al., 2013; Zheng et al., 2016). For example, the mixing layer height is a key parameter that constrains the dilution of surface air pollution, and the development of the mixing layer is highly related to the amount of solar radiation absorbed by the air and reaching the surface (Ding et al., 2016; Stull, 1988; Sun et al., 2013; Tang et al., 2016). By using field measurements combined with model simulation, a positive feedback between aerosol pollution, relative humidity and boundary layer was found to be important in aerosol production, accumulation and severe haze formation in Beijing (Liu et al., 2018). Wang et al. (2018) found that PBL schemes in their atmospheric chemistry models are not sufficient to describe the explosive growth of PM2.5 concentrations in the Beijing–Tianjin–Hebei region due to the absence of an online calculation of aerosol–radiation feedback and/or a deficient description of extremely weak turbulent diffusion.
In this study, using unique measurements on the Beijing 325 m high meteorology tower, we show a clear relationship between mixing layer height and turbulent kinetic energy at the 140 m observation platform. We also present direct evidence of the feedback that relates the decreasing mixed layer height to increasing particulate matter concentrations, and this feedback is critical to the formation of intense haze episodes in Beijing.
2.1 Calculation of mixing layer height with ceilometer
The ceilometer was deployed in the yard of the IAP (Institute of Atmospheric Physics, Chinese Academy of Science), with a horizontal distance of around tens of metres from the 325 m meteorology tower. The mixing layer height was measured with the enhanced single-lens ceilometers from July 2009 to August 2012 (CL 31, Vaisala, Finland), which utilized the strobe laser lidar technique (910 nm) to measure the attenuated backscattering coefficient profiles. The detection range of the CL31 is 7.6 km with the report period of 2–120 s. Detailed information can be found in previous studies (Tang et al., 2016). Since the distribution of particle concentrations is uniform in the mixing layer and has significant differences between the mixing layer and free atmosphere, the height at which a sudden change exists in the attenuated backscattering coefficient profile indicates the top of the mixing layer height. Vaisala software product BL-VIEW was used to determine the mixing layer height by finding the position with the maximum negative gradient () in the attenuated backscattering coefficient profiles as the top of the mixing layer (Münkel et al., 2007).
2.2 Measurements of energy flux at the 325 m Beijing meteorology tower
The turbulent fluxes of sensible heat (QH), latent heat (QE) and turbulence kinetic energy (TKE) were measured at the 140 m level using the eddy covariance technique from July 2009 to August 2012. The raw data (10 Hz) of wind components (u, v and w) and sonic temperature (Ts) was recorded with three-dimensional sonic anemometers (Model CSAT3, Campbell Scientific Inc., Logan, Utah, USA), and of water vapour concentrations (q) with open-path infrared gas analysers (Model LI-7500, LiCor Inc., Lincoln, Nebraska, USA). The fluxes of heat (Q) were calculated as the covariance between the instantaneous deviation or fluctuations of vertical velocity () and their respective scalar () averaged over a time interval of 30 min:
where the overbar denotes a time average, N is the number of samples during the averaging time and the fluctuations are the differences between the instantaneous readings and their respective means. The TKE was calculated as follows (Stull, 1988):
where m is the mass (kg) and e is the TKE per unit mass (m2 s−1). A more detailed description of the calculation and post-processing of flux is provided elsewhere (Song et al., 2013).
2.3 Measurements of PM2.5 concentration and gases at the 325 m Beijing meteorology tower
The mass concentrations of PM2.5 at the 8, 120 and 280 m observation platforms were measured with three TEOM RP1400s simultaneously from July 2009 to August 2012 (Thermo Scientific, https://www.thermoscientific.com, last access: 11 December 2019). The resolution and precision of the instrument for 1 h measurements were 0.1 and ±1.5 µg m−3, respectively. The filters were exchanged when the loading rates were approximately 40 %. The flow rate was monitored and calibrated monthly. The volume mixing ratios of ozone and NOx were measured with 49i and 42i (Thermal Environment Instruments (TEI) Inc.), respectively (Y. H. Wang et al., 2014).
2.4 Experiment design
The model used in this study is the Weather Research and Forecasting (WRF) model (ARW, version 3.8.1; Skamarock et al., 2008). The simulation domain was centered in Beijing (39.0∘ N, 116.0∘ E) and implemented with one-nested grids with a resolution of 1 km. The number of grid cells was 460×403 for the domain in the east–west and south–north directions. The model run was initialized at 00:00 UTC (or 08:00 LST) on 16 November 2010 and integrated for 131 h until 10:00 UTC on 21 November 2010, including 48 h for spin-up. The initial conditions of the model and its outermost lateral boundary conditions, as well as the soil moisture field, were taken from National Centers for Environmental Prediction/National Center for Atmospheric Research Reanalysis data (resolution: 1∘ × 1∘). The model physics schemes used include Thompson microphysical parameterization (Thompson et al., 2004); BouLac boundary-layer parameterization (Bougeault and Lacarrere, 1989); the RRTMG (Iacono et al., 2008) radiation scheme; and the Building Effect Parameterization (BEP) and Building Energy Model (BEM) schemes implemented in WRF that can more accurately describe three-dimensional urban land surface features and processes, including anthropogenic heat from buildings (Martilli et al., 2002; Salamanca and Martilli, 2010). The control and test experiments were performed separately to investigate impact of aerosol direct radiative forcing on surface temperature, relative humidity and development of boundary layer height. The control run (CTL) used the RRTMG radiation scheme which ignored the direct radiation effects of aerosol input. In the sensitivity test experiment, we add the aerosol input in the RRTMG scheme using Tegen climatology and urban-type aerosols during the sensitivity test.
2.5 Other supporting measurements
Total solar radiation was measured with a direct radiometer (TBQ-2, Junzhou, China). Direct radiation was measured with a direct radiometer (TBS-2, Junzhou, China). UV radiation in the range of 220–400 nm was measured using a CUV3 radiometer (USA). The estimated experiment errors for the three instruments are 3 %, 1 % and 2 %, respectively. The original data were obtained at 1 min intervals and the hourly average values were used in this study. The chemical composition of organic, sulfate, nitrate, ammonium and chloride in non-refractory submicron aerosol were measured during several campaigns with an Aerodyne High-Resolution Time-of-Flight Aerosol Mass Spectrometer from July 2009 to August 2012 (HR-ToF-AMS, Aerodyne Research Inc., Billerica, MA, USA). Detailed information about the instrument, calibration and data process have been introduced by Zhang et al. (2016). All these measurements were conducted at the IAP station.
A typical intense haze episode occurred during the heating season in urban Beijing during 17 to 22 November 2010. This episode was associated with synoptic stagnation in the North China Plain (Fig. S1 in the Supplement) and was characterized by low wind speeds and irregular wind direction (Fig. 1). Several meteorological variables had distinct temporal patterns during different stages of pollution, including reduced solar radiation and increased relative humidity during the most intense presence of haze (Fig. 1). The temporal patterns of PM2.5 concentrations were very similar at the two lower measurement heights (8 and 120 m, Fig. 1d), even though the concentration was clearly highest close to the surface. The PM2.5 concentration measured at 280 m behaved in a different way, especially during the most intense period of the haze when the mixed layer height was very low (Fig. 1e). The decoupling of the 280 m platform from the other two lower ones at low mixed layer heights is apparent in our 3-year measurement data set, especially when comparing O3 and NOx concentrations between the three measurement platforms (Figs. S2 and S5). During the haze period, the maximum PM2.5 concentrations at 8, 120 and 280 m were 505, 267 and 339 µg m−3, respectively. The higher maximum concentration at 280 m compared with 120 m can be ascribed to the transport of pollutants from the surrounding regions of Hebei and Tianjin provinces typical for polluted periods (Sun et al., 2013). The mixing layer height varied from 130 to 1640 m during the haze episode, ranging between about 200 and 500 m during the most intense period of the haze period on 18 November 2010 (Fig. 1e). The TKE was quite low during this intensive haze episode from 18 to 21 November, with an average value around 0.3 m2 s−2. However, the TKE increased significantly on the morning of 21 November as surface wind increased from 1.2 to around 6 m s−1, which was possible due to the movement of a cold front as shown in Fig. S1.
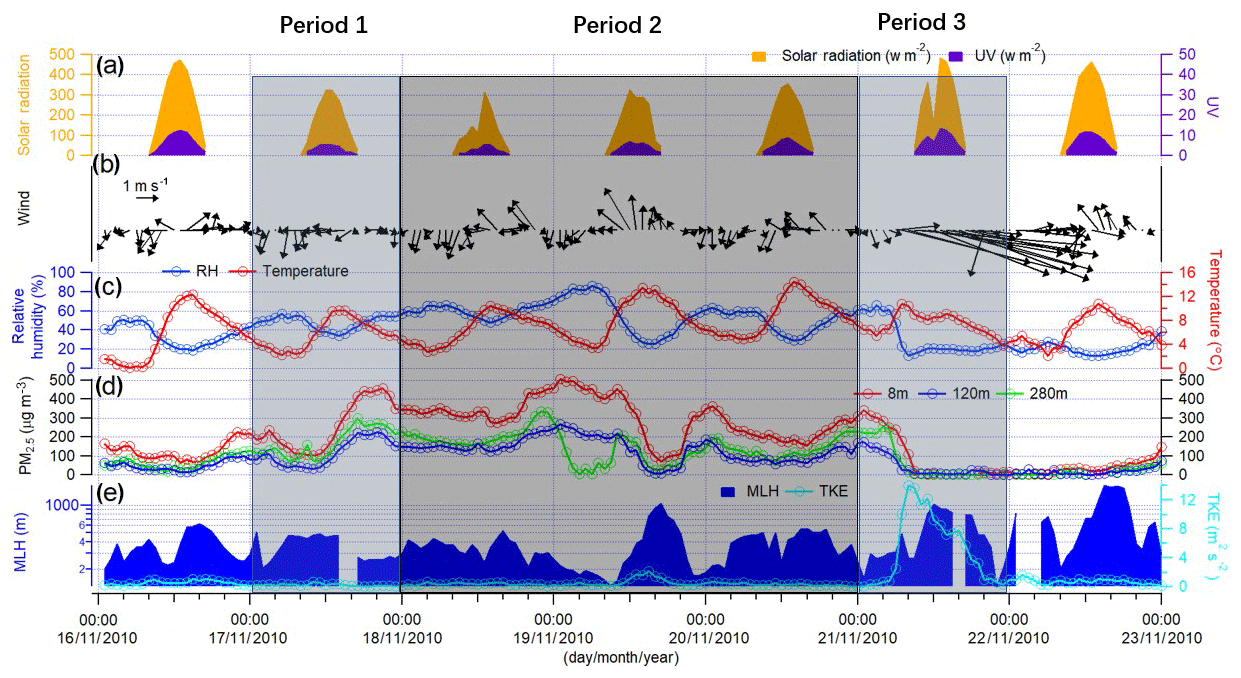
Figure 1Measurements of (a) solar radiation and ultraviolet radiation at 8 m, (b) wind speed and direction at 8 m, (c) relative humidity and air temperature at 8 m, (d) mass concentration of PM2.5 at 8, 120 and 280 m, and (e) mixing layer height at 8 m and turbulence kinetic energy at 140 m in the Beijing 325 m meteorology tower during an intensive air pollution episode in November 2010. The evolution of the air pollution episode can be divided into period 1 (clean period to air pollution accumulation period), period 2 (pollution period) and period 3 (pollution to clean period).
The vertical distributions of attenuated backscatter density obtained from ceilometer measurements indicate vertical mixing conditions accompanied by an inversion layer and high relative humidity in the surface as shown in Fig. 2. The strong inversion and high relative humidity occurred on the morning of 18 November 2010, with a lapse rate of 2 K / 100 m, relative humidity of 78 % and a northerly wind speed of around 2 m s−1 detected by the vertical sounding. The turbulent kinetic energy at 140 m was reduced to around 0.1–0.7 m2 s−2 due to decreased solar radiation, as presented in Fig. 1a. In this manner, the development of a mixing layer was significantly suppressed during the intense haze episode.
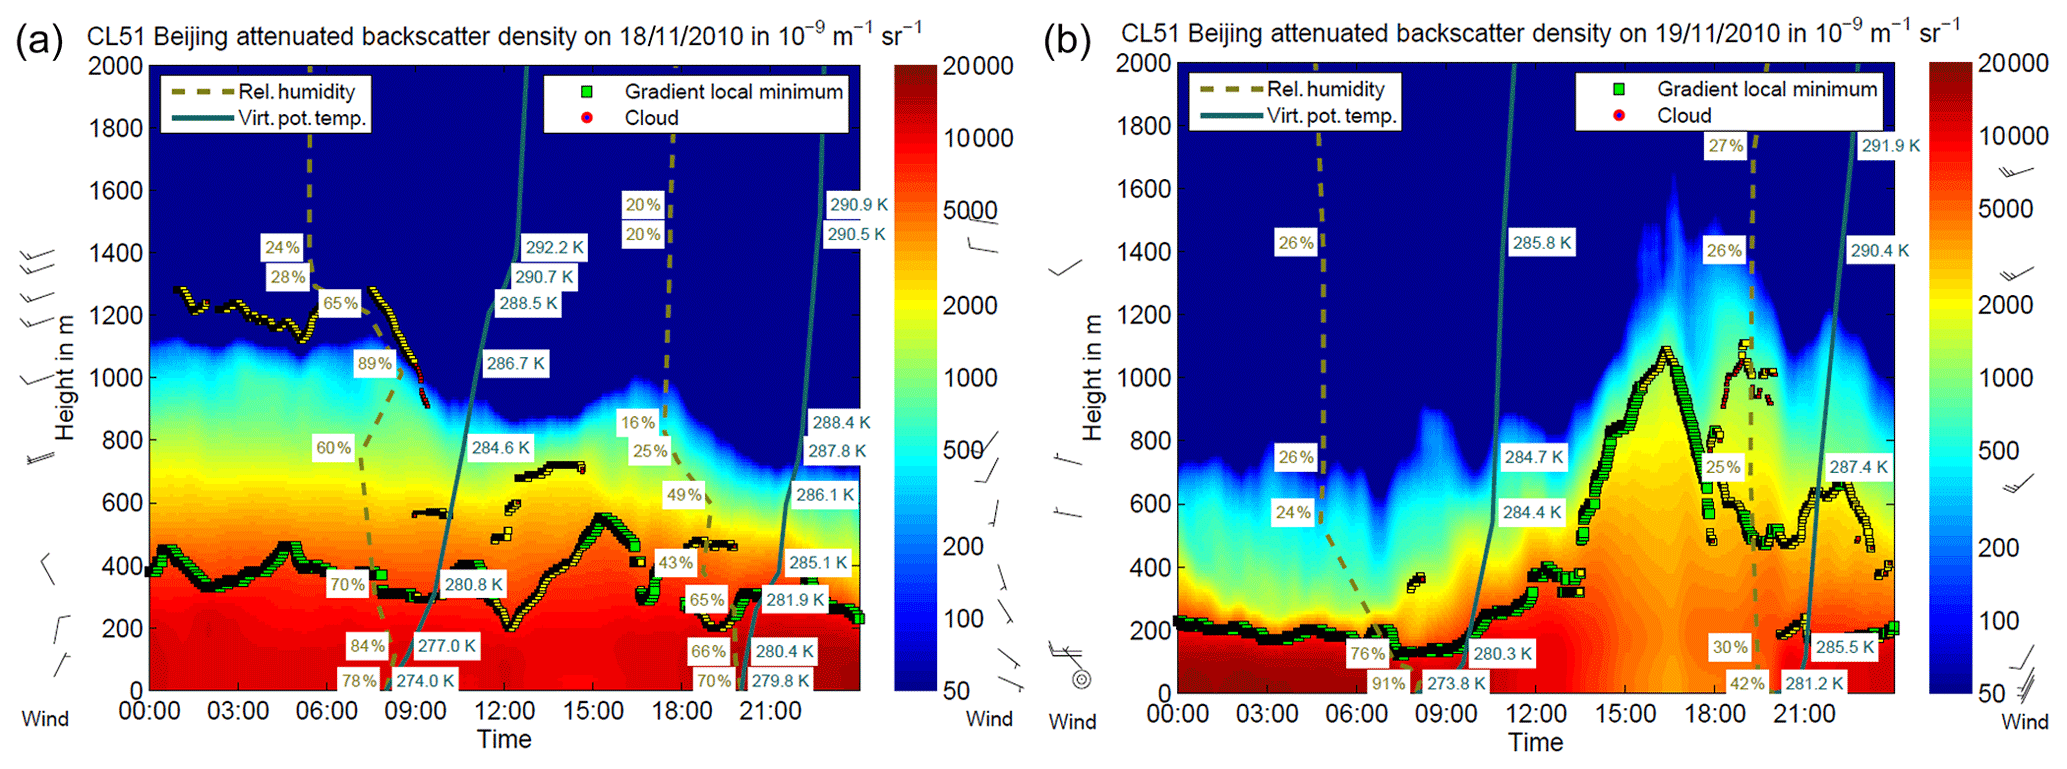
Figure 2Observed attenuated backscatter density, calculated mixing layer height using ceilometer and vertical wind speed, wind direction, relative humidity, and virtual potential temperature using sounding data during 18 November (a) and 19 November (b). The black flags on the left- and right-hand sides of the figures stand for vertical wind speed and wind direction obtained from sounding measurements at 08:00 and 20:00 Beijing time, respectively. The circle on the left-hand side of the figure represents calm wind. The dotted yellow lines and solid green lines represent the vertical distribution of virtual potential temperature and relative humidity from sounding at 08:00 and 20:00, respectively. The yellow square and green square represent the first layer and second layer, respectively, and usually the first layer was used as the mixing layer height. The mixing layer height was determined from the local minimum of the backscatter density gradient, and the colour in the figure stands for backscatter density from the ceilometer. From both figures, we can clearly see that the mixing layer has an important role in regulating the distribution of air pollutants.
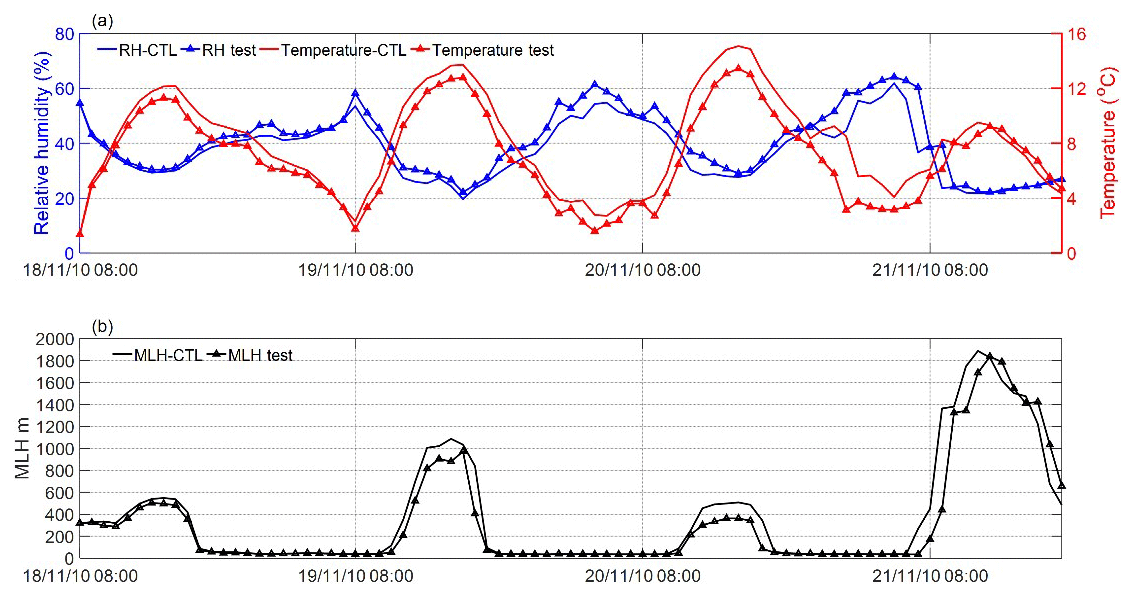
Figure 3(a) Modelled variation of surface relative humidity and temperature and (b) mixing layer height during the intensive haze episode from 18 to 21 November 2010. The lines with triangles on them represent results from the test experiment, while the lines without triangles represent results from the control experiment. The control experiment was performed with the absence of aerosol direct radiative forcing in the RRTMG radiation scheme, while the test experiment was conducted with the presence of aerosol direct radiative forcing considered.
In order to demonstrate how the PM2.5 modifies the surface temperature, relative humidity and development of the mixing layer height, we performed two numerical simulation experiments, using the WRF model as a tool. We took the measurements during the intensive haze episode shown in Fig. 1 as an example. As shown in Fig. 3a, the variation of temperature and relative humidity showed pronounced daily variations, with higher and lower values, respectively, during daytime in both test and control experiments. However, the presence of aerosol in the test experiment clearly showed decreased surface temperature and increased relative humidity. The presence of aerosol reduces downward radiation reaching the surface, as a result of which the surface temperature and sensitive heat flux decrease and the development of the mixing layer height is suppressed (M. Li et al., 2017; Z. Li et al., 2017; Miao et al., 2016). Statistical results showed that the average relative humidity, surface temperature and mixing layer height were 8.2±3.4 ∘C, 40.5±11.6 % and 377.7±499 m, respectively, without the consideration of aerosol direct radiative forcing, whereas the consideration of aerosol directive radiative forcing changed these values to 7.1±3.1 ∘C, 40.6±11.7 % and 326.7±470.1 m, respectively. Our model results clearly demonstrate the pronounced role of aerosol particles in reducing the mixing layer height during this haze pollution episode.
In order to further illustrate how the mixing layer height modifies PM2.5 concentrations, we used 3 years of simultaneous winter-time air pollutant measurements in Beijing. We divided the observed PM2.5 concentrations into highly polluted and less polluted conditions using a threshold value of 75 µg m−3 for PM2.5 to distinguish between these conditions. This is consistent with the Chinese Environment Protection Bureau definition of a haze pollution event. With this threshold value, we found that 31 % and 69 % of the total measurement time corresponded to highly polluted and less polluted conditions, respectively. We plotted the PM2.5 data as a function of the mixing layer height at the three observation heights (8, 120 and 280 m) during both highly polluted and less polluted conditions and fitted an exponential curve to these data based on best fitting (Fig. 4). The PM2.5 concentration has a clear anti-correlation with the mixing layer height during the intense haze episodes. At all the measurement heights, the PM2.5 concentration increased as the mixing layer height decreased, and this pattern was very strong under polluted conditions (Fig. 4). We also tested the reciprocal fitting function for the data (Fig. S8). It overestimated the PM2.5 concentration when the mixing layer height was very low, as compared to the exponential fitting function (Fig. 4). This also indicates that a much higher PM2.5 concentration is needed in order to obtain a very low mixing layer height without the positive feedback. This can also be supported by the root-mean-square error (RMSE) of these two fitting methods. The RMSE of the exponential fitting is much smaller than the reciprocal fitting in any case (Table S1 in the Supplement).
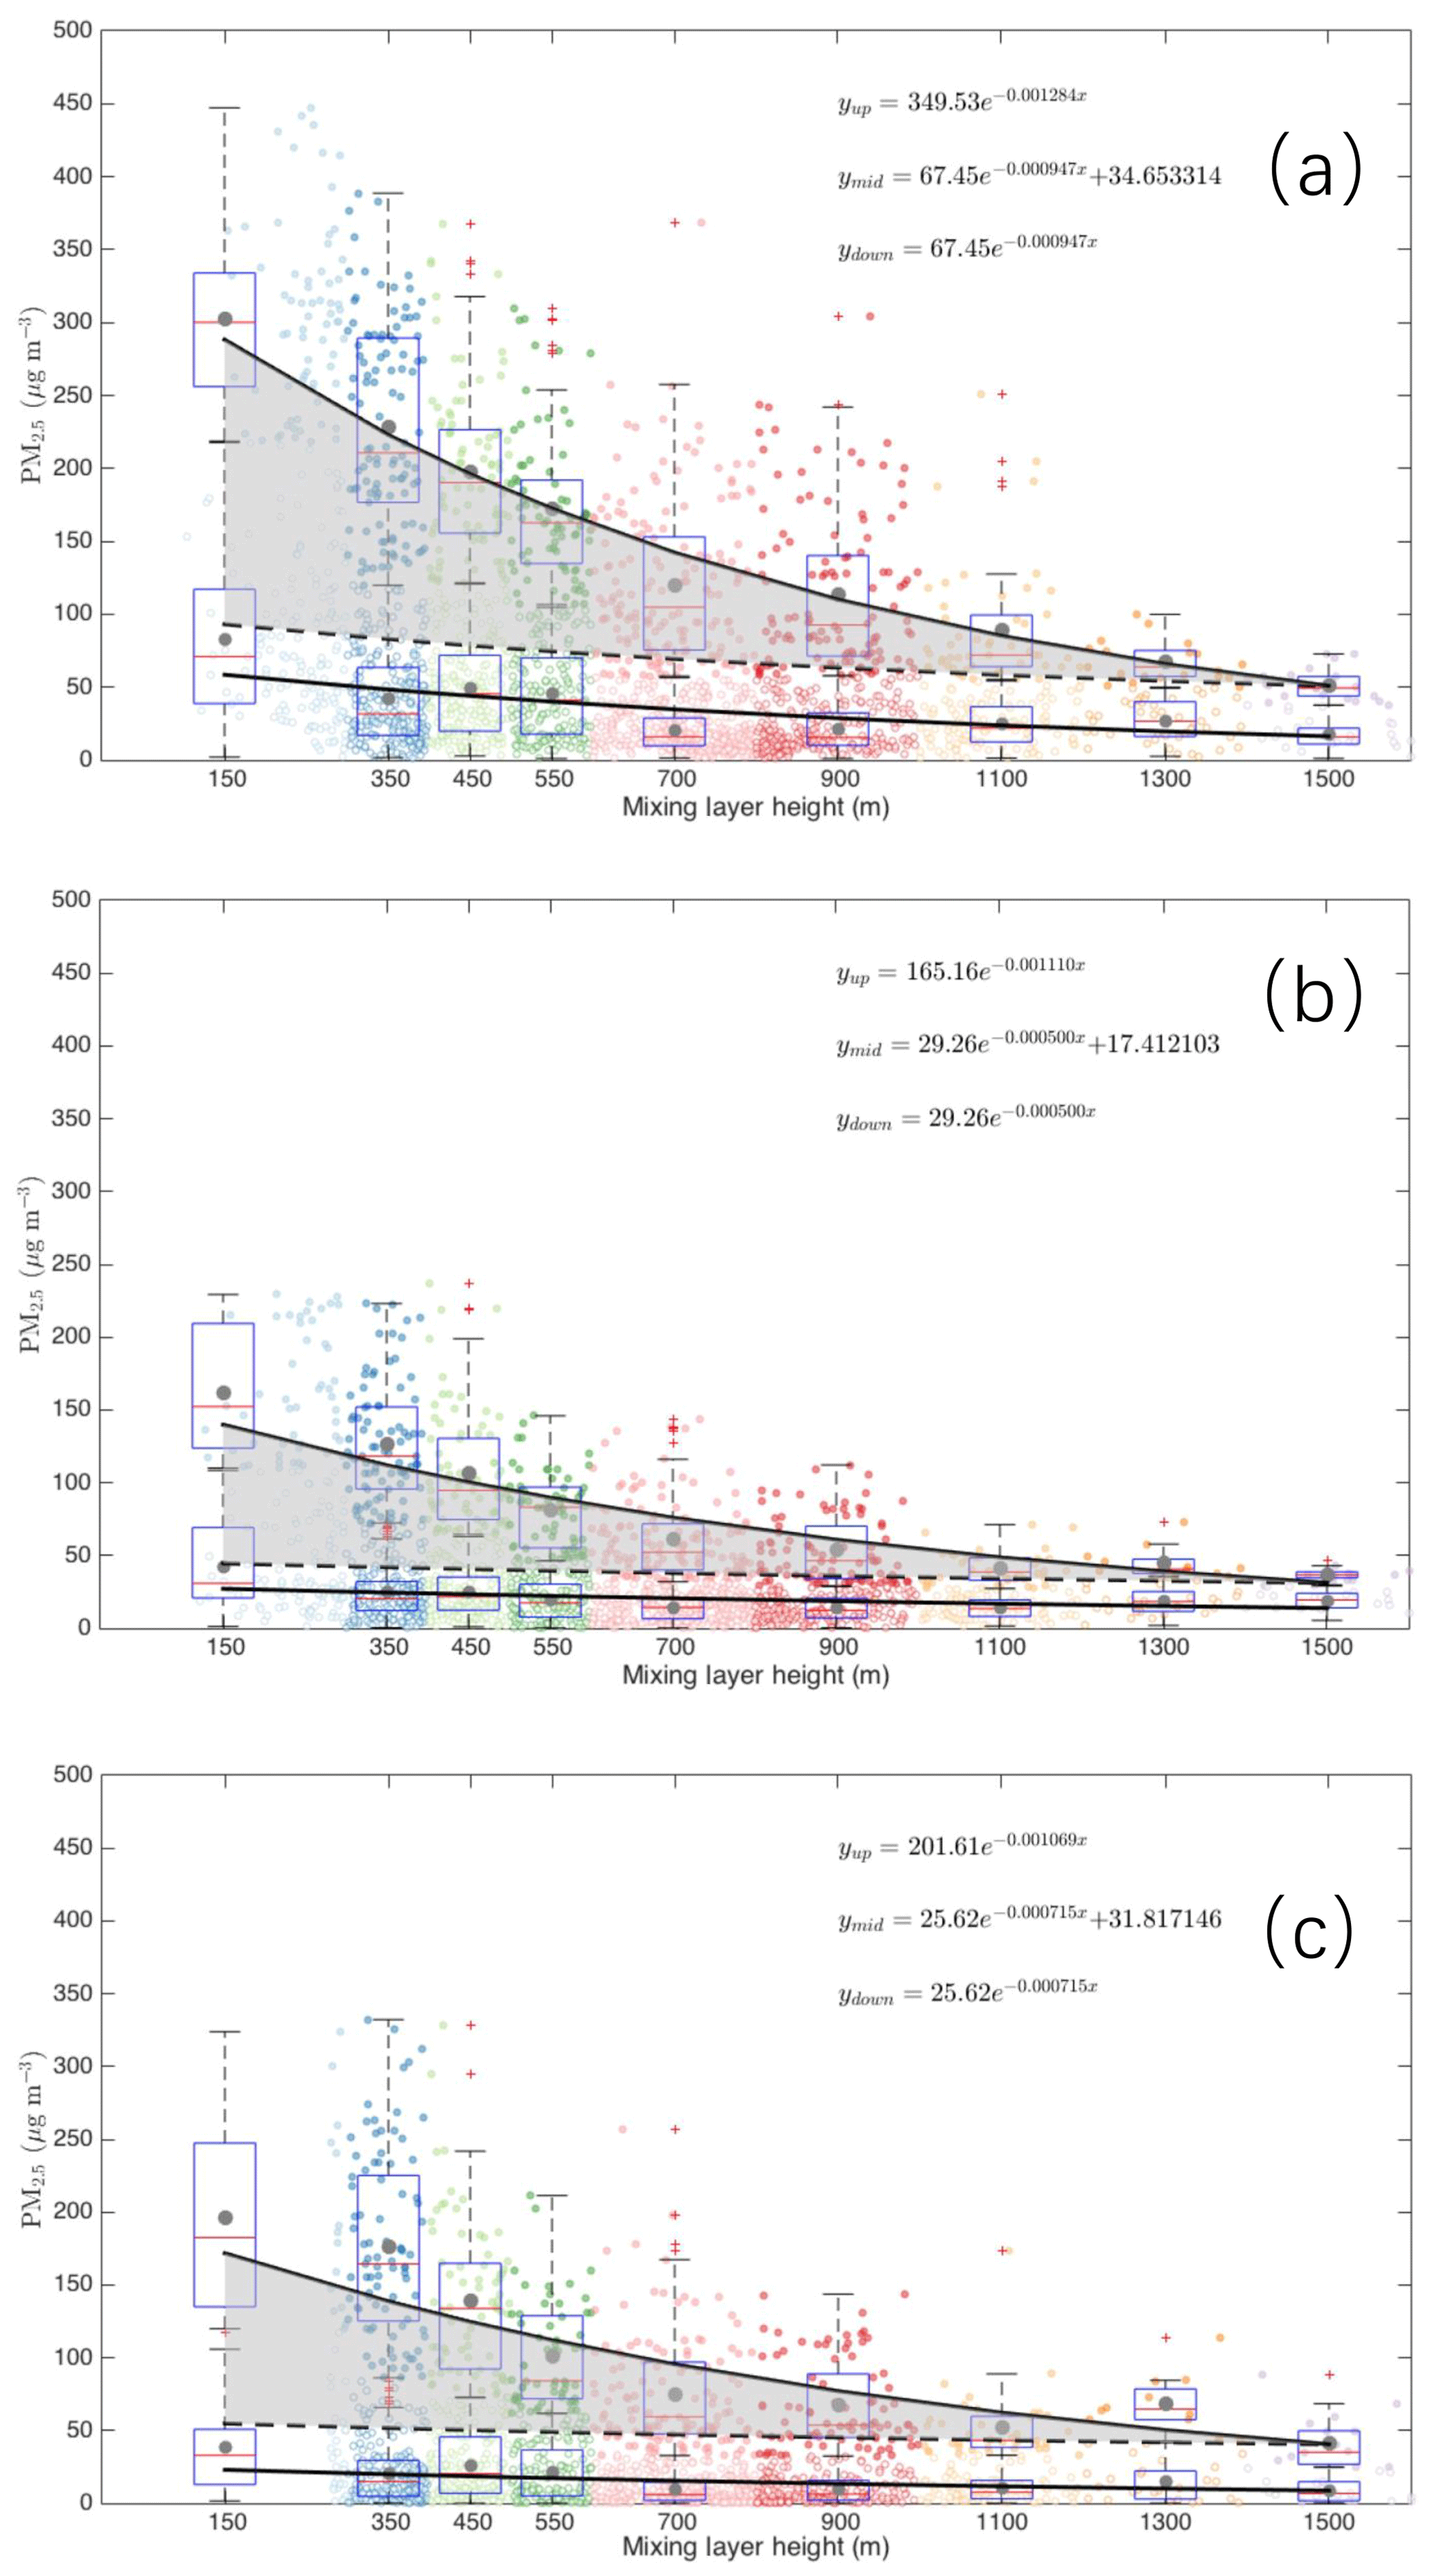
Figure 4The variability of the PM2.5 mass concentration as a function of the mixing layer height at 8 m (a), 120 m (b) and 280 m (c). The data related to the upper fitting line represent PM2.5 concentrations larger than 75 µg m−3, while the data related to the lower fitting line represent PM2.5 concentrations less than 75 µg m−3. The dark grey points represent mean values; the red line represents median values. The shadowed area corresponds to an increased amount of PM2.5 with decreased mixing layer height assuming that PM2.5 has the same variation pattern under highly polluted conditions as in less polluted times.
It is worth noting that the increase was mainly from the PM1−2.5 fraction that increased from 42 % to 65 % as the mixing layer height decreased from more than 1400 m to lower than 300 m (Fig. S4). A major portion of particulate mass between 1 and 2.5 µm originates from secondary aerosol formation processes in urban air (Y. H. Wang et al., 2015; Zhang et al., 2015). As shown in Fig. S7, the concentration of NR-PM1 increased significantly from 12.1 to 56.4 µg m−3 when the variation of MLH decreased from more than 1400 m to less than 200 m. The reduction in solar radiation reaching the surface due to fine particle matter reduces the turbulent kinetic energy and the development of the mixing layer, as shown in Fig. 5. An exponential function between the turbulent kinetic energy at 140 m and mixing layer height was fitted. Based on this fit, the MLH roughly doubles from about 400 to 800 m when TKE increases from 0.1 to 1 m2 s−2. These are typical values of MLH during polluted conditions in Beijing.
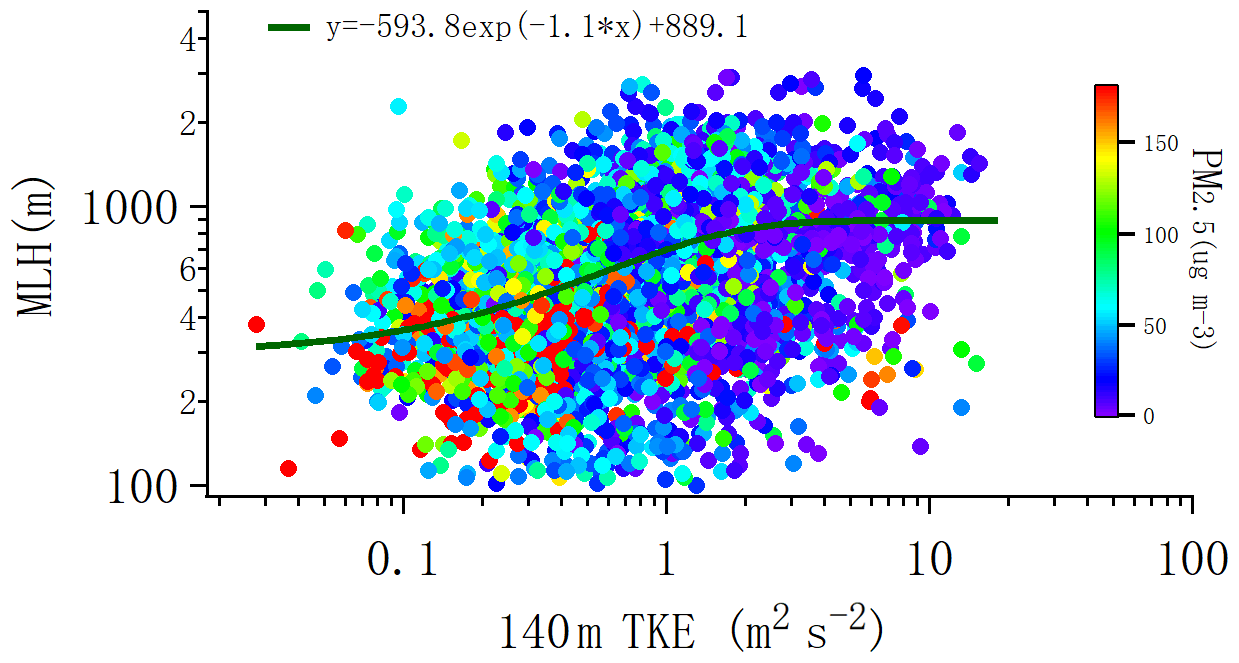
Figure 5Turbulent kinetic energy at 140 m as a function of mixing layer height and PM2.5 concentrations at 120 m from July 2009 to August 2011. An exponential function was fitted based on best fitting.
The reduced sensible heat and TKE due to aerosol particles reduce the entrainment of relatively dry air into the mixing layer from above, which makes the air more humid within the mixing layer. This, together with the decreased surface temperature, increases the relative humidity (Z. Li et al., 2017). The increased relative humidity enhances the aerosol water uptake and promotes the formation of secondary organic and inorganic aerosol via aqueous-phase reactions (Liu et al., 2018; Wang et al., 2019), enhancing light scattering and causing further reduction in the intensity of radiation reaching the surface. All these factors suppress the development of mixing layer height and enhance the accumulation of air pollutants within the mixing layer. We ascribe part of the observed increase in PM2.5 and simultaneous decrease in the mixing layer height to the positive feedback associated with the particulate matter–mixing layer interaction (Petäjä et al., 2016; Ding et al., 2016), occurring at the same time as primary emissions and secondary formation are confined into a smaller volume of air. The feedback occurred at all three observation platforms and appeared to be most intensive at 8 m. In an urban environment, NOx originates mainly from local anthropogenic emissions, whereas the sources of particulate matter include both primary emissions and secondary formation (Ehn et al., 2014; Jimenez et al., 2009; Zhang et al., 2015; Zhao et al., 2013). As shown in Fig. S6, the median NOx concentration at 8 m was 250 % higher under highly polluted conditions compared with less polluted conditions as the mixing layer height decreased to 100–200 m, while the corresponding number for the PM2.5 concentration was 360 %.
The increase in the PM2.5 concentration from less polluted to highly polluted conditions is mainly due to concentrated particulate matter caused by a decreased mixing layer height, which is accompanied by primary particle emissions, secondary aerosol formation and feedback from particulate matter–mixing layer height interactions. Compared with the increased amounts of NOx, we can roughly estimate that a maximum of 110 % of the increased PM2.5 originates from secondary aerosol formation processes in this study. Of the remaining 250 % of the PM2.5 increase, potentially a large fraction originates from particulate matter–mixing layer height interactions, but we cannot quantify this fraction at the moment.
The development of a mixing layer height in an urban city is affected by the intensity of incoming solar radiation. Our measurement at the 325 m meteorology tower showed that the solar and ultraviolet radiation reaching the surface decreases considerably at increased pollution levels, which leads to a decreased TKE and, consequently, the suppression of mixing layer development. In turn, the shallowed mixing layer height further favours the enhancement of PM2.5 concentration and its precursor gases from both direct emissions and secondary formation. This feedback mechanism may be an important reason for the rapid increase in particulate matter from moderately polluted conditions to periods of intense pollution in an urban atmosphere as the strength increased when the PM2.5 concentration increased, although we cannot quantify the feedback amount exactly by observations currently. The particulate matter–mixing layer height feedback is probably a critical factor in the formation of intense haze periods from moderately polluted periods in Beijing and other polluted cities.
The readers can access the data by contacting Yonghong Wang (yonghong.wang@helisnkifi) or Yuesi Wang (wys@mail.iap.ac.cn).
The supplement related to this article is available online at: https://doi.org/10.5194/acp-20-45-2020-supplement.
MK, TP and YoW had the original idea of the study. YuW, GT, TS, ZL, BH, LW, XZ, DJ, WG and YS conducted the long-time measurements and provided the data. MY conducted model simulation. YoW, GT, ST, PZ, ME, CY, VK, TP and MK interpreted the data and plotted the figures. YoW wrote the manuscript with contributions from all the co-authors.
The authors declare that they have no conflict of interest.
This article is part of the special issue “Pan-Eurasian Experiment (PEEX)”. It is not associated with a conference.
This work was supported by the Ministry of Science and Technology of China (no.: 2017YFC0210000), the Ministry of Science and Technology of China (no.: 2017YFC0210102), the National Research Program for key issues in air pollution control (DQGG0101), the Beijing National Science Foundation of China (8171002) and the Academy of Finland via the Center of Excellence in Atmospheric Sciences.
This work was supported by the Ministry of Science and Technology of China (grant nos. 2017YFC0210000 and 2017YFC0210102), the National Research Program for key issues in air pollution control (grant no. DQGG0101), the Beijing National Science Foundation of China (grant no. 8171002) and the Academy of Finland via Center of Excellence in Atmospheric Sciences.
This paper was edited by Dominick Spracklen and reviewed by two anonymous referees.
Bougeault, P. and Lacarrere, P.: Parameterization of orography-induced turbulence in a mesobeta–scale model, Mon. Weather Rev., 117, 1872–1890, 1989.
Cao, C., Lee, X., Liu, S., Schultz, N., Xiao, W., Zhang, M., and Zhao, L.: Urban heat islands in China enhanced by haze pollution, Nat. Commun., 7, 12509, https://doi.org/10.1038/ncomms12509, 2016.
Chen, Y., Ebenstein, A., Greenstone, M., and Li, H.: Evidence on the impact of sustained exposure to air pollution on life expectancy from China's Huai River policy, P. Natl. Acad. Sci. USA, 110, 12936–12941, https://doi.org/10.1073/pnas.1300018110, 2013.
Cheng, Y., Zheng, G., Wei, C., Mu, Q., Zheng, B., Wang, Z., Gao, M., Zhang, Q., He, K., Carmichael, G., Pöschl, U., and Su, H.: Reactive nitrogen chemistry in aerosol water as a source of sulfate during haze events in China, Sci. Adv., 2, e1601530, https://doi.org/10.1126/sciadv.1601530, 2016.
Ding, A. J., Huang, X., Nie, W., Sun, J. N., Kerminen, V.-M., Petäjä, T., Su, H., Cheng, Y. F., Yang, X.-Q., Wang, M. H., Chi, X. G., Wang, J. P., Virkkula, A., Guo, W. D., Yuan, J., Wang, S. Y., Zhang, R. J., Wu, Y. F., Song, Y., Zhu, T., Zilitinkevich, S., Kulmala, M., and Fu, C. B.: Enhanced haze pollution by black carbon in megacities in China, Geophys. Res. Lett., 43, 2873–2879, https://doi.org/10.1002/2016gl067745, 2016.
Ehn, M., Thornton, J. A., Kleist, E., Sipilä, M., Junninen, H., Pullinen, I., Springer, M., Rubach, F., Tillmann, R., Lee, B., Lopez-Hilfiker, F., Andres, S., Acir, I.-H., Rissanen, M., Jokinen, T., Schobesberger, S., Kangasluoma, J., Kontkanen, J., Nieminen, T., Kurtén, T., Nielsen, L. B., Jørgensen, S., Kjaergaard, H. G., Canagaratna, M., Dal Maso, M., Berndt, T., Petäjä, T., Wahner, A., Kerminen, V.-M., Kulmala, M., Worsnop, D. R., Wildt, J., and Mentel, T. F.: A large source of low-volatility secondary organic aerosol, Nature, 506, 476–479, https://doi.org/10.1038/nature13032, 2014.
Huang, R.-J., Zhang, Y., Bozzetti, C., Ho, K.-F., Cao, J.-J., Han, Y., Daellenbach, K. R., Slowik, J. G., Platt, S. M., Canonaco, F., Zotter, P., Wolf, R., Pieber, S. M., Bruns, E. A., Crippa, M., Ciarelli, G., Piazzalunga, A., Schwikowski, M., Abbaszade, G., Schnelle-Kreis, J., Zimmermann, R., An, Z., Szidat, S., Baltensperger, U., El Haddad, I., and Prévôt, A. S. H.: High secondary aerosol contribution to particulate pollution during haze events in China, Nature, 514, 218–222, https://doi.org/10.1038/nature13774, 2014.
Iacono, M. J., Delamere, J. S., Mlawer, E. J., Shephard, M. W., Clough, S. A., and Collins, W. D.: Radiative forcing by long-lived greenhouse gases: Calculations with the AER radiative transfer models, J. Geophys. Res.-Atmos., 113, 2–9, https://doi.org/10.1029/2008JD009944, 2008.
Jimenez, J. L., Canagaratna, M. R., Donahue, N. M., Prevot, A. S. H., Zhang, Q., Kroll, J. H., DeCarlo, P. F., Allan, J. D., Coe, H., Ng, N. L., Aiken, A. C., Docherty, K. S., Ulbrich, I. M., Grieshop, A. P., Robinson, A. L., Duplissy, J., Smith, J. D., Wilson, K. R., Lanz, V. A., Hueglin, C., Sun, Y. L., Tian, J., Laaksonen, A., Raatikainen, T., Rautiainen, J., Vaattovaara, P., Ehn, M., Kulmala, M., Tomlinson, J. M., Collins, D. R., Cubison, M. J., Dunlea, E. J., Huffman, J. A., Onasch, T. B., Alfarra, M. R., Williams, P. I., Bower, K., Kondo, Y., Schneider, J., Drewnick, F., Borrmann, S., Weimer, S., Demerjian, K., Salcedo, D., Cottrell, L., Griffin, R., Takami, A., Miyoshi, T., Hatakeyama, S., Shimono, A., Sun, J. Y., Zhang, Y. M., Dzepina, K., Kimmel, J. R., Sueper, D., Jayne, J. T., Herndon, S. C., Trimborn, A. M., Williams, L. R., Wood, E. C., Middlebrook, A. M., Kolb, C. E., Baltensperger, U., and Worsnop, D. R.: Evolution of Organic Aerosols in the Atmosphere, Science, 326, 1525–1529, https://doi.org/10.1126/science.1180353, 2009.
Kulmala, M.: China's choking cocktail, Nature, 526, 497–499, 2015.
Lelieveld, J., Evans, J. S., Fnais, M., Giannadaki, D., and Pozzer, A.: The contribution of outdoor air pollution sources to premature mortality on a global scale, Nature, 525, 367–371, https://doi.org/10.1038/nature15371, 2015.
Li, M., Wang, T., Xie, M., Zhuang, B., Li, S., Han, Y., and Chen, P.: Impacts of aerosol-radiation feedback on local air quality during a severe haze episode in Nanjing megacity, eastern China, Tellus B, 69, 1–16, https://doi.org/10.1080/16000889.2017.1339548, 2017.
Li, Z., Guo, J., Ding, A., Liao, H., Liu, J., Sun, Y., Wang, T., Xue, H., Zhang, H., and Zhu, B.: Aerosol and boundary-layer interactions and impact on air quality, Natl. Sci. Rev., 4, 810–833, https://doi.org/10.1093/nsr/nwx117, 2017.
Liu, Q., Jia, X., Quan, J., Li, J., Li, X., Wu, Y., Chen, D., Wang, Z., and Liu, Y.: New positive feedback mechanism between boundary layer meteorology and secondary aerosol formation during severe haze events, Sci. Rep.-UK, 8, 6095, https://doi.org/10.1038/s41598-018-24366-3, 2018.
Martilli, A., Clappier, A., and Rotach, M. W.: An urban surface exchange parameterisation for mesoscale models, Bound.-Lay. Meteorol., 104, 261–304, https://doi.org/10.1023/A:1016099921195, 2002.
Miao, Y., Liu, S., Zheng, Y., and Wang, S.: Modeling the feedback between aerosol and boundary layer processes: a case study in Beijing, China, Environ. Sci. Pollut. R., 23, 3342–3357, https://doi.org/10.1007/s11356-015-5562-8, 2016.
Münkel, C., Eresmaa, N., Räsänen, J., and Karppinen, A.: Retrieval of mixing height and dust concentration with lidar ceilometer, Bound.-Lay. Meteorol., 124, 117–128, https://doi.org/10.1007/s10546-006-9103-3, 2007.
Pan, Y., Wang, Y., Zhang, J., Liu, Z., Wang, L., Tian, S., Tang, G., Gao, W., Ji, D., Song, T., and Wang, Y.: Redefining the importance of nitrate during haze pollution to help optimize an emission control strategy, Atmos. Environ., 141, 197–202, https://doi.org/10.1016/j.atmosenv.2016.06.035, 2016.
Petäjä, T., Järvi, L., Kerminen, V. M., Ding, A. J., Sun, J. N., Nie, W., Kujansuu, J., Virkkula, A., Yang, X., Fu, C. B., Zilitinkevich, S., and Kulmala, M.: Enhanced air pollution via aerosol-boundary layer feedback in China, Sci. Rep.-UK, 6, 18998, https://doi.org/10.1038/srep18998, 2016.
Quan, J., Gao, Y., Zhang, Q., Tie, X., Cao, J., Han, S., Meng, J., Chen, P., and Zhao, D.: Evolution of planetary boundary layer under different weather conditions, and its impact on aerosol concentrations, Particuology, 11, 34–40, https://doi.org/10.1016/j.partic.2012.04.005, 2013.
Salamanca, F. and Martilli, A.: A new building energy model coupled with an urban canopy parameterization for urban climate simulations – part II, Validation with one dimension off-line simulations, Theor. Appl. Climatol., 99, 345–356, 2010.
Skamarock, W. C., Klemp, J. B., Dudhia, J., Gill, D. O., Barker, D., Duda, M. G., and Powers, J. G. A.: A description of the advanced research WRF version 3, NCAR/TN-475+STR, University Corporation for Atmospheric Research, https://doi.org/10.5065/D68S4MVH, 2008.
Song, T., Sun, Y., and Wang, Y.: Multilevel measurements of fluxes and turbulence over an urban landscape in Beijing, Tellus B, 65, 20421, https://doi.org/10.3402/tellusb.v65i0.20421, 2013.
Stull, R. B.: An Introduction to Boundary Layer Meteorology, Kluwer Academic Publishers, Dordrecht, 1988.
Sun, Y., Song, T., Tang, G., and Wang, Y.: The vertical distribution of PM2.5 and boundary-layer structure during summer haze in Beijing, Atmos. Environ., 74, 413–421, https://doi.org/10.1016/j.atmosenv.2013.03.011, 2013.
Tang, G., Zhang, J., Zhu, X., Song, T., Münkel, C., Hu, B., Schäfer, K., Liu, Z., Zhang, J., Wang, L., Xin, J., Suppan, P., and Wang, Y.: Mixing layer height and its implications for air pollution over Beijing, China, Atmos. Chem. Phys., 16, 2459–2475, https://doi.org/10.5194/acp-16-2459-2016, 2016.
Thompson, G., Rasmussen, R. M., and Manning, K.: Explicit forecasts of winter precipitation using an improved bulk microphysics scheme. Part I: Description and sensitivity analysis, Mon. Weather Rev., 132, 519–542, 2004.
Wang, H., Peng, Y., Zhang, X., Liu, H., Zhang, M., Che, H., Cheng, Y., and Zheng, Y.: Contributions to the explosive growth of PM2.5 mass due to aerosol–radiation feedback and decrease in turbulent diffusion during a red alert heavy haze in Beijing–Tianjin–Hebei, China, Atmos. Chem. Phys., 18, 17717–17733, https://doi.org/10.5194/acp-18-17717-2018, 2018.
Wang, J., Wang, S., Jiang, J., Ding, A., Zheng, M., Zhao, B., Wong, D. C., Zhou, W., Zheng, G., Wang, L., Pleim, J. E., and Hao, J.: Impact of aerosol–meteorology interactions on fine particle pollution during China's severe haze episode in January 2013, Environ. Res. Lett., 9, 094002, https://doi.org/10.1088/1748-9326/9/9/094002, 2014.
Wang, Y., Wang, Y., Wang, L., Petäjä, T., Zha, Q., Gong, C., Li, S., Pan, Y., Hu, B., Xin, J., and Kulmala, M.: Increased inorganic aerosol fraction contributes to air pollution and haze in China, Atmos. Chem. Phys., 19, 5881–5888, https://doi.org/10.5194/acp-19-5881-2019, 2019.
Wang, Y. H., Hu, B., Ji, D. S., Liu, Z. R., Tang, G. Q., Xin, J. Y., Zhang, H. X., Song, T., Wang, L. L., Gao, W. K., Wang, X. K., and Wang, Y. S.: Ozone weekend effects in the Beijing–Tianjin–Hebei metropolitan area, China, Atmos. Chem. Phys., 14, 2419–2429, https://doi.org/10.5194/acp-14-2419-2014, 2014.
Wang, Y. H., Liu, Z. R., Zhang, J. K., Hu, B., Ji, D. S., Yu, Y. C., and Wang, Y. S.: Aerosol physicochemical properties and implications for visibility during an intense haze episode during winter in Beijing, Atmos. Chem. Phys., 15, 3205–3215, https://doi.org/10.5194/acp-15-3205-2015, 2015.
Zhang, J. K., Wang, L. L., Wang, Y. H., and Wang, Y. S.: Submicron aerosols during the Beijing Asia-Pacific Economic Cooperation conference in 2014, Atmos. Environ., 124, 224–231, https://doi.org/10.1016/j.atmosenv.2015.06.049, 2016.
Zhang, R., Wang, G., Guo, S., Zamora, M. L., Ying, Q., Lin, Y., Wang, W., Hu, M., and Wang, Y.: Formation of Urban Fine Particulate Matter, Chem. Rev., 115, 3803–3855, https://doi.org/10.1021/acs.chemrev.5b00067, 2015.
Zhao, B., Wang, S. X., Liu, H., Xu, J. Y., Fu, K., Klimont, Z., Hao, J. M., He, K. B., Cofala, J., and Amann, M.: NOx emissions in China: historical trends and future perspectives, Atmos. Chem. Phys., 13, 9869–9897, https://doi.org/10.5194/acp-13-9869-2013, 2013.
Zheng, G., Duan, F., Ma, Y., Zhang, Q., Huang, T., Kimoto, T., Cheng, Y., Su, H., and He, K.: Episode-Based Evolution Pattern Analysis of Haze Pollution: Method Development and Results from Beijing, China, Environ. Sci. Technol., 50, 4632–4641, https://doi.org/10.1021/acs.est.5b05593, 2016.