the Creative Commons Attribution 4.0 License.
the Creative Commons Attribution 4.0 License.
 | 18 Mar 2020
Uptake selectivity of methanesulfonic acid (MSA) on fine particles over polynya regions of the Ross Sea, Antarctica
Jinyoung Jung
Miming Zhang
Federico Bianchi
Yee Jun Tham
Suqing Xu
Qi Lin
Shuhui Zhao
Lei Li
Liqi Chen
The uptake of methanesulfonic acid (MSA) on existing particles is a major route of the particulate MSA formation, however, MSA uptake on different particles is still lacking in knowledge. Characteristics of MSA uptake on different aerosol particles were investigated in polynya (an area of open sea water surrounded by ice) regions of the Ross Sea, Antarctica. Particulate MSA mass concentrations, as well as aerosol population and size distribution, were observed simultaneously for the first time to access the uptake of MSA on different particles. The results show that MSA mass concentration does not always reflect MSA particle population in the marine atmosphere. MSA uptake on aerosol particle increases the particle size and changes aerosol chemical composition, but it does not increase the particle population. The uptake rate of MSA on particles is significantly influenced by aerosol chemical properties. Sea salt particles are beneficial for MSA uptake, as MSA-Na and MSA-Mg particles are abundant in the Na and Mg particles, accounting for 0.43±0.21 and 0.41±0.20 of the total Na and Mg particles, respectively. However, acidic and hydrophobic particles suppress the uptake of MSA, as MSA-EC (elemental carbon) and MSA- particles account for only 0.24±0.68 and 0.26±0.47 of the total EC and particles, respectively. The results extend the knowledge of the formation and environmental behavior of MSA in the marine atmosphere.
- Article
(3459 KB) - Full-text XML
-
Supplement
(1406 KB) - BibTeX
- EndNote


Methanesulfonic acid (MSA) and non-sea-salt sulfate (nss-), derived from the oxidation of dimethyl sulfide (DMS), are important sources of cloud condensation nuclei (CCN) in the marine boundary layer (Chang et al., 2011; Ghahremaninezhad et al., 2016). Different from nss-, MSA is exclusively from the oxidation of DMS in the atmosphere (Sorooshian et al., 2007). Thus, MSA is expected as a useful marker for the deconvolution of sulfate from marine biogenic and non-biogenic sources (Legrand et al., 1998). The ratio of MSA to nss- is often used to assess the DMS oxidation routes and the contributions of biogenic sulfur to other sulfur sources (Sorooshian et al., 2007; Wang et al., 2014). DMS oxidation routes, as well as the products of MSA and nss-, have been investigated previously in the marine atmosphere (Preunkert et al., 2008; Kloster et al., 2006).
Generally, particulate MSA is generated from the reactive uptake of DMS and condensation of gaseous MSA on aerosol particles (Davis et al., 1998; Barnes et al., 2006). A recent study has shown that MSA can increase the sulfate cluster formation rate by up to 1 order of magnitude, increasing the stability of the clusters (Bork et al., 2014). However, previous studies have shown that is more effective at new particle formation (NPF) than MSA, while MSA is more likely to condense onto existing particles (Hayashida et al., 2017). Although the reactive uptake of MSA on fine particles has been demonstrated in the previous studies (Sorooshian et al., 2007; Bates et al., 1992), the influence of aerosol characteristics on MSA uptake is not present.
The chemical components and sources of aerosol particles in the marine atmosphere are very complicated (Weller et al., 2018). Filtered sample methods are often used in previous studies (Jung et al., 2014; Preunkert et al., 2007; Read et al., 2008), with a long sampling interval to accommodate the detection limit of the instrument (Preunkert et al., 2007; Zhang et al., 2015). It is, therefore, difficult to clarify how MSA mixes with other aerosol species, using bulk aerosol sampling methods, as only mean aerosol chemical components are obtained during the sampling period (Bates et al., 1992; Chen et al., 2012). Online aerosol mass spectrometry has been used to characterize the aerosol chemical species and sizes with high-time-resolution observations (Yan et al., 2018; Healy et al., 2010), allowing the determination of particle mixing states and sources. Although a few studies have shown that MSA is often associated with Mg in aerosol particles, probably due to marine biogenic activity (Casillas-Ituarte et al., 2010), studies of the interactions between MSA and other aerosol species are still rare. Theoretical and laboratory studies have attempted to explain these observations and determine in which way MSA enters aerosol particle (Bork et al., 2014). However, the relative likelihood of MSA uptake on different particles remains uncertain.
In this study, we examined the uptake characteristics of MSA on different particles over polynya (an area of open sea water surrounded by ice) regions in the Ross Sea (RS), Antarctica, based on high-time-resolution observations. MSA mass concentrations and particle populations, as well as aerosol compositions and size distributions, were measured simultaneously for the first time in the RS using an in situ gas and aerosol compositions (IGAC) and a single particle aerosol mass spectrometer (SPAMS) monitoring instrument. Observations were carried out in two different seasons: early December with intense sea ice coverage and in mid-January to February with sea ice free conditions in the RS.
The observations were carried out aboard of R/V Xuelong, covering a large region of the RS, Antarctica (50 to 78∘ S, 160 to 185∘ E) (Supplement Fig. S1) with different sea ice concentrations. The leg I was carried out from 2 to 20 December 2017. The sea surfaces were covered with intense sea ice in the RS during this period (Fig. S2a). However, when we arrived back in the RS (leg II, from 13 January to 14 February 2018), the sea ice had almost melted in the RS (Fig. S2b).
2.1 Observation instruments and sampling inlet
An in situ gas and aerosol compositions monitoring system (IGAC, model S-611, Machine Shop, Fortelice International Co., Ltd., Taiwan; http://www.machine-shop.com.tw/, last access: 13 March 2020), and a single particle aerosol mass spectrometer (SPAMS, Guangzhou Hexin Analytical Instrument Co., Ltd.) were used to determine aerosol water-soluble ion species, particle size distributions and chemical compositions, respectively (Fig. S3). The sampling inlet connecting to the monitoring instruments was fixed to a mast 20 m above the sea surface to minimize the impact of self-contaminations of the vessel. Wind speeds and directions were also monitored during the cruise. The observation periods in which self-contaminations impacted the measurement have been excluded based on the high-time- resolution observation data. A total suspended particulate (TSP) sampling inlet was positioned at the top of the mast. Conductive silicon tubing with an inner diameter of 1.0 cm was used to make the connection to all instruments.
2.2 Aerosol water-soluble ion species
Gases and aerosol water-soluble ion species were determined using a semi-continuous IGAC monitor. A PM10 cyclone was conducted for the IGAC sampling. Hence, the measurement particle size is ∼10 µm of the IGAC in this study. Gases and aerosols are separated and streamed into a liquid effluent for online chemical analysis at an hourly temporal resolution (Young et al., 2016; Liu et al., 2017). The analytical design and methodology for the determination of gases and aerosol water-soluble ions have been described in detail by Tao (2018) and Tian (2017). Fine particles are firstly enlarged by vapor condensation and subsequently accelerated through a conical-shaped impaction nozzle and collected on the impaction plate. The samples are then analyzed for anions and cations by an online ion chromatography (IC) system (Dionex ICS-3000). The injection loop size is 500 µL for both anions and cations. Six to eight concentrations of standard solutions are selected for calibration, depending on the target concentration, in which the R2 was above 0.997 (Fig. S4). The detection limits for MSA−, , Na+, and Cl− are 0.09, 0.12, 0.03, and 0.03 µg L−1 (aqueous solution), respectively.
2.3 Aerosol size distribution and chemical compositions
The detection method for fine particles (0.1–2.0 µm) using a SPAMS has been described in detail by Li et al. (2011, 2014). Particles are introduced into the vacuum system through a critical orifice and then focused and accelerated to form a particle beam with specific velocity. The particle beam passes through two continuous diode Nd:YAG lasers (532 nm), where the scattered light is detected by two photomultiplier tubes (PMTs). The velocity of a single particle is then determined and converted into its aerodynamic diameter. The individual particle is ionized with a 266 nm Nd:YAG laser to produce positive and negative ions. The fragment ions are analyzed using a bipolar time-of-flight mass spectrometer. The power density of the ionization laser is kept at 1.56×10⁸ W cm−2.
The particle size data and mass spectra are analyzed using the YAADA software toolkit (http://www.yaada.org/, last access: 22 March 2019) (Allen, 2005). A neural network algorithm based on an adaptive resonance theory (ART-2a) is applied to cluster individual particles into separate groups based on the presence and intensity of ion peaks in the single particle mass spectrum (Song et al., 1999), with a vigilance factor of 0.65, a learning rate of 0.05, and a maximum of 20 iterations.
2.4 Metrological data
Meteorological parameters such as temperature, humidity, wind speed, and wind direction were measured continuously using an automated meteorological station deployed on the R/V Xuelong, which was located on the top deck of the vessel.
2.5 Satellite data of sea ice and chlorophyll a
In this study, we used remote-sensing data to show the spatial and temporal distribution of chlorophyll and sea ice concentrations in the RS. To reduce the impact of cloud and swath limits, we chose the 8 d datasets for the remote sensing of chlorophyll a from MODIS Aqua (https://modis.gsfc.nasa.gov, last access: 13 March 2020) with a spatial resolution of 4 km. We used the sea ice concentration data from the daily 3.125 km AMSR2 dataset (Spreen et al., 2008) (available at https://seaice.uni-bremen.de, last access: 16 September 2019). Each grid of the gridded datasets with a sea ice concentration less than or equal to 15 % was regarded as comprising all water (Cavalieri and Parkinson, 2003). The time series of the total regional mean value in the study region was then plotted.
3.1 Spatial distributions of MSA mass concentrations and particle populations
MSA mass concentrations were measured continuously in the RS. The spatial distributions of MSA mass concentrations and particle populations in Fig. 1 are created with Ocean Data View (Schlitzer, 2002, 2015). MSA concentrations ranged from 14.6 to 210.8 ng m−3, with an average of 43.8±22.1 ng m−3 during leg I (Fig. 1a), consistent with summertime MSA levels recorded at Halley station (75∘39′ S, with an average of 35.3 ng m−3) and Dumont d'Urville station (66∘40′ S, with an average of 49 ng m−3) (Minikin et al., 1998) but lower than those reported at Palmer station (64∘77′ S, with an average of 122 ng m−3) (Savoie et al., 1993). The highest MSA levels occurred in the region between 64 and 67∘ S with a maximum value of 210.8 ng m−3 (Fig. 1a), consistent with the previous observation results obtained from the Southern Ocean (60–70∘ S, with a maximum MSA level of 260 ng m−3) (Chen et al., 2012). In this study, elevated MSA levels were associated with the dynamic sea ice edge at ∼64∘ S, as sea ice starts to melt in early December (Fig. S2a and S2c). The release of iron (De Baar et al., 1995; Wang et al., 2014) and algae (Lizotte et al., 2001; Loose et al., 2011) from sea ice increase phytoplankton numbers (Taylor et al., 2013), resulting in the increase of DMS generation and emission (Hayashida et al., 2017). This, in turn, increases MSA levels due to the oxidation of DMS in the atmosphere.
MSA particle populations (0.1–2.5 µm) were determined simultaneously by SPAMS during the cruise (Fig. 1b). The highest average hourly MSA particle population (507±189) occurred at MP1 (high MSA population; 68–72∘ S, 172∘ E) near the Antarctic continent, followed by MP2 (high MSA population; 65–68∘ S, 160–170∘ E), with an average particle population of 344±334. High MSA particle populations were associated with high wind speeds in these regions (MP1 8.06±1.86 m s−1, MP2 15.76±3.93 m s−1; Fig. 2).
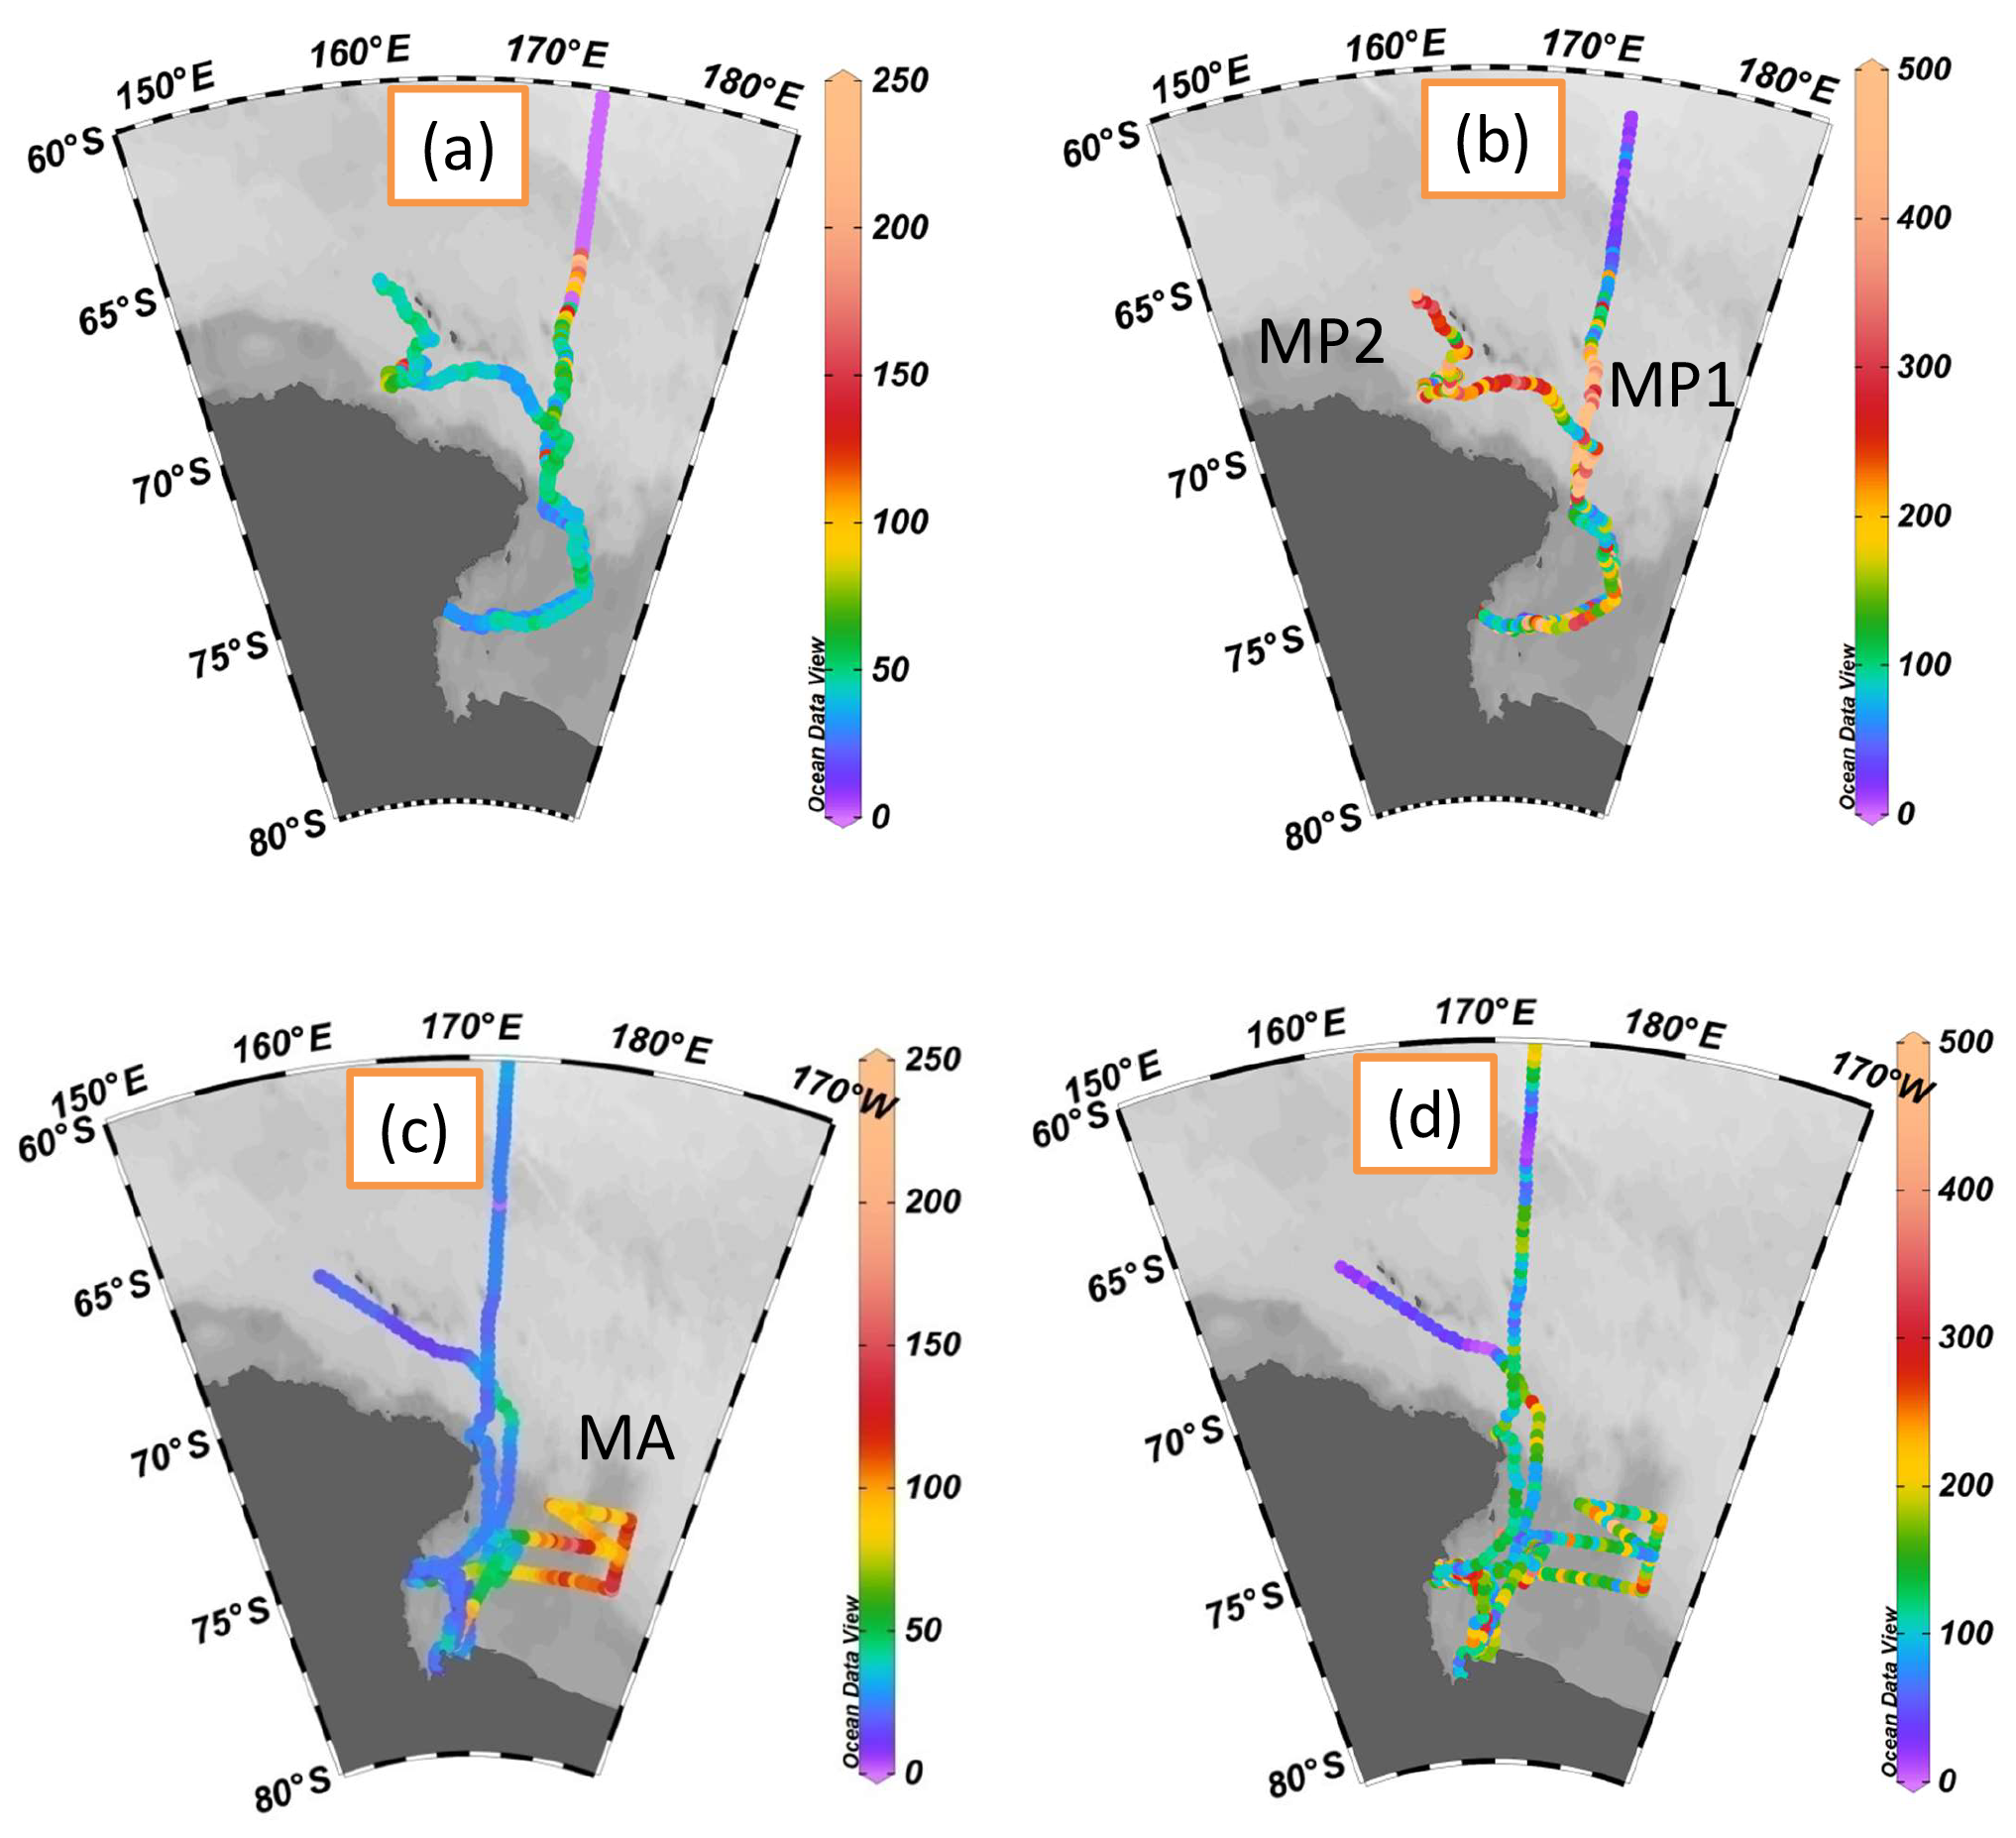
Figure 1Spatial distributions of MSA mass concentrations and particle populations created with ODV (Schlitzer, 2002, 2015); (a) MSA mass concentrations during leg I (ng m−3); (b) MSA particle populations during leg I; (c) MSA mass concentrations during leg II (ng m−3), and (d) MSA particle populations during leg II.
The MSA mass concentrations ranged from 11.4 to 165.4 ng m−3 (with an average of 38.8±27.5 ng m−3) during leg II, and the MSA particle populations ranged from 3 to 1666 (with an average of 168±172, Fig. 1c and d). Similar variations of MSA particle population and total particle population were present (Fig. 2). The relationship between MSA particle population and total particle population will be further discussed in Sect. 3.2. Extremely high MSA mass concentrations, with an average of 100.3±18.6 ng m−3, were observed in the MA region (high MSA mass; 170.2–177.4∘ E, 68.2–77.8∘ S), but high MSA particle populations were not present in this region (with an average of 171±159). High MSA particle populations with low MSA concentrations occurred at MP1 and MP2 (Fig. 1a and b). It indicates that MSA mass concentrations did not always reflect the MSA particle populations in the marine atmosphere. Generally, the uptake of MSA on aerosol surface (Read et al., 2008) only changes the aerosol size and chemical composition, without varying their populations. Hence, the MSA particle population is mainly associated with the aerosol number concentration in the atmosphere, as more particles are provided for the uptake of MSA in high particle number concentration. Though high levels of MSA may also increase the MSA population, high MSA mass concentrations with low MSA populations are observed in this study. This phenomenon occurs when low existing particle populations and high MSA mass concentrations are present in the marine atmosphere.
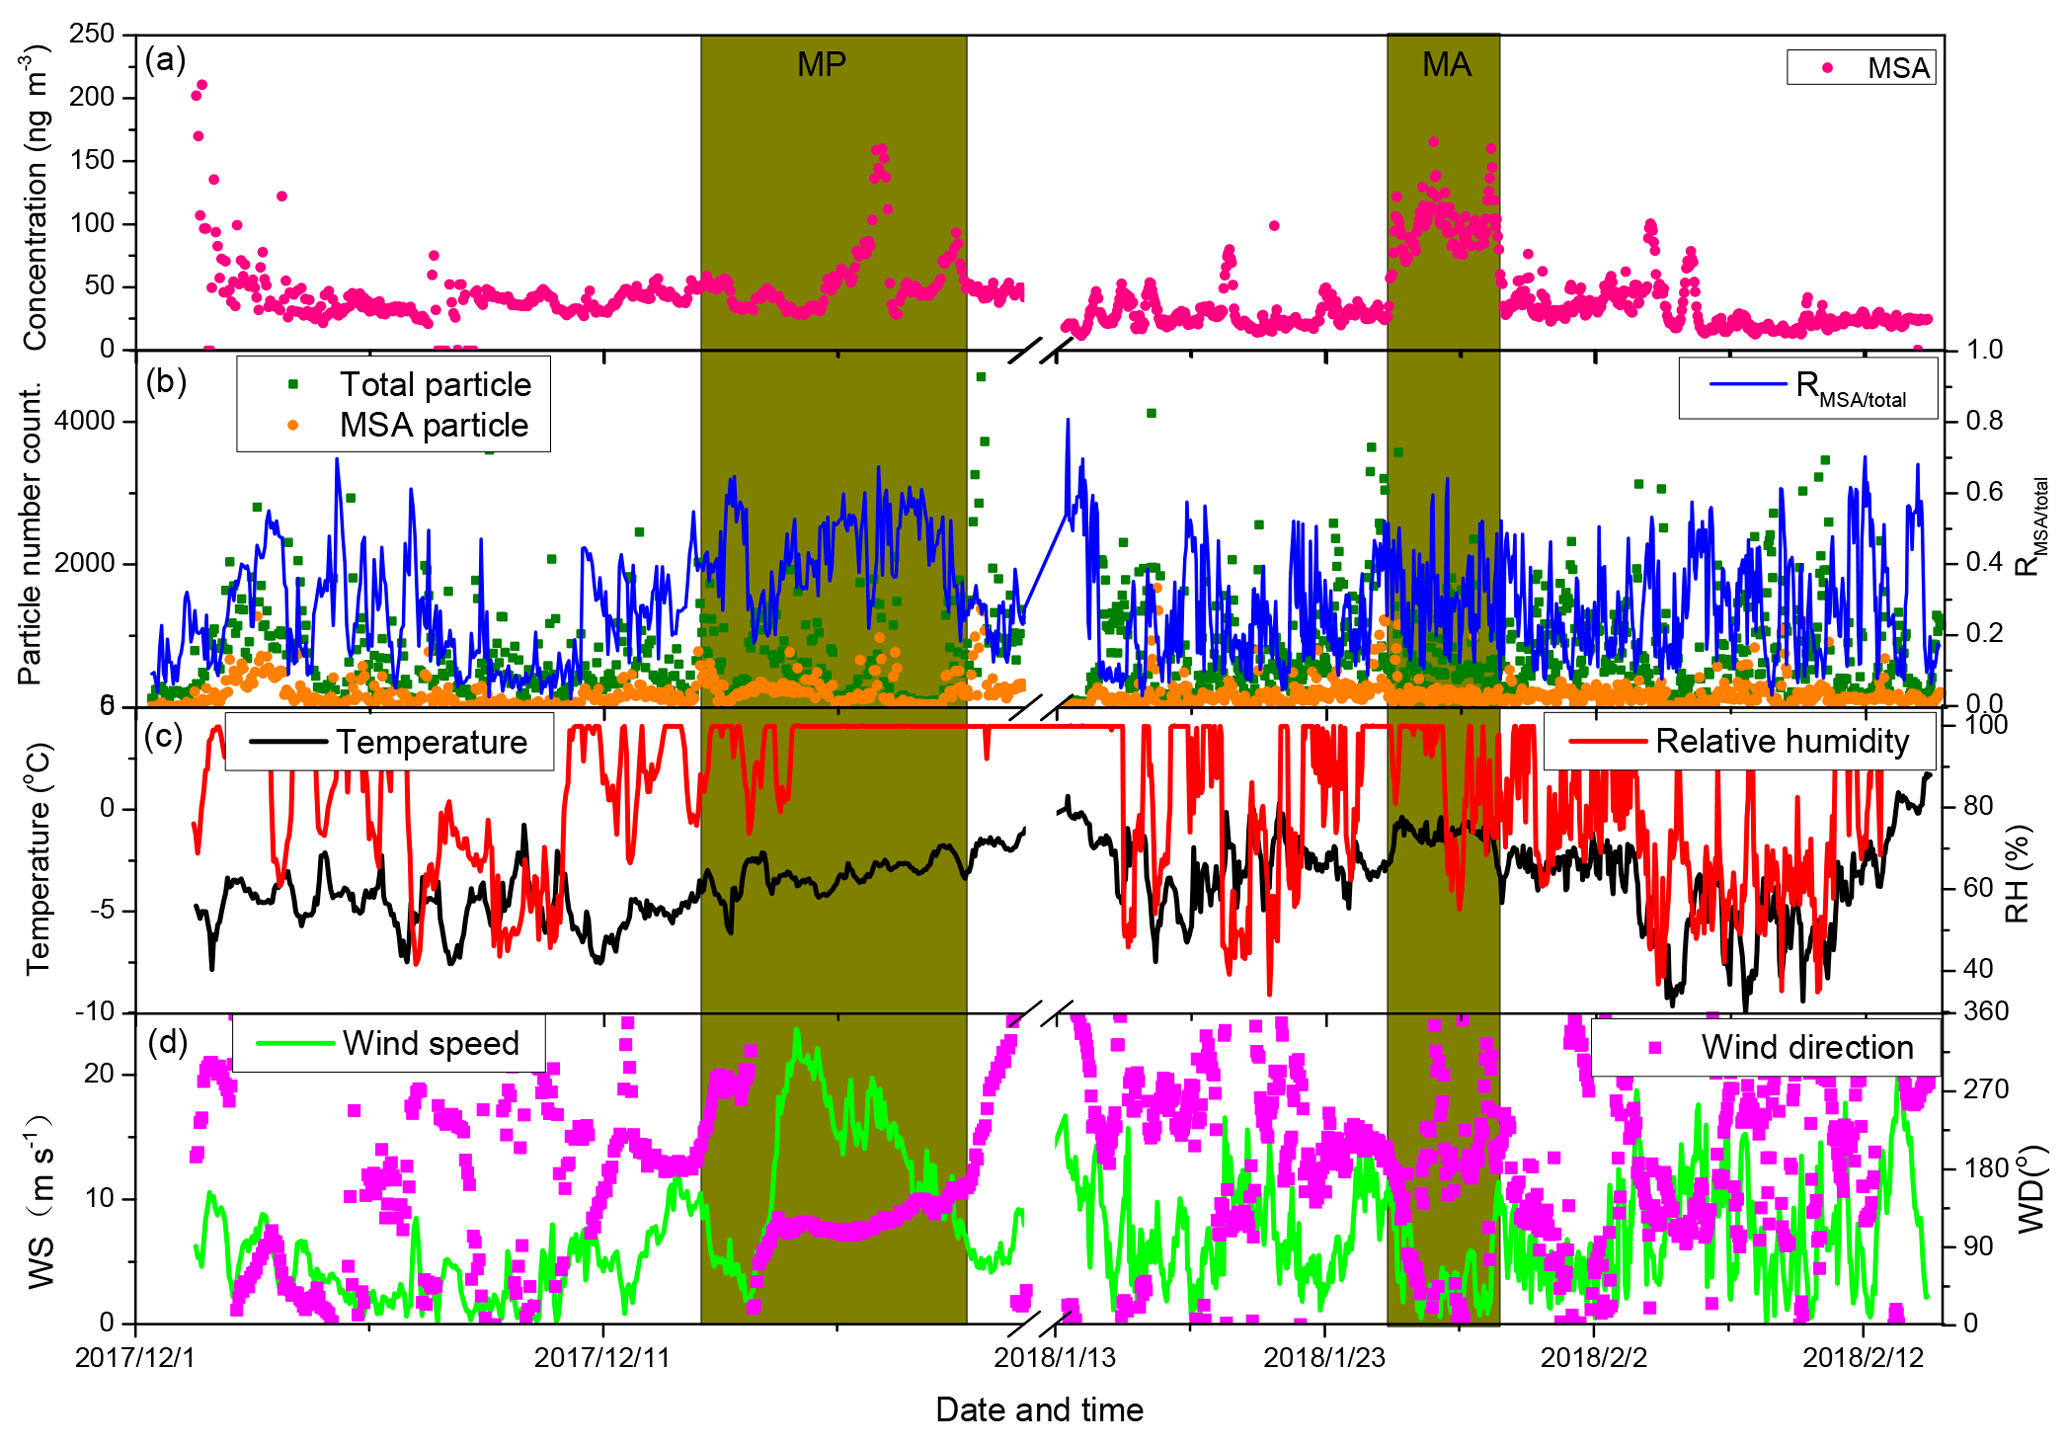
Figure 2Relationship between MSA mass concentration and MSA particle population in the context of various environmental factors. (a) Time series of MSA mass concentrations; (b) time series of MSA particle population, total particle population, and the ratio of MSA particle population and total particle population; (c) time series of temperature and relative humidity (RH); and (d) time series of wind speeds and direction.
3.2 Linkage between MSA concentration and particle population
To verify the relationship between MSA mass concentration and particle population, the temporal distributions of MSA mass concentration and particle number are illustrated in Fig. 2. Variations of MSA mass concentrations were not always associated with the MSA particle populations during the observation periods (Fig. 2a and b). We did not find an obvious correlation between MSA particle population and MSA mass concentration (Fig. S5a), indicating that the major factors regulating MSA mass concentration and MSA particle population were different. High MSA particle populations often occurred in conjunction with high wind speeds (Fig. 2b and d), while high MSA mass concentrations were not always observed at high wind speed regions, such as extremely high MSA mass concentrations with low wind speeds were present at MA (Fig. 2a, b and d).
MSA mass concentrations are determined by the oxidation of DMS, derived from marine phytoplankton activity (Davis et al., 1998; Barnes et al., 2006; Read et al., 2008), but MSA particle populations are mainly associated with the uptake of MSA on existing particles. High existing particle populations lead to high MSA particle populations, as the formation of particulate MSA often occurs on the surface of existing particles (Read et al., 2008). In this study, the variation of MSA particle population was consistent with the variation of total particle population during the observation period (Fig. 2b). A positive correlation between MSA particle population and total particle population was present (slope =0.19, r2=0.65, n=1195; Fig. S5b). The ratio of MSA particle population to total particle population (RMSA∕total) concentrated on the range of 0.2–0.5, with an average of 0.29±0.15 (Fig. 2b).
3.3 Signatures of MSA particle types
During leg I, 332 438 single particles with positive and negative mass spectra were obtained, while 603 098 single particles with positive and negative mass spectra were obtained during leg II. Fine particles were classified into eight types, i.e., Na, Mg, , K, EC (elemental carbon), OC (organic carbon), , and MSA, using the ART-2a algorithm (Song et al., 1999) during the cruise (Fig. S6). MSA particles accounted for 27.69 % and 22.08 % of the total particles during leg I and leg II, respectively. To investigate the interaction between MSA and other species, MSA particles were further classified into seven subtypes, including MSA-Na, MSA-Mg, MSA-, MSA-K, MSA-EC, MSA-OC, and MSA-.
3.3.1 MSA-Na particles
Sodium, which is often associated with sea salt particles in the marine atmosphere (Teinila et al., 2014), is an important component of atmospheric aerosols in ocean regions (Yan et al., 2018). Figure 3a illustrates the average mass spectra of MSA-Na particles during leg I and leg II. Strong Na+ peaks with weak K+, Ca+, and Na2Cl+ peaks were observed in the positive spectrum, while strong and MSA− peaks with low Cl−, , , and O− peaks were present in the negative spectrum. Similar average mass spectra for MSA-Na particles were observed during leg I and leg II, even though the two measurements were carried out under different circumstances. MSA-Na particles were the most dominant type of MSA particles, accounting for more than 30 % of total MSA particles (Fig. 4d).
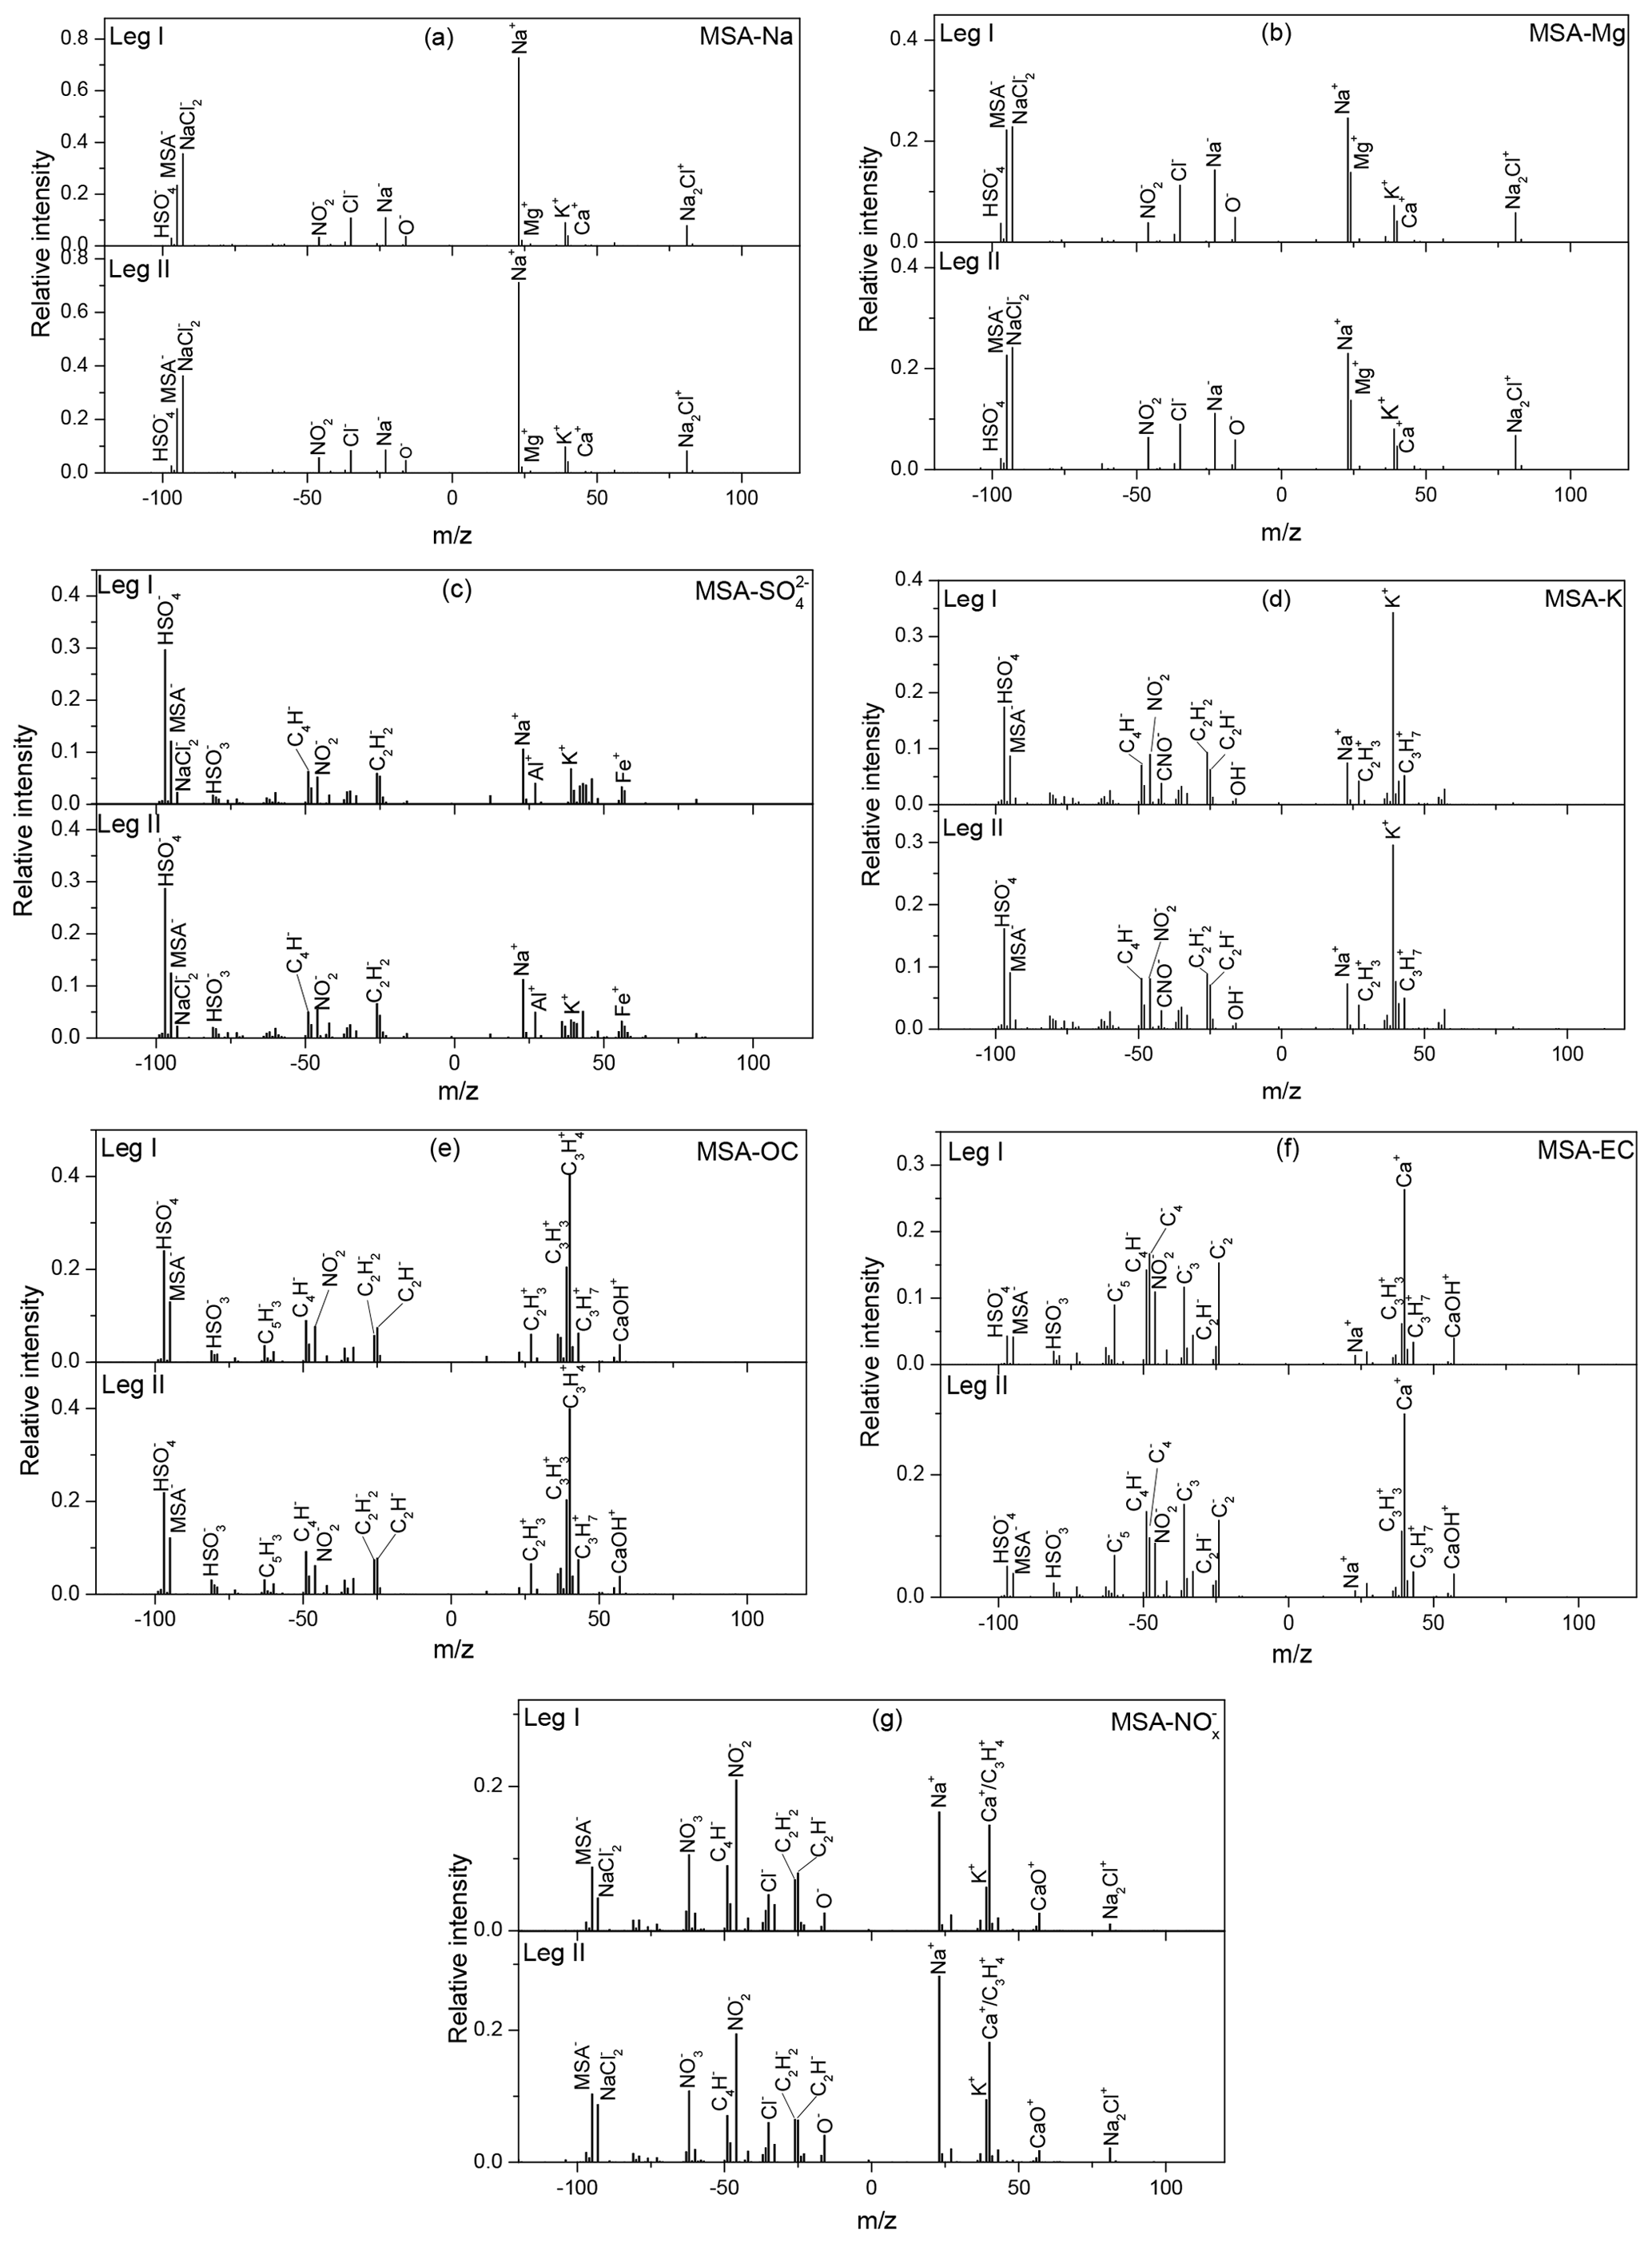
Figure 3Average mass spectra of major MSA clusters during leg I and leg II. (a) MSA-Na, (b) MSA-Mg, (c) MSA-, (d) MSA-K, (e) MSA-OC, (f) MSA-EC, and (g) MSA-.
3.3.2 MSA-Mg particles
Mg is another common component in ocean-derived particles; hence, such particles are often classified as sea salt particles in the marine atmosphere. However, some previous studies have shown that the chemical properties of Mg particles observed in the marine environment are distinct from those of sea salt particles (Gaston et al., 2011). In this study, the mass spectral characteristics of MSA-Mg-type particles included strong MSA− and Mg peaks (Fig. 3b). In sea salt particles, the dominant peak was typically Na+ rather than Mg+ (Fig. 3a) due to the higher concentration of Na+ in seawater (Guazzotti et al., 2001). Similar to MSA-Na-type particles, strong Na+ and peaks with weak Cl−, , K+, and Ca+ peaks were observed in the mass spectra, indicating that MSA-Mg-type particles were also derived from sea salt particles. A strong, positive correlation (r2=0.95) between MSA-Na and MSA-Mg was present in this study (Fig. S7), indicating that these two types of particles were derived from the same sources. However, the abundance of the Mg+ fragment ion relative to the Na+ fragment ion in MSA-Mg-type particles was different from MSA-Na particles, indicating that MSA-Mg particles were also affected by other sources. Studies have shown that Mg particles are correlated strongly with atmospheric DMS (r2=0.76) (Gaston et al., 2011), indicating that Mg particles are also impacted by marine biological materials, such as cell debris or fragments, viruses, bacteria, or the organics released by lysed cells (Casillas-Ituarte et al., 2010; Gaston et al., 2011). Hence, MSA-Mg-type particles were associated with both sea salt particles and biological emissions in this study.
3.3.3 MSA- particles
particles are derived from different sources, such as sea salt aerosols, anthropogenic emissions, and marine biogenic and volcanic sources (Legrand et al., 1998). Strong signals, peeking at and MSA−, were present in the negative spectrum (seen in Fig. 3c), consistent with previous studies with intense signals of and MSA− occurred at and (Gaston et al., 2011; Silva et al., 2000). Peaks of K+, Na+, Al+, and Fe+ were present in the positive mass spectrum, and , , C4H−, and peaks were present in the negative mass spectrum, suggesting that MSA- particles were associated with different sources. This can be further demonstrated by the size distribution of MSA- particles (Fig. 5c and d), as MSA- particles were found in both submicron particles (0.1–1.0 µm) and coarse particles (1.0–2.0 µm).
3.3.4 MSA-K particles
The positive mass spectrum of the MSA-K particles was dominated by a strong K+ peak with weak Na+, , and peaks (Fig. 3d). Strong and MSA− signals were present in the negative mass spectrum. Abundance of organic fragment ions were observed in the mass spectra of MSA-K particles. K is often expected as a marker of a biomass-burning source in continental areas (Yan et al., 2018). But K is also derived from other sources, such as coal combustion and biological materials. The mass spectra of MSA-K particles observed in this study were very different from the mass spectra of K particles observed from biomass burning, indicating that K particles were not associated with biomass burning here.
3.3.5 MSA-OC particles
OC particles are often associated with anthropogenic sources, such as vehicle and coal combustion (Silva et al., 2000; Sitaras and Siskos, 2008); marine biogenic sources (Quinn et al., 2014); and secondary sources (photochemical reaction from their precursor organic gases) (Horne et al., 2018). The positive and negative mass spectra of MSA-OC were dominated by CxHy ion peaks (i.e., , C3H+, , , and ; Fig. 3e). Strong signals of and MSA− fragment ions were also present in the negative spectrum, while weak signals of Na+ and Cl− were observed in the positive mass spectrum (Fig. 3e).
3.3.6 MSA-EC particles
EC particles are often associated with primary emissions; that is, the incomplete combustion of carbon-containing materials (Murphy et al., 2009). In this study, MSA-EC particles were characterized by strong peaks of (, , and ) in the negative spectrum, while the positive mass spectrum was dominated by Ca+ ions (Fig. 3f). EC particles are often associated with ship emissions in the ocean atmosphere (Yan et al., 2018). Compared with the average mass spectra of MSA-OC particles, the abundances of MSA− and fragment ions were lower in MSA-EC particles, indicating that the uptake of MSA on EC particles may be more difficult than the uptake of MSA on OC particles. Similar to the mass spectra of MSA-OC particles, a few fragments of Na+ and Cl− were observed in the MSA-EC mass spectra, suggesting that MSA-OC and MSA-EC particles rarely mixed with sea salt particles.
3.3.7 MSA- particles
The negative spectrum of MSA- particle was dominated by strong peaks of MSA−, , and , with weak , O−, and Cl− peaks (Fig. 3g). Strong Na+, (), and () peaks with weak Na2Cl+ and CaO+ peaks were observed in the positive spectrum. Sea salt particles react easily with atmospheric HNO3 to form nitrate and hydrogen chloride (Adachi and Buseck, 2015). The abundances of Na+, Cl−, and ions in the mass spectra of MSA- particles demonstrated that these particles were formed by the interaction between sea salt particles and in the marine atmosphere. Generally, components ( and ) are produced from their precursor gases NO2, N2O, and NO, mainly deriving from natural sources in the Southern Ocean (Wolff, 1995) and also impacted by the human activities in the coastal Antarctic regions (Mazzera et al., 2001). High concentrations of are often found in urban atmospheric aerosols (Yan et al., 2015). However, the concentrations of were extremely low during the whole cruise (Fig. 4), indicating that was associated with the marine sources in this study.
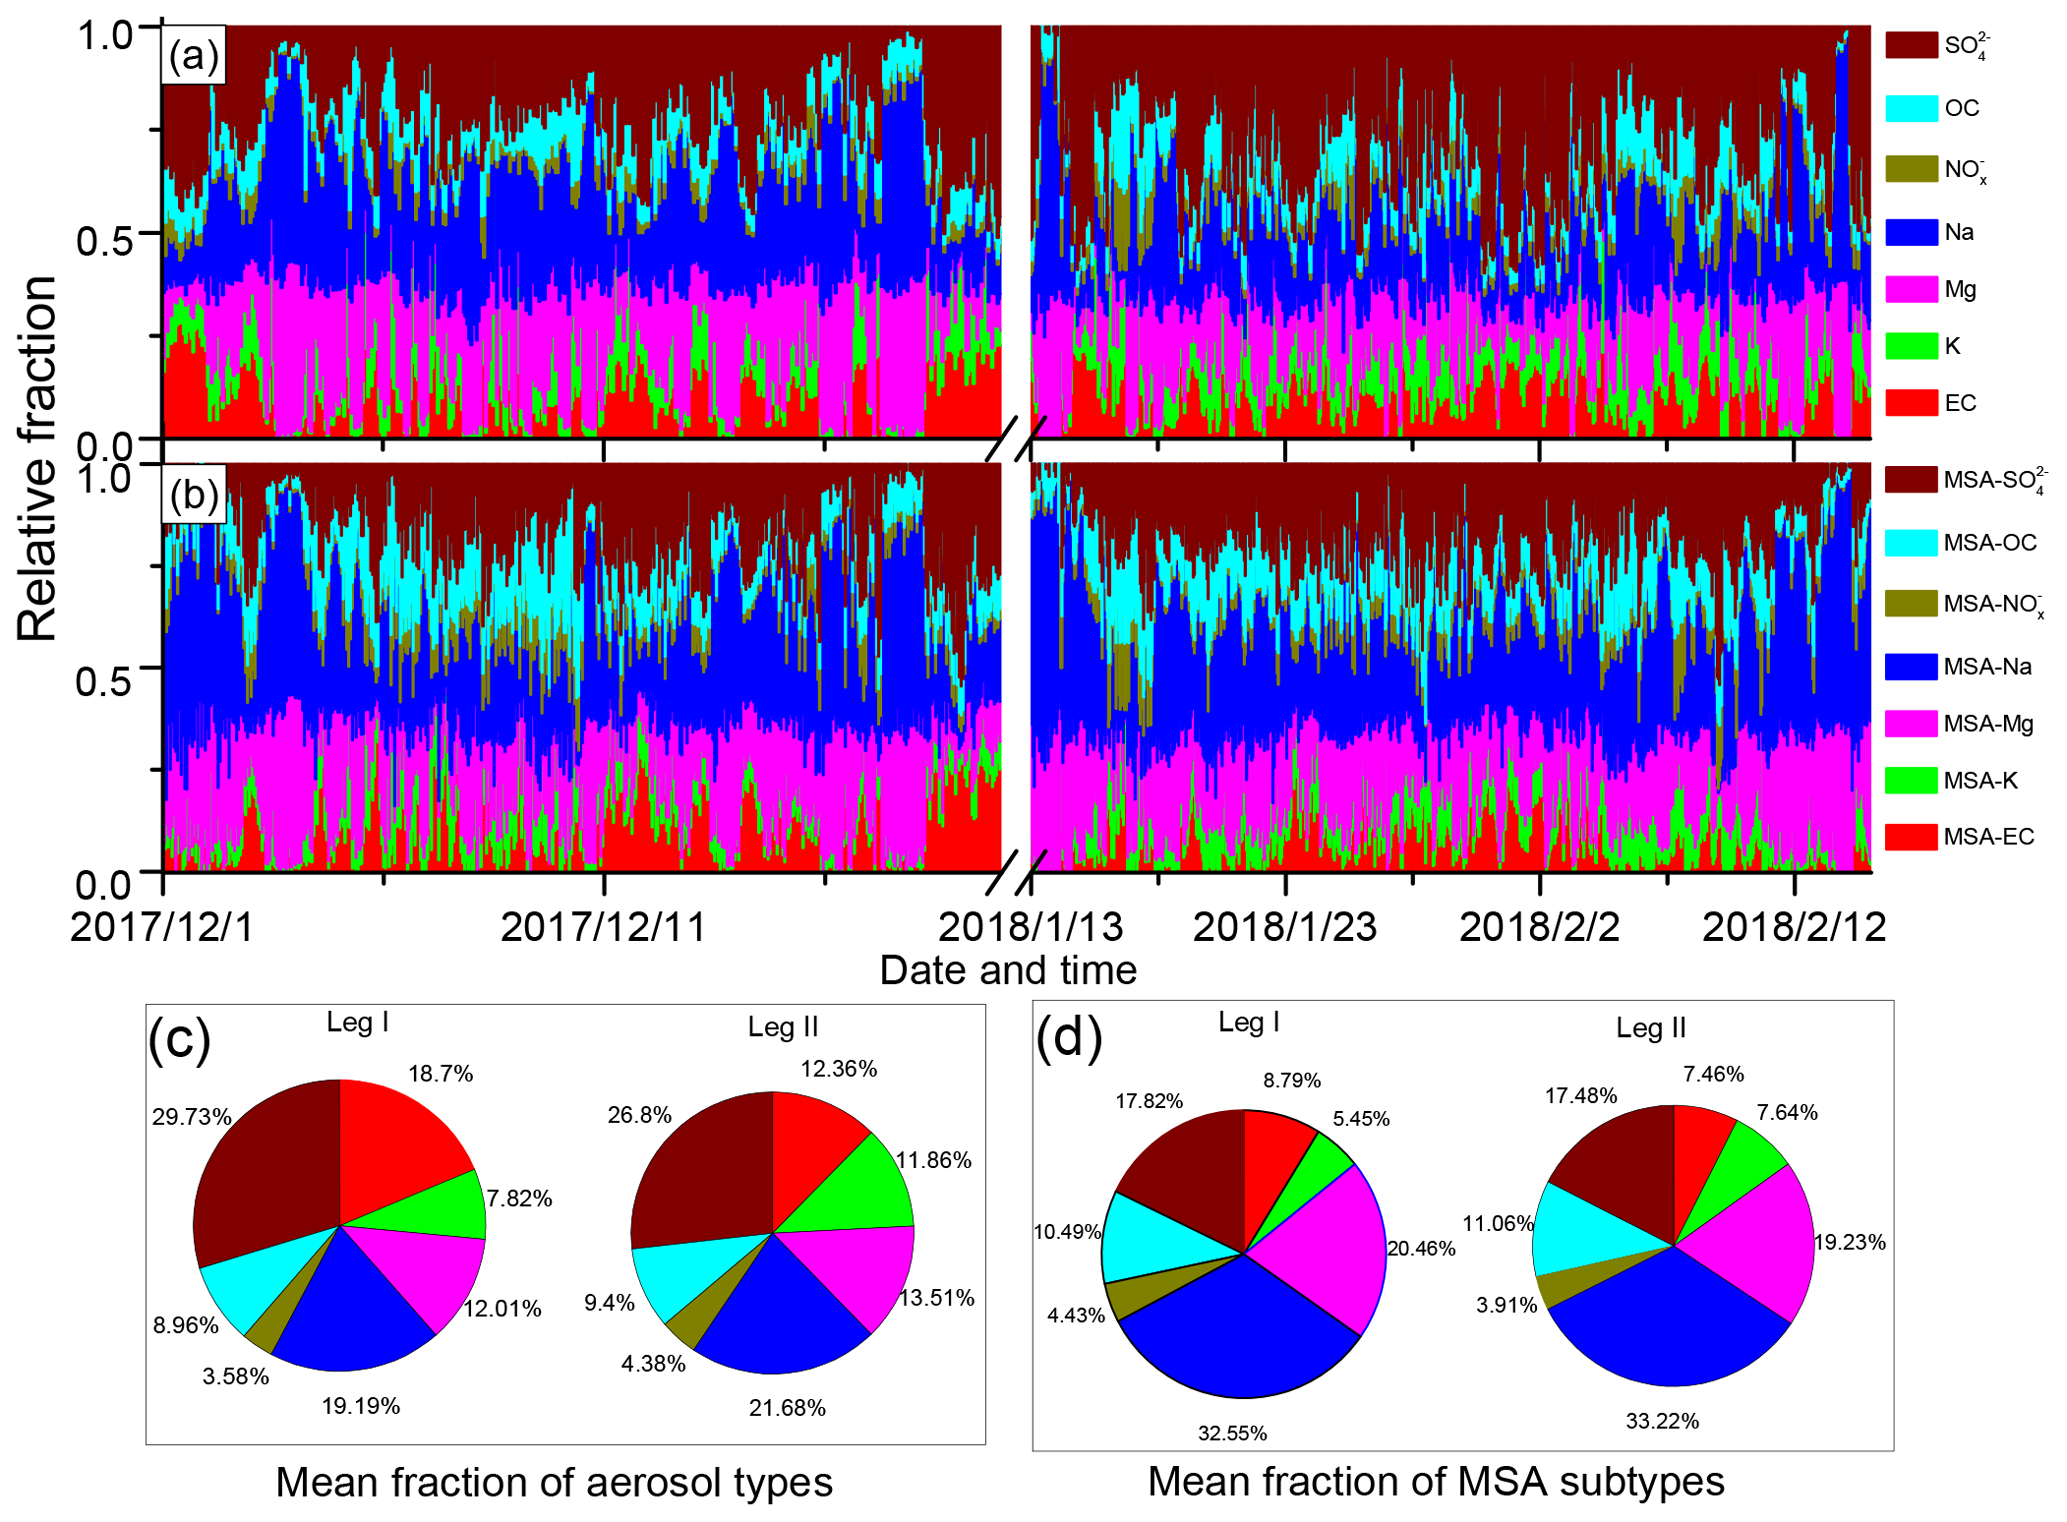
Figure 4Relative fractions of different particle types during leg I and leg II. (a) Relative fractions of different particle types; (b) relative fractions of MSA subtype particles; (c) average fractions of different particle types during leg I and leg II; and (d) average fractions of MSA subtype particles during leg I and leg II.
3.4 Uptake characteristics of MSA on existing particles
In this study, Na, Mg, and were the most abundant particles (Fig. 4a). Similar to Na, Mg, and , MSA-Na, MSA-Mg, and MSA- particles were also the three most abundant MSA particles (Fig. 4b), accounting for more than 70 % of the total MSA particles. It indicates that the uptake of MSA was associated with the particle population. However, was the most abundant particle type of the total aerosol particles, while MSA- was not the most abundant MSA particle type in the atmosphere. This indicates that particle population was not the only impact factor for the uptake of MSA.
The average fractions of the MSA subtype particles differed considerably from the average fractions of their corresponding particle types (Fig. 4c and d). particles accounted for 26.8 % of the total particles (Fig. 4c). However, MSA- particles accounted for only about 17.8 % of the total MSA particles (Fig. 4d). Similarly, the relative abundances of MSA-EC and MSA-K with respect to total MSA particles were lower than those of EC and K with respect to the total particles. In contrast, MSA-Na particles were the most abundant MSA particles, accounting for more than 32.55 % of the total MSA particles (Fig. 4d), while Na particles accounted for only 21.68 % of the total particles (Fig. 4c). Similar patterns were observed for Mg and OC particles. MSA-Mg and MSA-OC particles were more abundant in the MSA particles than Mg and OC particles in the total particles (Fig. 4d). These results indicate that the uptake of MSA on Na and Mg particles were more effective than the uptake of MSA on EC and particles. Note that observations during leg I and leg II were conducted under different circumstances, as high concentrations of sea ice were present during leg I (Fig. S2a) but sea-ice-free conditions occur during leg II (Fig. S2b). Despite different conditions being present during leg I and leg II, the relative fractions of MSA subtype particles remain similar, confirming that the uptake selectivity of MSA occurred on different particles.
As discussed above, relative factions of MSA subtype particles were different from their corresponding particles. The contributions of MSA-Na and MSA-Mg to the total MSA particles were improved significantly, while the contribution of MSA- declined. Figure S8 illustrates the mean fractions of MSA subtype particles to the total particle population. Similar mean fractions of MSA subtype particles during leg I and leg II revealed that the uptake of MSA was affected by the particle chemical properties. Note that particle size also affects the uptake of MSA on fine particles. To clarify the uptake properties of MSA on different size particles, the size distributions of MSA particles (0.1–2.0 µm) and size-resolved MSA subtype particles during leg I and leg II were also analyzed in this study. Although particles smaller than 0.1 µm were not detected by SPAMS in this study, most of the MSA particles are in the range of 0.1 to 1.0 µm in the marine atmosphere (Ayers et al., 1997), indicating that the MSA particles measured in this study represent most of the MSA particles in the marine atmosphere.
The size of the total particles shows an unimodal distribution, with a mean diameter of 0.51 µm, during leg I and leg II (Fig. 5a). Most of the particles were 0.3–1.0 µm, consistent with particle sizes observed in Antarctica using SMPS (scanning mobility particle sizer) (Pant et al., 2011) and with sea spray aerosol sizes measured in marine regions (Quinn et al., 2017). Compared with the mean size of the total particles, MSA particles were larger in this study, with a mean diameter of 0.65 µm (Fig. 5a). This suggests that particles were enlarged when MSA uptake occurred on their surfaces. Although particles were enlarged by MSA uptake, submicron MSA particles contributed to more than 90 % of the total MSA particles (Fig. 5b), indicating that most of the MSA particles were still in the submicron range, consistent with observation results in coastal Antarctica (Legrand et al., 1998) and the Pacific Ocean (Jung et al., 2014).
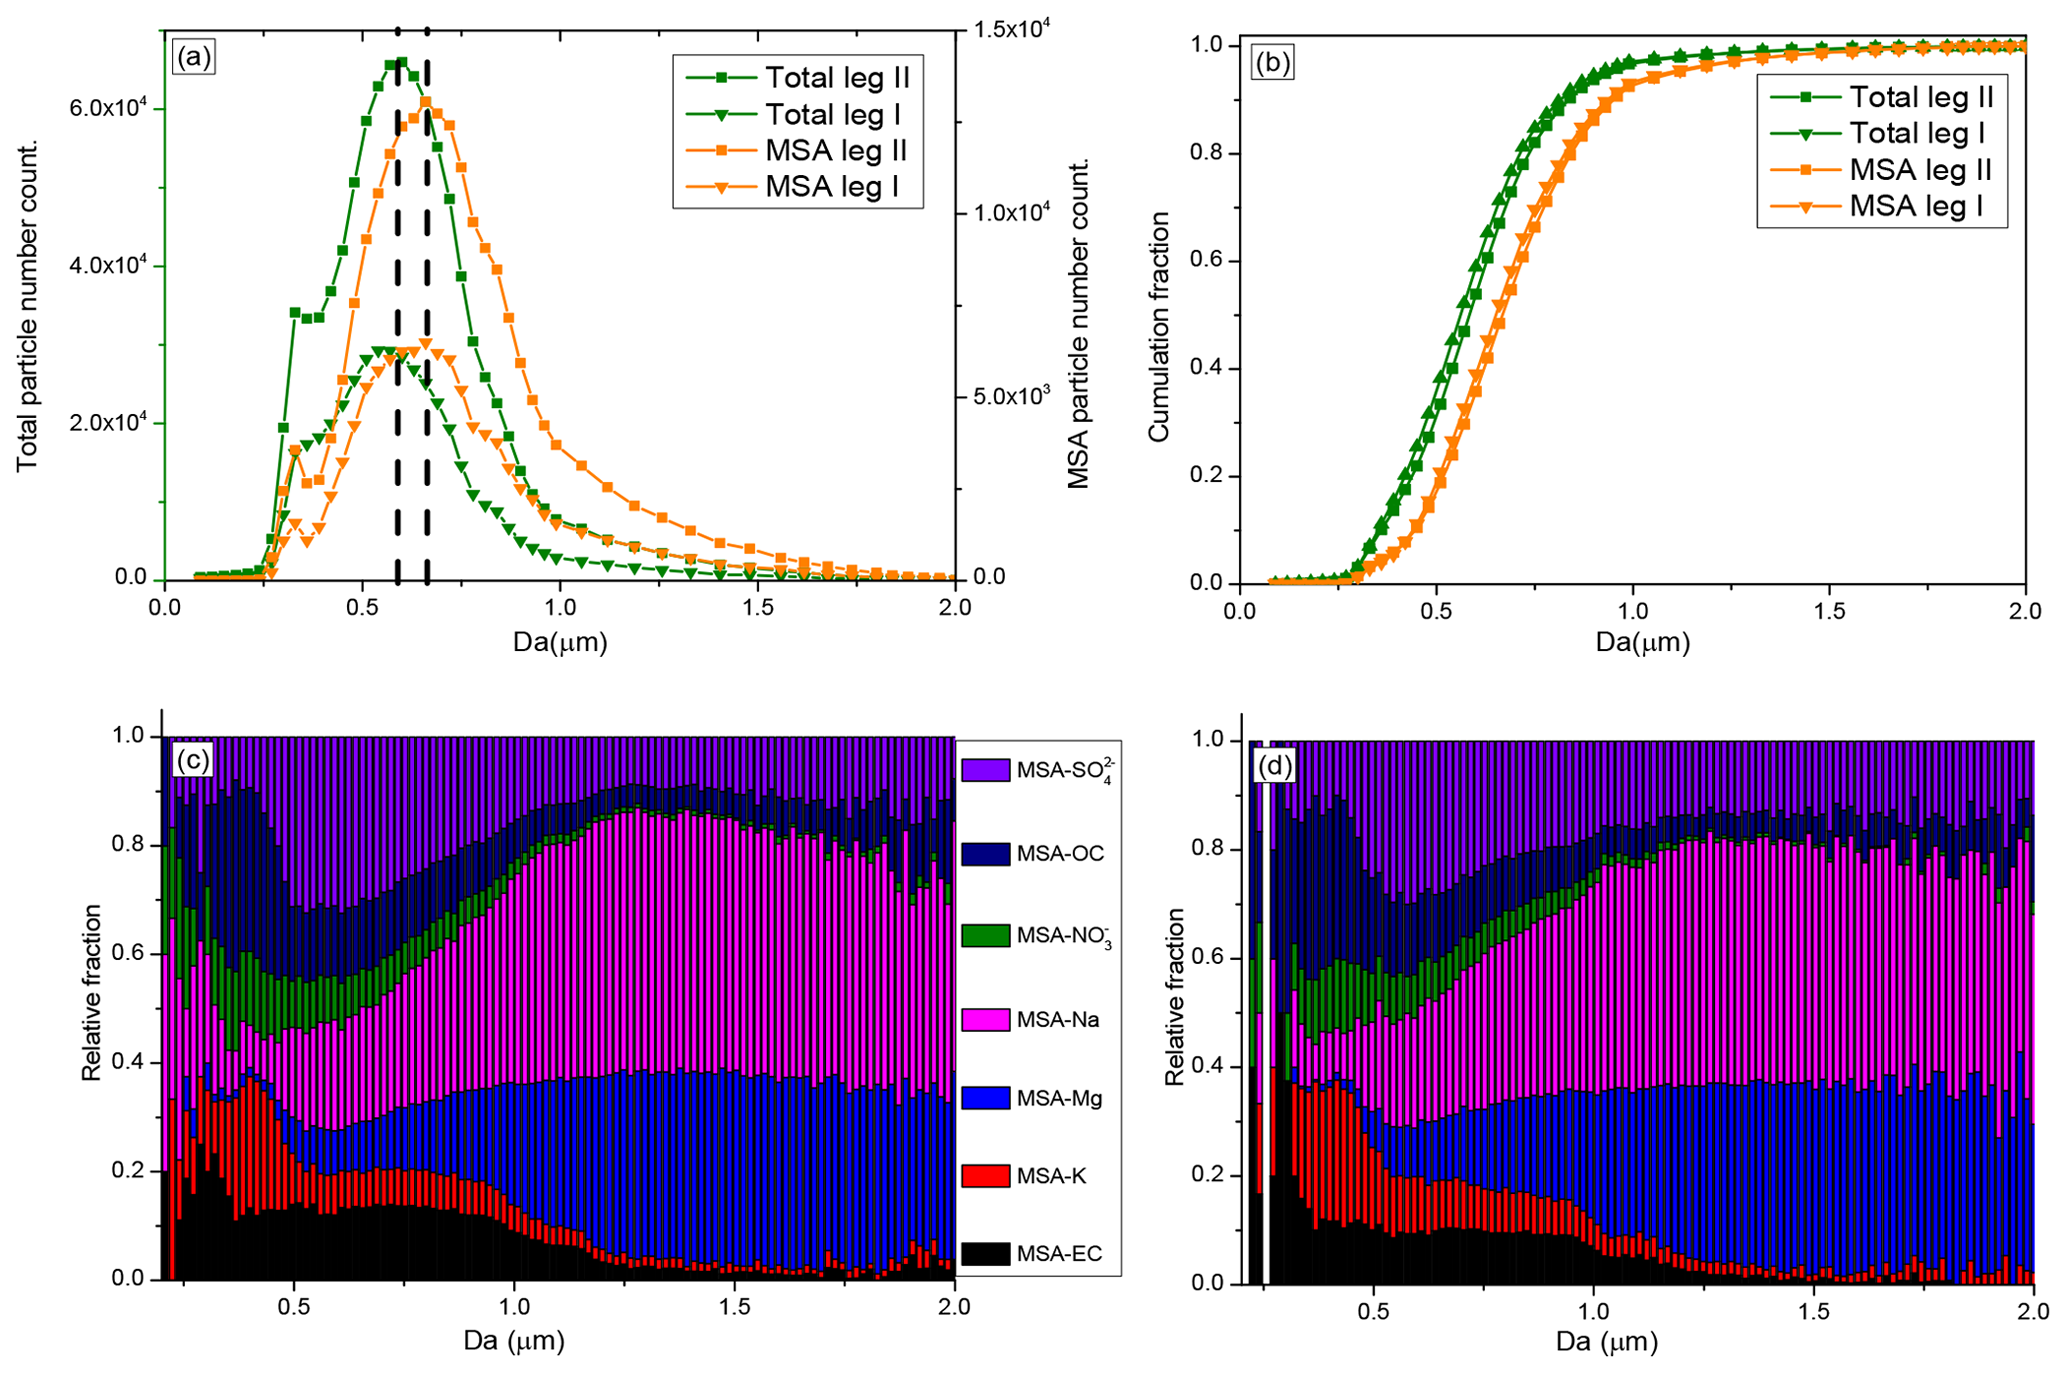
Figure 5Size distributions of MSA particles and size-resolved MSA subtype particles during the cruise; (a) size distributions of MSA particles and total particles; (b) cumulative size distributions of MSA and total particles; (c) size-resolved MSA subtype particles during leg I; and (d) size-resolved MSA subtype particles during leg II.
The size-resolved MSA subtype particles by population fraction during leg I and leg II are also given in this study. MSA-EC, MSA-K, and MSA- particles were primarily distributed in the small size (< 1 µm) (Fig. 5c). In contrast, high relative fractions of MSA-Na and MSA-Mg particles were present in large particles (> 1 µm), accounting for more than 75 % of the total coarse particles (1.0–2.0 µm) (Fig. 5c). The relative fractions of MSA- particles did not change significantly as the particle size increases, mainly due to the variety of sources of this type of particle. particles are mainly derived from sea salt particles and the oxidation of DMS in the marine atmosphere. Sea salt particles have a wide size distribution, ranging from 0.01 to 8 µm (Clarke et al., 2006), which are found in the submicron size (De Leeuw et al., 2011, and Prather et al., 2013) and coarse size (Norris et al., 2013) ranges. But particles generated from the oxidation of DMS are mainly distributed in the submicron range (Legrand et al., 1998).
The MSA particle and total particle populations during leg II were much higher than during leg I (Fig. 5a), and seasonal conditions were different between leg I and leg II (Fig. S2). The size-resolved MSA subtype particles identified during leg II were very similar with the size-resolved MSA subtype particles identified during leg I (Fig. 5c and d), confirming the stable MSA uptake properties on different particles.
3.5 The uptake rate of MSA on different particles
The uptake of MSA on the existing particles has been investigated; however, the pressing question is how different aerosol properties impact the uptake rate of MSA. Figure 6 shows the uptake rate of MSA (defined as the ratio of MSA-containing particles to the corresponding particles, such as MSA-Na to Na ratio) on different particles in the marine atmosphere. The formation of particulate MSA includes two routes: the reactive uptake of DMS on existing aerosols and the conversion of gaseous MSA to particulate MSA by condensation on existing particles (Read et al., 2008). High uptake rates of MSA-Na and MSA-Mg particles were observed in Na and Mg particles, accounting for 0.43±0.21 and 0.41±0.20 of the total Na and Mg particles, respectively (Fig. 6). There are two reasons for the effective uptake of MSA on Na and Mg particles. Firstly, Na and Mg particles are mainly derived from sea salt particles, which are often alkaline. Previous studies have shown that alkaline sea salt particles are favored to absorb acidic atmospheric gases, promoting the formation of acidic compounds on sea salt particles (Laskin et al., 2003). As an acidic species, MSA is easily absorbed by sea salt particles to form particulate MSA. Secondly, the presence of halogen radicals on sea salt particle surfaces also enhances the oxidative reactive uptake of DMS on those particles to form particulate MSA (Read et al., 2008).
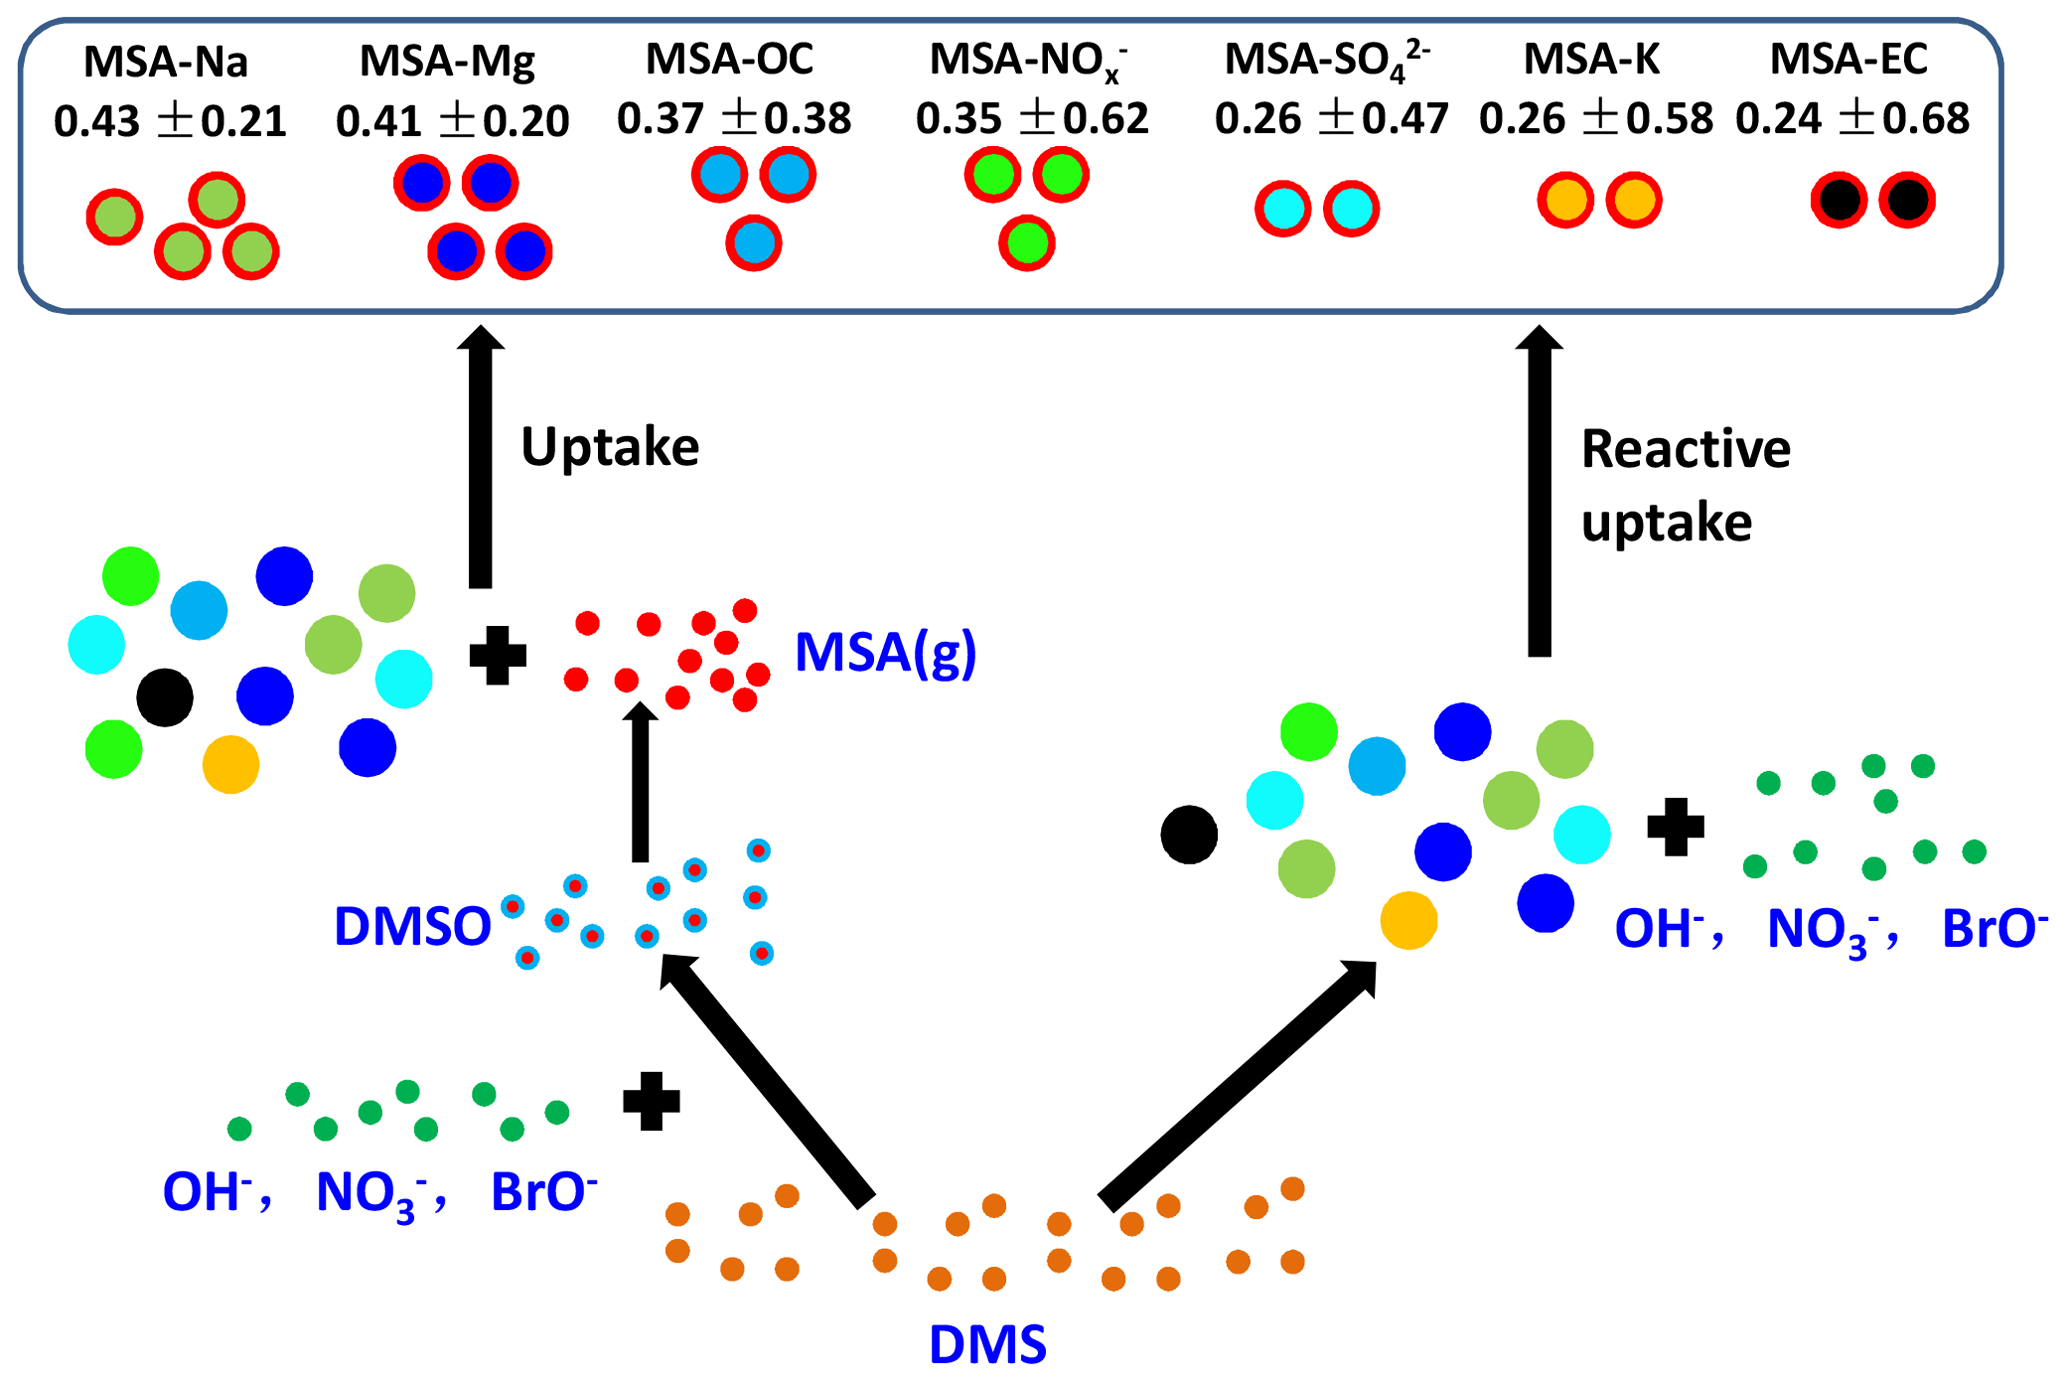
A low uptake rate (0.24±0.68) of MSA-EC particles was observed in this study (Fig. 6). Generally, EC particles are highly hydrophobic, which suppresses the uptake of MSA on these particles, as DMS reactive uptake often occurs through aqueous reactions (Bardouki et al., 2003). The relative fraction of particles was much higher than that of EC particles (Fig. 4c). However, the uptake rate of MSA- particles (0.26±0.47) was similar with that of MSA-EC particles (Fig. 6), indicating that particle population was not the major factor affecting MSA uptake rate. The uptake rate of MSA on existing particles is significantly dependent on particle characteristics. As particles are often acidic, MSA uptake by this type of particle is restricted. For this reason, even though particle population was much higher than Na particle population, the uptake rate of MSA- particles was much lower than that of MSA-Na particles (Fig. 6).
The uptake rates of MSA-OC and MSA- particles were 0.37±0.38 and 0.35±0.62, respectively (Fig. 6). This is consistent with the relative abundances of MSA-OC and MSA- particles and the corresponding OC and particles (Fig. 4). It indicates that the uptake rates of MSA on existing particles were determined by the aerosol properties and alkaline sea salt particles enhanced the uptake of MSA, while acidic and hydrophobic species suppressed the uptake of MSA on these particles.
The uptake characteristics of MSA on different aerosols were examined during early December 2017 and January–February 2018 in the polynya regions of the RS, Antarctica. Particulate MSA mass concentration, as well as particle populations and size distributions, were determined simultaneously for the first time to characterize the formation of MSA on different particles. To access the interactions between MSA and other species, MSA particles were classified into seven subtypes using the ART-2a algorithm: MSA-Na, MSA-Mg, MSA-, MSA-K, MSA-EC, MSA-OC, and MSA-.
MSA mass concentration did not always reflect MSA particle population in the marine atmosphere. The MSA uptake that occurred on aerosol surfaces alters the aerosol size and chemical compositions, but it did not change the aerosol population. The MSA particle population was mainly associated with the total particle population, as more particles implies a greater opportunity for MSA uptake. High MSA mass concentrations with low MSA populations occurred when a low existing particle population with high MSA production from the oxidation of DMS were present.
The uptake of MSA on existing particles was mainly dependent on aerosol properties. Alkaline sea salt particles enhanced the uptake of MSA, as high uptake rates of MSA-Na and MSA-Mg particles were observed in the Na and Mg particles, accounting for 0.43±0.21 and 0.41±0.20 of the total Na and Mg particles, respectively. But acidic and hydrophobic species suppressed the uptake of MSA on these particles, as only 0.24±0.68 and 0.26±0.47 of MSA-EC and MSA- were present in the total EC and particles. The results extend the knowledge of the impact of aerosol properties on the conversion of MSA in the marine atmosphere; however, the details of the formation of MSA are complicated and still controversial. Observations and especially simulation experiments in the laboratory are required in the future to clarify the formation of MSA and their impact factors in the marine atmosphere.
The data used in the figures; the time series of the cruise tracks; MSA mass concentrations and particle mass concentrations obtained from the IGAC; MSA particle population, size distributions, and mass spectra obtained from the SPAMS; and wind speeds and directions, temperature, and RH are available at https://doi.org/10.5281/zenodo.3614694 (Yan, 2020). Codes for the analysis are available from Jinpei Yan upon request.
The supplement related to this article is available online at: https://doi.org/10.5194/acp-20-3259-2020-supplement.
JY conducted the observations, analyzed the results, and wrote the paper. JJ contributed to the data analyses and paper writing. MZ conducted the onboard observations. FB and YT contributed to refining the ideas and contributed considerably to the interpretation of the results. SX and SZ applied the calculations of sea ice distribution and metrological data. QL and LL contributed to the observation data analyses. LC and JY were together responsible for the design of the study. All authors were involved in discussing the results and improved the paper by proofreading.
The authors declare that they have no conflict of interest.
The authors gratefully acknowledge Guangzhou Hexin Analytical Instrument Company Limited for the SPAMS data analysis and onboard observation technical assistance. They also thank Machine Shop Fortelice International Company Limited (Taiwan) for the IGAC technical assistance and data analysis. We would like to thank Meijiao Pang for the SPAMS onboard maintenance during the cruise.
This research has been supported by the Qingdao National Laboratory for marine science and technology (grant no. QNLM2016ORP0109), the Natural Science Foundation of Fujian Province, China (grant no. 2019J01120), the National Natural Science Foundation of China (grant no. 41941014), and grants from the Korea Polar Research Institute (KOPRI) (grant no. PE20140).
This paper was edited by Annele Virtanen and reviewed by three anonymous referees.
Adachi, K. and Buseck, P. R.: Changes in shape and composition of sea-salt particles upon aging in an urban atmosphere, Atmos. Environ., 100, 1–9, 2015.
Allen, J. O.: YAADA: Software Toolkit to Analyze Single-Particle Mass Spectral Data, available at: http://www.yaada.org (last access: 22 March 2019), 2005.
Ayers, G. P., Cainey, J. M., Gillett, R. W., and Ivey, J. P.: Atmospheric sulphur and cloud condensation nuclei in marine air in the Southern Hemisphere, Philos. T. R. Soc. B, 352, 203–211, 1997.
Barnes, I. and Hjorth, J.: Mihalopoulos, N. Dimethyl sulfide and dimethyl sulfoxide and their oxidation in the atmosphere, Chem. Rev., 106, 940–975, 2006.
Bardouki, H., Berresheim, H., Vrekoussis, M., Sciare, J., Kouvarakis, G., Oikonomou, K., Schneider, J., and Mihalopoulos, N.: Gaseous (DMS, MSA, SO2, H2SO4 and DMSO) and particulate (sulfate and methanesulfonate) sulfur species over the northeastern coast of Crete, Atmos. Chem. Phys., 3, 1871–1886, https://doi.org/10.5194/acp-3-1871-2003, 2003.
Bates, T. S., Calhoum, J. A., and Quinn, P. K.: Variations in the methane sulphonate to sulphate molar ratio in submicrometer marine aerosol particles over the South Pacific Ocean, J. Geophys. Res., 97, 9859–9865, 1992.
Bork, N., Elm, J., Olenius, T., and Vehkamäki, H.: Methane sulfonic acid-enhanced formation of molecular clusters of sulfuric acid and dimethyl amine, Atmos. Chem. Phys., 14, 12023–12030, https://doi.org/10.5194/acp-14-12023-2014, 2014.
Casillas-Ituarte, N. N., Callahan, K. M., Tang, C. Y., Chen, X., and Roeselova, M.: Surface organization of aqueous MgCl2 and application to atmospheric marine aerosol chemistry, P. Natl. Acad. Sci. USA, 107, 6616–6621, 2010.
Cavalieri, D. J. and Parkinson, C. L.: 30-Year satellite record reveals contrasting Arctic and Antarctic decadal sea ice variability, Geophys. Res. Lett., 30, CRY 4-1, https://doi.org/10.1029/2003GL018031, 2003.
Chang, R. Y.-W., Sjostedt, S. J., Pierce, J. R., Papakyriakou, T. N., Scarratt, M. G., Michaud, S., Levasseur, M., Leaitch, W. R., and Abbatt, J.: Relating atmospheric and oceanic DMS levels to particle nucleation events in the Canadian Arctic, J. Geophys. Res., 116, D00S03, https://doi.org/10.1029/2011JD015926, 2011.
Chen, L., Wang, J., Gao, Y., Xu, G., Yang, X., Lin, Q., and Zhang, Y.: Latitudinal distributions of atmospheric MSA and MSA/nss-SO42-ratios in summer over the high latitude regions of the Southern and Northern Hemispheres, J. Geophys. Res., 117, D10306, https://doi.org/10.1029/2011JD016559, 2012.
Clarke, A. D., Owens, S. R., and Zhou, J.: An ultrafine sea-salt flux from breaking waves: implications for cloud condensation nuclei in the remote marine atmosphere, J. Geophys. Res., 111, D06202, https://doi.org/10.1029/2005JD006565, 2006.
Davis, D., Chen, G., Kasibhatla, P., Jefferson, A., Tanner, D., Eisele, F., Lenschow, D., Neff, W., and Berresheim, H.: DMS oxidation in the Antarctic marine boundary layer: Comparison of model simulations and field observations of DMS, DMSO, DMSO2, H2SO4(g,), MSA(g), and MSA(p), J. Geophys. Res., 103, 1657–1678, 1998.
De Baar, H. J., De Jong, J. T., Bakker, D. C., Löscher, B. M., Veth, C., Bathmann, U., and Smetacek, V.: Importance of iron for plankton blooms and carbon dioxide drawdown in the Southern Ocean, Nature, 373, 412–415, 1995.
De Leeuw, G., Andreas, E. L, Anguelova, M. D., Fairall, C. W., Lewis, E. R., O'Dowd, C., Schulz, M., and Schwartz, S. E.: Production flux of sea spray aerosol, Rev. Geophys., 49, RG2001, https://doi.org/10.1029/2010RG000349, 2011.
Gaston, C. J., Furutani, H., Guazzotti, S. A., Coffee, K. R., Bates, T. S., Quinn, P. K., Aluwihare, L. I. Mitchell, B. G., and Prather, K.: Unique ocean-derived particles serve as a proxy for changed in ocean chemistry, J. Geophys. Res., 116, D18310, https://doi.org/10.1029/2010JD015289, 2011
Ghahremaninezhad, R., Norman, A.-L., Abbatt, J. P. D., Levasseur, M., and Thomas, J. L.: Biogenic, anthropogenic and sea salt sulfate size-segregated aerosols in the Arctic summer, Atmos. Chem. Phys., 16, 5191–5202, https://doi.org/10.5194/acp-16-5191-2016, 2016.
Guazzotti, S. A., Coffee, K. R., and Prather K. A.: Continuous measurements of size-resolved particle chemistry during INDOEX Intensive Field Phase 99, J. Geophys. Res., 106, 28607–28627, https://doi.org/10.1029/2001JD900099, 2001.
Hayashida, H., Steiner, N., Monahan, A., Galindo, V., Lizotte, M., and Levasseur, M.: Implications of sea-ice biogeochemistry for oceanic production and emissions of dimethyl sulfide in the Arctic, Biogeosciences, 14, 3129–3155, https://doi.org/10.5194/bg-14-3129-2017, 2017.
Healy, R. M., Hellebust, S., Kourtchev, I., Allanic, A., O'Connor, I. P., Bell, J. M., Healy, D. A., Sodeau, J. R., and Wenger, J. C.: Source apportionment of PM2.5 in Cork Harbour, Ireland using a combination of single particle mass spectrometry and quantitative semi-continuous measurements, Atmos. Chem. Phys., 10, 9593–9613, https://doi.org/10.5194/acp-10-9593-2010, 2010.
Horne, J. R., Zhu, S., Montoya-Aguilera, J., Hinks, M. L., Wingen, L. M., Nizkorodov, S. A., and Dabdub, D.: Reactive uptake of ammonia by secondary organic aerosols: Implications for air quality, Atmos. Environ., 189, 1–8, 2018.
Jung, J., Furutani, H., Uematsu, M., and Park, J.: Distributions of atmospheric non-sea-salt sulfate and methanesulfonic acid over the Pacific Ocean between 48∘ N and 55∘ S during summer, Atmos. Environ., 99, 374–384, 2014.
Kloster, S., Feichter, J., Maier-Reimer, E., Six, K. D., Stier, P., and Wetzel, P.: DMS cycle in the marine ocean-atmosphere system – a global model study, Biogeosciences, 3, 29–51, https://doi.org/10.5194/bg-3-29-2006, 2006.
Laskin, A., Gaspar, D. J., Wang, W., Hunt, S. W., Cowin, J. P., Colson, S. D., and Finlayson-Pitts, B. J.: Reactions at interfaces as a source of sulfate formation in sea-salt particles, Science, 301, 340–344, 2003.
Legrand, M. and Pasteur, E. C.: Methane sulfonic acid to non-sea-salt sulfate ratio in coastal Antarctic aerosol and surface snow, J. Geophys. Res., 103, 10991–11006, 1998.
Li, L., Huang, Z., Dong, J., Li, M., Gao, W., Nian, H., Fu, Z., Zhang, G., Bi, X., Cheng, P., and Zhou, Z.: Real time bipolar time-of-flight mass spectrometer for analyzing single aerosol particles, Int. J. Mass Spectrom., 303, 118–124, 2011.
Li, L., Li, M., Huang, Z. X., Gao, W., Nian, H. Q., Fu, Z., Gao, J., Chai, F. H., and Zhou, Z.: Ambient particle characterization by single particle aerosol mass spectrometry in an urban area of Beijing, Atmos. Environ., 94, 323–331, 2014.
Liu, M., Song, Y., Zhou, T., Xu, Z., Yan, C., Zheng, M., Wu, Z., Hu, M., Wu, Y., and Zhu, T.: Fine particle pH during severe haze episodes in northern China, Geophys. Res. Lett., 44, 5213–5221, 2017.
Lizotte, M. P.: The Contributions of Sea Ice Algae to Antarctic Marine Primary Production, Am. Zool., 41, 57–73, 2001.
Loose, B., Miller, L. A., Elliott, S., and Papakyriakou, T.: Sea ice biogeochemistry and material transport across the frozen interface, Oceanography, 24, 202–218, 2011.
Mazzera, D. M., Lowenthal, D. H., Chow, J. C., and Watson, J. G.: Sources of PM10 and sulfate aerosol at McMurdo Station, Antarctica, Chemosphere, 45, 347–356, 2001.
Minikin, A., Legrand, M., Hall, J., Wagenbach, D., Kleefeld, C., Wolff, E., Pasteur, E. C., and Ducroz, F.: Sulfur-containing species (sulfate and methanesulfonate) in coastal Antarctic aerosol and precipitation, J. Geophys. Res., 103, 10975–10990, 1998.
Murphy, S. M., Agrawal, H., Sorooshian, A., Padró, L. T., Gates, H., and Hersey, S.: Comprehensive simultaneous shipboard and airborne characterization of exhaust from a modern container ship at sea, Environ. Sci. Technol., 43, 4626–4640, 2009.
Norris, S. J., Brooks, I. M., Moat, B. I., Yelland, M. J., de Leeuw, G., Pascal, R. W., and Brooks, B.: Near-surface measurements of sea spray aerosol production over whitecaps in the open ocean, Ocean Sci., 9, 133–145, https://doi.org/10.5194/os-9-133-2013, 2013.
Pant, V., Siingh, D., and Kamra, A. K.: Size distribution of atmospheric aerosols at Maitri, Antarctica, Atmos. Environ., 45, 5138–5149, 2011.
Prather, K. A., Bertram, T. H., Grassian, V. H., Deane, G. B., Stokes, M. D., DeMott, P. J., Aluwihare, L. I., Palenik, B. P., Azam, F. Seinfeld, J. H., Moffet, R. C., Molina, M. J., Cappa, C. D., Geiger, F. M., Roberts, G. C., Russell, L. M., Ault, A. P., Baltrusaitis, J., Collins, D. B., Corrigan, C. E., Cuadra-Rodriguez, L. A., Ebben, C. J., Forestieri, S. D., Guasco, T. L., Hersey, S. P., Kim, M. J., Lambert, W. F., Modini, R. L., Mui, W., Pedler, B. E., Ruppel, M. J., Ryder, O. S., Schoepp, N. G., Sullivan, R. C., and Zhao, D.: Bringing the ocean into the laboratory to probe the chemical complexity of sea spray aerosol, P. Natl. Acad. Sci. USA, 110, 7550–7555, 2013.
Preunkert, S., Legrand, M., Jourdain, B., Moulin, C., Belviso, S., Kasamatsu, N., Fukuchi, M., and Hirawake, T.: Interannual variability of dimethylsulfide in air and seawater and its atmospheric oxidation by-products (methanesulfonate and sulphate) at Dumont d'Urville, coastal Antarctica (1999–2003), J. Geophys. Res., 112, D06306, https://doi.org/10.1029/2006JD007585, 2007.
Preunkert, S., Jourdain, B., Legrand, M., Udisti, R., Becagli, S., and Cerri, O.: Seasonality of sulfur species (dimethyl sulfide, sulfate, and methanesulfonate) in Antarctica: Inland versus coastal regions, J. Geophys. Res., 113, D15302, https://doi.org/10.1029/2008JD009937, 2008.
Quinn, P. K., Bates, T. S., Schulz, K. S., Coffman, D. J., Frossard, A. A., Russell, L. M., Keene, W. C., and Kieber, D. J.: Contribution of sea surface carbon pool to organic matter enrichment in sea spry aerosol, Nat. Geosci., 7, 228–232, 2014.
Quinn, P. K., Coffman, D. J., Johnson, J. E., Upchurch, L. M., and Bates, T. S.: Small fraction of marine cloud condensation nuclei made up of sea spray aerosol, Nat. Geosci., 10, 674–679, https://doi.org/10.1038/NGEO3003, 2017.
Read, K. A., Lewis, A. C., Bauguitte, S., Rankin, A. M., Salmon, R. A., Wolff, E. W., Saiz-Lopez, A., Bloss, W. J., Heard, D. E., Lee, J. D., and Plane, J. M. C.: DMS and MSA measurements in the Antarctic Boundary Layer: impact of BrO on MSA production, Atmos. Chem. Phys., 8, 2985–2997, https://doi.org/10.5194/acp-8-2985-2008, 2008.
Savoie, D. L., Prospero, J. M., Larsen, R. J., Huang, F., Izaguirre, M. A., Huang, T., Snowdon, T. H., Custals, L., and Sanderson, C. G.: Nitrogen and sulfur species in Antarctic aerosols at Mawson, Palmer, and Marsh (King George Island), J. Atmos. Chem., 17, 95–122, 1993.
Schlitzer, R.: Interactive analysis and visualization of geosciences data with Ocean Data view, Comput. Geosci., 28, 1211–1218, 2002.
Schlitzer, R.: Ocean Data View, available at: https://odv.awi.de/ (last access: 13 March 2020), 2015.
Song, X. H., Hopke, P. K., Fergenson, D. P., and Prather, K. A.: Classification of single particles analyzed by ATOFMS using an artificial neural network, ART-2A, Anal. Chem., 71, 860–865, 1999.
Sorooshian, A., Lu, M. L., Brechtel, F. J., Jonsson, H., Feingold, G., Flagan, R. C., and Seinfeld, J. H.: On the source of organic acid aerosol layers above clouds, Environ. Sci. Technol., 41, 4647–4654, 2007.
Spreen, G., Kaleschke, L., and Heygster, G.: Sea ice remote sensing using AMSR-E 89 GHz channels, J. Geophys. Res., 113, C02S03, https://doi.org/10.1029/2005JC003384, 2008.
Silva, P. J., Carlin, R. A., and Prather, K. A.: Single particles analysis of suspended soil dust from Southern California, Atmos. Environ., 34, 1811–1820, 2000.
Sitaras, I. E. and Siskos, P. A.: The role of primary and secondary air pollutants in atmospheric pollution: Athens urban area as a case study, Environ. Chem. Lett., 6, 59–69, 2008.
Tao, J., Zhang, Z., Tan, H., Zhang, L., Wud, Y., Sun, J., Chee, H., Cao, J., Cheng, P., Chen, L., and Zhang, R.: Observation evidence of cloud processes contributing to daytime elevated nitrate in an urban atmosphere, Atmos. Environ., 186, 209–215, 2018.
Taylor, M. H., Losch, M., and Bracher, A.: On the drivers of phytoplankton blooms in the Antarctic marginal ice zone: A modeling approach, J. Geophys. Res., 118, 63–75, 2013.
Teinila, K., Frey, A., Hillamo, R., Tulp, H. C., and Weller, R.: A study of the sea-salt chemistry using size-segregated aerosol measurements at coastal Antarctic station Neumayer, Atmos. Environ., 96, 11–19, 2014.
Tian, M., Wang, H., Chen, Y., Zhang, L., Shi, G., Liu, Y., Yu, J., Zhai, C., Wang, J., and Yang, F.: Highly time-resolved characterization of water-soluble inorganic ions in PM2.5 in a humid and acidic mega city in Sichuan Basin, China, Sci. Total Environ., 580, 224–234, 2017.
Wang, S., Bailey, D., Lindsay, K., Moore, J. K., and Holland, M.: Impact of sea ice on the marine iron cycle and phytoplankton productivity, Biogeosciences, 11, 4713–4731, https://doi.org/10.5194/bg-11-4713-2014, 2014.
Weller, R., Legrand, M., and Preunkert, S.: Size distribution and ionic composition of marine summer aerosol at the continental Antarctic site Kohnen, Atmos. Chem. Phys., 18, 2413–2430, https://doi.org/10.5194/acp-18-2413-2018, 2018.
Wolff, E.: Nitrate in polar ice, in Ice Core Studies of Global Biogeochemical Cycles, edited by: Delmas, R., Springer-Verlag, New York, 195–224, 1995.
Yan, J.: Data for “Uptake selectivity of methanesulfonic acid (MSA) on fine particles over polynya regions of the Ross Sea, Antarctica”, Zenodo, https://doi.org/10.5281/zenodo.3614694, 2020.
Yan, J., Chen, L., Lin, Q., Li, Z., Chen, H., and Zhao, S.: Chemical characteristics of submicron aerosol particles during a long-lasting haze episode in Xiamen, China, Atmos. Environ., 113, 118–126, 2015.
Yan, J., Lin, Q., Zhao, S., Chen, L., and Li, L.: Impact of marine and continental sources on aerosol characteristics using an on-board SPAMS over Southeast Sea, China, Environ. Sci. Pollut. R., 25, 30659–30670, 2018.
Young, L. H., Li, C. H., Lin, M. Y., Hwang, B. F., Hsu, H. T., Chen, Y. C., Jung, C. R., Chen, K. C., Cheng, D. H., Wang, V. S., Chiang, H. C., and Tsai, P. J.: Field performance of semi-continuous monitor for ambient PM2.5 water-soluble inorganic ions and gases at a suburban site, Atmos. Environ., 144, 376–388, 2016.
Zhang, M., Chen, L., Xu, G., Lin, Q., and Liang, M.: Linking phytoplankton activity in polynyas and sulfur aerosols over Zhongshan Station, East Antarctica, J. Atmos. Sci., 72, 4629–4642, 2015.