the Creative Commons Attribution 4.0 License.
the Creative Commons Attribution 4.0 License.
 | 18 Mar 2020
Aerosol pH and liquid water content determine when particulate matter is sensitive to ammonia and nitrate availability
Athanasios Nenes
Spyros N. Pandis
Rodney J. Weber
Armistead Russell
Nitrogen oxides (NOx) and ammonia (NH3) from anthropogenic and biogenic emissions are central contributors to particulate matter (PM) concentrations worldwide. The response of PM to changes in the emissions of both compounds is typically studied on a case-by-case basis, owing in part to the complex thermodynamic interactions of these aerosol precursors with other PM constituents. Here we present a simple but thermodynamically consistent approach that expresses the chemical domains of sensitivity of aerosol particulate matter to NH3 and HNO3 availability in terms of aerosol pH and liquid water content. From our analysis, four policy-relevant regimes emerge in terms of sensitivity: (i) NH3 sensitive, (ii) HNO3 sensitive, (iii) NH3 and HNO3 sensitive, and (iv) insensitive to NH3 or HNO3. For all regimes, the PM remains sensitive to nonvolatile precursors, such as nonvolatile cations and sulfate. When this framework is applied to ambient measurements or predictions of PM and gaseous precursors, the “chemical regime” of PM sensitivity to NH3 and HNO3 availability is directly determined. The use of these regimes allows for novel insights, and this framework is an important tool to evaluate chemical transport models. With this extended understanding, aerosol pH and associated liquid water content naturally emerge as previously ignored state parameters that drive PM formation.
- Article
(5388 KB) - Full-text XML
-
Supplement
(77 KB) - BibTeX
- EndNote


Gas-phase ammonia (NH3(g), hereafter “NH3”) is one of the most important atmospheric alkaline species and contributor to atmospheric fine particle mass (Seinfeld and Pandis, 2016). NH3 originates from nitrogen-based fertilizer, animal waste (e.g., Aneja et al., 2009), biomass burning (e.g., Behera et al., 2013), and the natural biosphere (National Academies of Sciences, Engineering, and Medicine, 2016). NH3 emissions are also linked to world food production, so these emissions are expected to increase with world population (NRC, 2016). Ammonia reacts with sulfuric and nitric acids (from SO2 and NOx oxidation) to form ammonium sulfate/bisulfate and nitrate aerosol that globally constitute an important fraction of ambient PM2.5 mass (Kanakidou et al., 2005; Sardar et al., 2005; Zhang et al., 2007). SO2 and NOx emissions are expected to decrease over time due to air quality regulations (IPCC, 2013). Combined with increasing NH3 levels (e.g., Skjøth and Geels, 2013), this may lead to changes in aerosol composition and mass concentration, with important impacts on human health (Pope III et al., 2004; Lim et al., 2012; Lelieveld et al., 2015; Cohen et al., 2017), ecosystem productivity (Fowler et al., 2013), and the climate system (Haywood and Boucher, 2000; Bellouin et al., 2011; IPCC, 2013).
The abovementioned emission trends have created the expectation that atmospheric aerosol will become significantly less acidic over time (West et al., 1999; Pinder et al., 2007, 2008; Heald et al., 2012; Tsimpidi et al., 2007; Saylor et al., 2015). Reductions in ammonium sulfate due to SO2 reductions can be balanced, at least in part, by ammonium nitrate formation (e.g., West et al., 1999; Heald et al., 2012; Karydis et al., 2016; Vasilakos et al., 2018). This behavior arises because nitrate may remain in the gas phase as HNO3 when insufficient amounts of total ammonia (i.e., gas + aerosol) or nonvolatile cations (NVCs) from dust and sea salt exist to “neutralize” aerosol sulfate (i.e., completely consume any free sulfuric acid or bisulfate salts). This conceptual model can fail, because it does not sufficiently consider the large volatility difference between deliquesced aerosol containing sulfate/NVCs and ammonium/nitrate, the last two of which are strongly modulated by aerosol acidity (pH) (Guo et al., 2015, 2017; Weber et al., 2016) and aerosol water. Modeling studies explicitly considering acidity effects may still incorrectly estimate nitrate substitution, owing to errors in emissions of nonvolatile cations (such as Na, Ca, K, and Mg) that can bias estimates of aerosol acidity and ammonium or nitrate partitioning (Vasilakos et al., 2018). A bias in our understanding of aerosol pH can reaffirm a sometimes incorrect conceptual model of aerosol nitrate formation, and fundamental reasons for prediction biases in nitrate and ammonium (i.e., errors in pH and liquid water content) are not identified, therefore inhibiting further model improvement.
Developing an understanding of when aerosol levels are sensitive to NH3 and HNO3 concentrations requires a new approach that explicitly considers aerosol pH and its effects on aerosol precursor volatility in a thermodynamically consistent way. Here we present such a framework, and demonstrate it with observational data, to understand the chemical regimes associated with aerosol sensitivity to changes in ammonia and nitrate availability.
Aerosol pH needs to be sufficiently high for aerosol nitrate formation to readily occur. Depending on the temperature and the amount of liquid water, this threshold ranges from a pH of 1.5 to 3.5 (Meskhidze et al., 2003; Guo et al., 2016, 2017; Fig. 1). If pH is high enough, almost all inorganic nitrate forming from NOx oxidation mostly resides in the aerosol phase; however, when pH is low (typically below 1.5 to 2), nitrate remains almost exclusively in the gas phase as HNO3, regardless of the amount present. Between these “high” and “low” pH values, a “sensitivity window” emerges, where partitioning shifts from nitrate being predominantly gaseous to mostly aerosol bound. When acidity is below this “pH window”, aerosol nitrate is almost nonexistent, and therefore aerosol levels are insensitive to HNO3 availability and controls aimed solely on HNO3 reduction are unimportant since none is in the aerosol phase. When the pH is above the sensitivity window, most nitrate resides in the aerosol phase, and aerosol levels directly respond to HNO3 availability. A similar situation exists for aerosol ammonium – although with an inverse dependence on pH compared to HNO3. When aerosol pH is low enough, any inorganic ammonia emitted mostly resides in the aerosol phase; when pH is high enough, most of it resides in the gas phase (Fig. 1). Based on the criteria above, one can then define characteristic levels of aerosol acidity, where aerosol becomes insensitive to NH3 (or HNO3) concentrations and vice versa. In the following sections, we quantitatively develop these concepts and formulate a new thermodynamically consistent framework of aerosol formation.
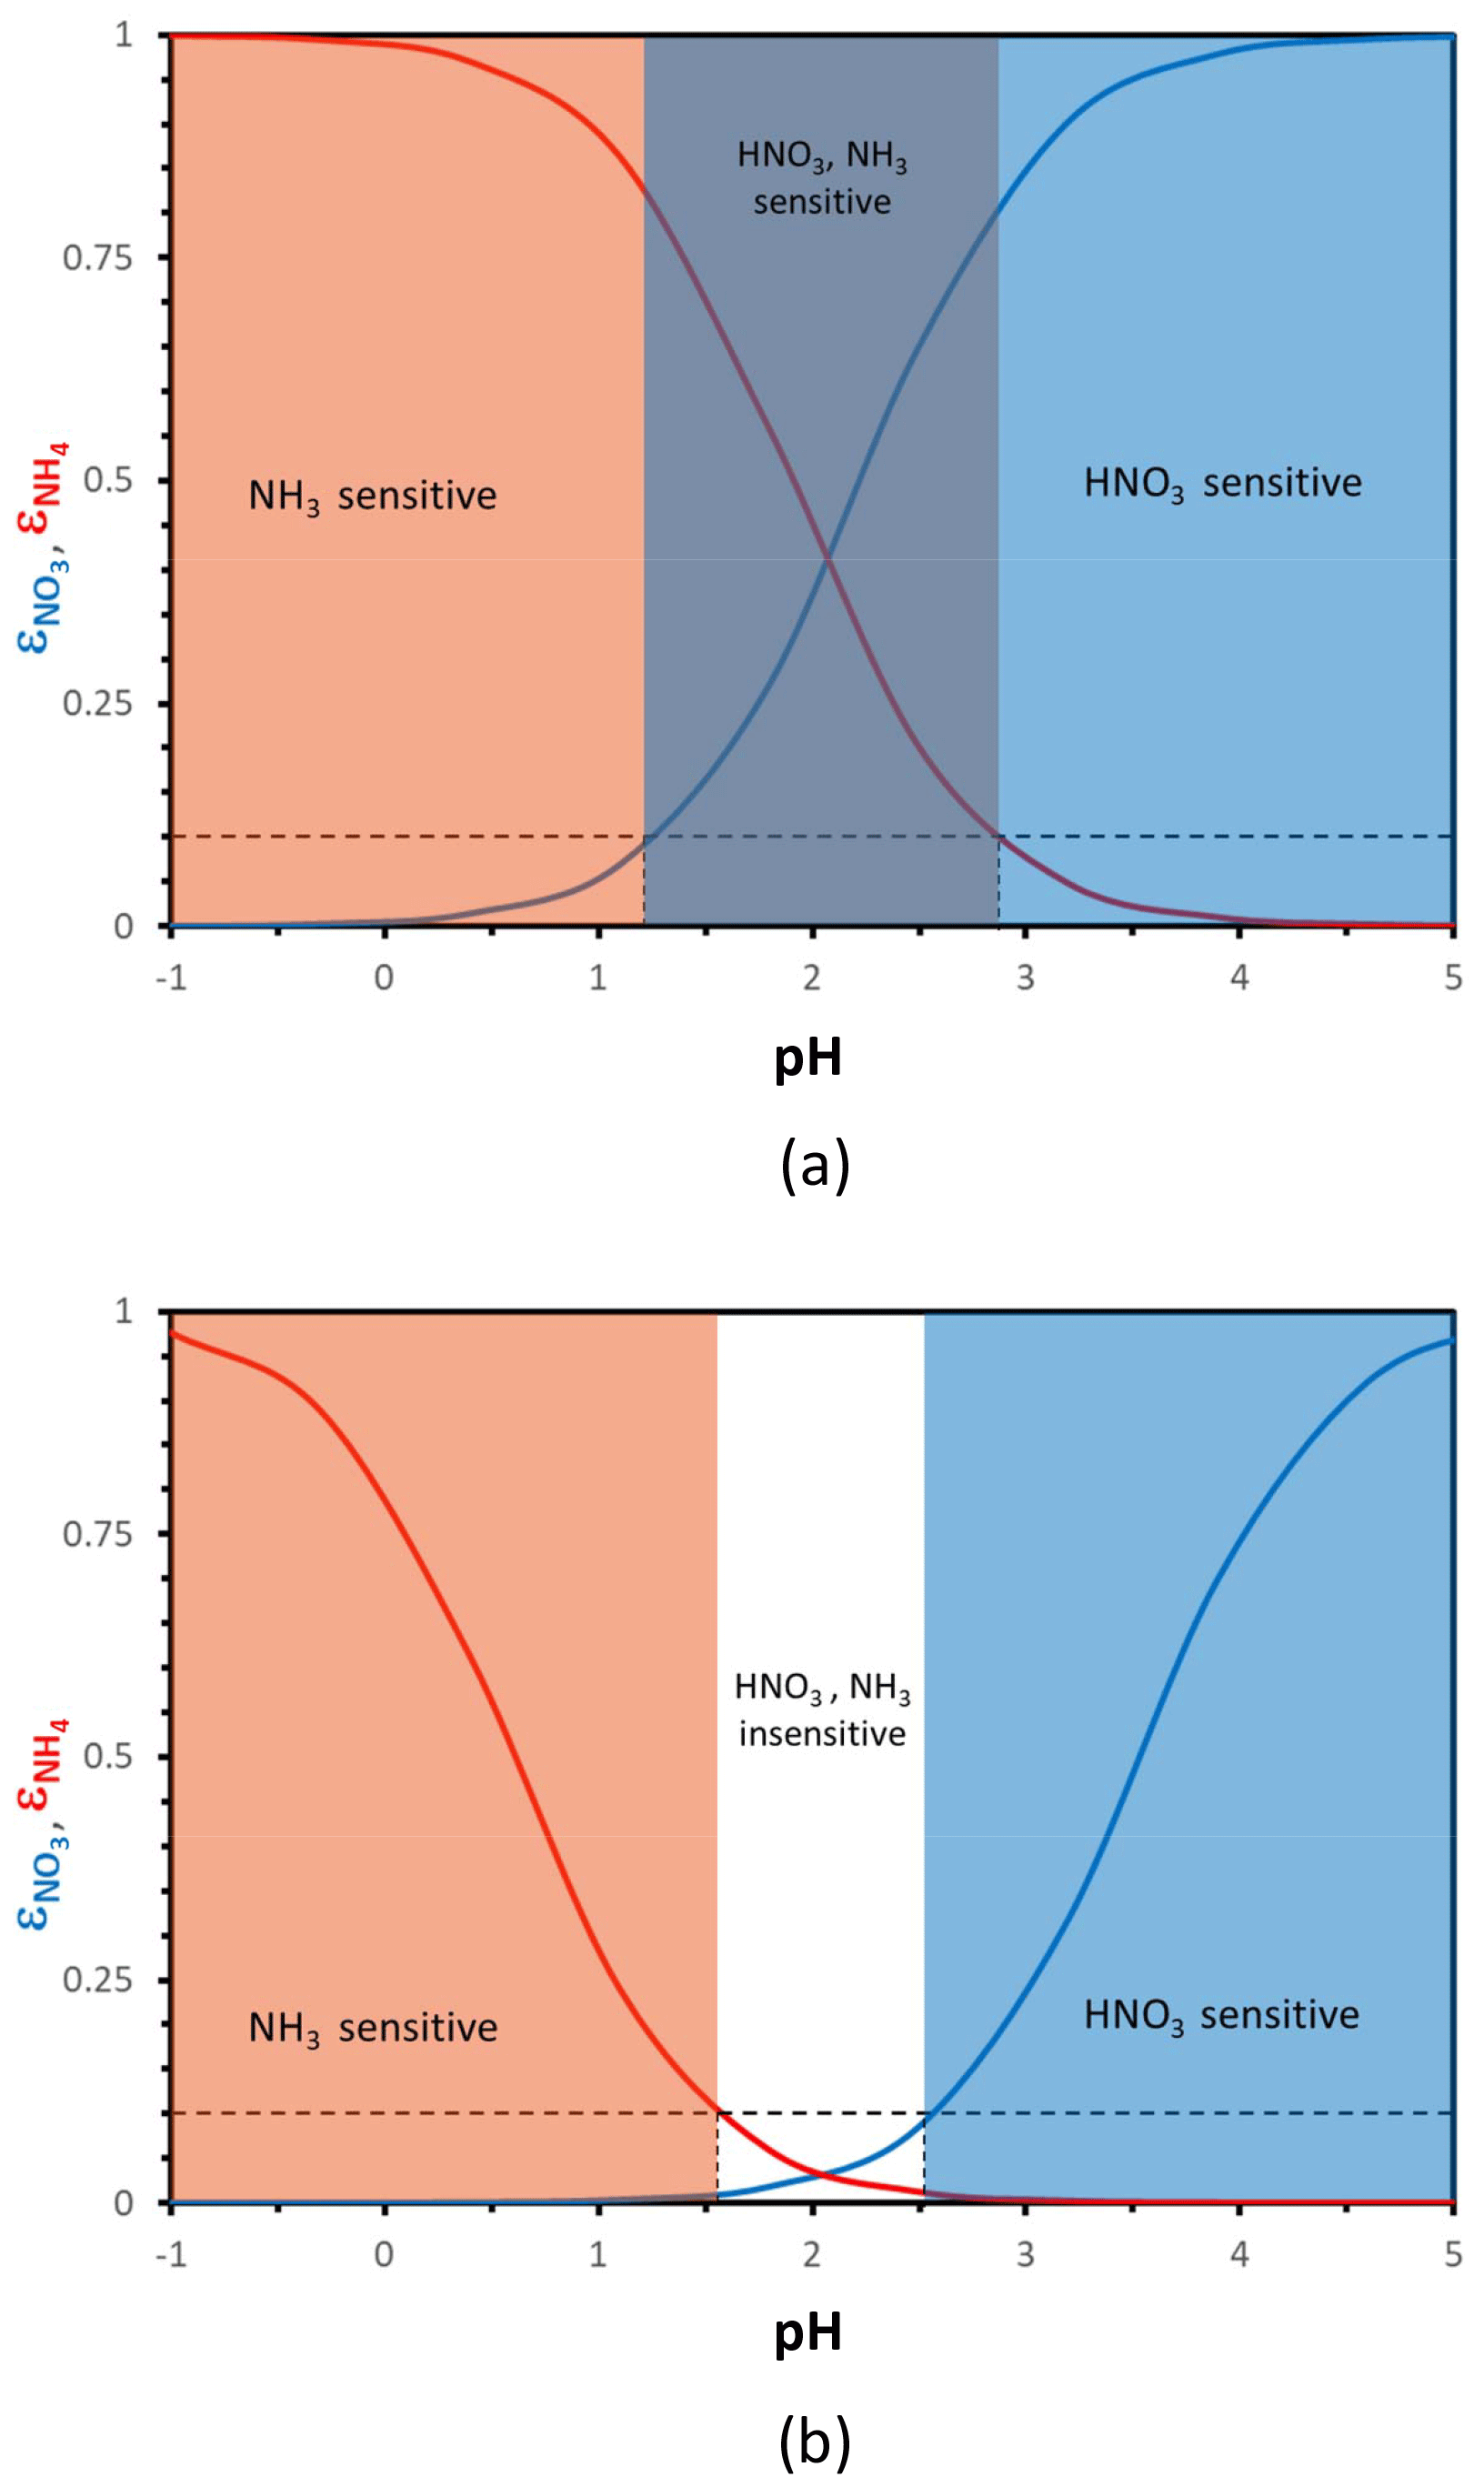
Figure 1Particle phase fraction of total nitrate, (blue curve), and total ammonium, (red curve), versus pH for a temperature of 288 K and an aerosol liquid water content of (a) 10 µg m−3 and (b) 0.5 µg m−3. The blue zone denotes where aerosol responds strongly (i.e., ) to the amount of total nitrate, orange is where NH3 dominates (i.e., ), purple is where both NH3 and HNO3 changes affect PM concentrations, and white is where aerosol is relatively insensitive to NH3 and HNO3 fluctuations. In defining the sensitivity domains, we have assumed that a partitioning fraction of 10 % (dashed black lines), and its corresponding “characteristic” pH, defines where the aerosol becomes insensitive to changes in total NH3 and HNO3.
2.1 Determining when aerosol mass is sensitive to nitric acid and ammonia availability
For a given air mass with total nitrate (i.e., the amount of aerosol and gas-phase nitrate), the equilibrium aerosol nitrate concentration, , is given by , where is the fraction of that partitions to the particle phase. Given that nitrate ions are associated with semivolatile and nonvolatile cations (NVCs) such as Na+, Ca2+, K+, and Mg2+ when they partition to aerosol, the sensitivity of aerosol mass to changes in is proportional to the changes occurring in . Therefore,
where ζ is the ratio of PM mass formed (or lost) per mole of that condenses (or evaporates) from the particles. Therefore, if is associated with aerosol NH4NO3, then . Lower values are found for particles rich in NVCs that are associated with carbonates and chlorides; for example, if nitric acid were replacing chloride in sea salt (e.g., conversion of NaCl to NaNO3), the ratio would be . A similar ζ is seen when alkaline dust particles rich in CaCO3 react with HNO3 to form Ca(NO3)2: . Given that NVCs tend to reside in the coarse mode aerosol, environments that are rich in NH3 and form large amounts of NH4NO3 (e.g., in northern Europe, US Midwest, and China) would therefore tend to exhibit ζ values of ∼1.29; in environments where there is a mixture of NVCs and NH4NO3, ζ would be a weighted average between 1.29 (pure NH4NO3 limit) and 0.5 (NVC limit), determined by the ratio of the two cation categories in the aerosol. The sensitivity of PM to changes in can therefore be expressed in terms of nitrate partitioning, so the parameters that affect also directly impact .
We now proceed with explicitly quantifying how aerosol liquid water and pH affect nitrate partitioning and hence PM sensitivity to nitrate availability. Meskhidze et al. (2003) and later on Guo et al. (2017) showed that, for a deliquesced aerosol, explicitly depends on the concentration of H+ in the aerosol phase, [H+], and the aerosol liquid water content, Wi, as
where and Kn1 are the Henry's law and acid dissociation constants for HNO3, respectively; R is the universal gas constant; T is the temperature; and and are the single-ion activity coefficients for H+ and , respectively. Temperature dependence for is provided by Sander (2015), while activity coefficients can be calculated using an aerosol thermodynamic model (e.g., ISORROPIA II; Fountoukis and Nenes, 2007).
Similarly, equilibrium partitioning of to the aerosol is given by , where is the fraction of (i.e., the amount of aerosol ammonium and gas-phase ammonia) that partitions to the particle phase. The sensitivity of aerosol mass to perturbations in total ammonia is , where λ is the ratio of mass of PM that is lost or gained per mole of evaporation or loss of ; λ is more variable than ζ, because the anion associated with ammonium can be an involatile or semivolatile species with relatively large molar mass. For example, if condenses or evaporates from sulfate salts (NH4HSO4, (NH4)2SO4), then and λ=4.4 for NH4NO3, λ=2.97 for NH4Cl, and λ=10 for (NH4)2(COO)2. Given that the majority of the aerosol ammonium is associated with nitrate and sulfates, aerosol therefore tends to exhibit a value for λ that is a weighted average of ∼1 (NH4HSO4, (NH4)2SO4 limit) or 4.4 (NH4NO3 limit), determined by the aerosol sulfate / nitrate ratio. In regions where the aerosol is acidic, nitrate tends to reside in the gas phase and λ≈1.
From the above criteria, the sensitivity of PM to changes in can be expressed in terms of its partitioning. , as in Eq. (2), can be linked to aerosol liquid water and pH (Guo et al., 2017):
where and Ka are the Henry's law and dissociation constants for NH3, respectively, and is the single-ion activity coefficient for . Temperature dependence for is provided by Sander (2015).
Defining the parameters
and
, Eqs. (2) and (3) can be
written as
For given levels of Wi, the expressions in Eq. (4) yield “sigmoidal” functions that display a characteristic “pH sensitivity window”, where the partition fraction changes from zero to unity over a limited pH range. Equation (4) can then be used to determine a “characteristic pH” that defines when aerosol is insensitive to total ammonia and nitrate availability (or emissions). For this purpose, we determine the pH for which and are equal to a characteristic (small) threshold value, being α for and β for (Fig. 1). When α (or β) are exceeded, the aerosol is said to be sensitive to NH3 (or NOx) emissions, because changes in NH3 and NOx levels can appreciably affect aerosol concentrations. This sensitivity may be in one direction (e.g., increase in the emissions if the corresponding particulate levels are low and decrease if they are high) or in both. Guo et al. (2018) found a “critical” pH of approximately 3, above which the is nearly 1 and almost all nitrate () resides in the aerosol phase. Here we generalize the approach developing relationships between the terms that depend on aerosol composition, pH, and particle water, with temperature still remaining as an independent variable.
Based on the above discussion, the characteristic acidity level for nitrate, pH′, is computed as
where is the concentration where equals the threshold value. The parameter , which we call the “threshold factor”, adjusts pH′ to account for the threshold above which the aerosol is said to become sensitive to .
Similarly to nitrates, the characteristic acidity level for ammonium, pH′′, is determined as
2.2 Chemical domains of aerosol mass sensitive to nitrate and ammonia perturbations
Hereafter we consider ; in selecting these threshold values, we assume that aerosol responds in an important manner to NH3∕HNO3 when at least 10 % of the total precursor can partition to the aerosol phase. The threshold can be adjusted accordingly to fit any other objective, depending on the analysis required (e.g., a prescribed PM response). With these considerations, the threshold factors are 9 for both compounds and the characteristic pH values obtain the very simple formulations for nitrate and for ammonium. Apart from the value of the parameters Ψ and Φ (which vary mainly with T), pH′ and pH′′ vary only with Wi – with a logarithmic dependence. Figure 2 displays their variation for 273 and 298 K. Nitrate tends to exhibit a decrease in pH′ with increasing Wi and vice versa for ammonium and pH′′.
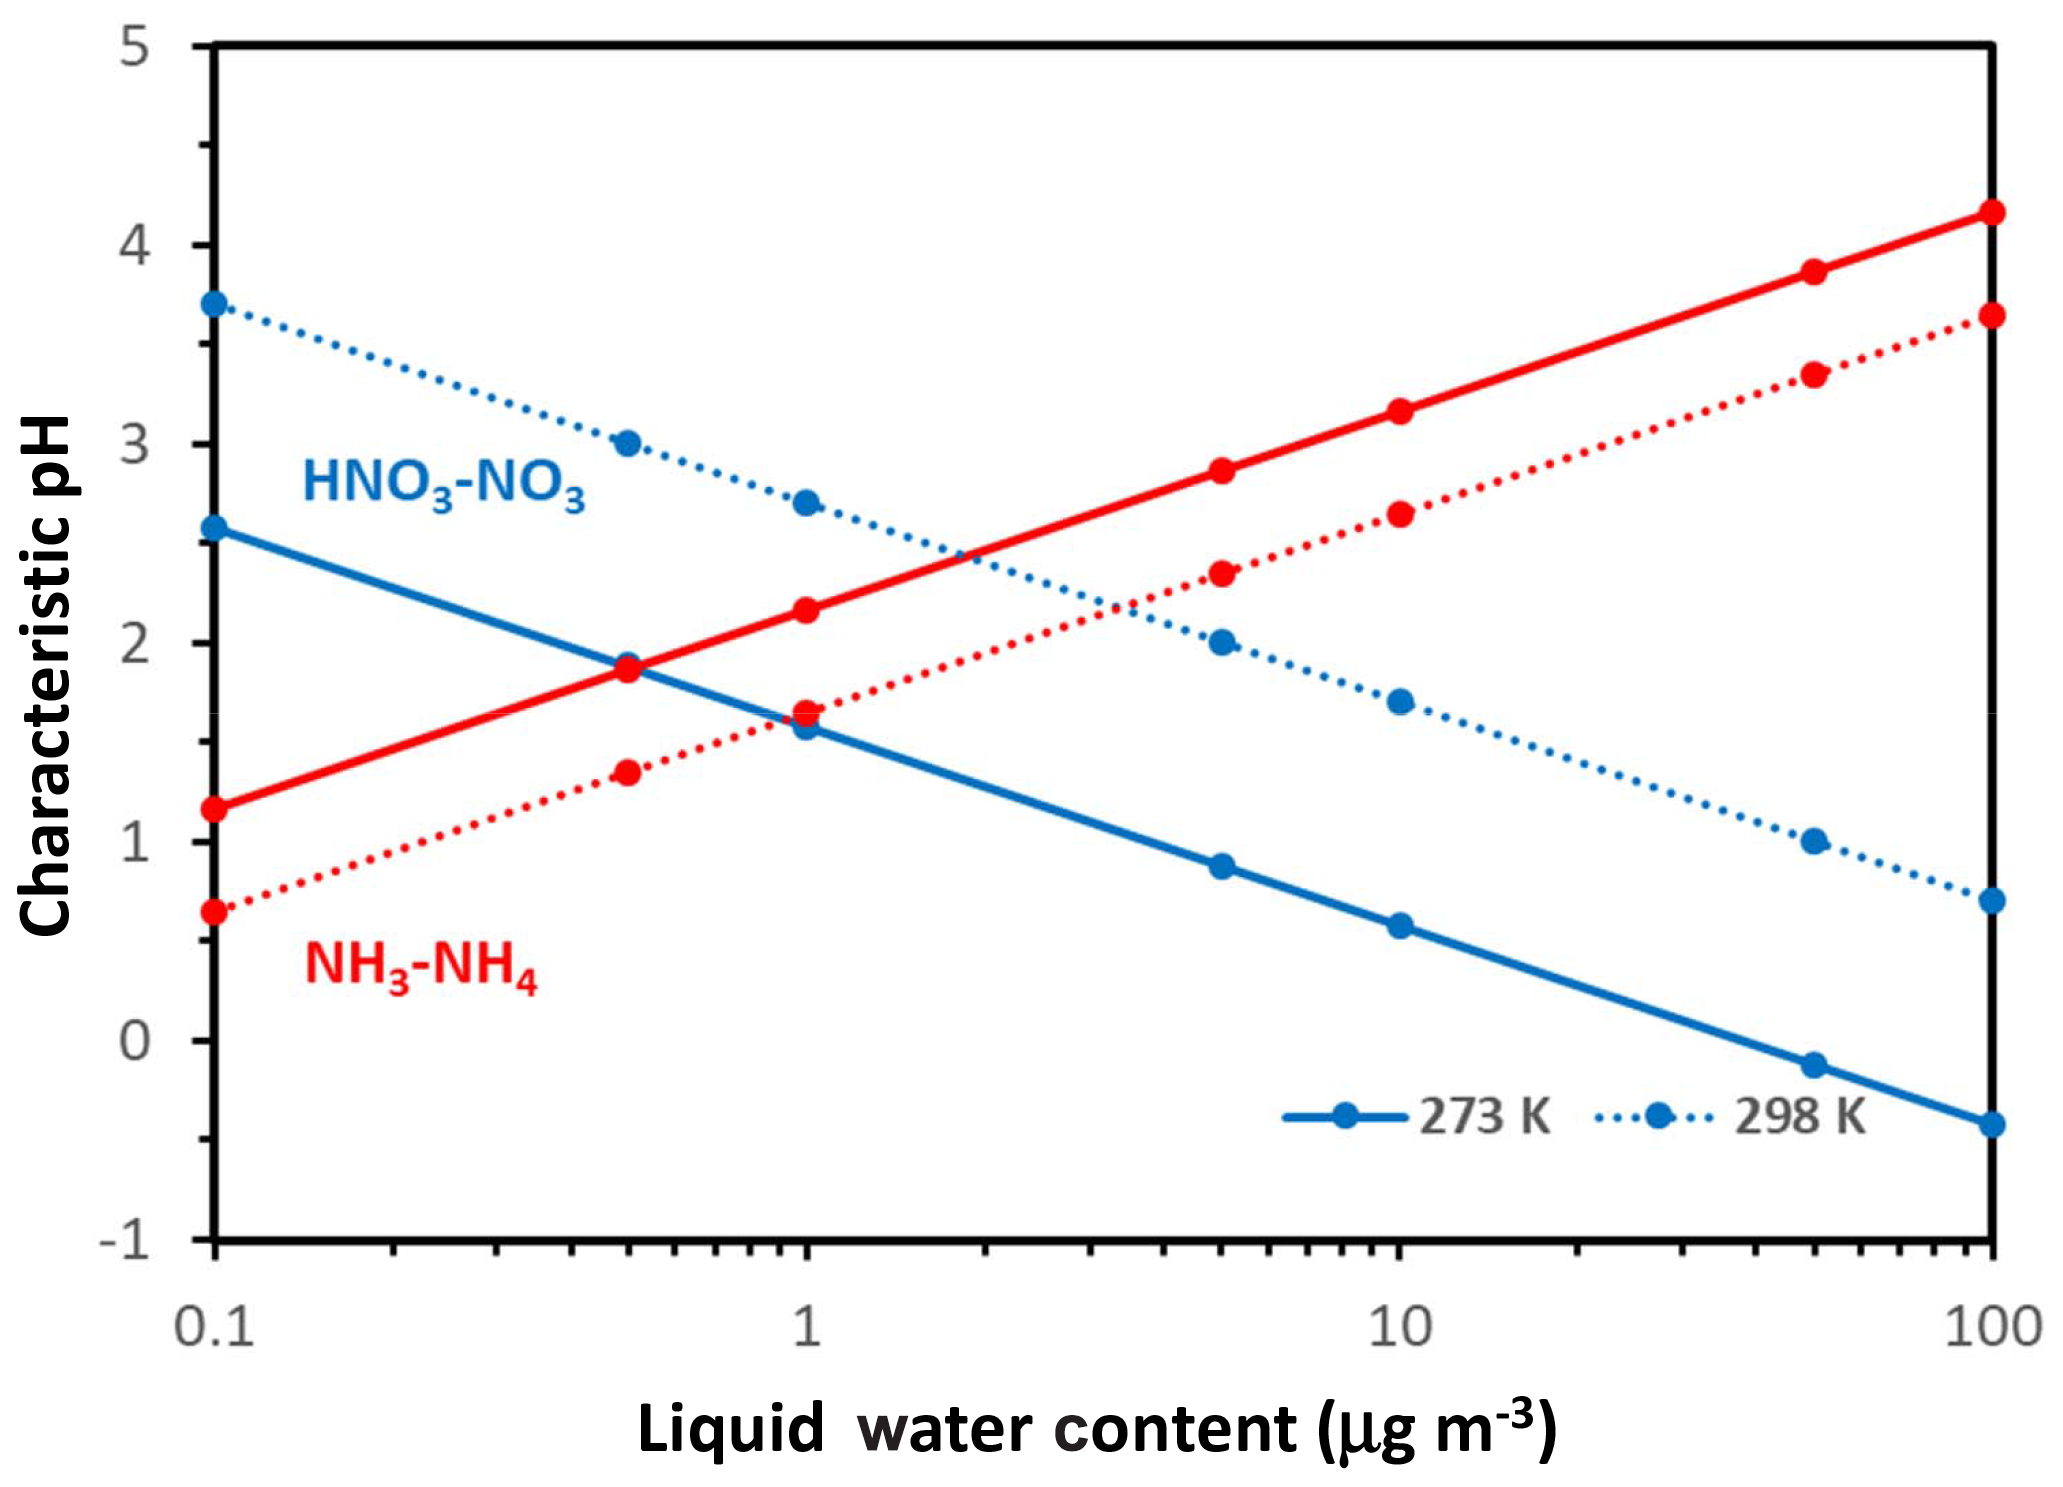
Figure 2Characteristic pH for defining when aerosol is sensitive to changes in available nitrate (blue lines) and ammonia (red lines) versus Wi. Results shown for a temperature of 298 K (dotted line) and 273 K (solid line). Note the relatively stronger effects of temperature changes on the characteristic pH for nitrate. Calculations were carried out using the Excel spreadsheet provided in the Supplement.
Based on the values of the characteristic pH and its relation to the aerosol pH, we can then determine whether the aerosol responds to changes in nitrate or ammonium – as only when (or ) does the aerosol become sensitive to changes in (or ). This realization constitutes the basis of our new framework, and aerosol can belong to one of four distinct chemical regimes:
-
Regime 1 is not sensitive to either NH3 or HNO3: this occurs when and . This regime is termed “NH3, HNO3 insensitive” or just “insensitive”.
-
Regime 2 is not sensitive to NH3, but it is sensitive to HNO3: this occurs when and . This regime is termed “HNO3 sensitive”.
-
Regime 3 is sensitive to both NH3 and HNO3: this occurs when and . This regime is termed “NH3 and HNO3 sensitive”.
-
Regime 4 is sensitive to NH3 but not sensitive to HNO3: this occurs when and . This regime is termed “NH3 sensitive”.
Figure 3 shows these four regions in white (Regime 1), blue (Regime 2), purple (Regime 3), and red (Regime 4) for 273 K (Fig. 3a) and 298 K (Fig. 3b). Therefore, any specific set of data (from observations or a model), based on their corresponding aerosol acidity and liquid water contents, places them in one of the four above domains – which in turn determines the “chemical regime” of aerosol response to and/or . What is surprising is the emergence of a region of conditions where aerosol is insensitive to either NH3 or HNO3 – which occupies an increasingly large pH–LWC (liquid water content) domain as the temperature increases (Fig. 3).
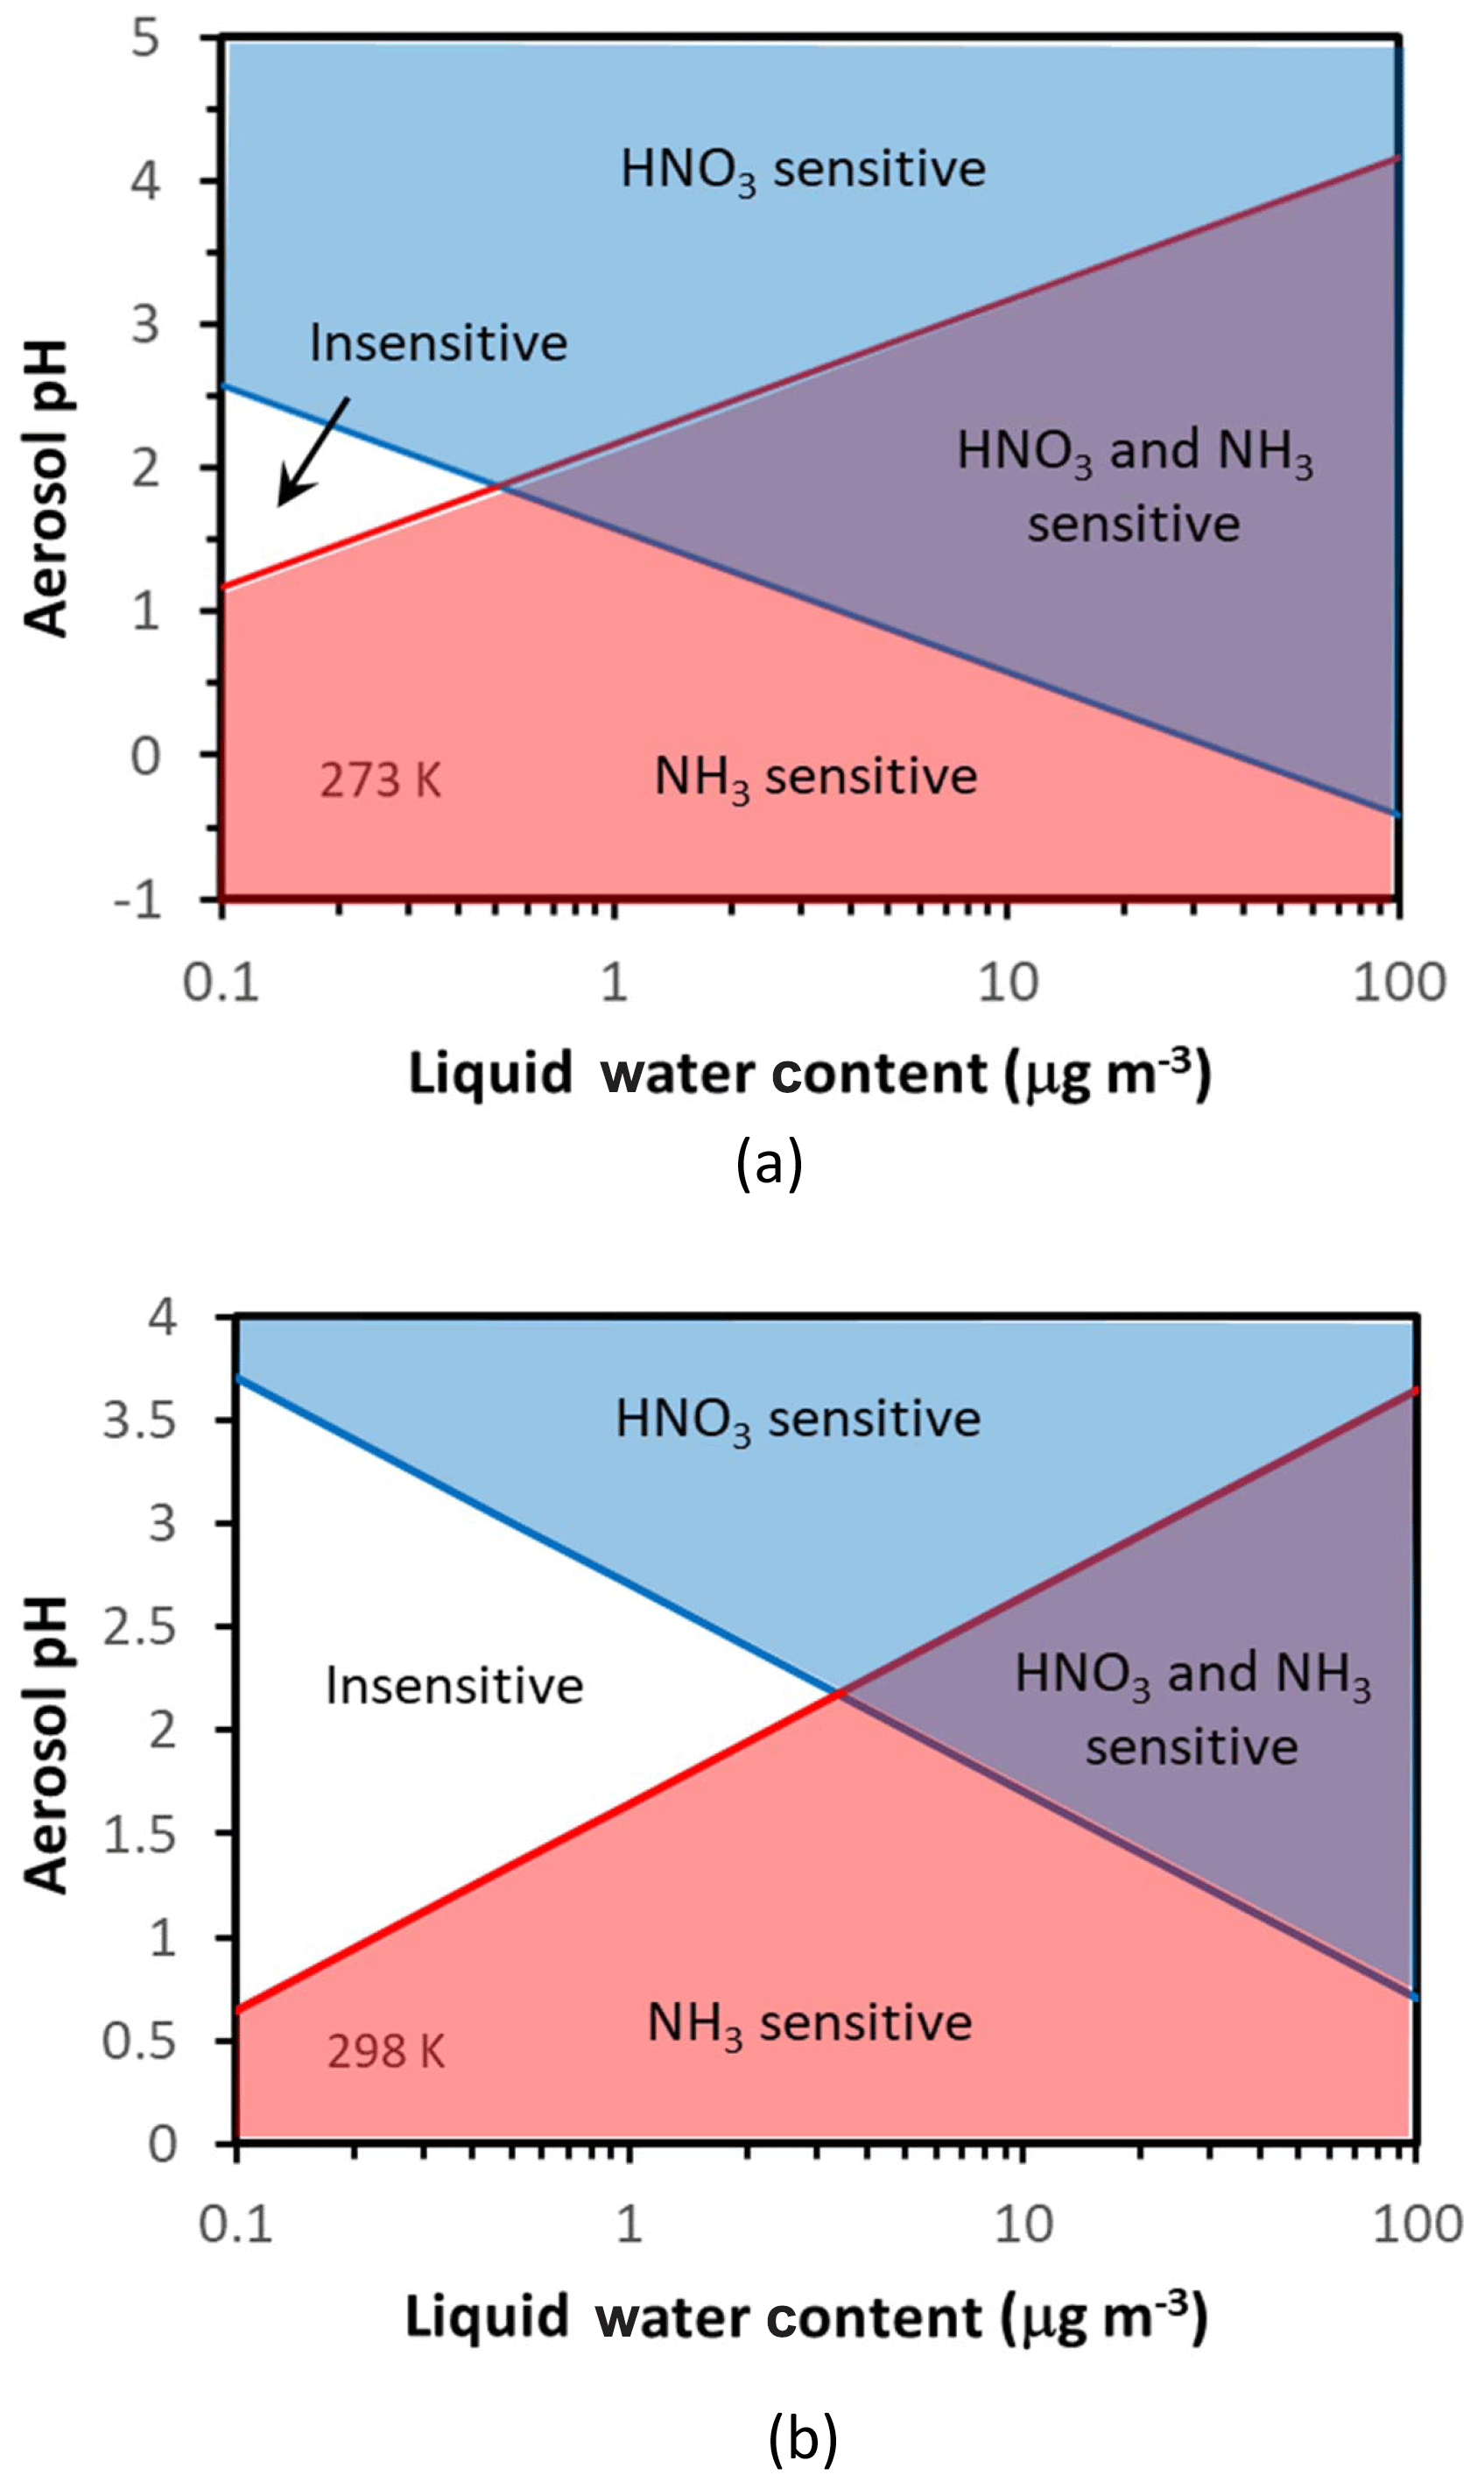
Figure 3Chemical domains of aerosol response to ammonia and nitrate emissions. Shown are results for 273 K (a) and 298 K (b). Note that there exists a fairly expansive region of acidity and liquid water content (especially for warmer temperatures) where aerosol is relatively insensitive to ammonia and nitrate emissions; here only nonvolatiles (sulfate, NVCs) can have an appreciable impact on aerosol mass. Also important is the role of aerosol water in helping define the chemical regime of aerosol sensitivity to precursors.
A characteristic point on the chemical regime map corresponds to where the two lines “crossover”, thus separating Regime 1 from Regime 3 and Regime 2 from Regime 4. This critical point corresponds to a characteristic value of LWC, , that is easily found by equating pH′ with pH′′:
Substitution of into either Eq. (5) or Eq (6) gives also the characteristic pH∗ of this crossover point:
Both pH* and depend on temperature (Fig. 3). For T=298 K and , , , so µg m−3 and . Therefore, for moderately acidic aerosol () and for moderate levels of liquid water content (a few micrograms per cubic meter, µg m−3), aerosol tends to be insensitive to emissions of either or precursors. For higher (or lower) pH levels, the aerosol transitions to Regime 2 (or 4). For liquid water above , there is a “transition pH” from an ammonia-sensitive aerosol to an exclusively nitrate-sensitive aerosol, which depends linearly on liquid water content (Fig. 3). Similarly, there is also another transition pH that defines when the aerosol becomes exclusively sensitive to .
As formulated here, the framework does not imply that the water is associated with the species considered (ammonium, nitrate) but rather it is treated as a variable; pH is also treated as a variable and can be modulated from organics, NVCs, halogen ions, sulfates, carbonates, and other species. The main requirement is that the aerosol is dominated by a single aqueous phase, as discussed in Battaglia Jr. et al. (2019) and references therein; therefore, the framework applies more accurately to conditions where the relative humidity is above 40 % and the assumption of thermodynamic equilibrium is applicable (i.e., ultra-viscosity and semisolid effects do not considerably limit mass transfer in the aerosol phase). Given the complexity of aerosol thermodynamics, it is remarkable that such an apparently simple framework can be used to characterize the regions of aerosol sensitivity to and emissions, with “coordinates” being pH and liquid water. This is illustrated in the following section.
The above framework requires knowledge of aerosol pH and liquid water content, which can be routinely calculated by state-of-the-art atmospheric chemical transport models (e.g., CMAQ, CAMx) during the course of any simulation. Thermodynamic analysis of ambient aerosol and gas-phase data also provides aerosol pH and liquid water content; therefore, the above framework can be used to characterize the chemical domain of ambient and simulated aerosol.
Table 1Characteristics of the datasets used for determining the sensitivity to NH3 and HNO3 emissions. Shown is the average relative humidity (RH), temperature (K), and the concentration of major aerosol precursors (µg m−3), while in the respective standard deviation for each parameter is shown in parenthesis. Access to the data is described in the “Code and data availability” section.
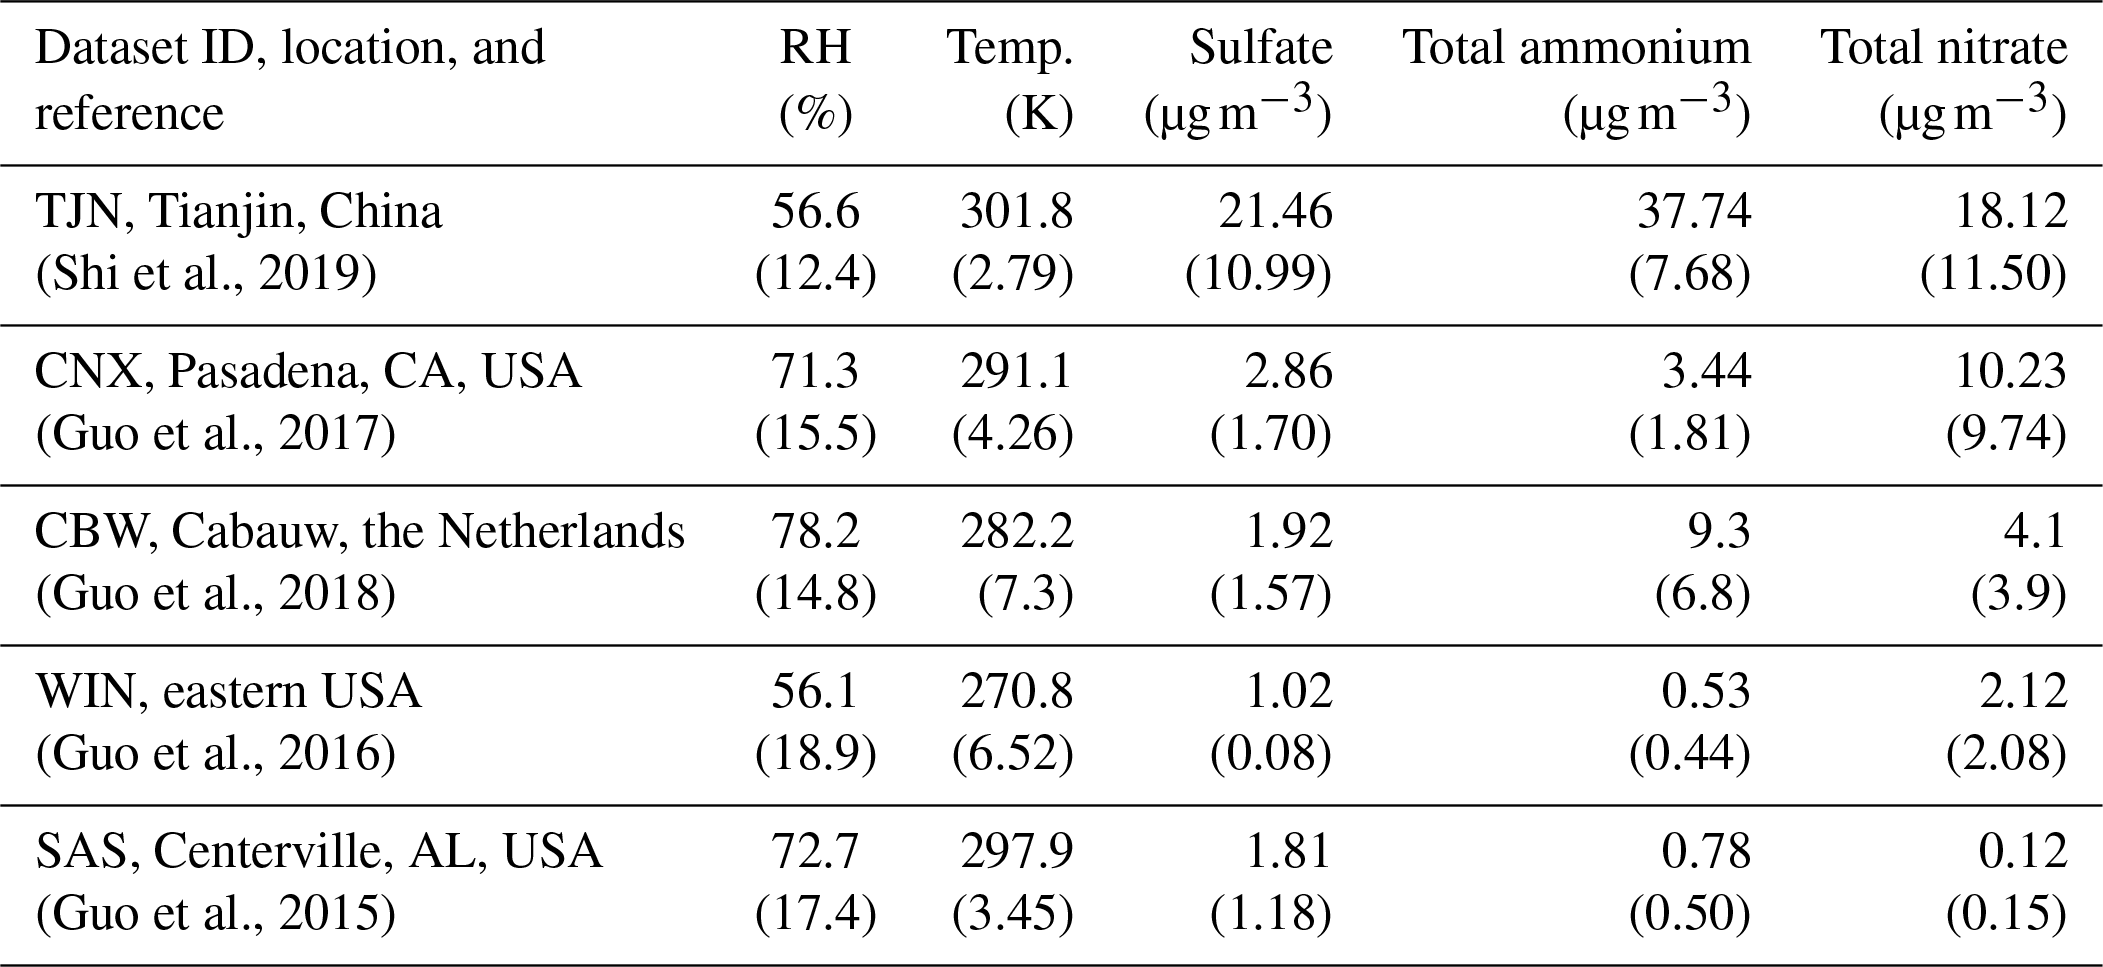
The applicability of the chemical domain approach is demonstrated by its application to ambient data. For this purpose, we have selected more than 7700 data points obtained from observations over five locations worldwide: Cabauw (CBW), Tianjin (TJN), California (CNX), SE US (SAS), and a wintertime NE US (WIN) study (Table 1). Each dataset displays a broad range of acidity, temperature, and relative humidity, and each has been thoroughly studied and evaluated for the applicability of thermodynamic analysis. Each data point corresponds roughly to a 1 h measurement, meaning that the chemical domains examined correspond to effectively the instantaneous response of PM to ammonia and nitric acid availability. In addition to the major aerosol species of ammonium/ammonia, sulfate, and nitrate/nitric acid, the datasets also contain chloride/hydrochloric acid, sodium, calcium, potassium, and magnesium (not shown in Table 1), which contribute to the pH and liquid water levels predicted. However, not all of the data provide size-dependent composition, so our analysis is limited, here, to looking at the bulk fine PM composition. The range of and for all the data examined is presented in Fig. 4. Noted on the figure are also indicative domains that correspond to Regime 1 to Regime 4. It is clear that each dataset has distinct characteristics that provide insight into the expected sensitivity of PM to NH3 and HNO3 emissions – as low and correspond to a low sensitivity of PM to their respective precursor emissions. However, it is unclear, based on ε alone, where this (in)sensitivity originates from: strong or weak acidity, high or low liquid water content, or high or low temperature. The latter is important, given that those parameters in models shape the local sensitivity profiles. Much of the data are found towards the extremes in the partitioning fraction scale, leaving the central part of the diagram sparsely populated. However, this does not mean that aerosols are limited by one component or the other, as much of the data are found to be in the region sensitive to both.
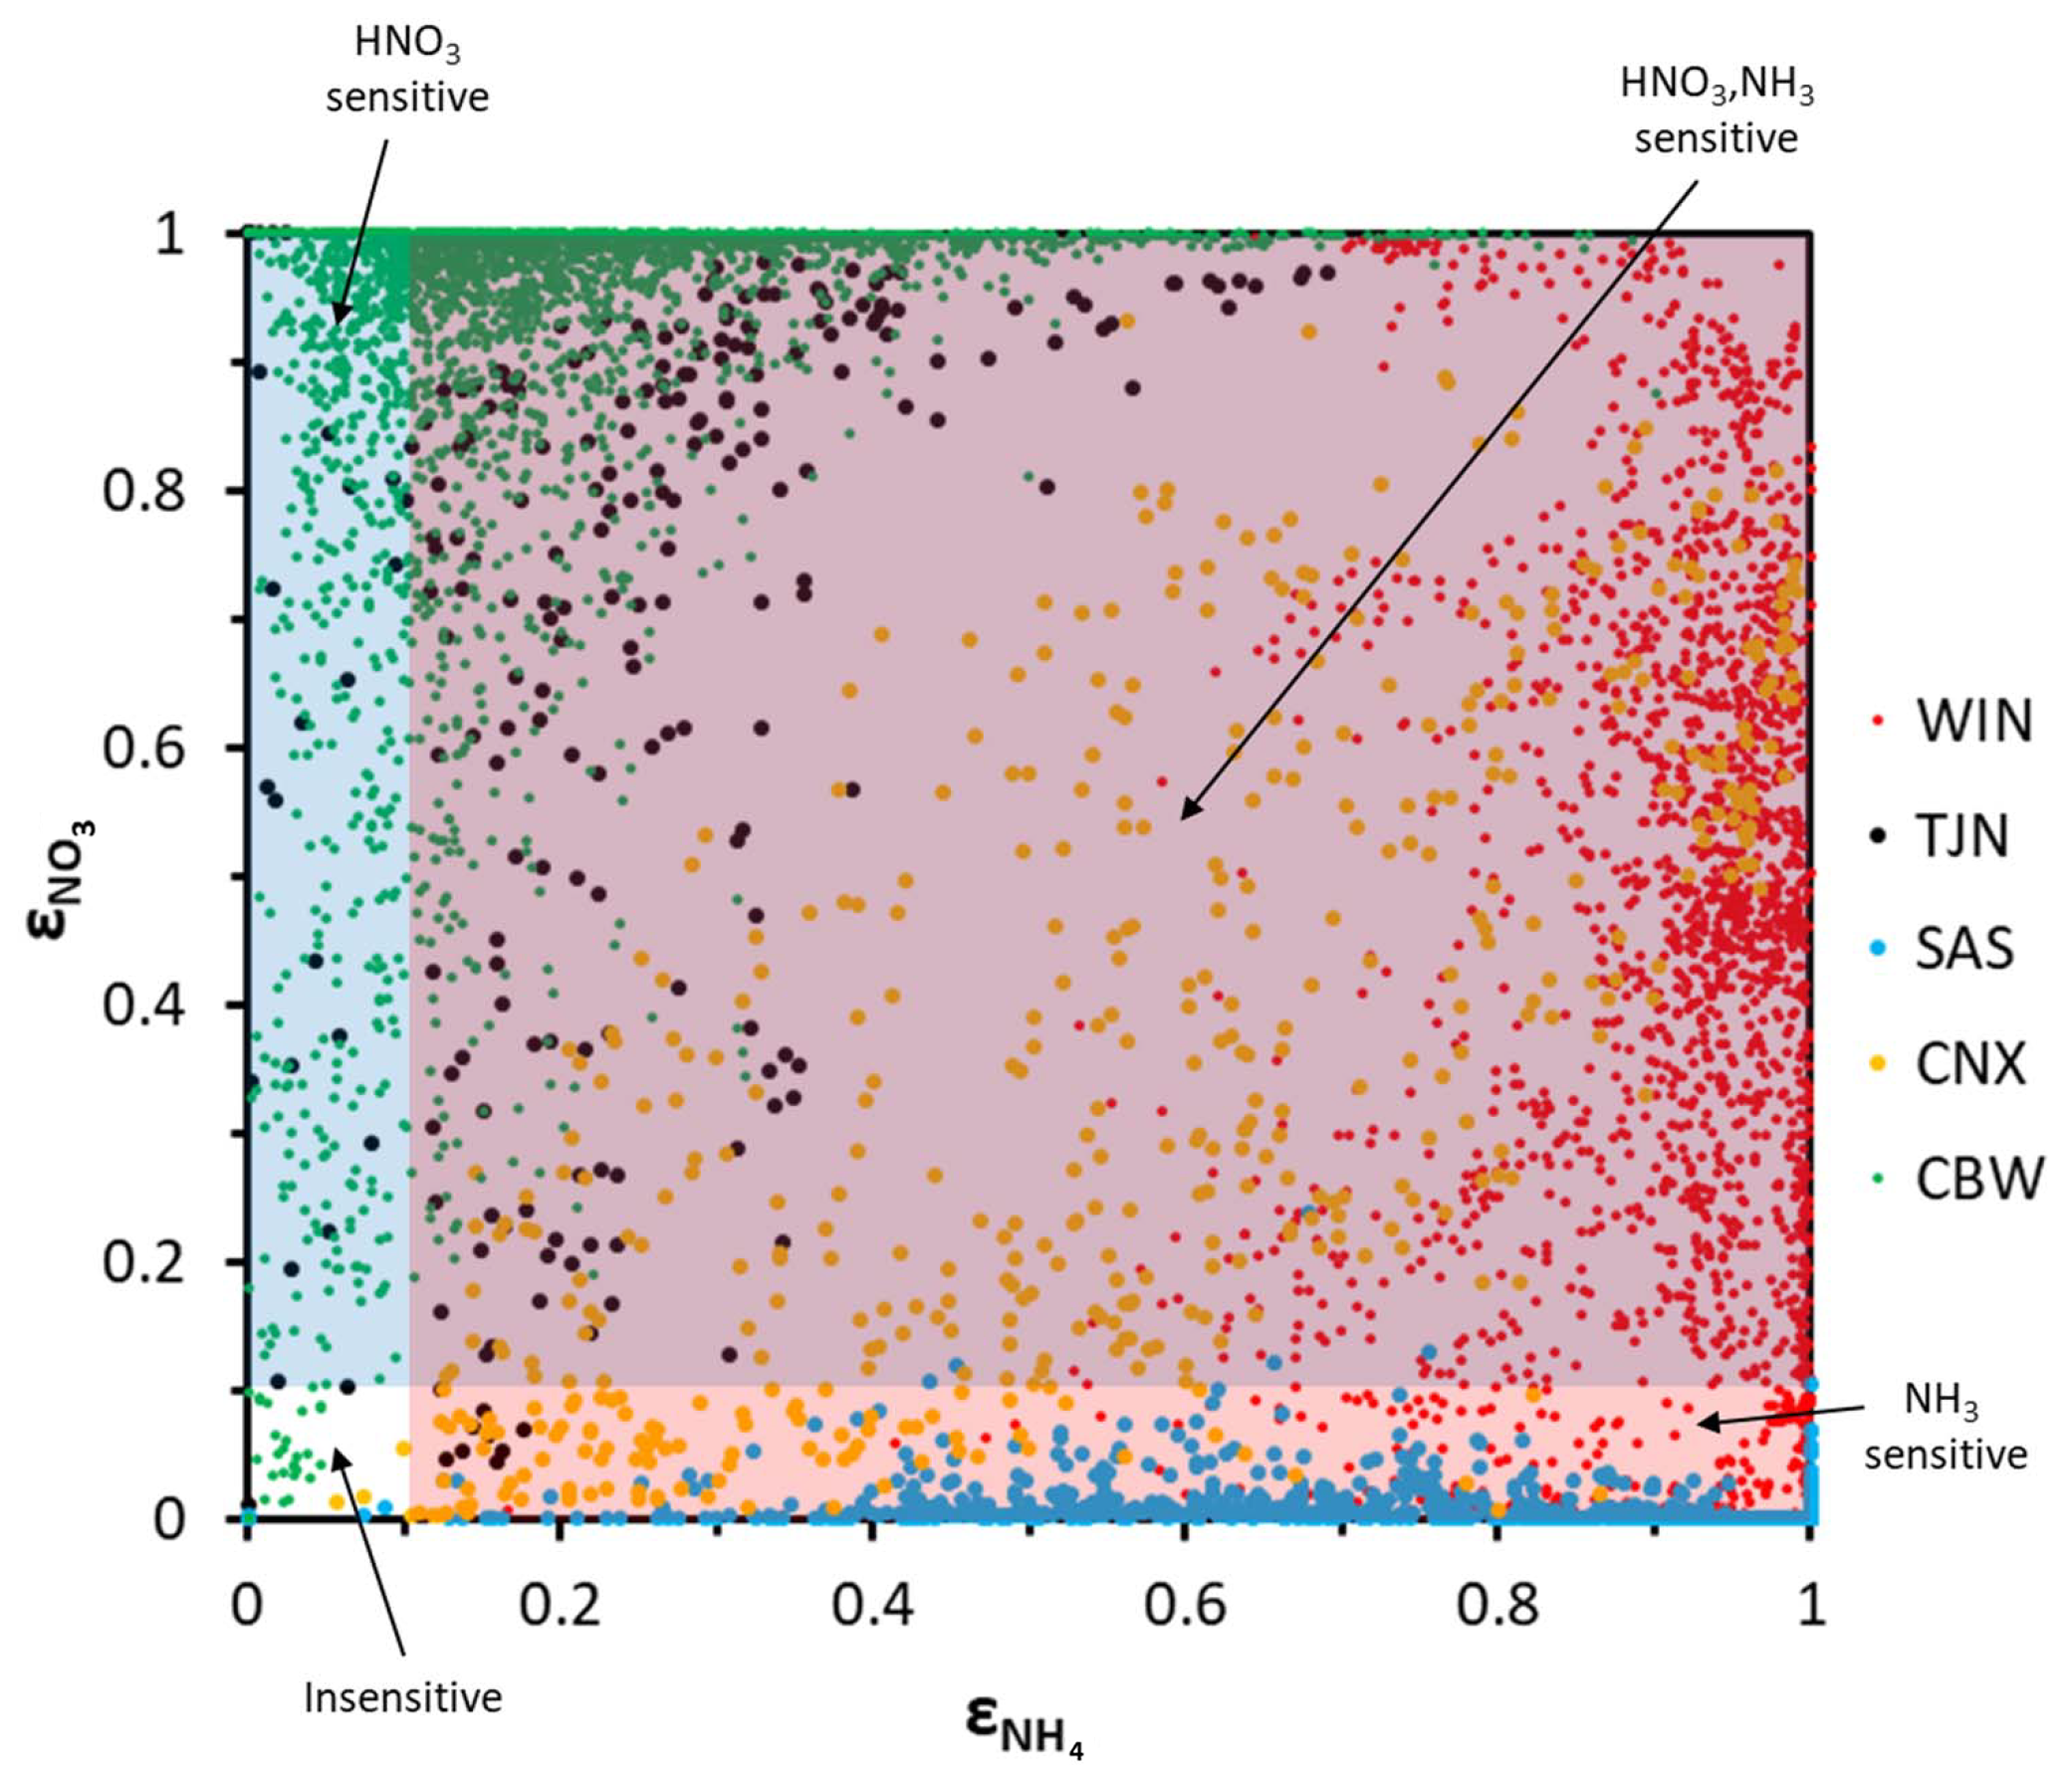
Figure 4Aerosol partitioning fraction for total ammonia/ammonium and nitric acid/nitrate for the five regions examined: (a) Cabauw – CBW, (b) CalNex – CNX, (c) Tianjin – TJN, (d) SOAS – SAS, and (e) E United States (WIN).
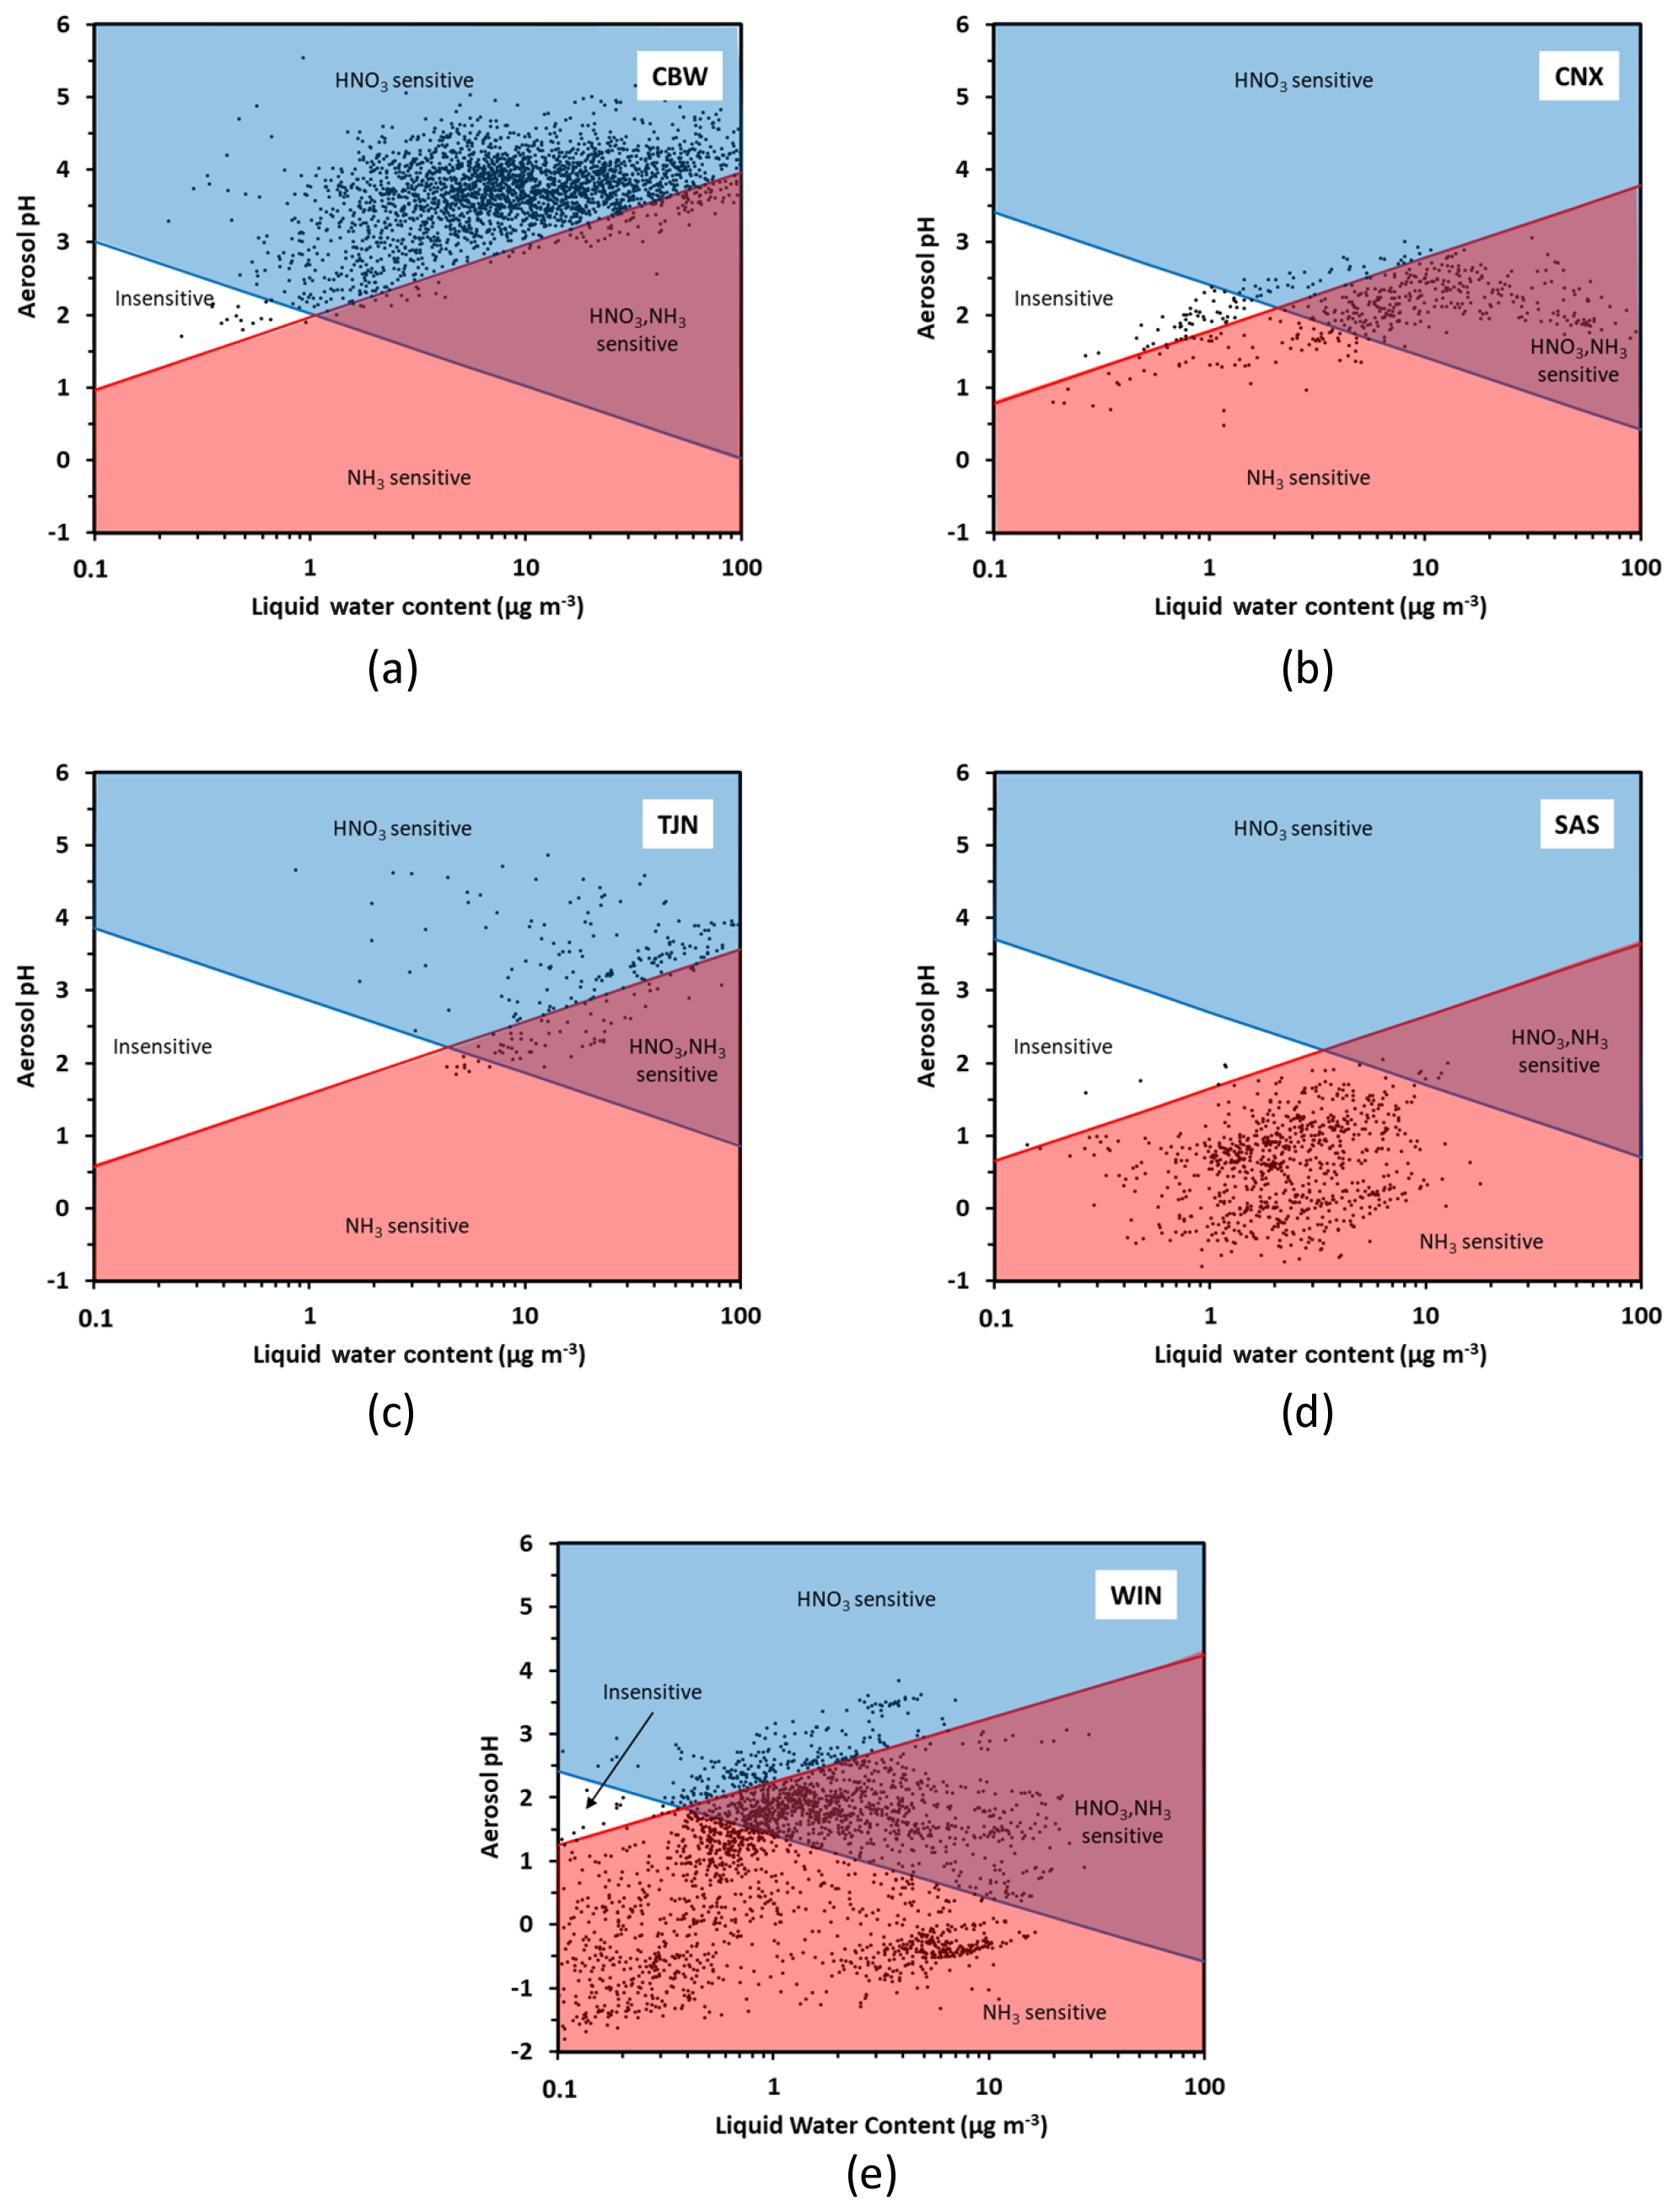
Figure 5Chemical domains of sensitivity of aerosol to NH3 and NOx emissions for five regions examined: (a) Cabauw – CBW, (b) CalNex – CNX, (c) Tianjin – TJN, (d) SOAS – SAS, and (e) E United States (WIN). Average composition, temperature, and humidity along with their variations (expressed by their standard deviation) are provided in Table 1.
Figure 5 presents the chemical domain classifications for each location. These data sets are used to provide an example and may not apply to all locations in the region. For each subplot, the characteristic curves are calculated using the average temperature of the dataset (presented in Table 1). From each subplot it becomes clear that every location (CBW, TJN, CNX, SAS, WIN) belongs almost exclusively to a characteristic domain for the duration of the measurements. Cabauw, for example, is characterized by high enough NH3 so that aerosol is not sensitive to variations of it. Nitric acid, on the other hand, is by far a limiting factor in PM formation, and hence CBW is in the HNO3-dominated regime throughout the year. For similar reasons, Tianjin is also mostly in the HNO3-dominated region, although a fraction of the data points lie in the combined NH3−HNO3 region owing to the slightly more acidic conditions compared to CBW. The southeast US (SAS) is considerably more acidic and with an order of magnitude less liquid water content compared to CBW and TJN; for these reasons, it belongs to the NH3-sensitive regime (i.e., there is little NH4NO3 present in summer – even if total nitrate availability may be high). The California dataset is quite interesting, being one that partly occupies the insensitive region and then transitions to the combined NH3−HNO3 region; in this dataset, the combination of moderate NH3 levels, temperature, and the fraction of NVCs from sea salt that is internally mixed with the other components makes aerosol sensitive to both NH3 and HNO3 variations. The wintertime eastern US dataset (WIN) corresponds to a broad region (aircraft data set), and hence the data naturally occupies multiple domains. The lower temperatures, however, prohibit most of the data from occupying any of the insensitive region; most of the data occupies the NH3-sensitive regime, owing to the strong acidity and low liquid water content. One remarkable point, however, is that regardless of location, the transition point between NH3-dominated and HNO3-dominated sensitivity always occurs at a pH around 2 but at variable levels of liquid water content. The latter is important, as pH emerges as a required but not sufficient condition to determine the type of aerosol sensitivity: too little water (i.e., liquid water below the characteristic value ) and the aerosol can be insensitive to NH3, even if the pH is as low as 2 (Fig. 5a). In the case of Cabauw conditions (Fig. 5a), where aerosol liquid water ranges from 7 to 15 µg m−3, the transition pH from an aerosol that is exclusively sensitive to precursor emissions to one that is sensitive to both and ranges from 2.8 and 3.2, which is in perfect agreement with the analysis of Guo et al. (2018). The additional insight that our framework shows is that the transition pH varies with temperature and logarithmically with aerosol liquid water content, in response to emissions and diurnal/seasonal variability and climate change. This insight, not apparent in the analysis of Guo et al. (2018), demonstrates the power and flexibility of the new framework.
Here we present a simple yet powerful way to understand when concentrations of nitric acid (HNO3) and ammonia (NH3) from anthropogenic and biogenic emissions can considerably modulate particulate matter (PM) concentrations worldwide. The conceptual framework explicitly considers acidity (pH), aerosol liquid water content, and temperature as the main parameters controlling secondary inorganic PM sensitivity, and it identifies four policy-relevant regimes: (i) NH3 dominated, (ii) HNO3 dominated, (iii) both NH3 and HNO3, and (iv) a previously unidentified domain where neither NH3 nor HNO3 are important for PM formation (but only nonvolatile precursors such as NVCs and sulfate). When this framework is applied to ambient measurements and predictions of PM and gaseous precursors, the “chemical regime” of PM sensitivity to emissions is directly determined, allowing novel insights and eventually an important tool to evaluate models. Given that if simulated aerosol is in the same sensitivity regime as suggested by thermodynamic analysis of observations, models are expected to provide plausible responses to changes in aerosol emissions. The framework can be used to identify regions or time periods where or when pH and liquid water content prediction errors matter for PM sensitivity assessments. With this deeper understanding, aerosol pH and associated liquid water content naturally emerge as policy-relevant parameters that have not been explicitly explored until now.
User access to data used in this article is described in the citations referenced for each dataset and can also be accessed from the compiled dataset by Pye et al. (2019). The ISORROPIA II thermodynamic equilibrium code is available at http://isorropia.epfl.ch (last access: 3 March 2020; EPFL, 2020).
The supplement related to this article is available online at: https://doi.org/10.5194/acp-20-3249-2020-supplement.
AN initiated the study, developed the framework, carried out analysis of the data, and wrote the initial draft. All authors provided feedback on the analysis approach and extensively commented on the article.
The authors declare that they have no conflict of interest.
The contents are solely the responsibility of the grantee and do not necessarily represent the official views of the supporting agencies. Further, the US government does not endorse the purchase of any commercial products or services mentioned in the publication.
We thank the comments from two anonymous reviewers and Hongyu Guo and Guoliang Shi for providing access to the data used here.
This research has been supported by the European Commission, H2020 Research Infrastructures (PyroTRACH (grant no. 726165)) and the United States Environmental Protection Agency (grant no. R83588001). Its contents are solely the responsibility of the grantee and do not necessarily represent the official views of the supporting agencies.
This paper was edited by Veli-Matti Kerminen and reviewed by two anonymous referees.
Aneja, V. P., Schlesinger, W. H., and Erisman, J. W.: Effects of Agriculture upon the Air Quality and Climate: Research, Policy, and Regulations, Environ. Sci. Technol., 43, 4234–4240, https://doi.org/10.1021/es8024403, 2009.
Battaglia Jr., M. A., Weber, R. J., Nenes, A., and Hennigan, C. J.: Effects of water-soluble organic carbon on aerosol pH, Atmos. Chem. Phys., 19, 14607–14620, https://doi.org/10.5194/acp-19-14607-2019, 2019.
Behera, S. N., Sharma, M., Aneja, V. P., and Balasubramanian, R.: Ammonia in the atmosphere: a review on emission sources, atmospheric chemistry and deposition on terrestrial bodies, Environ. Sci. Pollut. R., 20, 8092–8131, https://doi.org/10.1007/s11356-013-2051-9, 2013.
Bellouin, N., Rae, J., Jones, A., Johnson, C., Haywood, J., and Boucher, O.: Aerosol forcing in the Climate Model Intercomparison Project (CMIP5) simulations by HadGEM2-ES and the role of ammonium nitrate, J. Geophys. Res., 116, D20206, https://doi.org/10.1029/2011jd016074, 2011.
Cohen, A. J., Brauer, M., Burnett, R., Anderson, H. R., Frostad, J., Estep, K., Balakrishnan, K., Brunekreef, B., Dandona, L., Dandona, R., Feigin, V., Freedman, G., Hubbell, B., Jobling, A., Kan, H., Knibbs, L., Liu, Y., Martin, R., Morawska, L., Pope, C. A., Shin, H., Straif, K., Shaddick, G., Thomas, M., van Dingenen, R., van Donkelaar, A., Vos, T., Murray, C. J. L., and Forouzanfar, M. H.: Estimates and 25-year trends of the global burden of disease attributable to ambient air pollution: an analysis of data from the Global Burden of Diseases Study 2015, Lancet, 389, 1907–1918, https://doi.org/10.1016/s0140-6736(17)30505-6, 2017.
EPFL: ISORROPIA, available at: http://isorropia.epfl.ch, last access: 3 March 2020.
Fountoukis, C. and Nenes, A.: ISORROPIA II: a computationally efficient thermodynamic equilibrium model for aerosols, Atmos. Chem. Phys., 7, 4639–4659, https://doi.org/10.5194/acp-7-4639-2007, 2007.
Fowler, D., Coyle, M., Skiba, U., Sutton, M. A., Cape, J. N., Reis, S., Sheppard, L. J., Jenkins, A., Grizzetti, B., Galloway, J. N., Vitousek, P., Leach, A., Bouwman, A. F., Butterbach-Bahl, K., Dentener, F., Stevenson, D., Amann, M., and Voss, M.: The global nitrogen cycle in the twenty-first century, Philos. T. Roy. Soc. B, 368, 20130164, https://doi.org/10.1098/rstb.2013.0164, 2013.
Guo, H., Xu, L., Bougiatioti, A., Cerully, K. M., Capps, S. L., Hite Jr., J. R., Carlton, A. G., Lee, S.-H., Bergin, M. H., Ng, N. L., Nenes, A., and Weber, R. J.: Fine-particle water and pH in the southeastern United States, Atmos. Chem. Phys., 15, 5211–5228, https://doi.org/10.5194/acp-15-5211-2015, 2015.
Guo, H., Sullivan, A. P., Campuzano-Jost, P., Schroder, J. C., Lopez-Hilfiker, F. D., Dibb, J. E., Jimenez, J. L., Thornton, J. A., Brown, S. S., Nenes, A., and Weber, R. J.: Fine particle pH and the partitioning of nitric acid during winter in the northeastern United States, J. Geophys. Res., 121, 10355–10376, https://doi.org/10.1002/2016jd025311, 2016.
Guo, H., Liu, J., Froyd, K. D., Roberts, J. M., Veres, P. R., Hayes, P. L., Jimenez, J. L., Nenes, A., and Weber, R. J.: Fine particle pH and gas–particle phase partitioning of inorganic species in Pasadena, California, during the 2010 CalNex campaign, Atmos. Chem. Phys., 17, 5703–5719, https://doi.org/10.5194/acp-17-5703-2017, 2017.
Guo, H., Otjes, R., Schlag, P., Kiendler-Scharr, A., Nenes, A., and Weber, R. J.: Effectiveness of ammonia reduction on control of fine particle nitrate, Atmos. Chem. Phys., 18, 12241–12256, https://doi.org/10.5194/acp-18-12241-2018, 2018.
Haywood, J. and Boucher, O.: Estimates of the direct and indirect radiative forcing due to tropospheric aerosols: A review, Rev. Geophys., 38, 513–543, https://doi.org/10.1029/1999rg000078, 2000.
Heald, C. L., Collett Jr., J. L., Lee, T., Benedict, K. B., Schwandner, F. M., Li, Y., Clarisse, L., Hurtmans, D. R., Van Damme, M., Clerbaux, C., Coheur, P.-F., Philip, S., Martin, R. V., and Pye, H. O. T.: Atmospheric ammonia and particulate inorganic nitrogen over the United States, Atmos. Chem. Phys., 12, 10295–10312, https://doi.org/10.5194/acp-12-10295-2012, 2012.
IPCC: Climate Change 2013: The Physical Science Basis, Contribution of Working Group I to the Fifth Assessment Report of the Intergovernmental Panel on Climate Change, Cambridge, United Kingdom and New York, NY, USA, 2013.
Kanakidou, M., Seinfeld, J. H., Pandis, S. N., Barnes, I., Dentener, F. J., Facchini, M. C., Van Dingenen, R., Ervens, B., Nenes, A., Nielsen, C. J., Swietlicki, E., Putaud, J. P., Balkanski, Y., Fuzzi, S., Horth, J., Moortgat, G. K., Winterhalter, R., Myhre, C. E. L., Tsigaridis, K., Vignati, E., Stephanou, E. G., and Wilson, J.: Organic aerosol and global climate modelling: a review, Atmos. Chem. Phys., 5, 1053–1123, https://doi.org/10.5194/acp-5-1053-2005, 2005.
Karydis, V. A., Tsimpidi, A. P., Pozzer, A., Astitha, M., and Lelieveld, J.: Effects of mineral dust on global atmospheric nitrate concentrations, Atmos. Chem. Phys., 16, 1491–1509, https://doi.org/10.5194/acp-16-1491-2016, 2016.
Lelieveld, J., Evans, J. S., Fnais, M., Giannadaki, D., and Pozzer, A.: The contribution of outdoor air pollution sources to premature mortality on a global scale, Nature, 525, 367–371, https://doi.org/10.1038/nature15371, 2015.
Lim, S. S., Vos, T., Flaxman, A. D., Danaei, G., Shibuya, K., Adair-Rohani, H., AlMazroa, M. A., Amann, M., Anderson, H. R., Andrews, K. G., Aryee, M., Atkinson, C., Bacchus, L. J., Bahalim, A. N., Balakrishnan, K., Balmes, J., Barker-Collo, S., Baxter, A., Bell, M. L., Blore, J. D., Blyth, F., Bonner, C., Borges, G., Bourne, R., Boussinesq, M., Brauer, M., Brooks, P., Bruce, N. G., Brunekreef, B., Bryan-Hancock, C., Bucello, C., Buchbinder, R., Bull, F., Burnett, R. T., Byers, T. E., Calabria, B., Carapetis, J., Carnahan, E., Chafe, Z., Charlson, F., Chen, H., Chen, J. S., Cheng, A. T.-A., Child, J. C., Cohen, A., Colson, K. E., Cowie, B. C., Darby, S., Darling, S., Davis, A., Degenhardt, L., Dentener, F., Des Jarlais, D. C., Devries, K., Dherani, M., Ding, E. L., Dorsey, E. R., Driscoll, T., Edmond, K., Ali, S. E., Engell, R. E., Erwin, P. J., Fahimi, S., Falder, G., Farzadfar, F., Ferrari, A., Finucane, M. M., Flaxman, S., Fowkes, F. G. R., Freedman, G., Freeman, M. K., Gakidou, E., Ghosh, S., Giovannucci, E., Gmel, G., Graham, K., Grainger, R., Grant, B., Gunnell, D., Gutierrez, H. R., Hall, W., Hoek, H. W., Hogan, A., Hosgood Iii, H. D., Hoy, D., Hu, H., Hubbell, B. J., Hutchings, S. J., Ibeanusi, S. E., Jacklyn, G. L., Jasrasaria, R., Jonas, J. B., Kan, H., Kanis, J. A., Kassebaum, N., Kawakami, N., Khang, Y.-H., Khatibzadeh, S., Khoo, J.-P., Kok, C., Laden, F., Lalloo, R., Lan, Q., Lathlean, T., Leasher, J. L., Leigh, J., Li, Y., Lin, J. K., Lipshultz, S. E., London, S., Lozano, R., Lu, Y., Mak, J., Malekzadeh, R., Mallinger, L., Marcenes, W., March, L., Marks, R., Martin, R., McGale, P., McGrath, J., Mehta, S., Memish, Z. A., Mensah, G. A., Merriman, T. R., Micha, R., Michaud, C., Mishra, V., Hanafiah, K. M., Mokdad, A. A., Morawska, L., Mozaffarian, D., Murphy, T., Naghavi, M., Neal, B., Nelson, P. K., Nolla, J. M., Norman, R., Olives, C., Omer, S. B., Orchard, J., Osborne, R., Ostro, B., Page, A., Pandey, K. D., Parry, C. D. H., Passmore, E., Patra, J., Pearce, N., Pelizzari, P. M., Petzold, M., Phillips, M. R., Pope, D., Pope Iii, C. A., Powles, J., Rao, M., Razavi, H., Rehfuess, E. A., Rehm, J. T., Ritz, B., Rivara, F. P., Roberts, T., Robinson, C., Rodriguez-Portales, J. A., Romieu, I., Room, R., Rosenfeld, L. C., Roy, A., Rushton, L., Salomon, J. A., Sampson, U., Sanchez-Riera, L., Sanman, E., Sapkota, A., Seedat, S., Shi, P., Shield, K., Shivakoti, R., Singh, G. M., Sleet, D. A., Smith, E., Smith, K. R., Stapelberg, N. J. C., Steenland, K., Stöckl, H., Stovner, L. J., Straif, K., Straney, L., Thurston, G. D., Tran, J. H., Van Dingenen, R., van Donkelaar, A., Veerman, J. L., Vijayakumar, L., Weintraub, R., Weissman, M. M., White, R. A., Whiteford, H., Wiersma, S. T., Wilkinson, J. D., Williams, H. C., Williams, W., Wilson, N., Woolf, A. D., Yip, P., Zielinski, J. M., Lopez, A. D., Murray, C. J. L., and Ezzati, M.: A comparative risk assessment of burden of disease and injury attributable to 67 risk factors and risk factor clusters in 21 regions, 1990–2010: a systematic analysis for the Global Burden of Disease Study 2010, Lancet, 380, 2224–2260, https://doi.org/10.1016/S0140-6736(12)61766-8, 2012.
Meskhidze, N., Chameides, W. L., Nenes, A., and Chen, G.: Iron mobilization in mineral dust: Can anthropogenic SO2 emissions affect ocean productivity?, Geophys. Res. Lett., 30, 2085, https://doi.org/10.1029/2003gl018035, 2003.
National Academies of Sciences, Engineering, and Medicine: The Future of Atmospheric Chemistry Research: Remembering Yesterday, Understanding Today, Anticipating Tomorrow, The National Academies Press, Washington, DC, https://doi.org/10.17226/23573, 2016.
Pinder, R. W., Adams, P. J., and Pandis, S. N.: Ammonia Emission Controls as a Cost-Effective Strategy for Reducing Atmospheric Particulate Matter in the Eastern United States, Environ. Sci. Technol., 41, 380–386, https://doi.org/10.1021/es060379a, 2007.
Pinder, R. W., Dennis, R. L., and Bhave, P. V.: Observable indicators of the sensitivity of PM2.5 nitrate to emission reductions – Part I: Derivation of the adjusted gas ratio and applicability at regulatory-relevant time scales, Atmos. Environ., 42, 1275–1286, https://doi.org/10.1016/j.atmosenv.2007.10.039, 2008.
Pope III, C. A.,, Burnett, R. T., Thurston, G. D., Thun, M. J., Calle, E. E., Krewski, D., and Godleski, J. J.: Cardiovascular mortality and long-term exposure to particulate air pollution: epidemiological evidence of general pathophysiological pathways of disease, Circulation, 109, 71–77, https://doi.org/10.1161/01.CIR.0000108927.80044.7F, 2004.
Pye, H. O. T., Nenes, A., Alexander, B., Ault, A. P., Barth, M. C., Clegg, S. L., Collett Jr., J. L., Fahey, K. M., Hennigan, C. J., Herrmann, H., Kanakidou, M., Kelly, J. T., Ku, I.-T., McNeill, V. F., Riemer, N., Schaefer, T., Shi, G., Tilgner, A., Walker, J. T., Wang, T., Weber, R., Xing, J., Zaveri, R. A., and Zuend, A.: The Acidity of Atmospheric Particles and Clouds, Atmos. Chem. Phys. Discuss., https://doi.org/10.5194/acp-2019-889, in review, 2019.
Seinfeld, J. H. and Pandis, S. N.: Atmospheric Chemistry and Physics: From Air Pollution to Climate Change, John Wiley & Sons, Hoboken, 2016.
Sander, R.: Compilation of Henry's law constants (version 4.0) for water as solvent, Atmos. Chem. Phys., 15, 4399–4981, https://doi.org/10.5194/acp-15-4399-2015, 2015.
Sardar, S. B., Fine, P. M., and Sioutas, C.: Seasonal and spatial variability of the size-resolved chemical composition of particulate matter (PM10) in the Los Angeles Basin, J. Geophys. Res., 110, D07S08, https://doi.org/10.1029/2004jd004627, 2005.
Saylor, R., Myles, L., Sibble, D., Caldwell, J., and Xing, J.: Recent trends in gas-phase ammonia and PM2.5 ammonium in the southeast United States, J. Air Waste Manage., 65, 347–357, https://doi.org/10.1080/10962247.2014.992554, 2015.
Shi, X., Nenes, A., Xiao, Z., Song, S., Yu, H., Shi, G., Zhao, Q., Chen, K., Feng, Y., Russell, A.G.: High-resolution datasets unravel the effects of sources and meteorological conditions on nitrate and its gas-particle partitioning, Environ. Sci. Technol., 53, 3048–3057, 2019.
Skjøth, C. A. and Geels, C.: The effect of climate and climate change on ammonia emissions in Europe, Atmos. Chem. Phys., 13, 117–128, https://doi.org/10.5194/acp-13-117-2013, 2013.
Tsimpidi, A. P., Karydis, V. A., and Pandis, S. N.: Response of inorganic fine particulate matter to emission changes of sulfur dioxide and ammonia: The Eastern United States as a case study, J. Air Waste Manage., 57, 1489–1498, https://doi.org/10.3155/1047-3289.57.12.1489, 2007.
Vasilakos, P., Russell, A., Weber, R., and Nenes, A.: Understanding nitrate formation in a world with less sulfate, Atmos. Chem. Phys., 18, 12765–12775, https://doi.org/10.5194/acp-18-12765-2018, 2018.
Weber, R. J., Guo, H., Russell, A. G., and Nenes, A.: High aerosol acidity despite declining atmospheric sulfate concentrations over the past 15 years, Nat. Geosci., 9, 282–285, https://doi.org/10.1038/ngeo2665, 2016.
West, J. J., Ansari, A. S., and Pandis, S. N.: Marginal PM2.5: nonlinear aerosol mass response to sulfate reductions in the eastern United States, J. Air Waste Manage., 49, 1415–1424, 1999.
Zhang, Q., Jimenez, J. L., Canagaratna, M. R., Allan, J. D., Coe, H., Ulbrich, I., Alfarra, M. R., Takami, A., Middlebrook, A. M., Sun, Y. L., Dzepina, K., Dunlea, E., Docherty, K., DeCarlo, P. F., Salcedo, D., Onasch, T., Jayne, J. T., Miyoshi, T., Shimono, A., Hatakeyama, S., Takegawa, N., Kondo, Y., Schneider, J., Drewnick, F., Borrmann, S., Weimer, S., Demerjian, K., Williams, P., Bower, K., Bahreini, R., Cottrell, L., Griffin, R. J., Rautiainen, J., Sun, J. Y., Zhang, Y. M., and Worsnop, D. R.: Ubiquity and dominance of oxygenated species in organic aerosols in anthropogenically-influenced Northern Hemisphere midlatitudes, Geophys. Res. Lett., 34, L13801, https://doi.org/10.1029/2007gl029979, 2007.
chemical regimeof PM sensitivity to ammonia and nitric acid availability.