the Creative Commons Attribution 4.0 License.
the Creative Commons Attribution 4.0 License.
 | 07 Jan 2020
The changing role of organic nitrates in the removal and transport of NOx
Paul S. Romer Present
Azimeh Zare
A better understanding of the chemistry of nitrogen oxides (NOx) is crucial to effectively reducing air pollution and predicting future air quality. The response of NOx lifetime to perturbations in emissions or in the climate system is set in large part by whether NOx loss occurs primarily by the direct formation of HNO3 or through the formation of alkyl and multifunctional nitrates (RONO2). Using 15 years of detailed in situ observations, we show that in the summer daytime continental boundary layer the relative importance of these two pathways can be well approximated by the relative likelihood that OH will react with NO2 or instead with a volatile organic compound (VOC). Over the past decades, changes in anthropogenic emissions of both NOx and VOCs have led to a significant increase in the overall importance of RONO2 chemistry to NOx loss. We find that this shift is associated with a decreased effectiveness of NOx emissions reductions on ozone production in polluted areas and increased transport of NOx from source to receptor regions. This change in chemistry, combined with changes in the spatial pattern of NOx emissions, is observed to be leading to a flatter distribution of NO2 across the United States, potentially transforming ozone air pollution from a local issue into a regional one.
- Article
(5904 KB) - Full-text XML
- BibTeX
- EndNote


Nitrogen oxides () play a central role in the formation of toxic air pollutants including O3 and secondary aerosols. More broadly, NOx chemistry controls the rates and pathways of atmospheric oxidation by determining the concentration of the three most important tropospheric oxidants: OH, O3, and NO3. NOx emissions also directly contribute to nitrogen deposition in sensitive ecosystems (Fowler et al., 2013). Due to its harmful effects to the environment and human health, NOx has been the target of emissions control strategies since the 1970s, causing anthropogenic NOx emissions in the United States to have decreased by a factor of 2 or more over the past 30 years (United States Environmental Protection Agency, 2018). Understanding the consequences of these past changes and predicting the results of future emissions reductions on the atmosphere requires a quantitative description of feedbacks between NOx concentrations and NOx chemistry.
After emission to the atmosphere, removal of NOx occurs through two primary pathways: conversion to HNO3 and conversion to alkyl and multifunctional nitrates (RONO2). Once formed, HNO3 is nearly chemically inert in the troposphere, with a lifetime to reaction or photolysis of over 50 h. HNO3 is therefore removed almost entirely by wet and dry deposition. RONO2 represents a class of diverse molecules, with atmospheric lifetimes ranging from hours to days depending on the properties of the organic backbone (R group). The loss of RONO2 is divided among reactions that release NOx from the R group and recycle it back to the atmosphere, reactions that result in heterogeneous hydrolysis to form HNO3, and direct deposition. The later two pathways permanently remove NOx from the atmosphere (Nguyen et al., 2015; Romer et al., 2016; Fisher et al., 2016). Other NOx oxidation products, such as peroxy acetyl nitrate (PAN) or HONO, can play an important role in the transport and redistribution of NOx but do not generally lead to permanent NOx removal.
Historically, direct HNO3 production was thought to be the only important NOx loss pathway, with RONO2 chemistry playing at most a minor role. However, several studies have shown that the formation rate of RONO2 in cities or forested regions can be competitive with or greater than the direct production rate of nitric acid (Rosen et al., 2004; Farmer et al., 2011; Browne et al., 2013; Romer et al., 2016; Sobanski et al., 2017).
The relative importance of HNO3 and RONO2 production is an important factor in setting the lifetime of NOx (Romer et al., 2016), and it affects the response of NOx loss to temperature (Romer et al., 2018). Due to their different production pathways, the relative importance of HNO3 and RONO2 production also controls how NOx loss and ozone production are affected by changes to emissions of NOx or volatile organic compounds (VOCs). By terminating the radical chain reactions, the formation of RONO2 serves to suppress ozone formation in polluted areas (Perring et al., 2010; Farmer et al., 2011; Edwards et al., 2013; Lee et al., 2014). Several studies have also shown that RONO2 can efficiently partition into aerosols, potentially explaining a large portion of secondary organic aerosol in a wide range of environments (Rollins et al., 2012; Pye et al., 2015; Xu et al., 2015b; Lee et al., 2016).
Multiple previous studies have used chemical transport models to investigate how the relative production of RONO2 and HNO3 varies in different environments. Browne and Cohen (2012) modeled NOx loss over the Canadian boreal forest using WRF-Chem and Fisher et al. (2016) and Zare et al. (2018) studied NOx loss in the southeast United States using GEOS-Chem and WRF-Chem, respectively. These studies agree that in rural and forested areas with lower NOx emissions and higher biogenic VOC emissions, RONO2 chemistry is often the largest sink of NOx.
However, these studies diverge in their conclusions about the overall importance of RONO2 chemistry as a NOx sink and how it is likely to change in the future. In a WRF-Chem simulation identical to those described in Zare et al. (2018), RONO2 chemistry is found to be 60 % or more of the total NOx loss across broad swathes of the southeast United States (Fig. 1), while Fisher et al. (2016) found RONO2 production to be concentrated in rather small sections of the southeast. Furthermore, Fisher et al. (2016) suggested that the contribution of RONO2 chemistry to NOx loss across the region is unlikely to change significantly in the future due to the spatial segregation of NOx and VOC emissions. On the other hand, Zare et al. (2018) and Browne and Cohen (2012) suggested that the contribution of RONO2 chemistry to NOx loss was likely to grow significantly if anthropogenic NOx emissions decreased across the United States.
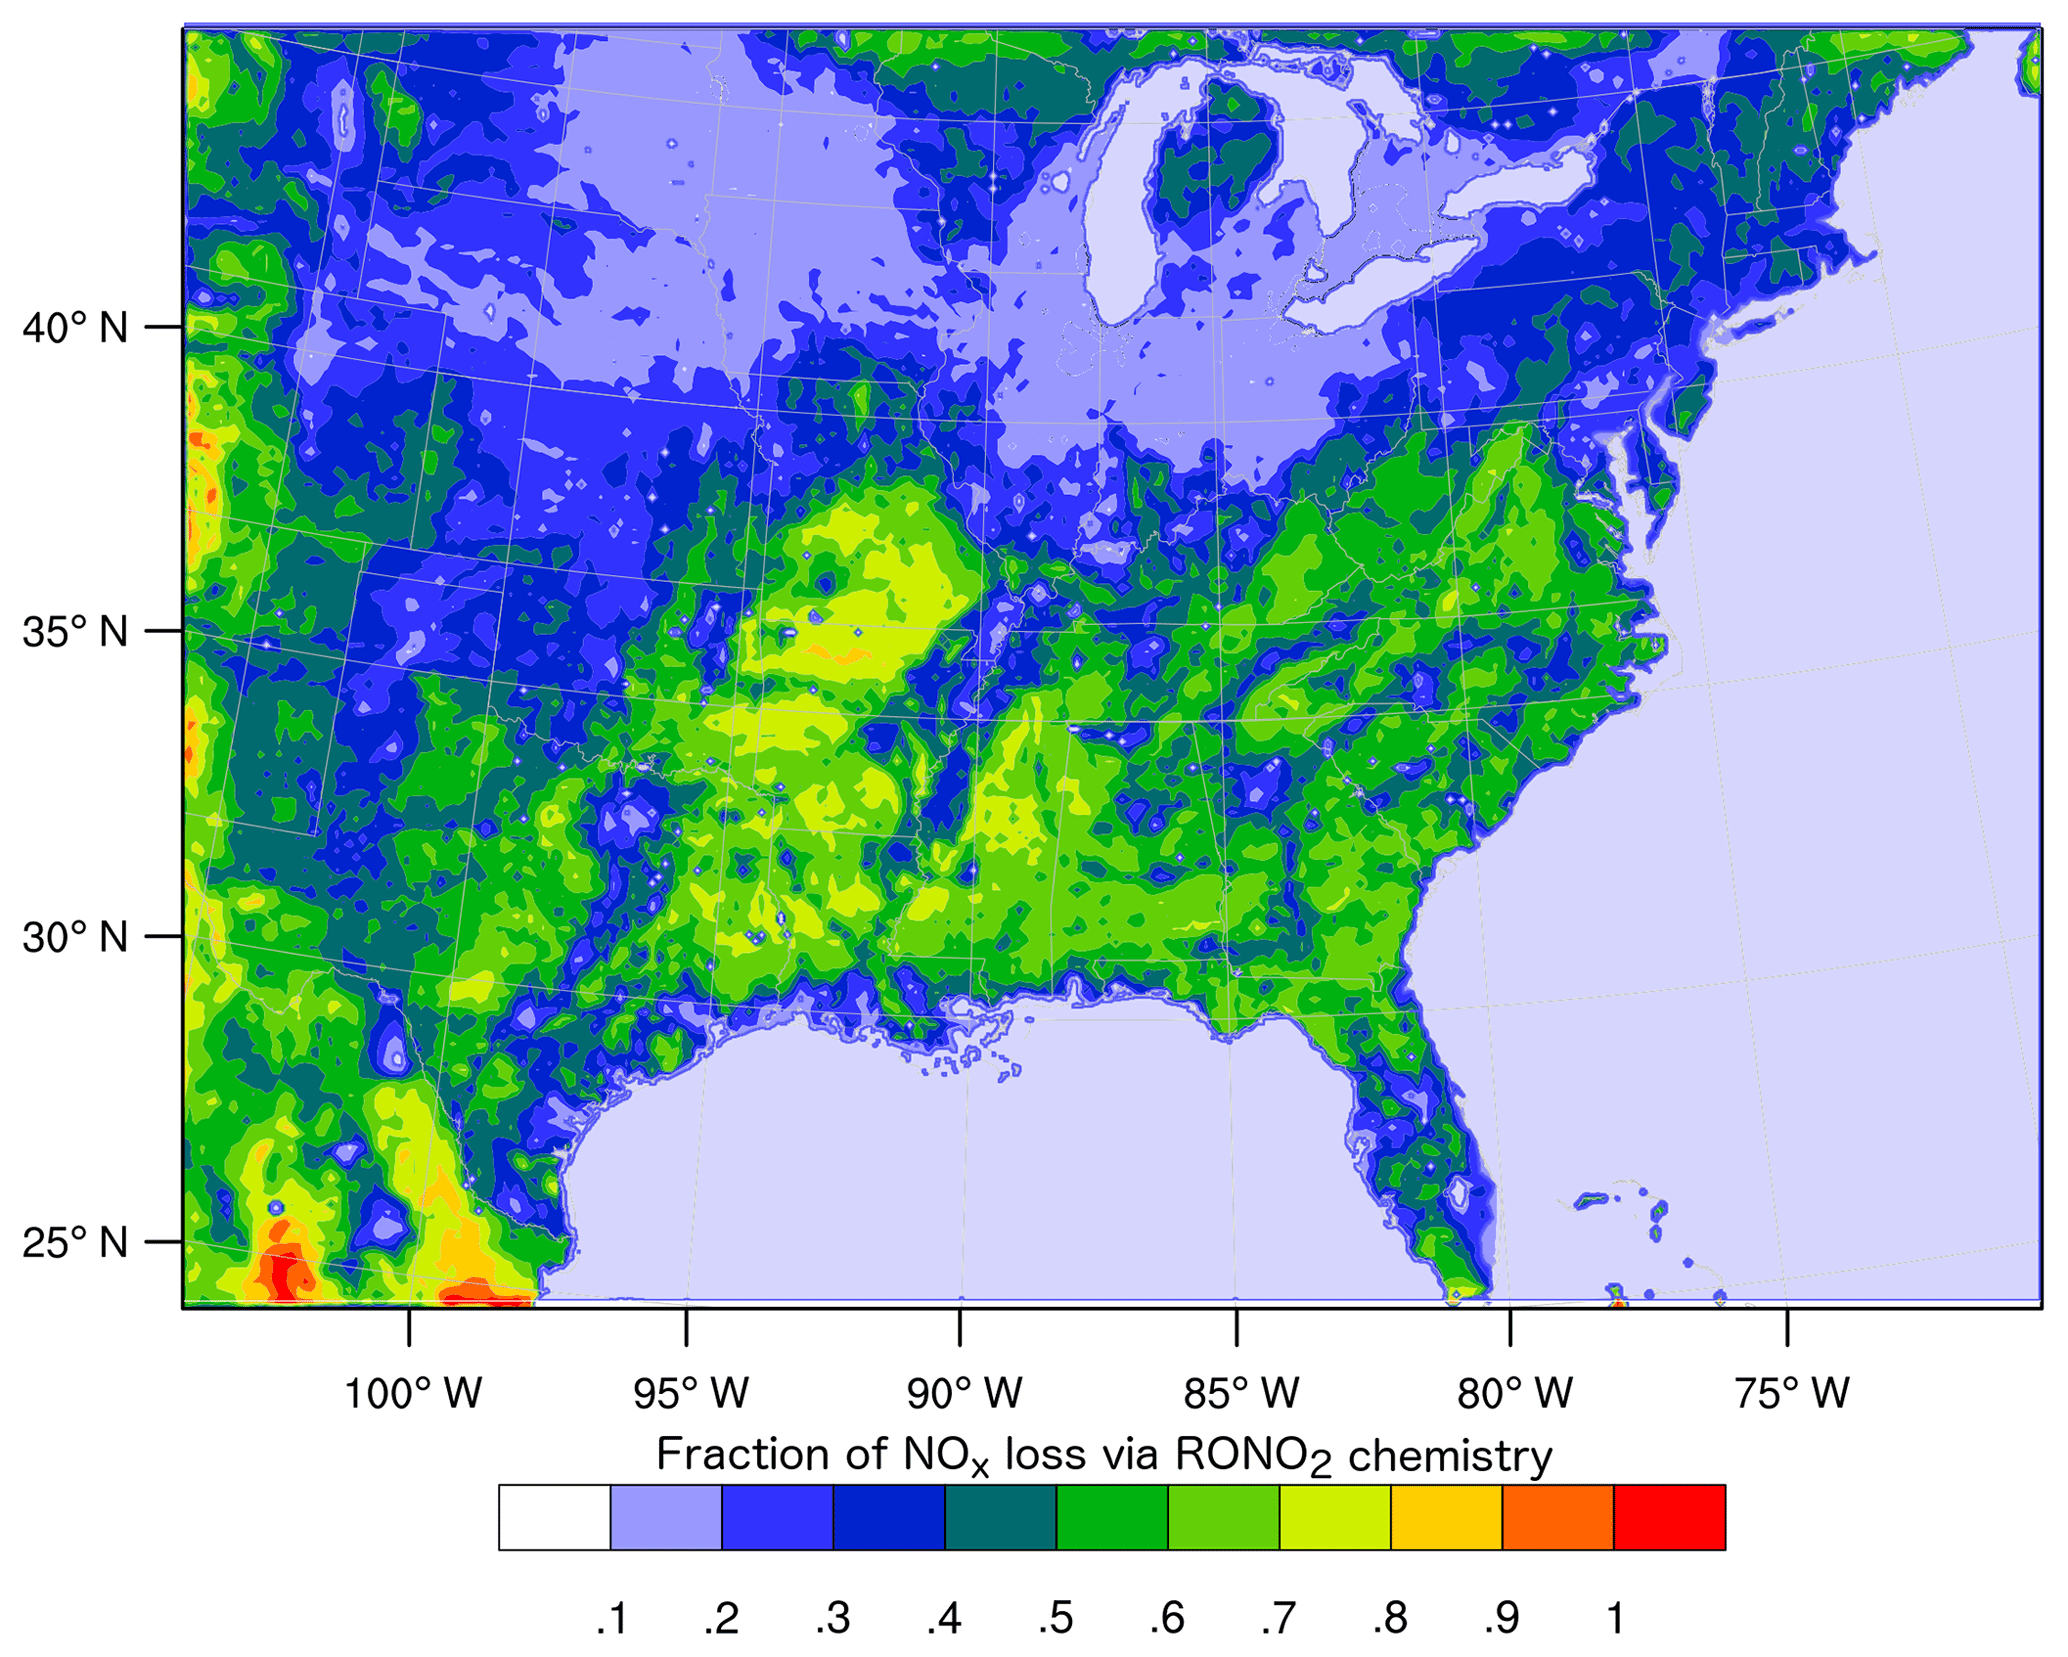
Figure 1Average (24 h) fraction of total NOx loss via RONO2 chemistry over the southeast United States in summer 2013 simulated using the RACM2_Berkeley2 mechanism in WRF-Chem (Zare et al., 2018).
Here we use in situ observations from a collection of 13 different field deployments to investigate how the relative daytime production of RONO2 and HNO3 varies across the United States and how this fraction may change in the future. We show that the relative production of RONO2 and HNO3 can be well described by the relative OH reactivity of NO2 and of the combined VOC mixture. As both anthropogenic NOx and anthropogenic VOC emissions have decreased substantially in the United States over the past 20 years, the relative role of these two pathways has shifted as well. While the shift has generally been towards an increasing role for RONO2 chemistry, the shift has been smallest in large cities and largest in the transitional regime around them. Combined with changing emission patterns of NOx, the shift in NOx chemistry is leading to a flatter distribution of NOx across the continental United States.
NOx is emitted to the atmosphere as NO from a range of anthropogenic and biogenic sources, including motor vehicles, power plants, lightning, fires, and soil bacteria. In the daytime, NO interconverts with NO2 on a timescale of minutes through Reactions (R1–R2), forming the chemical family NOx. When NOx is combined with VOCs and hydrogen oxides (HOx), a set of linked radical chain reactions is formed (Reactions R3–R6). As part of these reactions, two molecules of NO are oxidized to NO2, leading to the net production of O3 through Reaction (R2).
The reactions that propagate the catalytic cycle occur at the same time as reactions that remove NOx from the atmosphere, terminating the cycle. Direct HNO3 production occurs through the association of OH with NO2 (Reaction R7). RONO2 compounds are produced as a minor channel of the RO2+NO reaction. While the RO2+NO reaction typically produces NO2 and leads to the production of ozone (Reaction R4b), for a small fraction of the time these two radicals will instead associate to form an organic nitrate (Reaction R4a).
The branching ratio is designated α and is determined by the nature of the R group as well as the temperature and pressure. Longer carbon backbones and lower temperatures increase α, while lower pressures and oxygenated functional groups decrease it (Wennberg et al., 2018). Typical values of α in the summertime continental boundary layer range from near 0 for small hydrocarbons and highly oxygenated compounds to over 0.20 for large alkanes and alkenes (Perring et al., 2013).
The total rate of RONO2 production can be calculated from the properties of individual VOCs measured in the atmosphere via Eq. (1). In Eq. (1), represents the yield of RO2 radicals from VOC oxidation and represents the fraction of those RO2 radicals that react with NO instead of reacting with HO2 or undergoing unimolecular isomerization (e.g., Teng et al., 2017). is close to 1 under polluted or moderately polluted conditions but decreases as the concentration of NOx decreases.
If the contributions from individual VOCs are summed and averaged, the total production of RONO2 can also be calculated from the effective behavior of the VOC mixture via Eq. (2), where VOCR is the sum of all measured VOC concentrations weighted by their reaction rate with OH.
In a similar fashion, the production of HNO3 can be calculated via Eq. (3), where NO2R is the NO2 reactivity, or the concentration of NO2 multiplied by . At 298 K and 1 atm, 10 ppb of NO2 is equivalent to an NO2R of 2.3 s−1.
Total NOx loss is the sum of the conversion to HNO3 and conversion to RONO2. The fraction of NOx loss via RONO2 production can be expressed analytically as Eq. (4).
The relative production of RONO2 and HNO3 is seen to be controlled by two factors: the first describing the chemistry of RO2 radicals (αeff, , ) and the second the ratio of NO2R to VOCR, which describes whether OH is more likely to react with a VOC or with NO2. Because Eq. (4) concerns fractional loss of NOx, the concentration of OH, which affects RONO2 and HNO3 production equally, does not appear in the result.
We show below that in the summertime continental boundary layer, the terms describing RO2 radical chemistry vary significantly less than the NO2R∕VOCR ratio, allowing the relative importance of RONO2 and HNO3 chemistry to be roughly estimated from only a single ratio.
3.1 Daytime chemistry
Relative RONO2 and HNO3 production rates were calculated for 13 separate campaign deployments in the Northern Hemisphere over the past 20 years. Campaigns were selected that included measurements of NOx, HNO3, O3, HCHO, a wide range of VOCs, and total organic nitrates (ΣRONO2). Although they do not include measurements of ΣRONO2, ITCT2k2 and CALNEX-P3 were also included to provide a pair of measurements of VOCs and NOx in the same geographic location separated in time. A list of all campaigns used in this study is given in Table 1. Where available, measurements of OH and HO2 were used to directly calculate RO2 formation and loss. When these radicals were not available, OH and HO2 radical concentrations were also calculated iteratively based on the total rate of HOx radical production by O3 photolysis, HCHO photolysis, and alkene ozonolysis. When HONO was measured, HONO photolysis was also included as an OH source. In a small fraction of cases (3 % of all data points), NO measurements were not available and NO concentrations were calculated based on the concentrations of O3 and NO2. Details of the radical modeling, including the equations used to calculate the production and loss of these radicals, are given in Appendix A.
ITCT Science Team (2002)INTEX-A Science Team (2006)INTEX-B Science Team (2011)BEARPEX 07 Science Team (2007)ARCTAS-B Science Team (2011)BEARPEX 09 Science Team (2009)CALNEX Science Team (2002a)CALNEX Science Team (2002b)DC3 Science Team (2013)SOAS Science Team (2013)SEAC4RS Science Team (2014)FRAPPÉ Science Team (2014)KORUS-AQ Science Team (2018)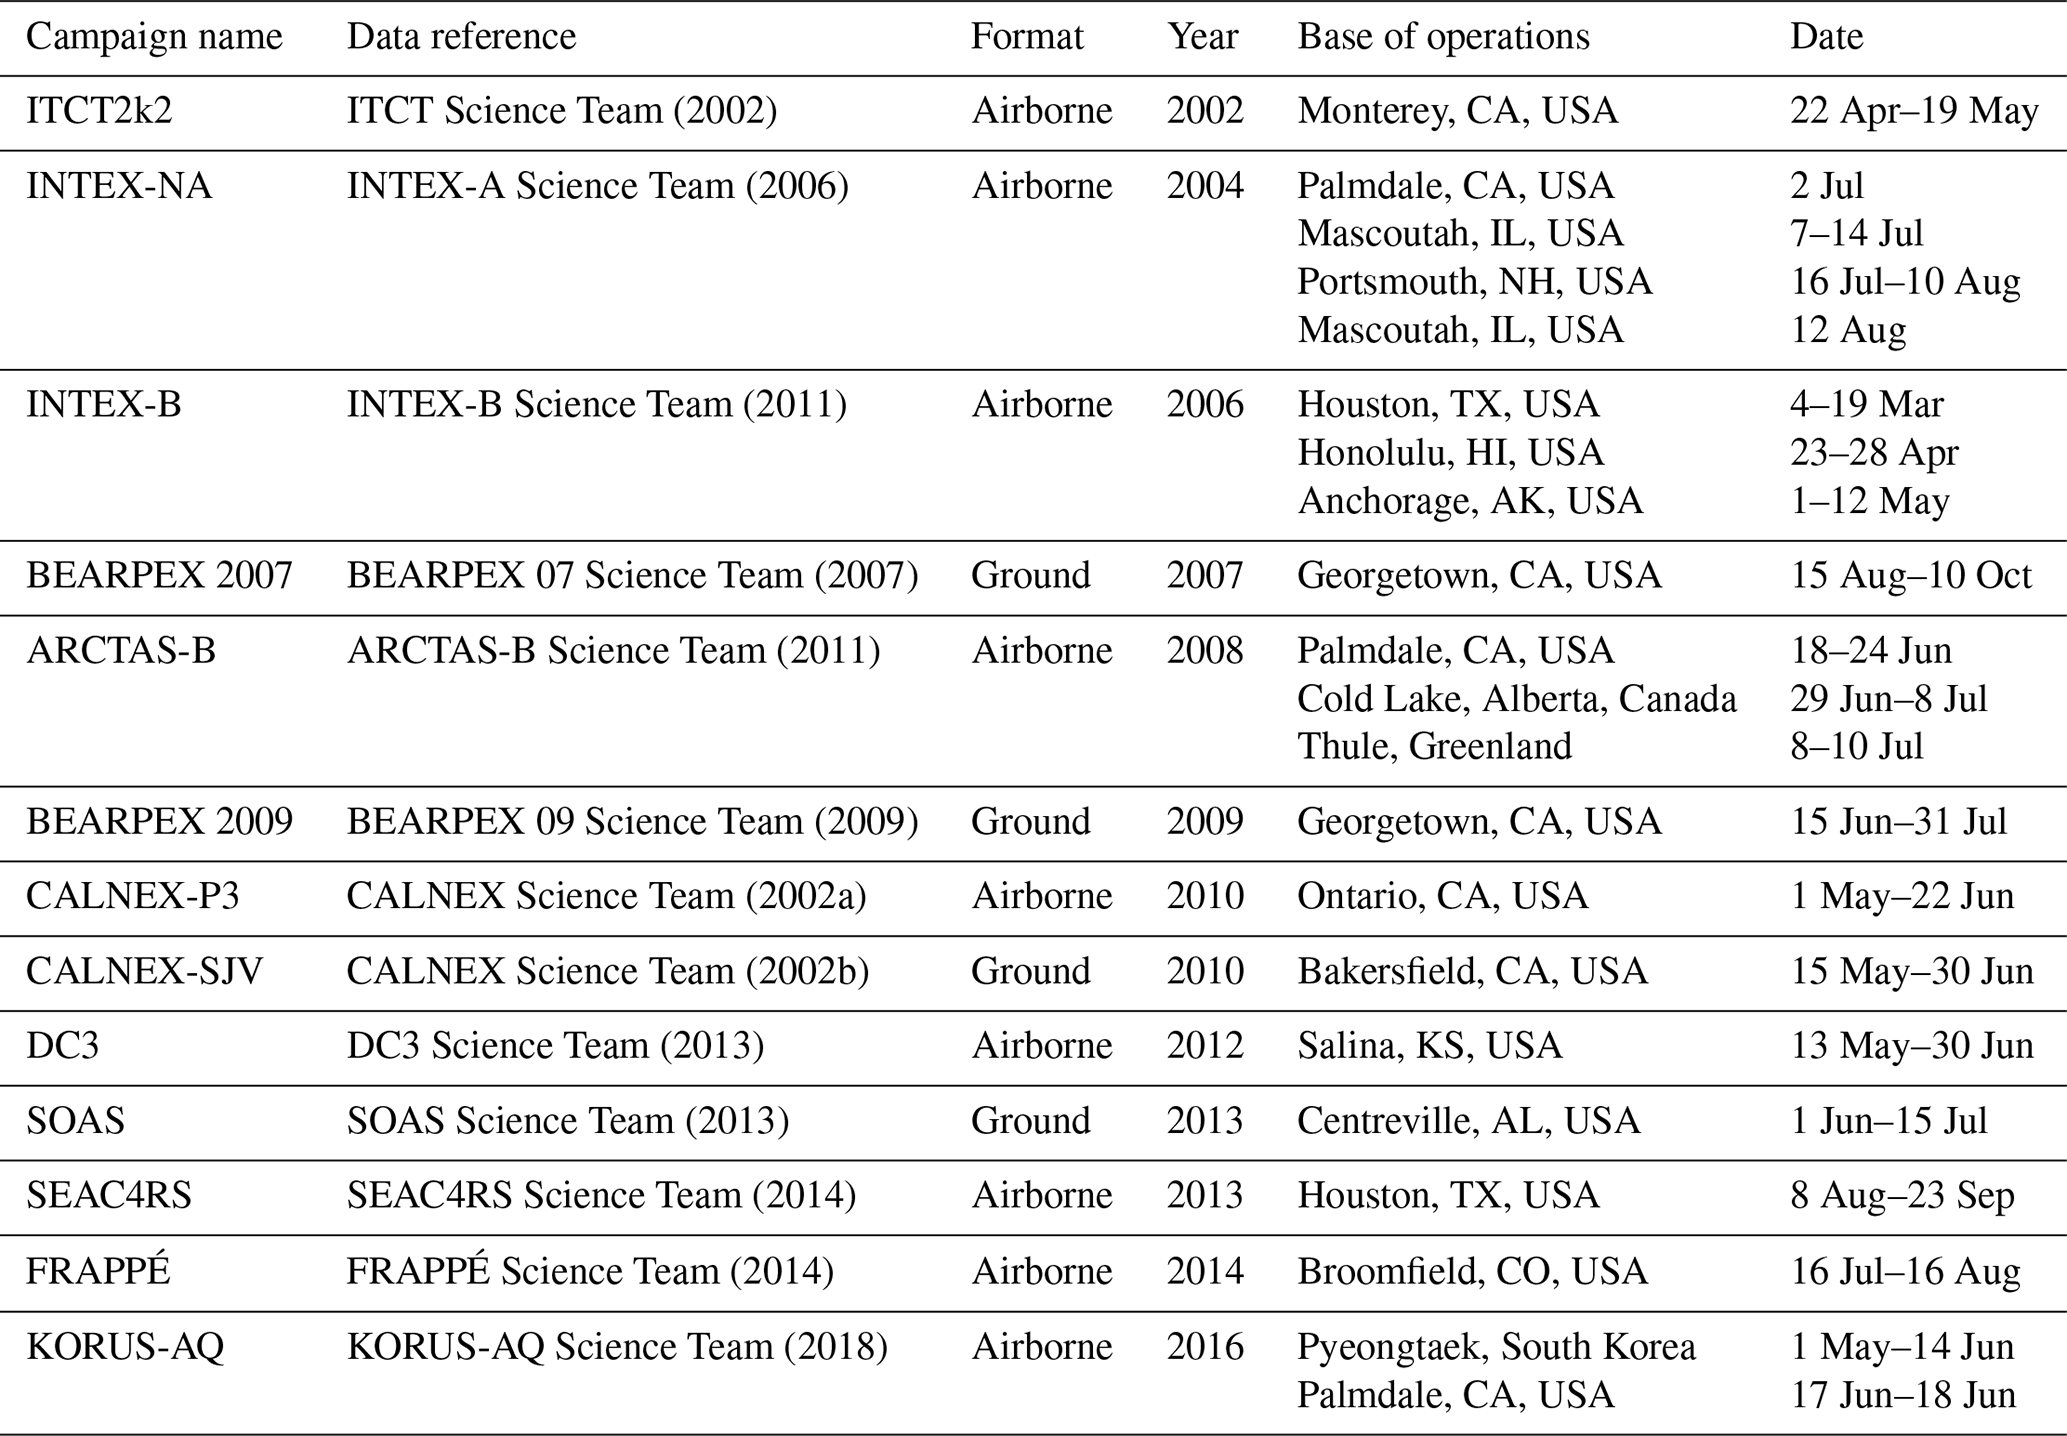
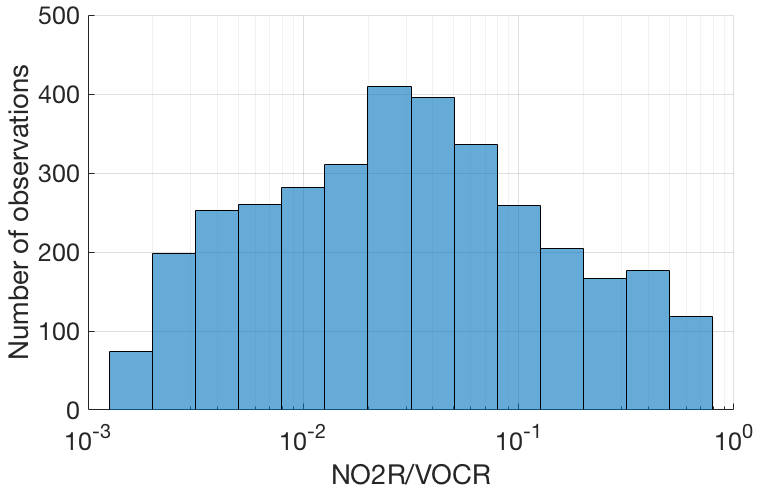
Figure 2Number of points in each bin for which the fraction of NOx loss occurring via RONO2 chemistry could be calculated.
Although these field campaigns do not constitute a random sample of the atmosphere, the combined dataset provides an excellent survey of atmospheric chemistry over a wide range of conditions. The combined dataset includes nearly 8000 data points for which fractional NOx loss can be calculated, spanning nearly 3 orders of magnitude in the ratio of NO2R to VOCR with no significant gaps (Fig. 2).
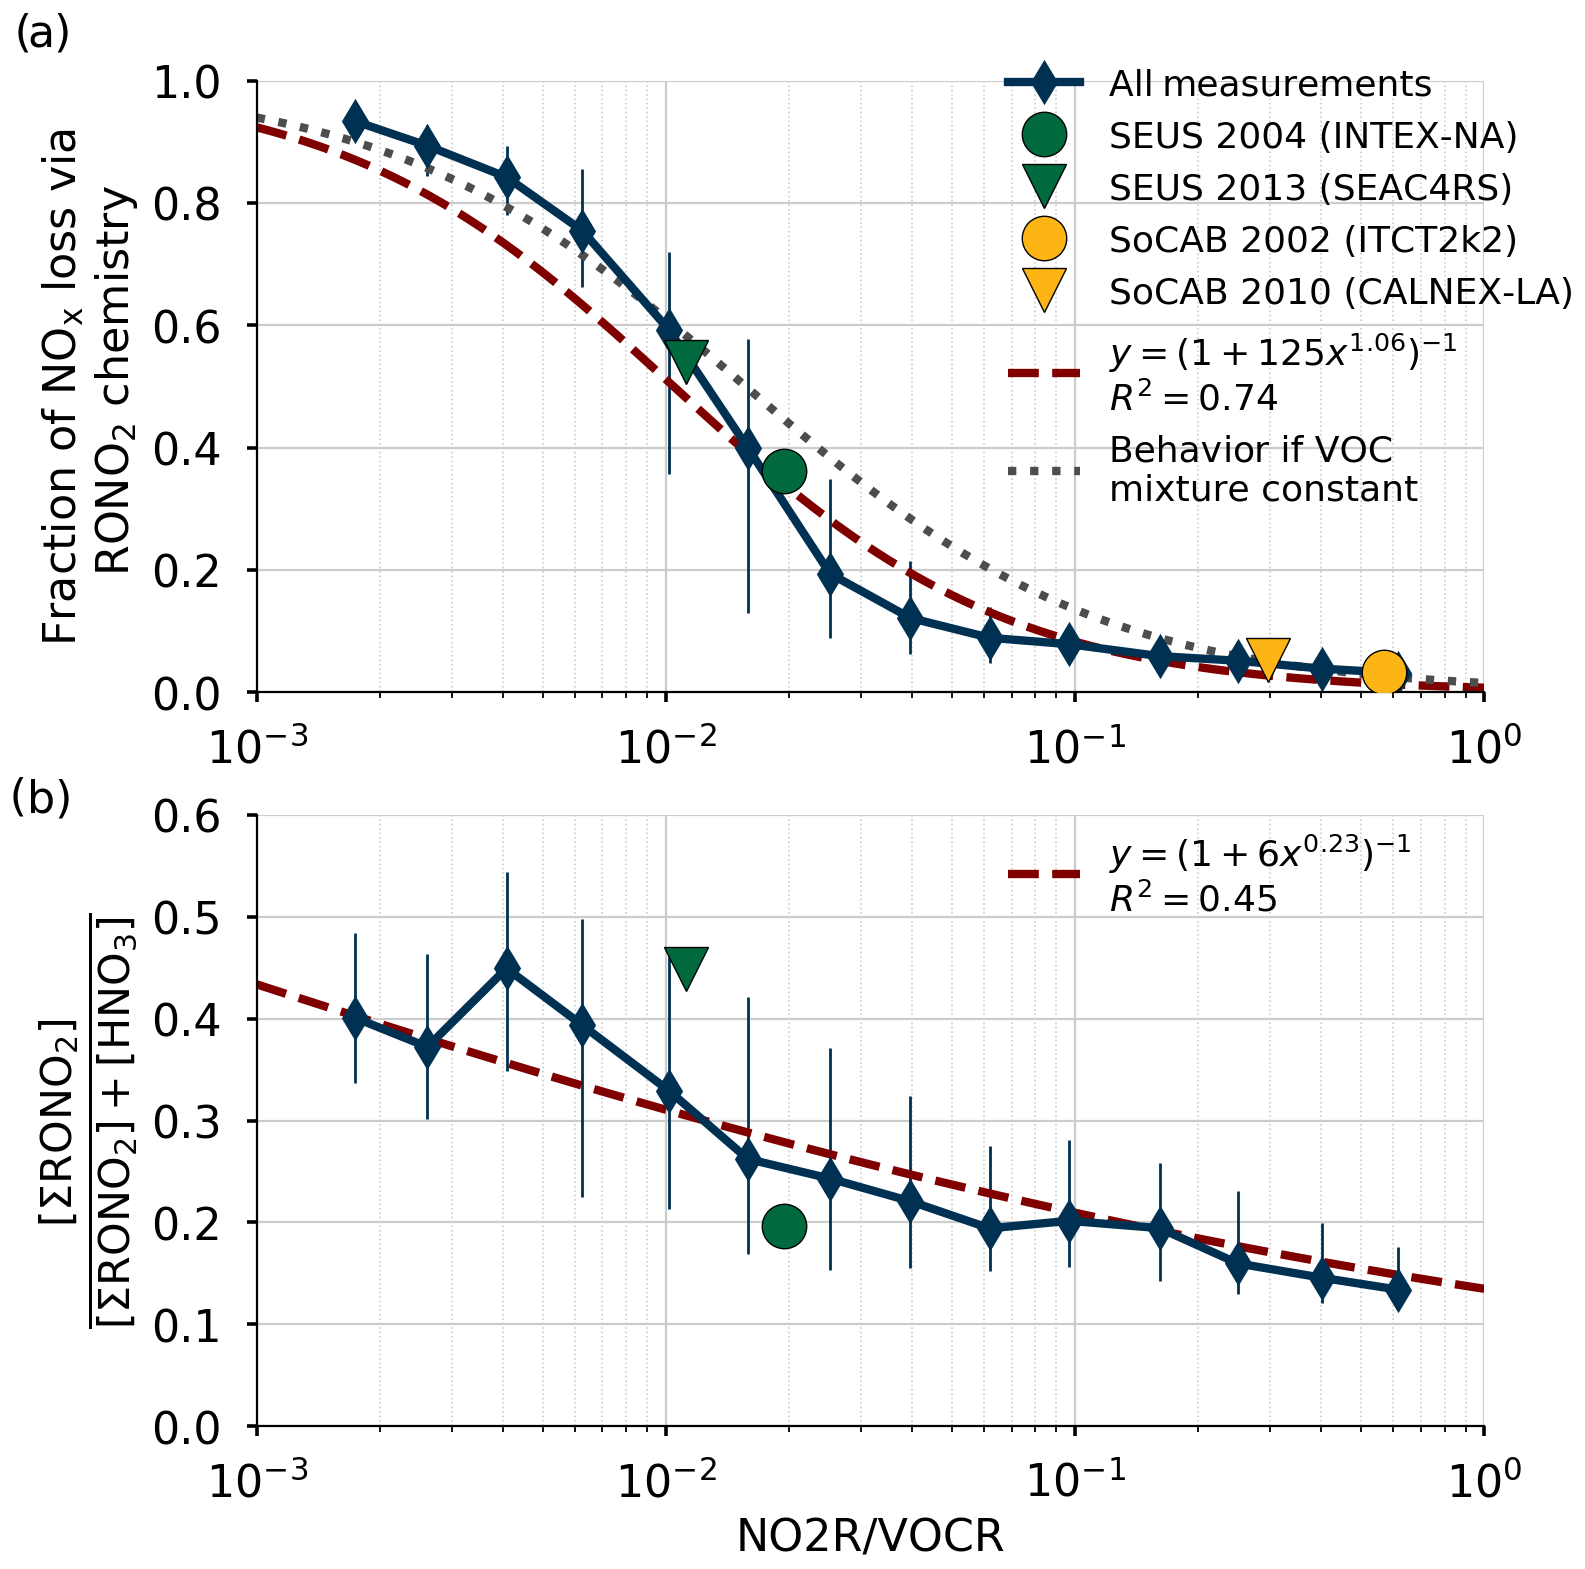
Figure 3Comparison of the relative production rates of RONO2 and HNO3 as a function of NO2R∕VOCR. Used data points are restricted to the continental summer daytime boundary layer (i.e., over land, less than 1.5 km above ground level, and average temperature >10 ∘C). Panel (a) shows the fraction of NOx loss attributable to RONO2 chemistry, as well as a least-squares fit to the data and the expected behavior if αeff, , and were constant. Panel (b) shows the ratio of ΣRONO2 to the sum of HNO3 and ΣRONO2. In each panel, the blue diamonds show the median in each bin, and the vertical lines show the interquartile range.
The fraction of total NOx loss occurring via RONO2 chemistry from all 13 of these campaigns is shown in Fig. 3a for points within the continental summertime boundary layer. Despite spanning a large range of environments, all 13 campaigns are well described by a single function of the form (red line in Fig. 3a). This functional form corresponds to a linear relationship between P(RONO2)∕P(HNO3) and NO2R∕VOCR on a log-log scale. If m is fixed to 1, then this form also corresponds to the expected behavior if the VOC mixture did not change between environments, and so all parameters other than NO2R∕VOCR remained constant (gray line in Fig. 3a).
The calculated increase in fractional NOx loss via RONO2 chemistry as NO2R∕VOCR decreases is matched by an increase in the observed ratio of ΣRONO2 to the sum of ΣRONO2 and HNO3 (Fig. 3b). However, the increase in fractional concentrations as NO2R∕VOCR decreases is much less than the increase in fractional production. At low NO2R∕VOCR ratios, the dominant RONO2 species are typically short lived and can undergo heterogeneous hydrolysis to produce HNO3 (e.g., Browne et al., 2013). This indirect source of HNO3 can be the greatest source of HNO3 in forested environments, and it leads to the relatively weak dependence of fractional concentration on NO2R∕VOCR.
While the fraction of NOx loss occurring via RONO2 chemistry can be well predicted from just the NO2R∕VOCR ratio, the observations exhibit a sharper transition from HNO3-dominated to RONO2-dominated NOx loss than would be expected if the VOC mixture remained constant. This effect can be explained by variation in , αeff, and as NO2R∕VOCR changes. The behavior of these three parameters is shown in Fig. 4. As NO2R∕VOCR decreases, consistently decreases from 0.8 to 0.2, due almost entirely to the decrease in NOx concentrations. In contrast, both and αeff are larger in areas with low NO2R∕VOCR ratios, due to changes in the VOC mixture between environments. In areas where NO2R∕VOCR is high, many of the predominant VOCs, including CO, HCHO, and aromatics, either do not produce RO2 radicals when oxidized by OH or produce RO2 radicals that do not efficiently produce organic nitrates, leading to the relatively low values of and αeff. In areas with low NO2R∕VOCR ratios, the VOC mixture is often dominated by biogenic alkenes such as isoprene and monoterpenes that efficiently produce organic nitrates, leading to higher values of both and αeff. However, although variation in these parameters can help explain some of the observed behavior of fractional NOx loss, the overall variation is much smaller than the variation of the NO2R∕VOCR ratio. Each of the three parameters varies by a factor of 4 or less, while the NO2R∕VOCR ratio varies by a factor of 1000.
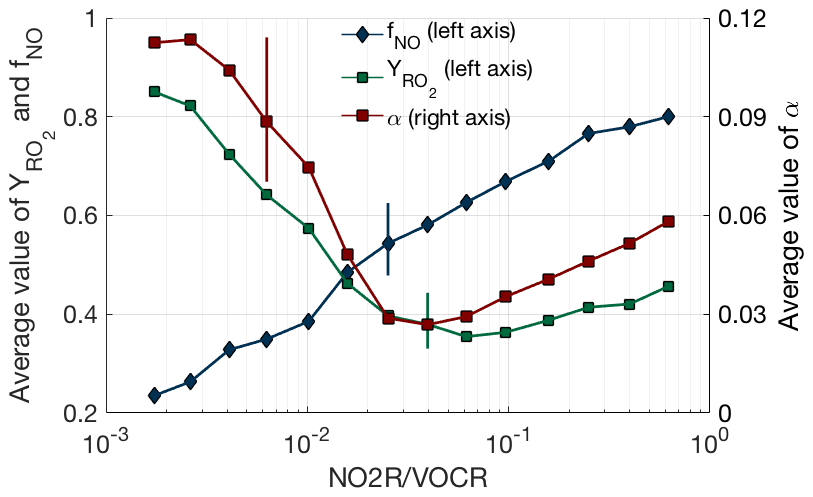
Figure 4VOC oxidation parameters (αeff, , ) as a function of NO2R∕VOCR. Used data points are restricted to the continental summer daytime boundary layer (i.e., over land, less than 1.5 km above ground level, and average temperature >10 ∘C). The line and solid shapes show the median in each bin, and the vertical lines show an example of the interquartile range for each binned parameter.
The conclusion that variation in VOC parameters is small compared to the variation in the NO2R∕VOCR ratio does not hold outside of the summertime continental boundary layer. In the remote marine boundary layer or in the upper troposphere, αeff is extremely low, as the dominant VOCs produce alkyl nitrates at yields of 0.01 or less (Mao et al., 2009; Perring et al., 2013). Under these conditions, HNO3 dominates NOx loss even when NO2R∕VOCR is less than .
The trend calculated from the in situ observations matches that found in model simulations: in areas with high ratios of NO2R to VOCR, HNO3 is the dominant NOx sink, but as concentrations of NOx decrease and concentrations of VOCs increase, the opposite is true. The combined in situ observations show that the importance of RONO2 chemistry to NOx loss is a nonlinear function of the NO2R∕VOCR ratio, leading to a sharp transition between the HNO3-dominated and RONO2-dominated regimes. The sharp transition suggests there is a strong gradient in chemical NOx loss between urban and rural areas, especially in areas with significant biogenic VOC emissions. Furthermore, the sharp transition indicates that some regions may quickly shift from HNO3-dominated to RONO2-dominated regimes if NO2R∕VOCR decreases.
3.2 Nighttime chemistry
While the primary focus of this analysis is on daytime chemistry, a conceptually similar transition may also occur at night. At night, OH concentrations are near zero, and the first step in NOx oxidation is the reaction of NO2 with O3 to produce NO3. This radical can in turn react either with NO2 to form N2O5 or with an alkene to form an organic nitrate (Reactions R8–R9).
Finally, N2O5 can either thermally decompose to re-form NO3 and NO2 or it can hydrolyze on aerosol surfaces to produce HNO3 (Reactions R9–R10).
Although the details are different, the nighttime chemical system shares some fundamental similarities with the daytime system: NOx can be lost through the production of RONO2 or of HNO3, and a key step controlling the relative importance of these two sinks is whether an oxidant reacts with NO2 or with a VOC. These similarities suggest that the relative importance of RONO2 and HNO3 as NOx sinks at night may be controlled by the relative reactivities of NO2 and VOCs towards NO3. In areas where NO3 is more likely to react with NO2, HNO3 production is likely to dominate NOx loss, while the opposite is likely to be true in areas where NO3 is more likely to react with a VOC.
However, quantitatively estimating the relative fraction of NOx lost through these different pathways is not practical with the combined dataset presented here. There have been relatively few measurements of the nocturnal atmosphere (only 4 of the 13 campaigns in Table 1 include nighttime measurements) and there remain significant uncertainties in the kinetics of nighttime NOx loss. In particular, the overall rate of N2O5 hydrolysis is controlled by the reactive uptake parameter γ and the aerosol surface area, both of which can vary by multiple orders of magnitude (Brown et al., 2009; McDuffie et al., 2018). Variation in the rate of N2O5 hydrolysis may therefore also play a major role in controlling the relative importance of RONO2 and HNO3 chemistry to NOx loss at night. While developing a more quantitative understanding of the trends in the chemical mechanisms of nocturnal NOx loss is an important area for future research, the conceptual similarity between the daytime and nighttime regimes suggests that conclusions based on daytime NOx chemistry may also be relevant to the nighttime.
Using the trends in Fig. 3a to understand trends in NOx chemistry over time is only possible if the response to variation across space is equivalent to the response to variation across time. Two direct comparisons of fractional NOx loss in the same environment but at different times are found to fall along the same curve as the variation between campaigns in different locations (Fig. 3), indicating that such a substitution is valid in this analysis. The first case, INTEX-NA and SEAC4RS, sampled the southeast United States (SEUS) in 2004 and 2013; the second case, ITCT2k2 and CALNEX-P3, sampled the South Coast Air Basin (SoCAB) around Los Angeles in 2002 and 2010. Averages from these pairs of campaigns are shown in Fig. 3a and all four points fall along the same overall curve. For INTEX-NA and SEAC4RS, the shift in chemistry towards the RONO2-dominated regime is accompanied by a dramatic shift in the ratio of ΣRONO2 and HNO3 concentrations, where ΣRONO2 concentrations were only one-quarter of HNO3 in 2004 but were nearly equal to HNO3 in 2013. ΣRONO2 measurements are not available for ITCT2k2 or CALNEX-P3, preventing a similar comparison from being made for those campaigns.
Together, these cases indicate that the trend from Fig. 3a can be used to predict changes in fractional loss if the trend in NO2R∕VOCR is known. Over the past decade, satellite measurements of NO2 show a significant decrease in national NO2 concentrations, reporting an average decrease of 4.5 %–7 % per year between 2005 and 2011 (Russell et al., 2012). No comparable satellite observations of VOCs exist, but studies in multiple locations have reported a decrease in primary anthropogenic VOC concentrations of 5.5 %–7.5 % per year over 2000–2010 (Geddes et al., 2009; Warneke et al., 2012; Pollack et al., 2013; Pusede et al., 2014). In contrast, biogenic VOC concentrations have been either constant or increasing over that same time period (Geddes et al., 2009; Hidy et al., 2014). Oxygenated VOCs show no major trend with time, although there are few long-term measurements of these species (Geddes et al., 2009; Pusede et al., 2014).
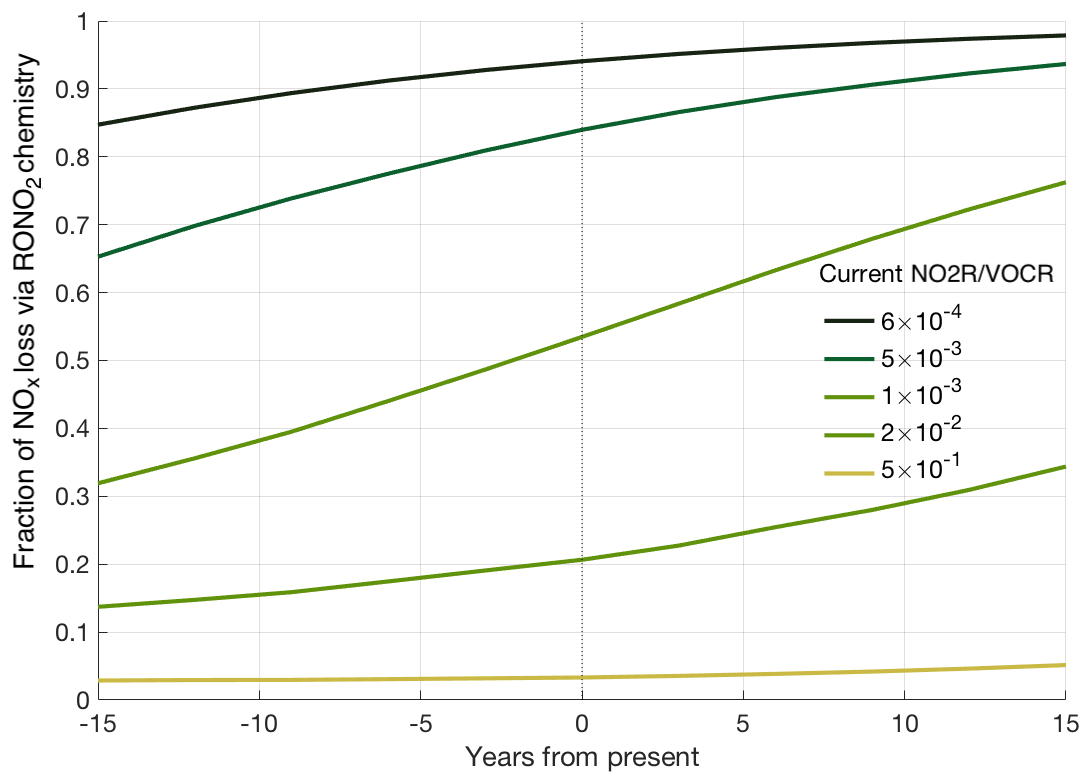
Figure 5Predicted trends in fractional NOx loss over time, calculated from the estimated NO2R∕VOCR ratio assuming a constant 6.5 % yr−1 decrease in anthropogenic VOC concentrations, a 5.5 % yr−1 decrease in NOx concentrations, and a 1.5 % yr−1 increase in biogenic VOC concentrations.
These varied trends in NOx, anthropogenic VOCs, and biogenic VOCs mean that NO2R∕VOCR has not changed uniformly over the past decade. Past NO2R∕VOCR ratios were calculated by assuming a 6.5 % yr−1 decrease to anthropogenic VOC concentrations, a 5.5 % yr−1 decrease to NOx concentrations, and a 1.5 % yr−1 increase in biogenic VOC concentrations over the past 15 years. We also extrapolate these same trends to estimate NO2R∕VOCR 15 years into the future. The calculated NO2R∕VOCR ratios are combined with the relationship from Fig. 3 to estimate fractional NOx loss at different times (Fig. 5). Based on these trends, RONO2 chemistry is seen to have become a larger portion of total NOx loss over the past 15 years, although the change is not evenly distributed. The similar trends in NOx and anthropogenic VOCs cause there to have been little to no change in the regions with the highest NO2R∕VOCR ratios (typically large cities). The largest changes are projected to occur in regions with moderate NO2R∕VOCR ratios. In these regions, biogenic VOCs often account for a greater fraction of the VOCR, leading to significant decreases in NO2R∕VOCR over the past 15 years. In addition, the response of fractional NOx loss to changes in the NO2R∕VOCR ratio is magnified in areas where both RONO2 and HNO3 chemistry contribute to NOx loss. In this transitional regime, if recent trends continue, the fraction of NOx loss occurring via RONO2 chemistry could double in the next 15 years. Given the large number of data points sampled in this transition regime (Fig. 2), many regions of the United States are therefore likely to transition from a regime where HNO3 dominates NOx loss to a mixed or RONO2-dominated regime.
The growing importance of RONO2 chemistry to NOx loss has several implications for air quality. Most directly, it means that understanding NOx chemistry in all but the most polluted megacities requires including the effects of RONO2 chemistry. More theoretically, the transition from HNO3- to RONO2-dominated NOx loss affects how atmospheric chemistry will respond to changes in emissions of NOx and VOCs. Because RONO2 species are produced in the same set of reactions that produce O3, the fractional loss of NOx via RONO2 chemistry is directly proportional to the ozone production efficiency (OPE), the ratio of ozone production to NOx loss (Eq. 5).
Fundamentally, OPE represents the total amount of ozone produced for each molecule of NOx emitted. When considering ozone pollution on regional scales, OPE is a more appropriate metric than instantaneous ozone production, because it accounts for ozone production both locally and further afield.
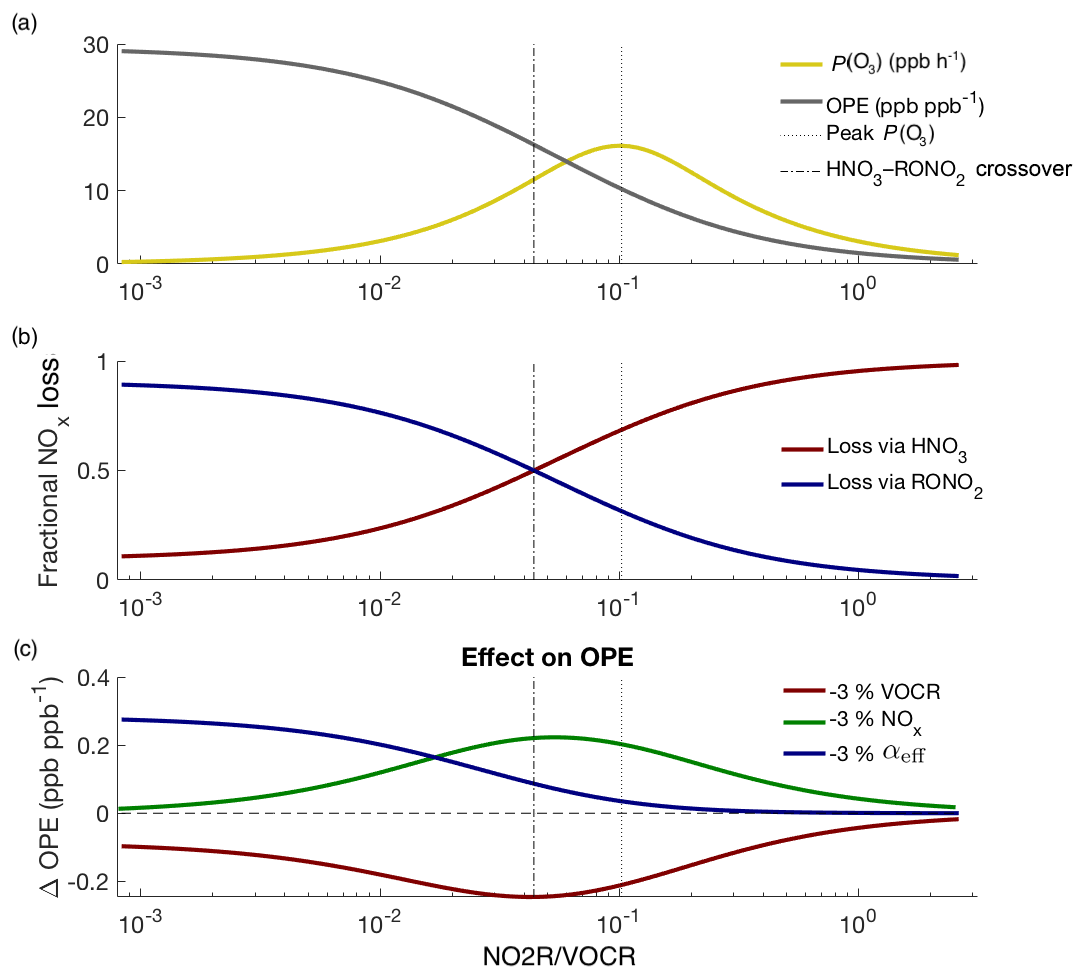
Figure 6Theoretical picture of NOx and O3 chemistry, calculated using variable NOx concentrations and fixed VOCR, P(HOx), and αeff. Panel (a) shows how P(O3) and OPE change as NOx changes; panel (b) shows how the fractional NOx loss changes as NO2R∕VOCR decreases; panel (c) shows that changes to NOx and VOCR have their greatest effect on OPE not when P(O3) is at a maximum, but at the crossover point between the RONO2-dominated and HNO3-dominated regimes.
Figure 6 uses the theoretic framework described in Romer et al. (2018) to investigate how ozone and NOx chemistry change as a function of NO2R∕VOCR. As the NO2R∕VOCR ratio decreases, OPE increases, reaching an inflection point exactly at the crossover point between the HNO3-dominated and RONO2-dominated regimes (Fig. 6a–b). For the polluted areas of the country, where HNO3 is currently the dominant NOx loss pathway, this means that, for example, interventions to improve air quality by reducing NOx emissions will be fighting uphill because every incremental fractional decrease in NOx emissions will be associated with a growing incremental increase in OPE (Fig. 6c).
In addition, as RONO2 chemistry becomes a more important part of the NOx budget, changes to αeff have an increasing effect on OPE (Fig. 6c). Policy interventions that reduce VOCR but preferentially target high-α compounds (e.g., long-chain alkanes) could inadvertently increase ozone production or OPE (Farmer et al., 2011; Perring et al., 2013).
In addition to the large effects on aerosol yield that changes to NOx and VOC emissions have directly (e.g., Xu et al., 2015a; Pusede et al., 2016), they also affect aerosols by changing the fate of NOx. While both HNO3 and RONO2 can form aerosols (Stelson and Seinfeld, 1982; Pye et al., 2015), the properties of the resulting aerosols are likely to differ. Because HNO3 is a strong acid, a shift towards RONO2 chemistry is likely to increase aerosol pH. An increase in the role of RONO2 chemistry will also cause more of the nitrate aerosol to be organic rather than inorganic, potentially affecting the viscosity and morphology of aerosols.
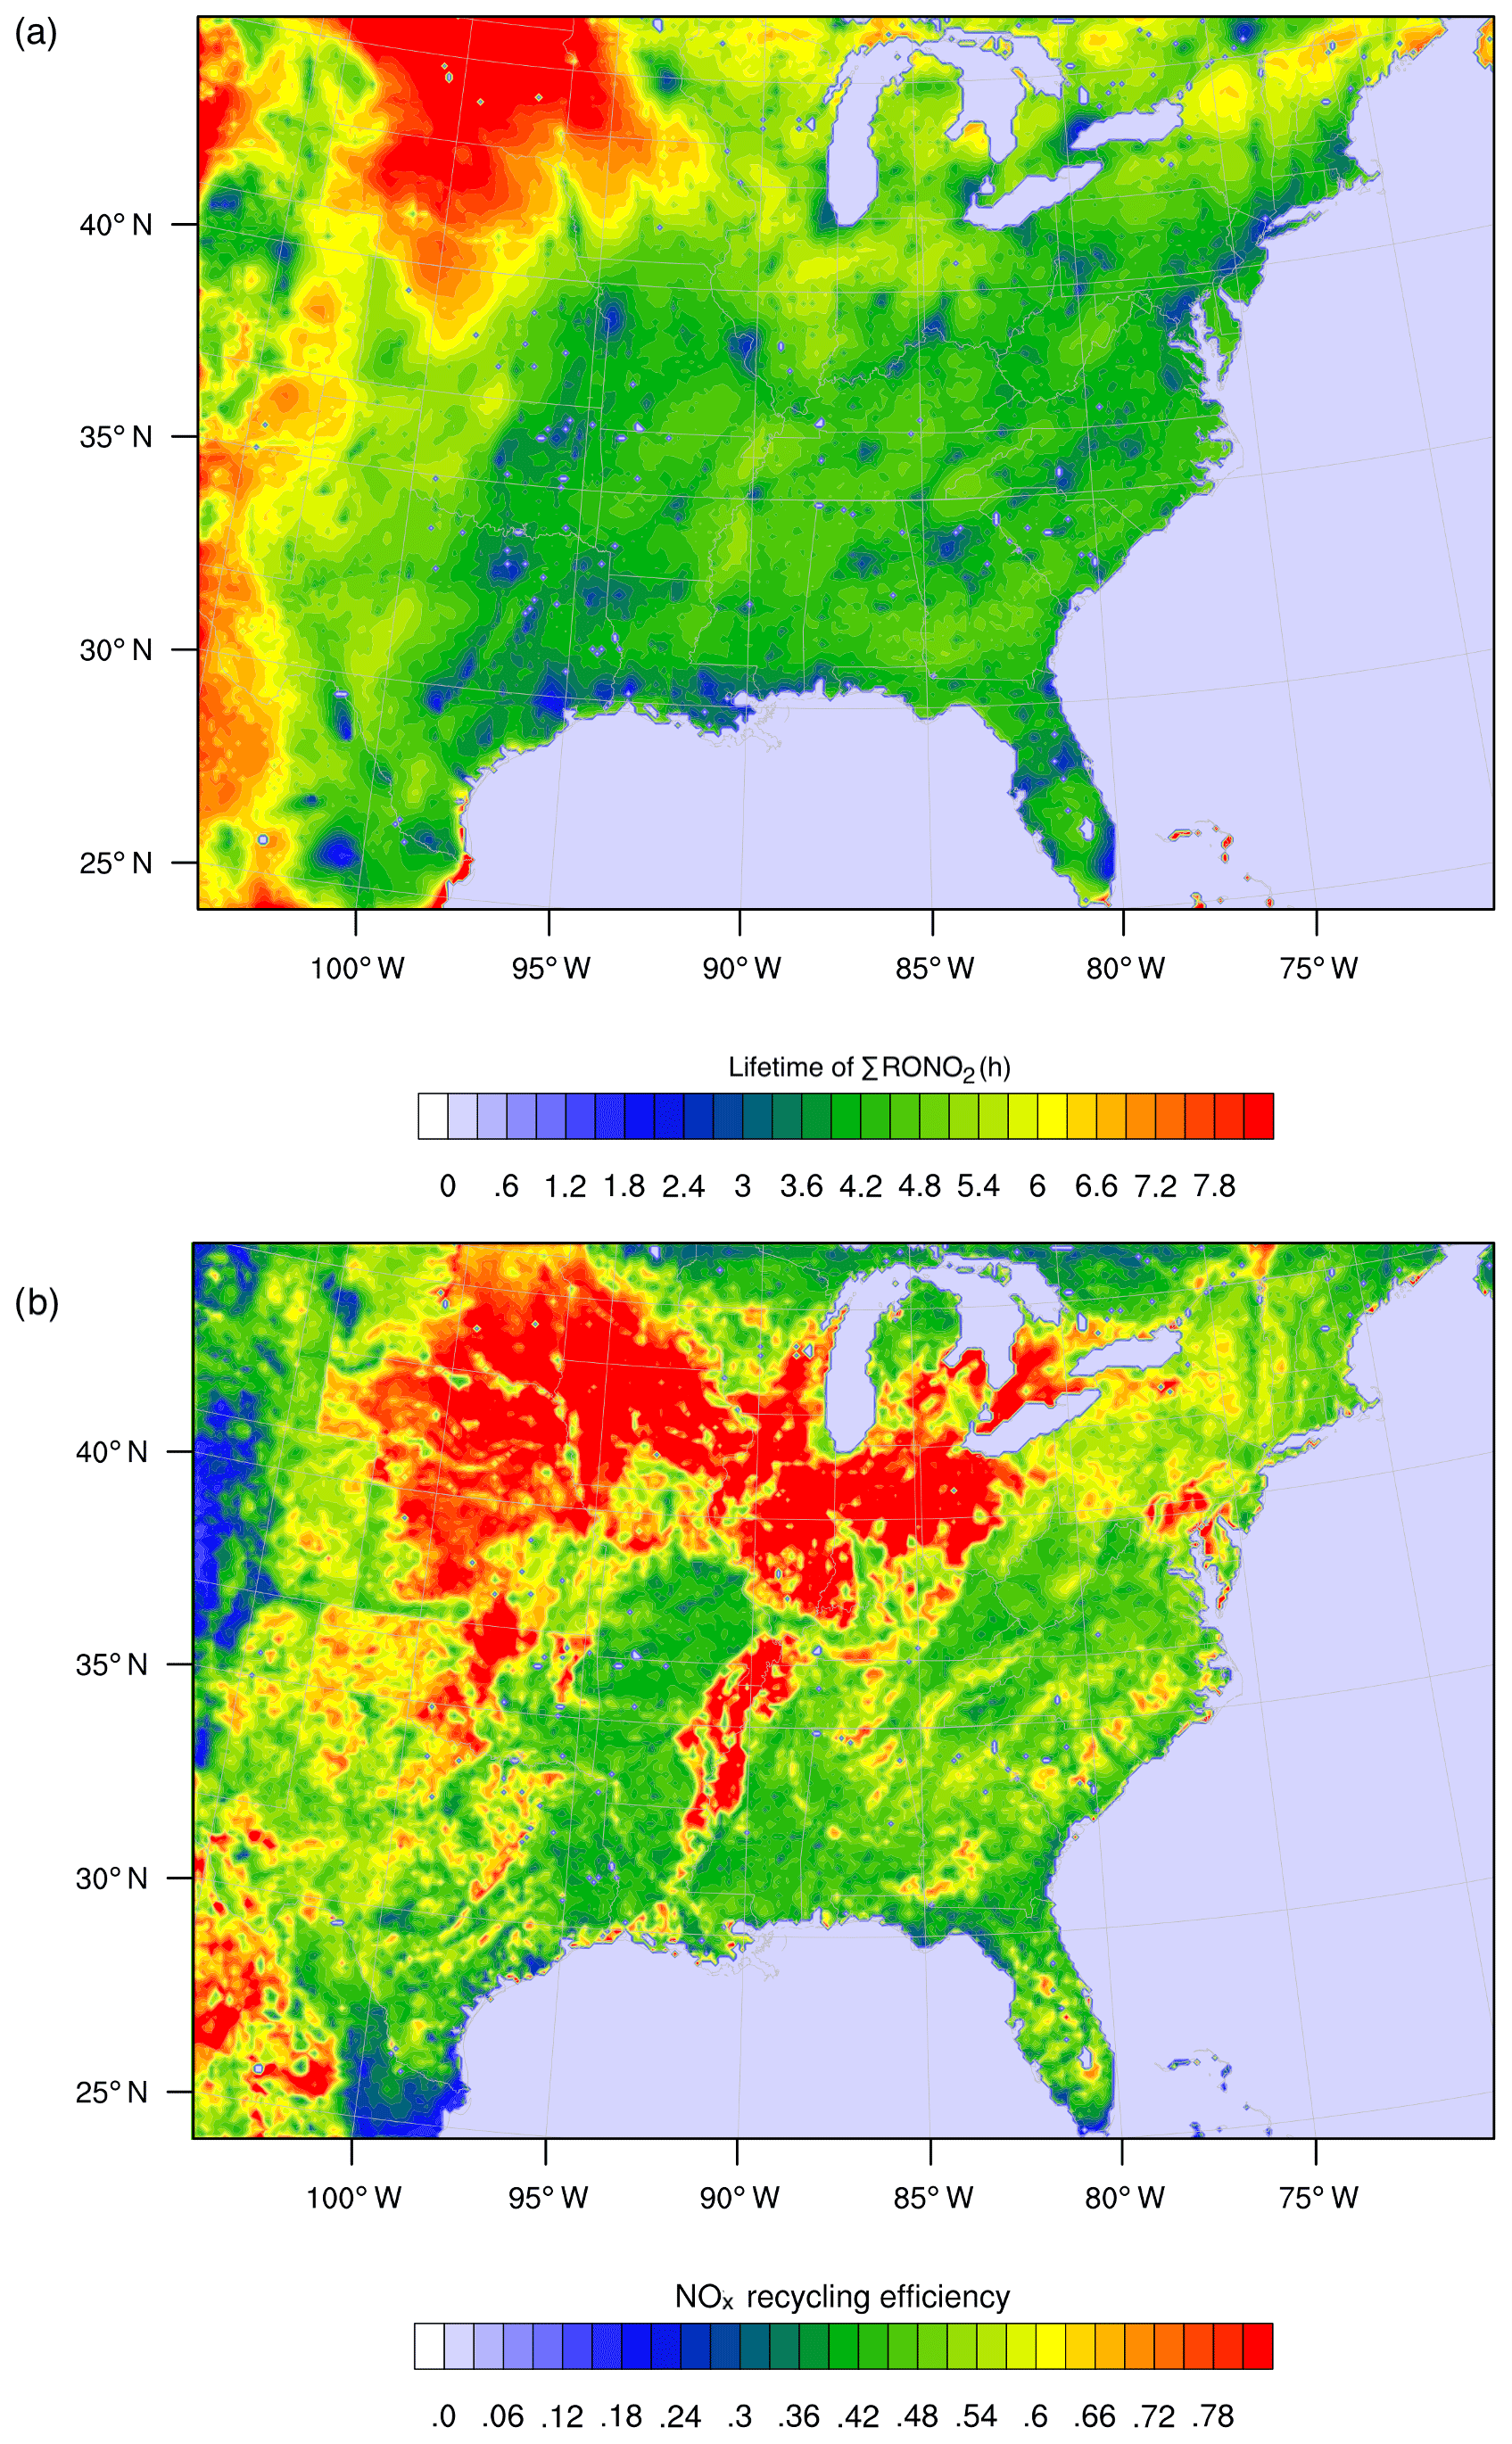
Figure 7WRF-Chem simulation of RONO2 chemistry over the southeast United States for summer 2013 as described in Zare et al. (2018). Panel (a) shows the overall lifetime of ΣRONO2, defined as the concentration of ΣRONO2 divided by their chemical loss rate for the daytime boundary layer. Panel (b) shows the average NOx recycling efficiency, defined as the local rate of NOx production from RONO2 oxidation divided by the rate of RONO2 production.
Further effects of changing NOx chemistry arise from the distinct fates of RONO2 and HNO3. Many RONO2 compounds, especially those derived from isoprene, are remarkably reactive in the troposphere, with lifetimes of a few hours or less. A fraction of this RONO2 loss returns NOx to the atmosphere, allowing RONO2 production to effectively transport NOx downwind (Romer et al., 2016; Xiong et al., 2016). In contrast, HNO3 is effectively chemically inert in the troposphere, with a chemical lifetime of 50 h or more.
As a result of the differing chemical fates and lifetimes, transitioning from a HNO3-dominated regime to a mixed or RONO2-dominated regime has implications for the distribution of NOx on regional to continental scales. If a greater fraction of NOx in polluted or moderately polluted regions is converted into RONO2 compounds rather than into HNO3, then more of the NOx may be re-released downwind, where it can participate in radical chemistry and ozone production. Simulations of RONO2 chemistry using WRF-Chem and the RACM2_Berkeley2 mechanism (Zare et al., 2018) were used to investigate the RONO2 lifetime and NOx recycling efficiency of RONO2 across the southeast United States in summer 2013 (Fig. 7). Across much of the region, ΣRONO2 is calculated to have a lifetime of roughly 4 h, and the release of NOx from RONO2 oxidation was between 40 % and 75 % of the instantaneous RONO2 production rate. Combined, these findings demonstrate a significant role for RONO2 chemistry in the transport of NOx between regions in the southeast United States. The effects of organic nitrate chemistry on the distribution of NOx is likely to vary greatly across different regions of the United States and should be studied in further detail.
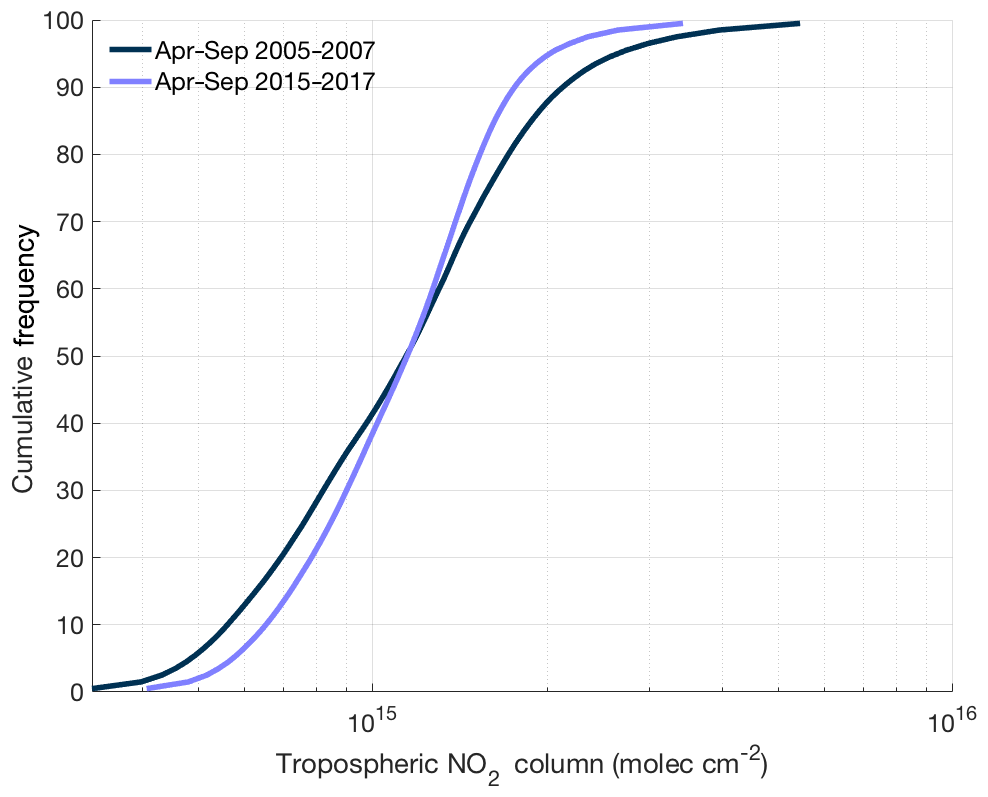
Figure 8Cumulative frequency distribution of ozone monitoring instrument tropospheric NO2 columns over the continental United States using the BErkeley High-Resolution (BEHR) v3.0A retrieval for summer (April–September) in 2005–2007 and 2015–2017.
Enhanced NOx transport between source and receptor regions is one aspect of a combined trend that is transforming the spatial distribution of NOx. Over the past decade, NOx emission reductions have been concentrated in the most polluted environments. In these areas, motor vehicles and power plants, targets of emission control strategies, account for almost all of the NOx emissions. In less polluted regions, other sources of NOx, including soil microbes (both in agricultural and nonagricultural regions), off-road vehicles, fires, and lightning, play a greater role in the NOx budget, reducing the effectiveness of typical combustion-related NOx emission controls. In addition, hemispheric background concentrations of NOx and O3 have risen slightly over the past 2 decades (Cooper et al., 2012). The combination of all three of these trends suggests that the distribution of NOx across the United States is getting flatter over time. This trend matches satellite observations of NO2 over the continental United States. Figure 8 shows the cumulative frequency distribution of summertime tropospheric NO2 columns from 2005–2007 and 2015–2017 using the BErkeley High-Resolution (BEHR) v3.0A retrieval (Laughner et al., 2018a) of slant-column measurements from ozone monitoring instrument (OMI). Over this time, the highest percentiles of NO2 concentrations have decreased and the lowest percentiles increased, leading to a significantly narrower distribution of NO2 concentrations.
In summary, over the past 15 years, decreases in anthropogenic NOx and VOC emissions have led to a significant shift in the mechanisms of daytime NOx loss. Many places where HNO3 production dominated NOx loss are now mixed or have switched to a situation where the majority of NOx loss occurs through RONO2 chemistry. If past trends continue, RONO2 chemistry will grow to become an even more important fraction of NOx chemistry in coming decades. As a result of this combination of changing NOx chemistry, decreasing NOx emissions, and increasing background concentrations, air pollution in the United States may transform from a highly local issue to a more extended regional one. Efforts to control air pollution focused only on local sources are less likely to be effective; future improvements in air quality and attaining the most recent National Ambient Air Quality Standards are likely to require coordinated efforts on regional scales to broadly reduce NOx emissions.
Data from previous field campaigns are available at the following locations: https://esrl.noaa.gov/csd/groups/csd7/measurements/2002ITCT/P3/DataDownload/ (ITCT Science Team, 2002); https://doi.org/10.5067/asdcdaac/intexa/0008 (INTEX-A Science Team, 2006); https://doi.org/10.5067/asdcdaac/intexb/0008 (INTEX-B Science Team, 2011); https://doi.org/10.5281/zenodo.3593409 (BEARPEX 07 Science Team, 2007); https://www-air.larc.nasa.gov/cgi-bin/ArcView/arctas (ARCTAS-B Science Team, 2011); https://doi.org/10.5281/zenodo.3593413 (BEARPEX 09 Science Team, 2009); https://esrl.noaa.gov/csd/groups/csd7/measurements/2010calnex/P3/DataDownload/ (CALNEX Science Team, 2002a); https://esrl.noaa.gov/csd/groups/csd7/measurements/2010calnex/Bakersfield/DataDownload/ (CALNEX Science Team, 2002b); https://doi.org/10.5067/aircraft/dc3/dc8/aerosol-tracegas (DC3 Science Team, 2013); https://esrl.noaa.gov/csd/groups/csd7/measurements/2013senex/Ground/DataDownload/ (SOAS Science Team, 2013); https://www-air.larc.nasa.gov/cgi-bin/ArcView/seac4rs (SEAC4RS Science Team, 2014); https://www-air.larc.nasa.gov/cgi-bin/ArcView/discover-aq.co-2014?C130=1 (FRAPPÉ Science Team, 2014); https://doi.org/10.5067/Suborbital/KORUSAQ/DATA01 (KORUS-AQ Science Team, 2018). The BEHR retrieval of OMI NO2 columns is available at https://doi.org/10.6078/D1RQ3G (Laughner et al., 2018b).
A1 Steady-state calculation of unmeasured radicals
The formation rates of RONO2, HNO3, and O3 depend either directly or indirectly on the concentration of OH, HO2, RO2, NO, and NO2. Speciated RO2 radicals are not currently observable in the atmosphere, and thus all RO2 concentrations were calculated assuming they were in steady state, with their production and loss rates equal.
There were additional periods in which some combination of OH, HO2, and NO were also not measured, and these radicals were also assumed to be in steady state. Concentrations of VOCs, NO2, and O3 were always taken from measurements. In order to calculate the steady-state concentrations of unmeasured radicals, reaction rate constants and RO2 yields for the different VOCs were taken from the MCM v3.3.1 (Jenkin et al., 2015). Concentrations of all unmeasured species were calculated iteratively until all the concentrations converged. Equations (A1–A8) were used to calculate the steady-state concentration of unmeasured radicals. In Eq. (A8), the symbol XR is used to represent the OH reactivity of species such as SO2 and O3 that are not included in either VOCR or NO2R. Although it is not often categorized as a VOC, CO is included as a contributor to VOCR. The reaction rate constant for NO2 with OH was taken from Mollner et al. (2010), with temperature and pressure dependencies from Henderson et al. (2012).
In order to test the accuracy of the modeling, we used periods when HO2, OH, and NO were all measured and calculated how the production ratio P(RONO2)∕P(HNO3) changed if modeled radical concentrations were substituted for the measured values. These results are shown in Fig. A1. Even in the worst-case scenario (modeled concentrations used for all radicals), the slope is close to one (Fig. A1a), indicating that the use of modeled radicals does not significantly affect our results. Furthermore, Fig. A1b–d show that the use of modeled OH or HO2 concentrations alone does not lead to noticeable changes in P(RONO2)∕P(HNO3). Use of modeled NO concentrations can cause small but noticeable changes in P(RONO2)∕P(HNO3), but modeled NO concentrations are used in less than 3 % of all data points used in this analysis (238 out of 7988 data points).
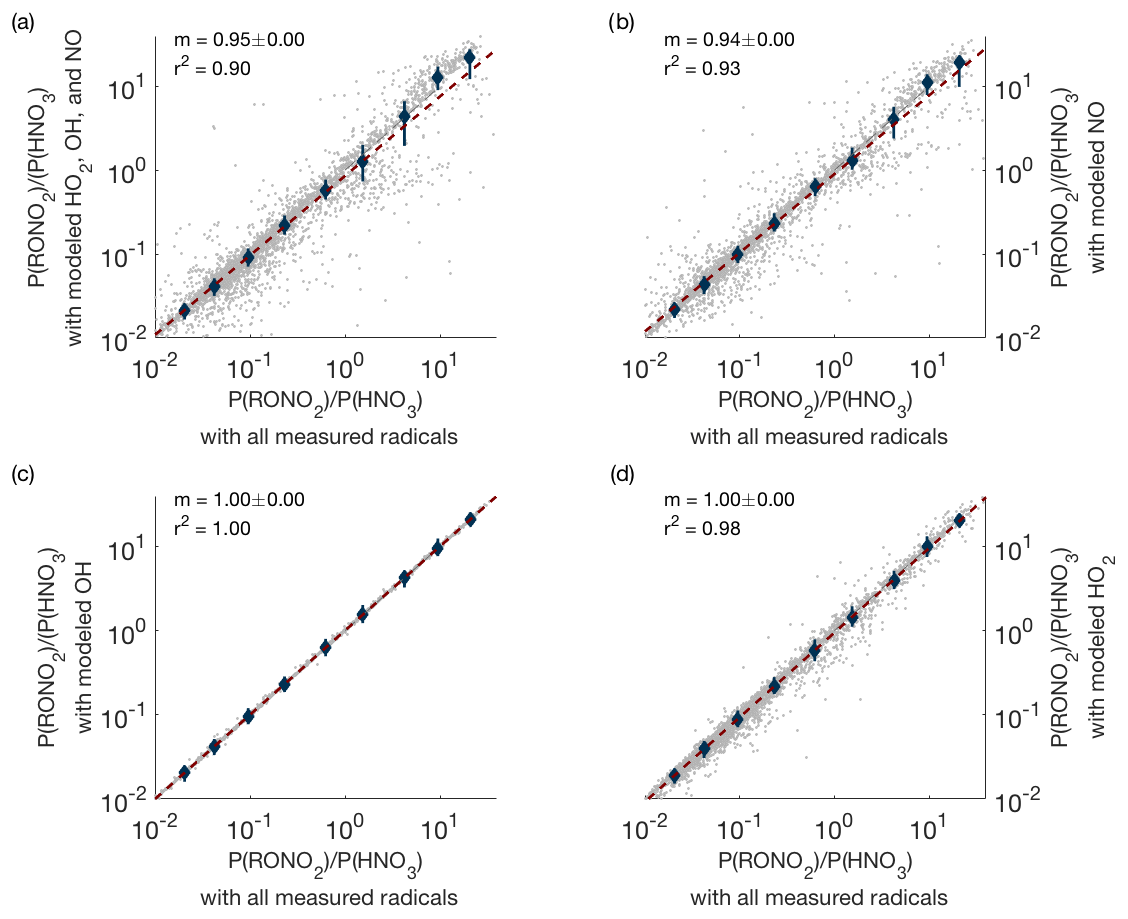
Figure A1Comparison of P(RONO2)∕P(HNO3) when measured concentrations of all possible radicals are used (x axis) versus when measured concentrations are replaced by modeled concentrations (y axis). Panel (a) shows the result when modeled concentrations of OH, HO2, and NO are all used simultaneously; panels (b–d) show the effect of replacing measured with modeled values one species at a time.
A2 Determination of α
Accurately calculating the RONO2 production rate requires accurate knowledge of αi for all VOCs. If values of α had been reported for a specific compound from laboratory measurements, the most recent value was applied (Perring et al., 2013; Teng et al., 2015; Rindelaub et al., 2015; Praske et al., 2015; Wennberg et al., 2018). In cases where no reliable laboratory measurements are available, the parameterization for α from Wennberg et al. (2018) was used. In all cases, the temperature and pressure dependencies described in Wennberg et al. (2018) were used to scale the laboratory measurements of α to the conditions of the atmosphere.
PSRP and RCC designed the experiment; PSRP performed the analysis of field campaign data and wrote the paper with contributions from all authors; AZ designed, ran, and analyzed the modeling simulations; and RCC supervised the project.
The authors declare that they have no conflict of interest.
The authors thank Joshua Laughner for assistance with the OMI BEHR retrieval.
This research has been supported by the National Oceanic and Atmospheric Administration, Climate Program Office (grant no. NA18OAR4310117) and the National Science Foundation, Division of Atmospheric and Geospace Sciences (grant no. AGS-1352972).
This paper was edited by Astrid Kiendler-Scharr and reviewed by three anonymous referees.
ARCTAS-B Science Team: ARCTAS-B DC-8 aircraft data, NASA, available at: https://www-air.larc.nasa.gov/cgi-bin/ArcView/arctas (last access: 13 July 2018), 2011. a, b
BEARPEX 07 Science Team: BEARPEX 2007 field campaign data, https://doi.org/10.5281/zenodo.3593409, 2007. a, b
BEARPEX 09 Science Team: BEARPEX 2009 field campaign data, https://doi.org/10.5281/zenodo.3593413, 2009. a, b
Brown, S. S., Dubé, W. P., Fuchs, H., Ryerson, T. B., Wollny, A. G., Brock, C. A., Bahreini, R., Middlebrook, A. M., Neuman, J. A., Atlas, E., Roberts, J. M., Osthoff, H. D., Trainer, M., Fehsenfeld, F. C., and Ravishankara, A. R.: Reactive uptake coefficients for N2O5 determined from aircraft measurements during the Second Texas Air Quality Study: Comparison to current model parameterizations, J. Geophys. Res., 114, D00F10, https://doi.org/10.1029/2008JD011679, 2009. a
Browne, E. C. and Cohen, R. C.: Effects of biogenic nitrate chemistry on the NOx lifetime in remote continental regions, Atmos. Chem. Phys., 12, 11917–11932, https://doi.org/10.5194/acp-12-11917-2012, 2012. a, b
Browne, E. C., Min, K.-E., Wooldridge, P. J., Apel, E., Blake, D. R., Brune, W. H., Cantrell, C. A., Cubison, M. J., Diskin, G. S., Jimenez, J. L., Weinheimer, A. J., Wennberg, P. O., Wisthaler, A., and Cohen, R. C.: Observations of total RONO2 over the boreal forest: NOx sinks and HNO3 sources, Atmos. Chem. Phys., 13, 4543–4562, https://doi.org/10.5194/acp-13-4543-2013, 2013. a, b
CALNEX Science Team: CALNEX 2010 WP-3D data, NOAA, available at: https://esrl.noaa.gov/csd/groups/csd7/measurements/2010calnex/P3/DataDownload/ (last access: 13 June 2018), 2002a. a, b
CALNEX Science Team: CALNEX 2010 Bakersfield site data, NOAA, available at: https://esrl.noaa.gov/csd/groups/csd7/measurements/2010calnex/Bakersfield/DataDownload/ (last access: 13 June 2018), 2002b. a, b
Cooper, O. R., Gao, R.-S., Tarasick, D., Leblanc, T., and Sweeney, C.: Long-term ozone trends at rural ozone monitoring sites across the United States, 1990–2010, J. Geophys. Res.-Atmos., 117, D22307, https://doi.org/10.1029/2012JD018261, 2012. a
DC3 Science Team: DC3 Field Campaign Data from DC-8 aircraft, NASA, https://doi.org/10.5067/aircraft/dc3/dc8/aerosol-tracegas, 2013. a, b
Edwards, P. M., Young, C. J., Aikin, K., deGouw, J., Dubé, W. P., Geiger, F., Gilman, J., Helmig, D., Holloway, J. S., Kercher, J., Lerner, B., Martin, R., McLaren, R., Parrish, D. D., Peischl, J., Roberts, J. M., Ryerson, T. B., Thornton, J., Warneke, C., Williams, E. J., and Brown, S. S.: Ozone photochemistry in an oil and natural gas extraction region during winter: simulations of a snow-free season in the Uintah Basin, Utah, Atmos. Chem. Phys., 13, 8955–8971, https://doi.org/10.5194/acp-13-8955-2013, 2013. a
Farmer, D. K., Perring, A. E., Wooldridge, P. J., Blake, D. R., Baker, A., Meinardi, S., Huey, L. G., Tanner, D., Vargas, O., and Cohen, R. C.: Impact of organic nitrates on urban ozone production, Atmos. Chem. Phys., 11, 4085–4094, https://doi.org/10.5194/acp-11-4085-2011, 2011. a, b, c
Fisher, J. A., Jacob, D. J., Travis, K. R., Kim, P. S., Marais, E. A., Chan Miller, C., Yu, K., Zhu, L., Yantosca, R. M., Sulprizio, M. P., Mao, J., Wennberg, P. O., Crounse, J. D., Teng, A. P., Nguyen, T. B., St. Clair, J. M., Cohen, R. C., Romer, P., Nault, B. A., Wooldridge, P. J., Jimenez, J. L., Campuzano-Jost, P., Day, D. A., Hu, W., Shepson, P. B., Xiong, F., Blake, D. R., Goldstein, A. H., Misztal, P. K., Hanisco, T. F., Wolfe, G. M., Ryerson, T. B., Wisthaler, A., and Mikoviny, T.: Organic nitrate chemistry and its implications for nitrogen budgets in an isoprene- and monoterpene-rich atmosphere: constraints from aircraft (SEAC4RS) and ground-based (SOAS) observations in the Southeast US, Atmos. Chem. Phys., 16, 5969–5991, https://doi.org/10.5194/acp-16-5969-2016, 2016. a, b, c, d
Fowler, D., Coyle, M., Skiba, U., Sutton, M. A., Cape, J. N., Reis, S., Sheppard, L. J., Jenkins, A., Grizzetti, B., Galloway, J. N., Vitousek, P., Leach, A., Bouwman, A. F., Butterbach-Bahl, K., Dentener, F., Stevenson, D., Amann, M., and Voss, M.: The global nitrogen cycle in the twenty-first century, Philos. T. Roy. Soc. B, 368, https://doi.org/10.1098/rstb.2013.0164, 2013. a
FRAPPÉ Science Team: FRAPPÉ C-130 aircraft data, NASA, available at: https://www-air.larc.nasa.gov/cgi-bin/ArcView/discover-aq.co-2014?C130=1 (last access: 21 March 2017), 2014. a, b
Geddes, J. A., Murphy, J. G., and Wang, D. K.: Long term changes in nitrogen oxides and volatile organic compounds in Toronto and the challenges facing local ozone control, Atmos. Environ., 43, 3407–3415, https://doi.org/10.1016/j.atmosenv.2009.03.053, 2009. a, b, c
Henderson, B. H., Pinder, R. W., Crooks, J., Cohen, R. C., Carlton, A. G., Pye, H. O. T., and Vizuete, W.: Combining Bayesian methods and aircraft observations to constrain the HO. + NO2 reaction rate, Atmos. Chem. Phys., 12, 653–667, https://doi.org/10.5194/acp-12-653-2012, 2012. a
Hidy, G. M., Blanchard, C. L., Baumann, K., Edgerton, E., Tanenbaum, S., Shaw, S., Knipping, E., Tombach, I., Jansen, J., and Walters, J.: Chemical climatology of the southeastern United States, 1999–2013, Atmos. Chem. Phys., 14, 11893–11914, https://doi.org/10.5194/acp-14-11893-2014, 2014. a
INTEX-A Science Team: INTEX-A DC-8 Aircraft data, NASA, https://doi.org/10.5067/asdcdaac/intexa/0008, 2006. a, b
INTEX-B Science Team: INTEX-B DC-8 aircraft data, NASA, https://doi.org/10.5067/asdcdaac/intexb/0008, 2011. a, b
ITCT Science Team: ITCT 2002 WP-3D Data, NOAA, available at: https://esrl.noaa.gov/csd/groups/csd7/measurements/2002ITCT/P3/DataDownload/ (last access: 13 June 2018), 2002. a, b
Jenkin, M. E., Young, J. C., and Rickard, A. R.: The MCM v3.3.1 degradation scheme for isoprene, Atmos. Chem. Phys., 15, 11433–11459, https://doi.org/10.5194/acp-15-11433-2015, 2015. a
KORUS-AQ Science Team: KorUS-AQ Airborne Mission, NASA, https://doi.org/10.5067/Suborbital/KORUSAQ/DATA01, 2018. a, b
Laughner, J. L., Zhu, Q., and Cohen, R. C.: The Berkeley High Resolution Tropospheric NO2 product, Earth Syst. Sci. Data, 10, 2069–2095, https://doi.org/10.5194/essd-10-2069-2018, 2018a. a
Laughner, J., Zhu, Q., and Cohen, R. C.: Berkeley High Resolution (BEHR) OMI NO2 – Gridded pixels, monthly profiles, https://doi.org/10.6078/D1RQ3G, 2018b. a
Lee, B. H., Mohr, C., Lopez-Hilfiker, F. D., Lutz, A., Hallquist, M., Lee, L., Romer, P., Cohen, R. C., Iyer, S., Kurtén, T., Hu, W., Day, D. A., Campuzano-Jost, P., Jimenez, J. L., Xu, L., Ng, N. L., Guo, H., Weber, R. J., Wild, R. J., Brown, S. S., Koss, A., de Gouw, J., Olson, K., Goldstein, A. H., Seco, R., Kim, S., McAvey, K., Shepson, P. B., Starn, T., Baumann, K., Edgerton, E. S., Liu, J., Shilling, J. E., Miller, D. O., Brune, W., Schobesberger, S., D'Ambro, E. L., and Thornton, J. A.: Highly functionalized organic nitrates in the southeast United States: Contribution to secondary organic aerosol and reactive nitrogen budgets, P. Natl. Acad. Sci. USA, 113, 1516–1521, https://doi.org/10.1073/pnas.1508108113, 2016. a
Lee, L., Wooldridge, P. J., Gilman, J. B., Warneke, C., de Gouw, J., and Cohen, R. C.: Low temperatures enhance organic nitrate formation: evidence from observations in the 2012 Uintah Basin Winter Ozone Study, Atmos. Chem. Phys., 14, 12441–12454, https://doi.org/10.5194/acp-14-12441-2014, 2014. a
Mao, J., Ren, X., Brune, W. H., Olson, J. R., Crawford, J. H., Fried, A., Huey, L. G., Cohen, R. C., Heikes, B., Singh, H. B., Blake, D. R., Sachse, G. W., Diskin, G. S., Hall, S. R., and Shetter, R. E.: Airborne measurement of OH reactivity during INTEX-B, Atmos. Chem. Phys., 9, 163–173, https://doi.org/10.5194/acp-9-163-2009, 2009. a
McDuffie, E. E., Fibiger, D. L., Dubé, W. P., Lopez-Hilfiker, F., Lee, B. H., Thornton, J. A., Shah, V., Jaeglé, L., Guo, H., Weber, R. J., Reeves, J. M., Weinheimer, A. J., Schroder, J. C., Campuzano-Jost, P., Jimenez, J. L., Dibb, J. E., Veres, P., Ebben, C., Sparks, T. L., Wooldridge, P. J., Cohen, R. C., Hornbrook, R. S., Apel, E. C., Campos, T., Hall, S. R., Ullmann, K., and Brown, S. S.: Heterogeneous N2O5 Uptake During Winter: Aircraft Measurements During the 2015 WINTER Campaign and Critical Evaluation of Current Parameterizations, J. Geophys. Res.-Atmos., 123, 4345–4372, https://doi.org/10.1002/2018JD028336, 2018. a
Mollner, A. K., Valluvadasan, S., Feng, L., Sprague, M. K., Okumura, M., Milligan, D. B., Bloss, W. J., Sander, S. P., Martien, P. T., Harley, R. A., McCoy, A. B., and Carter, W. P. L.: Rate of Gas Phase Association of Hydroxyl Radical and Nitrogen Dioxide, Science, 330, 646–649, https://doi.org/10.1126/science.1193030, 2010. a
Nguyen, T. B., Crounse, J. D., Teng, A. P., St. Clair, J. M., Paulot, F., Wolfe, G. M., and Wennberg, P. O.: Rapid deposition of oxidized biogenic compounds to a temperate forest, P. Natl. Acad. Sci. USA, 112, E392–E401, https://doi.org/10.1073/pnas.1418702112, 2015. a
Perring, A. E., Bertram, T. H., Farmer, D. K., Wooldridge, P. J., Dibb, J., Blake, N. J., Blake, D. R., Singh, H. B., Fuelberg, H., Diskin, G., Sachse, G., and Cohen, R. C.: The production and persistence of ∑RONO2 in the Mexico City plume, Atmos. Chem. Phys., 10, 7215–7229, https://doi.org/10.5194/acp-10-7215-2010, 2010. a
Perring, A. E., Pusede, S. E., and Cohen, R. C.: An Observational Perspective on the Atmospheric Impacts of Alkyl and Multifunctional Nitrates on Ozone and Secondary Organic Aerosol, Chem. Rev., 113, 5848–5870, https://doi.org/10.1021/cr300520x, 2013. a, b, c, d
Pollack, I. B., Ryerson, T. B., Trainer, M., Neuman, J. A., Roberts, J. M., and Parrish, D. D.: Trends in ozone, its precursors, and related secondary oxidation products in Los Angeles, California: A synthesis of measurements from 1960 to 2010, J. Geophys. Res.-Atmos., 118, 5893–5911, https://doi.org/10.1002/jgrd.50472, 2013. a
Praske, E., Crounse, J. D., Bates, K. H., Kurtén, T., Kjaergaard, H. G., and Wennberg, P. O.: Atmospheric Fate of Methyl Vinyl Ketone: Peroxy Radical Reactions with NO and HO2, J. Phys. Chem. A, 119, 4562–4572, https://doi.org/10.1021/jp5107058, 2015. a
Pusede, S. E., Gentner, D. R., Wooldridge, P. J., Browne, E. C., Rollins, A. W., Min, K.-E., Russell, A. R., Thomas, J., Zhang, L., Brune, W. H., Henry, S. B., DiGangi, J. P., Keutsch, F. N., Harrold, S. A., Thornton, J. A., Beaver, M. R., St. Clair, J. M., Wennberg, P. O., Sanders, J., Ren, X., VandenBoer, T. C., Markovic, M. Z., Guha, A., Weber, R., Goldstein, A. H., and Cohen, R. C.: On the temperature dependence of organic reactivity, nitrogen oxides, ozone production, and the impact of emission controls in San Joaquin Valley, California, Atmos. Chem. Phys., 14, 3373–3395, https://doi.org/10.5194/acp-14-3373-2014, 2014. a, b
Pusede, S. E., Duffey, K. C., Shusterman, A. A., Saleh, A., Laughner, J. L., Wooldridge, P. J., Zhang, Q., Parworth, C. L., Kim, H., Capps, S. L., Valin, L. C., Cappa, C. D., Fried, A., Walega, J., Nowak, J. B., Weinheimer, A. J., Hoff, R. M., Berkoff, T. A., Beyersdorf, A. J., Olson, J., Crawford, J. H., and Cohen, R. C.: On the effectiveness of nitrogen oxide reductions as a control over ammonium nitrate aerosol, Atmos. Chem. Phys., 16, 2575–2596, https://doi.org/10.5194/acp-16-2575-2016, 2016. a
Pye, H. O. T., Luecken, D. J., Xu, L., Boyd, C. M., Ng, N. L., Baker, K. R., Ayres, B. R., Bash, J. O., Baumann, K., Carter, W. P. L., Edgerton, E. S., Fry, J. L., Hutzell, W. T., Schwede, D., and Shepson, P. B.: Modeling the Current and Future Roles of Particulate Organic Nitrates in the Southeastern United States, Environ. Sci. Technol., 49, 14195–14203, https://doi.org/10.1021/acs.est.5b03738, 2015. a, b
Rindelaub, J. D., McAvey, K. M., and Shepson, P. B.: The photochemical production of organic nitrates from α-pinene and loss via acid-dependent particle phase hydrolysis, Atmos. Environ., 100, 193–201, https://doi.org/10.1016/j.atmosenv.2014.11.010, 2015. a
Rollins, A. W., Browne, E. C., Min, K.-E., Pusede, S. E., Wooldridge, P. J., Gentner, D. R., Goldstein, A. H., Liu, S., Day, D. A., Russell, L. M., and Cohen, R. C.: Evidence for NOx Control Over Nighttime SOA Formation, Science, 337, 1210–1212, https://doi.org/10.1126/science.1221520, 2012. a
Romer, P. S., Duffey, K. C., Wooldridge, P. J., Allen, H. M., Ayres, B. R., Brown, S. S., Brune, W. H., Crounse, J. D., de Gouw, J., Draper, D. C., Feiner, P. A., Fry, J. L., Goldstein, A. H., Koss, A., Misztal, P. K., Nguyen, T. B., Olson, K., Teng, A. P., Wennberg, P. O., Wild, R. J., Zhang, L., and Cohen, R. C.: The lifetime of nitrogen oxides in an isoprene-dominated forest, Atmos. Chem. Phys., 16, 7623–7637, https://doi.org/10.5194/acp-16-7623-2016, 2016. a, b, c, d
Romer, P. S., Duffey, K. C., Wooldridge, P. J., Edgerton, E., Baumann, K., Feiner, P. A., Miller, D. O., Brune, W. H., Koss, A. R., de Gouw, J. A., Misztal, P. K., Goldstein, A. H., and Cohen, R. C.: Effects of temperature-dependent NOx emissions on continental ozone production, Atmos. Chem. Phys., 18, 2601–2614, https://doi.org/10.5194/acp-18-2601-2018, 2018. a, b
Rosen, R. S., Wood, E. C., Wooldridge, P. J., Thornton, J. A., Day, D. A., Kuster, W., Williams, E. J., Jobson, B. T., and Cohen, R. C.: Observations of total alkyl nitrates during Texas Air Quality Study 2000: Implications for O3 and alkyl nitrate photochemistry, J. Geophys. Res., 109, D07303, https://doi.org/10.1029/2003JD004227, 2004. a
Russell, A. R., Valin, L. C., and Cohen, R. C.: Trends in OMI NO2 observations over the United States: effects of emission control technology and the economic recession, Atmos. Chem. Phys., 12, 12197–12209, https://doi.org/10.5194/acp-12-12197-2012, 2012. a
SEAC4RS Science Team: SEAC4RS field campaign data, NASA, available at: https://www-air.larc.nasa.gov/cgi-bin/ArcView/seac4rs (last access: 24 October 2017), 2014. a, b
SOAS Science Team: SOAS 2013 Centreville site data, NOAA, available at: https://esrl.noaa.gov/csd/groups/csd7/measurements/2013senex/Ground/DataDownload/ (last access: 17 June 2017), 2013. a, b
Sobanski, N., Thieser, J., Schuladen, J., Sauvage, C., Song, W., Williams, J., Lelieveld, J., and Crowley, J. N.: Day and night-time formation of organic nitrates at a forested mountain site in south-west Germany, Atmos. Chem. Phys., 17, 4115–4130, https://doi.org/10.5194/acp-17-4115-2017, 2017. a
Stelson, A. W. and Seinfeld, J. H.: Relative humidity and temperature dependence of the ammonium nitrate dissociation constant, Atmos. Environ., 16, 983–992, https://doi.org/10.1016/0004-6981(82)90184-6, 1982. a
Teng, A. P., Crounse, J. D., Lee, L., St. Clair, J. M., Cohen, R. C., and Wennberg, P. O.: Hydroxy nitrate production in the OH-initiated oxidation of alkenes, Atmos. Chem. Phys., 15, 4297–4316, https://doi.org/10.5194/acp-15-4297-2015, 2015. a
Teng, A. P., Crounse, J. D., and Wennberg, P. O.: Isoprene Peroxy Radical Dynamics, J. Am. Chem. Soc., 139, 5367–5377, https://doi.org/10.1021/jacs.6b12838, 2017. a
United States Environmental Protection Agency: Air Pollutant Emissions Trends Data, available at: https://www.epa.gov/air-emissions-inventories/air-pollutant-emissions-trends-data (last access: 5 July 2018), 2018. a
Warneke, C., de Gouw, J. A., Holloway, J. S., Peischl, J., Ryerson, T. B., Atlas, E., Blake, D., Trainer, M., and Parrish, D. D.: Multiyear trends in volatile organic compounds in Los Angeles, California: Five decades of decreasing emissions, J. Geophys. Res.-Atmos., 117, D00V17, https://doi.org/10.1029/2012JD017899, 2012. a
Wennberg, P. O., Bates, K. H., Crounse, J. D., Dodson, L. G., McVay, R. C., Mertens, L. A., Nguyen, T. B., Praske, E., Schwantes, R. H., Smarte, M. D., St Clair, J. M., Teng, A. P., Zhang, X., and Seinfeld, J. H.: Gas-Phase Reactions of Isoprene and Its Major Oxidation Products, Chem. Rev., 118, 3337–3390, https://doi.org/10.1021/acs.chemrev.7b00439, 2018. a, b, c, d
Xiong, F., Borca, C. H., Slipchenko, L. V., and Shepson, P. B.: Photochemical degradation of isoprene-derived 4,1-nitrooxy enal, Atmos. Chem. Phys., 16, 5595–5610, https://doi.org/10.5194/acp-16-5595-2016, 2016. a
Xu, L., Guo, H., Boyd, C. M., Klein, M., Bougiatioti, A., Cerully, K. M., Hite, J. R., Isaacman-VanWertz, G., Kreisberg, N. M., Knote, C., Olson, K., Koss, A., Goldstein, A. H., Hering, S. V., Gouw, J. d., Baumann, K., Lee, S.-H., Nenes, A., Weber, R. J., and Ng, N. L.: Effects of anthropogenic emissions on aerosol formation from isoprene and monoterpenes in the southeastern United States, P. Natl. Acad. Sci. USA, 112, 37–42, https://doi.org/10.1073/pnas.1417609112, 2015a. a
Xu, L., Suresh, S., Guo, H., Weber, R. J., and Ng, N. L.: Aerosol characterization over the southeastern United States using high-resolution aerosol mass spectrometry: spatial and seasonal variation of aerosol composition and sources with a focus on organic nitrates, Atmos. Chem. Phys., 15, 7307–7336, https://doi.org/10.5194/acp-15-7307-2015, 2015b. a
Zare, A., Romer, P. S., Nguyen, T., Keutsch, F. N., Skog, K., and Cohen, R. C.: A comprehensive organic nitrate chemistry: insights into the lifetime of atmospheric organic nitrates, Atmos. Chem. Phys., 18, 15419–15436, https://doi.org/10.5194/acp-18-15419-2018, 2018. a, b, c, d, e, f
- Abstract
- Introduction
- NOx chemistry and production of RONO2 and HNO3
- Observed contributions of HNO3 and RONO2 chemistry to NOx loss
- Predicted trends over time
- Impacts of the transition from the HNO3 to the RONO2 regime
- Data availability
- Appendix A: Calculation of the RONO2 production rate
- Author contributions
- Competing interests
- Acknowledgements
- Financial support
- Review statement
- References