the Creative Commons Attribution 4.0 License.
the Creative Commons Attribution 4.0 License.
 | 03 Mar 2020
In situ vertical characteristics of optical properties and heating rates of aerosol over Beijing
Ping Tian
Delong Zhao
Chenjie Yu
Mengyu Huang
Zhaoze Deng
Liang Ran
Yunfei Wu
Shuo Ding
Kang Hu
Gang Zhao
Chunsheng Zhao
Deping Ding
Characterizing vertical profiles of aerosol optical properties is important because relying on only the surface or column-integrated measurements cannot unambiguously constrain the radiative impacts of aerosol. This study presents series of vertical profiles of in situ measured multi-wavelength optical properties of aerosols during three pollution events from November to December 2016 over the Beijing region. For all pollution events, the clean periods (CPs) before pollution initialization showed a higher scattering Ångström exponent (SAE) and a smaller asymmetry parameter (g) with relatively uniform vertical structures. The heavy pollution periods (HPs) showed an increased particle size, causing these parameters to vary in the opposite way. During the transition periods (TPs), regional transport of aged aerosols at higher altitudes was found. The Aerosol Robotic Network (AERONET) aerosol optical depth (AOD) matched the in situ measurements within 10 %; however the AERONET absorption optical depth (AAOD) was 10 %–20 % higher than the in situ measurements, and this positive discrepancy increased to 30 % at shorter wavelengths. The absorption of brown carbon (BrC) was identified by the increased-absorption Ångström exponent (AAE), and the heating rate of black carbon (BC) and BrC was estimated by computing the spectral absorption coefficient and actinic flux calculated by a radiative transfer model. BC and BrC had a heating rate of up to 0.18 and 0.05 K h−1 in the planetary boundary layer (PBL), respectively, during the pollution period. The fraction of BrC absorption increased from 12 % to 40 % in the PBL from the CP to the HP. Notably, a higher contribution of BrC heating was found above the PBL under polluted conditions. This study paints a full picture of shortwave heating impacts of carbonaceous aerosols during different stages of pollution events and highlights the increased contribution of BrC absorption especially at higher altitudes during pollution.
- Article
(6790 KB) - Full-text XML
-
Supplement
(1925 KB) - BibTeX
- EndNote


The optical properties of aerosol, which cause aerosol to scatter or absorb solar radiation, have caused important radiative impacts on the earth system (Intergovernmental Panel on Climate Change 2013 – IPCC 2013). The optical properties depend on the particle size (Bergin et al., 2001), refractive index (Ebert et al., 2002; Quinn, 2002) and mixing state of aerosols. There are still large uncertainties in evaluating the radiative forcing of aerosol, especially in the eastern Asia region due to the lack of information on vertical distribution of these parameters (Liao and Seinfeld, 1998; Ramanathan et al., 2001; Li et al., 2017). Previous studies showed that the surface observation or column-integrated measurements may not provide sufficient information to derive vertical profiles of aerosol optical properties (Andrews et al., 2011; Rosati et al., 2016). Modelling studies find the radiative forcing impact to be sensitive to the aerosol vertical distribution (Haywood et al., 1998) and, especially for the absorbing aerosol for example black carbon (BC), to exert different climatic impacts depending on the location of the aerosol layer (Yu et al., 2002; Ban-Weiss et al., 2011; Wilcox et al., 2016). Though most aerosols are contained inside the planet boundary layer (PBL), the climatic sensitivity to absorbing aerosol rapidly increases with altitude (Ramanathan et al., 2001; Hodnebrog et al., 2014; Nazarenko et al., 2017). Absorbing aerosol above the PBL has the potential to suppress the PBL development and enhance the inversion cap at the top of the PBL (Ding et al., 2016; Z. Wang et al., 2018), further aggravating the pollution. However, this impact depends on the location of the absorbing layer, which may also promote the convection by heating the layer above (Koch and Del Genio, 2010; Yu et al., 2019). It is therefore important to characterize the vertical profile of the absorbing component in the atmosphere in order to understand its influences on atmospheric thermodynamics.
The North China Plain (NCP) has raised great attention in the recent decade because of the severe air pollution and high frequency of hazy days over this region. The causes of pollution have been widely investigated through surface measurements (Zhang et al., 2013, 2015; Zhong et al., 2018); however only limited studies have considered the evolution of pollutants in the vertical direction (Tian et al., 2019; F. Wang et al., 2018). It was found that the surface aerosol concentration over Beijing depended not only on the emission but also on the vertical structure of the aerosol distribution, which was largely dependent on local and synoptic meteorological conditions (Ran et al., 2016b; D. L. Zhao et al., 2019), such as the mountain chimney effect over the Beijing region, which may introduce enhanced aerosol loading to high altitudes (Chen et al., 2009). The light-absorbing aerosol mainly includes the species of black carbon (Bond et al., 2013), brown carbon (Lack and Cappa, 2010) and dust (Klingmüller et al., 2019) which have different spectral sensitivities to solar radiation. Different aerosol components dominate at different environments, and the heating rates caused by various aerosol sources have been studied over the world, e.g., for the anthropogenic sources over North America (Gao et al., 2008; Sahu et al., 2012; J. Liu et al., 2015), Europe (Ferrero et al., 2014, 2018) and southern Asia (Chakrabarty et al., 2012; Shamjad et al., 2015) and biomass-burning sources over North and South America (Saleh et al., 2015; Zhang et al., 2017). However, there are only sparse data regarding the vertical structures of heating rates. The calculations were performed for single species such as BC or BrC, but most did not consider the co-impacts of all species (Chakrabarty et al., 2012; Chung et al., 2012; Shamjad et al., 2015). In the lower free troposphere, the interaction of aerosol-induced heating with boundary layer dynamics has raised much attention recently, as it may play an important role in suppressing boundary layer development, hereby exacerbating the local pollution (Li et al., 2017). The heating rate caused by light-absorbing aerosol was reported to vary as a function of the height and range at 0.3–2.1 K d−1 for the polluted PBL over Europe (Kedia et al., 2010; Ferrero et al., 2014, 2018) and 0.3–2.5 K d−1 for southern Asia (Tripathi et al., 2007; Ramana et al., 2007; Ramachandran and Kedia, 2010; Chakrabarty et al., 2012). Only a limited number of reports are available for eastern Asia.
This study chose three typical pollution events occurring in the wintertime over Beijing and performed continuous flights on a daily basis for each event. The vertical profiles of multi-wavelength aerosol optical properties were characterized in situ, accounting for all stages during pollution events from the pollution start, full development and end. The directly measured optical parameters were used as inputs for radiative transfer calculation, hereby estimating the heating rates of light-absorbing aerosols, including BC and brown carbon (BrC). The results here paint a full picture of vertical profiles of aerosol optical properties over the Beijing region and investigate the radiative forcing effect of aerosol during the heavy pollution events.
A King Air 350ER turbo aircraft in the Beijing weather modification office was employed for the in situ measurements over Beijing during the 2016 winter in this study. Meteorological parameters, including the temperature, relative humidity (RH), pressure, wind direction and wind speed with a time resolution of 1 s, were measured by the Aircraft Integrated Meteorological Measurement System (AIMMS-20, Aventech Research Inc, Canada), which was calibrated annually. The aerosol instrumentation inside the cabin was connected to an isokinetic inlet (Model:1200, Brechtel Inc, USA), which can deliver particles with a high transport efficiency (90 %) for sub-micrometre particles. The room temperature (25 ∘C) in the cabin had a self-drying effect when the temperature inside was higher than that outside of the cabin; in addition to this, a silicate dryer was used for all instruments to maintain a sampling RH lower than 40 %.
Table 1Flight summary in this study.
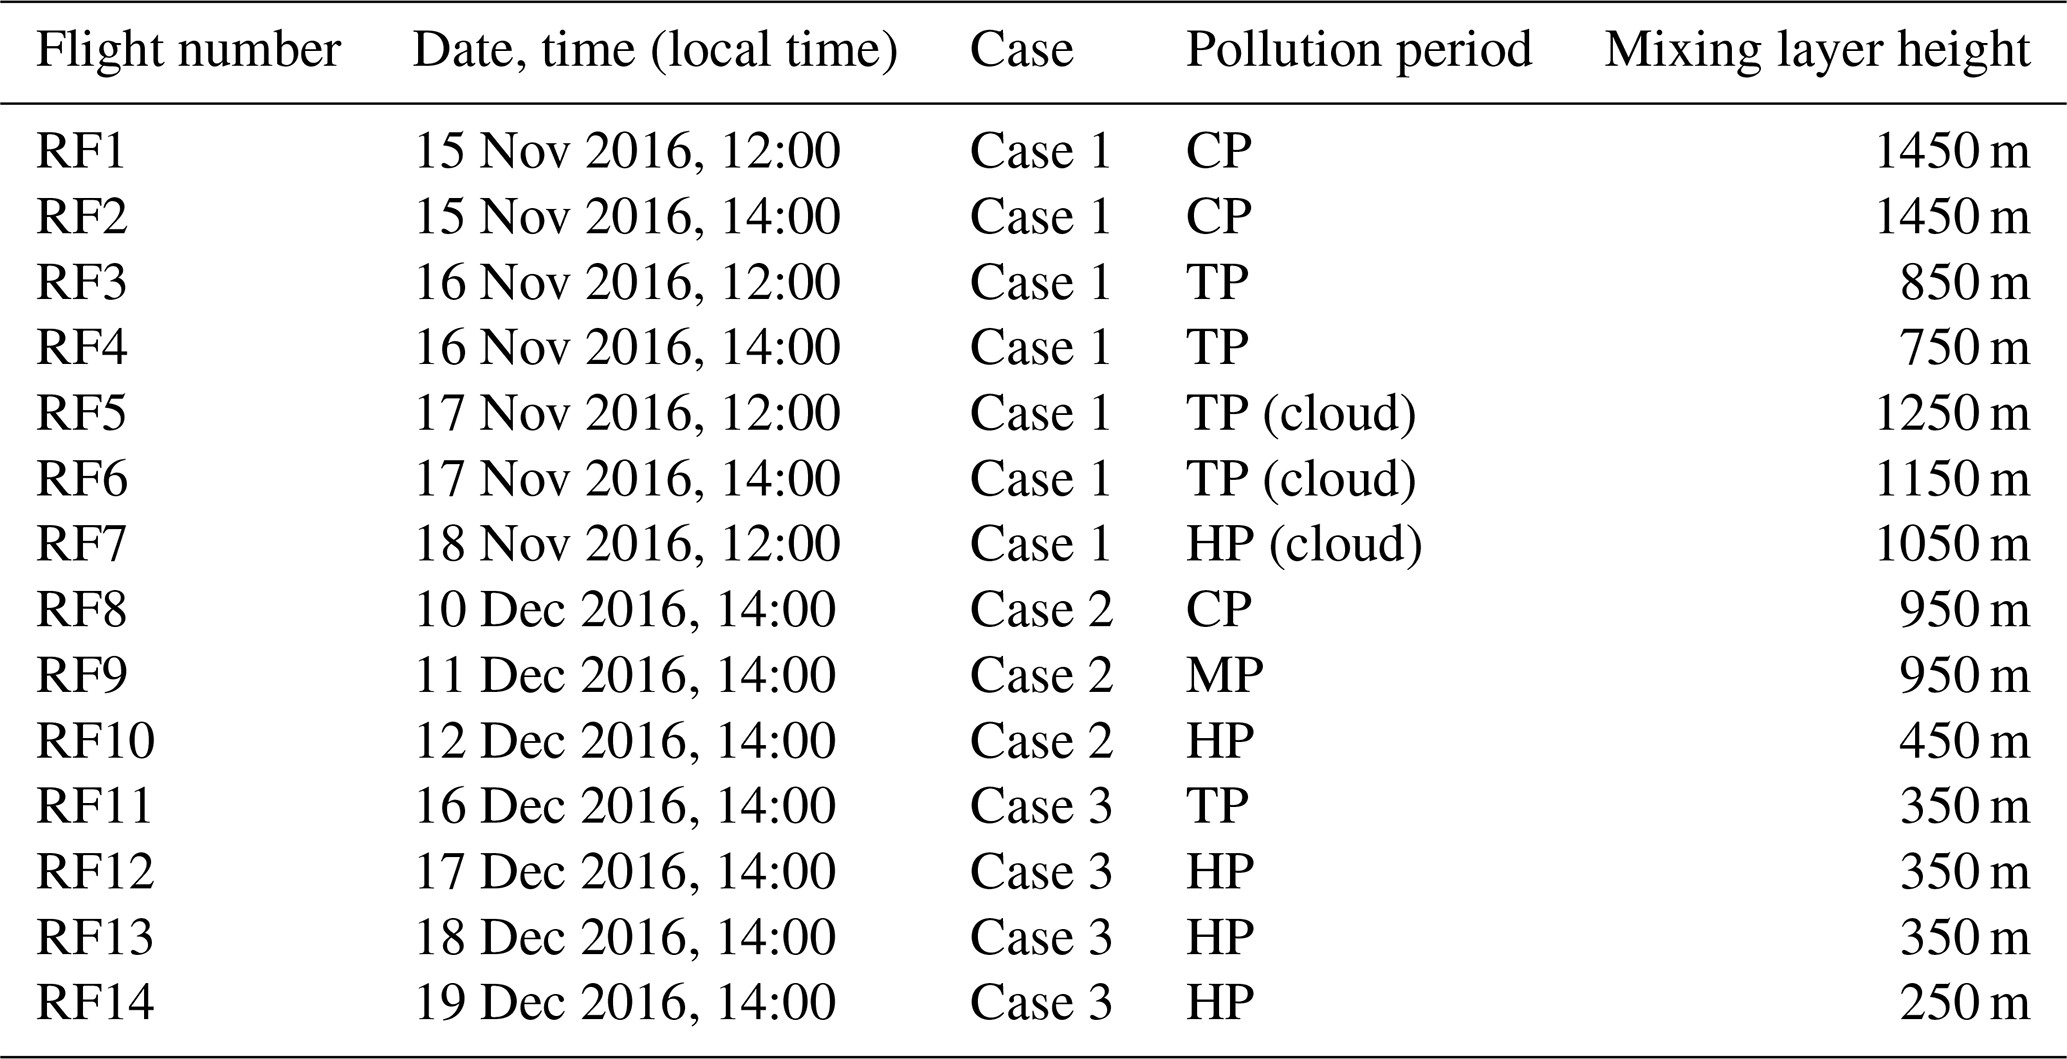
CP, TP and HP represent the clean, transition and heavy pollution period during a pollution event.
In situ measurements of aerosol optical properties were performed during three pollution events over Beijing from 15 November to 21 December 2016, including 14 flights covering the start, development and end stage for each pollution event. All flights were conducted around midday, when the PBL was well developed. Table 1 summarizes the information of each flight. In order to compare the AOD from the Aerosol Robotic Network (AERONET) and to calculate the vertical heating rates, only the cloud-free vertical profiles are used. In this study, three flights (20161117 – 12:00 LT; 20161117 – 15:00 LT; 20161118 – 12:00 LT) were observed with cumulus clouds (Table 1). The in-cloud data in this study were screened out according to the in situ measured cloud number concentration and liquid water content. Data with a total number concentration of more than 10 cm−3 and liquid water of more than 0.001 g m−3 are not included in the following analysis (Deng et al., 2009). A micro-pulse lidar (MPL; Sigma-Aldrich Inc, USA) was employed to measure the temporal evolution of aerosol extinction vertical profiles, and the vertical wind profile was measured by a wind profile radar with a vertical resolution of 150 m.
2.1 Aerosol optical properties
The aerosol scattering (σsca) and hemispheric-backscattering (σbsca) coefficients at λ=450, 525 and 650 nm were measured by an integrating nephelometer (Aurora 3000, Ecotech Inc, Australia), and the flow rate of Aurora 3000 was maintained at 4 L min−1 during flight. The baseline of Aurora 3000 in real time was corrected for Rayleigh scattering of gas molecules at different air pressures (Fig. S1 in the Supplement). In addition, the σsca and σbsca at all wavelengths were corrected for truncation affects (Anderson and Ogren, 1998; Müller et al., 2009).
The scattering Ångström exponent (SAE) measures the wavelength dependence of σsca, assuming a power relationship with λ, expressed as
where σλ1 denotes the σsca at λ1; the value of SAE could also be used to reflect particle size, with larger particles showing a smaller SAE (Carrico et al., 1998).
The asymmetry parameter (g) is obtained from the measured backscattering fraction according to the empirical function from Andrews et al. (2006):
where β is the hemispheric-backscattering fraction (σbsca∕σsca) measured by the Aurora 3000.
The absorbing coefficient (σabs) at different wavelengths (370, 470, 520, 590, 660, 880 and 950 nm) was measured by an Aethalometer (AE33, Magee Scientific Inc, USA; Hansen, 2005). The flow rate of AE33 was maintained at 4 L min−1 below 3000 m. The shadowing effect of the AE33 was corrected by the two spot measurements with different attenuation (Drinovec et al., 2017). The multiple-scattering artefact of the AE33 was corrected by measuring the ambient aerosol in parallel with a photoacoustic spectrometer (PASS-3, DMT Inc, USA), and the latter is independent of the filter artefacts. PASS-3 was calibrated using the NO2 and BC standard (Arnott et al., 2005). Figure S2 shows the 2-weeks ambient measurements between the AE33 and PASS-3 at three overlapped wavelengths. The multiple-scattering correction factor of 2.88 was consistently found at the three overlapped λ values.
The absorbing Ångström exponent (AAE), which can weight the absorption at different wavelengths, is calculated using the power fitting function at seven wavelengths:
We estimated the σabs of BrC, assuming that if BC is the only absorber at λ=950 nm, then the absorption of BC at other wavelengths was extrapolated by assuming an AAE of 1 (Kirchstetter et al., 2004; Lack et al., 2013; Massabò et al., 2015), and the contribution of BrC at each wavelength was obtained by subtracting the BC absorption from the total absorption (Schnaiter et al., 2005; D. Liu et al., 2015). It should be noted that previous studies pointed out that the AAEBC may be less than 1, thus assuming that AAEBC=1 may lead to an underestimation of the BrC contribution (Gyawali et al., 2009; Lack and Cappa, 2010; Feng et al., 2013). We therefore consider the results reported here to be the lower bound for the BrC contribution.
The single-scattering albedo (SSA) is the ratio of the scattering coefficient over the extinction coefficient (σext) at a given wavelength.
The parameters σsca, σabs and σext are reported for standard temperature and pressure (STP; 1013.25 hPa, 273.15 K) to allow for direct comparison at different altitudes among flights. Note that to compare with the AERONET results and for the radiative transfer calculations (as detailed in the following), these parameters are used in ambient conditions.
Column aerosol optical properties during the aircraft observation period were obtained from the AERONET sun-photometer network (Che et al., 2009; Xia et al., 2008), where the site (AERONET BEIJING_PKU) is about 10 km away from the location of the vertical profiles. The measurement of σext was up to 2500 m, above which the aerosol concentration was low enough to be below the instrument lower detection limit. Given the very low concentration above 2500 m, the value at 2500 m was used to reconstruct the vertical profile up to 5000 m. After that the σext from 2.5–5 km only accounted for 1 %–2 % of the integrated columnar extinction.
To evaluate the potential influence of the particle hygroscopicity on optical properties, the aerosol hygroscopic growth parameterization (f(RH)) is used to calculate the enhancement of σsca under ambient RH. This function was previously measured by P. S. Zhao et al. (2019) over the Beijing region, expressed as
where f(RH) was obtained by a comparison between dry and humidified nephelometers in parallel. a∕γ was 0.930∕0.329, 0.971∕0.372 and 0.988∕0.356 for the clean, moderate and heavy pollution period, respectively, according to the study.
The RH influence on g was calculated according to Zhao et al. (2018), expressed as
where a∕γ was 0.9984∕0.0849.
The σsca, σext, SSA and g are all calculated for the hygroscopicity influence.
Table 2Summary of input parameters for the radiative transfer calculation using discrete-ordinate radiative transfer code (DISORT).
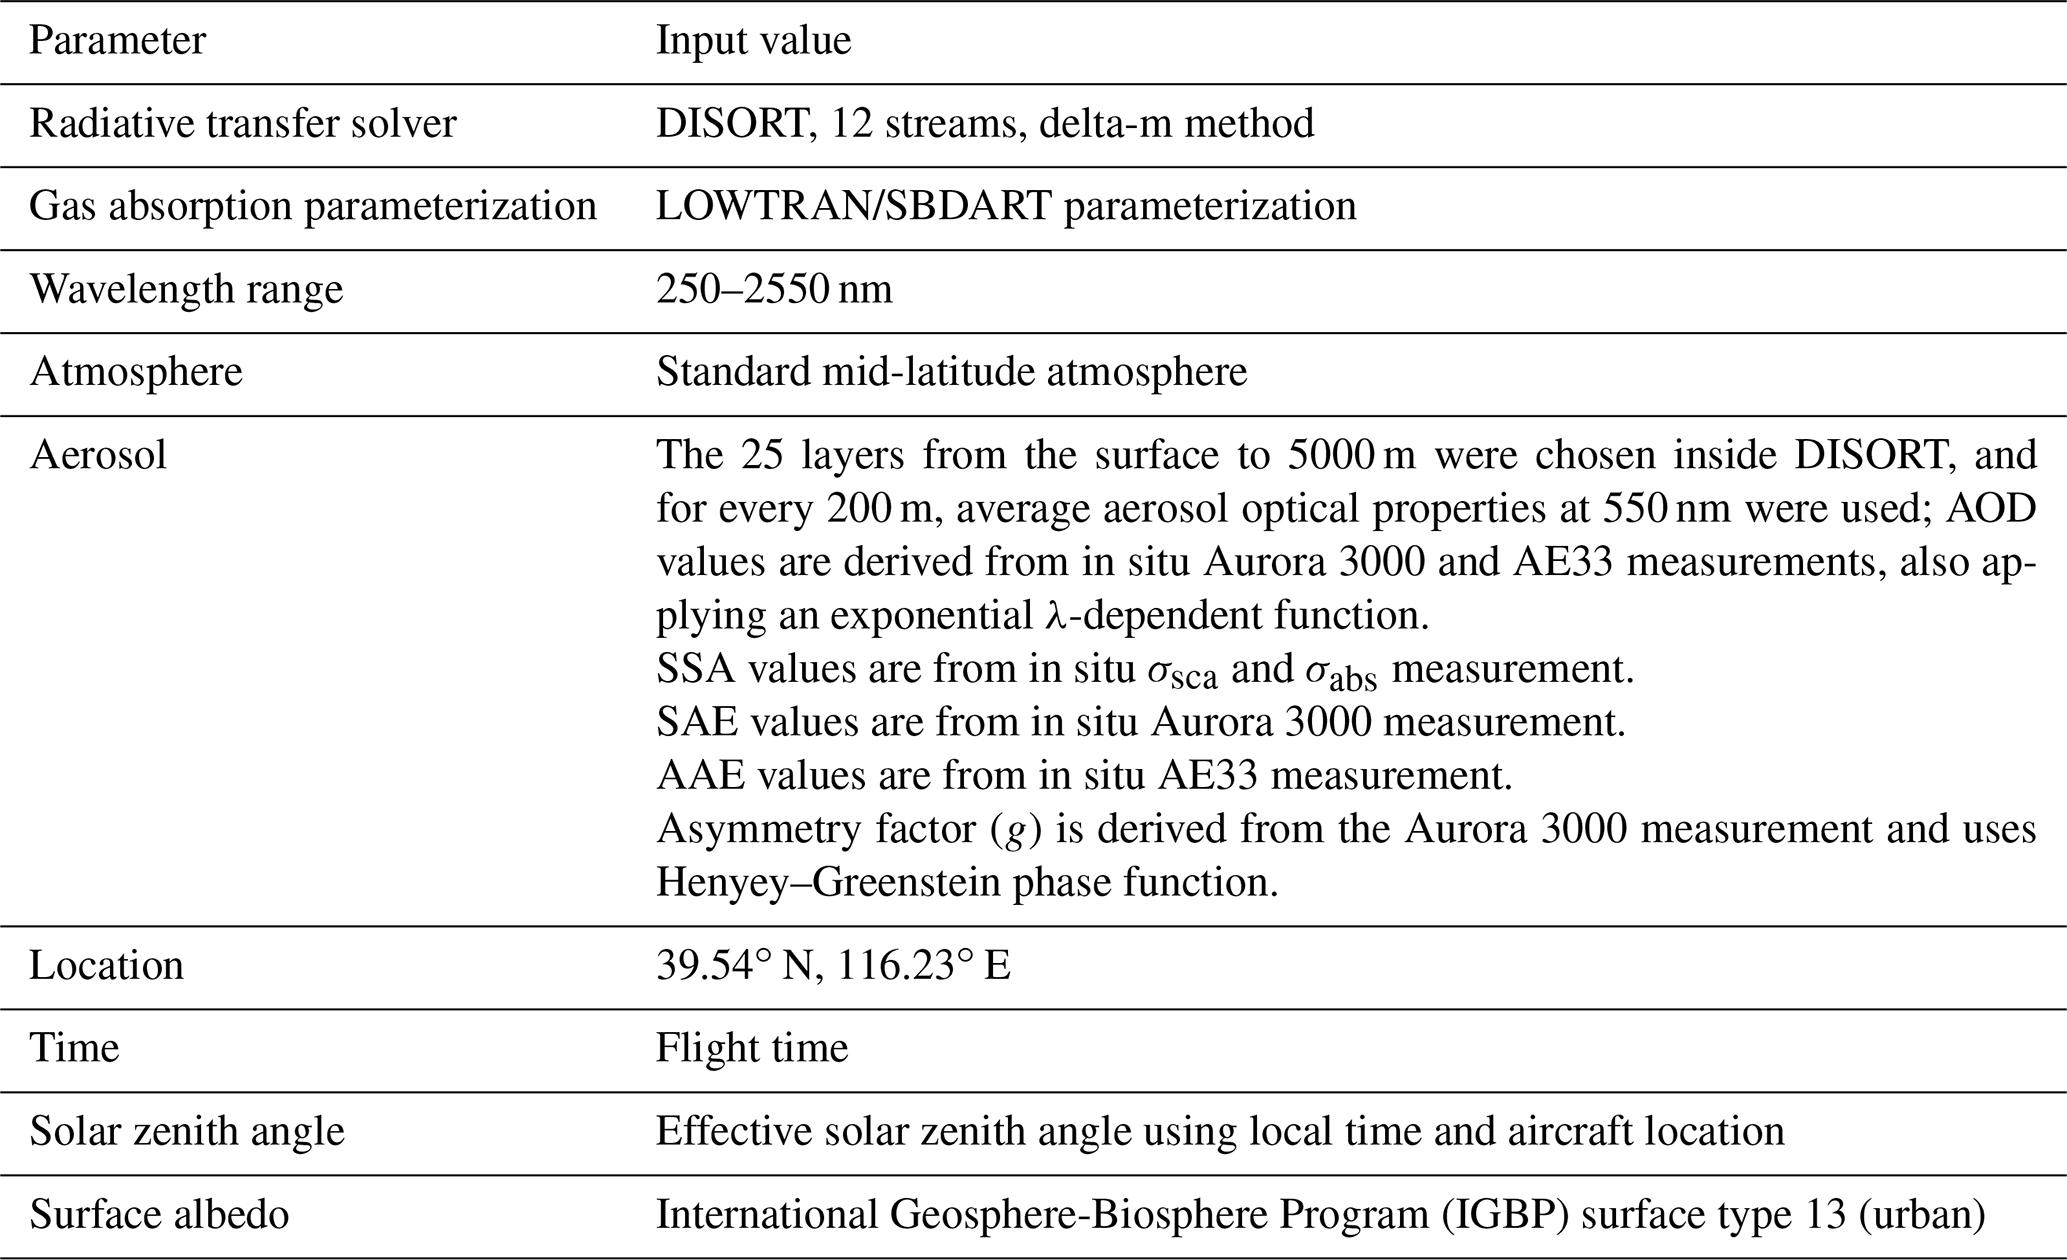
2.2 Radiative transfer calculation
The atmospheric irradiance and actinic flux use the pseudo-spherical version of the discrete-ordinate radiative transfer code (DISORT), as implemented in the libRadtran software package (Emde et al., 2016). The in situ measured vertical profiles of AOD, SSA and g are used as inputs, and the other input parameters for the radiative transfer calculation are summarized in Table 2. The calculation is performed for clear-sky condition only; thus the flights experiencing low-level clouds are not included in the calculation. The direct, upward diffuse and downward diffuse irradiance and actinic flux (AF; in mW m−2) at λ=250–2550 nm are calculated. The calculation of AF is performed with and without the aerosol input (AOD is set to zero) to evaluate the aerosol net impact. The heating rate is only calculated considering the in situ measured AOD. The spectral instantaneous absorbing power of BC (ABC) or BrC (ABrc) can be calculated by multiplying the absorption coefficient of BC (or BrC) by AF at a specified λ; then integrating all λ values will obtain the total absorbing power (Gao et al., 2008; Emde et al., 2016), expressed as
By assuming no radiative loss of solar energy and that the heat absorbed by aerosol is fully transferred to the surrounding air, the instantaneous heating rate of BC or BrC to the ambient air is hence calculated as
where ρ and Cp are the air mass density (kg m−3) and heat capacity (1.007 J (g K)−1), respectively. The profiles of aerosol optical properties influenced by hygroscopic growth (as calculated above) are also input into the calculation to work out its influence on heating rates.

Figure 1Temporal variations from 15 to 18 November in vertical profiles of wind direction (a) and wind speed (b) measured by wind profile radar. (c) Particle extinction measured by MPL. Aerosol optical depth (d) and aerosol absorption optical depth (e) from AERONET (asterisk) and derived from aircraft in situ measurements (open star). (f) Surface PM2.5 and RH. The vertical bars denote the periods of flight profiles, with blue, black and red representing the clean period, transition period and heavy pollution period during a pollution event, respectively. The other two pollution events are shown in the Supplement Figs. S2 and S3.
3.1 Overview and the pollution events
Three pollution events from 15–18 November (Case 1), 10–12 December (Case 2) and 16–19 December (Case 3) in 2016 were captured. Figure 1 shows the temporal evolution of surface PM2.5, AOD (AAOD) constrained by the in situ aircraft measurements and from AERONET, and the vertical profiles of σext and wind information during the Case 1 pollution event. The other two events are shown in Figs. S3 and S4. Aircraft vertical profiles were performed on a daily basis as the flight time, which is indicated by the vertical bars (Fig. 1). Each pollution event was classified as the pollution initialization, development and peak pollution period, corresponding to the following pollution levels: the clean period (CP; PM µg cm−3), transition period (TP; ) and heavy pollution period (HP; PM µg cm−3). Three flights (20161117 – 12:00 LT; 20161117 – 15:00 LT; 20161118 – 12:00 LT) experienced boundary layer clouds (Fig. 1c), as indicated by the intensive extinction on top of the PBL. There were three, four and four profiles in the clear-sky condition for the CP, TP and HP, respectively (as detailed in Table 1). As Fig. 1b shows, wind shear in both wind speed and direction appeared on top of the PBL, consistent with the vertical distribution of σext observed by a lidar (Fig. 1c). During the CP, wind profiles (Fig. 1b) showed dominant northwesterly wind with high wind speed throughout the column, dispersing the pollutant in a more developed PBL (Fig. 1c). During the TP, the southerly air flow dominated and the PM2.5 mass concentration underwent a rapid increase from 30 to 100 µg m−3 over several hours. During the HP, the wind speed was relatively low at all altitudes, maintaining the PM2.5 mass concentration at a high level.

Figure 2Vertical profiles of temperature (a, b, c), relative humidity (d, e, f) and potential temperature (g, h, i) for clean period, transition period and heavy pollution period, respectively. The black and red dots represent inside the PBL and above the PBL.
Figure 2 summarized the in situ measured meteorological parameters at different stages of pollution events. The height of the PBL (PBLH) was determined by considering a variety of factors. Firstly, a stable potential temperature (θ; Fig. 2d–f) with a vertical gradient K km−1 in the PBL indicated sufficient convective mixing (Su et al., 2017), with a pronounced positive gradient above the PBL indicating a stable layer (Petra Seibert, 2000). Secondly, there was usually a temperature inversion on top of the PBL (Fig. 2a–c). During the CP, the weak temperature inversion (∼0.15 K per 100 m) on top of the PBL allowed pollutants to penetrate the PBL and disperse in a higher atmospheric column (Fig. 2b). This inversion was significantly enhanced for the TPs and HPs, to 0.9 K per 100 m and 0.7 K per 100 m, respectively. The large increase in the inversion during flight 20161211 was caused by the regional transport from the south, when the lower-latitude warmer air mass was imposed onto the measurement level (Tian et al., 2019). Additionally, the PBLH decreased gradually as the pollution continued during the pollution event, in line with the enhanced aerosol concentration in the PBL. The moisture had similar features in that a lower moisture content could be seen at a lower pollution level and was vertically dispersed efficiently, whereas the stronger inversion trapped the moisture inside the PBL, leading to a positive vertical gradient, with the maximum RH showing on top of the PBL. There were some regional transport influences under TP, resulting in enhanced RH when air mass was advected from the south (Fig. 2f).
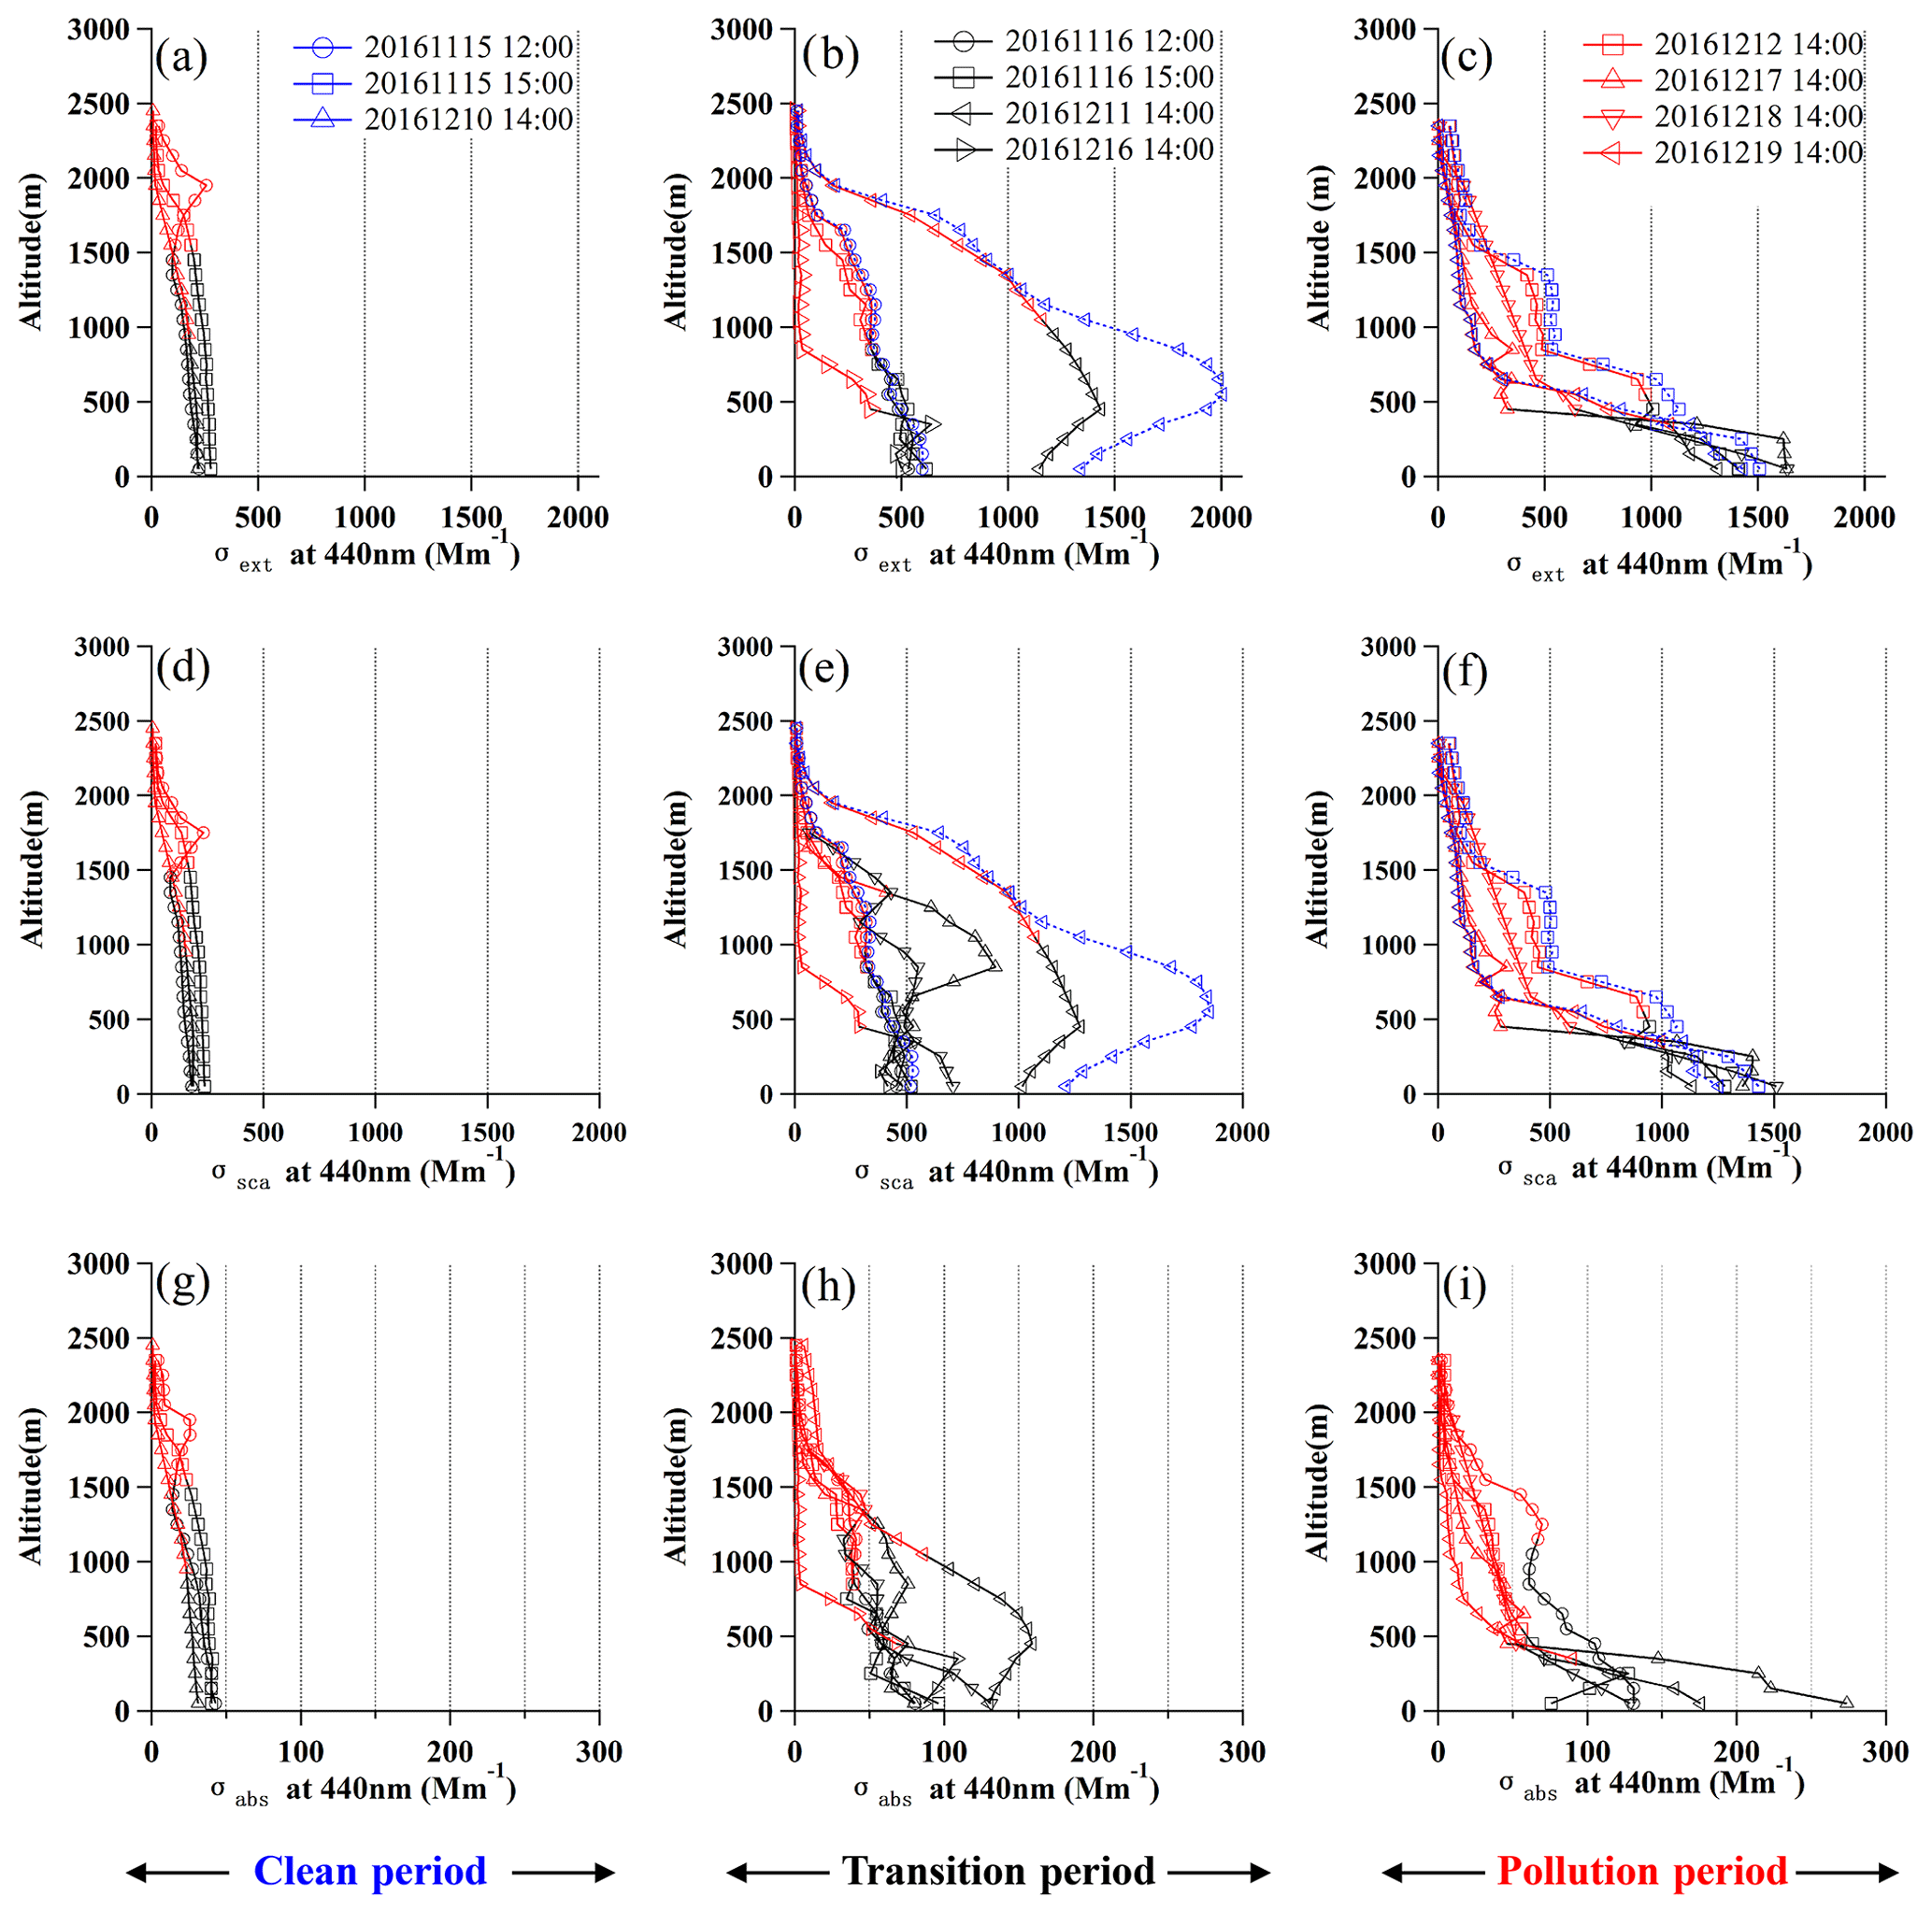
Figure 3Vertical profiles of aerosol extinction, scattering and absorption coefficient at 440 nm for CP (blue), TP (black) and HP (red), respectively. The black and red lines represent inside of and above the PBL, respectively. The hygroscopicity-corrected profiles are shown as blue lines.
3.2 Vertical profiles of σext, σsca and σabs
Figure 3 shows the vertical distributions of aerosol optical properties including extinction (σext), scattering (σsca) and absorbing (σabs) coefficients. Different structures of vertical profiles were observed for CPs, TPs and HPs. During the CP, aerosol concentration was low and showed a uniform mixing inside the PBL, with σext, σsca and σabs values of 220–270, 180–240 and 30–50 Mm−1, respectively. The backward trajectories for the CP showed that the air masses were from the northwestern low-emission region (Fig. S5). The TP showed about a 4-fold increase in σext compared to the CP. During the TP, the σext, σsca and σabs had large variation inside the PBL, at 325–1435, 300–1275 and 45–160 Mm−1, respectively, and the mean PBLH decreased to 200–500 m. During these pollution accumulation periods (before the pollution reached the peak level), two contrasting vertical structures were observed. One showed good mixing in the PBL but a decreased concentration in the free troposphere (FT; e.g., flight 20161115 – 14:00 LT and 20161210 – 14:00 LT; Fig. 3a). The other one had the increased aerosol layer on top of the PBL and showed positive vertical gradients for all optical properties at a certain level (e.g., flight 20161116 – 12:00 LT, 20161211 – 14:00 LT and 20161216 – 14:00 LT; Fig. 3b). The former was because of the mostly cleaner northwesterly air mass and higher wind speed influencing the layer above the PBL, while the latter resulted from the southwesterly regional transport (Tian et al., 2019).
During the HP, most flights consistently showed the exponentially declined vertical profile patterns, and the PBLH was even lower than that during the TP (Fig. 2f). The stronger temperature inversion (Fig. 2c) and lower wind speed (Fig. 1b) inside the PBL led to high stability of the PBL and promoted the pollutant accumulation. The aerosol concentration was largely enhanced towards the surface and sharply declined above the PBL. Interestingly, the absorption showed a higher degree of the negative vertical gradient than the scattering at λ=440 nm, which may reflect the different sources and mixing ratios of absorbing and non-absorbing aerosols. The surface emission tends to contain more primary sources of absorbing particles such as BC and BrC, while enhanced secondary aerosol formation at upper altitudes may add additional aerosol extinction.
The vertical profiles of σsca and σabs during HP can be fitted as
where σ0 represents the surface value of σsca and σabs, and H is the altitude. a and b are the parameters defining the changing rate with altitude. This parameterization could be used to represent the vertical structure of optical properties under heavy pollution conditions.
The hygroscopic effect on aerosol vertical profiles was mainly controlled by the ambient RH (shown in blue lines in Fig. 3). For most of the flights, the hygroscopic effect could be neglected due to low RH (<50 %; Fig. 2). For some of the flights (20161211), the σsca and σext, especially at the top of the PBL, could be enhanced by a factor of 1.3.
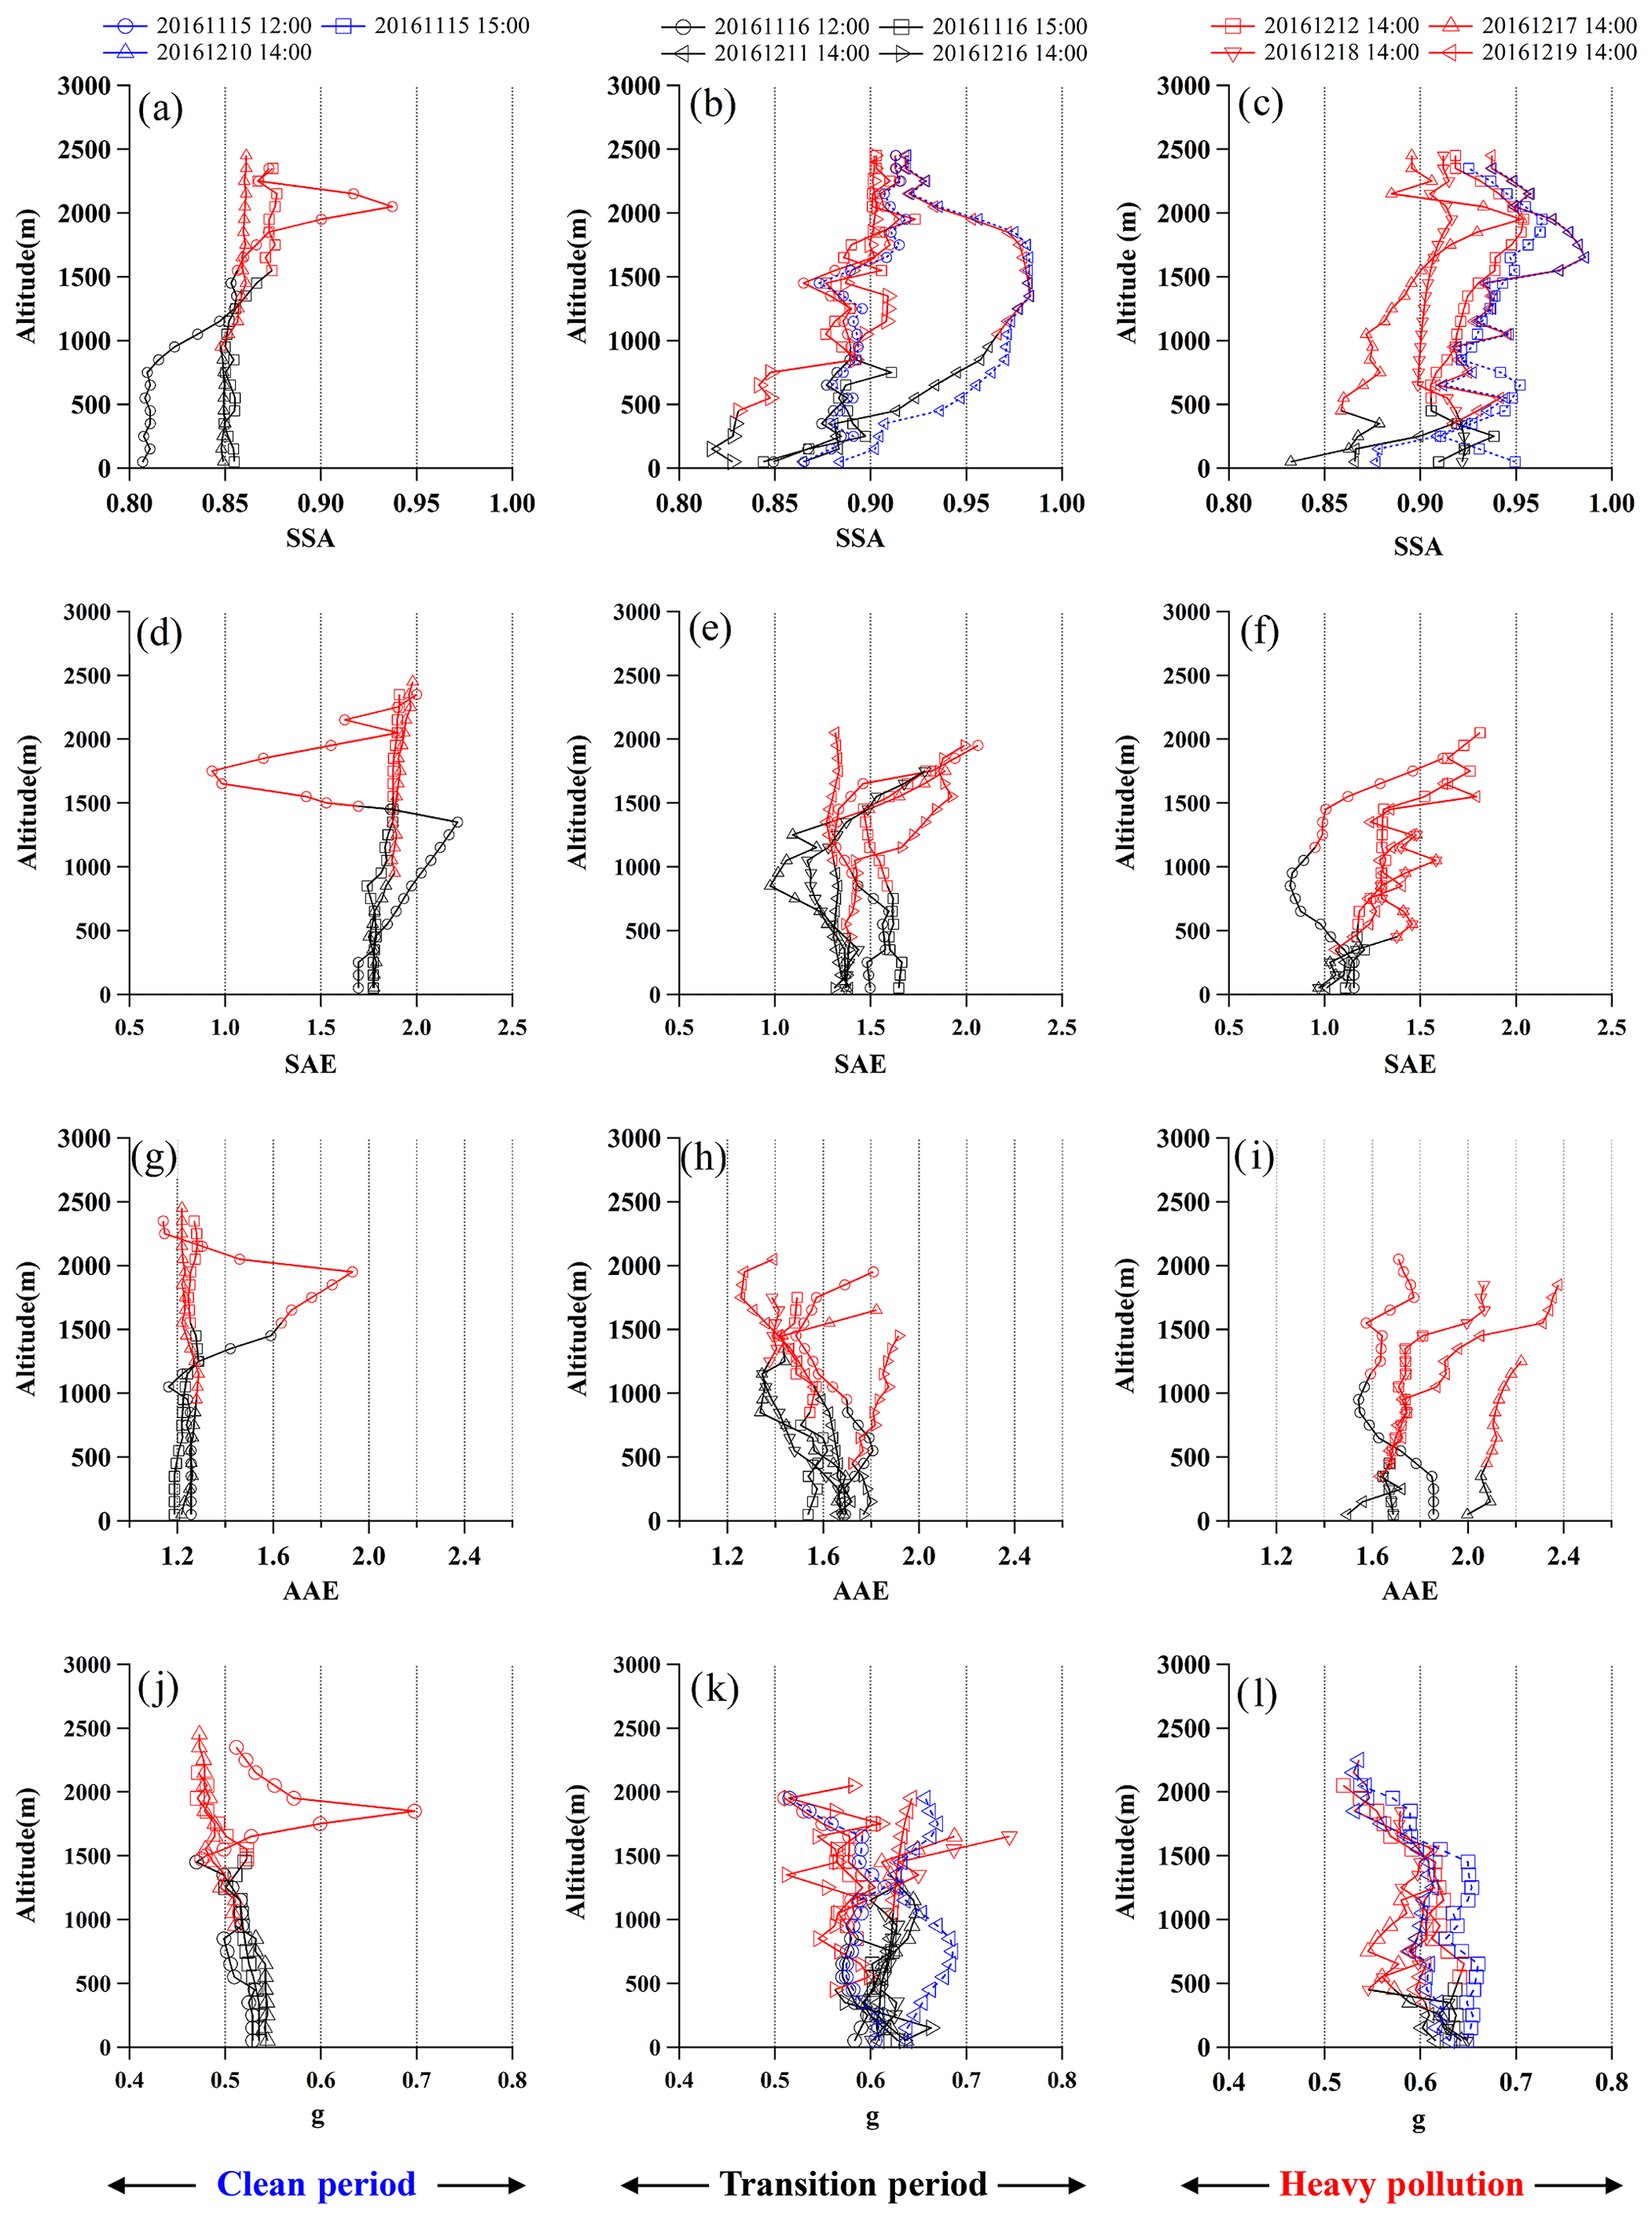
Figure 4Vertical profiles of aerosol single-scattering albedo at 440 nm (SSA; a–c), scattering Ångström exponent (SAE; d–f), absorption Ångström exponent (AAE; g–i), and asymmetry parameter (g, j–l) for CP (a, d, g, j), TP (b, e, h, k) and HP (c, f, i, l), respectively. The hygroscopicity-corrected profiles were shown in blue lines.
3.3 Vertical profiles of SSA, SAE, AAE and g
Figure 4 shows the vertical profiles of SSA, SAE, AAE and g for all the flights during different stages of pollution events. Overall, the SSA showed two modes inside the PBL. During the CP, SSA for most flights was populated at 0.85 and had less variation throughout the column in the PBL. Flight 20161115 AM showed a strong elevation of SSA (0.94) at 2200 m (Fig. 4a), which may be influenced by a dust layer (to be further discussed below). SSA showed a positive vertical gradient for the TP and HP inside the PBL; i.e., from the surface to the PBLH, the mean SSA increased from 0.85 to 0.91 and from 0.87 to 0.92 for the TP and HP, respectively. This indicates the reduced fraction of absorbing particles, in turn suggesting an enhancement of secondary production for non-absorbing particles. There were a few profiles featuring a large enhancement of SSA (>0.95, for flight 20161211) at high altitudes (Fig. 4b), and backward trajectory analysis (Fig. S5) showed that these resulted from the regional transport when more aged pollutants were advected to the high altitude. The SSA in the FT was mostly higher than that in the PBL and stayed at 0.9–0.95 for the TP and HP, suggesting a lower absorbing particle fraction at higher altitudes. Comparing different stages during pollution events, it could be concluded that at the initialization stage of the pollution, when the total PM was relatively low, the SSA was lower, while the increase in the pollution level added more secondary substances, hence increasing SSA. This trend was consistent with the previous ground studies in Beijing (He et al., 2009; Jing et al., 2011).
The SAE reflects the particle size, with larger sizes having a smaller SAE. A decreasing SAE was shown for increasing pollution levels inside the PBL (Fig. 4); i.e., from the CP to HP, the SAE in the PBL showed an average value of 1.74, 1.45 and 1.21, respectively. For most of the profiles, the SAE showed enhancement at higher altitudes. This means that smaller particle sizes were present at higher altitudes, which may result from a higher scavenging efficiency for larger particles, whereas smaller particles remained un-scavenged at the upper height (Liu et al., 2009). There was an exception for flight 20161211, when the regional advection transported larger and aged particles to the higher altitude. The particle size also corresponded with the asymmetry parameter (g, Fig. 4j–i), with larger particles representing a larger fraction of forward scattering (larger g). Note that there was only one flight (flight 20161211) under RH>80 %, where the particle hygroscopicity had appreciable influences on SSA (increased by 0.05), SAE (decreased by 0.2) and g (increased by 0.1).
The AAE reflects the degree of the absorption towards shorter wavelengths such that the presence of BrC will enhance the absorption in the UV. A lower AAE of 1.2±0.2 was shown for the CP (Fig. 4g), but it increased to 1.56±0.3 for the TP in the PBL (Fig. 4h), and an additional higher mode of AAE was shown at 1.8–2.0 for the HP (Fig. 4i). There was a weak variation in AAE for the CP throughout the column, but it became largely spread for the TP, i.e., with either a positive or negative vertical gradient at different altitudes. Notably, the AAE showed a consistent positive vertical gradient for most of the HP profiles (Fig. 4i). This implied the enhancement of BrC contribution at higher altitudes for the polluted troposphere. Flight 20161115 AM showed a notably increased AAE up to 2 at an altitude of 2 km (Fig. 4g), which may reflect the influence of dust (Cazorla et al., 2013). The ground AAE had strong seasonal variation, with winter normally showing a higher AAE due to higher emissions of solid fuel burning (Sun et al., 2017; J. Wang et al., 2018). However, there is still a lack of results on the vertical characteristics of AAE due to limited measurements, and the results here highlight the enhancement of BrC at higher levels, mainly for the polluted environment.

Figure 5Comparison between AERONET and aircraft in situ constrained AOD and AAOD: (a)–(c) the comparison of AOD at 440, 675 and 870 nm, with a colour gradient representing different levels of RH. The solid and open markers denote the dry and hygroscopicity-corrected conditions. (d)–(f) Comparison of AAOD at 440, 670 and 880 nm. The blue, black and red circles represent the CPs, TPs and HPs, respectively.
3.4 Comparison of column-integrated and in situ constrained AOD and AAOD
To compare the AOD and AAOD between AERONET and those constrained by the in situ measurements, the AERONET data were chosen to match the aircraft profiles in time (±3 h) and location (within 10 km; BEIJING_PKU site). The comparison was performed at overlapped wavelengths (440, 675 and 870 nm) between AERONET and aircraft instruments. As shown in Fig. 5a–c, high correlation (R2>0.95) was found between the columnar and in situ measurements. In particular, the correlation was close to unity for dry conditions (RH<40 %), while the AERONET data were about 10 %–20 % higher than the in situ measurement for RH>60 %. Improved agreement was achieved by 8 %–15 % if considering aerosol hygroscopic growth (open circle in Fig. 5a–c), despite the in situ constrained AOD still being 2 %–5 % lower than AERONET after the hygroscopic correction.
Figure 5g–i show, at three wavelengths, that the AAOD had lower correlations between both methods compared to AOD, with R2=0.75, 0.58 and 0.49 at 440, 675 and 870 nm, respectively. The columnar AAOD was overall about 10 %–25 % higher than the in situ measurement, and this AERONET AAOD overestimation was higher under higher AOD conditions. This is consistent with previous findings conducted over the USA in that the AAOD retrieved from AERONET was biased higher when compared to the in situ measurement (Andrews et al., 2017).
Note that there were better agreements during the CP, when there was a lower pollution level and lower RH (shown in blue dots). This suggests that a lower moisture level and less AOD interference may improve the agreement in AAOD. Previous studies pointed out that the retrieval from AERONET was sensitive to the variation in aerosol vertical distribution (Torres et al., 2014). We thus speculate that the better agreement for the CP was due to the vertically homogeneous distribution of aerosol optical properties, and the larger bias for the TPs and HPs might be caused by the significant variations in the vertical profiles. Other factors like the aerosol hygroscopic growth under higher RH may introduce factors in enhancing the absorption, e.g., more lensing effects on BC absorption via thicker coatings and coatings with moisture (Wu et al., 2017). Though this study is not able to rule out the exact influencing factor in causing this discrepancy, an overestimation of 25 % in the AERONET AAOD under polluted conditions is shown for the dataset here.
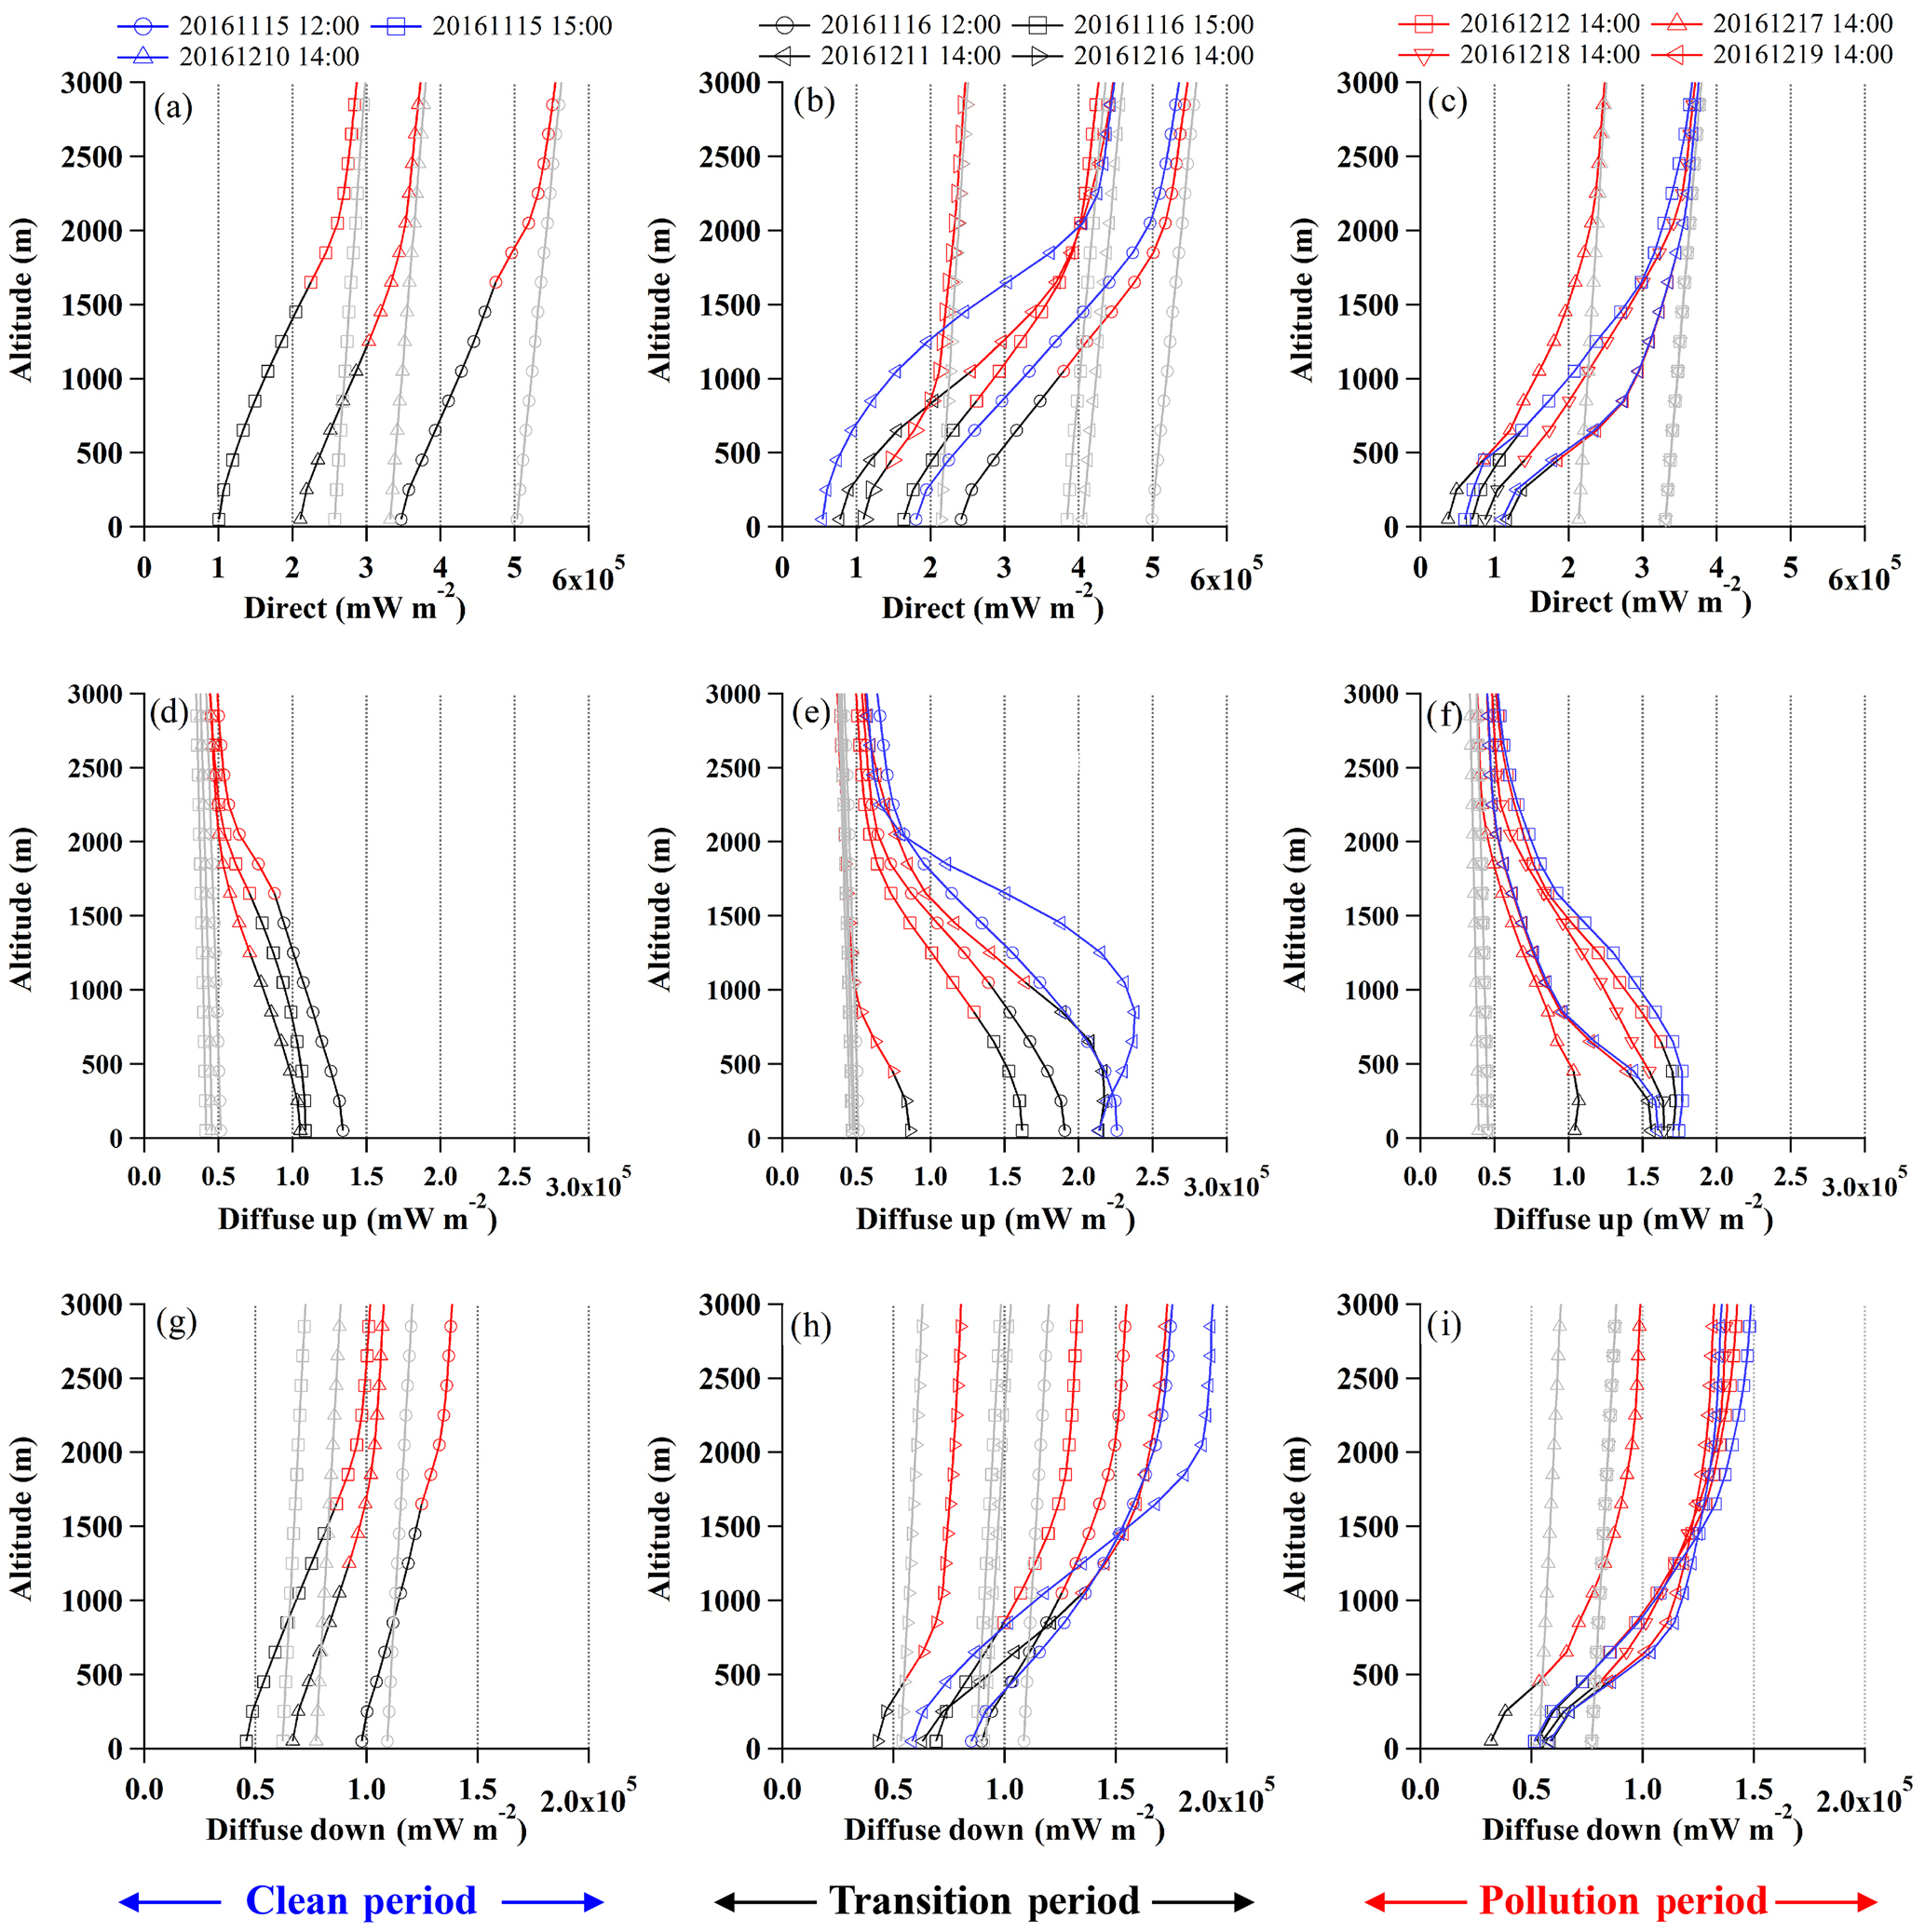
Figure 6Radiative transfer results calculated by DISTORT. (a)–(c), (d)–(f) and (g)–(i) show the direct, diffuse upward and diffuse downward irradiance, respectively. The left, middle and right panel represent CP, TP and HP respectively, with black and red lines denoting the area above the PBL and within the PBL. The coloured (all colours except for grey) and grey lines denote the profiles with and without aerosol influence, respectively, and the blue lines are for corrected hygroscopic effect.
3.5 Heating impacts of BC and BrC
Figure 6 shows vertical profiles of irradiance from the radiative transfer calculation using in situ measurements as model inputs (Table 1). The results show that the presence of aerosols reduced the direct irradiance reaching the surface (Fig. 6a–c) but increased the upward diffuse (Fig. 6d–f) and downward diffuse irradiance, especially above the PBL (Fig. 6g–i). The direct irradiance on the surface ranged from 1×10⁹ to 3.5×10⁹ mW m−2, with an average of 2.2×10⁹ mW m−2 during the CP (Fig. 6a), which was about 2-fold and 3-fold larger than that during the TP (Fig. 6b) and HP (Fig. 6c), respectively. The combined direct, diffuse upward and downward irradiance, which forms the actinic flux (AF), showed an enhancement above the PBL and a reduction within the PBL (Fig. 7a–c), but the extent to which the enhancement or reduction occurred depended on the aerosol vertical profiles. The vertical gradient of AF was slightly modified by the aerosol loadings during the CP, whereas for the TP and HP, aerosol effects caused an AF about 2 times smaller within the PBL and 20 % larger above the PBL, leading to an increased vertical gradient of AF. The AF received at lower altitude was reduced by up to 10 % by incorporating the aerosol hygroscopicity influence (Fig. 7) due to the enhanced AOD, and AF was further redistributed to give a larger vertical gradient (Fig. 7a–c).
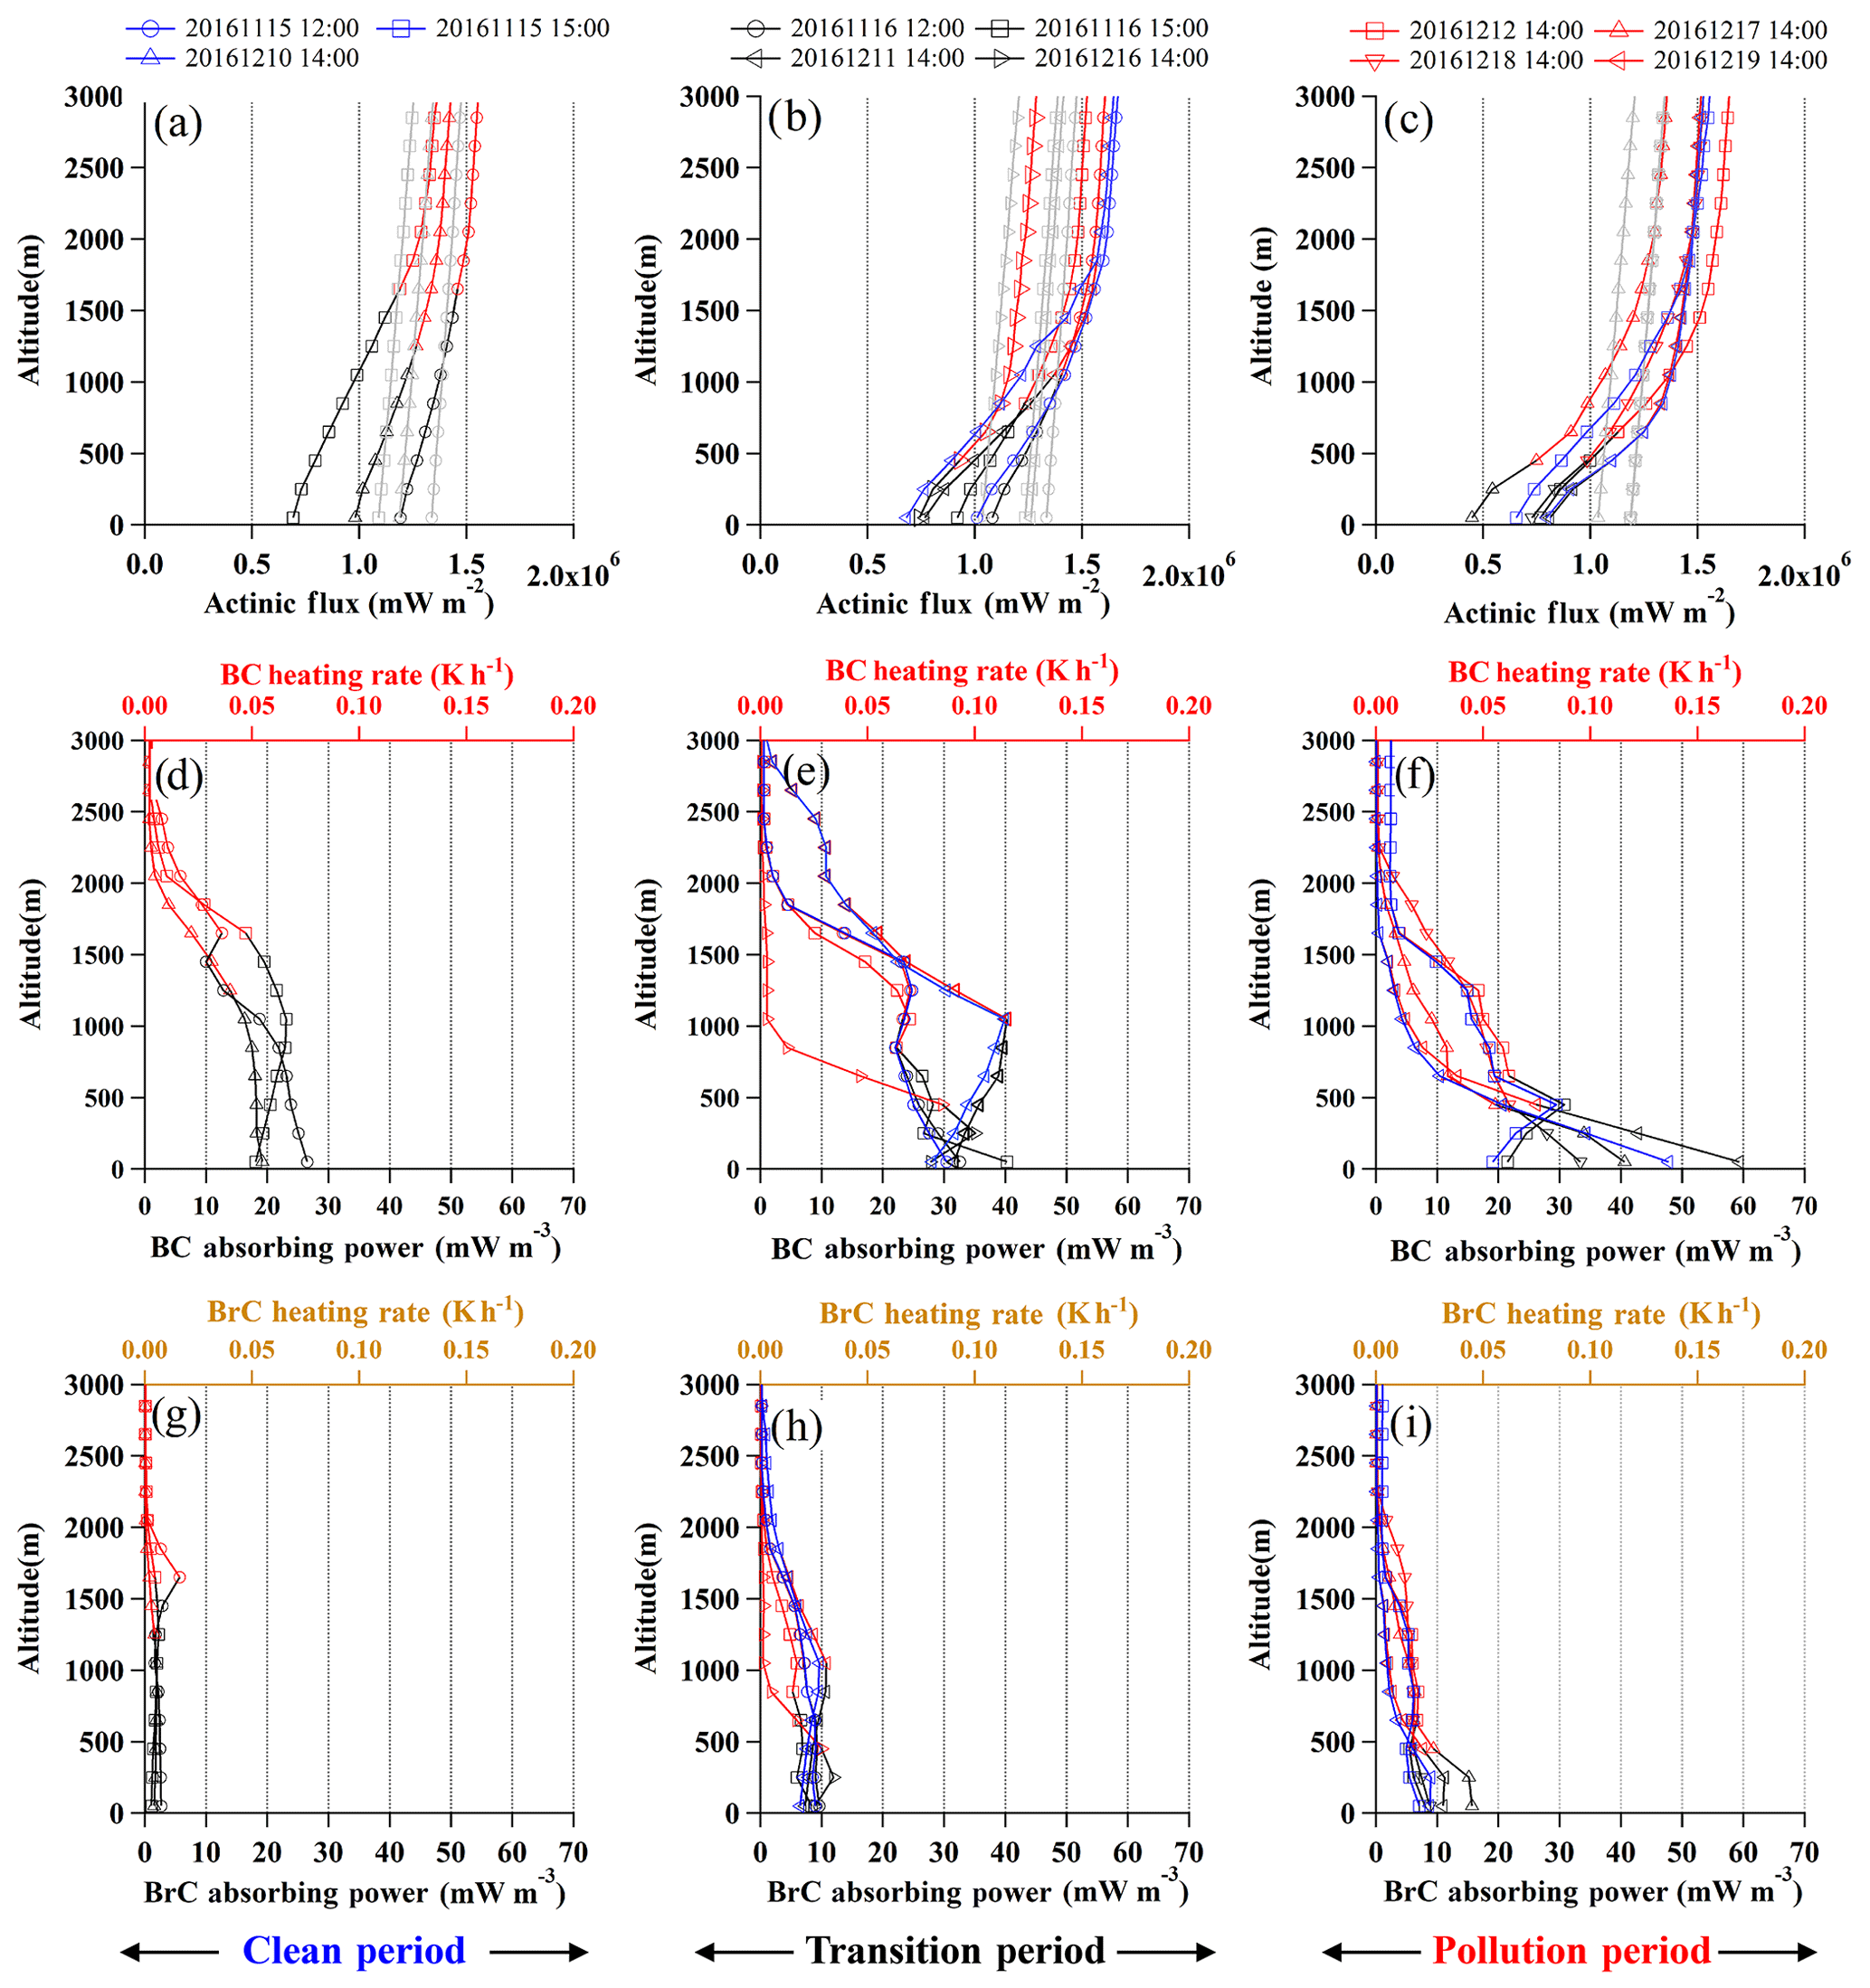
Figure 7Actinic flux (a–c), BC absorbing power (d–f) and BrC absorbing power (g–i). The left, middle and right column is for LP, TP and HP, respectively, with the black and red line denoting the area within and above the PBL. The grey lines in (a) to (c) show the aerosol-free results, and the blue line denotes the corrected hygroscopic effect. The upper x axis from (d) to (i) shows the heating rate.
The vertical profiles of the absorbing power and heating rate of BC are shown in Fig. 7d–f. The vertically homogeneous BC heating rate of 0.05 K h−1 was found inside the PBL during the CP (Fig. 7d). During the regional transport cases (flight 20161211 and flight 20161216) for the TP, positive vertical gradients (increase with increasing altitude) of BC heating rates were observed, and a heating rate as high as 0.1 K h−1 could occur at the top of the PBL (Fig. 7e). During the HP, a negative heating rate (decrease with increasing altitude) of BC was found except for flight 20161212 – 14:00 LT in Case 2, and the BC heating rate at the surface could reach as high as 0.15 K h−1 (Fig. 7f). The reason causing the negative vertical gradient of the BC heating rate was the higher degree of the negative gradient of σabs (Fig. 3i) than the positive gradient of AF (Fig. 7). The results here show that the atmospheric heating by aerosol was mainly inside the PBL, and for the polluted period, the BC-induced heating was 0.05–0.17 K h−1, generally consistent with previous studies over the polluted Asian region, with 0.02–0.17 K h−1 (Ramana et al., 2007, 2010; Kedia et al., 2010).
The contribution of BrC to the absorbing power and heating rate was computed as the integrated portion of absorption over the visible wavelength (370–950 nm in this study) by subtracting the BC absorption from the spectrum. Figure 7g–i show the vertical profiles of the BrC heating rate. A continuous increase in the BrC heating rate in the PBL was observed from the CP to the HP, with a mean heating rate of 0.02, 0.03 and 0.05 K h−1 during the CP, TP and HP, respectively. Though the BC was the main contributor to the heating in the PBL, the heating of BrC was more evenly distributed and could be comparable with the BC heating rate at high altitudes especially during the HP (Fig. 7i). The contribution of BrC to the total absorption was reported to be 10 %–27 % over the polluted regions of Europe (Ferrero et al., 2018) and southern Asia (Chung et al., 2012; Shamjad et al., 2015), in general consistent with the results during polluted periods here.
Corresponding with the aerosol hygroscopicity influence on the actinic flux, the heating rate showed lowered intensity but an enhanced vertical gradient for the flights with high ambient RH (Fig. 7b). The vertical gradient of the overall heating rate from absorbing components, i.e., an increase or decrease in the heating rate with altitude, will importantly determine the influence on atmospheric stability. If the heating occurred near the surface (Case 3), the lower layer will be heated, leading to enhanced convective mixing (Sühring et al., 2014; Petaja et al., 2016), whereas if the heating was above the PBL (Case 2), an increase in the temperature inversion will occur, hence inhibiting the PBL development and trapping the pollutants in the PBL (Chakrabarty et al., 2012; Tripathi et al., 2007). This study showed positive vertical gradients for 30 % of the flights, especially during the regional transport, when pollutants were advected from outside of Beijing and showed the elevation of absorption at higher altitudes (Fig. 8). The rest of the flights showed highly accumulated aerosol concentration near surface, and BC potentially promoted the dispersion in the PBL and decreased its stability. This was also found by a previous study (Ferrero et al., 2014).

Figure 8Spectral absorption coefficient of BC and BrC inside of and above the PBL for CP (a, d), TP (b, e) and HP (c, f), respectively, shown in black and brown for BC and BrC, respectively. The vertical profiles of heating portion of BrC for CP, TP and HP are shown in (g)–(i).
3.6 The importance of BrC heating effects
Figure 8 shows the measured absorption coefficient of BrC and BC inside of and above the PBL at different values of λ for the CP, TP and HP, respectively. The results suggested that both the σabs values of BC and BrC increased with the pollution level; e.g., the σabs at λ=440 nm was 42.8 and 7.2 Mm−1 on average in the PBL and above the PBL, respectively, during the HP and was 4.7 and 1.3 Mm−1 for the CP. The contribution of BrC to total σabs was found to increase from the CP to the HP (Fig. 8c, f). This is in line with previous studies in urban Beijing in that more BrC contribution to total absorption was found under a higher pollution level (Ran et al., 2016a; Xie et al., 2019), suggesting the important role of BrC in absorption under polluted conditions.
The contribution of BrC to total heating rates showed notably different vertical structures. During the CP, all profiles showed a consistently low BrC contribution throughout the column, with about 7 % at the surface and 9 % in the FT (Fig. 8g). This means the low primary emission or the emission after being diluted by clean air mass did not contain a large fraction of absorbing organics. During the TP, the BrC contribution inside the PBL increased to 22 % and showed considerable variations at higher altitudes (Fig. 8h). During the HP, the surface contribution was comparable with that in TP but showed remarkably enhanced BrC heating contribution at higher altitudes, with a vertically increasing rate of 1.5 % m−1 in the PBL and reaching as high as 45 % in the lower FT. The higher heating contribution of BrC at higher altitudes means that the BrC absorption played an important role in heating at upper altitudes, which may enhance the temperature inversion at that level, hereby inhibiting the convective mixing under the heated layer.
By comparing the BrC heating contribution at the surface, there was an increase from the CP to the TP; however, there was no increase from the TP to the HP. This suggests that the primary emission will increase the BrC fraction from the CP to the TP, but for an even more polluted environment from the TP to the HP, the primary emission may provide a limited further increased fraction of BrC. The primary BrC could result from a range of combustion sources, and the polluted region at the south of Beijing contained a higher fraction of residential-coal-burning sources (Sun et al., 2017; Xie et al., 2019), which may influence the Beijing region during the polluted period in the wintertime. The relatively consistent BrC contribution at ∼20 % from the TP to the HP suggested the relatively uniform BrC profiles for the primary sources. During the TP, the BrC contribution above the PBL had rarely been above 30 % (Fig. 8h); however during the HP, there was a further enhancement of BrC contribution up to 45 % above the PBL (Fig. 8i). Note that there was no direct injection of biomass-burning plumes at the high altitude during the study period, and the higher portion of BrC absorption above the PBL during the HP may be formed through secondary production in addition to the primary source contribution. As shown in Fig. 7a–c, there was more intensive actinic flux received at higher altitudes, and this may promote the photochemical reactions of gas-phase species, allowing more secondary formation of aerosol, which may contain a fraction of BrC (Feng et al., 2013; Nakayama et al., 2013). Previous studies also found enhanced BrC formation with the light source under certain RH levels (Nguyen et al., 2012; Updyke et al., 2012; Laskin et al., 2015; Zhao et al., 2015). The positive gradient of the BrC heating contribution more likely resulted from the enhanced RH from the surface to the top of the PBL (Fig. 2i) because increased moisture promotes the aqueous reaction and gas-to-aerosol partition, which may also form part of the BrC observed here (Ervens et al., 2011; Nakayama et al., 2013). The secondary formation of BrC also requires the inorganic or VOC (volatile organic compound) precursors being transported to the high altitudes; therefore the enhancement of BrC mostly occurred under a higher pollution level, when sufficient gas precursors were transported to higher altitudes. The BrC may be also subject to the bleaching process and lose the absorbance (Sareen et al., 2013; Lee et al., 2014; Wong et al., 2019) because the profiles in this study were determined over an urban megacity where the sampled pollutants were fairly young and may not have experienced sufficient ageing for BrC to be degraded.
This study provides detailed characterization of vertical profiles of aerosol optical properties over the Beijing region by continuous aircraft in situ measurements at different stages during the pollution events. The results, combining direct measurements of scattering and absorption at multiple wavelengths, paint a full picture of how the optical properties evolve at different layers during typical pollution events. During the clean period (CP) for pollution initialization, the aerosols showed relatively uniform characteristics throughout the planetary boundary layer (PBL) and lower free troposphere (FT), such as lower scattering or a lower absorption coefficient, a larger SAE (due to smaller particle size), and a lower fraction of brown carbon (BrC), as reflected by a smaller AAE. The transition period (TP), when pollution was developing, had large variations in all optical properties, and enhanced aerosol loadings at higher altitudes were encountered when being influenced by regional advection. The fully developed heavy pollution period (HP) in the shallow PBL accumulated over 80 % of the scattering and absorption within the PBL and decreased the SAE due to the enlarged particle size. Notably the absorption towards shorter wavelengths became larger under a more polluted environment, especially at the higher altitude.
The AOD and AAOD measured by the passive remote sensing were, for the first time, compared with in situ measurements over this polluted region. AOD showed a high correlation between AERONET and in situ measurement, within 10 %, and the high discrepancy between both could be possibly resolved by considering the hygroscopic growth of aerosols under high RH conditions. The AAOD, however, was 10 %–25 % higher for the remote sensing, especially at shorter wavelengths, consistent with other studies (Müller et al., 2012; Andrews et al., 2017). The possibilities of causing this could be the non-homogeneously vertical structures of optical properties, the mixing state of light-absorbing aerosol and also the particle hygroscopic growth, which are unable to be elucidated only using the results here.
BC was the main heating species, inducing a 0.05, 0.1 and 0.15 K h−1 heating rate at 12:00 to 15:00 local time in the PBL during pollution initialization, transition and full development, respectively. The heating rate showed a positive vertical gradient during the regional transport period, when pollution was advected to a high altitude from the polluted southern region of Beijing (Tian et al., 2019). The contribution of BrC to the heating rate was found to increase by 20 % throughout the column from the CP to the HP; in particular the increased BrC contribution was pronounced at the layer above the PBL during the HP, which was proposed to result from intensive photochemical reactions above the PBL. The BrC present at this layer will have the potential to contribute to the heating, hence enhancing the temperature inversion on top of the PBL and its the capping effect on the pollutants. Particles at higher altitudes may be transported to wider regions spatially in both the vertical and horizontal directions, which may lead the BrC present at this layer to have wilder and longer radiative impacts. Different mechanisms of BrC formation at different levels such as above the PBL (where more solar flux received) or within the PBL (where more moisture was constrained) warrant future study.
All data in this paper are available from the authors upon request (tianping@bj.cma.gov.cn).
The supplement related to this article is available online at: https://doi.org/10.5194/acp-20-2603-2020-supplement.
DD and MH led and designed the study. PT and DL designed the study, set up the experiment, analysed the data and wrote the paper. PT, DZ and QL conducted the aircraft observation. CY performed the radiative transfer model calculation. PT, DL, ZD, LR and YW contributed to the aircraft data analysis. SD and KH contributed to the surface data analysis. GZ and CZ conducted the aerosol absorption comparison experiment.
The authors declare that they have no conflict of interest.
This research was supported by the National Key Research and Development Program of China (2016YFA0602001), the National Natural Science Foundation of China (41875044, 41875167, 41675038, 41975177) and the Beijing Natural Science Foundation (8192021). Part of this work is supported by the National Center of Meteorology, Abu Dhabi, UAE, under the UAE Research Program for Rain Enhancement Science.
This research has been supported by the National Key Research and Development Program of China (grant no. 2016YFA0602001) and the National Natural Science Foundation of China (grant nos. 41875044, 41675038, and 41875167).
This paper was edited by Harald Saathoff and reviewed by two anonymous referees.
Anderson, T. L. and Ogren, J. A.: Determining Aerosol Radiative Properties Using the TSI 3563 Integrating Nephelometer, Aerosol Sci. Technol., 29, 57–69, https://doi.org/10.1080/02786829808965551, 1998.
Andrews, E., Sheridan, P. J., Fiebig, M., McComiskey, A., Ogren, J. A., Arnott, P., Covert, D., Elleman, R., Gasparini, R., Collins, D., Jonsson, H., Schmid, B., and Wang, J.: Comparison of methods for deriving aerosol asymmetry parameter, J. Geophys. Res., 111, D05S04, https://doi.org/10.1029/2004jd005734, 2006.
Andrews, E., Sheridan, P. J., and Ogren, J. A.: Seasonal differences in the vertical profiles of aerosol optical properties over rural Oklahoma, Atmos. Chem. Phys., 11, 10661–10676, https://doi.org/10.5194/acp-11-10661-2011, 2011.
Andrews, E., Ogren, J. A., Kinne, S., and Samset, B.: Comparison of AOD, AAOD and column single scattering albedo from AERONET retrievals and in situ profiling measurements, Atmos. Chem. Phys., 17, 6041–6072, https://doi.org/10.5194/acp-17-6041-2017, 2017.
Arnott, W. P., Hamasha, K., Moosmüller, H., Sheridan, P. J., and Ogren, J. A.: Towards Aerosol Light-Absorption Measurements with a 7-Wavelength Aethalometer: Evaluation with a Photoacoustic Instrument and 3-Wavelength Nephelometer, Aerosol Sci. Technol., 39, 17–29, https://doi.org/10.1080/027868290901972, 2005.
Ban-Weiss, G. A., Cao, L., Bala, G., and Caldeira, K.: Dependence of climate forcing and response on the altitude of black carbon aerosols, Clim. Dynam., 38, 897–911, https://doi.org/10.1007/s00382-011-1052-y, 2011.
Bergin, M. H., Cass, G. R., Xu, J., Fang, C., Zeng, L. M., Yu, T., Salmon, L. G., Kiang, C. S., Tang, X. Y., Zhang, Y. H., and Chameides, W. L.: Aerosol radiative, physical, and chemical properties in Beijing during June 1999, J. Geophys. Res., 106, 17969–17980, https://doi.org/10.1029/2001jd900073, 2001.
Bond, T. C., Doherty, S. J., Fahey, D. W., Forster, P. M., Berntsen, T., DeAngelo, B. J., Flanner, M. G., Ghan, S., Kärcher, B., Koch, D., Kinne, S., Kondo, Y., Quinn, P. K., Sarofim, M. C., Schultz, M. G., Schulz, M., Venkataraman, C., Zhang, H., Zhang, S., Bellouin, N., Guttikunda, S. K., Hopke, P. K., Jacobson, M. Z., Kaiser, J. W., Klimont, Z., Lohmann, U., Schwarz, J. P., Shindell, D., Storelvmo, T., Warren, S. G., and Zender, C. S.: Bounding the role of black carbon in the climate system: A scientific assessment, J. Geophys. Res.-Atmos., 118, 5380–5552, https://doi.org/10.1002/jgrd.50171, 2013.
Carrico, C. M., Rood, M. J., and Ogren, J. A.: Aerosol light scattering properties at Cape Grim, Tasmania, during the First Aerosol Characterization Experiment (ACE 1), J. Geophys. Res., 103, 16565, https://doi.org/10.1029/98jd00685, 1998.
Cazorla, A., Bahadur, R., Suski, K. J., Cahill, J. F., Chand, D., Schmid, B., Ramanathan, V., and Prather, K. A.: Relating aerosol absorption due to soot, organic carbon, and dust to emission sources determined from in-situ chemical measurements, Atmos. Chem. Phys., 13, 9337–9350, https://doi.org/10.5194/acp-13-9337-2013, 2013.
Chakrabarty, R. K., Garro, M. A., Wilcox, E. M., and Moosmüller, H.: Strong radiative heating due to wintertime black carbon aerosols in the Brahmaputra River Valley, Geophys. Res. Lett., 39, L09804, https://doi.org/10.1029/2012gl051148, 2012.
Che, H., Zhang, X., Chen, H., Damiri, B., Goloub, P., Li, Z., Zhang, X., Wei, Y., Zhou, H., Dong, F., Li, D., and Zhou, T.: Instrument calibration and aerosol optical depth validation of the China Aerosol Remote Sensing Network, J. Geophys. Res., 114, D03206, https://doi.org/10.1029/2008jd011030, 2009.
Chen, Y., Zhao, C., Zhang, Q., Deng, Z., Huang, M., and Ma, X.: Aircraft study of Mountain Chimney Effect of Beijing, China, J. Geophys. Res., 114, D08306, https://doi.org/10.1029/2008jd010610, 2009.
Chung, C. E., Ramanathan, V., and Decremer, D.: Observationally constrained estimates of carbonaceous aerosol radiatice forcing, P. Natl. Acad. Sci. USA, 109, 11624–11629, https://doi.org/10.1073/pnas.1203707109, 2012.
Deng, Z. Z., Zhao, C. S., Zhang, Q., Huang, M. Y., and Ma, X. C.: Statistical analysis of microphysical properties and the parameterization of effective radius of warm clouds in Beijing area, Atmos. Res., 93, 888–896, https://doi.org/10.1016/j.atmosres.2009.04.011, 2009.
Ding, A. J., Huang, X., Nie, W., Sun, J. N., Kerminen, V. M., Petäjä, T., Su, H., Cheng, Y. F., Yang, X. Q., Wang, M. H., Chi, X. G., Wang, J. P., Virkkula, A., Guo, W. D., Yuan, J., Wang, S. Y., Zhang, R. J., Wu, Y. F., Song, Y., Zhu, T., Zilitinkevich, S., Kulmala, M., and Fu, C. B.: Enhanced haze pollution by black carbon in megacities in China, Geophys. Res. Lett., 43, 2873–2879, https://doi.org/10.1002/2016gl067745, 2016.
Drinovec, L., Gregorič, A., Zotter, P., Wolf, R., Bruns, E. A., Prévôt, A. S. H., Petit, J.-E., Favez, O., Sciare, J., Arnold, I. J., Chakrabarty, R. K., Moosmüller, H., Filep, A., and Močnik, G.: The filter-loading effect by ambient aerosols in filter absorption photometers depends on the coating of the sampled particles, Atmos. Meas. Tech., 10, 1043–1059, https://doi.org/10.5194/amt-10-1043-2017, 2017.
Ebert, M., Weinbruch, S., Rausch, A., Gorzawski, G., Helas, G., Hoffmann, P., and Wex, H.: Complex refractive index of aerosols during LACE 98 as derived from the analysis of individual particles, J. Geophys. Res.-Atmos., 107, LAC 3-1–LAC 3-15, https://doi.org/10.1029/2000jd000195, 2002.
Emde, C., Buras-Schnell, R., Kylling, A., Mayer, B., Gasteiger, J., Hamann, U., Kylling, J., Richter, B., Pause, C., Dowling, T., and Bugliaro, L.: The libRadtran software package for radiative transfer calculations (version 2.0.1), Geosci. Model Dev., 9, 1647–1672, https://doi.org/10.5194/gmd-9-1647-2016, 2016.
Ervens, B., Turpin, B. J., and Weber, R. J.: Secondary organic aerosol formation in cloud droplets and aqueous particles (aqSOA): a review of laboratory, field and model studies, Atmos. Chem. Phys., 11, 11069–11102, https://doi.org/10.5194/acp-11-11069-2011, 2011.
Feng, Y., Ramanathan, V., and Kotamarthi, V. R.: Brown carbon: a significant atmospheric absorber of solar radiation?, Atmos. Chem. Phys., 13, 8607–8621, https://doi.org/10.5194/acp-13-8607-2013, 2013.
Ferrero, L., Castelli, M., Ferrini, B. S., Moscatelli, M., Perrone, M. G., Sangiorgi, G., D'Angelo, L., Rovelli, G., Moroni, B., Scardazza, F., Močnik, G., Bolzacchini, E., Petitta, M., and Cappelletti, D.: Impact of black carbon aerosol over Italian basin valleys: high-resolution measurements along vertical profiles, radiative forcing and heating rate, Atmos. Chem. Phys., 14, 9641–9664, https://doi.org/10.5194/acp-14-9641-2014, 2014.
Ferrero, L., Mocnik, G., Cogliati, S., Gregoric, A., Colombo, R., and Bolzacchini, E.: Heating Rate of Light Absorbing Aerosols: Time-Resolved Measurements, the Role of Clouds, and Source Identification, Environ. Sci. Technol., 52, 3546–3555, https://doi.org/10.1021/acs.est.7b04320, 2018.
Gao, R. S., Hall, S. R., Swartz, W. H., Schwarz, J. P., Spackman, J. R., Watts, L. A., Fahey, D. W., Aikin, K. C., Shetter, R. E., and Bui, T. P.: Calculations of solar shortwave heating rates due to black carbon and ozone absorption using in situ measurements, J. Geophys. Res., 113, D14203, https://doi.org/10.1029/2007jd009358, 2008.
Gyawali, M., Arnott, W. P., Lewis, K., and Moosmüller, H.: In situ aerosol optics in Reno, NV, USA during and after the summer 2008 California wildfires and the influence of absorbing and non-absorbing organic coatings on spectral light absorption, Atmos. Chem. Phys., 9, 8007–8015, https://doi.org/10.5194/acp-9-8007-2009, 2009.
Hansen, A. D. A.: The Aethalometer Manual, Magee Scientific, Berkeley, California, USA, 2005.
Haywood, J. M., Schwarzkopf, M. D., and Ramaswamy, V.: Estimates of radiative forcing due to modeled increases in tropospheric ozone, J. Geophys. Res.-Atmos., 103, 16999–17007, https://doi.org/10.1029/98jd01348, 1998.
He, X., Li, C. C., Lau, A. K. H., Deng, Z. Z., Mao, J. T., Wang, M. H., and Liu, X. Y.: An intensive study of aerosol optical properties in Beijing urban area, Atmos. Chem. Phys., 9, 8903–8915, https://doi.org/10.5194/acp-9-8903-2009, 2009.
Hodnebrog, O., Myhre, G., and Samset, B. H.: How shorter black carbon lifetime alters its climate effect, Nat. Commun., 5, 1–7, https://doi.org/10.1038/ncomms6065, 2014.
Jing, J. S., Zhang, R. J., Tao, J., and Zhang, L. M.: Observations of Aerosol Optical Properties in the Beijing Urban Area inSummer, Atmos. Sci. Lett., 4, 338–343, 2011.
Kedia, S., Ramachandran, S., Kumar, A., and Sarin, M. M.: Spatiotemporal gradients in aerosol radiative forcing and heating rate over Bay of Bengal and Arabian Sea derived on the basis of optical, physical, and chemical properties, J. Geophys. Res., 115, D07205, https://doi.org/10.1029/2009jd013136, 2010.
Kirchstetter, T. W., Novakov, T., and Hobbs, P. V.: Evidence that the spectral dependence of light absorption by aerosols is affected by organic carbon, J. Geophys. Res.-Atmos., 109, D21208, https://doi.org/10.1029/2004jd004999, 2004.
Klingmüller, K., Lelieveld, J., Karydis, V. A., and Stenchikov, G. L.: Direct radiative effect of dust–pollution interactions, Atmos. Chem. Phys., 19, 7397–7408, https://doi.org/10.5194/acp-19-7397-2019, 2019.
Koch, D. and Del Genio, A. D.: Black carbon semi-direct effects on cloud cover: review and synthesis, Atmos. Chem. Phys., 10, 7685–7696, https://doi.org/10.5194/acp-10-7685-2010, 2010.
Lack, D. A. and Cappa, C. D.: Impact of brown and clear carbon on light absorption enhancement, single scatter albedo and absorption wavelength dependence of black carbon, Atmos. Chem. Phys., 10, 4207–4220, https://doi.org/10.5194/acp-10-4207-2010, 2010.
Lack, D. A., Bahreini, R., Langridge, J. M., Gilman, J. B., and Middlebrook, A. M.: Brown carbon absorption linked to organic mass tracers in biomass burning particles, Atmos. Chem. Phys., 13, 2415–2422, https://doi.org/10.5194/acp-13-2415-2013, 2013.
Laskin, A., Laskin, J., and Nizkorodov, S. A.: Chemistry of atmospheric brown carbon, Chem. Rev., 115, 4335–4382, https://doi.org/10.1021/cr5006167, 2015.
Lee, H. J., Aiona, P. K., Laskin, A., Laskin, J., and Nizkorodov, S. A.: Effect of solar radiation on the optical properties and molecular composition of laboratory proxies of atmospheric brown carbon, Environ. Sci. Technol., 48, 10217–10226, https://doi.org/10.1021/es502515r, 2014.
Li, Z., Guo, J., Ding, A., Liao, H., Liu, J., Sun, Y., Wang, T., Xue, H., Zhang, H., and Zhu, B.: Aerosol and boundary-layer interactions and impact on air quality, Nat. Sci. Rev., 4, 810–833, https://doi.org/10.1093/nsr/nwx117, 2017.
Liao, H. and Seinfeld, J. H.: Radiative forcing by mineral dust aerosols: Sensitivity to key variables, J. Geophys. Res.-Atmos., 103, 31637–31645, https://doi.org/10.1029/1998jd200036, 1998.
Liu, D., Taylor, J. W., Young, D. E., Flynn, M. J., Coe, H., and Allan, J. D.: The effect of complex black carbon microphysics on the determination of the optical properties of brown carbon, Geophys. Res. Lett., 42, 613–619, https://doi.org/10.1002/2014gl062443, 2015.
Liu, J., Scheuer, E., Dibb, J., Diskin, G. S., Ziemba, L. D., Thornhill, K. L., Anderson, B. E., Wisthaler, A., Mikoviny, T., Devi, J. J., Bergin, M., Perring, A. E., Markovic, M. Z., Schwarz, J. P., Campuzano-Jost, P., Day, D. A., Jimenez, J. L., and Weber, R. J.: Brown carbon aerosol in the North American continental troposphere: sources, abundance, and radiative forcing, Atmos. Chem. Phys., 15, 7841–7858, https://doi.org/10.5194/acp-15-7841-2015, 2015.
Liu, P., Zhao, C., Liu, P., Deng, Z., Huang, M., Ma, X., and Tie, X.: Aircraft study of aerosol vertical distributions over Beijing and their optical properties, Tellus B: Chemical and Physical Meteorology, 61, 756–767, https://doi.org/10.1111/j.1600-0889.2009.00440.x, 2009.
Massabò, D., Caponi, L., Bernardoni, V., Bove, M. C., Brotto, P., Calzolai, G., Cassola, F., Chiari, M., Fedi, M. E., Fermo, P., Giannoni, M., Lucarelli, F., Nava, S., Piazzalunga, A., Valli, G., Vecchi, R., and Prati, P.: Multi-wavelength optical determination of black and brown carbon in atmospheric aerosols, Atmos. Environ., 108, 1–12, https://doi.org/10.1016/j.atmosenv.2015.02.058, 2015.
Müller, D., Lee, K. H., Gasteiger, J., Tesche, M., Weinzierl, B., Kandler, K., Müller, T., Toledano, C., Otto, S., Althausen, D., and Ansmann, A.: Comparison of optical and microphysical properties of pure Saharan mineral dust observed with AERONET Sun photometer, Raman lidar, and in situ instruments during SAMUM 2006, J. Geophys. Res.-Atmos., 117, D07211, https://doi.org/10.1029/2011jd016825, 2012.
Müller, T., Nowak, A., Wiedensohler, A., Sheridan, P., Laborde, M., Covert, D. S., Marinoni, A., Imre, K., Henzing, B., Roger, J.-C., dos Santos, S. M., Wilhelm, R., Wang, Y.-Q., and de Leeuw, G.: Angular Illumination and Truncation of Three Different Integrating Nephelometers: Implications for Empirical, Size-Based Corrections, Aerosol Sci. Technol., 43, 581–586, https://doi.org/10.1080/02786820902798484, 2009.
Nakayama, T., Sato, K., Matsumi, Y., Imamura, T., Yamazaki, A., and Uchiyama, A.: Wavelength and NOx dependent complex refractive index of SOAs generated from the photooxidation of toluene, Atmos. Chem. Phys., 13, 531–545, https://doi.org/10.5194/acp-13-531-2013, 2013.
Nazarenko, L., Rind, D., Tsigaridis, K., Del Genio, A. D., Kelley, M., and Tausnev, N.: Interactive nature of climate change and aerosol forcing, J. Geophys. Res.-Atmos., 122, 3457–3480, https://doi.org/10.1002/2016jd025809, 2017.
Nguyen, T. B., Lee, P. B., Updyke, K. M., Bones, D. L., Laskin, J., Laskin, A., and Nizkorodov, S. A.: Formation of nitrogen- and sulfur-containing light-absorbing compounds accelerated by evaporation of water from secondary organic aerosols, J. Geophys. Res.-Atmos., 117, D01207, https://doi.org/10.1029/2011jd016944, 2012.
Petaja, T., Jarvi, L., Kerminen, V. M., Ding, A. J., Sun, J. N., Nie, W., Kujansuu, J., Virkkula, A., Yang, X. Q., Fu, C. B., Zilitinkevich, S., and Kulmala, M.: Enhanced air pollution via aerosol-boundary layer feedback in China, Sci. Rep.-UK, 6, 18998, https://doi.org/10.1038/srep18998, 2016.
Petra Seibert, F. B., Gryning, S.-E., Joffre, S., Rasmussen, A., and Tercier, P.: Review and intercomparison of operational methods for the determination of the mixing height, Atmos. Environ., 34, 1001–1027, 2000.
Quinn, P. K.: Aerosol optical properties during INDOEX 1999: Means, variability, and controlling factors, J. Geophys. Res., 107, 8020, https://doi.org/10.1029/2000jd000037, 2002.
Ramachandran, S. and Kedia, S.: Black carbon aerosols over an urban region: Radiative forcing and climate impact, J. Geophys. Res., 115, D10202, https://doi.org/10.1029/2009jd013560, 2010.
Ramana, M. V., Ramanathan, V., Kim, D., Roberts, G. C., and Corrigan, C. E.: Albedo, atmospheric solar absorption and heating rate measurements with stacked UAVs, Q. J. Roy. Meteor. Soc., 133, 1913–1931, https://doi.org/10.1002/qj.172, 2007.
Ramana, M. V., Ramanathan, V., Feng, Y., Yoon, S. C., Kim, S. W., Carmichael, G. R., and Schauer, J. J.: Warming influenced by the ratio of black carbon to sulphate and the black-carbon source, Nat. Geosci., 3, 542–545, https://doi.org/10.1038/ngeo918, 2010.
Ramanathan, V., Crutzen, P. J., Kiehl, J. T., and Rosenfeld, D.: Aerosols, climate, and the hydrological cycle, Science, 294, 2119–2124, https://doi.org/10.1126/science.1064034, 2001.
Ran, L., Deng, Z. Z., Wang, P. C., and Xia, X. A.: Black carbon and wavelength-dependent aerosol absorption in the North China Plain based on two-year aethalometer measurements, Atmos. Environ., 142, 132–144, https://doi.org/10.1016/j.atmosenv.2016.07.014, 2016a.
Ran, L., Deng, Z., Xu, X., Yan, P., Lin, W., Wang, Y., Tian, P., Wang, P., Pan, W., and Lu, D.: Vertical profiles of black carbon measured by a micro-aethalometer in summer in the North China Plain, Atmos. Chem. Phys., 16, 10441–10454, https://doi.org/10.5194/acp-16-10441-2016, 2016b.
Rosati, B., Herrmann, E., Bucci, S., Fierli, F., Cairo, F., Gysel, M., Tillmann, R., Größ, J., Gobbi, G. P., Di Liberto, L., Di Donfrancesco, G., Wiedensohler, A., Weingartner, E., Virtanen, A., Mentel, T. F., and Baltensperger, U.: Studying the vertical aerosol extinction coefficient by comparing in situ airborne data and elastic backscatter lidar, Atmos. Chem. Phys., 16, 4539–4554, https://doi.org/10.5194/acp-16-4539-2016, 2016.
Sahu, L. K., Kondo, Y., Moteki, N., Takegawa, N., Zhao, Y., Cubison, M. J., Jimenez, J. L., Vay, S., Diskin, G. S., Wisthaler, A., Mikoviny, T., Huey, L. G., Weinheimer, A. J., and Knapp, D. J.: Emission characteristics of black carbon in anthropogenic and biomass burning plumes over California during ARCTAS-CARB 2008, J. Geophys. Res.-Atmos., 117, D16302, https://doi.org/10.1029/2011jd017401, 2012.
Saleh, R., Marks, M., Heo, J., Adams, P. J., Donahue, N. M., and Robinson, A. L.: Contributon of brown carbon and lensing to the direct radiative effect of carbonaceous aerosols from biomass and biofuel burning emissions, J. Geophys. Res., 120, 10285–10296, https://doi.org/10.1002/2015JD023697, 2015.
Sareen, N., Moussa, S. G., and McNeill, V. F.: Photochemical aging of light-absorbing secondary organic aerosol material, J. Phys. Chem. A, 117, 2987–2996, https://doi.org/10.1021/jp309413j, 2013.
Schnaiter, M., Schmid, O., Petzold, A., Fritzsche, L., Klein, K. F., Andreae, M. O., Helas, G., Thielmann, A., Gimmler, M., Möhler, O., Linke, C., and Schurath, U.: Measurement of Wavelength-Resolved Light Absorption by Aerosols Utilizing a UV-VIS Extinction Cell, Aerosol Sci. Technol., 39, 249–260, https://doi.org/10.1080/027868290925958, 2005.
Shamjad, P. M., Tripathi, S. N., Pathak, R., Hallquist, M., Arola, A., and Bergin, M. H.: Contribution of Brown Carbon to Direct Radiative Forcing over the Indo-Gangetic Plain, Environ. Sci. Technol., 49, 10474–10481, https://doi.org/10.1021/acs.est.5b03368, 2015.
Su, T., Li, J., Li, C., Xiang, P., Lau, A. K.-H., Guo, J., Yang, D., and Miao, Y.: An intercomparison of long-term planetary boundary layer heights retrieved from CALIPSO, ground-based lidar, and radiosonde measurements over Hong Kong, J. Geophys. Res.-Atmos., 122, 3929–3943, https://doi.org/10.1002/2016jd025937, 2017.
Sühring, M., Maronga, B., Herbort, F., and Raasch, S.: On the Effect of Surface Heat-Flux Heterogeneities on the Mixed-Layer-Top Entrainment, Bound.-Lay. Meteorol., 151, 531–556, https://doi.org/10.1007/s10546-014-9913-7, 2014.
Sun, J., Zhi, G., Hitzenberger, R., Chen, Y., Tian, C., Zhang, Y., Feng, Y., Cheng, M., Zhang, Y., Cai, J., Chen, F., Qiu, Y., Jiang, Z., Li, J., Zhang, G., and Mo, Y.: Emission factors and light absorption properties of brown carbon from household coal combustion in China, Atmos. Chem. Phys., 17, 4769–4780, https://doi.org/10.5194/acp-17-4769-2017, 2017.
Tian, P., Liu, D., Huang, M., Liu, Q., Zhao, D., Ran, L., Deng, Z., Wu, Y., Fu, S., Bi, K., Gao, Q., He, H., Xue, H., and Ding, D.: The evolution of an aerosol event observed from aircraft in Beijing: An insight into regional pollution transport, Atmos. Environ., 206, 11–20, https://doi.org/10.1016/j.atmosenv.2019.02.005, 2019.
Torres, B., Dubovik, O., Toledano, C., Berjon, A., Cachorro, V. E., Lapyonok, T., Litvinov, P., and Goloub, P.: Sensitivity of aerosol retrieval to geometrical configuration of ground-based sun/sky radiometer observations, Atmos. Chem. Phys., 14, 847–875, https://doi.org/10.5194/acp-14-847-2014, 2014.
Tripathi, S. N., Srivastava, A. K., Dey, S., Satheesh, S. K., and Krishnamoorthy, K.: The vertical profile of atmospheric heating rate of black carbon aerosols at Kanpur in northern India, Atmos. Environ., 41, 6909–6915, https://doi.org/10.1016/j.atmosenv.2007.06.032, 2007.
Updyke, K. M., Nguyen, T. B., and Nizkorodov, S. A.: Formation of brown carbon via reactions of ammonia with secondary organic aerosols from biogenic and anthropogenic precursors, Atmos. Environ., 63, 22–31, https://doi.org/10.1016/j.atmosenv.2012.09.012, 2012.
Wang, F., Li, Z., Ren, X., Jiang, Q., He, H., Dickerson, R. R., Dong, X., and Lv, F.: Vertical distributions of aerosol optical properties during the spring 2016 ARIAs airborne campaign in the North China Plain, Atmos. Chem. Phys., 18, 8995–9010, https://doi.org/10.5194/acp-18-8995-2018, 2018.
Wang, J., Nie, W., Cheng, Y., Shen, Y., Chi, X., Wang, J., Huang, X., Xie, Y., Sun, P., Xu, Z., Qi, X., Su, H., and Ding, A.: Light absorption of brown carbon in eastern China based on 3-year multi-wavelength aerosol optical property observations and an improved absorption Ångström exponent segregation method, Atmos. Chem. Phys., 18, 9061–9074, https://doi.org/10.5194/acp-18-9061-2018, 2018.
Wang, Z., Huang, X., and Ding, A.: Dome effect of black carbon and its key influencing factors: a one-dimensional modelling study, Atmos. Chem. Phys., 18, 2821–2834, https://doi.org/10.5194/acp-18-2821-2018, 2018c.
Wilcox, E. M., Thomas, R. M., Praveen, P. S., Pistone, K., Bender, F. A., and Ramanathan, V.: Black carbon solar absorption suppresses turbulence in the atmospheric boundary layer, P. Natl. Acad. Sci. USA., 113, 11794–11799, https://doi.org/10.1073/pnas.1525746113, 2016.
Wong, J. P. S., Tsagkaraki, M., Tsiodra, I., Mihalopoulos, N., Violaki, K., Kanakidou, M., Sciare, J., Nenes, A., and Weber, R. J.: Atmospheric evolution of molecular-weight-separated brown carbon from biomass burning, Atmos. Chem. Phys., 19, 7319–7334, https://doi.org/10.5194/acp-19-7319-2019, 2019.
Wu, Y., Wang, X., Tao, J., Huang, R., Tian, P., Cao, J., Zhang, L., Ho, K.-F., Han, Z., and Zhang, R.: Size distribution and source of black carbon aerosol in urban Beijing during winter haze episodes, Atmos. Chem. Phys., 17, 7965–7975, https://doi.org/10.5194/acp-17-7965-2017, 2017.
Xia, X., Eck, T. F., Holben, B. N., Phillippe, G., and Chen, H.: Analysis of the weekly cycle of aerosol optical depth using AERONET and MODIS data, J. Geophys. Res., 113, D14217, https://doi.org/10.1029/2007jd009604, 2008.
Xie, C., Xu, W., Wang, J., Wang, Q., Liu, D., Tang, G., Chen, P., Du, W., Zhao, J., Zhang, Y., Zhou, W., Han, T., Bian, Q., Li, J., Fu, P., Wang, Z., Ge, X., Allan, J., Coe, H., and Sun, Y.: Vertical characterization of aerosol optical properties and brown carbon in winter in urban Beijing, China, Atmos. Chem. Phys., 19, 165–179, https://doi.org/10.5194/acp-19-165-2019, 2019.
Yu, H., Liu, S. C., and Dickinson, R. E.: Radiative effects of aerosols on the evolution of the atmospheric boundary layer, J. Geophys. Res., 107, 4142, https://doi.org/10.1029/2001jd000754, 2002.
Yu, P. F., Toon, O. B., Bardeen, C. G., Zhu, Y. Q., Rosenlof, K. H., Portmann, R. W., Thornberry, T. D., Gao, R. S., SDavis, S. M., Wolf, E. T., Gouw, J. D., Peterson, D. A., Fromm, M. D., and Robock, A.: Black carbon lofts wildfire smoke high into the stratosphere to form a persistent plume, Science, 365, 587–590, 2019.
Zhang, R., Jing, J., Tao, J., Hsu, S.-C., Wang, G., Cao, J., Lee, C. S. L., Zhu, L., Chen, Z., Zhao, Y., and Shen, Z.: Chemical characterization and source apportionment of PM2.5 in Beijing: seasonal perspective, Atmos. Chem. Phys., 13, 7053–7074, https://doi.org/10.5194/acp-13-7053-2013, 2013.
Zhang, X. Y., Wang, J. Z., Wang, Y. Q., Liu, H. L., Sun, J. Y., and Zhang, Y. M.: Changes in chemical components of aerosol particles in different haze regions in China from 2006 to 2013 and contribution of meteorological factors, Atmos. Chem. Phys., 15, 12935–12952, https://doi.org/10.5194/acp-15-12935-2015, 2015.
Zhang, Y., Forrister, H., Liu, J., Dibb, J., Anderson, B., Schwarz, J. P., Perring, A. E., Jimenez, J. L., Campuzano-Jost, P., Wang, Y., Nenes, A., and Weber, R. J.: Top-of-atmosphere radiative forcing affected by brown carbon in the upper troposphere, Nat. Geosci., 10, 486–489, https://doi.org/10.1038/ngeo2960, 2017.
Zhao, D. L., Huang, M. Y., Tian, P., He, H., Lowe, D., Zhou, W., Sheng, J. J., Wang, F., Bi, K., Kong, S. F., Yang, Y., Liu, Q., Liu, D. T., and Ding, D. P.: Vertical characteristics of black carbon physical properties over Beijing region in warm and cold seasons, Atmos. Environ., 213, 296–310, 2019.
Zhao, G., Zhao, C., Kuang, Y., Bian, Y., Tao, J., Shen, C., and Yu, Y.: Calculating the aerosol asymmetry factor based on measurements from the humidified nephelometer system, Atmos. Chem. Phys., 18, 9049–9060, https://doi.org/10.5194/acp-18-9049-2018, 2018.
Zhao, P. S., Ding, J., Du, X., and Su, J.: High time-resolution measurement of light scattering hygroscopic growth factor in Beijing A novel method for high relative humidity conditions, Atmos. Environ., 215, 116912, https://doi.org/10.1016/j.atmosenv.2019.116912, 2019.
Zhao, R., Lee, A. K. Y., Huang, L., Li, X., Yang, F., and Abbatt, J. P. D.: Photochemical processing of aqueous atmospheric brown carbon, Atmos. Chem. Phys., 15, 6087–6100, https://doi.org/10.5194/acp-15-6087-2015, 2015.
Zhong, J., Zhang, X., Dong, Y., Wang, Y., Liu, C., Wang, J., Zhang, Y., and Che, H.: Feedback effects of boundary-layer meteorological factors on cumulative explosive growth of PM2.5 during winter heavy pollution episodes in Beijing from 2013 to 2016, Atmos. Chem. Phys., 18, 247–258, https://doi.org/10.5194/acp-18-247-2018, 2018.