the Creative Commons Attribution 4.0 License.
the Creative Commons Attribution 4.0 License.
 | 06 Jan 2020
Contribution of local and remote anthropogenic aerosols to a record-breaking torrential rainfall event in Guangdong Province, China
Yi Ming
Chun Zhao
Ngar Cheung Lau
Jianping Guo
Massimo Bollasina
A torrential rainfall case, which happened in Guangdong Province during 14–16 December 2013, broke the historical rainfall record in the province in terms of duration, affected area, and accumulative precipitation. The influence of anthropogenic aerosols on this extreme rainfall event is examined using a coupled meteorology–chemistry–aerosol model. Up to 33.7 mm precipitation enhancement in the estuary and near the coast is mainly attributed to aerosol–cloud interactions (ACI), whereas aerosol–radiation interaction partially offsets 14 % of the precipitation increase. Our further analysis of changes in hydrometeors and latent heat sources suggests that the ACI effects on the intensification of precipitation can be divided into two stages: cold rain enhancement in the former stage followed by warm rain enhancement in the latter. Responses of precipitation to the changes in anthropogenic aerosol concentration from local (i.e., Guangdong Province) and remote (i.e., outside Guangdong Province) sources are also investigated through simulations with reduced aerosol emissions from either local or remote sources. Accumulated aerosol concentration from local sources aggregates mainly near the ground surface and dilutes quickly after the precipitation initiated. By contrast, the aerosols from remote emissions extend up to 8 km above ground and last much longer before decreasing until peak rainfall begins, because aerosols are continuously transported by the strong northerly winds. The patterns of precipitation response to remote and local aerosol concentrations resemble each other. However, compared with local aerosols through warm rain enhancement, remote aerosols contribute more than twice the precipitation increase by intensifying both cold and warm rain, occupying a predominant role. A 10-time emission sensitivity test shows about 10 times the PM2.5 concentration compared with the control run. Cold (warm) rain is drastically enhanced (suppressed) in the 10× run. In response to 10× aerosol emissions, the pattern of precipitation and cloud property changes resembles the differences between CTL and CLEAN, but with a much greater magnitude. The precipitation average over Guangdong decreases by 1.0 mm in the 10× run but increases by 1.4 mm in the control run compared with the CLEAN run. We note that the precipitation increase is concentrated within a more narrowed downstream region of the aerosol source, whereas the precipitation decrease is more dispersed across the upstream region. This indicates that the excessive aerosols not only suppress rainfall, but also change the spatial distribution of precipitation, increasing the rainfall range, thereby potentially exacerbating flood and drought elsewhere. This study highlights the importance of considering aerosols in meteorology to improve extreme weather forecasting. Furthermore, aerosols from remote emissions may outweigh those from local emissions in the convective invigoration effect.
- Article
(24306 KB) - Full-text XML
-
Supplement
(4797 KB) - BibTeX
- EndNote


Synoptic weather is a key factor driving air pollution events through photochemical, turbulence, wet deposition, and transport processes (Ding et al., 2009; Guo et al., 2017; Liu et al., 2001; L. Liu et al., 2019; Madronich, 1987). Numerous studies have predicted air quality either numerically or statistically based on weather conditions (Dutot et al., 2007; Otte et al., 2005). In recent years, efforts have been increasingly made to identify the influence of air pollution (e.g., aerosols) on synoptic weather (Ding et al., 2013; Grell et al., 2011), particularly on different types of extreme weather, such as tropical cyclone (Wang et al., 2014; Zhao et al., 2018), hail storm (Ilotoviz et al., 2016), and extreme rainfall (Fan et al., 2015; Zhong et al., 2015).
For decades, China has been affected by severe pollution induced by rapid urbanization and economic development (He et al., 2002). The Pearl River delta (PRD) region, situated on the southern coast of China, is one of the most developed and also most polluted regions. The aerosol optical depth retrieved from the Moderate Resolution Imaging Spectroradiometer is typically higher than 0.6 in Guangzhou, a megacity in the PRD region (Wu et al., 2005).
In addition to reducing visibility and inducing respiratory diseases (Cohen et al., 2015; Gu and Yim, 2016; Chen et al., 2017), high aerosol concentration can also affect weather and climate through interactions with radiation and clouds (Bollasina et al., 2011; Lau and Kim, 2006; Z. Liu et al., 2019; Wang et al., 2011). Aerosols absorb and scatter solar radiation and serve as cloud condensation nuclei and ice nuclei, which are referred to as aerosol–radiation interactions (ARI) and aerosol–cloud interactions (ACI), respectively (IPCC, 2013). Both ARI and ACI influence deep convection and hence precipitation (Fan et al., 2008, 2013, 2018; Koren et al., 2004; Liu et al., 2018; Rosenfeld et al., 2008). Liu et al. (2018) found that ARI suppressed deep convection by reducing the relative humidity in the middle–upper troposphere and weakening the upward motion. Fan et al. (2015) revealed that ARI suppressed convection in the basin during the daytime but enhanced rainfall at night on mountains. Compared with the effects of ARI, those of ACI on deep convection and precipitation have received more attention and are more controversial in both observational and modeling studies. Increased aerosols can suppress or enhance precipitation depending on environmental conditions such as humidity, cloud type, cloud phase, and vertical wind shear (Khain, 2009; Lee et al., 2008; Tao et al., 2012; H. Liu et al., 2019). Khain (2009) and Fan et al. (2007) have reported that increases in humidity generate more condensation with aerosols, resulting in more precipitation from deep convective clouds. Studies have reported that aerosols inhibit precipitation from shallow clouds (Andreae et al., 2004; Chen et al., 2016; Rosenfeld, 2000), whereas they invigorate deep convection with warm (>15 ∘C) cloud bases (Bell et al., 2008; Koren et al., 2010, 2014). By contrast, smaller cloud droplets induced by aerosols could remain liquid below 0 ∘C when lacking ice nuclei, inhibiting precipitation (Cui et al., 2006; Rosenfeld and Woodley, 2000). Fan et al. (2009, 2012) have suggested that increased aerosols enhanced convection under weak wind shear but suppressed convection under strong wind shear by increasing evaporative cooling for an isolated storm. Recently, Fan et al. (2018) found that the latent heat release could be mainly attributed to condensational heating rather than ice-related processes at upper levels, differing from cold convective invigoration (Rosenfeld et al., 2008).
The competition between the effects of ARI and ACI has been discussed on both cloud-resolving scale (Lin et al., 2006; Wang et al., 2018) and regional scale (Wang et al., 2016). Fan et al. (2008) suggested that the suppressive effects of ARI can outweigh the invigorative effects of ACI on deep convection and precipitation as the absorption of aerosols enhances. Koren et al. (2008) showed the net effect of two opposite influences on clouds over the Amazon, which depends on the initial cloud fraction. Large cloud cover fractions were mostly invigorated by ACI, whereas small cloud cover fractions were suppressed by ARI. Different aerosol types can also be a critical factor in the radiative or microphysical properties of clouds, thus determining the invigoration or suppression effect of aerosols on deep convection (J. H. Jiang et al., 2018). Most of the studies have focused on the summer season, in which most extreme rainfall events occur over China (Fu et al., 2013).
We select a torrential rainfall case in winter, which breaks the record of Guangdong Province since 1951 in terms of duration, affected area, and cumulative rainfall (Deng et al., 2015), to further understand the combined effects and relative importance of ARI and ACI for precipitation. Before this heavy rainfall, the PRD region is affected by a strong haze, with PM2.5 concentration reaching 174 µg m−3. The significant transboundary nature of air pollution in China has been well recognized (e.g., Gu and Yim, 2016; Yim et al., 2019a, b). Effects of local and remote aerosol emissions on monsoon and associated precipitation have been examined in recent years (Bollasina et al., 2014; Cowan and Cai, 2011; L. Guo et al., 2016; Jin et al., 2016), which were comprehensively reviewed by Li et al. (2016). The effects of local and remote aerosol emissions on extreme rainfall events remain mostly unexplored. Given the strong monsoonal flow and severe air pollution over the northeast of China (Fig. 1b), the aerosol concentration could be either from local emissions or transport by the prevailing northeasterly wind. A critical question is therefore whether the aerosols that affect this extreme rainfall case originate from local or remote aerosol emission sources. The remainder of this study proceeds as follows: Sect. 2 describes the regional model configuration associated with the experimental design as well as the observation datasets of this study. The main findings on the effects of aerosols on the extreme rainfall event are discussed in Sect. 3. The main conclusions are summarized and discussed in Sect. 4.
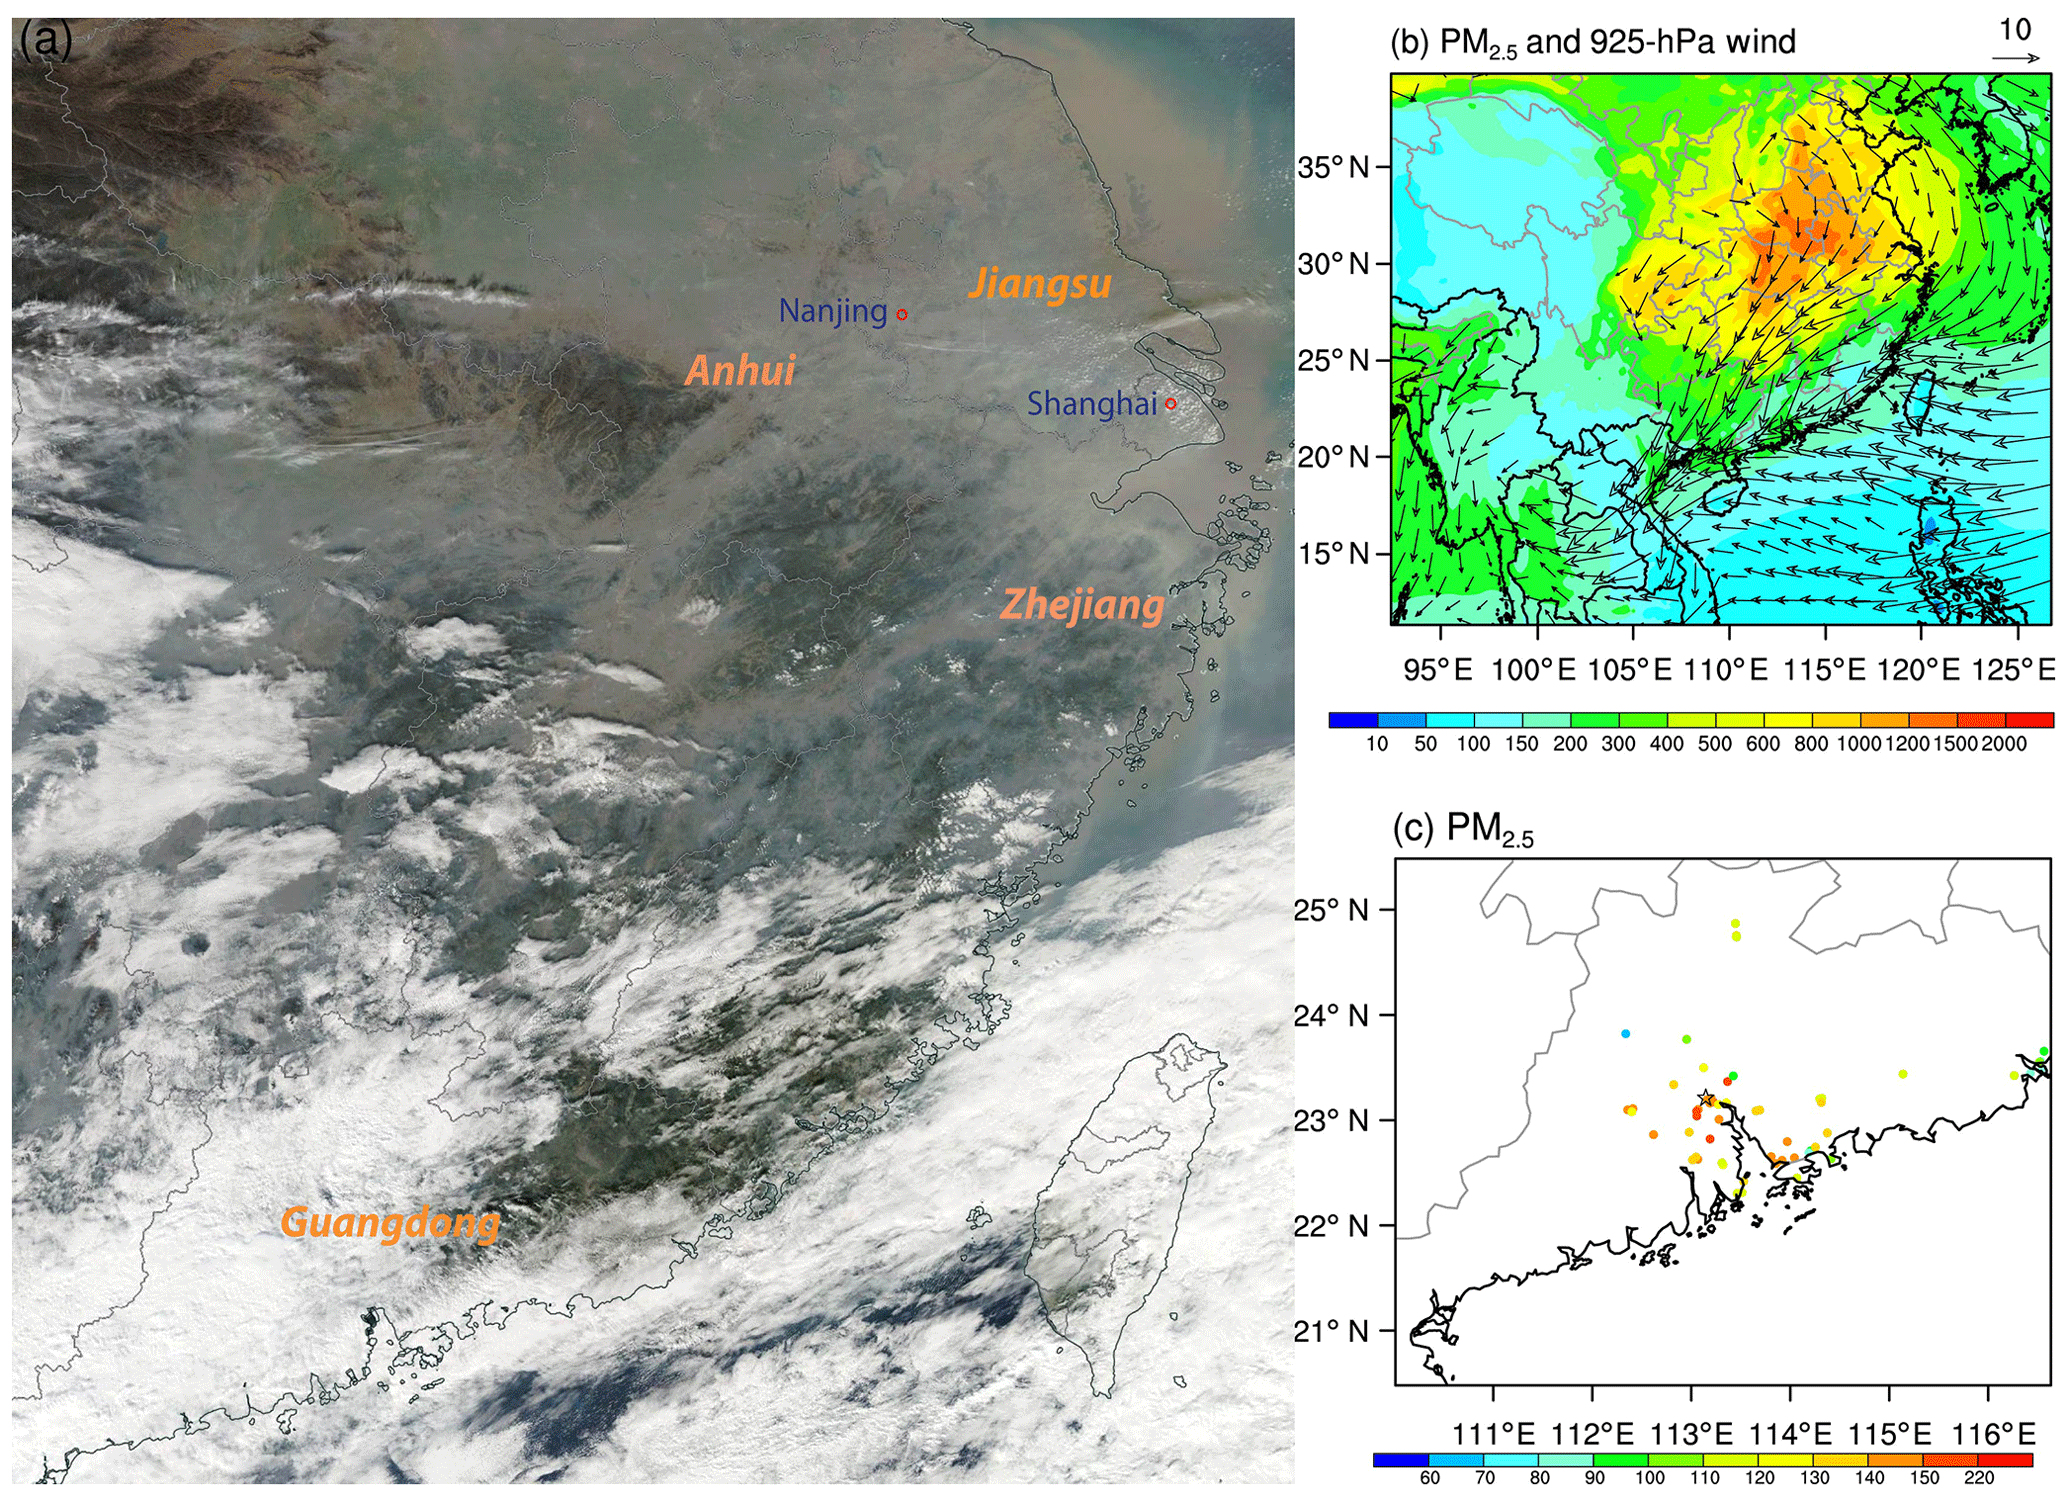
Figure 1(a) Terra satellite true-color image of East China on 13 December 2013 (UTC), provided by NASA's Worldview (source: https://worldview.earthdata.nasa.gov/, last access: 19 March 2019). Red circles denote city locations, blue fonts denote cities, and orange fonts in bold italic denote provinces. (b) Spatial distribution of 3 d averaged column-integrated PM2.5 concentration (shading; µg m−2) and 925 hPa wind (vector; m s−1) during 14–16 December 2013, in the control run. The red box denotes the analysis region. (c) Hourly averaged PM2.5 (µg m−3) concentration on 13 December 2013, observed in Guangdong Province. Colored circles denote in situ station locations and the black star denotes Guangzhou.
Table 1Model simulations. Abbreviations: CTL, control run; ARIoff, turn off aerosol–radiation interactions; D1, keep emissions in domain 1 as the control run while making those except for chemical boundary conditions in domain 2 the CLEAN run; D2, keep emissions and chemical initial conditions in domain 2 the control run and make those and chemical boundary conditions in domain 1 the CLEAN run; 10×, 10-fold anthropogenic emissions and chemical initial and boundary conditions.
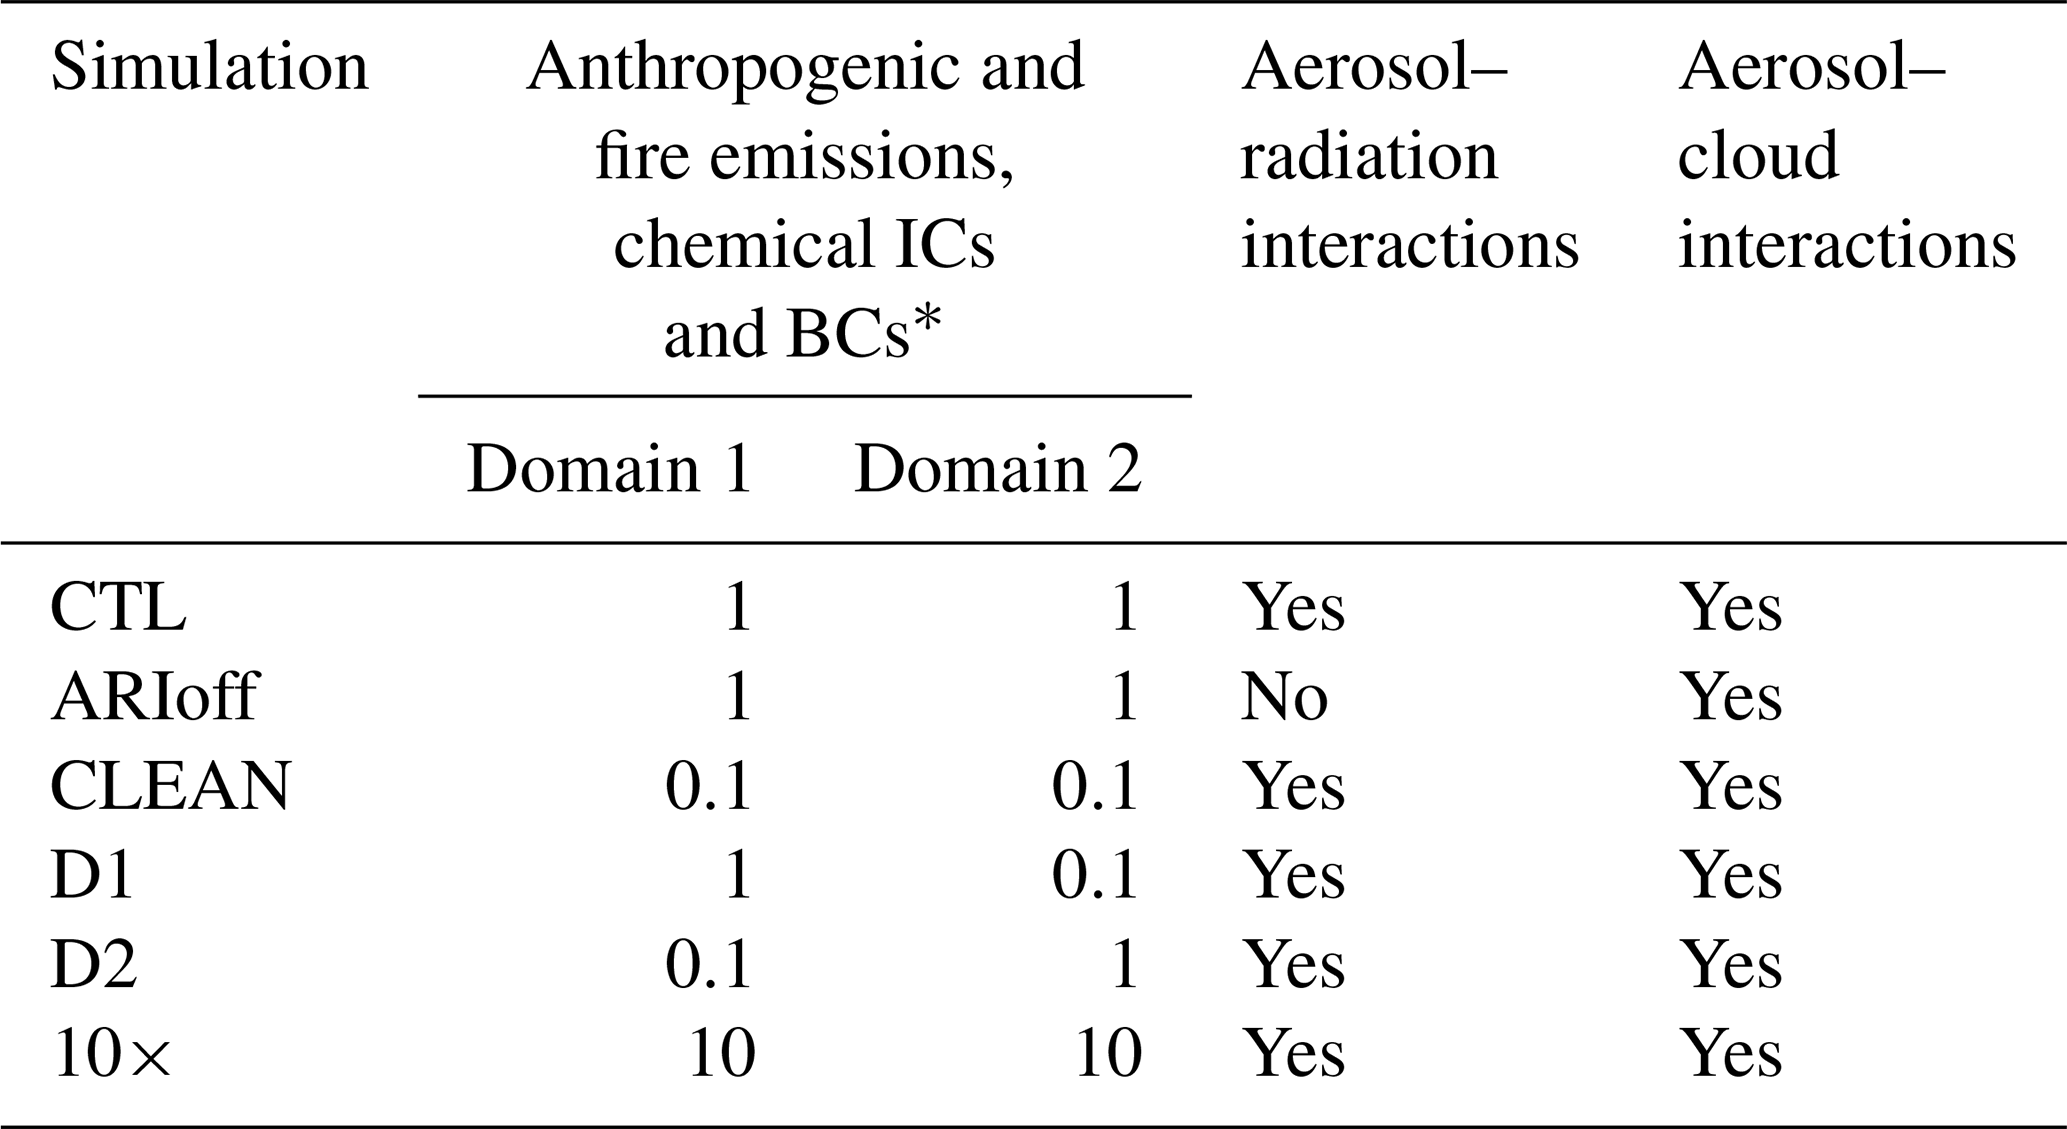
* indicates that emissions, initial conditions (ICs), or boundary conditions (BCs) are scaled from the control run. Note that the offline chemical BCs here are extracted from global chemical transport models and are only used for domain 1.
The principal tool for this work is the Weather Research and Forecasting (WRF) model coupled with Chemistry (WRF-Chem) v3.5.1 (Grell et al., 2005), with some recent improvement by the University of Science and Technology of China (Zhao et al., 2013, 2014, 2016; Hu et al., 2016). The details of the WRF-Chem configuration are provided in the Supplement. The model experiment design is described in Sect. 2.1. The observational datasets used for validating the simulated precipitation performance, along with hourly in situ PM2.5 observations, are described in Sect. 2.2.
2.1 Experiment design
WRF-Chem simulations are conducted to investigate the effect of aerosols on the extreme rainfall event of 14–16 December 2013. Unless specified, all time points in this study refer to local standard time (LST), which is equal to UTC+8. Two nested grids which run simultaneously with one-way nesting cover most of China (87.47–131.67∘ E, 11.42–41.22∘ N) and Guangdong Province (109.59–117.32∘ E, 20.07–25.62∘ N) with horizontal resolutions of 20 and 4 km, respectively (Fig. S1a in the Supplement). The cumulus scheme is turned off in the inner domain. Both nested grids use 41 vertical levels extending from the surface to 100 hPa. The meteorological initial and boundary conditions (ICs and BCs) are derived from 6-hourly National Center for Environmental Prediction global final analysis data with a horizontal resolution of . The 6-hourly chemical ICs and BCs are generated from the Model for Ozone and Related Chemical Tracer version 4 (MOZART-4), which is an offline global chemical transport model suited for tropospheric studies at a horizontal resolution of with 56 vertical levels (Emmons et al., 2010). Anthropogenic emissions are obtained from the Emissions Database for Global Atmospheric Research Hemispheric Transport of Air Pollution v2 inventory (Janssens-Maenhout et al., 2015) for the year 2010 with a horizontal resolution of (http://edgar.jrc.ec.europa.eu/htap_v2/, last access: 20 February 2017). Biomass burning emission data are extracted from FINN 1.5 (Wiedinmyer et al., 2011). Dust and sea salt emission schemes are updated following Zhao et al. (2010, 2013), respectively. The results show marginal differences between simulations with and without dust and sea salt emissions (figure not shown) in our study case; possible reasons for this are discussed in Sect. 4.
Six sets of experiments are performed in total (Table 1). To isolate robust signals from the model's natural variations, five ensemble members with perturbed ICs at 3 h intervals are conducted for each experiment. The simulations start from 08:00 to 20:00 Z on 13 December with 3 h intervals, and all end at 02:00 Z on 17 December. The simulation before 14 December is for model spinup, and the following analysis focuses on the results of 14–16 December. In the first experiment (CTL), current emissions are used in the simulation with both ARI and ACI effects included (Table 1). Following Fan et al. (2015), we scale the anthropogenic and fire emissions by a factor of 0.1 and perform the CLEAN simulation. We adjust the factor to 0.1 from 0.3 in Fan et al. (2015) to represent the background aerosol concentration as the emissions in 2010 are much higher than those in 2006 (Chang et al., 2018). It is used to mimic the situation in which the background of the aerosol concentration serves as cloud condensation nuclei before the economic development in China. The differences between CTL and CLEAN denote the total effects of aerosols, including both ARI and ACI effects. To examine the role and relative importance of ARI and ACI, the ARIoff run is conducted based on the CTL run by excluding the ARI effect. Thus, the differences between CTL and ARIoff represent ARI effects (Zhong et al., 2015). The ACI effects are approximated by looking at differences between CTL–CLEAN and CTL–ARIoff. To distinguish and isolate the effects induced by local (i.e., domain 2, Guangdong Province) emissions and remote (i.e., domain 1, outside Guangdong Province) emissions, two other experiments are designed. In the D1 (Table 1) experiment, the ICs, BCs, and emissions are kept the same as with the control run for domain 1. Meanwhile, the ICs and emissions are scaled by a factor of 0.1 for domain 2. Similarly, in the D2 experiment, the ICs, BCs, and emissions are scaled by a factor of 0.1 for domain 1. The ICs and emissions are kept the same as with the control run for domain 2. Note that the offline chemical BCs extracted from MOZART are only applicable to domain 1. Along with the CTL run, these experiments allow us to interpret and ascertain aerosol-related changes that would have occurred with either local or remote aerosol emissions by observing differences between CTL–CLEAN and either D2–CLEAN or D1–CLEAN. To test the sensitivity of precipitation to aerosol concentration, one more experiment for an extreme polluted case is conducted. In parallel to that in the CLEAN run, we scale the emissions and chemical ICs and BCs in the control run by a factor of 10 (10×).
2.2 Observational datasets
The model-simulated precipitation performance is evaluated with satellite-based precipitation products and in situ rainfall observations. Climate Prediction Center morphing technique (CMORPH) data are produced by the National Oceanic and Atmospheric Administration covering the period from December 2002 to the present. In this technique, infrared geostationary satellites observe the motion vectors of precipitation patterns to generate half-hourly precipitation estimates by using passive microwave (PMW) sensors. Time-weighted linear interpolation is exploited to morph the shape and intensity of precipitation features when and where PMW data are unavailable. This provides data for global (60∘ S–60∘ N) precipitation analysis with a horizontal resolution of 0.07277∘ (approximately 8 km at the Equator) and a temporal resolution of 30 min. More details of CMORPH products are documented by Joyce et al. (2004).
The in situ hourly precipitation dataset is developed at the National Meteorological Information Center of the China Meteorological Administration (source: http://data.cma.cn, last access: 30 May 2016). A total of 115 stations are within domain 2. Their locations are represented as colored circles in Fig. 2a.
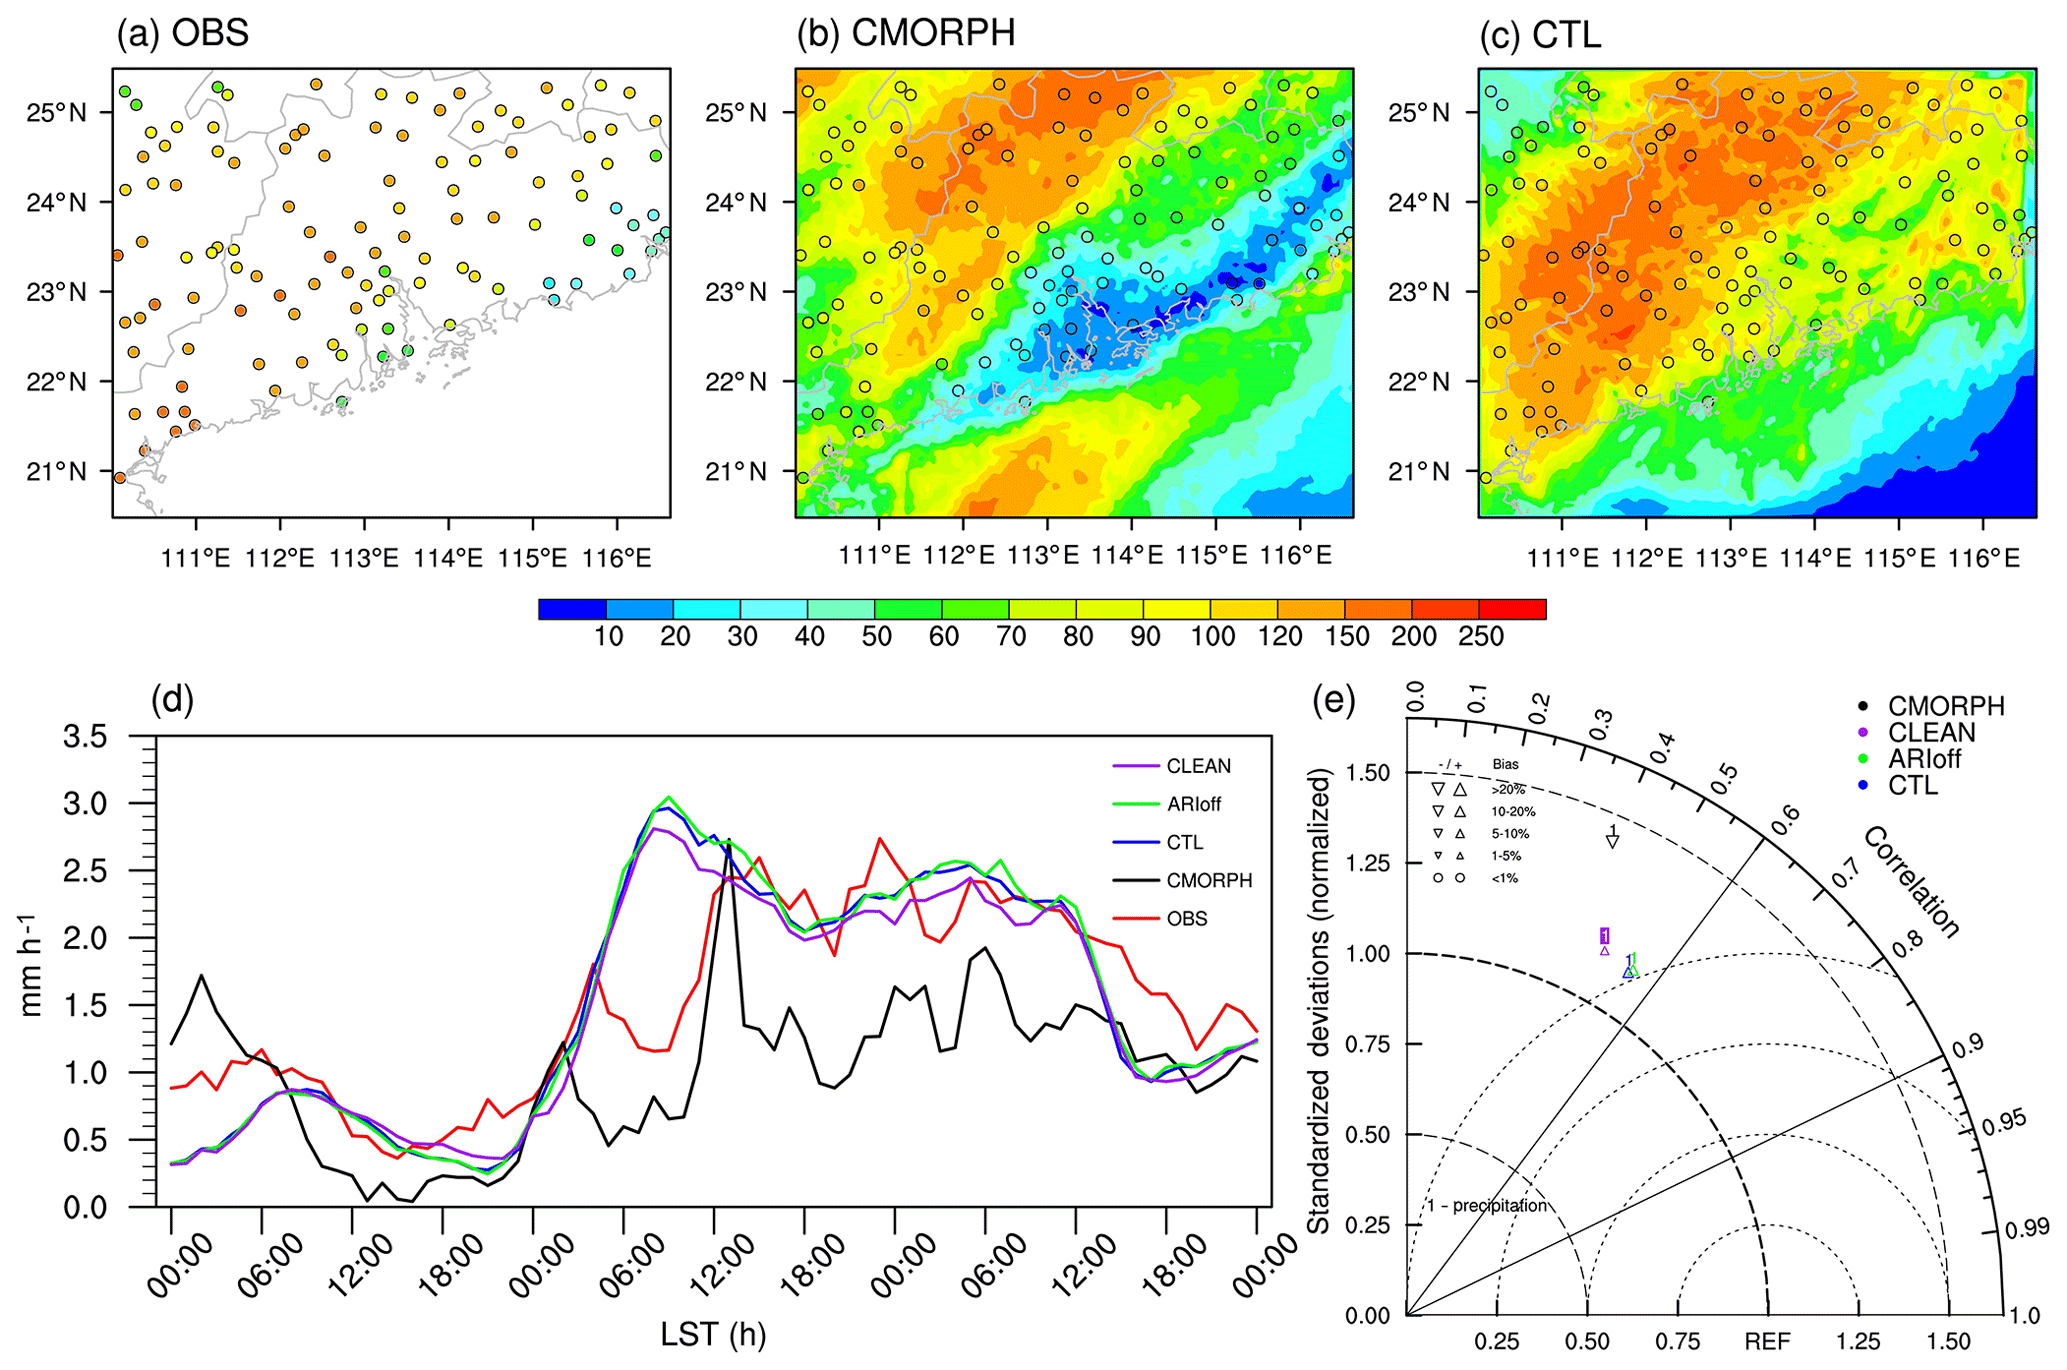
Figure 2Spatial distribution of accumulated precipitation (mm) from 00:00 Z on 14 December 2013 to 00:00 Z on 17 December 2013 (local standard time, LST) from (a) station observations (OBS), (b) the CMORPH satellite, and (c) the control simulation (CTL). Circles denote locations of in situ observations. (d) Time series of the station average of rain rate (mm h−1) over the entire domain 2 for OBS (red), CMORPH (black), CTL (blue), ARIoff (green), and CLEAN (purple). (e) Taylor diagrams for 3 d accumulated precipitation in CTL (blue), ARIoff (green), CLEAN (purple), and CMORPH (black) compared with OBS. Triangles and circles in the top-left corner in (e) denote bias. Sizes of triangles indicate the magnitude of the bias. Inverted (upright) triangles represent a negative (positive) bias. The ARIoff run refers to simulation with aerosol–radiation interactions off.
ERA-Interim version 2 is used to evaluate the model performance in simulating large-scale circulation. These data form a global atmospheric reanalysis making data publicly accessible since 1979, provided by the European Centre for Medium-Range Weather Forecasts (ECMWF) (Dee et al., 2011). The data are available at a horizontal resolution of approximately 0.25∘, which is comparable to the resolution of domain 1.
The in situ hourly PM2.5 concentration dataset is obtained from the website of the Ministry of Environmental Protection (source: http://106.37.208.233:20035, last access: 15 November 2015) (Zhang and Cao, 2015). In total, 58 stations are within domain 2. Their locations are denoted as colored circles in Fig. 1c.
During 14–16 December 2013, there is a rare continuous rainstorm over most of Guangdong Province. The 3 d accumulated rainfall at most stations exceeds 100 mm (Fig. 2a), which may benefit winter and spring water usage, promote air cleaning, and reduce forest fire risk. The mid-tropospheric flow pattern, with a ridge to the northeast of the Tibet Plateau and a trough over the west of the Indo-China Peninsula, facilitates cold and dry air in moving southward and moist and warm air in moving northward (Fig. S2). At the surface, prevailing northeasterlies blow over East China (Fig. 1b), indicating a strong monsoonal flow (Chang et al., 2006). The passage of a cold front results in a sharp temperature gradient with a northwest–southeast tilt (Fig. S3). Deep stratiform and convective clouds form at the cold and warm sides, respectively, as shown in the natural-color satellite image captured by NASA's Terra (Fig. 1a). The simulated cloud top temperature over Guangdong Province is lower than −15 ∘C, with the minimum reaching about −35 ∘C (Fig. S1b). Before the study case occurs, Guangdong Province is affected by severe pollution on 13 December. The hourly averaged PM2.5 concentration exceeds 100 µg m−3 over the delta region (Fig. 1c). The north of Guangdong, including Zhejiang, Jiangsu, and Anhui provinces, is blanketed in grey haze (Fig. 1a). The column-integrated PM2.5 concentration reaches up to 2000 µg m−2 during 14–16 December 2013 in the CTL run (Fig. 1b). The pattern configurations of circulation and pollutant are favorable for aerosol transport to the south of China. In the analysis, we firstly examine the total effects and relative importance of ARI and ACI for this extreme rainfall event in Sect. 3.2. The contribution of local and remote aerosol emissions to their total impact is disentangled in Sect. 3.3. In Sect. 3.4, the sensitivity of precipitation to aerosol emissions is explored.
3.1 Model evaluation compared with observational datasets
The model well replicates the trough over the west of the Indo-China Peninsula and the sub-tropical high over the South China Sea and the northwestern Pacific (Fig. S2). The pattern correlation of 500 hPa geopotential height reaches 0.99 at the 99 % significance level. Modeled PM2.5 concentration is evaluated by comparing with the 58 in situ station data in Guangdong Province. The spatial distribution of PM2.5 concentration is generally reproduced with highs over megacities and lows over the surrounding areas (Fig. S4). The failure to capture the hotspot near the estuary may be related to the coarse grid resolution or uncertainty of emissions. In the time series, both the simulation and observation show a dramatically decreasing trend of PM2.5 concentration after the rainfall initiated (Fig. S5). The model generally replicates the spatial distribution and time evolution of PM2.5 concentration with some underestimation during the first 2 days. This bias may underestimate the aerosol impact on rainfall.
The precipitation from model output and satellite retrievals is interpolated to the locations of in situ observation through bilinear interpolation (Fig. 2a–c). The CMORPH satellite data, which are often used to evaluate model rainfall performance, underestimate the amount, particularly near the coast. Previous studies have reported that this product substantially underestimates heavy rainfall (Q. Jiang et al., 2018; Qin et al., 2014) and cold season rainfall (Xie et al., 2017). By contrast, the control simulation yields a higher pattern correlation of 0.50–0.55 and a lower bias of 5 %–20 % (Fig. 2f). The time series of the average rain rate over Guangdong Province reveals a remarkable lasting rain rate of 2.5 mm h−1 on the second and third days when satellite data distinctly underestimate (Fig. 2d). The model reproduces a comparable magnitude to the observations with an earlier peak near 08:00 Z on 15 December. The initial time and physics schemes including microphysics, land surface, and PBL are tuned, but only the rainfall amplitude changes rather than the peak time. Thus, the bias may be induced by the meteorology boundary conditions from the global model. Precipitation in TRMM data is also underestimated along the coast, as well as that in CMORPH data (Fig. S6d). Overall, the model replicates the spatial distribution, time evolution, and intensity of this extreme rainfall event. Note that all the analyses in the following sections are based on simulation results from domain 2.
3.2 Effects of ARI versus those of ACI
In this section, the total effects of ARI and ACI as well as their relative importance in this extreme rainfall event are investigated. Figure 3 shows the spatial distribution of the daily accumulated rainfall changes for 14 and 15 December between different scenarios. Because the results on 16 December illustrate a similar mechanism to those on 15 December, our analysis focuses on 15 December. The rainfall differences on 16 December are put in Fig. S7. Distinct effects of aerosols appear on the second day when the rainfall peaks (Fig. 3d), although aerosol concentration peaks occur on the first day (Fig. 4a). This suggests that the aerosol impact is modulated by other factors (e.g., meteorological conditions). On 15 December, the domain-averaged precipitation increases by 1.4 mm. Interestingly, a dipole pattern is manifested by a reduction up to 19.4 mm over northern Guangdong Province and an increase up to 33.7 mm over southern Guangdong Province (particularly near the Pearl River estuary). This means different responses of precipitation in the warm and cold sectors (Fig. S3), indicating that the impact of aerosols on deep convective and stratiform clouds differs in this extreme rainfall case. To address this issue, two regions, R1 (22–24∘ N and 112–115∘ E) and R2 (24–25∘ N and 110–112∘ E), are selected for the following analysis and are denoted by red and green boxes, respectively (Fig. 3). The average precipitation increases by 16.7 % (+7.8 mm) over R1, while it decreases by 10.2 % (−4.4 mm) in R2. The contribution from ARI and ACI over R1 (R2) is −1.3 mm (−0.7 mm) and +9.3 mm (−3.7 mm), respectively. Positive (negative) indicates an increase (a decrease). It is evident that the net aerosol effects are dominated by ACI for both convective and stratiform cloud regimes. The subsequent analysis of this study is focused on precipitation enhancement in the warm sector, which covers most advanced city clusters, including Hong Kong, Shenzhen, and Guangzhou. The responses of stratiform clouds to increased aerosols in the cold sector are discussed in Sect. 4. Compared with the CTL and ARIoff runs, the CLEAN run yields an analogous time evolution, with less rainfall during the peak time from 06:00 Z on 15 December to 10:00 Z on 16 December (Fig. S8). The next question that arose is how ACI can increase the rainfall amount in the warm side.
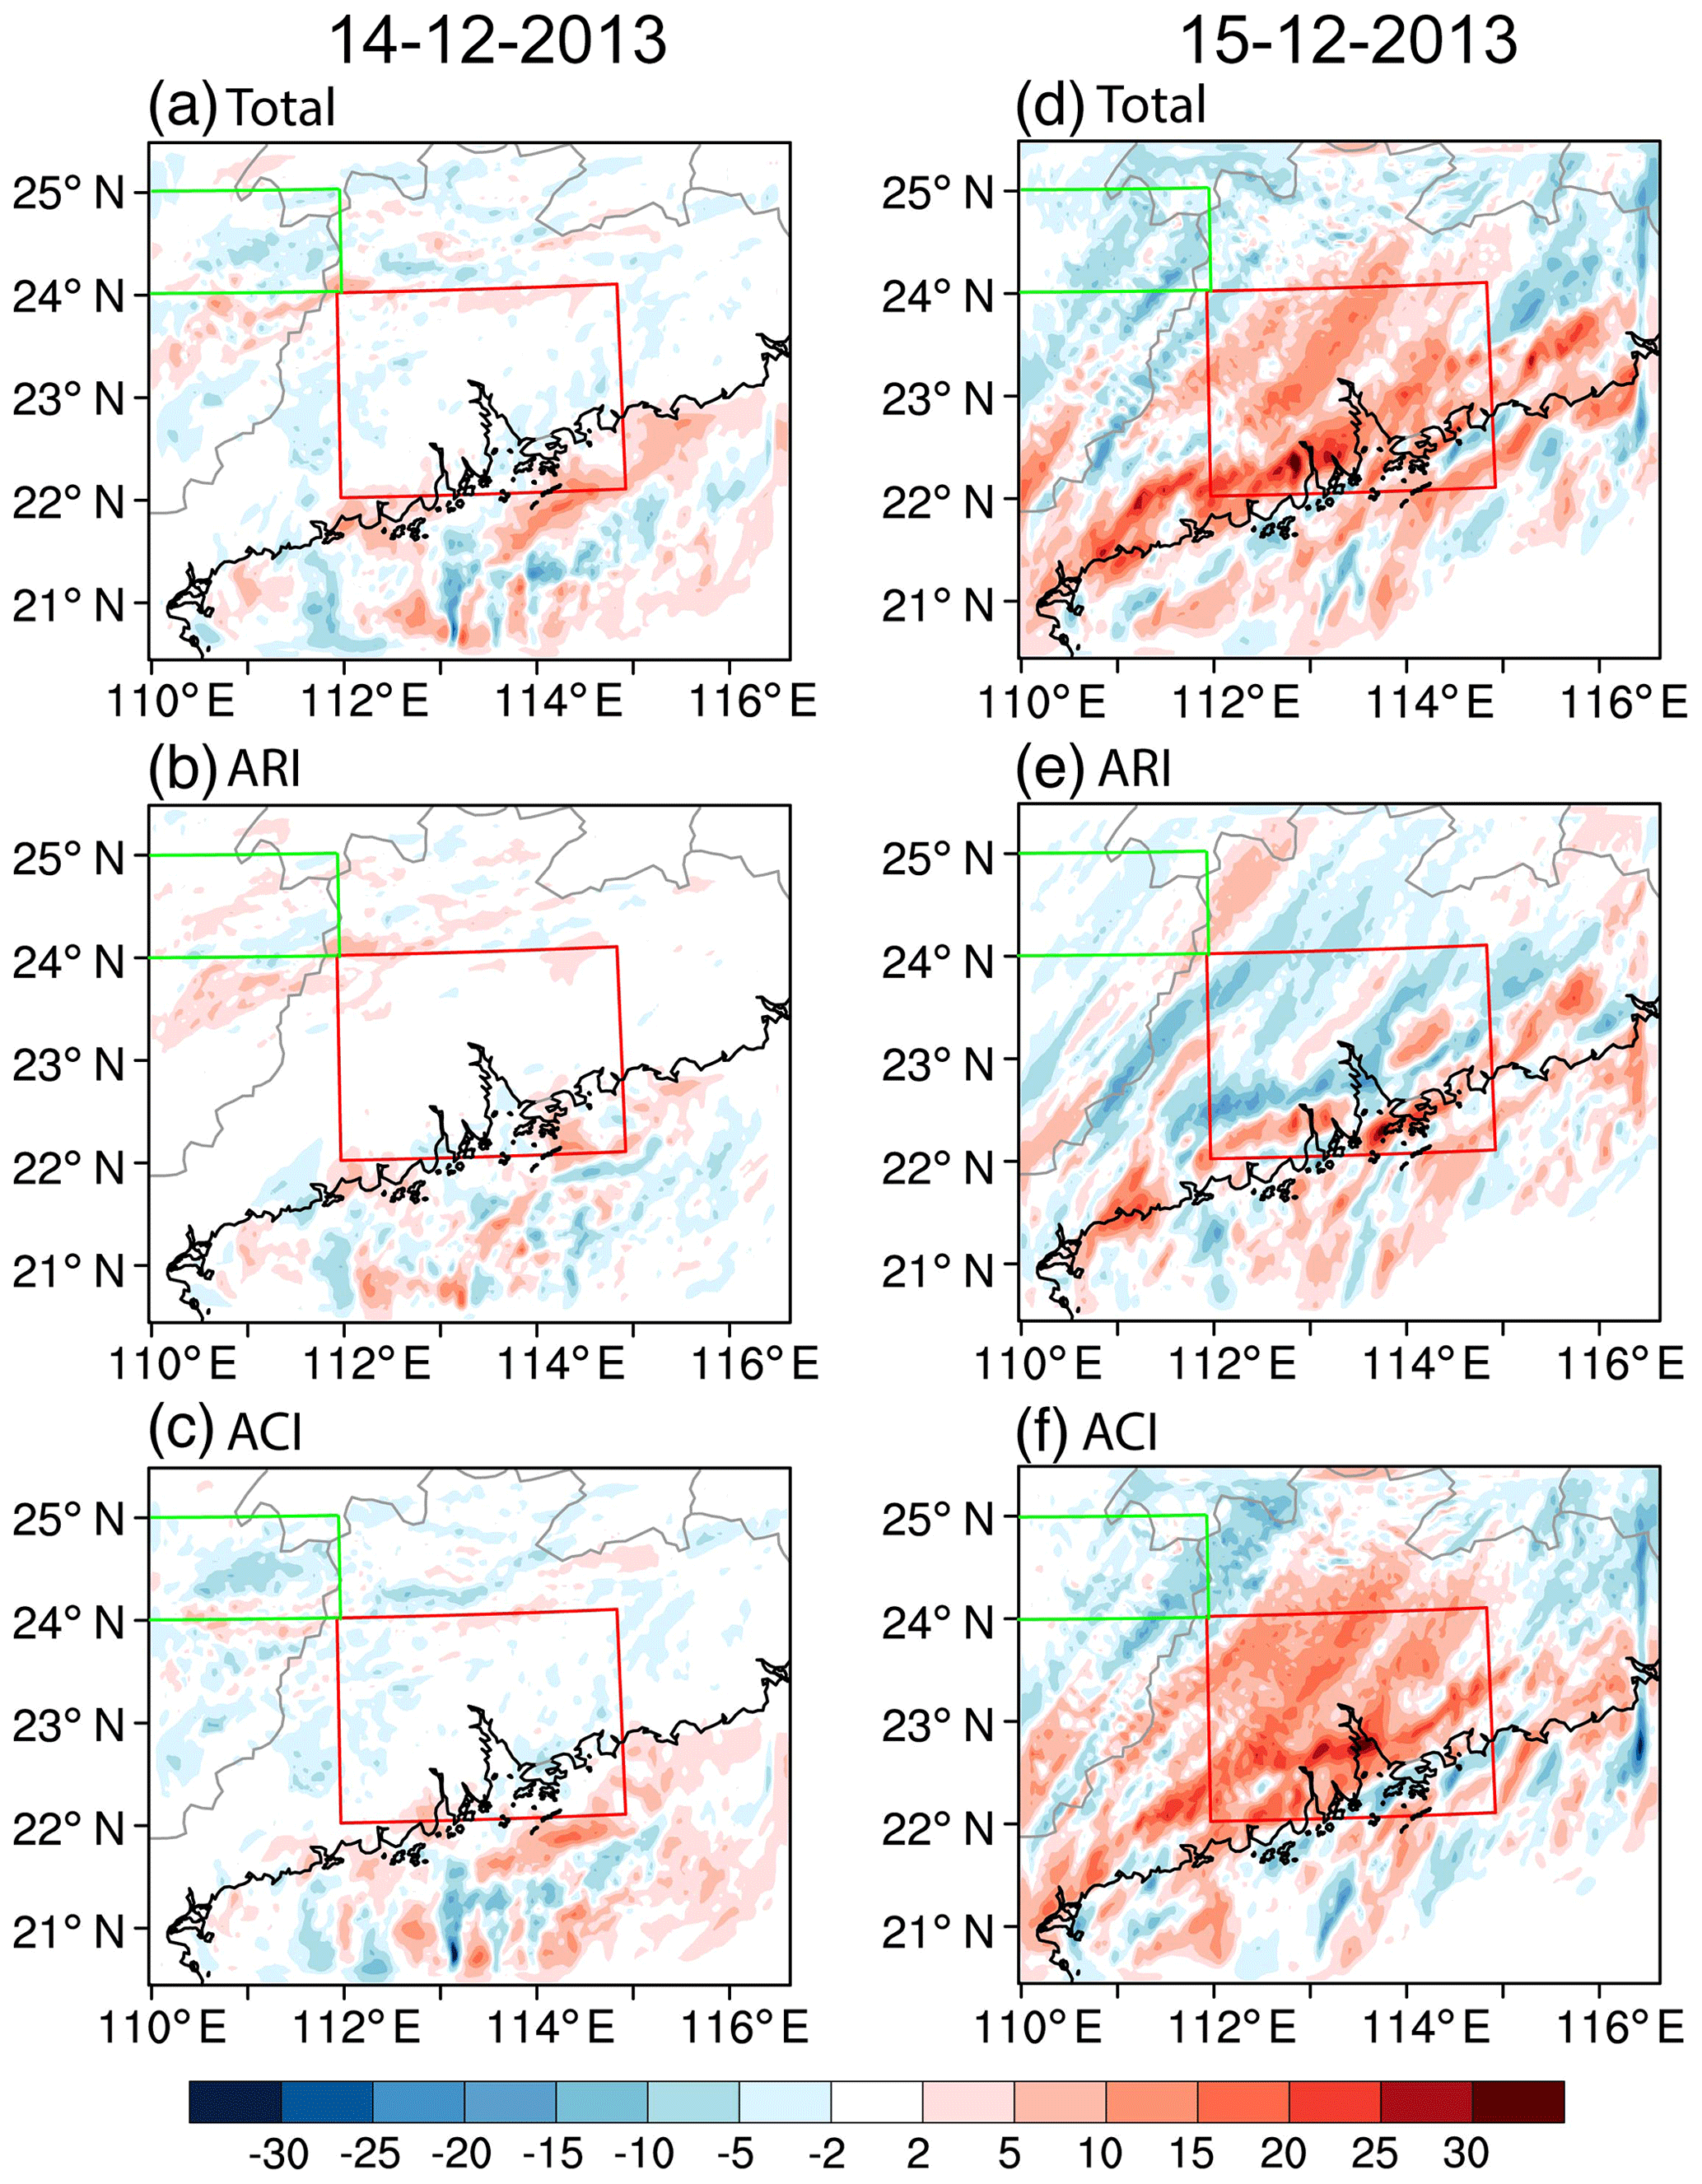
Figure 3Differences in precipitation (mm) (a) between CTL and CLEAN, (b) CTL and ARIoff, and (c) ARIoff and CLEAN on 14 December. (c–f) Same as (a–c) but for 15 December. Red boxes (22–24∘ N, 112–115∘ E) and green boxes (24–25∘ N, 110–112∘ E) denote the regions R1 and R2, respectively.
Figure 4a shows the time–height cross section of cloud fraction (shading) and PM2.5 concentration (contour) in the CTL run. The cloud fraction is calculated as the sum of cloud water, cloud ice, and snow following Hong et al. (1998). Most cloud fraction concentrates below 8 km on the first day, associated with a small amount of rainfall. Deep convection, with a cloud base at approximately 500 m and cloud top extending to 16 km, appears during 15–16 December, when peak rainfall occurs. The PM2.5 concentration in Fig. 4a portrays a sharp contrast before and after the rainfall peak. After the rainfall peaks at near 07:00 Z in Fig. S8, aerosols are washed out dramatically. However, before the peak, PM2.5 concentration decreases gradually from 40 µg m−3 near the surface to 5 µg m−3 near 7 km above the ground. With aerosols acting as cloud condensation nuclei, more cloud droplets are formed with a smaller radius (Fig. 5a). Smaller cloud droplets evaporate, associated with a reduction of cloud water (Fig. 6a), resulting in a cooling effect and weaker updraft (Fig. 5g). Thus, the cloud fraction decreases before the peak, particularly below 2 km. By contrast, a prominent cloud fraction band appears near 4 km throughout the peak period (Fig. 4b). The increase in cloud fraction extends to the upper troposphere, near 14 km, corresponding to the increase in ice cloud shown in Fig. 5d. As a result, the deep convection is enhanced, associated with more rainfall during peak time. The similarity of cloud fraction changes between Fig. 4b and c suggests that ACI dominates the total aerosol effect in this event, which is consistent with the previous discussion.

Figure 4(a) Time–height cross section of cloud fraction (CF; shading; unitless) and PM2.5 concentration (contour; µg m−3) averaged over R1 in the CTL run. Differences in the time–height cross section of CF (shading; unitless) and PM2.5 concentration (contour; µg m−3) averaged over R1 shown in Fig. 3 between (b) CTL and CLEAN and (c) ARIoff and CLEAN. The cloud fraction is calculated as the sum of cloud water, cloud ice, and snow. Dashed lines denote the 0 ∘C isotherm calculated as the averaged zero-layer height over R1.
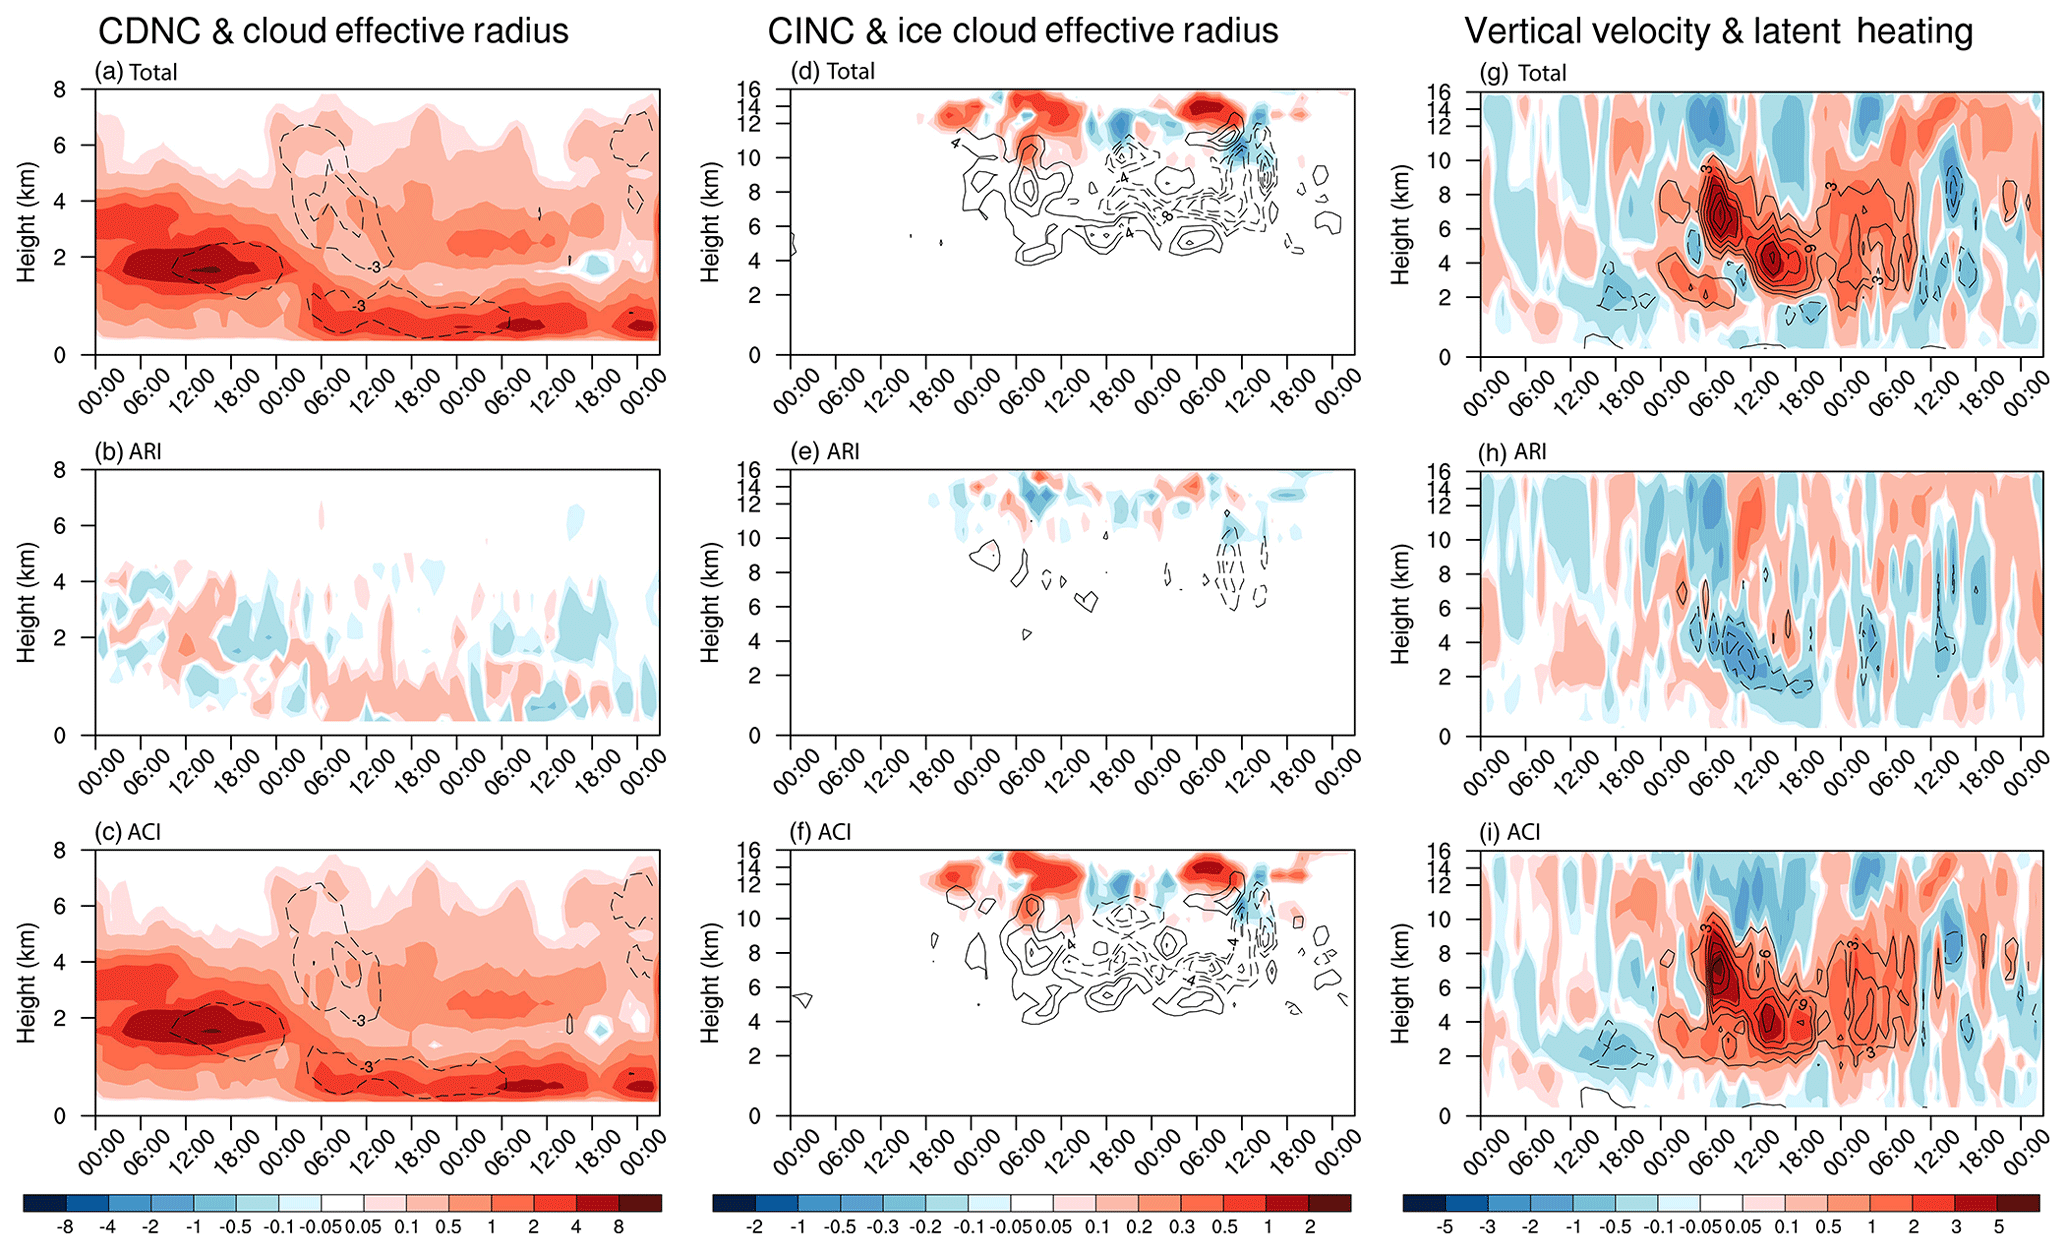
Figure 5Differences with time (abscissa; from 00:00 Z on 14 December to 02:00 Z on 17 December) and height (ordinate) in (a) cloud droplet number concentration (CDNC, shading; 107 kg−1) and cloud effective radius (contour; µm), (d) cloud ice number concentration (CINC, shading; 105 kg−1) and ice cloud effective radius (contour; µm), and (g) vertical velocity (shading; cm s−1) and latent heating (contour; K d−1) averaged over R1 between CTL and CLEAN. (b, e, h) Same as (a, d, g) but for differences between CTL and ARIoff. (c, f, i) Same as (a, d, g) but for differences between ARIoff and CLEAN. For CINC and ice cloud effective radius, only cloud ice is considered. Zero-value contour lines are omitted and negative values are dashed.
Figure 5a–c present the aerosol effects on cloud droplet number concentration (CDNC; shading) and cloud effective radius (contour). With aerosols, CDNC increases by 5.5 times accompanied by reduced cloud effective radius near 2 km from 00:00 Z on 14 December to 00:00 Z on 15 December, which reduces the efficiency of collision–coalescence between cloud droplets into raindrops (Rosenfeld, 2000; Twomey, 1977). This is characterized by less rain water formed in Fig. 6c, indicating suppression of the warm rain. Figure 6a shows more cloud water formed at 2–6 km due to higher supersaturation. The consumption of moisture and energy limits the formation of low cloud below. When droplets nucleate due to activation of enormous aerosols, there is abundant latent heat release by enhanced condensation below the 0 ∘C isotherm line. This is also reported in Fan et al. (2018), in which the mechanism responsible for latent heat release is from cloud water formation with ultrafine aerosols. This is called “warm-phase invigoration” in their study, which is different from “cold-phase invigoration” via suppression of the warm rain. Unlike their work, the warm rain is suppressed before 15:00 Z on 15 December (Fig. 6c) even though with strong latent heat release through cloud water formation. This is because the conversion of cloud droplets into raindrops is inversely proportional to cloud droplet numbers with a two-moment bulk scheme using autoconversion parameterization (Khairoutdinov and Kogan, 2000). Thus, the precipitation increase is because of enhancement of cold rain. Both cloud ice number concentration and its effective radius increase significantly between 06:00 and 15:00 Z on 15 December. Moreover, the mass and number of ice particles including cloud ice, snow, and graupel increase drastically during this period. A distinct latent heat release center appears above the 0 ∘C isotherm line, which is even stronger than the condensational heat below. These two peaks in aerosol-induced diabatic heating are also discussed in Wang et al. (2014) for oceanic deep convection. However, the peaks are much higher at 3 and 7 km because the convection occurs over the land. The latent heat from these two peaks will thus intensify convective strength. These findings suggest that the cold-cloud process plays a dominant role in the precipitation increase before 15:00 Z on 15 December. The latent heat released for each process, which is calculated as the product of mass conversion between different phases and its associated latent heat release rate in the model, is further analyzed for both cold and warm clouds (Fig. S9). The salient latent heat changes mentioned above in Fig. 5g are caused by deposition in cold clouds (Fig. S9e). Figure S10 shows the time–height distribution of mass and number concentration for different hydrometers in the control run. It should be noted that the magnitude of snow and graupel mass is 10 times that of rain water. There are affluent snow and graupel before 15:00 Z on 15 December located where the distinct changes in depositional heat appear. With aerosols, the snow and graupel grow at the expense of ice crystals and rain water via aggregation and riming, respectively (Fig. 6c–e). The former refers to the collision and coalescence of ice crystals to form snow, while the latter represents the accretion of cloud drops and raindrops by snow and graupel to form larger graupels. These are the main processes of converting liquid mass to solid phase, contributing to additional precipitating particles. However, the latent heat due to riming is relatively small (Fig. S9f) because the latent heat release per unit for freezing (334 kJ kg−1) is only 1∕8 of that for deposition (2256 kJ kg−1). The latent heat release due to deposition in cold cloud is stronger than that due to condensation in warm cloud even though the latter is also important (Fig. S9a and e). In deep convection, the strong updraft usually makes the atmospheric condition saturated for water which is supersaturated with respect to ice. With the presence of snow and graupel (Fig. S10), the formation of ice particles is enhanced, accompanied by additional latent heat release due to deposition (Figs. 6 and S9). After 15:00 Z on 15 December, most of the snow and graupel sedimentate. Compared with depositional heating, the condensational heating plays a dominant role in intensifying convective strength. The rain water increases through accretion of added cloud droplets, leading to precipitation increases. These findings highlight two different processes and mechanisms in the precipitation increase before and after 15:00 Z on 15 December. The dominant sources of latent heat release are depositional heating in the former case (cold rain enhancement) and condensational heating in the latter (warm rain enhancement). Due to latent heat release with aerosols, the vertical motion is boosted (Fig. 5g), which further enhances the supersaturation and latent heat release. Via microphysics–dynamics feedback, the convection is intensified and precipitation increases. This feedback has been widely discussed in ACI effects on deep convection (Fan et al., 2018; Koren et al., 2015; Tao et al., 2012).
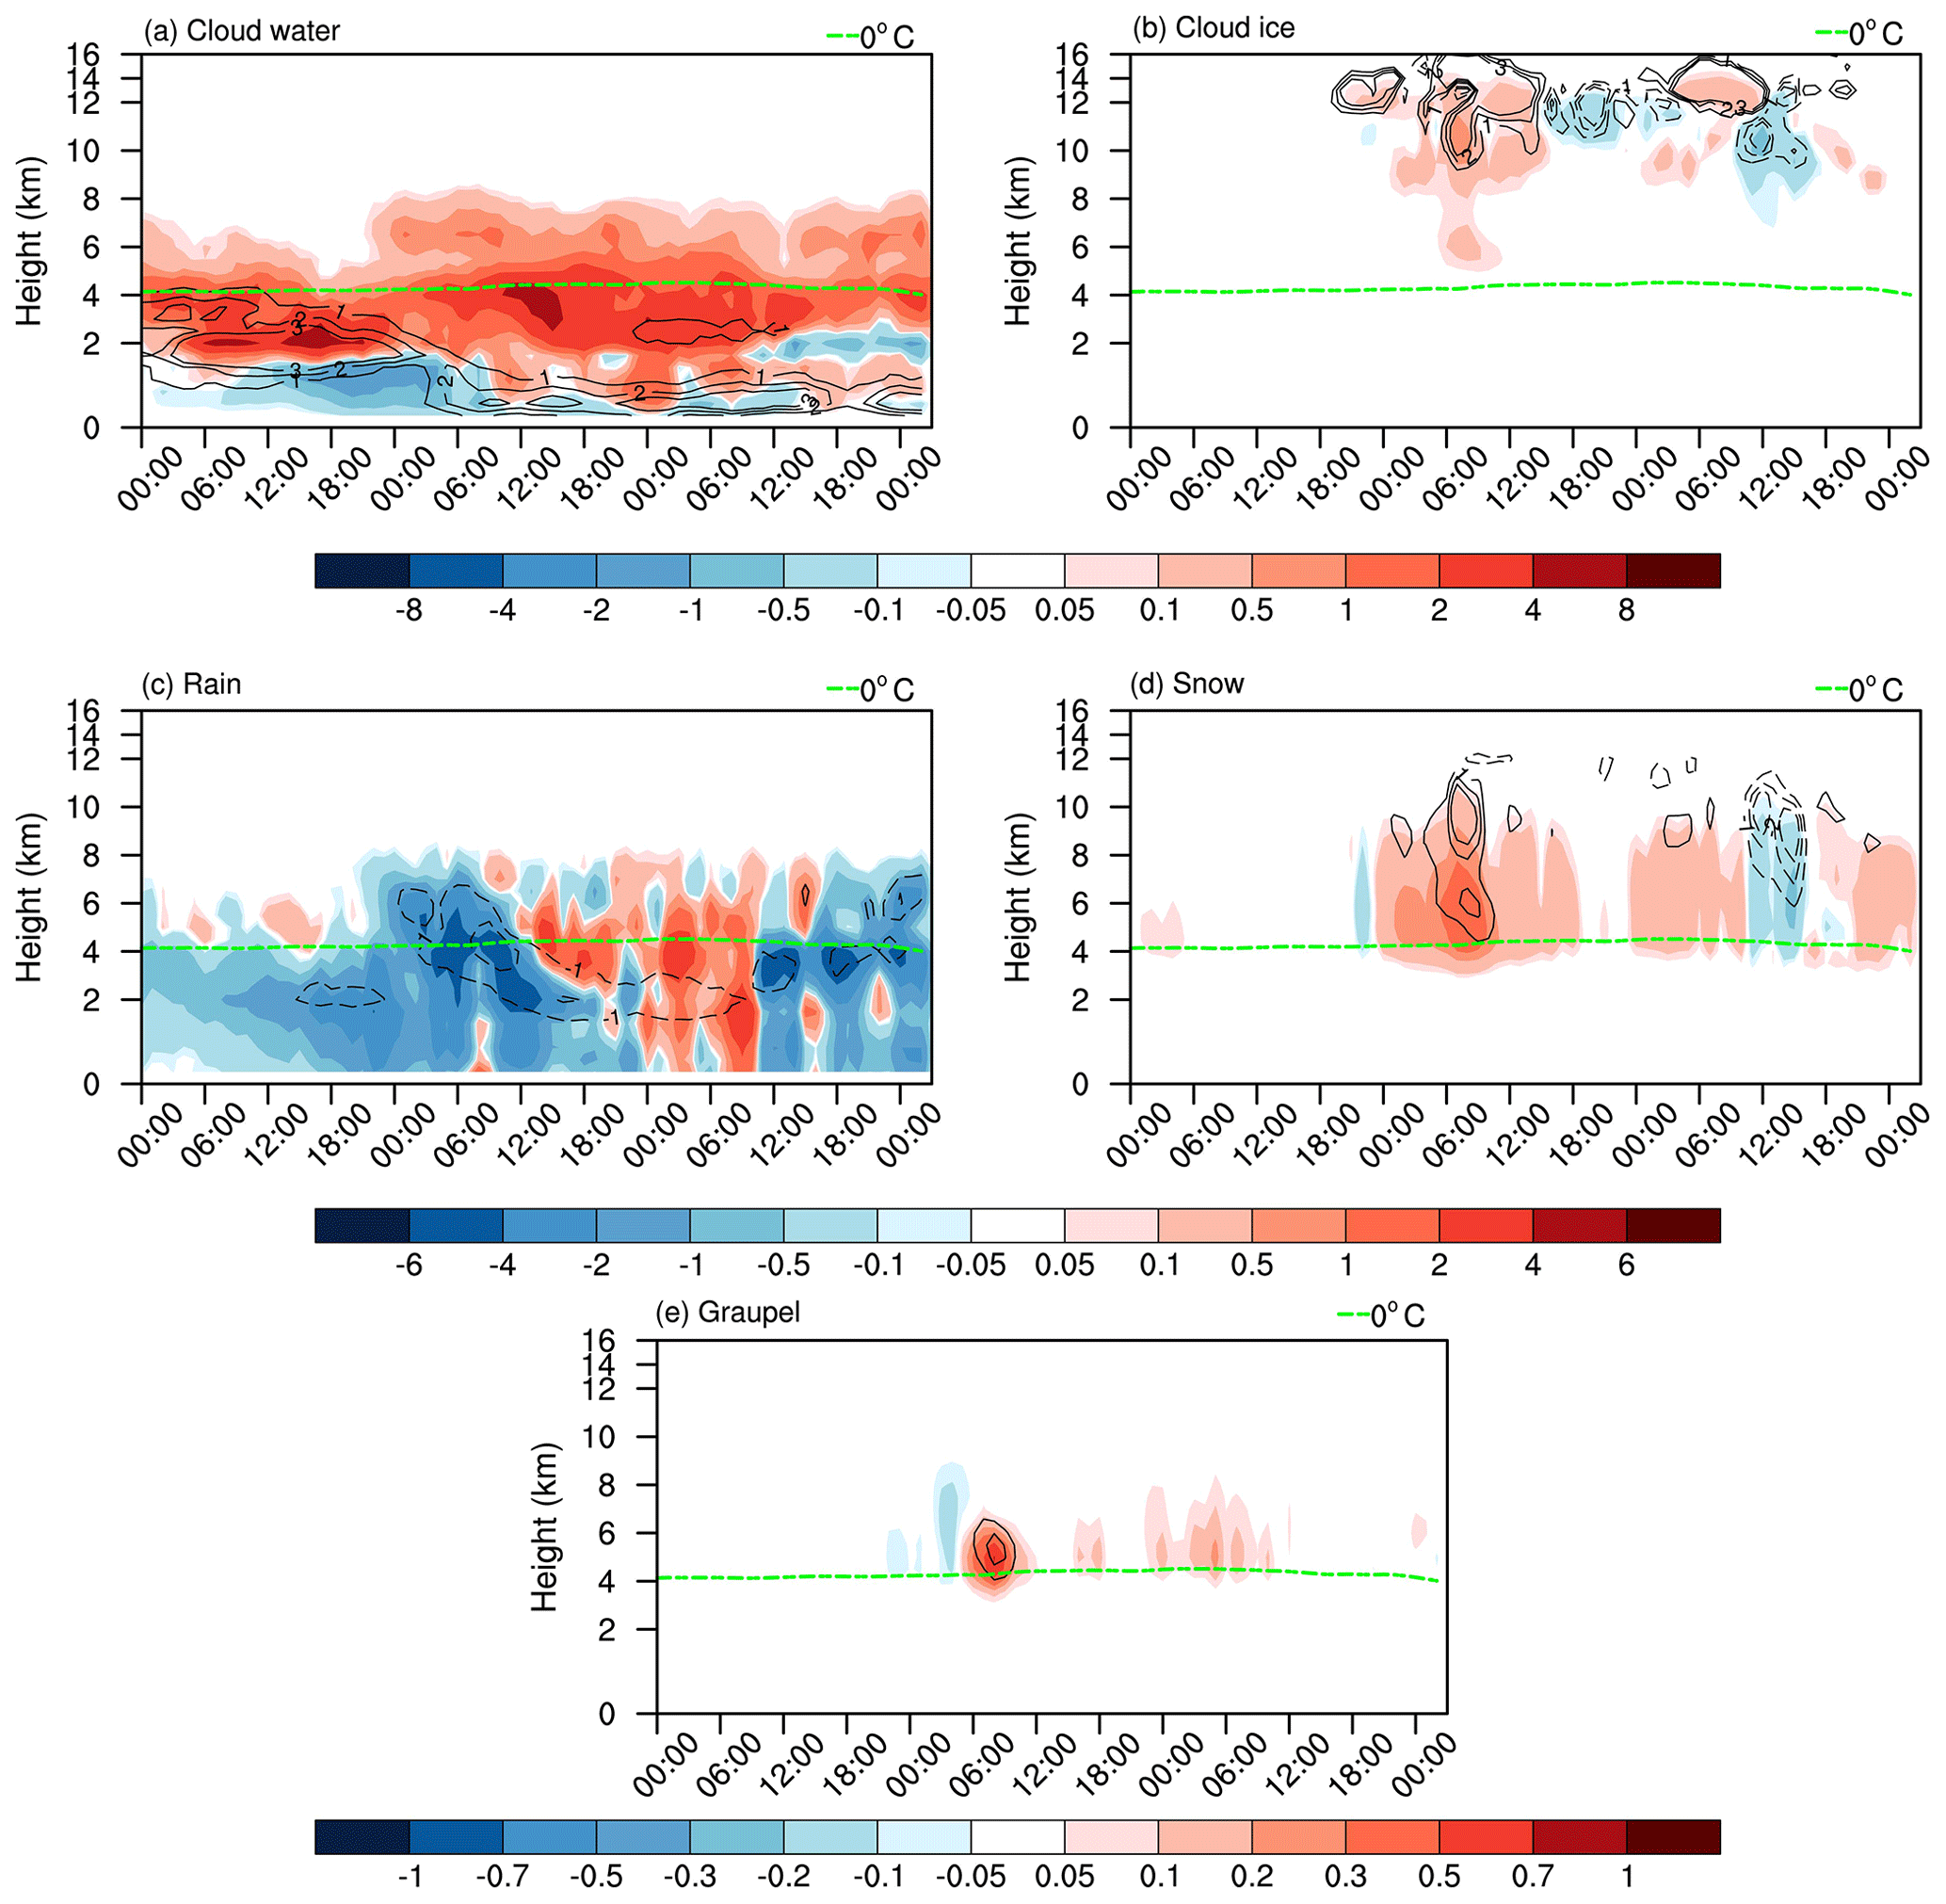
Figure 6Differences with time (abscissa) and height (ordinate) in (a) cloud water (shading; 10−5 kg kg−1) and CDNC (contour; 107 kg−1), (b) cloud ice (shading; 10−5 kg kg−1) and CINC (contour; 104 kg−1), (c) rain (shading; 10−5 kg kg−1) and rain number concentration (contour; 105 kg−1), (d) snow (shading; 10−4 kg kg−1) and snow number concentration (contour; 103 kg−1), and (e) graupel (shading; 10−4 kg kg−1) and graupel number concentration (contour; 103 kg−1) between CTL and CLEAN averaged over R1.
To further delineate the mechanism of this microphysics–dynamics feedback, the moisture budget tool is implemented based on the hourly model output. The atmospheric moisture balance is expressed as follows:
where Q is the column-integrated water vapor in the atmosphere, t is time, E is evaporation, P is precipitation, and MFC is the vertically integrated moisture flux convergence.
Evaporation is small in areas of intense precipitation and saturation (Banacos and Schultz, 2005). The column-integrated water vapor changes are small (figure not shown); thus, precipitation is balanced by MFC as follows:
MFC can be further divided into two terms as
where the first term on the right-hand side is the horizontal moisture convergence (hereafter CON); the second term is the horizontal advection of water vapor (hereafter ADV). Thus, the precipitation is balanced by the sum of CON and ADV as
The spatial distributions of column-integrated MFC (shading) and moisture flux (vector) between CTL and CLEAN on 15 December are displayed in Fig. 7a. The MFC pattern is in good agreement with precipitation differences in Fig. 3d, suggesting the validity of the derivation of Eq. (2). The MFC change averaged over R1 is +8.1 mm, which is comparable to +7.8 mm in precipitation difference. The moisture flux is enhanced over R1 driven by strong convergence. These flows converged in the estuary and near the coast with a magnitude of approximately 25 kg m−1 s−1. The overall pattern of CON is broadly consistent with that of MFC, which indicates that the MFC changes are mainly driven by CON changes (Fig. S11a). The ADV changes contribute about 35 % of MFC changes over the analysis region, but are much more scattered than CON changes (Fig. S11c).
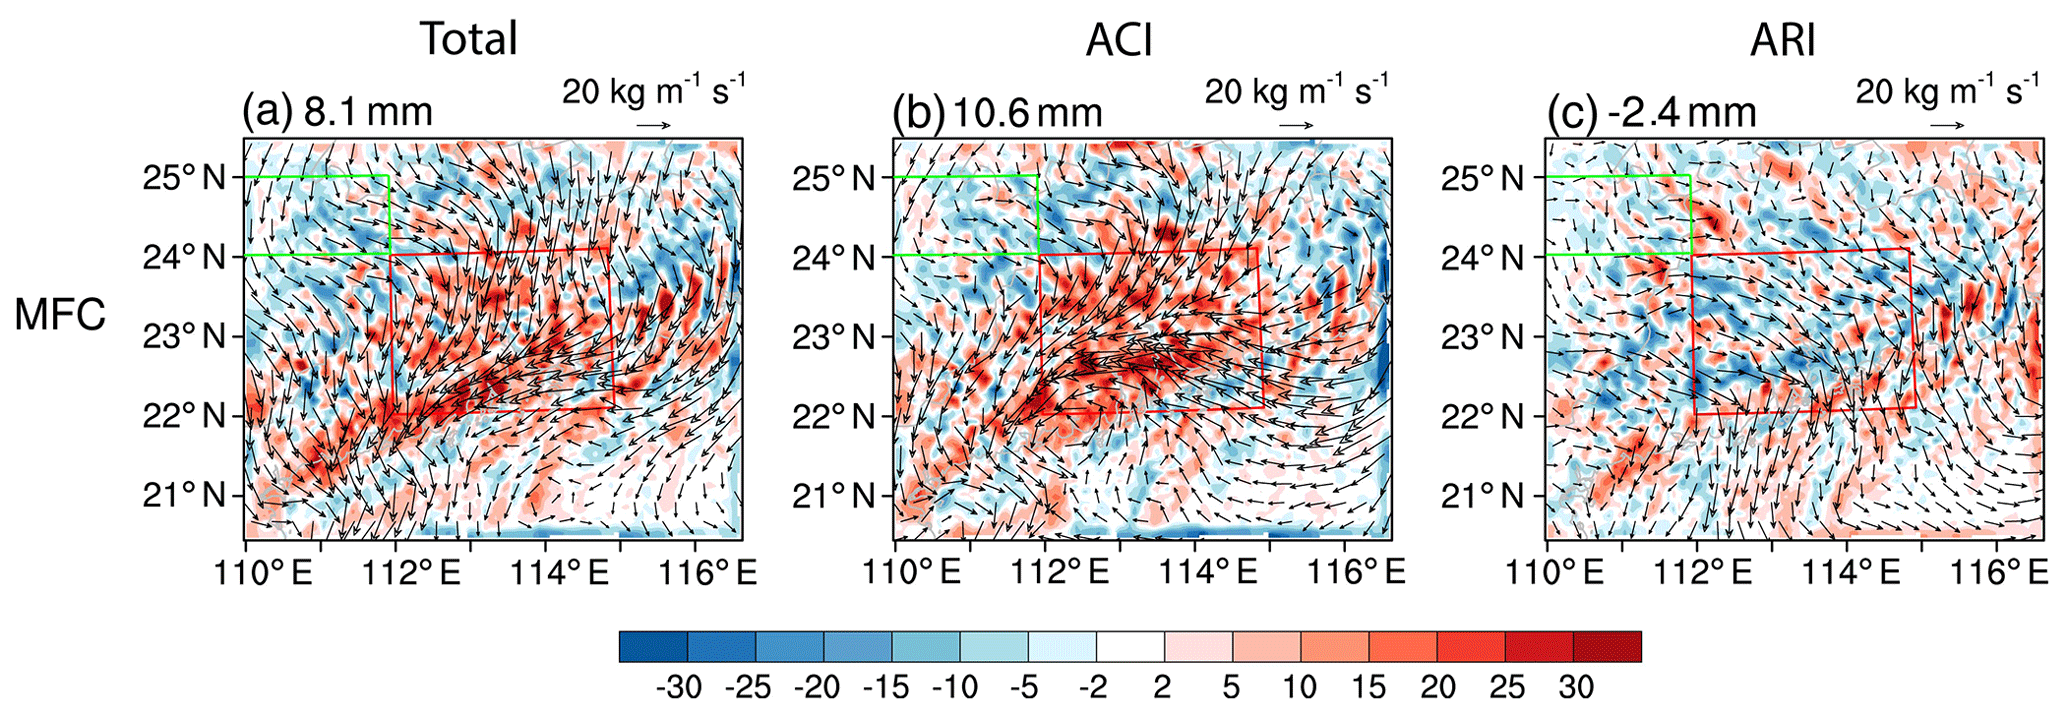
Figure 7Differences in column-integrated flux convergence (MFC; shading; mm) and moisture flux (vector; kg m−1 s−1) between (a) CTL and CLEAN, (b) ARIoff and CLEAN, and (c) CTL and ARIoff on 15 December. Numbers in the top-left corner of each panel represent values averaged over R1.
These findings reveal the prominent effects of aerosols on rainfall amount over the estuary and near the coast in this extreme rainfall event. The pattern of precipitation and associated cloud-related variables in total effects bears a resemblance to that in ACI effects, which allows us to ascertain that ACI dominates. By applying the moisture budget tool, we confirm the microphysical–dynamic feedback of ACI effects on invigorating convection.
3.3 Local versus remote aerosol emission effects
We disentangle the roles and relative importance of local (i.e., domain 2, which denotes Guangdong Province) and remote (i.e., domain 1, which denotes outside Guangdong Province) aerosols in the precipitation increase in the estuary during this extreme rainfall event. Figure 8a and b show the differences in the time–height cross section of cloud fraction (shading) and PM2.5 concentration (contour) induced by the effects of local and remote emissions, respectively. With local emissions, the aerosol concentration mainly increases within the PBL below 2 km before 12:00 Z on 15 December (Fig. 8b). The accumulated aerosols are washed out quickly after the rainfall initiated. By contrast, with remote emissions, higher aerosol concentration extends to approximately 8 km after 03:00 Z on 14 December (Fig. 8a). Two peaks near 0.5 and 5 km above ground are centered near 10:00 and 18:00 Z on 14 December, respectively, indicating a strong transportation of aerosols. The earlier peak, near 5 km, is caused by stronger wind speed in the free atmosphere compared with that within the PBL. Moreover, the aerosol concentration lasts for longer before decreasing dramatically until the peak rainfall starts at 07:00 Z on 15 December, because aerosols are transported continuously from the north. The cloud fraction reduction is coherent with aerosol concentration peaks, indicating that increased aerosols lead small cloud droplets to evaporate. Moreover, more deep cloud formation consumes moisture and energy. The similar cloud fraction changes between Fig. 8a and 4b indicate the dominant effects of aerosols from remote areas. The CDNC (shading) increases in both D1 and D2 runs compared with the CLEAN run before the rainfall peak (Fig. S12a and b). However, the discernible cloud effective radius (contours) decrease appears only in the D1 run and is attributed to a stronger CDNC increase. Correspondingly, the CINC and ice cloud effective radius show more remarkable increases in the D1 run during the rainfall peak time (Fig. S12c and d). The associated latent heat and vertical velocity are much stronger in the D1 run compared with that in the D2 run (Fig. S12e and f). Interestingly, most of the latent heat release with local emissions occurs below the 0 ∘C isotherm line. Figure 9 shows the changes in mass and number of different hydrometeors with remote aerosol emissions. There are plenty of snow and graupel formations at the expense of rain water when precipitation increases before 15:00 Z on 15 December, indicating an intensified cold rain process. The corresponding latent heat release is dominated by deposition in cold cloud (Fig. S13). By contrast, after 15:00 Z on 15 December, rain water increases significantly during precipitation enhancement, representing stronger warm rain processes. The associated latent heat release is due to condensational heating in warm cloud concentrated below the 0 ∘C isotherm line. The patterns of changes in hydrometeors and latent heat in D1 assembles that in the CTL run, further confirming the driving factor of remote aerosol emissions. The distribution of time–height changes in hydrometeors and latent heat between D2 and CLEAN runs are shown in Figs. S14 and S15, respectively. As aerosols from local emissions are concentrated near the surface and are washed out dramatically once the rain initiated, much less cloud water formed than that in the D1 run. More rain water is formed by accretion of cloud droplets, which indicates that intensified warm rain is the only reason for the precipitation increase with local aerosol emissions. As a result, the average precipitation increase over R1 on 15 December is 7.3 mm with remote aerosol emissions, much greater than that with local aerosol emissions (3.1 mm, Fig. 10c and d). These findings suggest that both the effects of local and, to a much greater extent, remote aerosol emissions contribute to precipitation increases.
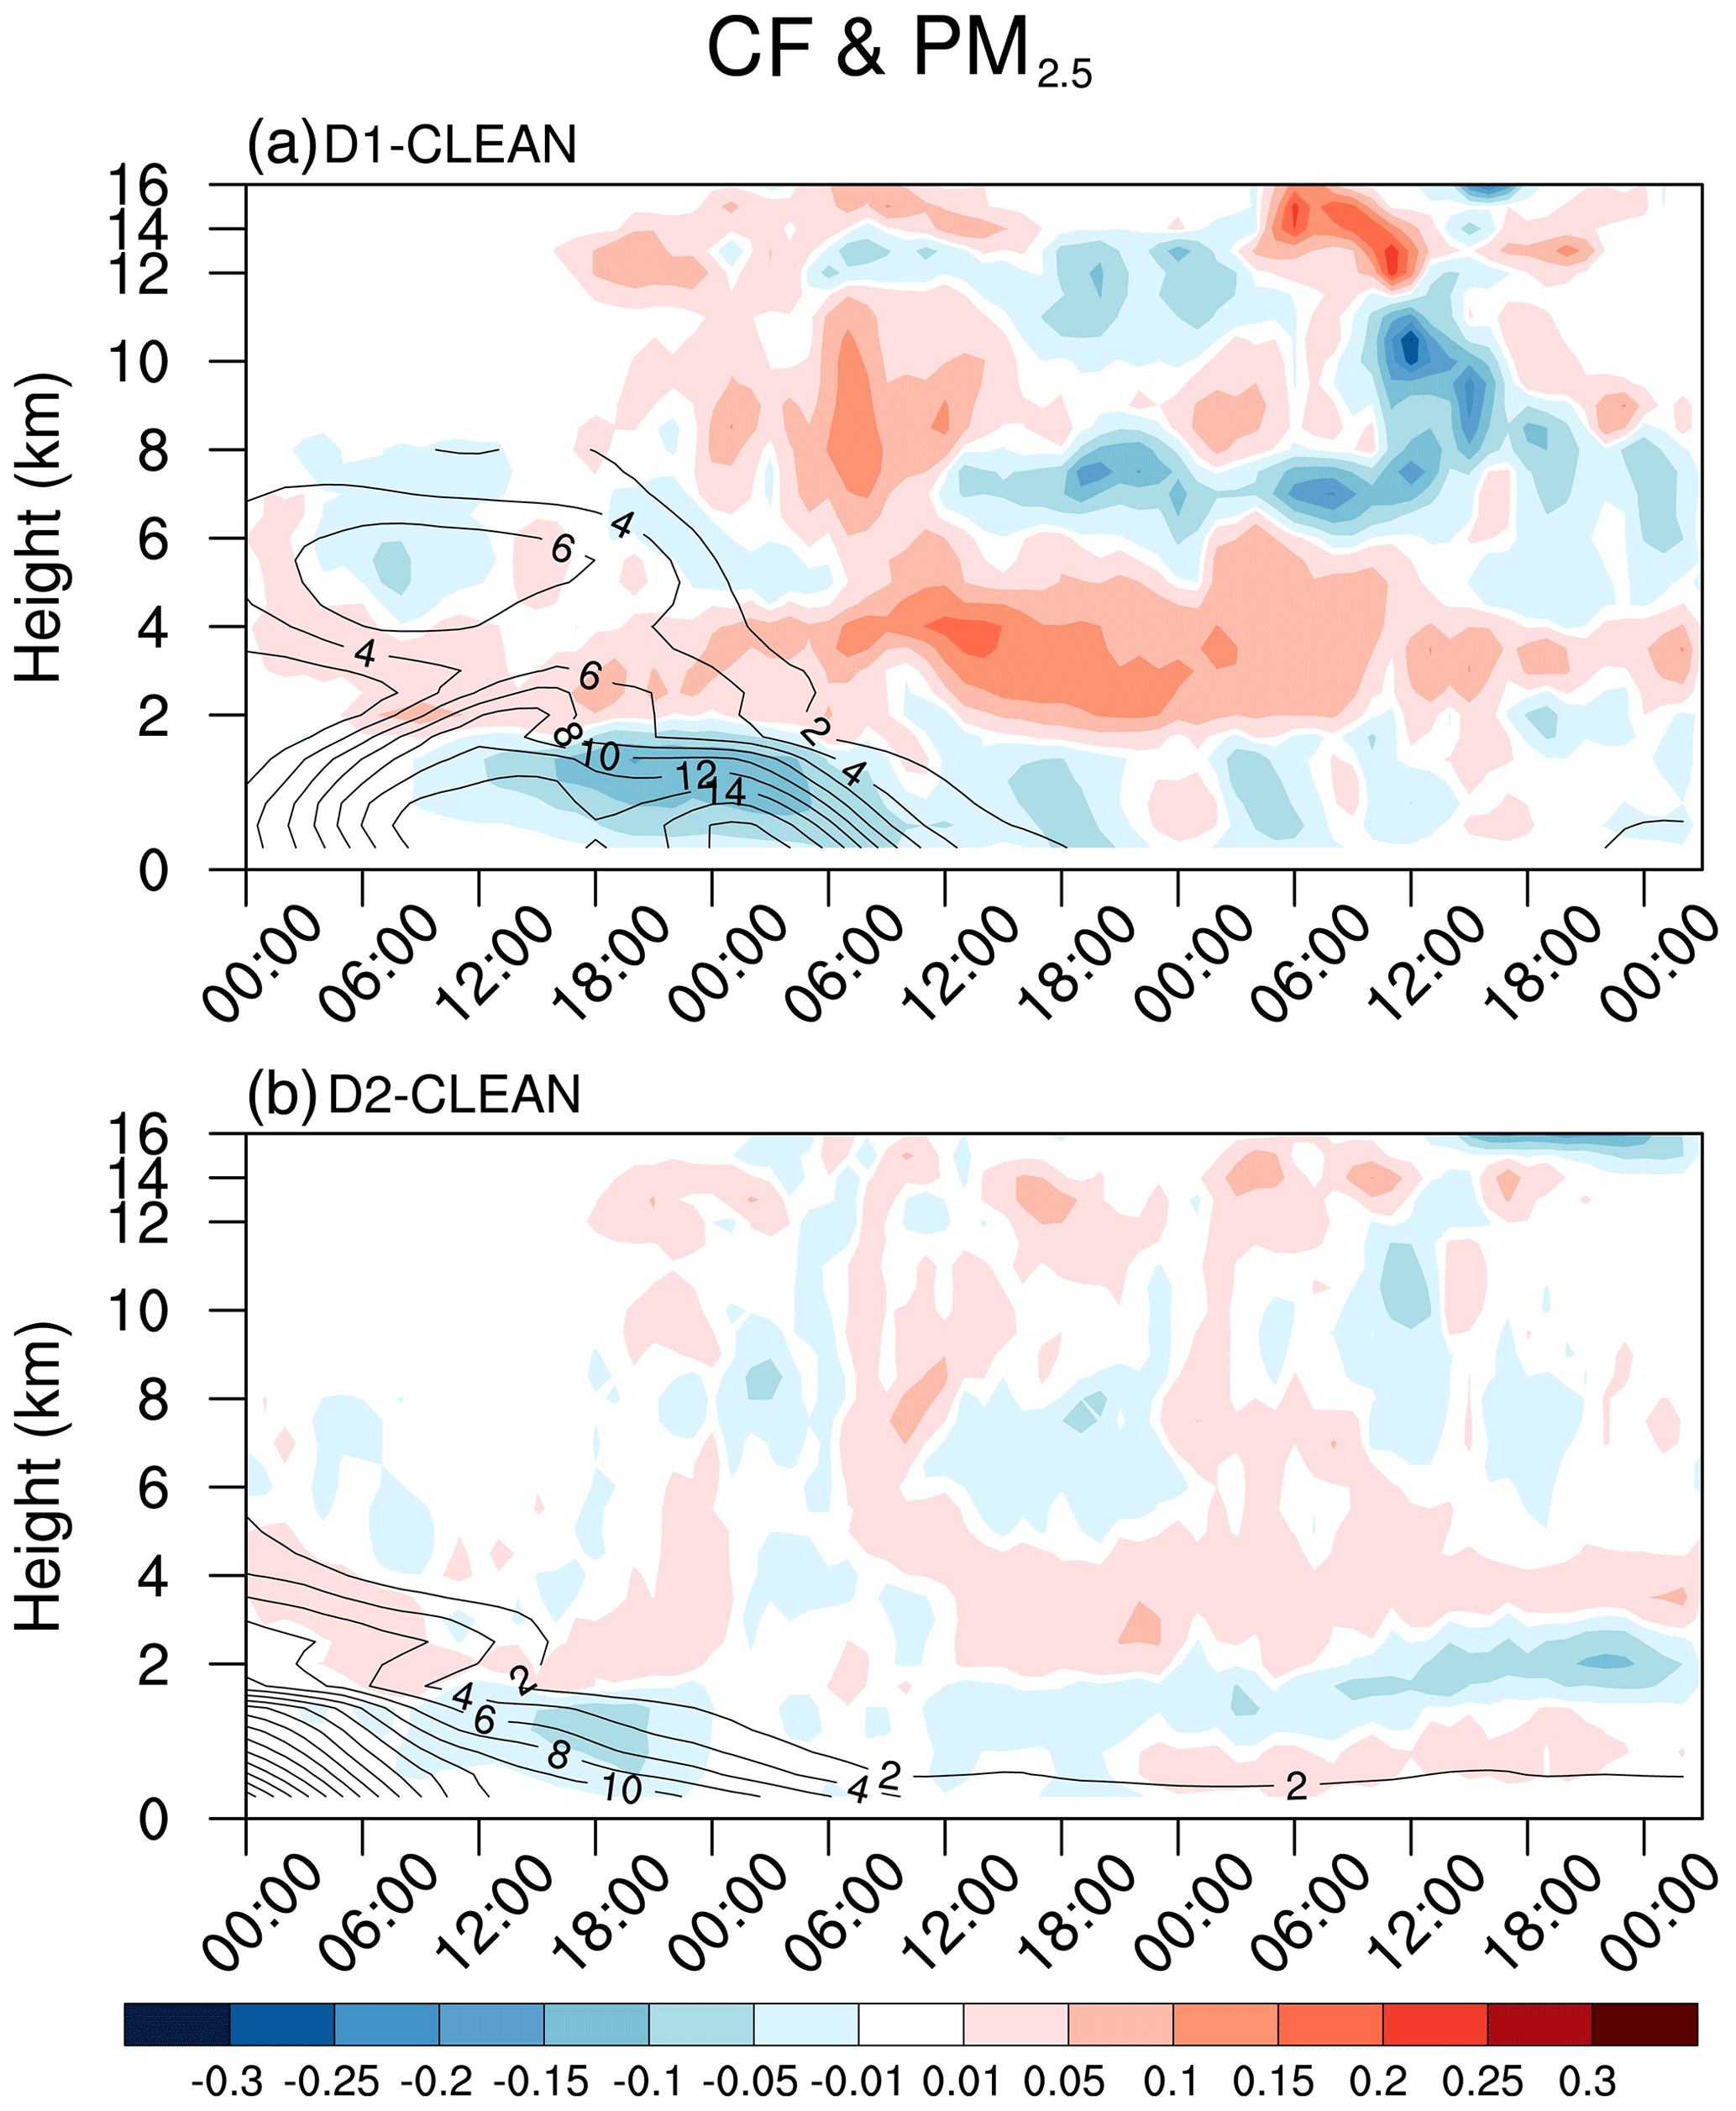
Figure 8Differences in the time–height cross section of CF (shading; unitless) and PM2.5 concentration (contour; µg m−3) averaged over R1 between (a) D1 and CLEAN and (b) D2 and CLEAN.
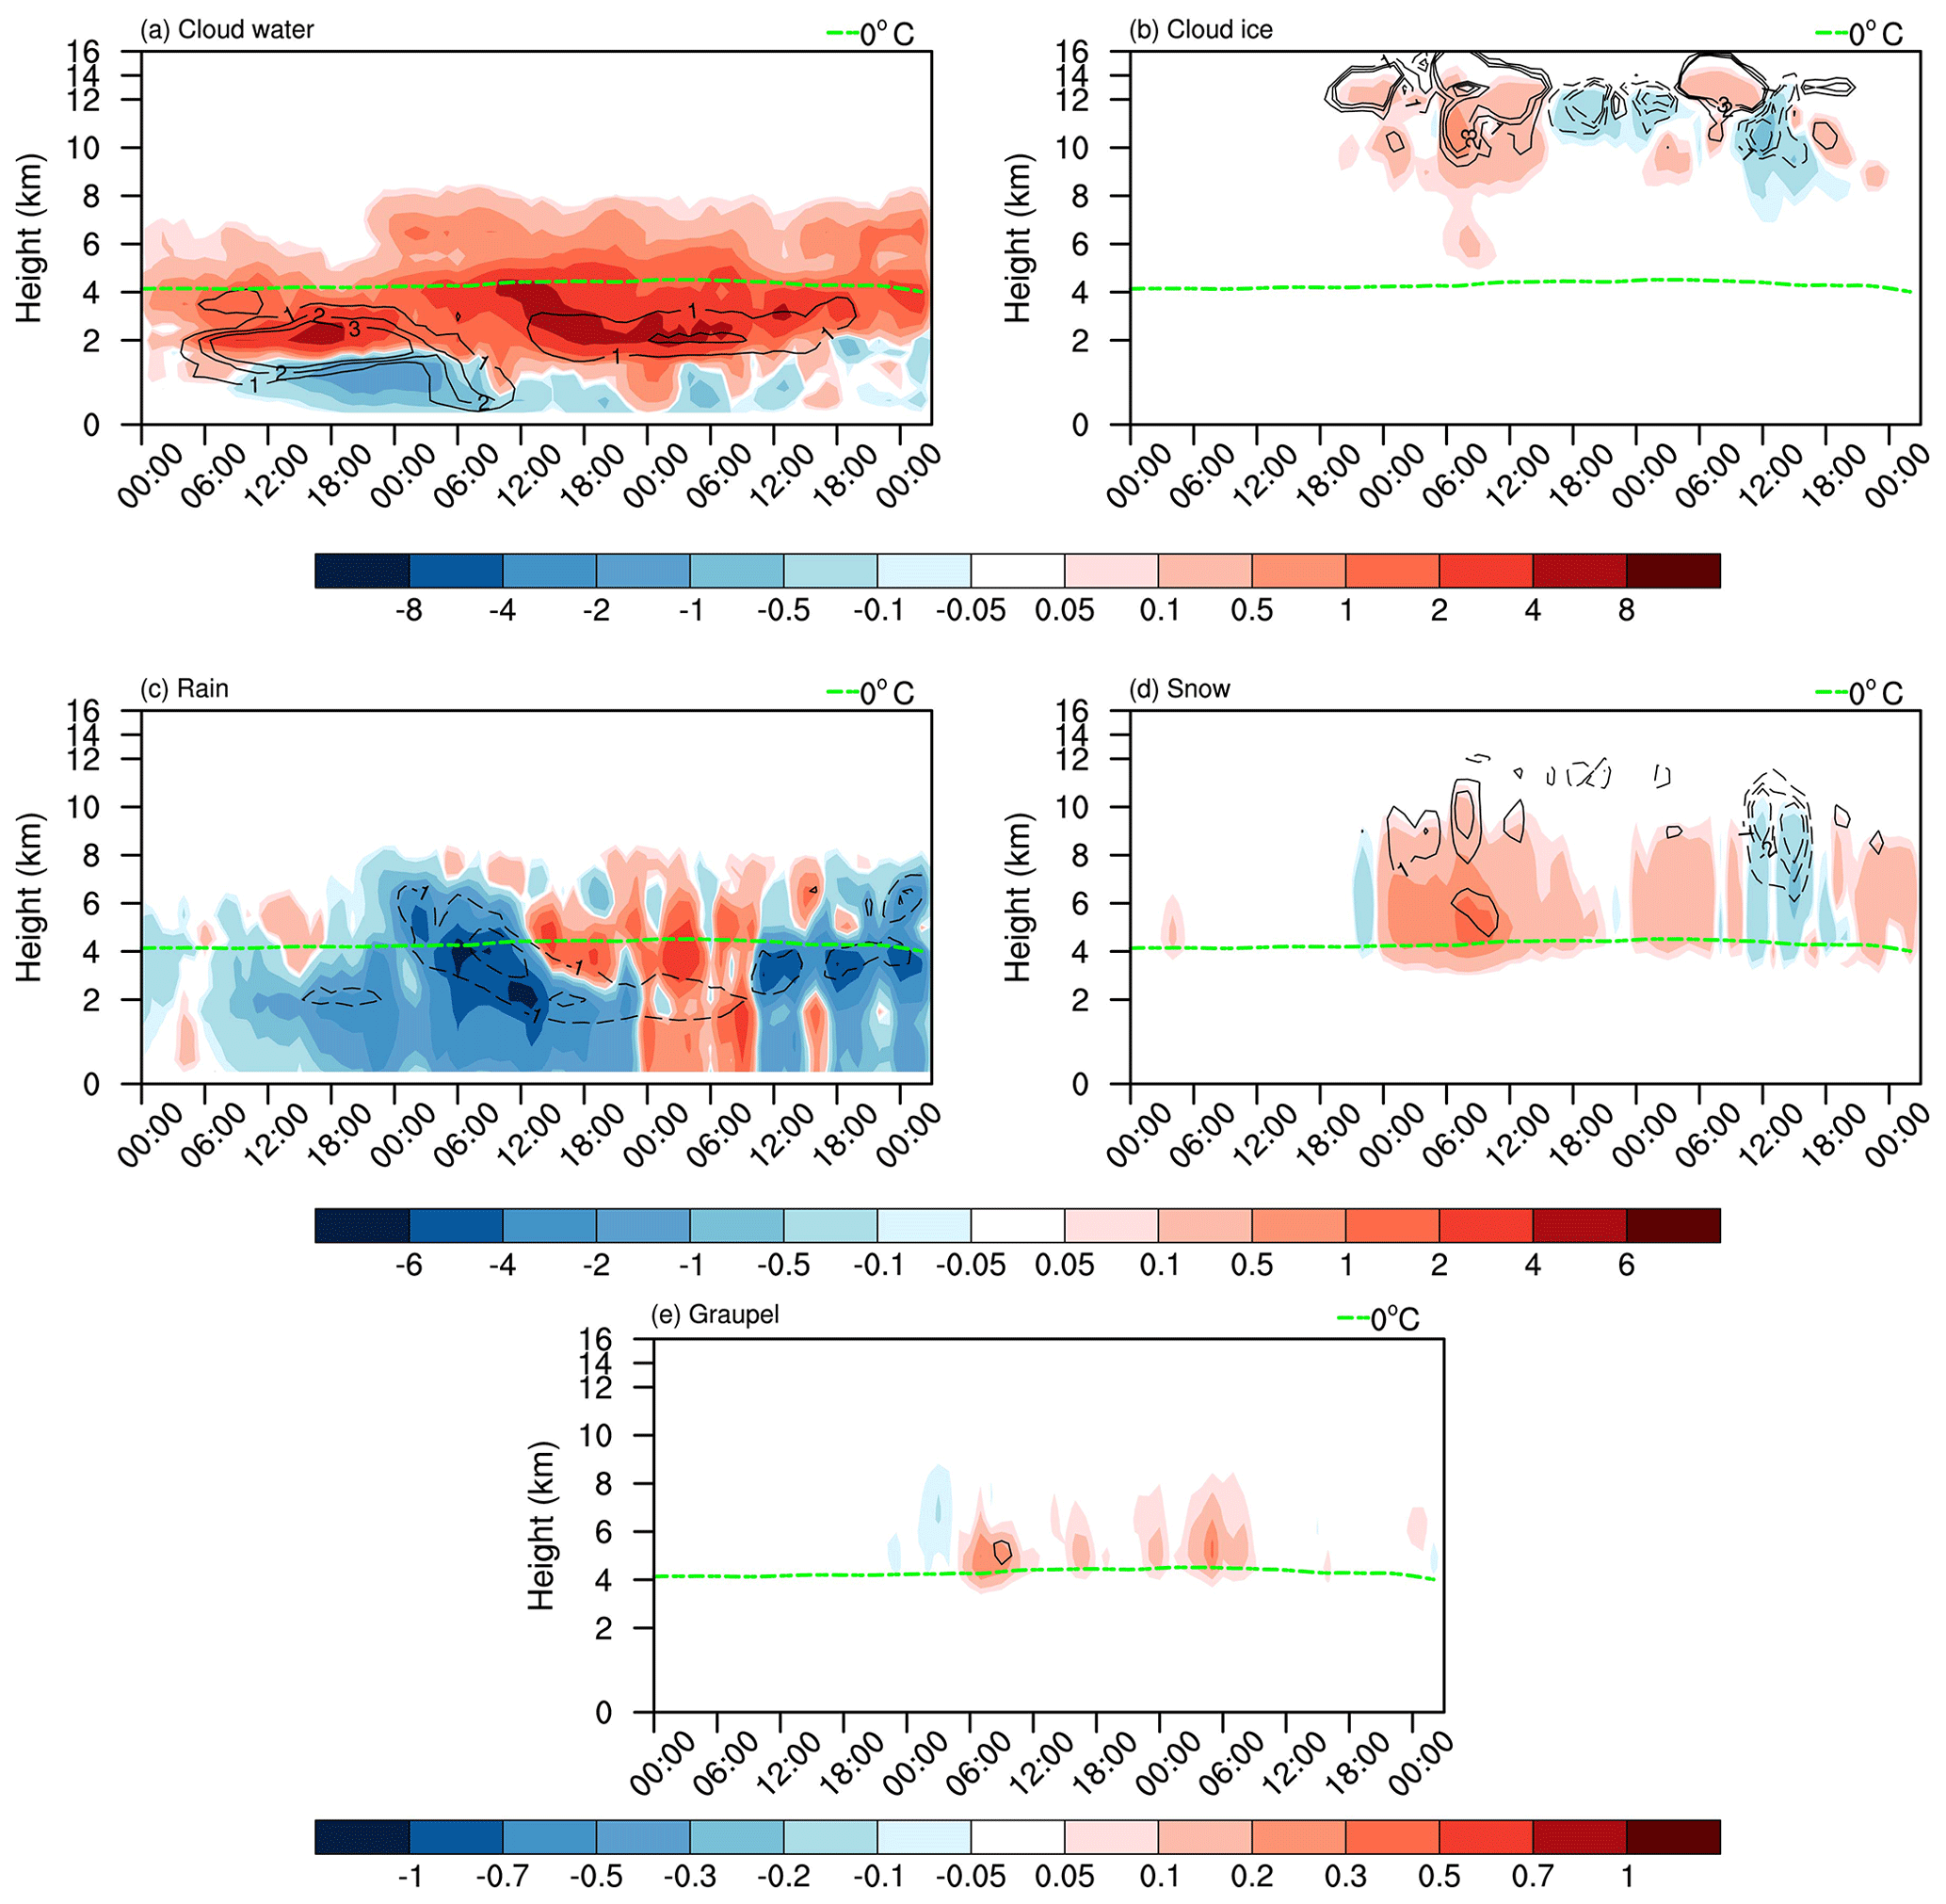
Figure 9Differences with time (abscissa) and height (ordinate) in (a) cloud water (shading; 10−5 kg kg−1) and CDNC (contour; 107 kg−1), (b) cloud ice (shading; 10−5 kg kg−1) and CINC (contour; 104 kg−1), (c) rain (shading; 10−5 kg kg−1) and rain number concentration (contour; 105 kg−1), (d) snow (shading; 10−4 kg kg−1) and snow number concentration (contour; 103 kg−1), and (e) graupel (shading; 10−4 kg kg−1) and graupel number concentration (contour; 103 kg−1) between D1 and CLEAN averaged over R1.
3.4 Ten-fold anthropogenic emissions and chemical ICs and BCs
The PM2.5 concentration (contours) in the 10-fold aerosol emission simulation (10×) increases significantly to approximately 10 times that in CTL, indicating a linear relationship from emissions to aerosol concentration (Fig. S16). The pattern changes in cloud fraction and aerosol concentration in Fig. S16 are similar to that in Fig. 4b, but with a much greater magnitude. The CDNC (shading) increase and cloud effective radius (contour) reduction in Fig. S17a are also more pronounced than those in Fig. 5a. CDNC noticeably decreases below 1.5 km but increases substantially from 1.5 to 4 km before 04:00 Z on 14 December, associating with a smaller radius. On the one hand, smaller cloud droplets below 1.5 km tend to evaporate. On the other hand, more cloud droplets are activated due to aerosol-induced higher supersaturation above. The consumption of water and energy above leads to a further reduction in low cloud (Fig. S18a). The involved latent heat and vertical velocity during the rainfall peak time (from 08:00 Z on 15 December to 10:00 Z on 16 December) in Fig. S17c exhibit a stronger increase associated with a higher altitude above the freezing level than those in Fig. 5c. Besides, a distinct weaker latent heat release associated with a negative vertical velocity anomaly appears below freezing level between 10:00 and 22:00 Z on 15 December. Figure S18 shows the changes in mass and number concentration of different hydrometeors in 10× simulation. The increases in snow and graupel between 10× and CLEAN are much larger than those between CTL and CLEAN, particularly before 15:00 Z on 15 December, indicating a more drastic cold rain in 10×. However, rain water shows a decrease during all the time instead of an increase after 15:00 Z in the CTL run when compared with that in the CLEAN run. This means the warm rain is suppressed much more strongly in the 10× simulation. With 10 times aerosol emissions, the aerosols lower the supersaturation much more strongly by activation to form much smaller cloud droplets. The rain water evaporates rather than increases by accretion of additional cloud droplets, associating with strong condensational cooling in warm cloud (Fig. S19a). Precipitation on 15 December is suppressed up to 39.6 mm over the upstream region of aerosol sources but substantially enhanced up to 59.7 mm over the downstream region near the coastal region (Fig. 11b). The delay of early rain in the upstream area results in more rainfall with a stronger intensity within a more narrowed region in the downstream area. The average precipitation over Guangdong Province on 15 December decreases by 1.0 mm in 10× but increases by 1.4 mm in CTL compared with that in CLEAN. Ten-fold aerosol emissions produce a more polluted environment, with a PM2.5 concentration of approximately 300 µg m−3. Although abundant moisture is transported from the South China Sea (Fig. 1b), the aerosol loading may still surpass the optimal value for convective invigoration and thus suppress precipitation over Guangdong Province. Moreover, aside from suppressing the rainfall amount, excessive aerosols also have the potential to redistribute precipitation and increase its range in spatial distribution.
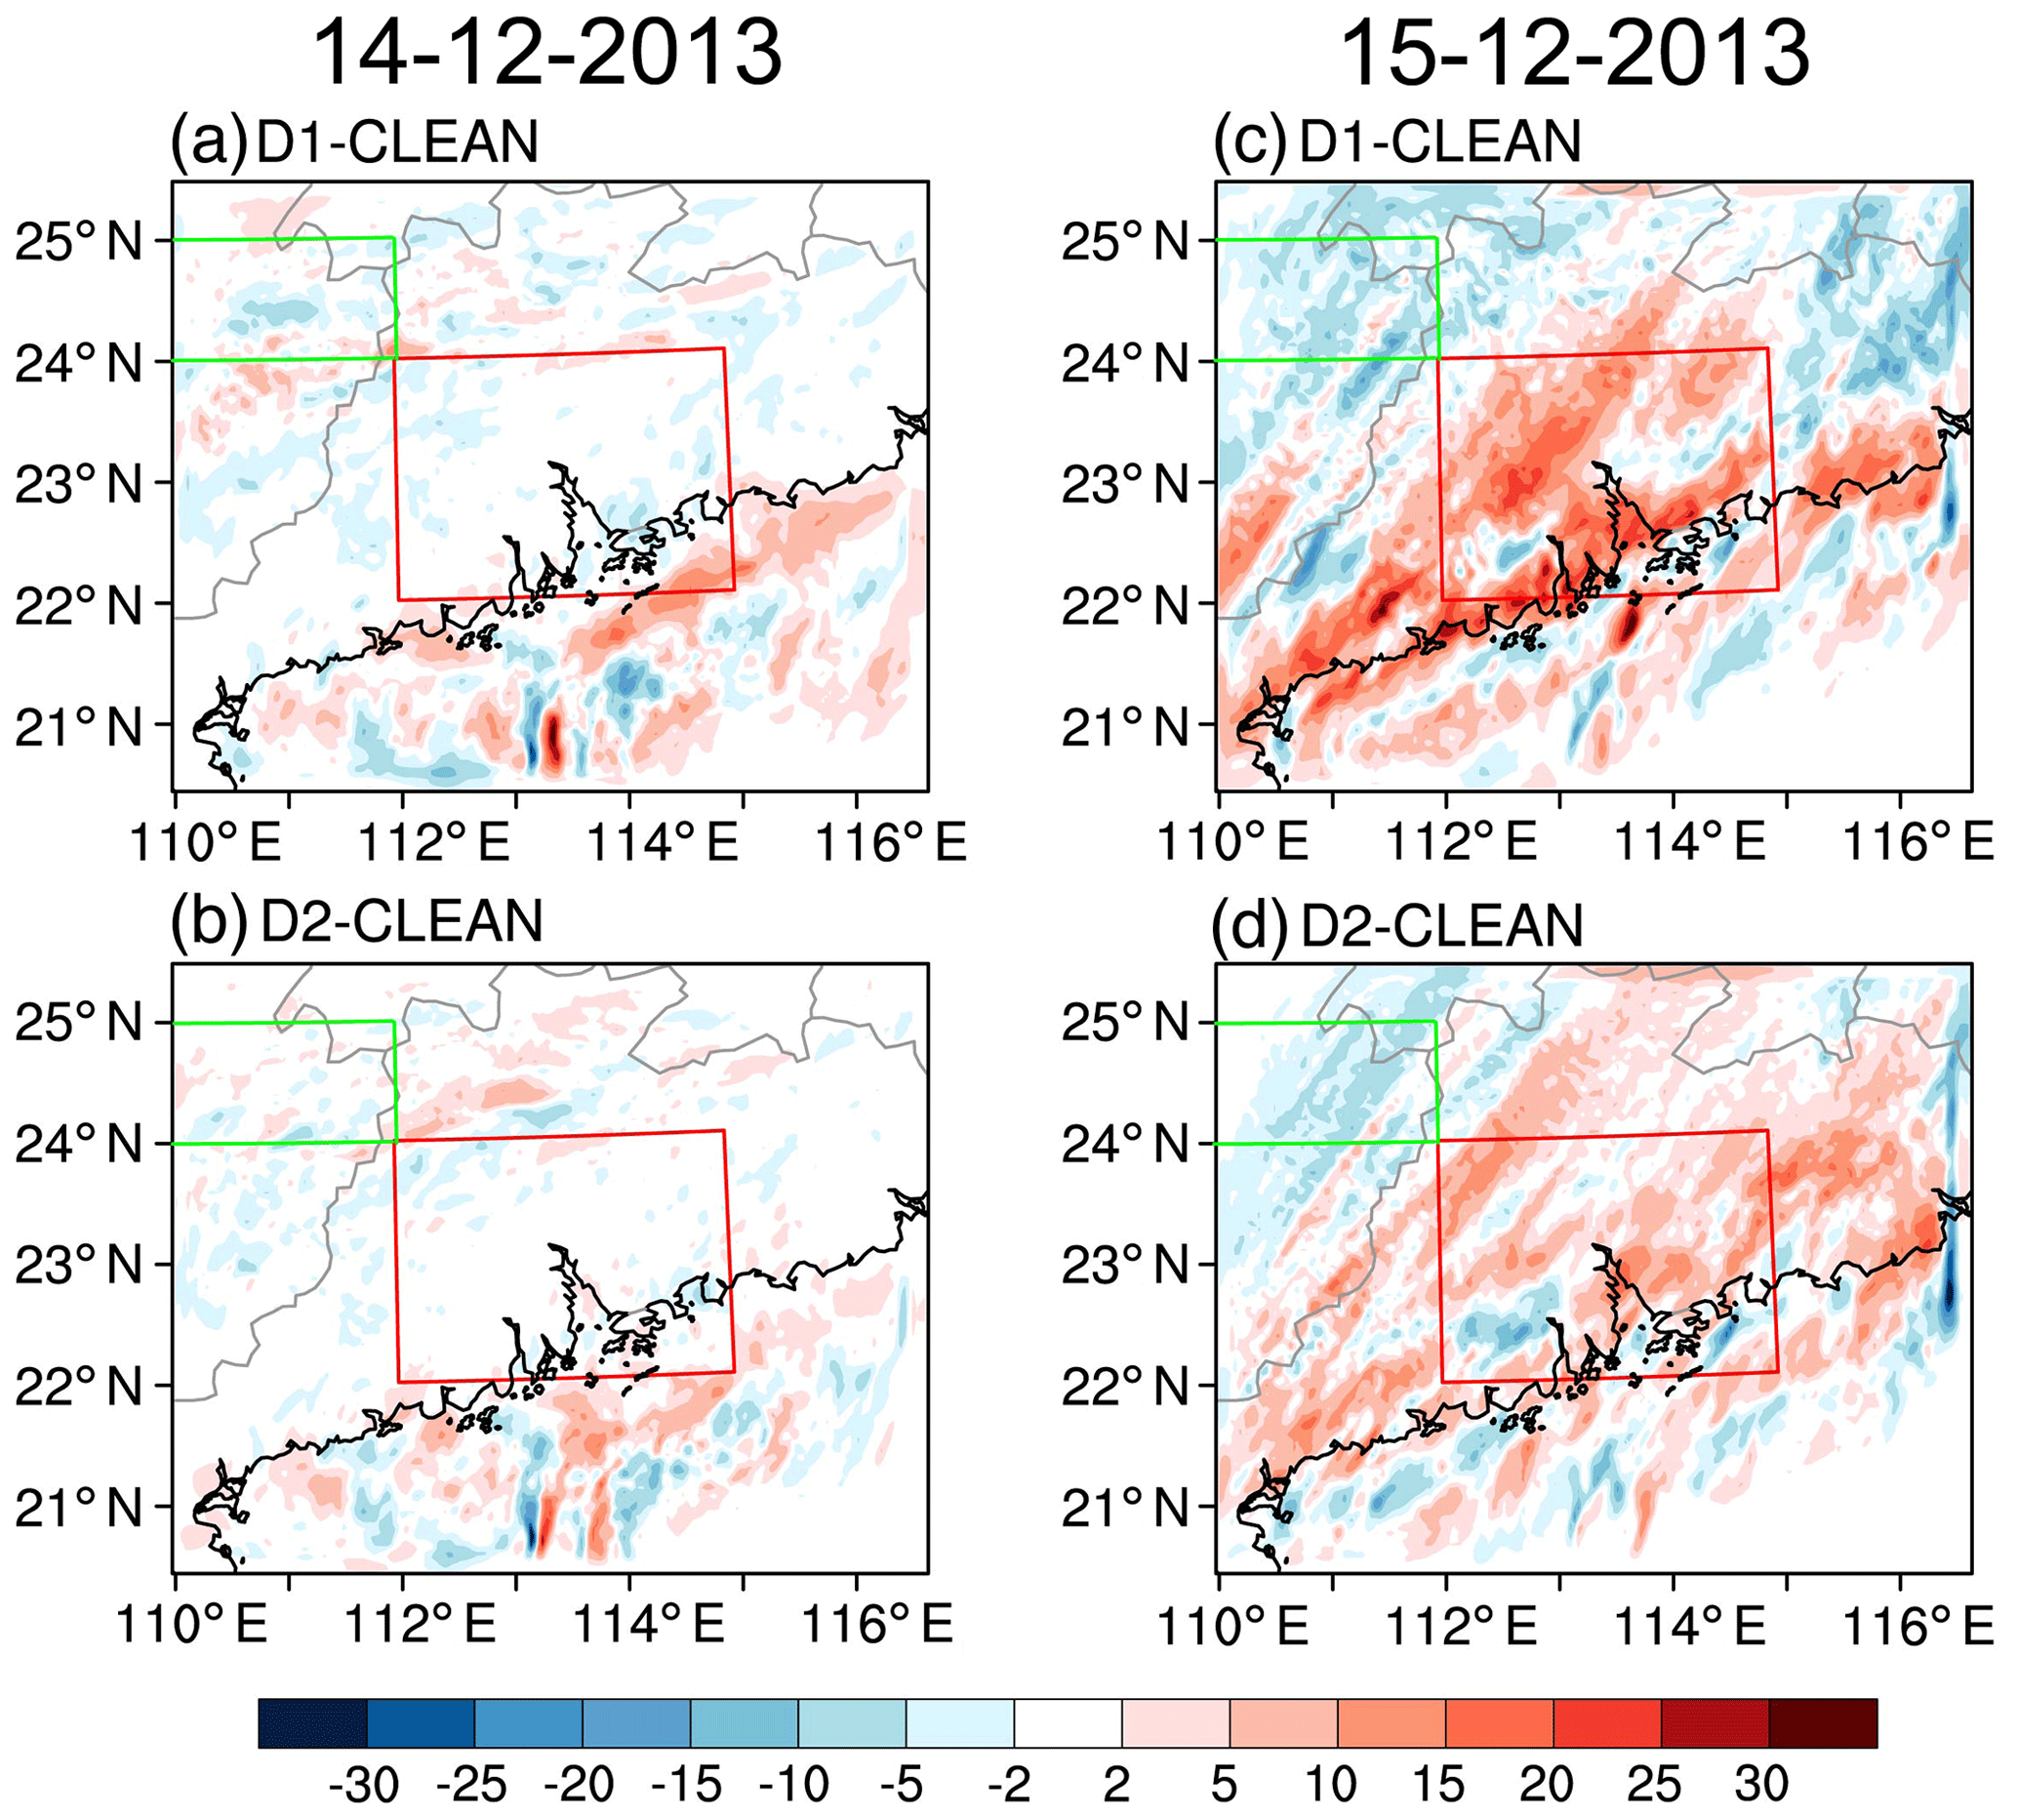
Figure 10Differences in precipitation (mm) between (a) D1 and CLEAN and (b) D2 and CLEAN on 14 December. (c, d) Same as (a, b) but for 15 December.
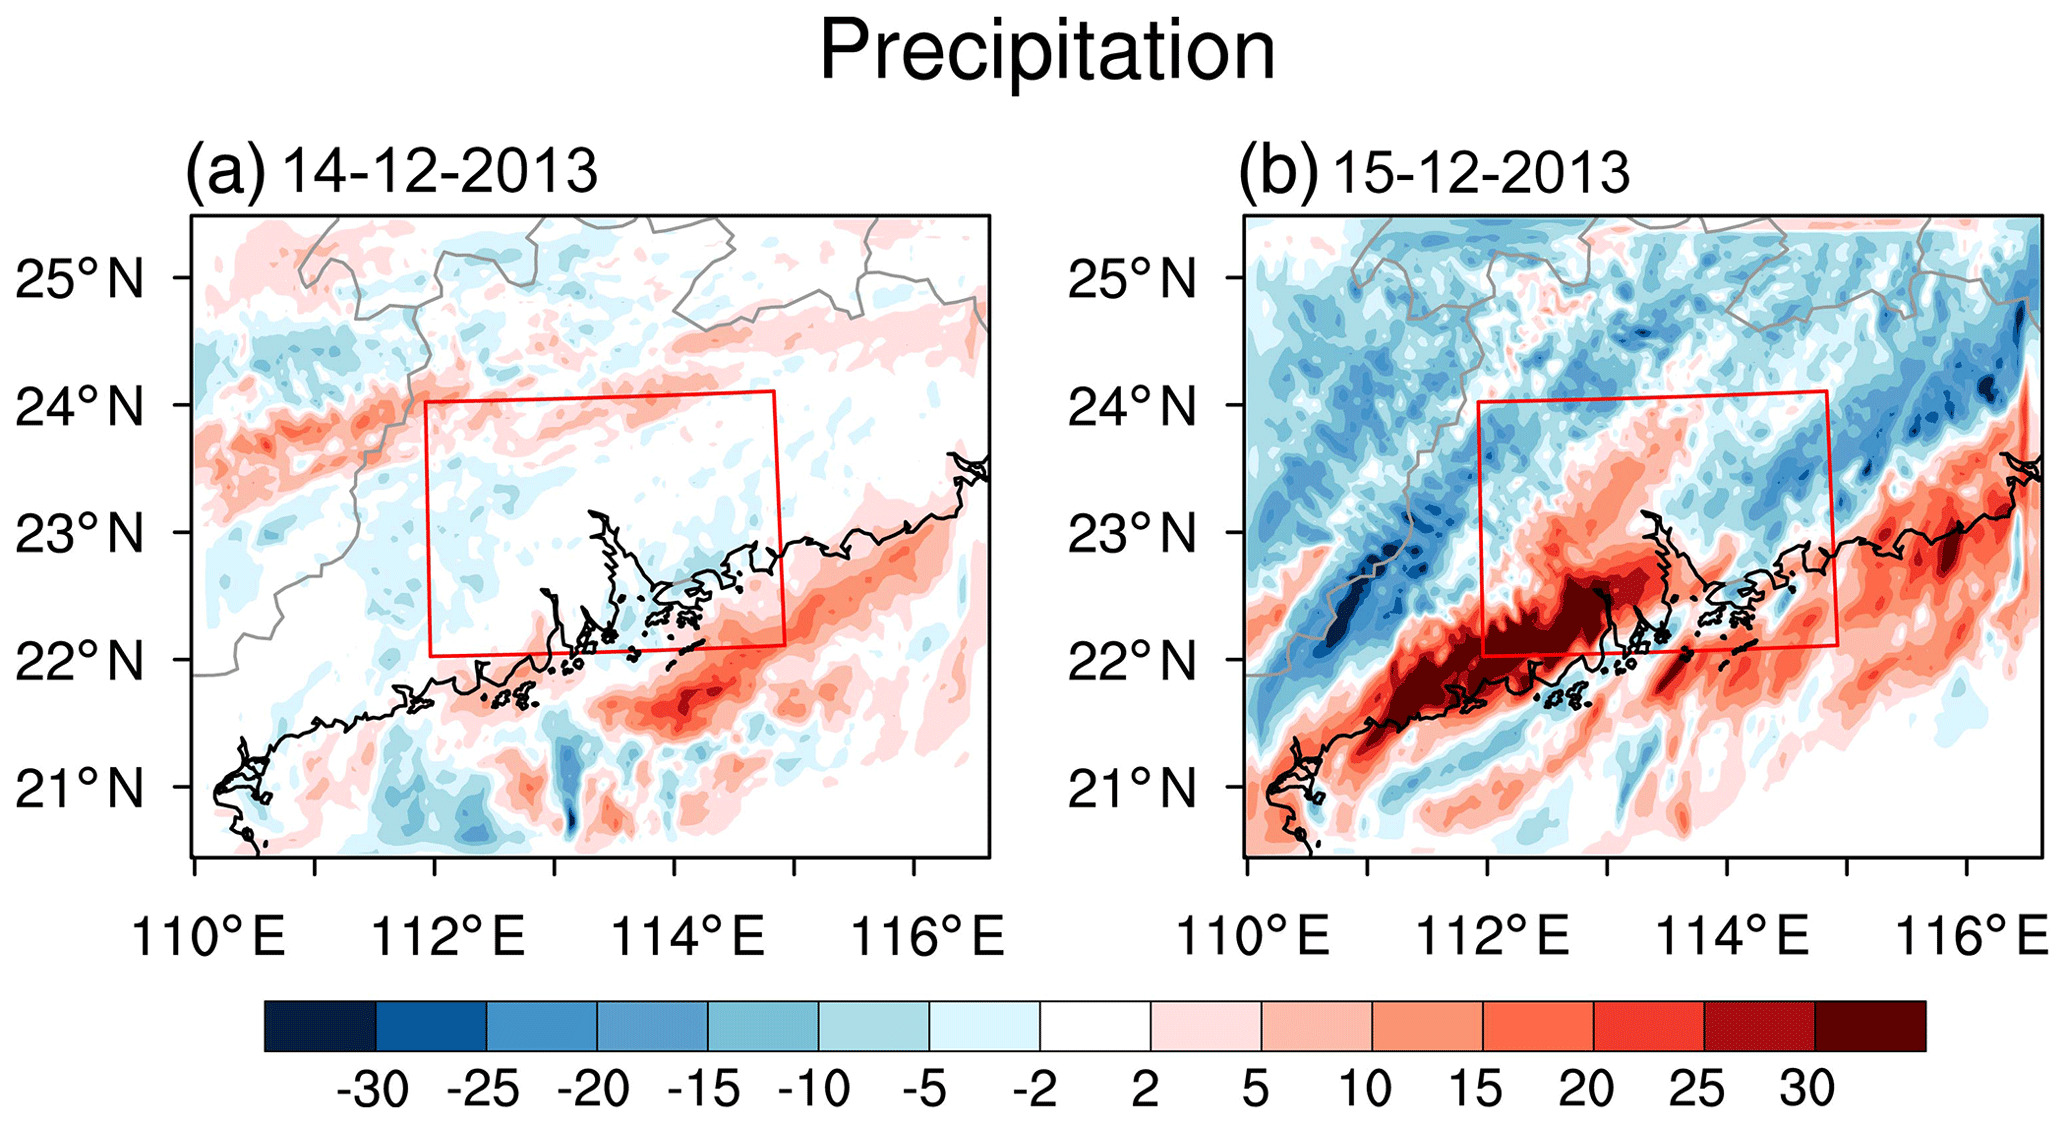
Figure 11Differences in precipitation (mm) between 10× and CLEAN on (a) 14 December and (b) 15 December.
This study finds that aerosols significantly affect local extreme weather (i.e., torrential rainfall), invigorating deep convection, via ACI effects. This invigoration effect by aerosols has been discussed in both observation (Andreae et al., 2004; Koren et al., 2004) and model simulations (Khain et al., 2005; Storer and van den Heever, 2013). Most of these studies focused on mixed and cold processes, which are referred to as cold-phase invigoration. Fan et al. (2018) found that additional nucleation of cloud droplets can release abundant condensational heat below freezing level. More cloud water will form via condensation on the additional cloud droplets. This process will increase both warm rain and supercooled cloud water. Furthermore, the ice-related processes are enhanced, resulting in intensified convection. In response to increased aerosols, the precipitation is enhanced in the warm side between 03:00 Z on 15 December and 10:00 Z on 16 December. CDNC increases remarkably, reducing the size of cloud droplets. Additional cloud water forms with intensified condensational heating, leading to enhanced convection and increased precipitation. However, rain water decreases substantially before 15:00 Z on 15 December, indicating warm rain is suppressed, which is different to Fan et al. (2018). The source of enhanced latent heat release is dominated by deposition in cold cloud associated with an increase in snow and graupel, representing cold rain enhancement. Most snow and graupel fall as precipitation when the peak rainfall occurs after 15:00 Z. By contrast, the warm rain is enhanced, characterized by an increase in rain water associated with condensational heating in warm cloud via accretion of cloud droplets, which is consistent with Fan et al. (2018). The enhanced latent heat boosts the vertical motion, leading to higher supersaturation accompanied by stronger latent heat release. This feedback between microphysical and dynamic processes results in more rainfall (Tao et al., 2007), up to 33.7 mm in our simulation. On average, ACI enhances precipitation over R1, while ARI reduces precipitation, offsetting the precipitation increase through ACI by 14 %. The analysis of the moisture budget suggests that the precipitation increase is caused by strengthening MFC via increased moisture convergence. It is critical to explain why the precipitation increases appear near the Pearl River estuary and along the coast. Khain et al. (2008) found that aerosols generally suppress (invigorate) convection in relatively dry (moist) conditions. Fan et al. (2009) suggested that increased aerosols suppress (invigorate) convection under strong (weak) wind shear. These findings highlight the crucial roles of humidity and wind shear in modulating the convective invigoration effects in response to aerosols. The wind shear is estimated as the difference between the maximum and minimum total wind speeds at 0–10 km. We choose 10 km because the latent heat release, a key factor determining convection intensity and partly depending on wind shear, extends up to approximately 10 km (Fig. 5g). Figure S20 shows the spatial distribution of wind shear and column-integrated water vapor. The wind shear increases with the southeast–northwest tilt ranging from 35 to 80 m s−1. The aerosol-induced convective invigoration effect appears over the region with relatively weak wind shear and high humidity. This invigoration effect under weak wind shear for cloud systems is described in Li et al. (2011).
Aerosol emissions are separated into those from Guangdong Province and those from elsewhere, named experiments D2 and D1, respectively, to represent the effects of aerosol concentration from local and remote emissions on this extreme rainfall event. The surface aerosol concentration from local emissions dilutes quickly with strong northerlies. Instead, aerosols from remote areas are imported persistently, extending to higher altitudes up to 8 km. The aerosol concentration is thus maintained at a relatively high level in the D1, invigorating convection. The resemblance of changes in different hydrometeors and latent heat between D1 and CTL further suggests the dominant role of remote aerosols. Interestingly, with local emissions, the precipitation enhancement is through intensified warm rain only. This is because far fewer aerosols stay in the atmosphere, with only local aerosol emissions once the rainfall is initiated. The effect of nucleated cloud droplets on reducing supersaturation and size of droplets is much weaker. Thus, the rain water is increased by accretion of cloud droplets, enhancing the warm rain. The precipitation averaged over R1 on 15 December increases by 7.3 mm from the effects of remote aerosol emissions but only 3.1 mm from local aerosol emissions. These results imply the potential influence of remote aerosol emissions on extreme synoptic weather events. However, this crucial issue remains insufficiently explored.
A 10-fold emission experiment shows a similar pattern with CTL but with a much stronger signal. Our further analysis of hydrometeors and latent heat reveals that the main reason for the precipitation increase is the intensified cold rain. The warm rain is suppressed almost all the time. Excessive aerosols lead to more precipitation increases, up to 59.7 mm, which are much larger than the 33.7 mm from CTL. However, the precipitation increase is limited to a more narrowed region along the coast in the downwind area. As discussed above, the average precipitation over Guangdong Province shows a decrease in CTL but an increase in CTL when compared with that in CLEAN. These opposite changes indicate that aerosol concentration in 10× exceeds the optimal aerosol loading for convective invigoration and thus suppresses the rainfall amount instead.
The effect of ACI on clouds is strongly regime based (Gryspeerdt and Stier, 2012). The mechanism of the precipitation reduction over R2 (cold sector) is also discussed. Figure S21 shows the distribution of time–height mass and number concentration of different hydrometeors from the CTL run. There are lots of ice particles extending up to 16 km, indicating deep stratiform clouds, which is consistent with low cloud top temperature in Fig. S1b. The cloud base is higher than that over R1, characterized by smaller low-level cloud water on 15 December when strong aerosol impact occurs. This can also be suggested from low convective available potential energy (not shown) and surface temperature (Fig. S3). With aerosols, more cloud droplets nucleate on which water can condensate. Additional cloud water is subsequently formed near to 4 km (Fig. S22a), accompanied by reduced supersaturation. The reduction in rain water and graupel suggests that both the warm rain and cold rain are suppressed, associated with less condensational and depositional heat release, respectively (Fig. S23). The typical response of deep stratiform clouds to aerosols is via collision processes (Fan et al., 2016). Before 06:00 Z on 15 December, the warm rain is inhabited because of slower autoconversion which is caused by smaller cloud droplets. The riming efficiency is weakened in the later time, resulting in less graupel and suppressed precipitation. With 10 times the aerosol emissions, the mass and number of rain water and graupel are further reduced, accompanied by a weaker latent heat release (Figs. S24 and S25). As a result, the precipitation is further suppressed (Fig. 11).
One may wonder whether the precipitation differences over Guangdong are driven by meteorological field changes in domain 1 or by transport of aerosols because the atmospheric conditions of domain 1 also change in response to increased aerosols. The changes in meteorology in turn may affect the precipitation. Figure S26 shows the aerosol effects on 2 m temperature and column water vapor in domain 1. With aerosols, the moisture change is small over the whole of China. The surface temperature decreases up to about 1 K are seen over northeastern China, Sichuan, and the northeastern Indo-China Peninsula. However, the temperature over Guangdong Province shows marginal changes as the aerosol is concentrated to the north of Guangdong and incident solar radiation is weak on rainy days. The relatively small changes in meteorological fields over Guangdong may indicate a dominant role of transboundary aerosols. Figure S27 shows the precipitation differences over Guangdong on 15 December based on domain 1 output. The pattern of precipitation changes is very different from that calculated based on domain 2 output, suggesting that the atmospheric condition changes in domain 1 cannot account for the precipitation differences in Fig. 3d. Moreover, the importance of ACI discussed above works for both the D1 and D2 experiments, which may further confirm the precipitation changes are driven by transboundary aerosols rather than changes in meteorology in domain 1. Note the cumulus scheme is used in domain 1 but not in domain 2, which may result in a different response of precipitation to atmospheric circulation changes in domain 1. To completely disentangle the meteorology impact from that of transboundary aerosols, the possible solution could be to apply nudging to constrain the meteorology in the same way as CTL and scale the emissions in domain 1. This could be conducted in future sensitivity studies.
We note that uncertainties exist in aerosol emission and the representation of ACI. Although ice nucleation may have little effect on the spatial distribution and temporal evolution of surface precipitation (Deng et al., 2018), this factor is not yet considered in the WRF-Chem model. This may explain negligible differences in results between simulations with and without dust and sea salt emissions. Additionally, dust sources are far from our analysis region and the prevailing wind is northerly; these produce low dust and sea salt concentrations, respectively. It is noteworthy that we assume the ARI and ACI effects are linear additive as in previous studies (Fan et al., 2015; Zhong et al., 2015), so that the ACI effect is derived by subtracting ARI from total aerosol effects. To check the nonlinearity between ARI and ACI effects is difficult by turning off the ACI effect. The problem is how to set the background concentration of the cloud droplet number while keeping the ARI the same as in the control run. This means that we could only prescribe the CDNC rather than adjust the emission or aerosol concentration. However, the ACI effect is very sensitive to the number we set (Gustafson et al., 2007). Our findings are limited to a case study; nevertheless, this case is representative of the remarkable aerosol effect on an extreme rainfall event through ACI (both convective and stratiform clouds). This finding provides more evidence of the importance of considering aerosols in extreme weather forecasting (i.e., torrential rainfall). More importantly, aerosols from remote emission sources exhibit the potential to modify extreme weather through transboundary air pollution. It pinpoints that we need to be careful about the spatial scale when looking at the effect of aerosols on extreme weather events. Aerosols substantially redistribute the rainfall amount, with crucial implications for the availability and usability of water resources in different regions of the world (Li et al., 2011). High aerosol concentration may therefore intensify both flood and drought by invigorating convection.
All model data can be accessed upon request. The model data cannot be deposited online because of their larger volume.
The supplement related to this article is available online at: https://doi.org/10.5194/acp-20-223-2020-supplement.
SHLY planned, supervised and sought funding for this study. ZL conducted the study and drafted the manuscript with SHLY. Other co-authors provided comments on the results and the manuscript.
The authors declare that they have no conflict of interest.
We thank the two anonymous reviewers whose insightful comments led to a significant improvement of the manuscript. Model simulations were conducted on computer clusters at the Geophysical Fluid Dynamics Laboratory (GFDL). We acknowledge Larry Horowitz, and Maofeng Liu provided helpful comments.
This research has been jointly supported by the Early Career Scheme of Research Grants Council of Hong Kong (grant no. ECS-24301415), the National Key Basic Research Program of China (grant no. 2015CB954103), the Ministry of Science and Technology of China (grant no. 2017YFC1501401), the Improvement on Competitiveness in Hiring New Faculties Fund (2013/2014) of the Chinese University of Hong Kong (grant no. 4930059), and the Vice-Chancellor's Discretionary Fund of the Chinese University of Hong Kong (grant no. 4930744). The appointment of Ngar Cheung Lau at the CUHK is supported by the AXA Research Fund. We would also like to acknowledge the Met Office Climate Science for Service Partnership China as part of the Newton Fund for supporting Zhen Liu and Massimo Bollasina in the paper revision effort. Chun Zhao is supported by the Thousand Talents Plan for Young Professionals, the Fundamental Research Funds for the Central Universities, and the National Natural Science Foundation of China (grant no. 41775146). We acknowledge the Global Scholarship Program for Research Excellence 2017–18 at the CUHK for supporting Zhen Liu's exchange visit to Princeton University.
This paper was edited by Johannes Quaas and reviewed by two anonymous referees.
Andreae, M. O., Rosenfeld, D., Artaxo, P., Costa, A. A., Frank, G. P., Longo, K. M., and Silva-Dias, M. A. F.: Smoking rain clouds over the Amazon, Science, 303, 1337–1342, https://doi.org/10.1126/science.1092779, 2004.
Banacos, P. C. and Schultz, D. M.: The use of moisture flux convergence in forecasting convective initiation: historical and operational perspectives, Weather Forecast., 20, 351–366, https://doi.org/10.1175/WAF858.1, 2005.
Bell, T. L., Rosenfeld, D., Kim, K. M., Yoo, J. M., Lee, M. I., and Hahnenberger, M.: Midweek increase in U.S. summer rain and storm heights suggests air pollution invigorates rainstorms, J. Geophys. Res., 113, D02209, https://doi.org/10.1029/2007JD008623, 2008.
Bollasina, M. A., Ming, Y., and Ramaswamy, V.: Anthropogenic aerosols and the weakening of the South Asian summer monsoon, Science, 334, 502–505, https://doi.org/10.1126/science.1204994, 2011.
Bollasina, M. A., Ming, Y., Ramaswamy, V., Schwarzkopf, M. D., and Naik, V.: Contribution of local and remote anthropogenic aerosols to the twentieth century weakening of the South Asian Monsoon, Geophys. Res. Lett., 41, 680–687, https://doi.org/10.1002/2013GL058183, 2014.
Chang, C.-P., Wang, Z., and Hendon, H.: The Asian winter monsoon, The Asian Monsoon, edited by: Wang, B., Springer, 89–127, 2006.
Chang, W., Zhan, J., Zhang, Y., Li, Z., Xing, J., and Li, J.: Emission-driven changes in anthropogenic aerosol concentrations in China during 1970–2010 and its implications for PM2.5 control policy, Atmos. Res., 212, 106–119, https://doi.org/10.1016/j.atmosres.2018.05.008, 2018.
Chen, T., Guo, J., Li, Z., Zhao, C., Liu, H., Cribb, M., Wang, F., and He, J.: A CloudSat perspective on the cloud climatology and its association with aerosol perturbations in the vertical over Eastern China, J. Atmos. Sci., 73, 3599–3616, https://doi.org/10.1175/JAS-D-15-0309.1, 2016.
Chen, X. C., Jahn, H. J., Engling, G., Ward, T. J., Kraemer, A., Ho, K. F., Yim, S. H. L., and Chan, C. Y.: Chemical characterization and sources of personal exposure to fine particulate matter (PM2.5) in the megacity of Guangzhou, China, Environ. Pollut., 231, 871–881, 2017.
Cohen, A. J., Brauer, M., Burnett, R., Ross Anderson, H., Frostad, J., Estep, K., Balakrishnan, K., Brunekreef, B., Dandona, L., Dandona, R., Feigin, V., Freedman, G., Hubbell, B., Jobling, A., Kan, H., Knibbs, L., Liu, Y., Martin, R., Morawska, L., Pope III, C. A., Shin, H., Straif, K., Shaddick, G., Thomas, M., van Dingenen, R., van Donkelaar, A., Vos, T., Murray, C. J. L., and Forouzanfar, M. H.: Estimates and 25-year trends of the global burden of disease attributable to ambient air pollution: an analysis of data from the Global Burden of Diseases Study, The Lancet, 389, 1907–1918, 2015.
Cowan, T. and Cai, W.: The impact of Asian and non-Asian anthropogenic aerosols on 20th century Asian summer monsoon, Geophys. Res. Lett., 38, L11703, https://doi.org/10.1029/2011GL047268, 2011.
Cui, Z. Q., Carslaw, K. S., Yin, Y., and Davies, S.: A numerical study of aerosol effects on the dynamics and microphysics of a deep convective cloud in a continental environment, J. Geophys. Res., 111, D05201, https://doi.org/10.1029/2005JD005981, 2006.
Dee, D. P., Uppala, S. M., Simmons, A. J., Berrisford, P., Poli, P., Kobayashi, S., Andrae, U., Balmaseda, M. A., Balsamo, G., Bauer, P., Bechtold, P., Beljaars, A. C., van de Berg, L., Bidlot, J., Bormann, N., Delsol, C., Dragani, R., Fuentes, M., Geer, A. J., Haimberger, L., Healy, S. B., Hersbach, H., Hólm, E. V., Isaksen, L., Kållberg, P., Köhler, M., Matricardi, M., McNally, A. P., Monge-Sanz, B. M., Morcrette, J., Park, B., Peubey, C., de Rosnay, P., Tavolato, C., Thépaut, J., and Vitart, F.: The ERA-Interim reanalysis: Configuration and performance of the data assimilation system, Q. J. Roy. Meteor. Soc., 137, 553–597, https://doi.org/10.1002/qj.828, 2011.
Deng, W. J., Wu, N. G., Lin, L. X., and Zhang, H. L.: Causal analysis of an unusual continuous torrential rainfall event in Guangdong in the winter of 2013, Meteorological Science and Technology, 43, 276–282, https://doi.org/10.19517/j.1671-6345.2015.02.019, 2015.
Deng, X., Xue, H., and Meng, Z.: The effect of ice nuclei on a deep convective cloud in South China, Atmos. Res., 206, 1–12, https://doi.org/10.1016/j.atmosres.2018.02.013, 2018.
Ding, A., Wang, T., Xue, L., Gao, J., Stohl, A., Lei, H., Jin, D., Ren, Y., Wang, X., Wei, X., Qi, Y., Liu, J., and Zhang, X.: Transport of north China air pollution by midlatitude cyclones: Case study of aircraft measurements in summer 2007, J. Geophys. Res., 114, D08304, https://doi.org/10.1029/2008JD011023, 2009.
Ding, A. J., Fu, C. B., Yang, X. Q., Sun, J. N., Petäjä, T., Kerminen, V.-M., Wang, T., Xie, Y., Herrmann, E., Zheng, L. F., Nie, W., Liu, Q., Wei, X. L., and Kulmala, M.: Intense atmospheric pollution modifies weather: a case of mixed biomass burning with fossil fuel combustion pollution in eastern China, Atmos. Chem. Phys., 13, 10545–10554, https://doi.org/10.5194/acp-13-10545-2013, 2013.
Dutot, A. L., Rynkiewicz, J., Steiner, F. E., and Rude, J.: A 24-h forecast of ozone peaks and exceedance levels using neural classifiers and weather predictions, Environ. Model. Softw., 22, 1261–1269, https://doi.org/10.1016/j.envsoft.2006.08.002, 2007.
Emmons, L. K., Walters, S., Hess, P. G., Lamarque, J.-F., Pfister, G. G., Fillmore, D., Granier, C., Guenther, A., Kinnison, D., Laepple, T., Orlando, J., Tie, X., Tyndall, G., Wiedinmyer, C., Baughcum, S. L., and Kloster, S.: Description and evaluation of the Model for Ozone and Related chemical Tracers, version 4 (MOZART-4), Geosci. Model Dev., 3, 43–67, https://doi.org/10.5194/gmd-3-43-2010, 2010.
Fan, J., Zhang, R., Li, G., and Tao, W. K.: Effects of aerosols and relative humidity on cumulus clouds, J. Geophys. Res., 112, D14204, https://doi.org/10.1029/2006JD008136, 2007.
Fan, J., Zhang, R., Tao, W.-K., and Mohr, K. I.: Effects of aerosol optical properties on deep convective clouds and radiative forcing, J. Geophys. Res., 113, D08209, https://doi.org/10.1029/2007JD009257, 2008.
Fan, J., Yuan, T., Comstock, J. M., Ghan, S., Khain, A., Leung, L. R., Li, Z., Martins, V. J., and Ovchinnikov, M.: Dominant role by vertical wind shear in regulating aerosol effects on deep convective clouds, J. Geophys. Res., 114, D22206, https://doi.org/10.1029/2009JD012352, 2009.
Fan, J., Rosenfeld, D., Ding, Y., Leung, L. R., and Li, Z.: Potential aerosol indirect effects on atmospheric circulation and radiative forcing through deep convection, Geophys. Res. Lett., 39, L09806, https://doi.org/10.1029/2012GL051851, 2012.
Fan, J., Leung, L. R., Rosenfeld, D., Chen, Q., Li, Z., Zhang, J., and Yan, H.: Microphysical effects determine macrophysical response for aerosol impacts on deep convective clouds, P. Natl. Acad. Sci. USA, 110, E4581–E4590, https://doi.org/10.1073/pnas.1316830110, 2013.
Fan, J., Rosenfeld, D., Yang, Y., Zhao, C., Leung, L. R., and Li, Z.: Substantial contribution of anthropogenic air pollution to catastrophic floods in Southwest China, Geophys. Res. Lett., 42, 6066–6075, https://doi.org/10.1002/2015GL064479, 2015.
Fan, J., Wang, Y., Rosenfeld, D., and Liu, X.: Review of Aerosol–Cloud Interactions: Mechanisms, Significance, and Challenges, J. Atmos. Sci., 73, 4221–4252, https://doi.org/10.1175/JAS-D-16-0037.1, 2016.
Fan, J., Rosenfeld, D., Zhang, Y., Giangrande, S. E., Li, Z., Machado, L. A. T., Martin, S. T., Yang, Y., Wang, J., Artaxo, P., Barbosa, H. M. J., Braga, R. C., Comstock, J. M., Feng, Z., Gao, W., Gomes, H. B., Mei, F., Pöhlker, C., Pöhlker, M. L., Pöschl, U., and de Souza, R. A. F.: Substantial convection and precipitation enhancements by ultrafine aerosol particles, Science, 359, 411–418, https://doi.org/10.1126/science.aan8461, 2018.
Fu, G., Yu, J., Yu, X., Ouyang, R., Zhang, Y., Wang, P., Liu, W., and Min, L.: Temporal variation of extreme rainfall events in China, 1961–2009, J. Hydrol., 487, 48–59, https://doi.org/10.1016/j.jhydrol.2013.02.021, 2013.
Grell, G., Freitas, S. R., Stuefer, M., and Fast, J.: Inclusion of biomass burning in WRF-Chem: impact of wildfires on weather forecasts, Atmos. Chem. Phys., 11, 5289–5303, https://doi.org/10.5194/acp-11-5289-2011, 2011.
Grell, G. A., Peckham, S. E., Schmitz, R., McKeen, S. A., Frost, G., Skamarock, W. C., and Eder, B.: Fully coupled “online” chemistry within the WRF model, Atmos. Environ., 39, 6957–6975, https://doi.org/10.1016/j.atmosenv.2005.04.027, 2005.
Gryspeerdt, E. and Stier, P.: Regime-based analysis of aerosol-cloud interactions, Geophys. Res. Lett., 39, L21802, https://doi.org/10.1029/2012GL053221, 2012.
Gu, Y. and Yim, S. H. L.: The air quality and health impacts of domestic trans-boundary pollution in various regions of China, Environ. Int., 97, 117–124, https://doi.org/10.1016/j.envint.2016.08.004, 2016.
Guo, J., Lou, M., Miao, Y., Wang, Y., Zeng, Z., Liu, H., He, J., Xu, H., Wang, F., Min, M., and Zhai, P.: Trans-Pacific transport of dust aerosol originated from East Asia: Insights gained from multiple observations and modeling, Environ. Pollut., 230, 1030–1039, https://doi.org/10.1016/j.envpol.2017.07.062, 2017.
Guo, L., Turner, A. G., and Highwood, E. J.: Local and remote impacts of aerosol species on indian summer monsoon rainfall in a GCM, J. Climate, 29, 6937–6955, https://doi.org/10.1175/JCLI-D-15-0728.1, 2016.
Gustafson, W. I., Chapman, E. G., Ghan, S. J., Easter, R. C., and Fast, J. D.: Impact on modeled cloud characteristics due to simplified treatment of uniform cloud condensation nuclei during NEAQS 2004, Geophys. Res. Lett., 34, L19809, https://doi.org/10.1029/2007GL030021, 2007.
He, K., Huo, H., and Zhang, Q.: Urban air pollution in China: Current status, characteristics, and progress, Annu. Rev. Energ. Env., 27, 397–431, https://doi.org/10.1146/annurev.energy.27.122001.083421, 2002.
Hong, S.-Y., Juang, H.-M. H., Zhao, Q., Hong, S.-Y., Juang, H.-M. H., and Zhao, Q.: Implementation of Prognostic Cloud Scheme for a Regional Spectral Model, Mon. Weather Rev., 126, 2621–2639, https://doi.org/10.1175/1520-0493(1998)126<2621:IOPCSF>2.0.CO;2, 1998.
Hu, Z., Zhao, C., Huang, J., Leung, L. R., Qian, Y., Yu, H., Huang, L., and Kalashnikova, O. V.: Trans-Pacific transport and evolution of aerosols: evaluation of quasi-global WRF-Chem simulation with multiple observations, Geosci. Model Dev., 9, 1725–1746, https://doi.org/10.5194/gmd-9-1725-2016, 2016.
Ilotoviz, E., Khain, A. P., Benmoshe, N., Phillips, V. T. J., and Ryzhkov, A. V.: Effect of Aerosols on Freezing Drops, Hail, and Precipitation in a Midlatitude Storm, J. Atmos. Sci., 73, 109–144, https://doi.org/10.1175/JAS-D-14-0155.1, 2016.
IPCC: Climate Change 2013: The physical science basis. Contribution of working Group I to the fifth assessment report of the Intergovernmental Panel on Climate Change, edited by: Stocker, T. F., Qin, D., Plattner, G.-K., Tignor, M., Allen, S. K., Boschung, J., Nauels, A., Xia, Y., Bex, V., and Midgley, P. M., Cambridge University Press, Cambridge, United Kingdom and New York, NY, USA, 1535 pp., https://doi.org/10.1017/CBO9781107415324, 2013.
Janssens-Maenhout, G., Crippa, M., Guizzardi, D., Dentener, F., Muntean, M., Pouliot, G., Keating, T., Zhang, Q., Kurokawa, J., Wankmüller, R., Denier van der Gon, H., Kuenen, J. J. P., Klimont, Z., Frost, G., Darras, S., Koffi, B., and Li, M.: HTAP_v2.2: a mosaic of regional and global emission grid maps for 2008 and 2010 to study hemispheric transport of air pollution, Atmos. Chem. Phys., 15, 11411–11432, https://doi.org/10.5194/acp-15-11411-2015, 2015.
Jiang, J. H., Su, H., Huang, L., Wang, Y., Massie, S., Zhao, B., Omar, A., and Wang, Z.: Contrasting effects on deep convective clouds by different types of aerosols, Nat. Commun., 9, 3874, https://doi.org/10.1038/s41467-018-06280-4, 2018.
Jiang, Q., Li, W., Wen, J., Qiu, C., Sun, W., Fang, Q., Xu, M., and Tan, J.: Accuracy evaluation of two high-resolution satellite-based rainfall products: TRMM 3B42V7 and CMORPH in Shanghai, Water, 10, 40, https://doi.org/10.3390/w10010040, 2018.
Jin, Q., Yang, Z. L., and Wei, J.: Seasonal responses of Indian summer monsoon to dust aerosols in the middle East, India, and China, J. Climate, 29, 6329–6349, https://doi.org/10.1175/JCLI-D-15-0622.1, 2016.
Joyce, R. J., Janowiak, J. E., Arkin, P. A., and Xie, P.: CMORPH: A method that produces global precipitation estimates from passive microwave and infrared data at high spatial and temporal resolution, J. Hydrometeorol., 5, 487–503, https://doi.org/10.1175/1525-7541(2004)005<0487:CAMTPG>2.0.CO;2, 2004.
Khain, A., Rosenfeld, D., and Pokrovsky, A.: Aerosol impact on the dynamics and microphysics of deep convective clouds, Q. J. Roy. Meteor. Soc., 131, 2639–2663, https://doi.org/10.1256/qj.04.62, 2005.
Khain, A. P.: Notes on state-of-the-art investigations of aerosol effects on precipitation: A critical review, Environ. Res. Lett., 4, 015004, https://doi.org/10.1088/1748-9326/4/1/015004, 2009.
Khain, A. P., BenMoshe, N., and Pokrovsky, A.: Factors determining the impact of aerosols on surface precipitation from clouds: An attempt at classification, J. Atmos. Sci., 65, 1721–1748, https://doi.org/10.1175/2007JAS2515.1, 2008.
Khairoutdinov, M. and Kogan, Y.: A new cloud physics parameterization in a large-eddy simulation model of marine stratocumulus, Mon. Weather Rev., 128, 229–243, https://doi.org/10.1175/1520-0493(2000)128<0229:ancppi>2.0.co;2, 2000.
Koren, I., Kaufman, Y. J., Remer, L. A., and Martins, J. V.: Measurement of the effect of amazon smoke on inhibition of cloud formation, Science, 303, 1342–1345, https://doi.org/10.1126/science.1089424, 2004.
Koren, I., Vanderlei Martins, J., Remer, L. A., and Afargan, H.: Smoke invigoration versus inhibition of clouds over the amazon, Science, 321, 946–949, https://doi.org/10.1126/science.1159185, 2008.
Koren, I., Feingold, G., and Remer, L. A.: The invigoration of deep convective clouds over the Atlantic: aerosol effect, meteorology or retrieval artifact?, Atmos. Chem. Phys., 10, 8855–8872, https://doi.org/10.5194/acp-10-8855-2010, 2010.
Koren, I., Dagan, G., and Altaratz, O.: From aerosol-limited to invigoration of warm convective clouds, Science, 344, 1143–1146, https://doi.org/10.1126/science.1252595, 2014.
Koren, I., Altaratz, O., and Dagan, G.: Aerosol effect on the mobility of cloud droplets, Environ. Res. Lett., 10, 104011, https://doi.org/10.1088/1748-9326/10/10/104011, 2015.
Lau, K. M. and Kim, K. M.: Observational relationships between aerosol and Asian monsoon rainfall, and circulation, Geophys. Res. Lett., 33, L21810, https://doi.org/10.1029/2006GL027546, 2006.
Lee, S. S., Donner, L. J., Phillips, V. T. J., and Ming, Y.: The dependence of aerosol effect on clouds and precipitation on cloud-system organization, shear and stability, J. Geophys. Res., 113, D16202, https://doi.org/10.1029/2007JD009224, 2008.
Li, Z., Niu, F., Fan, J., Liu, Y., Rosenfeld, D., and Ding, Y.: Long-term impacts of aerosols on the vertical development of clouds and precipitation, Nat. Geosci., 4, 888–894, https://doi.org/10.1038/ngeo1313, 2011.
Li, Z., Lau, W. K.-M., Ramanathan, V., Wu, G., Ding, Y., Manoj, M. G., Liu, J., Qian, Y., Li, J., Zhou, T., Fan, J., Rosenfeld, D., Ming, Y., Wang, Y., Huang, J., Wang, B., Xu, X., Lee, S.-S., Cribb, M., Zhang, F., Yang, X., Zhao, C., Takemura, T., Wang, K., Xia, X., Yin, Y., Zhang, H., Guo, J., Zhai, P. M., Sugimoto, N., Babu, S. S., and Brasseur, G. P.: Aerosol and monsoon climate interactions over Asia, Rev. Geophys., 54, 866–929, https://doi.org/10.1002/2015RG000500, 2016.
Lin, Y., Wang, Y., Pan, B., Hu, J., Liu, Y., and Zhang, R.: Distinct Impacts of Aerosols on an Evolving Continental Cloud Complex during the RACORO Field Campaign, J. Atmos. Sci., 73, 3681–3700, https://doi.org/10.1175/JAS-D-15-0361.1, 2016.
Liu, H., Jacob, D. J., Bey, I., and Yantosca, R. M.: Constraints from 210Pb and 7Be on wet deposition and transport in a global three-dimensional chemical tracer model driven by assimilated meteorological fields, J. Geophys. Res., 106, 12109–12128, https://doi.org/10.1029/2000JD900839, 2001.
Liu, H., Guo, J., Koren, I., Altaratz, O., Dagan, G., Wang, Y., Jiang, J. H., Zhai, P., and Yung, Y.: Non-monotonic aerosol effect on precipitation in convective clouds over tropical oceans, Scientific Reports, 9, 7809, https://doi.org/10.1038/s41598-019-44284-2, 2019.
Liu, L., Guo, J., Gong, H., Li, Z., Chen, W., Wu, R., Wu, L., Wang, L., Xu, H., Li, J., Chen, D., and Zhai, P.: Contrasting influence of Gobi and Taklimakan deserts on the dust aerosols in western North America, Geophys. Res. Lett., 46, 9064–9071, https://doi.org/10.1029/2019GL083508, 2019.
Liu, Z., Yim, S. H. L., Wang, C., and Lau, N. C.: The impact of the aerosol direct radiative forcing on deep convection and air quality in the Pearl River Delta Region, Geophys. Res. Lett., 45, 4410–4418, https://doi.org/10.1029/2018GL077517, 2018.
Liu, Z., Ming, Y., Wang, L., Bollasina, M. A., Luo, M., Lau, N. C., and Yim, S. H. L.: A model investigation of aerosol-induced changes in the East Asian winter monsoon, Geophys. Res. Lett., 46, 10186–10195, https://doi.org/10.1029/2019GL084228, 2019.
Madronich, S.: Photodissociation in the atmosphere: 1. Actinic flux and the effects of ground reflections and clouds, J. Geophys. Res., 92, 9740, https://doi.org/10.1029/JD092iD08p09740, 1987.
Otte, T. L., Pouliot, G., Pleim, J. E., Young, J. O., Schere, K. L., Wong, D. C., Lee, P. C. S., Tsidulko, M., McQueen, J. T., Davidson, P., Mathur, R., Chuang, H.-Y., DiMego, G., and Seaman, N. L.: Linking the eta model with the community multiscale air quality (CMAQ) modeling system to build a national air quality forecasting system, Weather Forecast., 20, 367–384, https://doi.org/10.1175/WAF855.1, 2005.
Qin, Y., Chen, Z., Shen, Y., Zhang, S., and Shi, R.: Evaluation of satellite rainfall estimates over the Chinese Mainland, Remote Sens., 6, 11649–11672, https://doi.org/10.3390/rs61111649, 2014.
Rosenfeld, D.: Suppression of rain and snow by urban and industrial air pollution, Science, 287, 1793–1796, https://doi.org/10.1126/science.287.5459.1793, 2000.
Rosenfeld, D. and Woodley, W.: Deep convective clouds with sustained supercooled liquid water down to −37.5 ∘C, Nature, 405, 440–442, https://doi.org/10.1038/35013030, 2000.
Rosenfeld, D., Lohmann, U., Raga, G. B., O'Dowd, C. D., Kulmala, M., Fuzzi, S., Reissell, A., and Andreae, M. O.: Flood or drought: How do aerosols affect precipitation?, Science, 321, 1309–1313, https://doi.org/10.1126/science.1160606, 2008.
Storer, R. L. and van den Heever, S. C.: Microphysical processes evident in aerosol forcing of tropical deep convective clouds, J. Atmos. Sci., 70, 430–446, https://doi.org/10.1175/JAS-D-12-076.1, 2013.
Tao, W. K., Li, X., Khain, A., Matsui, T., Lang, S., and Simpson, J.: Role of atmospheric aerosol concentration on deep convective precipitation: Cloud-resolving model simulations, J. Geophys. Res., 112, D24S18, https://doi.org/10.1029/2007JD008728, 2007.
Tao, W. K., Chen, J. P., Li, Z., Wang, C., and Zhang, C.: Impact of aerosols on convective clouds and precipitation, Rev. Geophys., 50, RG2001, https://doi.org/10.1029/2011RG000369, 2012.
Twomey, S.: The Influence of pollution on the shortwave albedo of clouds, J. Atmos. Sci., 34, 1149–1152, https://doi.org/10.1175/1520-0469(1977)034<1149:TIOPOT>2.0.CO;2, 1977.
Wang, Y., Wan, Q., Meng, W., Liao, F., Tan, H., and Zhang, R.: Long-term impacts of aerosols on precipitation and lightning over the Pearl River Delta megacity area in China, Atmos. Chem. Phys., 11, 12421–12436, https://doi.org/10.5194/acp-11-12421-2011, 2011.
Wang, Y., Lee, K. H., Lin, Y., Levy, M., and Zhang, R.: Distinct effects of anthropogenic aerosols on tropical cyclones, Nat. Clim. Change, 4, 368–373, https://doi.org/10.1038/nclimate2144, 2014.
Wang, Y., Ma, P. L., Jiang, J. H., Su, H., and Rasch, P. J.: Toward reconciling the influence of atmospheric aerosols and greenhouse gases on light precipitation changes in Eastern China, J. Geophys. Res.-Atmos., 121, 5878–5887, https://doi.org/10.1002/2016JD024845, 2016.
Wang, Y., Vogel, J. M., Lin, Y., Pan, B., Hu, J., Liu, Y., Dong, X., Jiang, J. H., Yung, Y. L., and Zhang, R.: Aerosol microphysical and radiative effects on continental cloud ensembles, Adv. Atmos. Sci., 35, 234–247, https://doi.org/10.1007/s00376-017-7091-5, 2018.
Wiedinmyer, C., Akagi, S. K., Yokelson, R. J., Emmons, L. K., Al-Saadi, J. A., Orlando, J. J., and Soja, A. J.: The Fire INventory from NCAR (FINN): a high resolution global model to estimate the emissions from open burning, Geosci. Model Dev., 4, 625–641, https://doi.org/10.5194/gmd-4-625-2011, 2011.
Wu, D., Tie, X., Li, C., Ying, Z., Lau, A. K. H., Huang, J., Deng, X., and Bi, X.: An extremely low visibility event over the Guangzhou region: A case study, Atmos. Environ., 39, 6568–6577, https://doi.org/10.1016/j.atmosenv.2005.07.061, 2005.
Xie, P., Joyce, R., Wu, S., Yoo, S.-H., Yarosh, Y., Sun, F., and Lin, R.: Reprocessed, bias-corrected CMORPH global high-resolution precipitation estimates from 1998, J. Hydrometeorol., 18, 1617–1641, https://doi.org/10.1175/JHM-D-16-0168.1, 2017.
Yim, S. H. L., Gu, Y., Shapiro, M. A., and Stephens, B.: Air quality and acid deposition impacts of local emissions and transboundary air pollution in Japan and South Korea, Atmos. Chem. Phys., 19, 13309–13323, https://doi.org/10.5194/acp-19-13309-2019, 2019a.
Yim, S. H. L., Hou, X., Guo, J., and Yang, Y.: Contribution of local emissions and transboundary air pollution to air quality in Hong Kong during El Niño-Southern Oscillation and heatwaves, Atmos. Res., 218, 50–58, 2019b.
Zhang, Y. L. and Cao, F.: Fine particulate matter (PM2.5) in China at a city level, Scientific Reports, 5, 14884, https://doi.org/10.1038/srep14884, 2015.
Zhao, C., Liu, X., Leung, L. R., Johnson, B., McFarlane, S. A., Gustafson Jr., W. I., Fast, J. D., and Easter, R.: The spatial distribution of mineral dust and its shortwave radiative forcing over North Africa: modeling sensitivities to dust emissions and aerosol size treatments, Atmos. Chem. Phys., 10, 8821–8838, https://doi.org/10.5194/acp-10-8821-2010, 2010.
Zhao, C., Leung, L. R., Easter, R., Hand, J., and Avise, J.: Characterization of speciated aerosol direct radiative forcing over California, J. Geophys. Res.-Atmos., 118, 2372–2388, https://doi.org/10.1029/2012JD018364, 2013.
Zhao, C., Hu, Z., Qian, Y., Ruby Leung, L., Huang, J., Huang, M., Jin, J., Flanner, M. G., Zhang, R., Wang, H., Yan, H., Lu, Z., and Streets, D. G.: Simulating black carbon and dust and their radiative forcing in seasonal snow: a case study over North China with field campaign measurements, Atmos. Chem. Phys., 14, 11475–11491, https://doi.org/10.5194/acp-14-11475-2014, 2014.
Zhao, C., Huang, M., Fast, J. D., Berg, L. K., Qian, Y., Guenther, A., Gu, D., Shrivastava, M., Liu, Y., Walters, S., Pfister, G., Jin, J., Shilling, J. E., and Warneke, C.: Sensitivity of biogenic volatile organic compounds to land surface parameterizations and vegetation distributions in California, Geosci. Model Dev., 9, 1959–1976, https://doi.org/10.5194/gmd-9-1959-2016, 2016.
Zhao, C., Lin, Y., Wu, F., Wang, Y., Li, Z., Rosenfeld, D., and Wang, Y.: Enlarging Rainfall Area of Tropical Cyclones by Atmospheric Aerosols, Geophys. Res. Lett., 45, 8604–8611, https://doi.org/10.1029/2018GL079427, 2018.
Zhong, S., Qian, Y., Zhao, C., Leung, R., and Yang, X. Q.: A case study of urbanization impact on summer precipitation in the greater Beijing metropolitan area: Urban heat island versus aerosol effects, J. Geophys. Res.-Atmos., 120, 10903–10914, https://doi.org/10.1002/2015JD023753, 2015.