the Creative Commons Attribution 4.0 License.
the Creative Commons Attribution 4.0 License.
 | 23 Dec 2020
Aerosol vertical distribution and interactions with land/sea breezes over the eastern coast of the Red Sea from lidar data and high-resolution WRF-Chem simulations
Georgiy L. Stenchikov
Alexander Ukhov
Illia Shevchenko
Oleg Dubovik
Anton Lopatin
With advances in modeling approaches and the application of satellite and ground-based data in dust-related research, our understanding of the dust cycle has significantly improved in recent decades. However, two aspects of the dust cycle, namely the vertical profiles and diurnal cycles, are not yet adequately understood, mainly due to the sparsity of direct observations. Measurements of backscattering caused by atmospheric aerosols have been ongoing since 2014 at the King Abdullah University of Science and Technology (KAUST) campus using a micro-pulse lidar (MPL) with a high temporal resolution. KAUST is located on the eastern coast of the Red Sea and currently hosts the only operating lidar system in the Arabian Peninsula. We use the data from the MPL together with other collocated observations and high-resolution simulations (with 1.33 km grid spacing) from the Weather Research and Forecasting model coupled with Chemistry (WRF-Chem) to study the following three aspects of dust over the Red Sea coastal plains. Firstly, we compare the model-simulated surface winds, aerosol optical depth (AOD), and aerosol size distributions with observations and evaluate the model performance in representing a typical large-scale dust event over the study site. Secondly, we investigate the vertical profiles of aerosol extinction and concentration in terms of their seasonal and diurnal variability. Thirdly, we explore the interactions between dust aerosols and land/sea breezes, which are the most influential components of the local diurnal circulation in the region.
The WRF-Chem model successfully reproduced the diurnal profile of surface wind speed, AOD, and dust size distributions over the study area compared to observations. The model also captured the onset, demise, and height of a large-scale dust event that occurred in 2015, as compared to the lidar data. The vertical profiles of aerosol extinction in different seasons were largely consistent between the MPL data and WRF-Chem simulations along with key observations and reanalyses used in this study. We found a substantial variation in the vertical profile of aerosols in different seasons and between daytime and nighttime, as revealed by the MPL data. The MPL data also identified a prominent dust layer at ∼5–7 km during the nighttime, which likely represents the long-range transported dust brought to the site by the easterly flow from remote inland deserts.
The sea breeze circulation was much deeper (∼2 km) than the land breeze circulation (∼1 km), but both breeze systems prominently affected the distribution of dust aerosols over the study site. We observed that sea breezes push the dust aerosols upwards along the western slope of the Sarawat Mountains. These sea breezes eventually collide with the dust-laden northeasterly trade winds coming from nearby inland deserts, thus causing elevated dust maxima at a height of ∼1.5 km above sea level over the mountains. Moreover, the sea and land breezes intensify dust emissions from the coastal region during the daytime and nighttime, respectively. Our study, although focused on a particular region, has broader environmental implications as it highlights how aerosols and dust emissions from the coastal plains can affect the Red Sea climate and marine habitats.
- Article
(19276 KB) - Full-text XML
-
Supplement
(1712 KB) - BibTeX
- EndNote


Dust aerosols, which mainly originate from natural deserts and disturbed soils such as agricultural areas, have implications for air quality (Prospero, 1999; Parajuli et al., 2019) and the Earth's climate (Sokolik and Toon, 1996; Mahowald et al., 2006; Jish Prakash et al., 2015; Bangalath and Stenchikov, 2015; Kalenderski and Stenchikov, 2016; Di Biagio et al., 2017). The Arabian Peninsula represents a key area within the global dust belt where significant dust emissions occur in all seasons. However, the spatio-temporal characteristics of dust emissions in the region have not yet been fully described, partly because of the sparsity of observations. Although our understanding of the dust cycle and the related physical processes has substantially improved in recent decades (Shao et al., 2011), in the present context, two aspects of dust aerosol dynamics remain the least explored: the vertical structure and the diurnal cycle. Understanding the vertical structure is important because the vertical distribution of aerosols affects the radiative budget (Johnson et al., 2008; Osipov et al., 2015) and surface air quality (Chin et al., 2007; Wang et al., 2010; Ukhov et al., 2020b). Moreover, understanding the diurnal cycle of aerosols is important because aerosols scatter and absorb radiation (Sokolik and Toon, 1996; Di Biagio et al., 2017), which ultimately affects the land and sea breezes in coastal areas. Land and sea breezes, which are the key diurnal-scale atmospheric processes over the Red Sea coastal plain, can also affect the distribution and transport of aerosols (Khan et al., 2015) and their composition (Fernández-Camacho et al., 2010; Derimian et al., 2017).
The vertical distribution of aerosols in the atmosphere has been studied for decades using lidar measurements from several ground-based sites, aircraft, and satellite platforms, covering different regions across the globe. Several satellites are equipped with lidar to measure the vertical distribution of aerosols. The Lidar In-space Technology Experiment (LITE) was the first space lidar launched by NASA in 1994 onboard the Space Shuttle, providing a quick snapshot of aerosols and clouds in the atmosphere on a global scale (Winker et al., 1996). LITE was followed by the Geoscience Laser Altimeter System (GLAS) containing a 532 nm lidar, as part of the Ice, Cloud and Land Elevation Satellite (ICESat) mission, which covered the polar regions (Abshire et al., 2005). Cloud-Aerosol Lidar with Orthogonal Polarization (CALIOP) onboard CALIPSO (Cloud-Aerosol Lidar and Infrared Pathfinder Satellite Observations) currently observes aerosol and clouds globally during both the day and night portions of the orbit, with a 16 d repeat cycle since 2006 (Winker et al., 2013). Apart from satellites, several field experiments have also been conducted using lidar to measure the vertical distribution of aerosols. The Indian Ocean Experiment (INDOEX) field campaign (Collins et al., 2001; Rasch et al., 2001; Welton et al., 2002b) took place in 1999 over the Indian Ocean, Arabian Sea, and the Bay of Bengal, in which an MPL system together with other instruments measured aerosol distribution in the troposphere. Similarly, an MPL system was employed in the Second Aerosol Characterization Experiment (ACE-2) in 1997 over Tenerife, Canary Islands, to understand the vertical distribution of dust/aerosols transported from northern Africa and Europe to the Atlantic Ocean (Welton et al., 2000; Ansmann et al., 2002). African Monsoon Multidisciplinary Analysis (AMMA), one of the largest international projects ever carried out in Africa, also measured aerosol vertical distribution using multiple lidar systems for a short period in 2006 (Heese and Wiegner, 2008; Lebel et al., 2010). Currently, several other coordinated lidar networks are operating in different regions. They include the European Aerosol Research Lidar Network EARLINET (Pappalardo et al., 2014), the German Aerosol Lidar Network (Boesenberg et al., 2001), the Latin American Lidar Network LALINET (Guerrero-Rascado et al., 2016), the Asian dust and aerosol lidar observation network AD-Net (Shimizu et al., 2016), and the Commonwealth of Independent States Lidar Network CIS-LiNet (Chaikovsky et al., 2006).
A micro-pulse lidar (MPL) has been operating at King Abdullah University of Science and Technology (KAUST), Thuwal, Saudi Arabia (22.3∘ N, 39.1∘ E), since 2014. This lidar is collocated with the KAUST AERONET (Aerosol Robotic Network) station. The KAUST MPL site is a part of the Micro-Pulse Lidar Network (MPLNET), maintained by the NASA Goddard Space Flight Center (GSFC) (Welton et al., 2001, 2002a). KAUST hosts the only lidar site on the Red Sea coast, and its colocation with the AERONET station facilitates the retrieval of the vertical profile of aerosols more accurately. Stations that measure a range of parameters of interest for dust-related research (including dust deposition rate, vertical profile, near-surface concentration, and spectral optical depth) are rare across the global dust belt. In addition to the lidar and AERONET station, KAUST also has a meteorological station that measures wind speed, air temperature, and incoming short-wave and long-wave radiative fluxes. These collocated data provide an opportunity to get a more complete picture of dust emissions and transport in the region.
The study site frequently experiences large-scale dust events. The satellite and ground-based observations such as AERONET have some limitations, because of which they are likely to miss some important details of these dust events. For example, many large-scale dust events are accompanied by cloud cover, which restricts the retrieval of aerosol optical properties in the visible bands (Fernández et al., 2019). Extreme dust events are nonetheless important from a research perspective because they provide an opportunity to understand the associated physical processes. AERONET stations and passive satellite sensors are further limited because they cannot retrieve aerosol properties during the night. Lidars help to overcome these limitations because they provide high-frequency measurements, even at night. Furthermore, lidar signals can penetrate thin and multilayer clouds, which are usually overlooked by passive satellite sensors (Winker et al., 1996, 2009), thus improving the detection of aerosol layers at different altitudes. Therefore, lidar data are essential for understanding the diurnal variability of aerosols and their climatic effect.
The location of the Red Sea between the two key dust source regions of northern Africa and the Arabian Peninsula provides a unique opportunity to understand the multi-faceted aspects of aerosol–climate interactions that occur in the region. KAUST is located on the eastern coast of the Red Sea, and dust is indeed the dominant aerosol type in this region (Jish Prakash et al., 2015; Kalenderski and Stenchikov, 2016). The sea and land breezes that occur during the day and night, respectively, are the dominant drivers of local air mass circulations (Jiang et al., 2009). Sea breezes facilitate the transport of moisture inland and contribute to the formation of cumulus clouds and mesoscale convection (Davis et al., 2019). The land and sea breezes can themselves also generate dust emissions from the coastal regions (e.g., Crouvi et al., 2017) and also interact with atmospheric dust aerosols in multiple ways.
In this study, we attempt to understand the vertical and diurnal profiles of aerosols over the eastern coast of the Red Sea. We use our multiple collocated datasets collected at KAUST to shed light on the various facets of local-scale dust–climate interactions in the region. Since land and sea breezes are fine-scale features modulated by local topography, high-resolution simulations are essential to resolve these circulations. Therefore, we conduct high-resolution simulations (with 1.33 km grid spacing) using WRF-Chem that interactively accounts for aerosol generation, transport, and deposition to understand the nature of these circulations and their interaction with aerosols. In summary, we aim to answer the following specific research questions.
-
How do the model simulations represent the vertical distribution of aerosols over the study site?
-
How are aerosols distributed in the vertical column over the study site at KAUST?
-
What is the seasonal or diurnal variability in the vertical distribution of aerosols?
-
How do prevailing land and sea breezes affect dust emissions and distribution over the study site?
This paper is organized as follows. We present a description of datasets and methods in Sect. 2, where we describe the observational datasets used and the WRF-Chem model settings. In Sect. 3, we present the results. More specifically, we explore the first and second research questions listed above in Sect. 3.2 and 3.3, respectively. Results presented in Sect. 3.3 and 3.4 are relevant to the third research question. Section 3.5 addresses the fourth question. We present a general discussion of the results along with the limitations of our research in Sect. 4. Finally, we present the key conclusions in Sect. 5.
2.1 Study site
The KAUST campus is located in the western Arabian Peninsula, on the eastern coast of the Red Sea (22.3∘ N, 39.1∘ E). This area is affected by local dust storms originating from surrounding inland deserts, by distantly generated dust arriving from northeastern Africa through the Tokar Gap (see, for example, Kalenderski and Stenchikov, 2016; Albugami et al., 2019; Kumar et al., 2019), and by dust from as far away as the Tigris and Euphrates regions (Parajuli et al., 2019). Therefore, dust is present in the atmosphere over the study site for the entire year.
Although our focus in this study is on dust aerosols, which are the dominant aerosol over the study site (Jish Prakash et al., 2015; Parajuli et al., 2019; Ukhov et al., 2020b), some additional aerosol types also contribute to the aerosol loading at KAUST. Our site is located on the coast; thus, sea salt aerosol, which is of natural origin, inevitably contributes considerably to the atmospheric aerosol loading. Furthermore, the study site has several industrial areas nearby that produce anthropogenic emissions of sulfur dioxide (SO2) and black and organic carbon (BC and OC) (Ukhov et al., 2020b).
Because the site is located exactly at the land–sea boundary, some unique small-scale processes exist that affect the local climate of this region. For instance, land and sea breezes affect the distribution of dust in the atmosphere over the study site. The desert land heats up during the day, which consequently heats the surface air above the land. This warm air mass rises due to convection, creating a local pressure “low” at the surface. The cooler and more moist air over the Red Sea then flows towards the low-pressure zone, thus forming sea breezes (Simpson, 1994; Miller et al., 2003; Davis et al., 2019). During the night, this flow is reversed to form land breezes, when the land surface temperature cools more quickly than the sea surface temperature. Because these breezes are driven by the thermal contrast between the land and the sea, their strengths vary by season. These breezes are further enhanced because of their coupling with slope winds generated on the Sarawat Mountains, which run along the western coast of the entire Arabian Peninsula (Davis et al., 2019).
Land and sea breezes affect dust aerosol emissions and transport in our study region. When the land and sea breezes are strong, they can cause dust emission from the coastal regions. Although breezes are not responsible for long-range transport, they can affect the local distribution of dust aerosols over the study site.
Because dust/aerosols are present over the study site for most of the year, they can also interact with the meteorology and thus affect atmospheric winds and temperature at different timescales (Jacobson and Kaufman, 2006; Rémy et al., 2015). Land or sea breezes are strongly coupled with dust/aerosols and temperature variability, especially near the surface (Crouvi et al., 2017).
2.2 Observations
We use several datasets to evaluate our model simulations and derive the average season profiles of aerosol loading and surface winds during 2015–2016, as described below.
2.2.1 Datasets
We collected meteorological data, including wind speed, temperature, and humidity, from a tower established at KAUST in 2009 in collaboration with WHOI (Woods Hole Oceanographic Institution) (Farrar et al., 2009; Osipov et al., 2015).
We use cloud-free aerosol extinction profiles retrieved from CALIOP onboard CALIPSO for analyzing the vertical structure of aerosols at the study site. CALIPSO is flown in a Sun-synchronous polar orbit and is a part of NASA's Afternoon (A-train) constellations (Stephens et al., 2018). We use level-3 day/night aerosol data v3.00, which are monthly aerosol products generated by aggregating level-2 monthly statistics at 2∘ (lat) × 5∘ (long) resolution (Winker et al., 2013). The data have 208 vertical levels up to a height of 12 km above sea level.
We also analyze aerosol optical depth (AOD) data from the AERONET station at KAUST (Holben et al., 1998). We use level-2.0 data of directly measured AOD values (direct Sun algorithm), which are cloud-screened and quality-assured. From AERONET, we also use an aerosol number density and a particle size distribution (PSD) obtained by inversion (Dubovik and King, 2000) to characterize the aerosol particles in the region. We use the AERONET V3, level-2.0 product, which provides volume concentration of aerosols in the atmospheric column in 22 bins between 0.05 and 15 µm in radius (Dubovik and King, 2000; Parajuli et al., 2019; Ukhov et al., 2020b).
We use Moderate Resolution Imaging Spectroradiometer (MODIS) level-2 Deep Blue AOD data (Hsu et al., 2004), which are available daily, for the whole globe, at a resolution of ∼0.1∘ × 0.1∘. We use the latest version of the MODIS dataset (collection 6) (Hsu et al., 2013) because of its extended coverage and improved Deep Blue aerosol retrieval algorithm, compared to its earlier version (collection 5). We process AOD data of both Terra and Aqua satellites on a daily basis and use the average of the two data products for our analysis. From MODIS, we also use the true color images for a qualitative analysis of a dust event.
We adopt the Modern-Era Retrospective Analysis for Research and Applications version 2 (MERRA-2) data (Rinecker et al., 2011) for comparing the model-simulated AOD and dust concentrations. Aerosol data from the MERRA-2 dataset assimilate several satellite observations, including MODIS AOD (Gelaro et al., 2017). We specifically use tavg1_2d_aer_Nx and inst3_3d_aer_Nv products for getting 2-D AOD/dust optical depth (DOD) data and 3-D aerosol concentrations, respectively. MERRA-2 data consist of 72 vertical model levels between ∼0.23 and 79.3 km.
We also employ 555 nm column AOD from MISR onboard the Terra satellite archived under collection MIL3DAE_4, which is a daily product available at 0.5×0.5∘ resolution (Diner, 2009). Because MISR has a wider view with nine viewing angles, MISR identifies thin aerosol layers more accurately and is more sensitive to the shape and size of particles (Kahn et al., 2005).
We also use the RGB composite from the SEVIRI (Spinning Enhanced Visible and Infrared Imager) instrument onboard the geostationary Meteosat satellite, which is a composite prepared from specific infrared channels that are sensitive to the presence of dust in the atmosphere (Ackerman, 1997; Schepanski et al., 2007). Dust appears “pink” in these composite images and is thus distinguishable from clouds, which are usually shown in yellow, red, or green.
2.2.2 Lidar data
Micropulse lidar is a fully autonomous active remote-sensing system in which a laser transmitter emits light vertically upward, and an optical sensor receives the backscattered signals. The numbers and the detection time of the backscattered photons provide information about the aerosols and clouds in the atmosphere. We established the lidar site on the KAUST campus as a part of the MPLNET network in 2014. It operates at a wavelength of 532 nm. The data from this lidar (hereafter called KAUST–MPL) are the main basis of this paper.
The colocation of the KAUST–MPL and AERONET station provides an opportunity to get a more comprehensive microphysical picture when the MPL data are combined with AERONET Sun-photometer measurements. We employ GRASP (Generalized Retrieval of Aerosol and Surface Properties, Dubovik et al., 2011, 2014), which is an open-source inversion code that combines different types of remote-sensing measurements, such as radiometer and lidar observations, to generate fully consistent columnar and vertical aerosol properties (Lopatin et al., 2013). We take aerosol characteristics from the AERONET retrieval, including size distribution, absorption, scattering optical depth, and refractive index. These parameters serve as inputs to GRASP, together with MPL data, to generate height-resolved aerosol fields such as aerosol extinction, absorption, and mixing ratios.
We combine cloud-screened AERONET radiances and lidar backscatter signals to retrieve aerosol properties during the daytime. As AOD data are unavailable during the night, for nighttime retrievals, we use a so-called multi-pixel approach, first introduced by Dubovik et al. (2011) and implemented in GRASP. According to this approach, the retrieval is implemented using a group of observations representing different time and location (e.g., several satellite pixels) to retain the variability of the retrieved parameter. For example, in this study, we invert the closest AERONET measurements obtained the day before and the day after, together with the nighttime lidar backscatter data, under some constraints on the temporal variability of the columnar parameters (size distribution, complex refractive index, and sphericity fraction) provided by AERONET measurements. In contrast to other more straightforward retrieval approaches used currently, the multi-pixel technique constrains the retrieval without eliminating the variability within the data. The implemented retrieval approach allows us to retain the variability of columnar properties throughout the night. This approach contrasts with the retrieval approach adopted by Benavent-Oltra et al. (2019), which ignores the variability of columnar properties during the night.
The GRASP algorithm relies on an external cloud masking. Overnight lidar retrievals are performed only when cloud-free AERONET Sun-photometric observations are available in the preceding evening and following morning. The AERONET cloud-masking algorithm is considered the gold standard, providing very reliable filtering of thick and broken clouds (Holben et al., 1998). In this regard, only clouds that form specifically at night and are undetectable by Sun-photometric observations in the evening and morning could influence our retrieved extinction profiles. At the same time, retrieval of these profiles, to a large extent, relies on detailed columnar aerosol properties retrieved before and after nighttime observations. An attempt to retrieve cloudy profiles under the assumption of cloud-free aerosol columnar properties should result in higher fitting errors and therefore should be easily detectable.
The retrieved aerosol data have 100 levels in the vertical dimension with a resolution of 75 m from 505 to 7700 m above sea level. The processed lidar extinction data have some data gaps because of the quality constraints applied and cloud filtering (Dubovik et al., 2011). To achieve a complete diurnal picture, we also analyze the raw data of the normalized relative backscatter (NRB) from KAUST–MPL, which gives the total backscatter from both aerosols and clouds at a fine 1 min resolution.
2.3 WRF-Chem model setup
We use WRF-Chem (v3.8.1) with some recent updates (Ukhov et al., 2020a) for simulating the emission and transport of dust and other aerosols at high resolution at the study site. The innermost domain (d03), which is marked by a red box in Fig. 1, is centered at KAUST and has a fine resolution of 1.33 km, which is required to resolve the essential features of local wind circulation and breezes. The innermost domain is encompassed by a second domain (d02) with a resolution of 4 km that covers the entire Arabian Peninsula. Although the western boundary of domain d03 appears close to that of d02, there are 40 grid cells in between, which is 10 times higher than generally recommended and is sufficient to ensure a smooth transition across the boundaries. While a further westward extension of d02 could be desirable to better resolve the synoptic weather phenomena across the Red Sea, e.g., through the Tokar Gap (Kalenderski and Stenchikov, 2016), such phenomena have a minor impact on the diurnal-scale local sea breeze circulation in our site, which is the focus of our study. To allow full aerosol exchange and cover all major sources of dust in the region, we nest the two inner domains within a larger domain (d01) with a 12 km resolution, which covers the entire Middle East and northern Africa (MENA) region shown in Fig. 1. The key physics and chemistry options used in WRF-Chem are presented in Table 1.
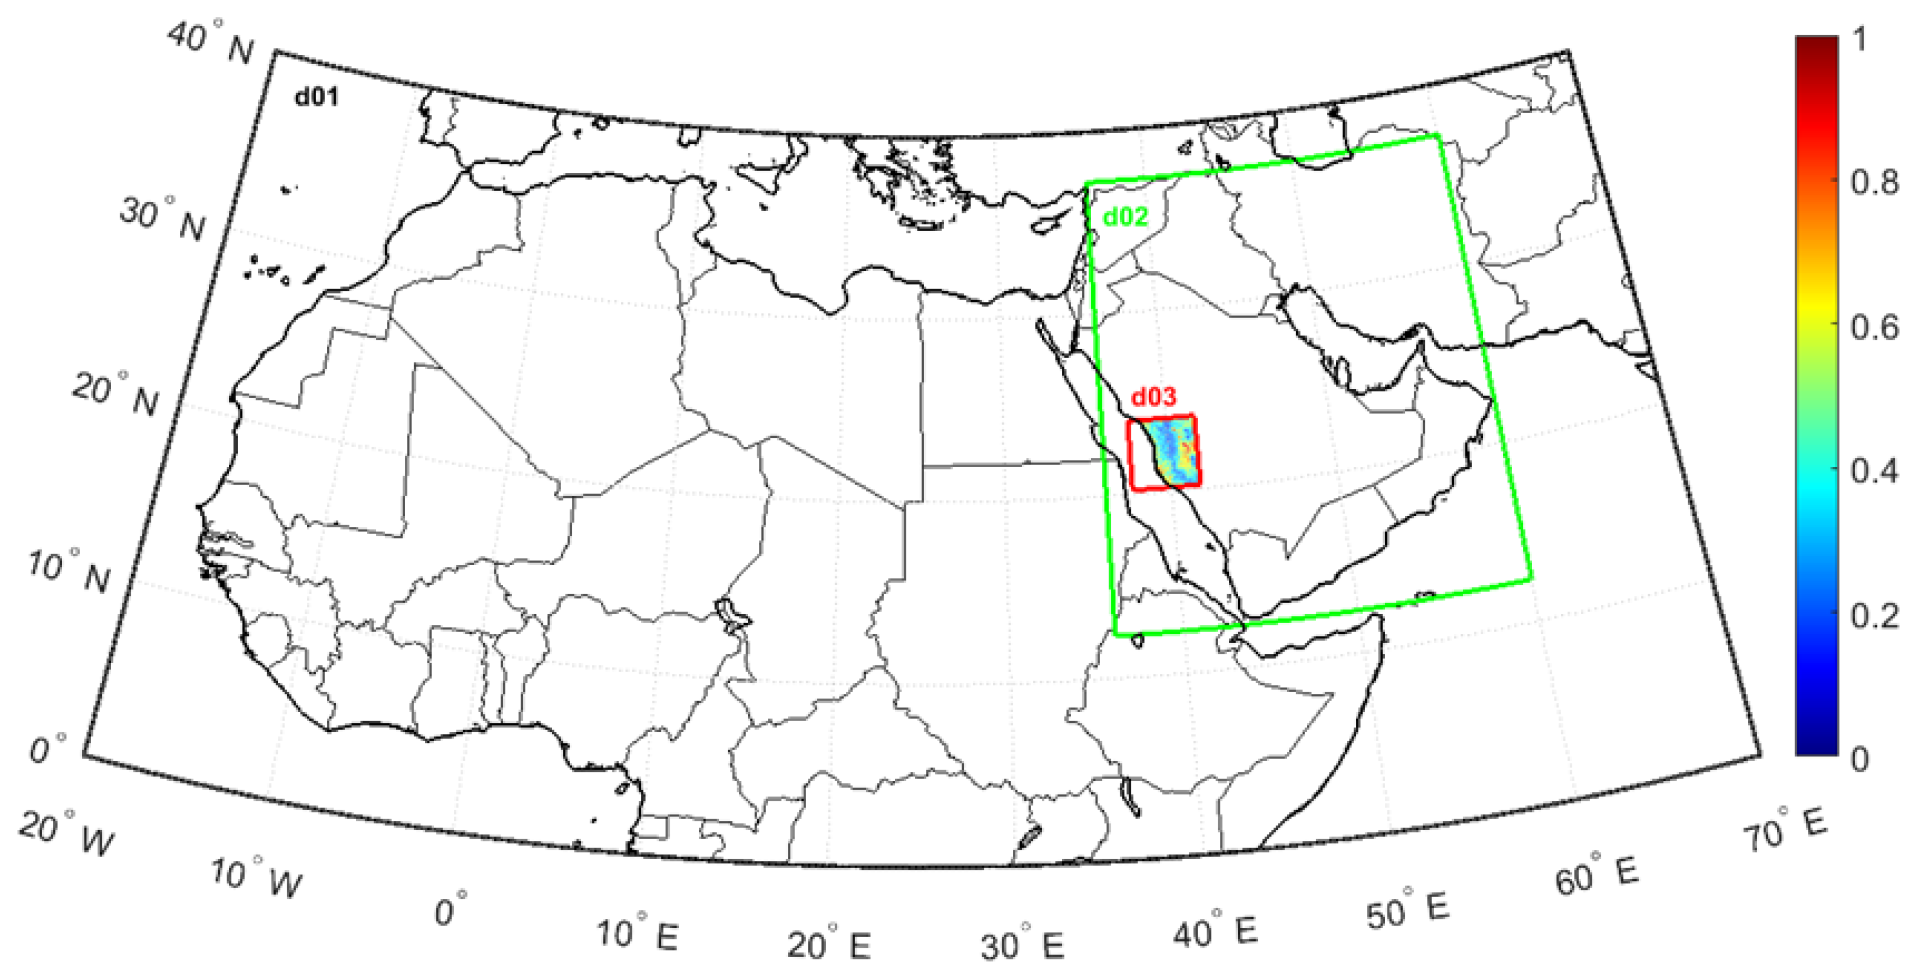
Figure 1The study region over the Red Sea showing the three nests d01 (black), d02 (green), and d03 (red) used in WRF-Chem simulations. The base map within d03 shows the high-resolution dust source function (Parajuli and Zender, 2017) used in this study, in which the values range from zero to one, with the highest value representing the strongest dust source.
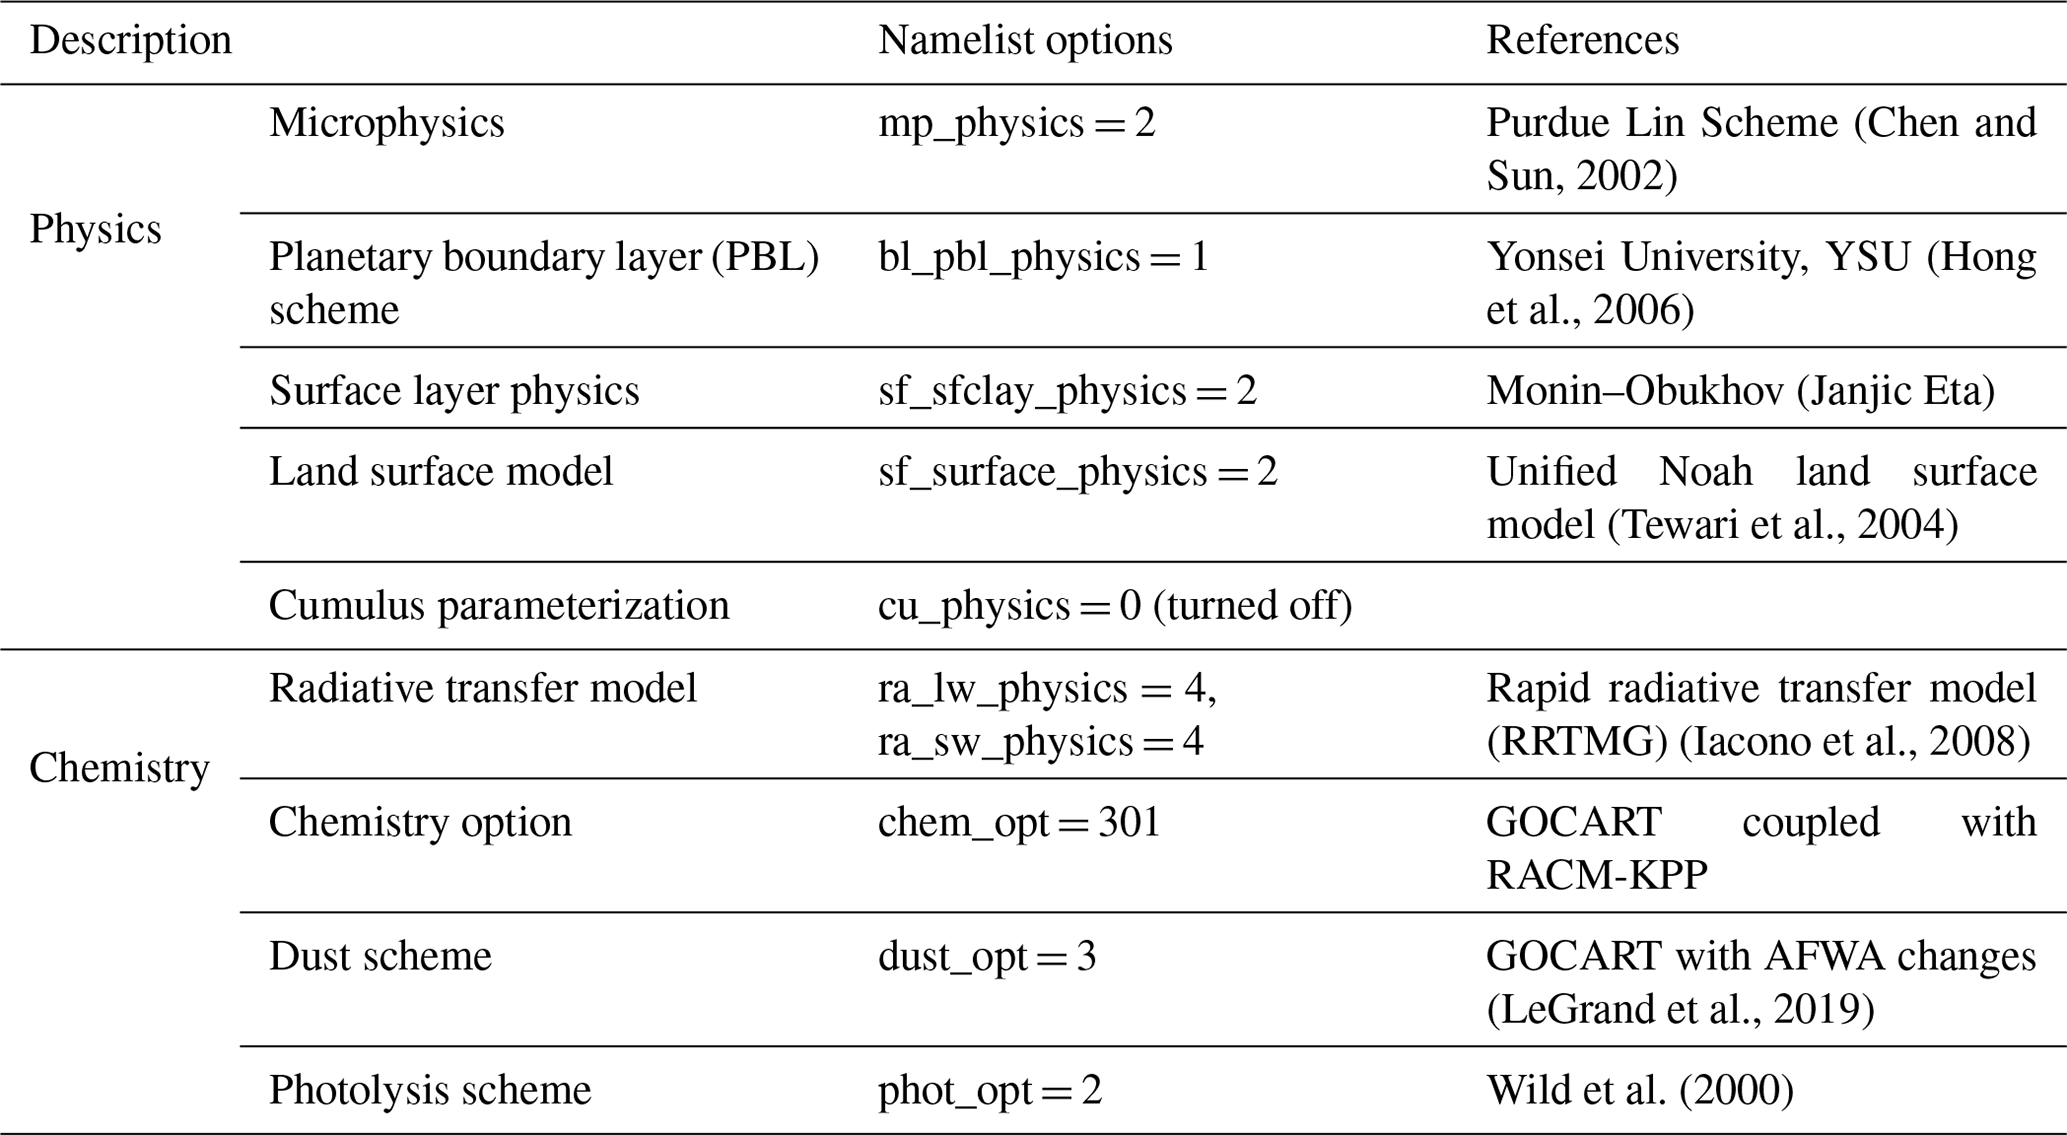
Table 1Details of key physics and chemistry namelist settings used in WRF-Chem.
The model top is set at 100 hPa and has 30 vertical levels between ∼20 m and 16 km. To represent winds better, we apply “grid nudging” on the u (zonal velocity) and v (meridional velocity) components of wind above the planetary boundary layer (PBL) in all three domains (Parajuli et al., 2019). We do not use any convective parameterization scheme and resolve deep convection in the innermost domain. We employ two-way nesting, which means that the parent domain provides boundary conditions for the nest, and the nest provides feedback to the parent domain. The model time steps are set to 72, 24, and 8 s for the three domains d01, d02, and d03, respectively.
Several studies compare the performance of PBL schemes in WRF, showing mixed results under different model settings (e.g., Saide et al., 2011; Fountoukis et al., 2018; Fekih and Mohamed, 2019). However, these studies have not directly compared the aerosol vertical profiles. Preliminary results showed that the choice of the PBL parameterization did not have a significant impact on the vertical distribution of aerosols in our case. In our simulations, we use the YSU PBL scheme, which is one of the most commonly used schemes, as suggested in the literature (e.g., Fountoukis et al., 2018; Fekih and Mohamed 2019).
We use high-resolution operational analysis data from ECMWF (∼15 km) to provide initial and boundary conditions in our model, which are updated every 6 h. The sea surface temperature (SST) values are also updated in our simulations, using the same ECMWF dataset.
We employ the Global Ozone Chemistry Aerosol Radiation and Transport (GOCART) aerosol scheme in our simulations (Chin et al., 2002). To calculate dust emissions, we use the AFWA dust scheme, which follows the original GOCART dust scheme (Ginoux et al., 2001) modified to account for saltation (Marticorena and Bergametti, 1995; LeGrand et al., 2019). It is important to represent the dust sources at a fine scale to capture the smaller-scale physical processes accurately. Therefore, we use a recently developed high-resolution sediment supply map (SSM) as the source function (Parajuli and Zender, 2017; Parajuli et al., 2019) in all three model domains. We adopt the tuning process of the dust model described in Parajuli et al. (2019). We tuned the model against CALIOP DOD, and the same tuning coefficients obtained from Parajuli et al. (2019) are used in all domains, including the added third domain, and are 0.136, 0.196, 0.120, and 0.110 for DJF, MAM, JJA, and SON, respectively.
We consider dust, sea salt, sulfate, and black and organic carbon (BC and OC) aerosols in our simulations. Biomass burning and biogenic aerosols are not important over the region, and thus we do not include them.
Sea salt emissions in WRF-Chem follow the parameterization developed by Monahan et al. (1986) and Gong (2003). In this parameterization, the rate of sea salt emissions produced via whitecaps and wave disruption is given as a function of particle size and 10 m wind speed.
We take the anthropogenic emissions of OC and BC from the most recent version of EDGAR (Emission Database for Global Atmospheric Research) database v4.3.2 available at 0.1∘ × 0.1∘ resolution (Crippa et al., 2018). The EDGAR database is a global database that provides gridded emission maps of several greenhouse gases and air pollutants from 1970 to 2012. We use OC and BC emissions data from 2012.
Sulfur dioxide (SO2) is of particular concern because it chemically transforms in the atmosphere into secondary sulfate, which is an important and influential aerosol at our study site (Ukhov et al., 2020b, c). To achieve a more accurate representation of sulfate aerosols, we use the SO2 emissions from a time-varying (monthly) inventory developed by NASA for the same year (2015). This SO2 inventory is developed by combining satellite-based estimates from the Ozone Monitoring Instrument (OMI) with the ground-based inventory developed by the Task Force on Hemispheric Transport Air Pollution (TF HTAP) (Janssens-Maenhout et al., 2015), which provides a more accurate gridded emission dataset with greater spatial and temporal coverage. The data have global coverage with 0.1×0.1∘ resolution (Liu et al., 2018). This dataset does not account for SO2 emissions produced by ships; therefore, we take ship SO2 emissions from the EDGAR v4.3.2 dataset. OMI-HTAP emissions in WRF-Chem are satisfactorily reproduced by the observed SO2 loading in the Middle East region (Ukhov et al., 2020c).
We activate both gas and aerosol chemistry in our simulations (gaschem_onoff = 1, aerchem_onoff = 1) and apply the aerosol chemistry options in all three domains.
To determine the contribution of each aerosol species to total AOD, we modify the WRF-Chem code, mainly the Fortran subroutines in optical_driver.F and chem_driver.F located in the chem folder. For this purpose, we calculate aerosol optical properties twice, first with the mixture containing all aerosols and second after removing a specific aerosol. This calculation is implemented in the subroutine “optical_averaging”. Thus, we obtain the contribution of specific aerosol species to total AOD by subtracting the AOD obtained without a specific aerosol from the total AOD calculated when all aerosols are accounted for.
We calculate the total aerosol concentration (TAC) in µg m−3 by summing up the individual concentrations of all aerosol species. The equation used to calculate the total aerosol concentration from the standard output variables of WRF-Chem is presented below.
where DUST_1…DUST_5 are the dust mass mixing ratios (µg kg−1) in five different size bins; SEAS_1…SEAS_4 are the sea salt mass mixing ratios (µg kg−1) in four different size bins; P10 and P25 are other anthropogenic PM10 and PM2.5 mass mixing ratios (µg kg−1), respectively; OC1 and BC1 are mass mixing ratios (µg kg−1) of hydrophobic organic carbon and black carbon, respectively; OC2 and BC2 are mass mixing ratios (µg kg−1) of hydrophilic organic carbon and black carbon, respectively; sulf is the SO4 volume mixing ratio (ppmv), ALT is the inverse of air density (m3 kg−1), and 96∕29 is the ratio of the molecular weights (g mol−1) of sulfate and air.
We conduct the model simulations for the entire year of 2015 on a monthly basis (for computational reasons). For each month, the model simulations start a week before the month begins, and we discard the data from this week as spin-up. We use data for 2015 only for the comparison of the model results with other datasets. However, we use the entire 2 years of data (2015–2016) to derive the seasonal profiles. Because we aim to explore the diurnal cycles, we use hourly model output data for analysis. While comparing point measurements (lidar and meteorology data) with gridded datasets, we use data from one grid cell containing the KAUST site from all gridded datasets.
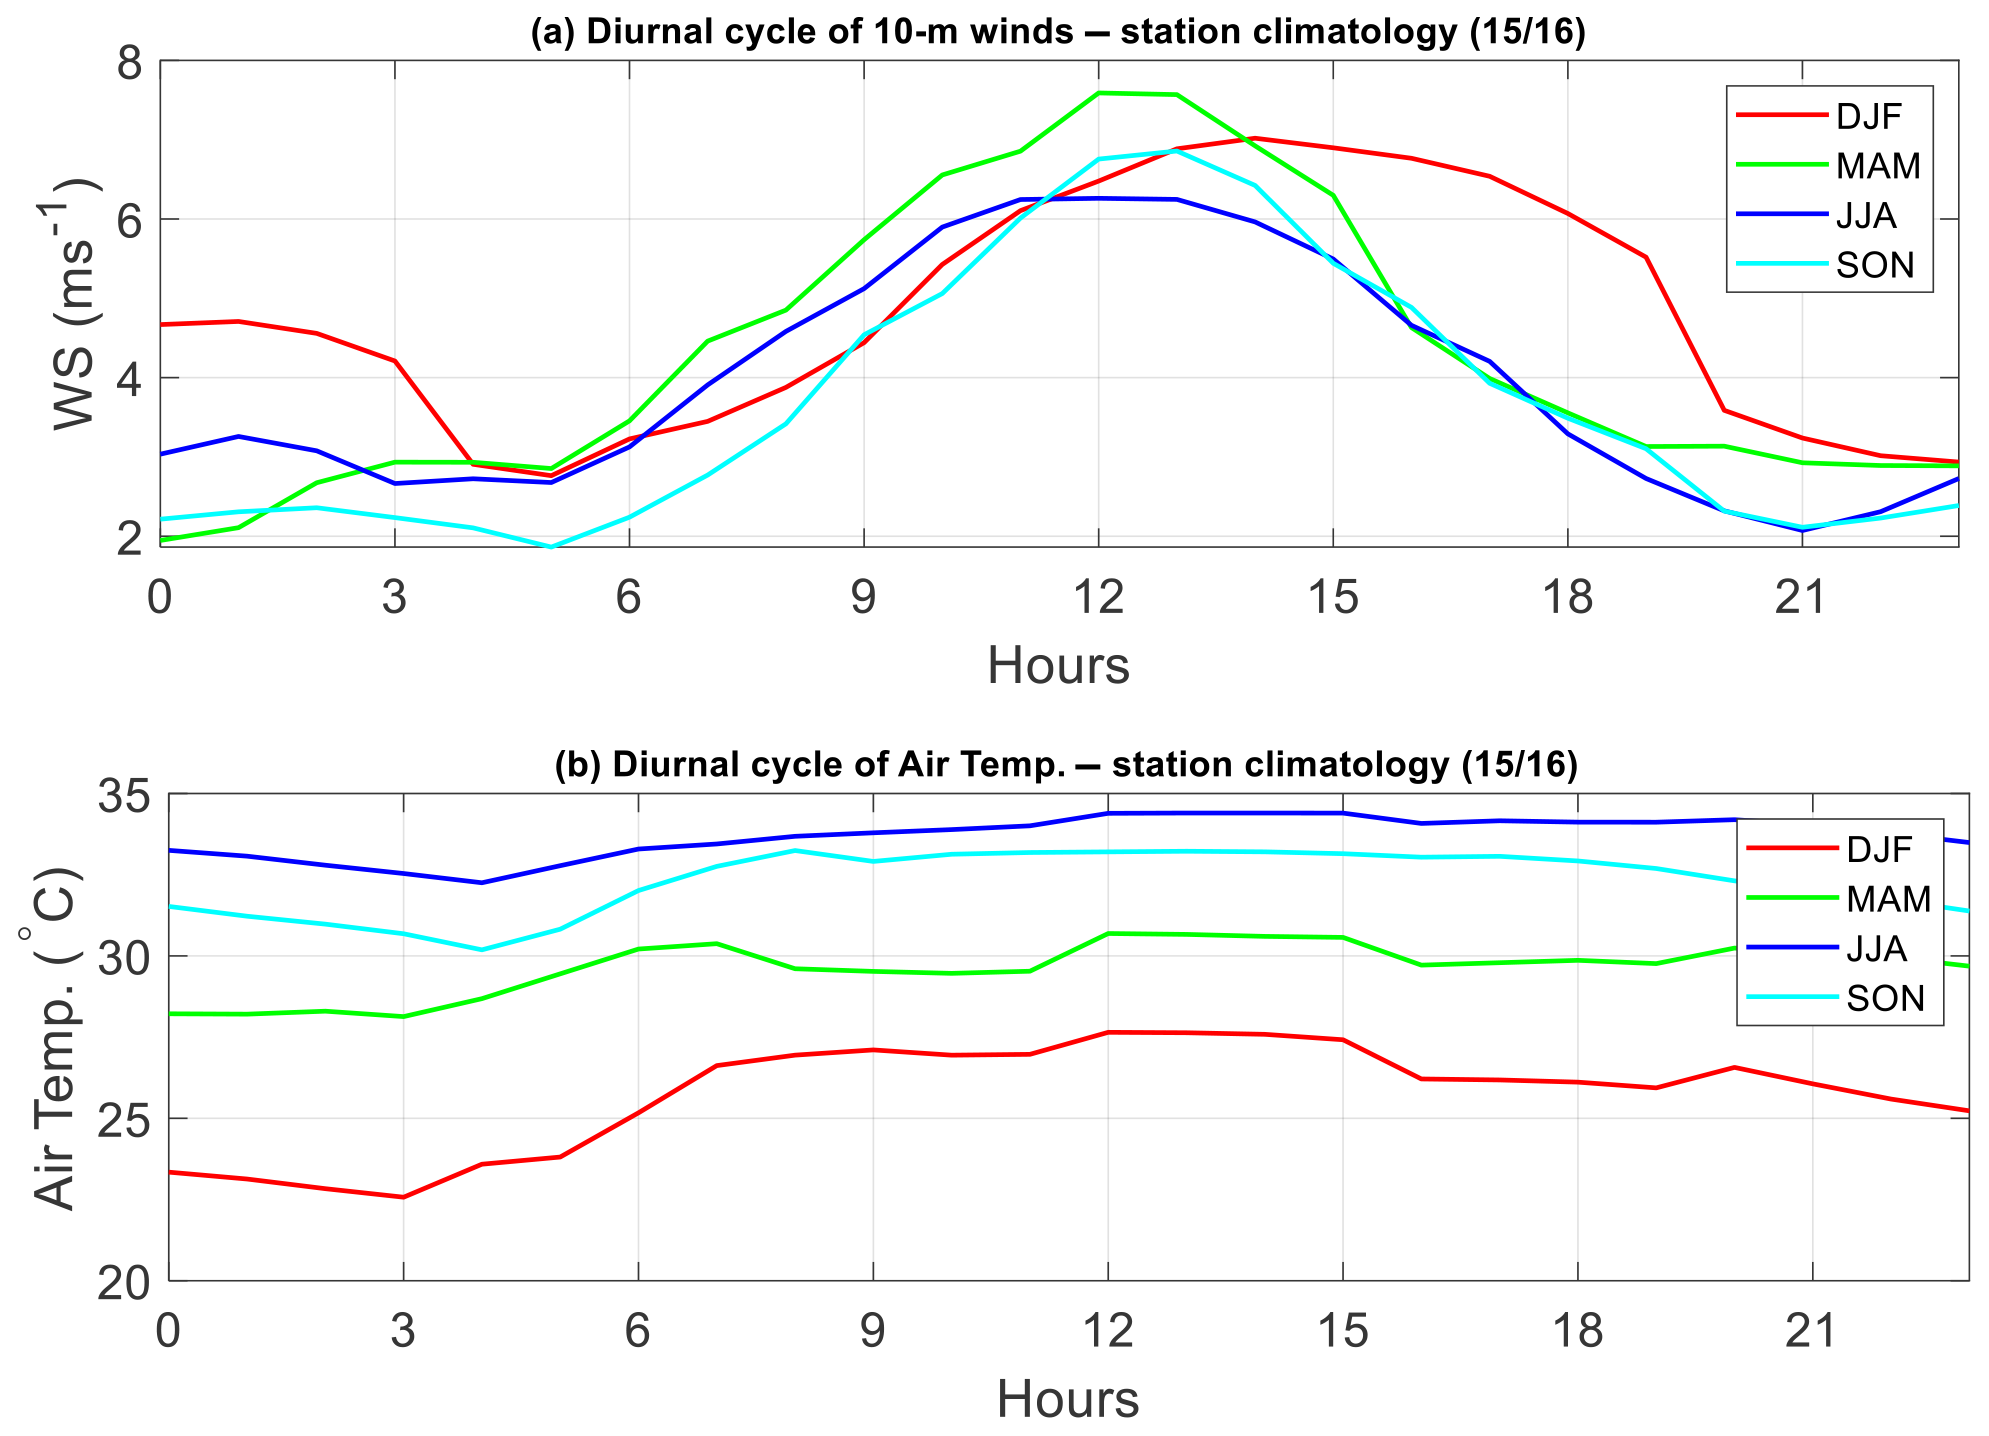
Figure 2Seasonally averaged (2015/16) diurnal cycle of (a) 10 m wind speed and (b) 2 m air temperature, both measured at the KAUST station. Times are reported in UTC.
3.1 Surface meteorology
Figure 2a shows the mean diurnal cycle (2015/16) of station-measured surface wind speed at the study site. The surface winds reach a peak around noon UTC (15:00 local time) for all seasons except winter, consistent with the results of Davis et al. (2019). The aforementioned sea breezes cause these wind peaks in the afternoon. Note that these sea breezes originate at sea and advance landward to reach the coast only later in the afternoon (Estoque et al., 1961), where they are measured at our station. In winter, the wind speed profile shifts to the right, peaking later in the day at around 14:00 UTC. This shift to later in the day occurs because, in winter, it takes more time to reach the required thermal contrast between the land and the sea to form sea breezes. Note the existence of a second peak in the wind speed plot during the night, around 01:00 UTC, representing the land breezes. These land breezes are stronger in winter than in the other seasons.
The time profiles of air temperature (Fig. 2b) are relatively flat, showing a weak diurnal cycle. Winter reveals the most pronounced diurnal cycle. The temperature contrast between day and night is minimal in summer and maximal in winter. The weak diurnal cycle observed in the station-measured temperature is because of the influence of SST, since the station is located very close to the sea. The diurnal cycle of land temperature becomes much stronger as we go further inland in the coastal region (Fig. S1 in the Supplement), creating a strong temperature gradient between the ocean and the land surface, which ultimately drives the breeze circulation.
Given the strong diurnal cycles of surface winds and temperature, it is evident that the day and night circulation in the study area is remarkably different. Therefore, it becomes important to look at the aerosol vertical profiles separately in the day and night.
3.2 Model evaluation
3.2.1 Surface winds
Figure 3a and b show the diurnal cycle of 10 m wind speeds compared with the model simulations and station data at KAUST for individual months from different seasons chosen to represent the four seasons. The profiles are in good agreement, although the model slightly overestimates the wind speed magnitudes. Nevertheless, the model captures the seasonal variation of wind speed well. These results indicate that our high-resolution simulations effectively reproduce local features of wind circulations.

Figure 3(a) Average diurnal cycle (2015) of 10 m winds at KAUST for four different months representing each season from (a) model and (b) station. Times are reported in UTC.
3.2.2 Comparison of AOD and aerosol volume concentrations
Figure 4 shows the model-simulated time series of total columnar AOD at KAUST obtained using daily-average values, compared with several datasets, including AERONET, MODIS, MISR, and MERRA-2. For the model and MERRA-2 data, we only use the daytime data (between 07:00 and 19:00 local time) to make them consistent with AERONET, MODIS, and MISR data. In general, all data are consistent and show similar temporal patterns, except during some large-scale dust events.
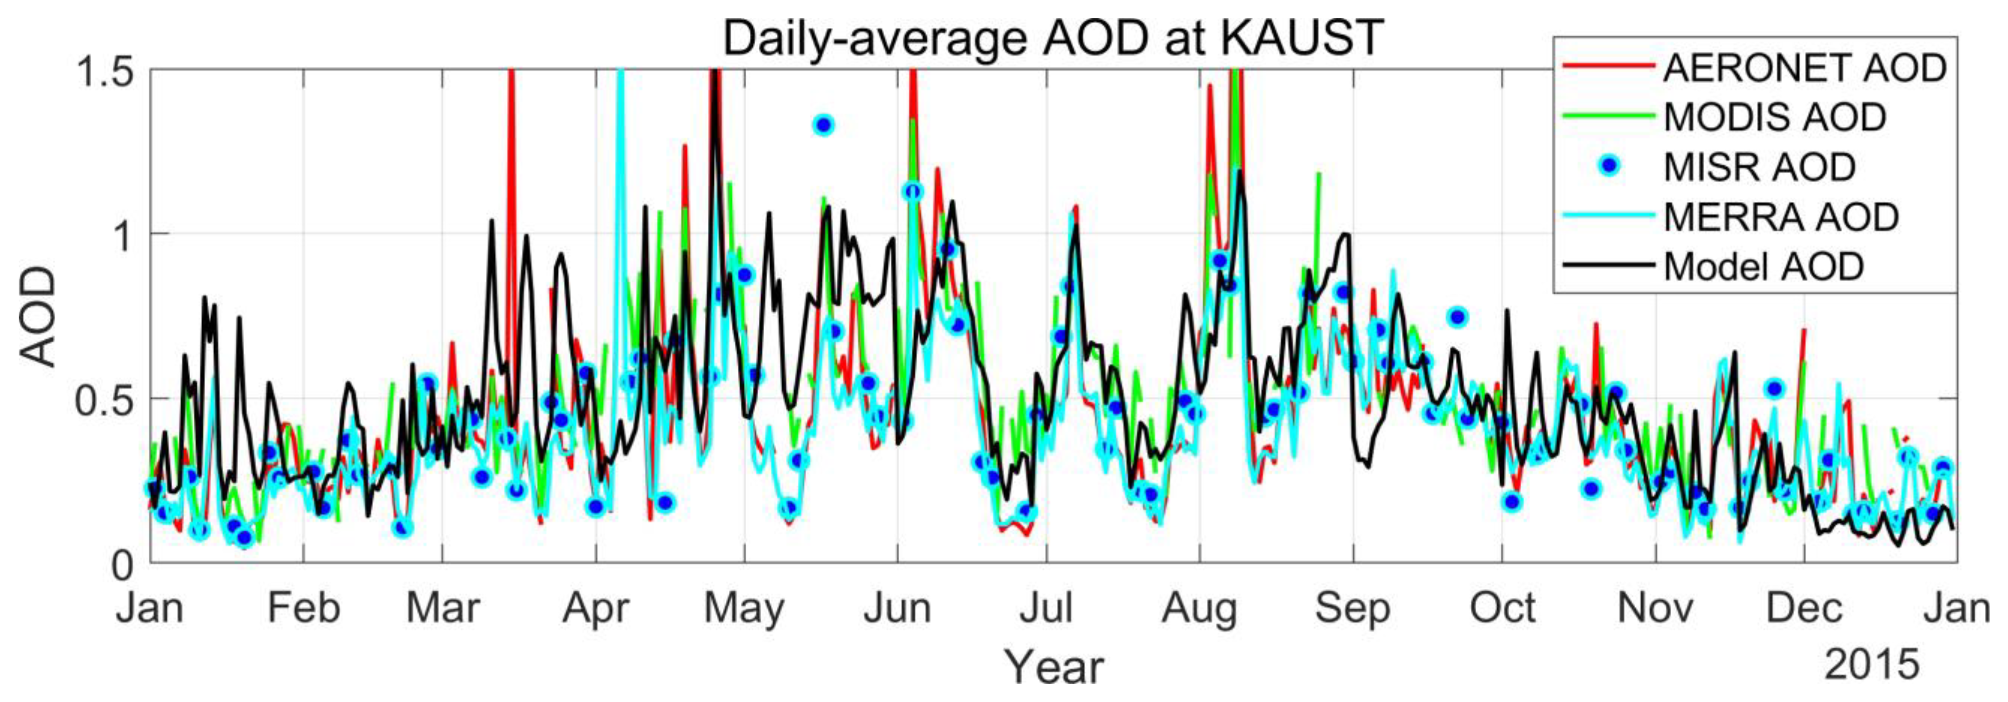
Figure 4Time series of daily-averaged AOD at KAUST (AERONET, MODIS, MERRA-2, and model AODs at 550 nm and MISR AOD at 555 nm).
For a quantitative evaluation of the model results, we calculate the mean bias error (MBE) of the model AOD against the three sets of observations, viz., AERONET, MODIS, and MISR at KAUST. The MBEs calculated using daily-mean values for 2015 are presented in Table 2. We also calculate Pearson's correlation coefficient (ρ) of the simulated AOD against the available observations after removing the seasonal cycle from all observations. The calculated MBE for the model is low against all datasets. The MBE is 13.4 % against the most reliable AERONET data. The model AOD also shows a good correlation with observations, with a correlation coefficient close to 0.5 for all datasets. These results demonstrate that the model-simulated AOD values are reasonable.
Table 2Statisticsa of simulated AOD compared with different observations at KAUST.
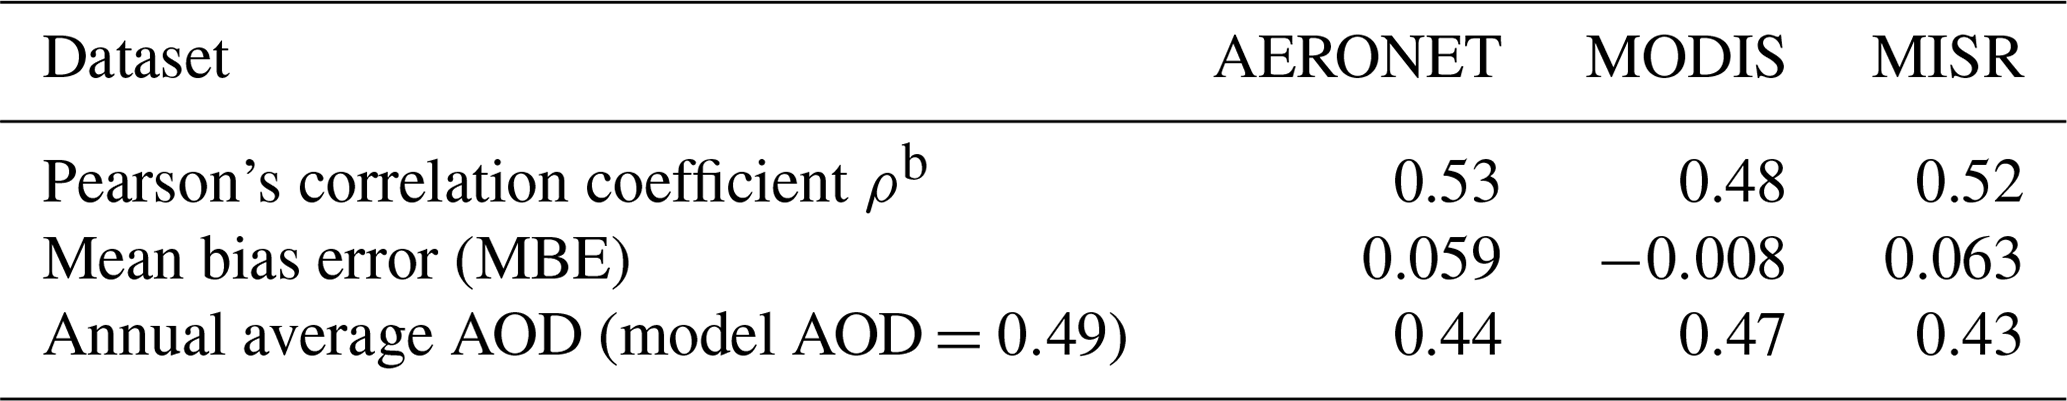
a Calculated using daily-average data for 2015. b All correlation coefficients are significant (p<0.0001).
Figure 5 shows the contribution of different aerosol species to total AOD at KAUST, as simulated by WRF-Chem. Dust is the major contributor to AOD in all seasons, reaching above 90 % in spring and summer. This result is consistent with earlier reported percentage contributions of dust over the region (Kalenderski and Stenchikov, 2016). The anthropogenic contribution is highest in winter but contributes less than 15 %. The contribution of sea salt emissions is also small in all seasons (less than 10 %). These results are also qualitatively consistent with the contributions derived from CALIOP data that use histograms of aerosol type in a grid cell containing the KAUST site (Fig. S2).
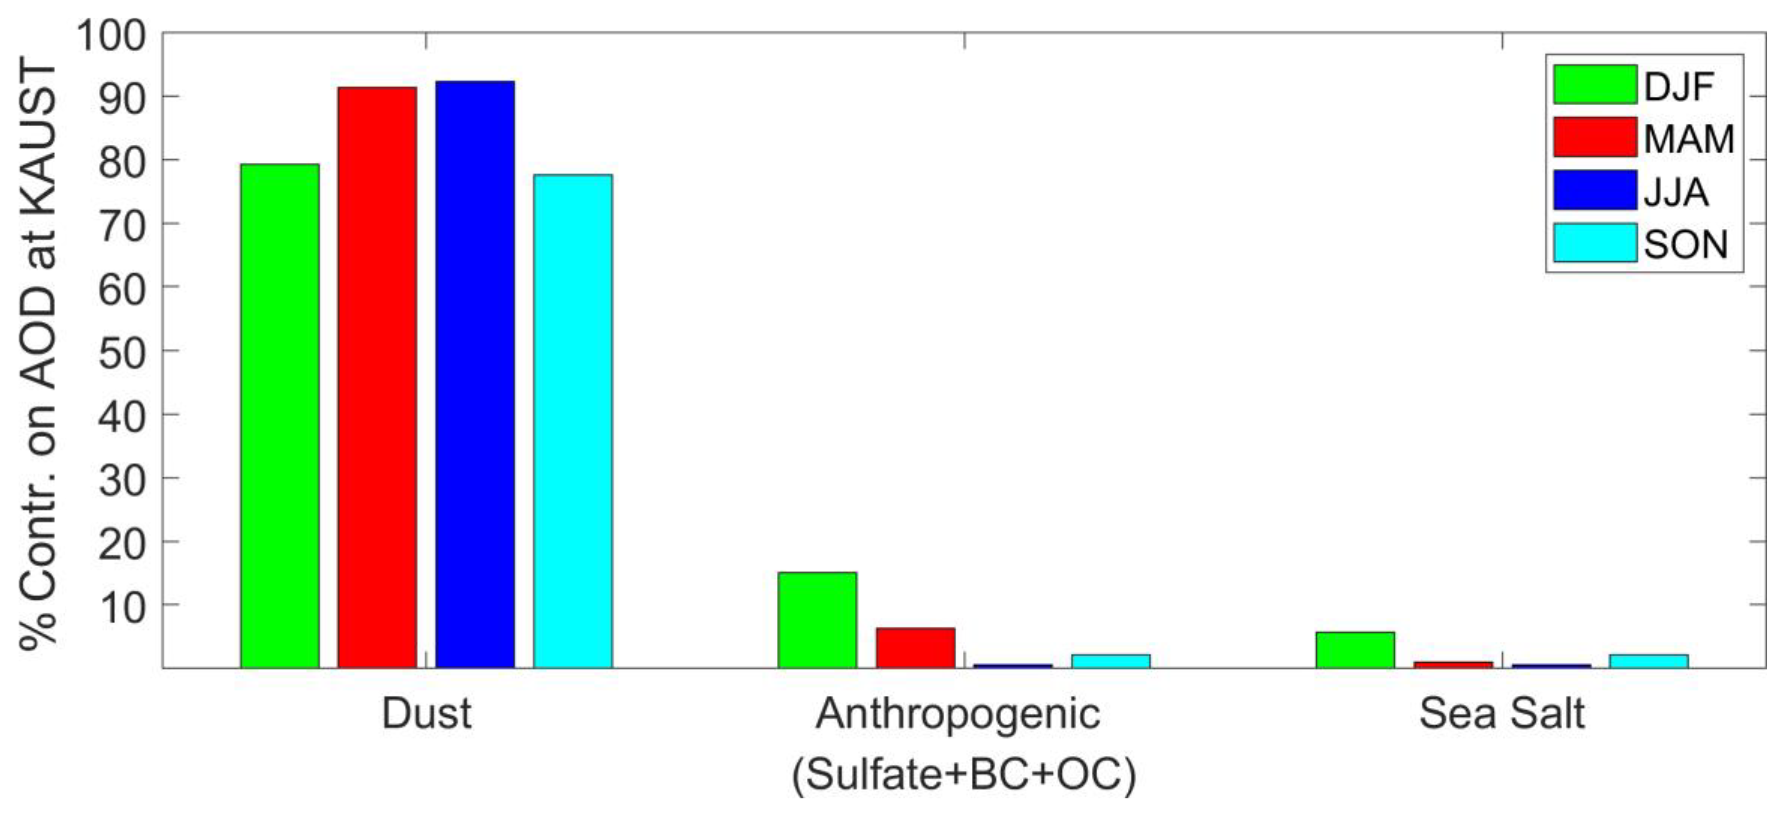
Figure 5Percentage contribution of different aerosol types to total AOD at KAUST as simulated by WRF-Chem.
The size distributions of dust, sea salt, and sulfate are modeled in WRF-Chem using approximations over different size bins. Dust and sea salt are distributed in five and four size bins, respectively, both between 0.1 and 10 µm radius, as detailed in Ukhov et al. (2020b). Sulfate aerosols are distributed in two lognormal modes, the Aitken and accumulation modes. As discussed earlier, dust is the dominant aerosol type; thus, here we compare the volume size distributions of the modeled dust with the AERONET data. Figure 6 shows the column-integrated volume PSD in the model and AERONET data. The simulated and observed volume PSDs are reasonably well matched in all seasons even though the dust in the model is distributed in five bins only (Parajuli et al., 2019; LeGrand et al., 2019). Although the maximum radius of particles in AERONET data is 15 µm, which is larger than the maximum size in the model (10 µm), the majority of particles in the AERONET data fall within the 10 µm range. Recent measurements from aircraft have shown that dust particles can be much larger (Ryder et al., 2019), up to 40 µm in radius, during large-scale dust events (Marenco et al., 2018). However, the optical contribution of such large particles is relatively small. There are two distinct aerosol modes in AERONET PSD data: one finer mode centered around 0.1 µm and another coarse mode centered around 2–3 µm. The coarse mode primarily corresponds to mineral dust (silt) that originates locally and from inland deserts, northeastern Africa, and the Tigris–Euphrates source region (Kalenderski and Stenchikov et al., 2016; Parajuli et al., 2019). The composition of the fine mode is much more complex but usually includes clay particles transported over long distances and anthropogenic aerosols from pollution sources (mainly as sulfate) (Chin et al., 2007; Hu et al., 2016; Prospero et al., 1999). The size distributions of sulfate and sea salt aerosols are presented in the Supplement (Figs. S3 and S4). Note that we use the PSD and AOD data from this AERONET station (KAUST) to retrieve the lidar aerosol extinction profiles used in this study.
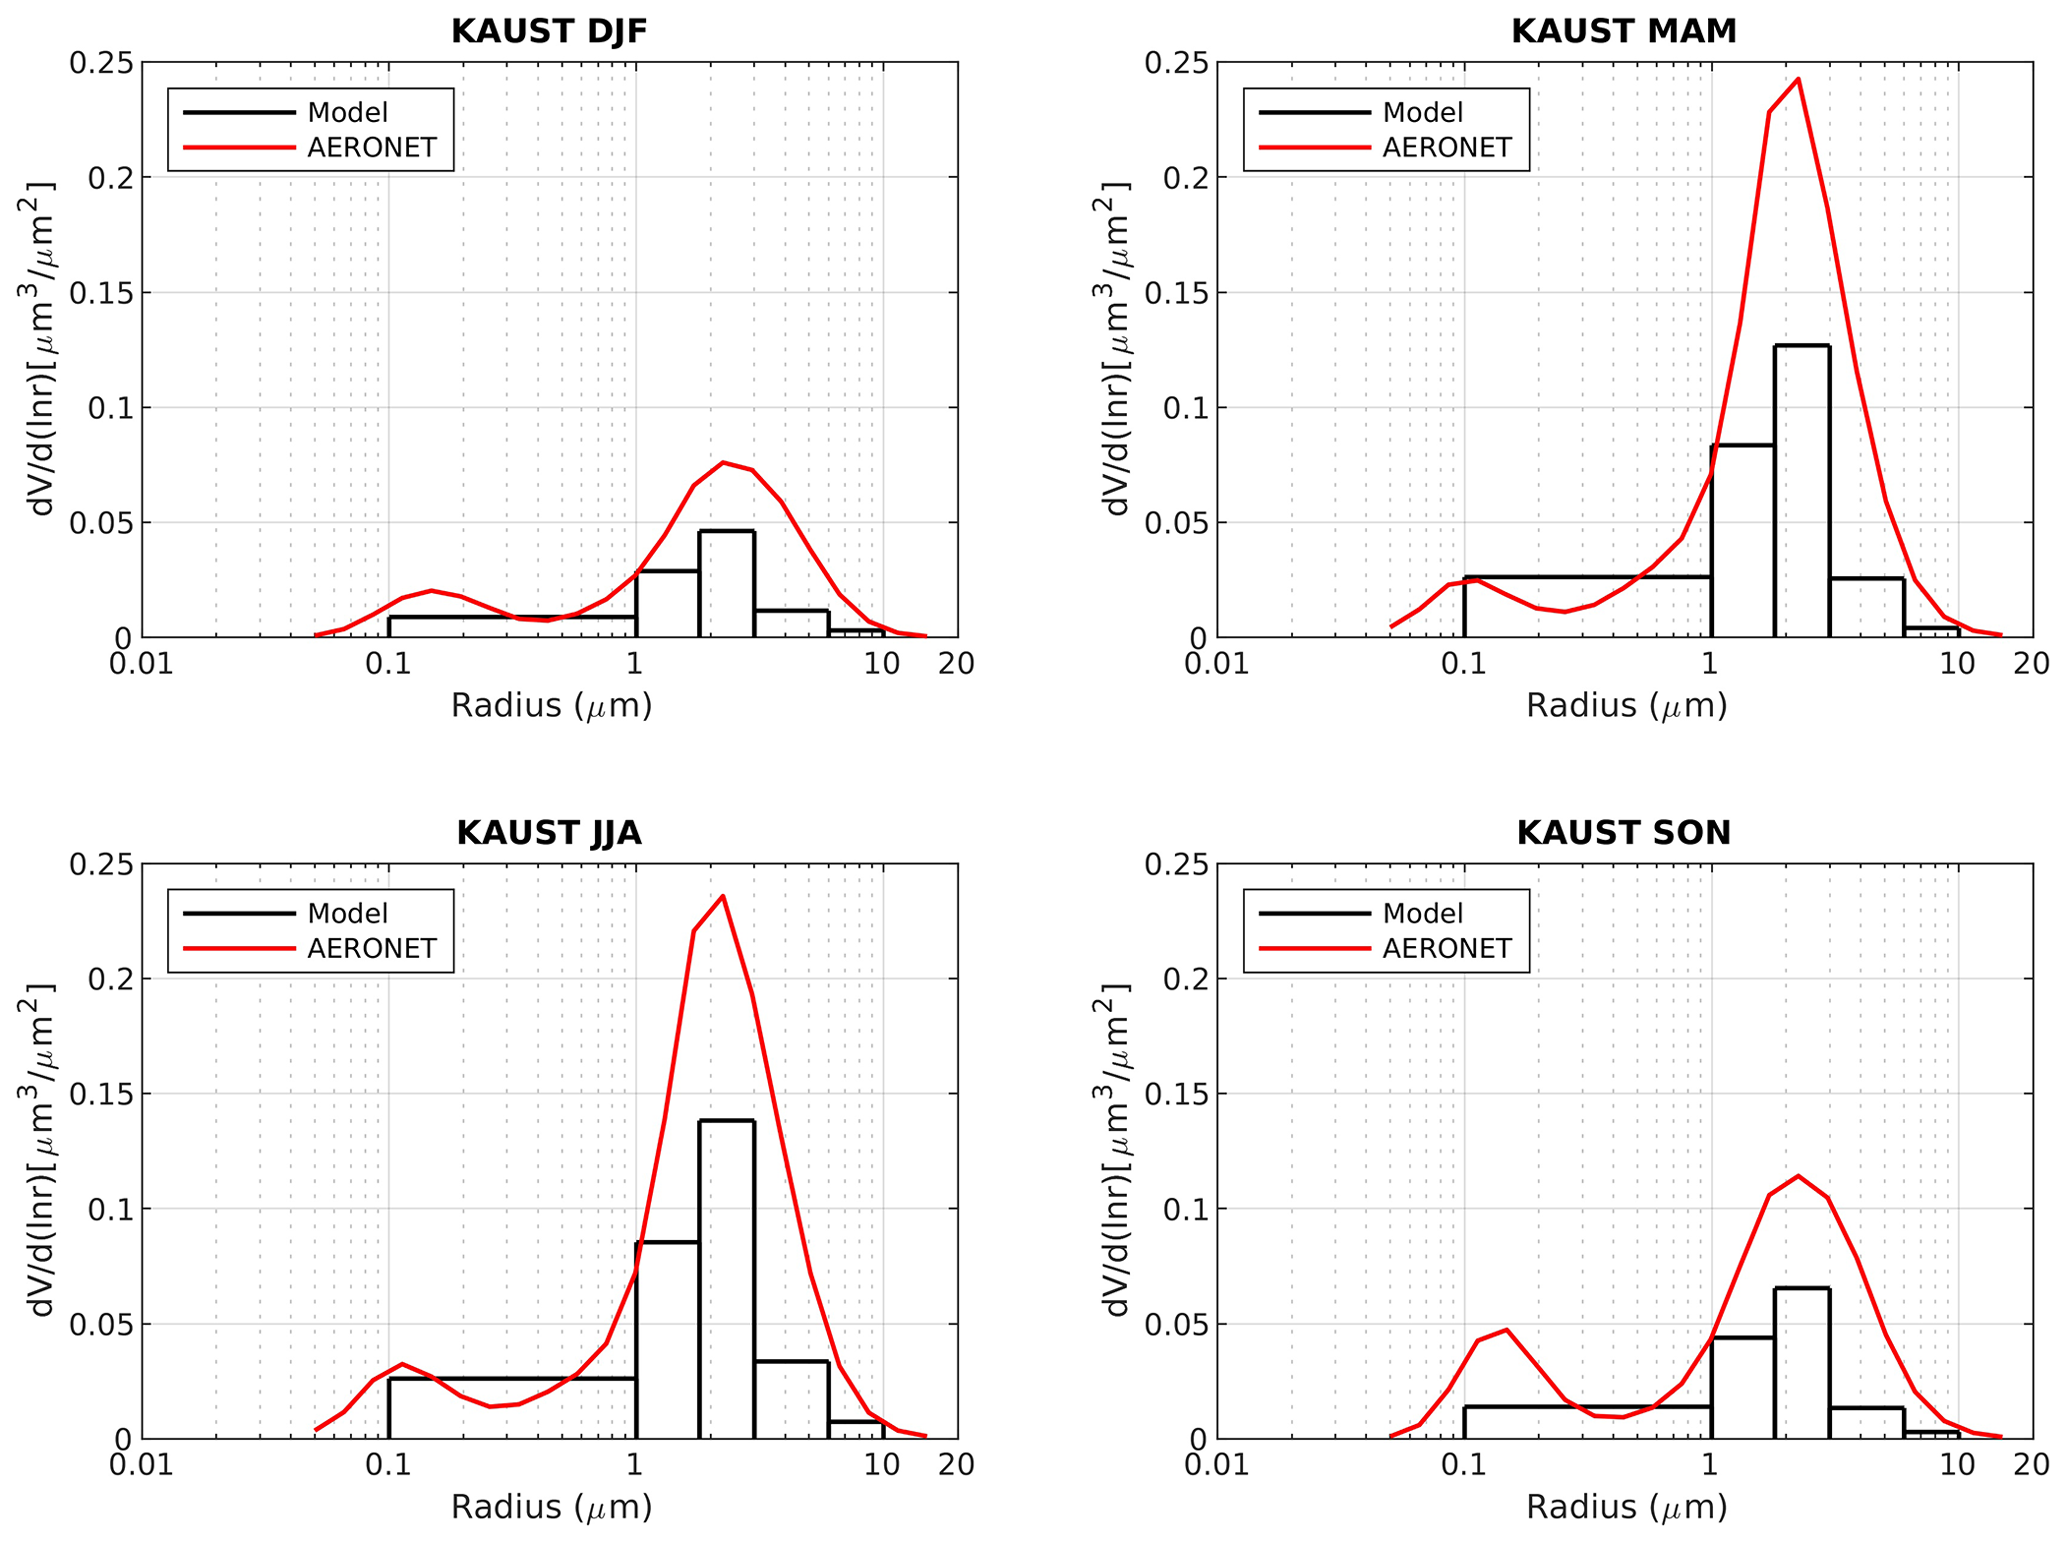
Figure 6Column-integrated volume size distributions and concentrations of only dust from the model, plotted against AERONET aerosol volume concentrations at KAUST.
3.2.3 Case study of a summer-time dust event
A large-scale dust storm swept over the KAUST site on 8 August 2015, as seen in the MODIS image in Fig. 7a. The dust event lasted for 2 d until 9 August. The KAUST AERONET station registered the second-highest AOD of the entire year on 8 August, with the AOD daily mean reaching 2.48. The AERONET Angström exponent (AE 440/675) value showed a sharp reduction on this day, from 0.41 on 6 August to 0.10 on 8 August. This reduction indicates the dominance of coarse-mode dust during the event and that the dust event originated from nearby inland deserts. By 9 August, the dust storm moved towards the south/southwest and spread to a broader region across the Red Sea and northeastern Africa. The MODIS RGB image on 9 August shows a dust plume originating from northeastern Africa around Port Sudan, which, after being deflected by the northerly winds, experiences a marked curvature (Fig. 7b). The SEVIRI RGB dust composite (Fig. 7c), in which the pink color represents atmospheric dust, also shows strong dust activity around the KAUST site on 8 August.
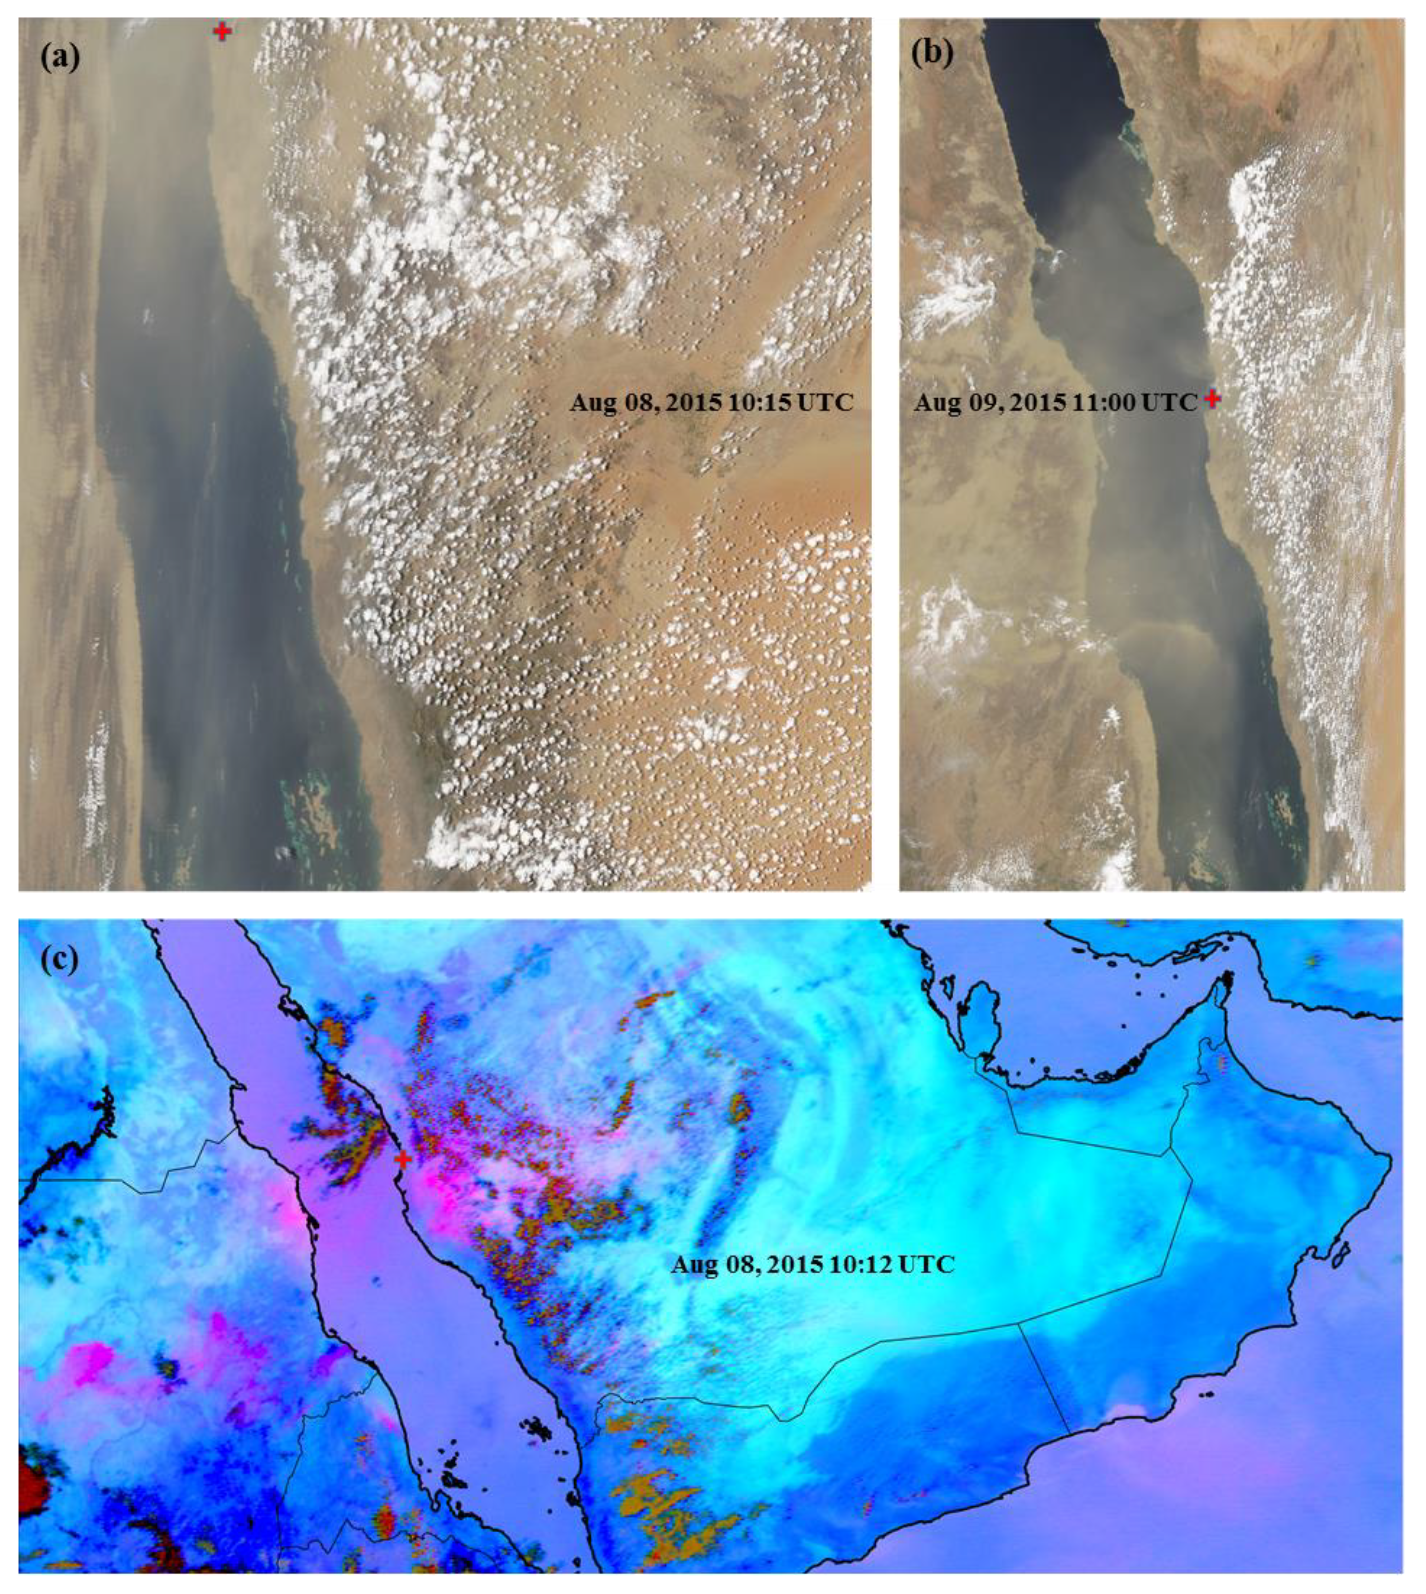
Figure 7MODIS and SEVIRI images during a large-scale dust event. True color images from MODIS on (a) 8 August 2015, 10:15 UTC, (b) 9 August 2015, 11:00 UTC, and (c) Meteosat SEVIRI RGB dust composite for 8 August 2015, 10:12 UTC. The KAUST site is marked by a red (+) mark.
The synoptic conditions of this dust event are somewhat similar to those of a summer-time dust event reported by Kalenderski and Stenchikov (2016), which was centered over northern Sudan. The dust event we describe here is a typical summer-time dust event caused by high winds driven by strong pressure gradients (Alharbi et al., 2013). Although haboob-type dust events commonly occur in the region, analysis of the RGB pink dust composite (Fig. 7c) shows only a few scattered clouds (red and brown patches) over the study site during this period, ruling out the possibility of a haboob dust event. Haboob is a typical dust event that commonly occurs in regions with moist convection, in which dust is generated by strong divergent winds that form around a cold pool of downdrafts (Anisimov et al., 2018).

Figure 8Mean sea level pressure (MSLP) and wind vectors from ECMWF operational analysis data during the dust event (a, b) and MODIS deep blue AOD data overlain by model wind vectors (c, d). The KAUST site is marked by a + sign.
As seen in Fig. 8a, b, a high-pressure system developed in the eastern Mediterranean region and Turkey on 8 August, which expanded towards Africa/Middle East and created stronger winds over the region on 9 August. On 8 August, a low-pressure system developed, which was centered on northeastern Africa (Sudan). Winds converging towards this low from the north/northeast adopted a northeasterly flow pattern, which is characteristic of the Harmattan winds prevalent in the region. The winds originating from the eastern Mediterranean were forced to curve by the Hijaz Mountains in the western Arabian Peninsula, finally converging with the low-pressure system in northeastern Africa and the Red Sea, where the high energy of the flow was finally dissipated. A high-pressure system persisted throughout the dust event over the Ethiopian Highlands and southern Sudan, as shown in Fig. 8a, b. This high-pressure system gave rise to the southerly/southwesterly winds that also converged towards the low-pressure region around northeastern Africa and the Red Sea.
MODIS AOD also showed a high aerosol loading around KAUST (+ symbol in Fig. 8c, d) on 8 August that spread across a larger area towards northeastern Africa on 9 August. Figure 8 shows that the dust mobilization was evidently caused by the northerly/northeasterly winds moving over the study site. The wind vector patterns are very consistent between ECMWF operational analysis (Fig. 8a, b) and model simulations (Fig. 8c, d) for most parts of the domain. This observation is not surprising because we use the ECMWF operational analysis data for the boundary conditions and apply “grid nudging” at each model grid using the same ECMWF dataset. The wind patterns in the two figures differ in some areas, however, especially over the Ethiopian Highlands. Note that the model winds presented are derived from the coarser 12 km domain to show the wind patterns over a larger region beyond our innermost study domain. In the Ethiopian Highlands region, where there is a strong effect from the topography, such a coarse resolution may not be enough to resolve the fine features of the wind circulations. At the study site, however, winds are indeed better resolved in our model because the resolution of the innermost domain is much higher, i.e., 1.33 km.
The model captures the major features of the dust storm reasonably well. Both the model and the AERONET data register this event as the second-largest dust event of 2015. On 9 August, the model shows a daily average (daytime only) AOD of 1.18 compared to 1.79 given by the AERONET data (underestimation by ∼35 %).
Figure 9 compares the vertical profiles of dust provided by model simulations and the KAUST–MPL data during the dust event. The right column in the figure shows the simulated dust extinction coefficient at 550 nm, covering the 3 d during the dust event. Because of the quality constraints applied in the GRASP algorithm, the processed extinction data from KAUST–MPL are only partially available during this event. Therefore, we present the raw normalized relative backscattering (NRB) from the KAUST–MPL to examine the evolution of this dust event qualitatively, as shown in Fig. 9. Note that around noon local time in summer, the KAUST–MPL field of view is covered to avoid the Sun's glare, which is why there is a gap in the data around this time. In the KAUST–MPL NRB data (Fig. 9, left column), the dust plume appears as early as 8 August (∼05:00 UTC) at a height of 1–1.5 km, indicating the onset of the dust storm. This dust plume becomes strongest by 9 August, covering a large part of the atmospheric column with dust. Although the onset of the dust event is slightly earlier in the model compared to KAUST–MPL data, the model also shows high dust activity on 9 August, consistent with KAUST–MPL observations. The dust is mainly confined within a height of ∼2 km, which is consistent in both datasets.
The model data show a high aerosol extinction at a height of ∼6 km on 9/10 August, particularly at night (Fig. 9), which will be discussed further later. The demise timing of the dust storm is consistent in both the model and KAUST–MPL data.
When the dust-laden Harmattan winds arrive at the Red Sea coast, they encounter the land or sea breezes depending upon the time of arrival, as discussed further in Sect. 4.3. When they meet with the opposite sea breeze flow, the air mass rises up, bringing the dust to the upper levels. Such higher intrusion of dust is evident in the KAUST–MPL data (Fig. 9, left) in the afternoon, during which the sea breezes are most active. The suspended dust is still visible in the upper levels (∼2–3 km) in the night of 10 August, because the dust particles have not been deposited yet.
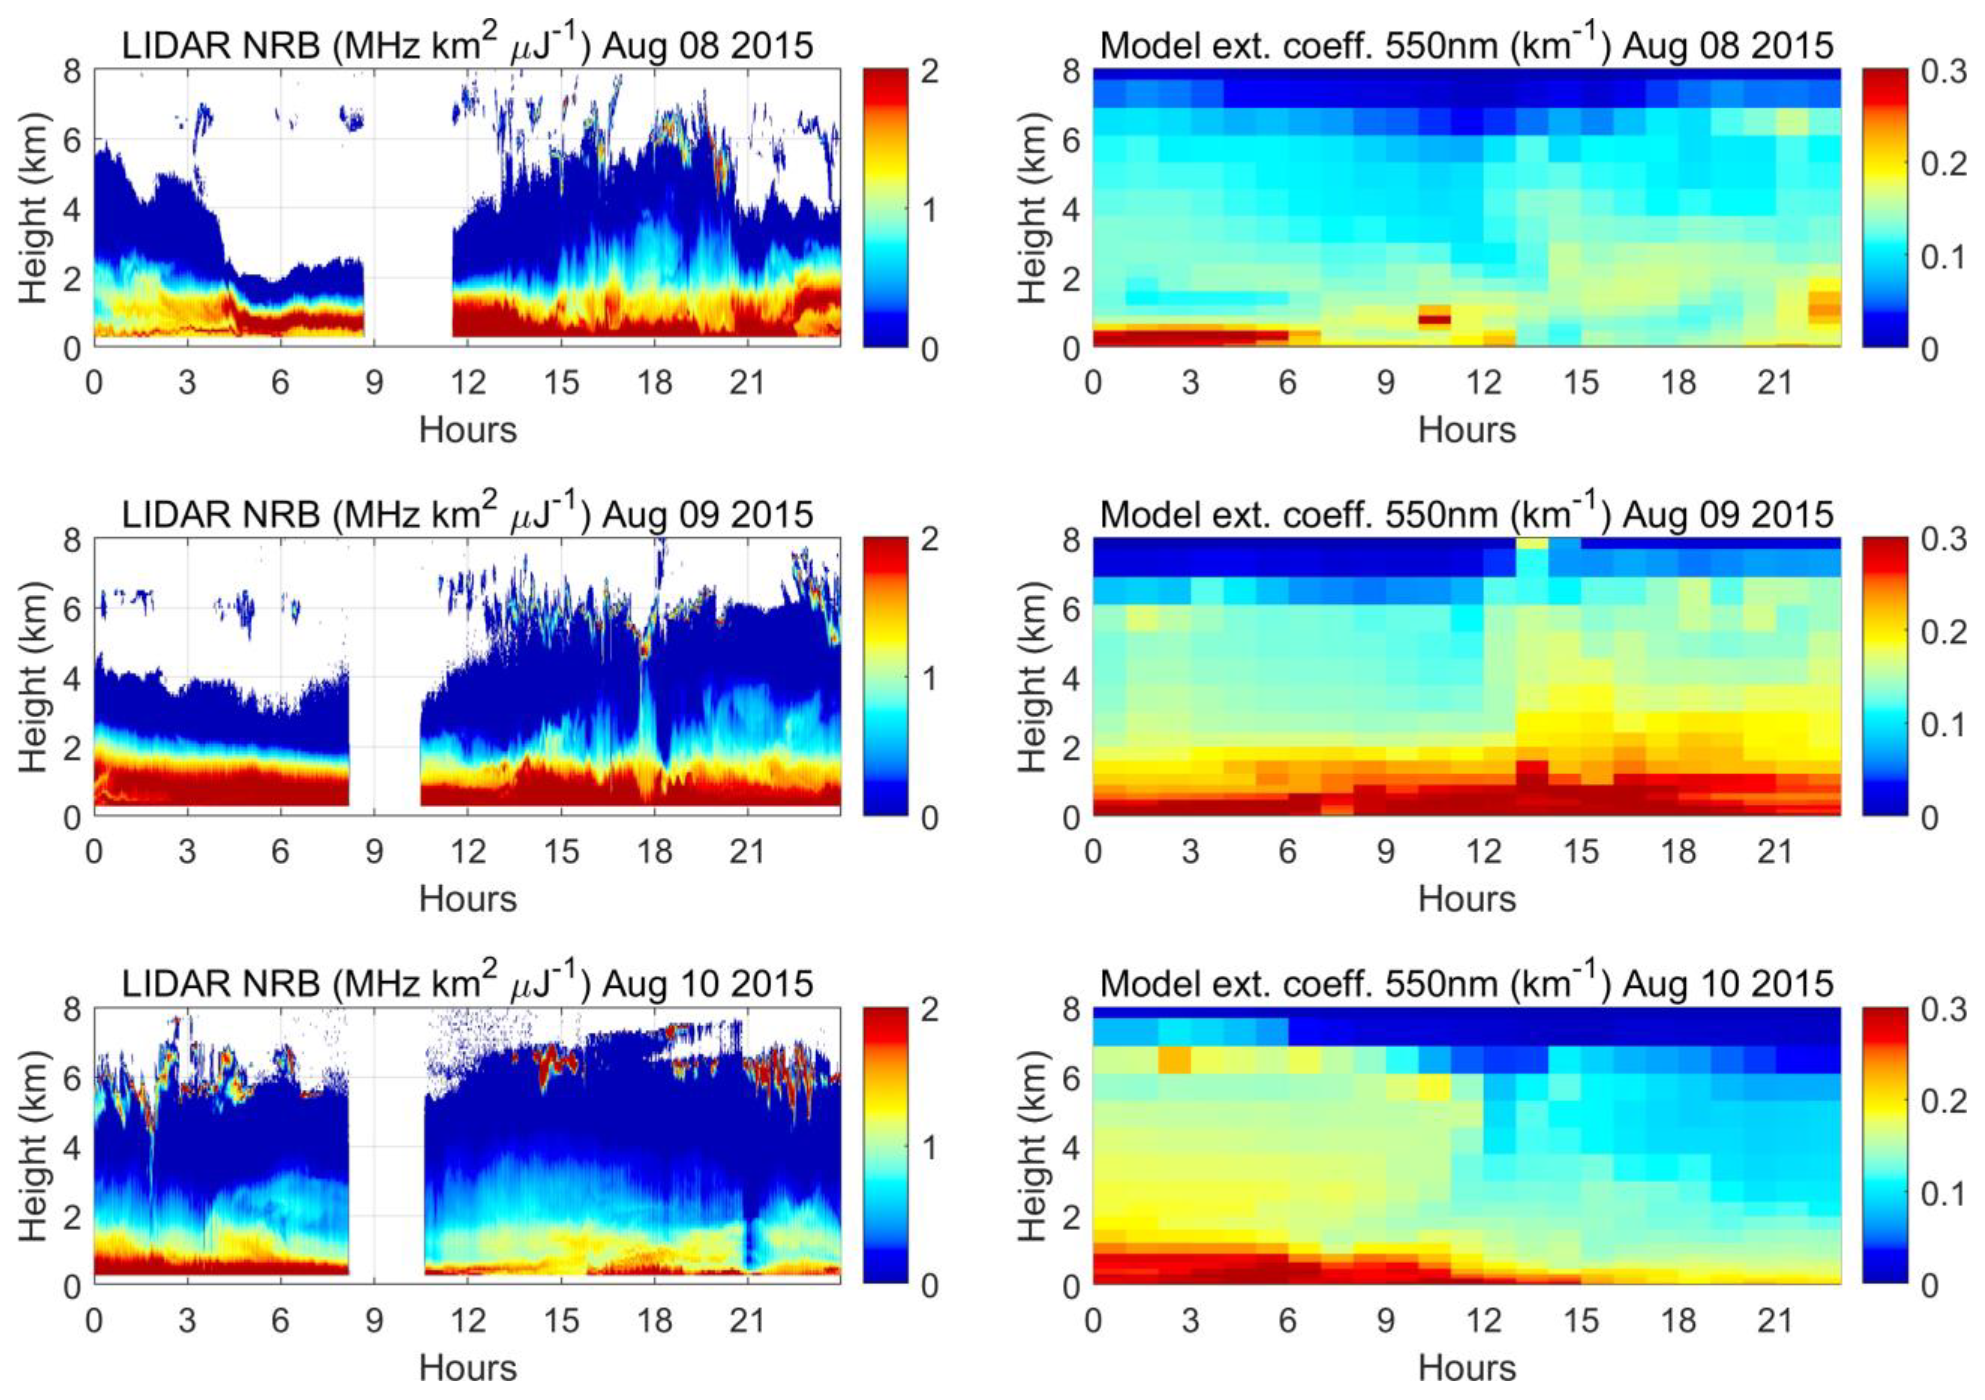
Figure 9Natural logarithm of normalized relative backscatter (NRB) at 532 nm measured at the KAUST–MPLNET station (left column) and the model-simulated dust extinction coefficient at 550 nm (right column) during the dust event of 8/9 August. Times are reported in UTC.
3.3 Vertical profiles
3.3.1 Comparison of extinction profiles from KAUST–MPL and CALIOP data
Figure 10 shows the comparison of aerosol extinction from KAUST–MPL and CALIOP, both of which show a similar profile. Most aerosols in the atmosphere are confined within the troposphere below 8 km altitude, which is consistent in both datasets. However, the KAUST–MPL underestimates the extinctions near the surface compared to CALIOP data. Moreover, the nighttime dust events observed in the KAUST–MPL data are not present in the CALIOP data.
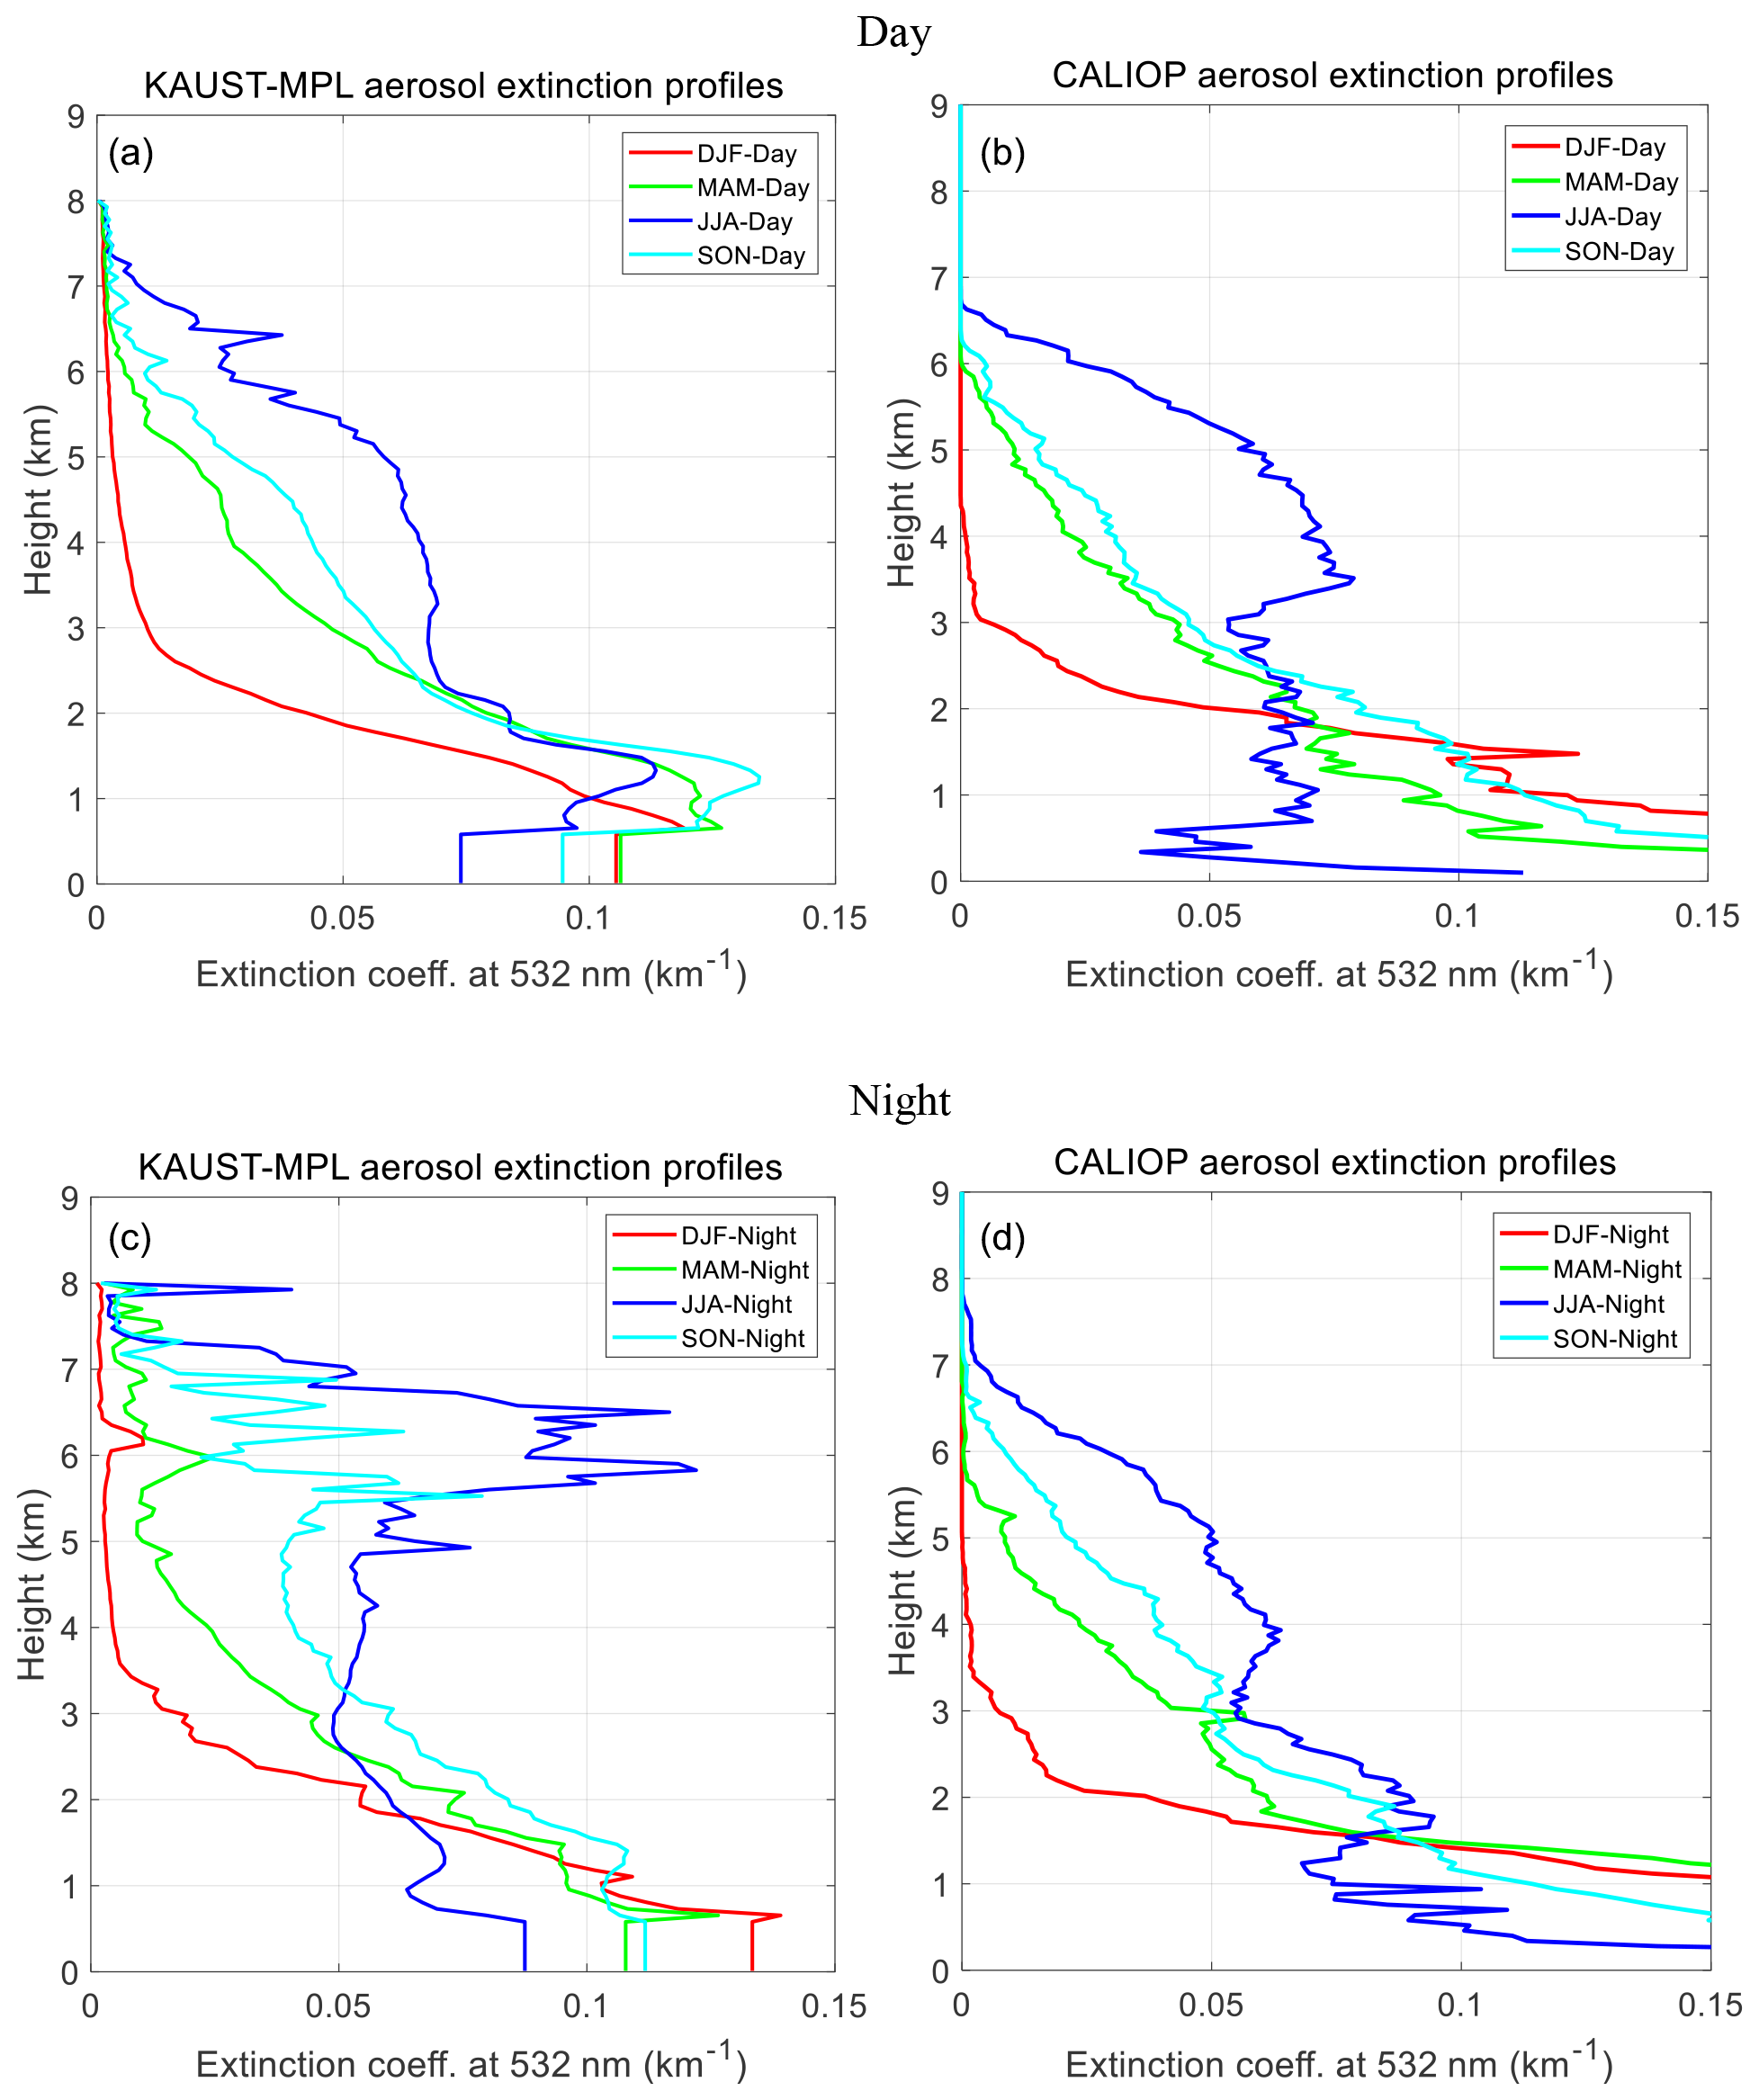
Figure 10Comparison of seasonal average (2015/16) of aerosol extinction from KAUST–MPL (a, c) and CALIOP (b, d) shown separately for day (a, b) and night (c, d). Heights are above sea level (a.s.l.).
Note that CALIOP extinction profiles represent data averaged over a large grid box (2×5∘) that contains the KAUST site. As such, CALIOP represents the larger regional-scale vertical structure of aerosols compared to KAUST–MPL, which represents a more local structure. Above ∼2 km, except for nights during summer and fall, the profiles of the two datasets are much more similar, indicating the presence of a stable aerosol layer spread throughout the region. This similarity is understandable because local fluctuations closer to ground level do not penetrate much above 2 km in winter. Below ∼2 km, there are more significant differences between the profiles. Note that the elevated aerosol loading present in the KAUST–MPL data at about 1–2 km height is not present in the CALIOP data. It is also worth mentioning that the MPL does not provide reliable observations in the lowest 550 m, and CALIOP loses accuracy near the surface.
3.3.2 Comparison of extinction profiles between KAUST–MPL and model simulations
Figure 11 shows the seasonally averaged vertical profiles of aerosol extinction from KAUST–MPL and model simulations, shown separately for day and night. The height of the top of the aerosol layer and the contrast of profiles in different seasons in the KAUST–MPL data and the model output are similar. The vertical profiles compare reasonably well, with similar orders of extinction in the daytime, especially considering the range of discrepancy in the KAUST–MPL and CALIOP data that we discussed above. The magnitude of extinctions in the model and KAUST–MPL are in good agreement in the nighttime as well, except in summer and spring, in which cases the KAUST–MPL data show higher extinctions, particularly above the PBL.
KAUST–MPL data show a distinct aerosol layer located between 5.5 and 7 km, especially in the nighttime, summer, and fall. The model does not show such dust layers. KAUST–MPL daytime data show a typically elevated maximum of dust extinction in the PBL centered around 1.5 km altitude. The model does not identify such a dust loading profile either. The KAUST–MPL and model profiles agree better in the daytime than in the nighttime and in winter compared to other seasons. However, there are no significant differences between daytime and nighttime profiles in the model. Note that the shape of the profile is reversed during the nighttime, which the model reproduces weakly. We explore this particularly interesting shape of the extinction profile at ∼1–2 km in the daytime in Sect. 3.4. As discussed later, these unique features of the profiles are related to the effect of land/sea breezes and topography.
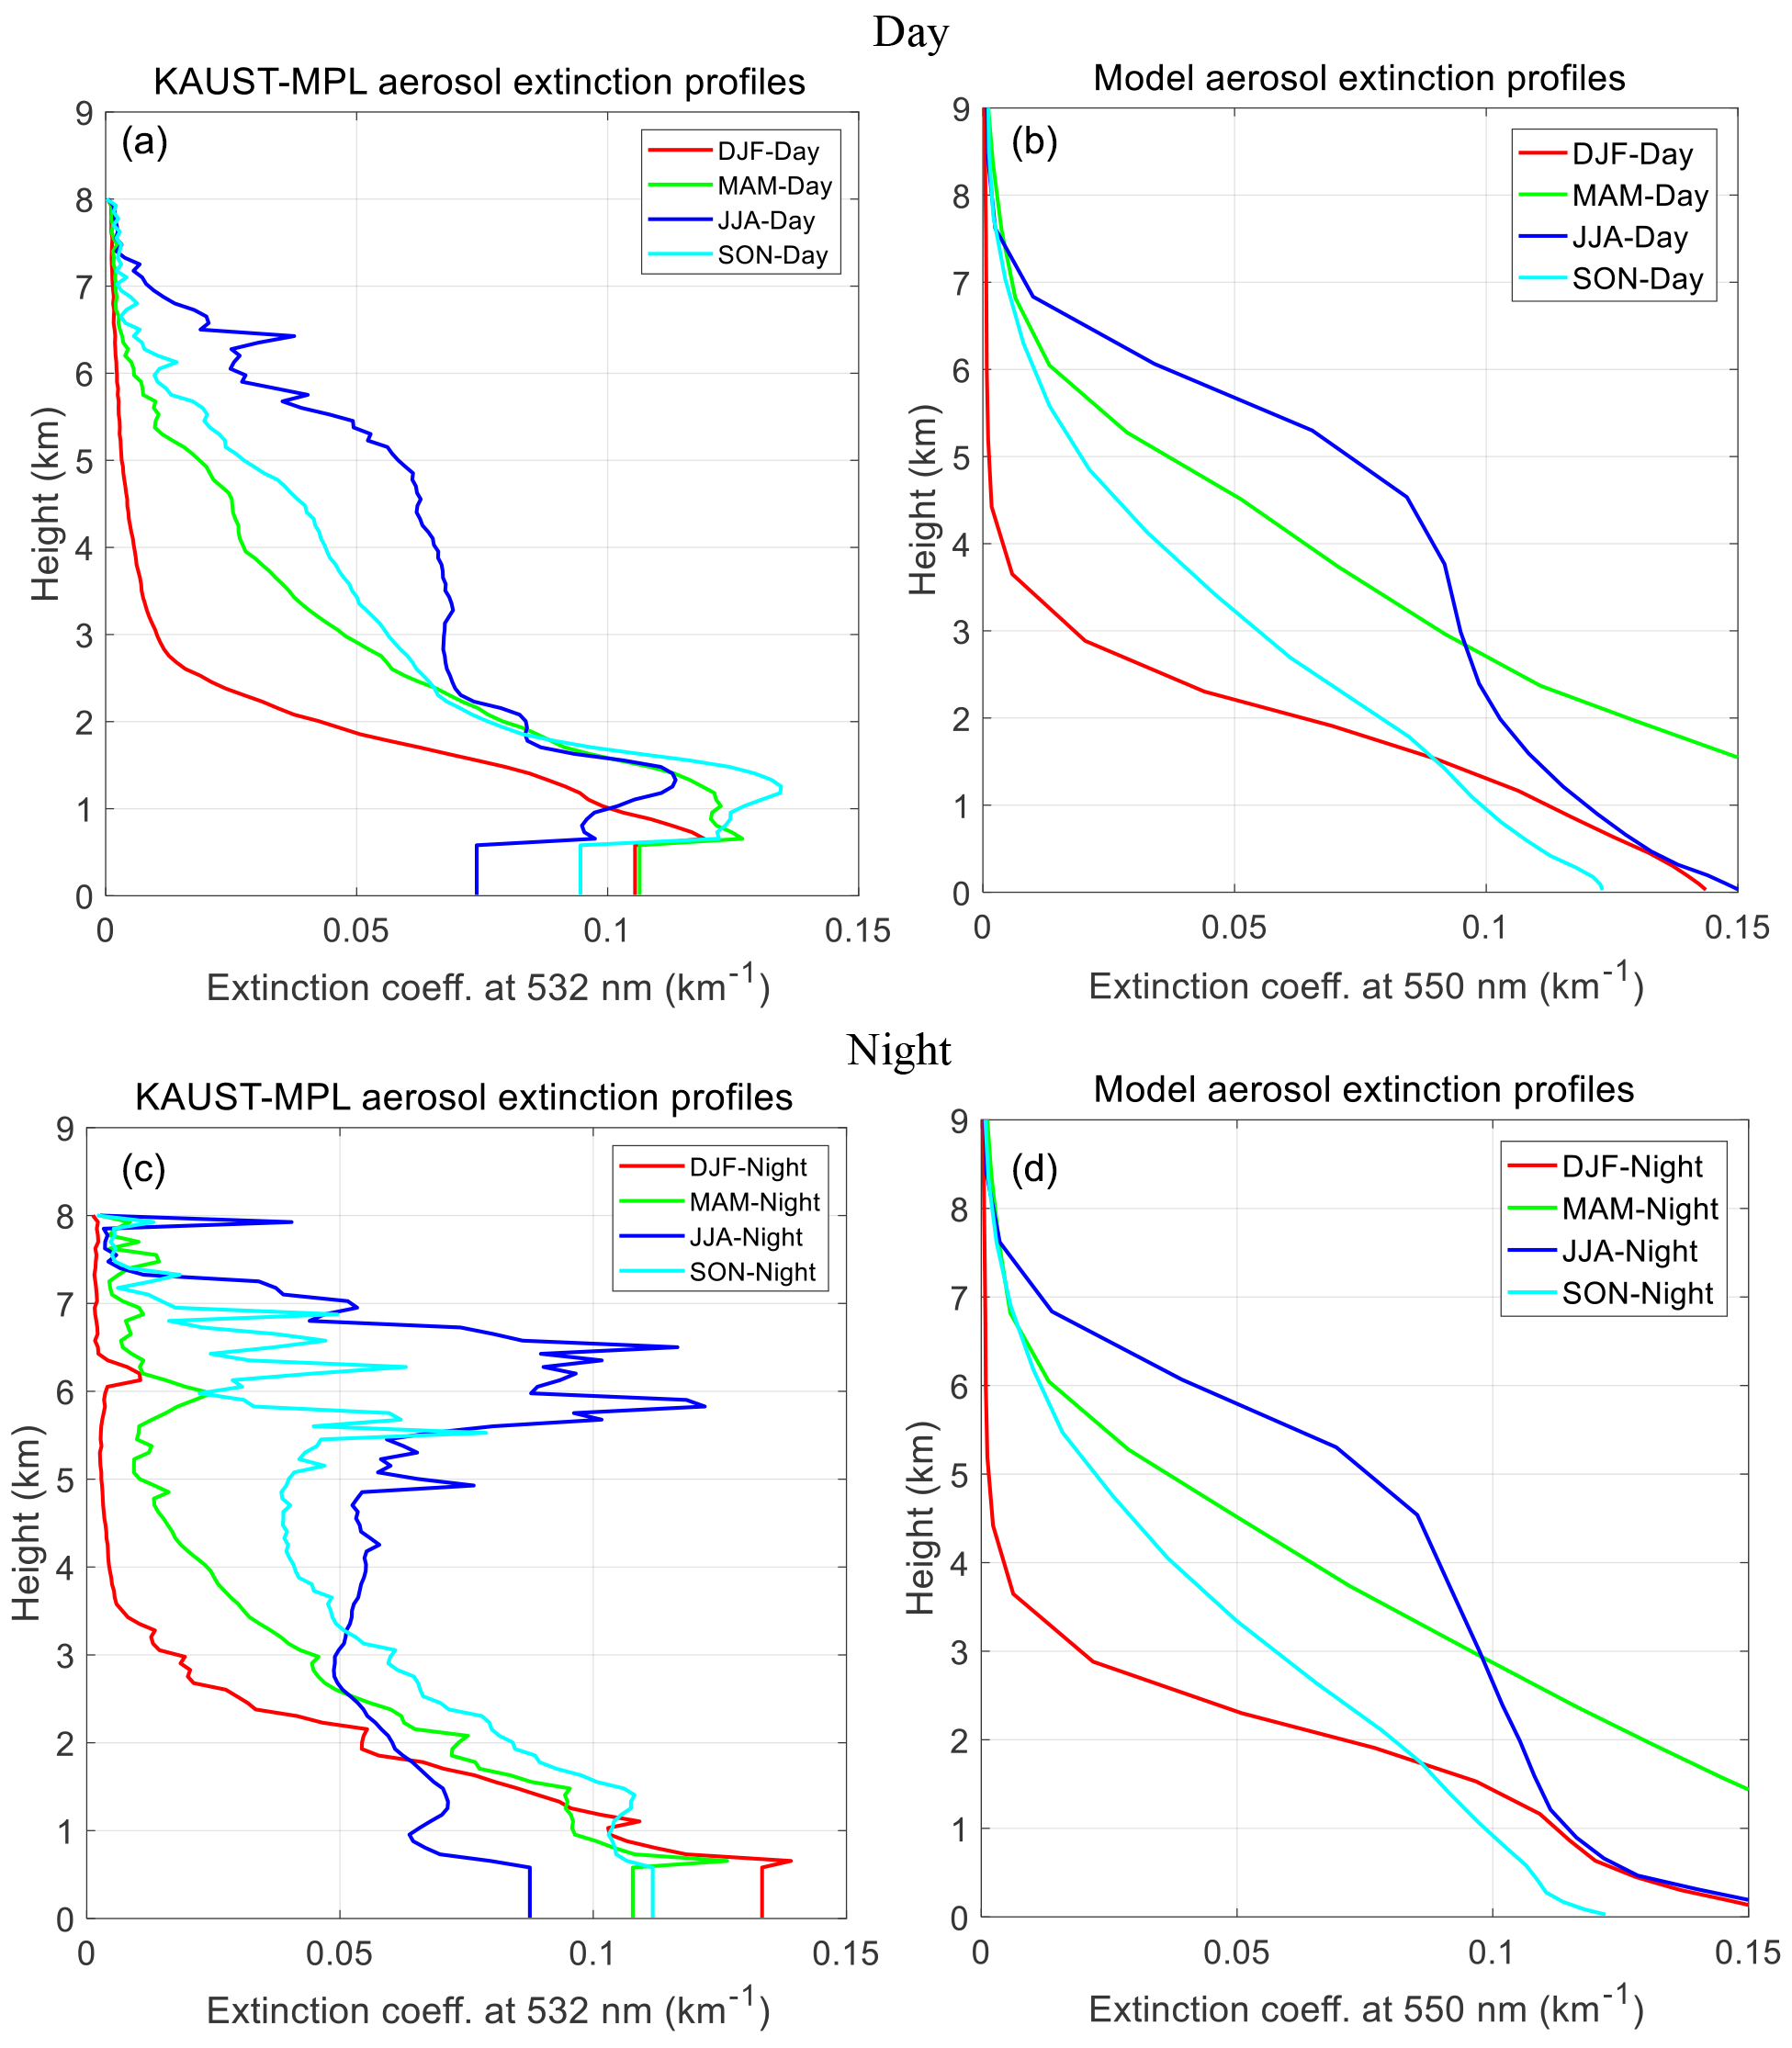
Figure 11KAUST–MPL-retrieved (a, c) and model-simulated (b, d) aerosol extinction profiles for different seasons presented separately for the daytime (a, b) and nighttime (c, d). The measurement times of all KAUST–MPL data available for daytime fall between 05:00 and 15:00 UTC, and nighttime data fall between 17:00 and 02:00 UTC. For the model, the daytime and nighttime data represent data between these times.
To understand the causes of the elevated dust maxima in the KAUST–MPL profiles at ∼1–2 km altitude in the daytime and 5.5–7 km in the nighttime, we separately analyzed the profiles under clear-sky and dusty conditions. We define “clear days” as the days with a daily mean of AOD at KAUST less than 0.25 and “dusty days” as the days with daily-mean AOD greater than 0.75, using either MODIS AOD or AERONET AOD to maximize data availability during large-scale dust events.
Figure 12 shows the average extinction profiles for clear and dusty conditions from KAUST–MPL data for 2015/16 obtained using the above criteria. The daytime profile (Fig. 12, left) shows a similarly elevated dust loading at 1–2 km height, as noted earlier in Figs. 10 and 11, but it is much more prominent. Since “dusty days” correspond to very high AOD conditions (AOD >0.75) expected during dust storms, we can infer that the observed elevated dust loading at 1–2 km corresponds to large-scale dust storms. Studies have shown that this shape is characteristic of dust profiles observed during large-scale dust events near land–ocean boundaries (Khan et al., 2015; Senghor et al., 2017). Marenco et al. (2018) also observed a similarly elevated dust loading over the eastern Atlantic at a comparable height in their airplane observations during the “heavy dust” period.
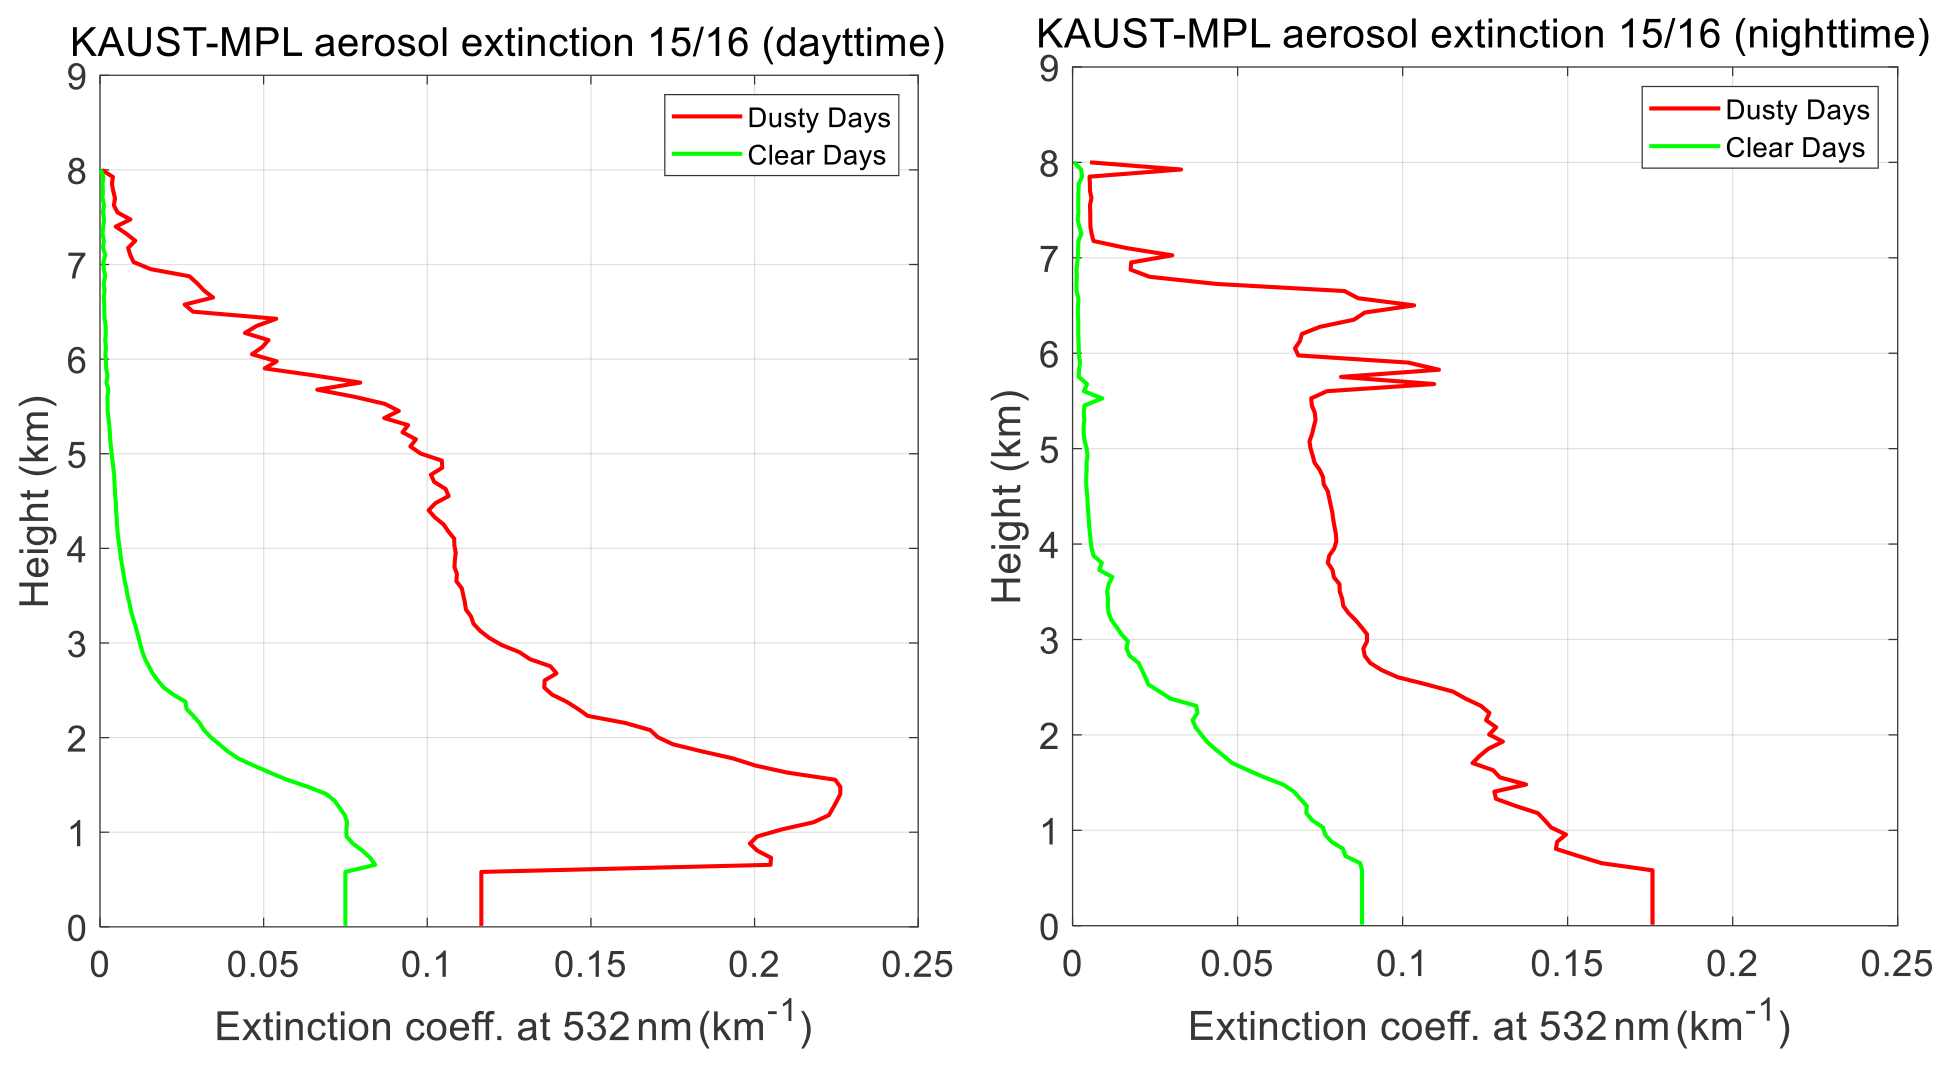
Figure 12Average vertical profiles of aerosol extinction corresponding to “clear days” and “dusty days” from KAUST–MPL data.
The elevated dust layer during the nighttime at the height of 5.5–7 km observed earlier in summer and fall (Figs. 10 and 11) is present on the “dusty days” and is absent on “clear days” (Fig. 12, right). The above analysis again tells us that the high dust loadings at 5.5–7 km in the night are also associated with large-scale dust events. However, it becomes vital to understand the source of these large-scale, nighttime dust events. Based on our results, we suggest that this nighttime dust represents transported dust from inland deserts. More vigorous convection in the inland desert regions during the daytime carries aerosols to higher altitudes. Over deserts in summer, convection is most energetic in the afternoon. The planetary boundary layer height (PBLH) can reach well above 5 km (Fig. S5). By the evening, the dust is mixed thoroughly within the PBL by the strong convection (Khan et al., 2015). At night, the PBL weakens and breaks the capping inversion (Fig. S6), which allows the dust-laden layer from the PBL to mix into the free troposphere and be transported to long distances. As an example, we noted such high intrusion of dust during the night of 9 August (21:00 and 02:00 UTC) in the lidar backscatter data of our case study (Fig. 9). The dust that lies above the PBL is ultimately carried to our site by the accelerated easterly geostrophic winds (Almazroui et al., 2018) and arrives at our site during the night. Therefore, the dust layers at 5–7 km observed in the nighttime likely represent dust of non-local origin transported from inland deserts at higher altitudes.
The dust transport process to our site is evident if we look at the wind vectors at higher altitudes. As Fig. S7 shows, the winds are northeasterly below ∼6 km, which are the regionally prevalent “trade winds” commonly called Harmattans. Above ∼6 km, the winds are easterly. Thus, these two wind patterns are responsible for transporting dust from the inland deserts to the study site. The geostrophic easterly wind transports dust at higher altitudes (6–7 km), and Harmattan transports dust at lower altitudes (1–2 km), which is why KAUST–MPL data show elevated dust loading at these heights. In the winter, such transport of dust from deserts to our site is impossible because the upper-level winds are westerly (Fig. S8).
3.3.3 Comparison of vertical profiles of dust concentrations
Figure 13 shows the vertical profile of aerosol concentrations per seasons simulated by the model compared with KAUST–MPL data and MERRA-2 reanalysis. We have presented these plots despite their broad resemblance to extinction profiles presented earlier (Fig. 11) because “concentrations” are more useful from an air quality perspective and MERRA-2 provides mixing ratios of different aerosols rather than extinctions. The variation in concentration profiles in different seasons is reasonably consistent in all three datasets. The elevated dust maxima at a height of ∼1.5 km observed in the KAUST–MPL profiles are not present in the model or the MERRA-2 data. Both the model and MERRA-2 tend to overestimate aerosol concentrations compared to KAUST–MPL data in summer and in the lower atmosphere, particularly below 1 km. The model-simulated near-surface concentrations in summer are twice as large as those in the lidar data. This overestimation is counter-intuitive because the model AOD agrees well with the AERONET AOD (Fig. 4) used to constrain lidar aerosol profiles. This discrepancy is related to the size distribution of particles. For AOD to be consistent in the model and lidar data, the model must overestimate the concentration of coarse particles in the lower atmosphere. Therefore, we can infer that the model overestimates the concentrations of coarse particles in the lower atmosphere relative to the observed concentrations, which appears to contradict the results of Ryder et al. (2019).
In winter, the boundary layer is shallower. The concentration profile resembles a typical profile that might be expected in a turbulent boundary layer, in which the concentration rapidly decreases with height, as observed in the field (e.g., Selezneva, 1966) and wind tunnel experiments (e.g., Neuman et al., 2009). In summer, the boundary layer is deeper, and the strong turbulent mixing transports dust higher into the atmosphere; consequently, the concentration profile is steeper.
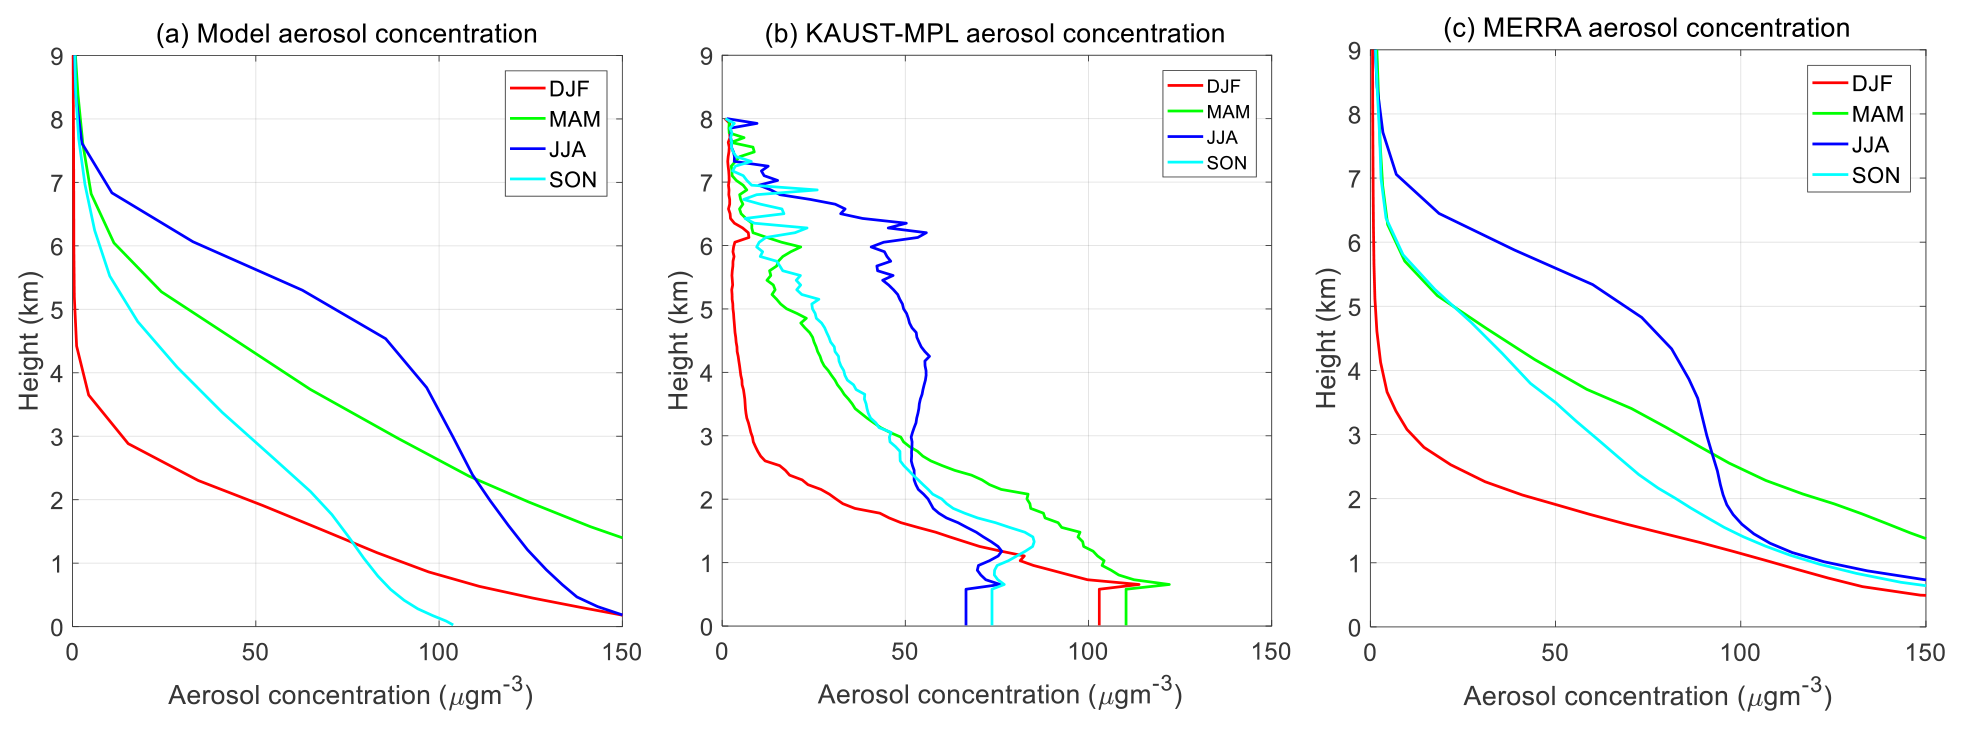
Figure 13Comparison of the vertical profiles of total aerosol concentrations among (a) the model, (b) KAUST–MPL, and (c) MERRA-2 data for different seasons at KAUST. For MERRA-2 and model data, total aerosol concentration is the sum of dust, sea salt, sulfate, OC and BC.
3.4 Diurnal cycle of aerosols
Figure 14 shows the diurnal cycles of aerosol extinction in KAUST–MPL data across the entire atmospheric column. Dust is generally confined within the lowest ∼2 km in winter and reaches ∼6 km in summer, following the seasonal and diurnal variations of the PBL. Note that there are some gaps in the KAUST–MPL data because of the quality controls applied. In summer, there is significant dust activity in the morning (∼06:00 local time), and in spring, dust activity peaks throughout the afternoon. In winter, the KAUST–MPL shows more vigorous dust activity in the nighttime (21:00 to 00:00 local time) near the surface. This increased dust activity at night is due to the effect of land breezes, which are strongest in winter (Fig. 2). We explore the effect of breezes on dust emissions and transport in Sect. 3.5. KAUST–MPL shows high extinctions at a height of 6–7 km, particularly in the evening of summer and fall, which represent long-range transported dust during large-scale dust events. Such high-intensity dust events are more frequent in summer and fall, as observed in the KAUST–MPL data (Figs. 10 and 11).
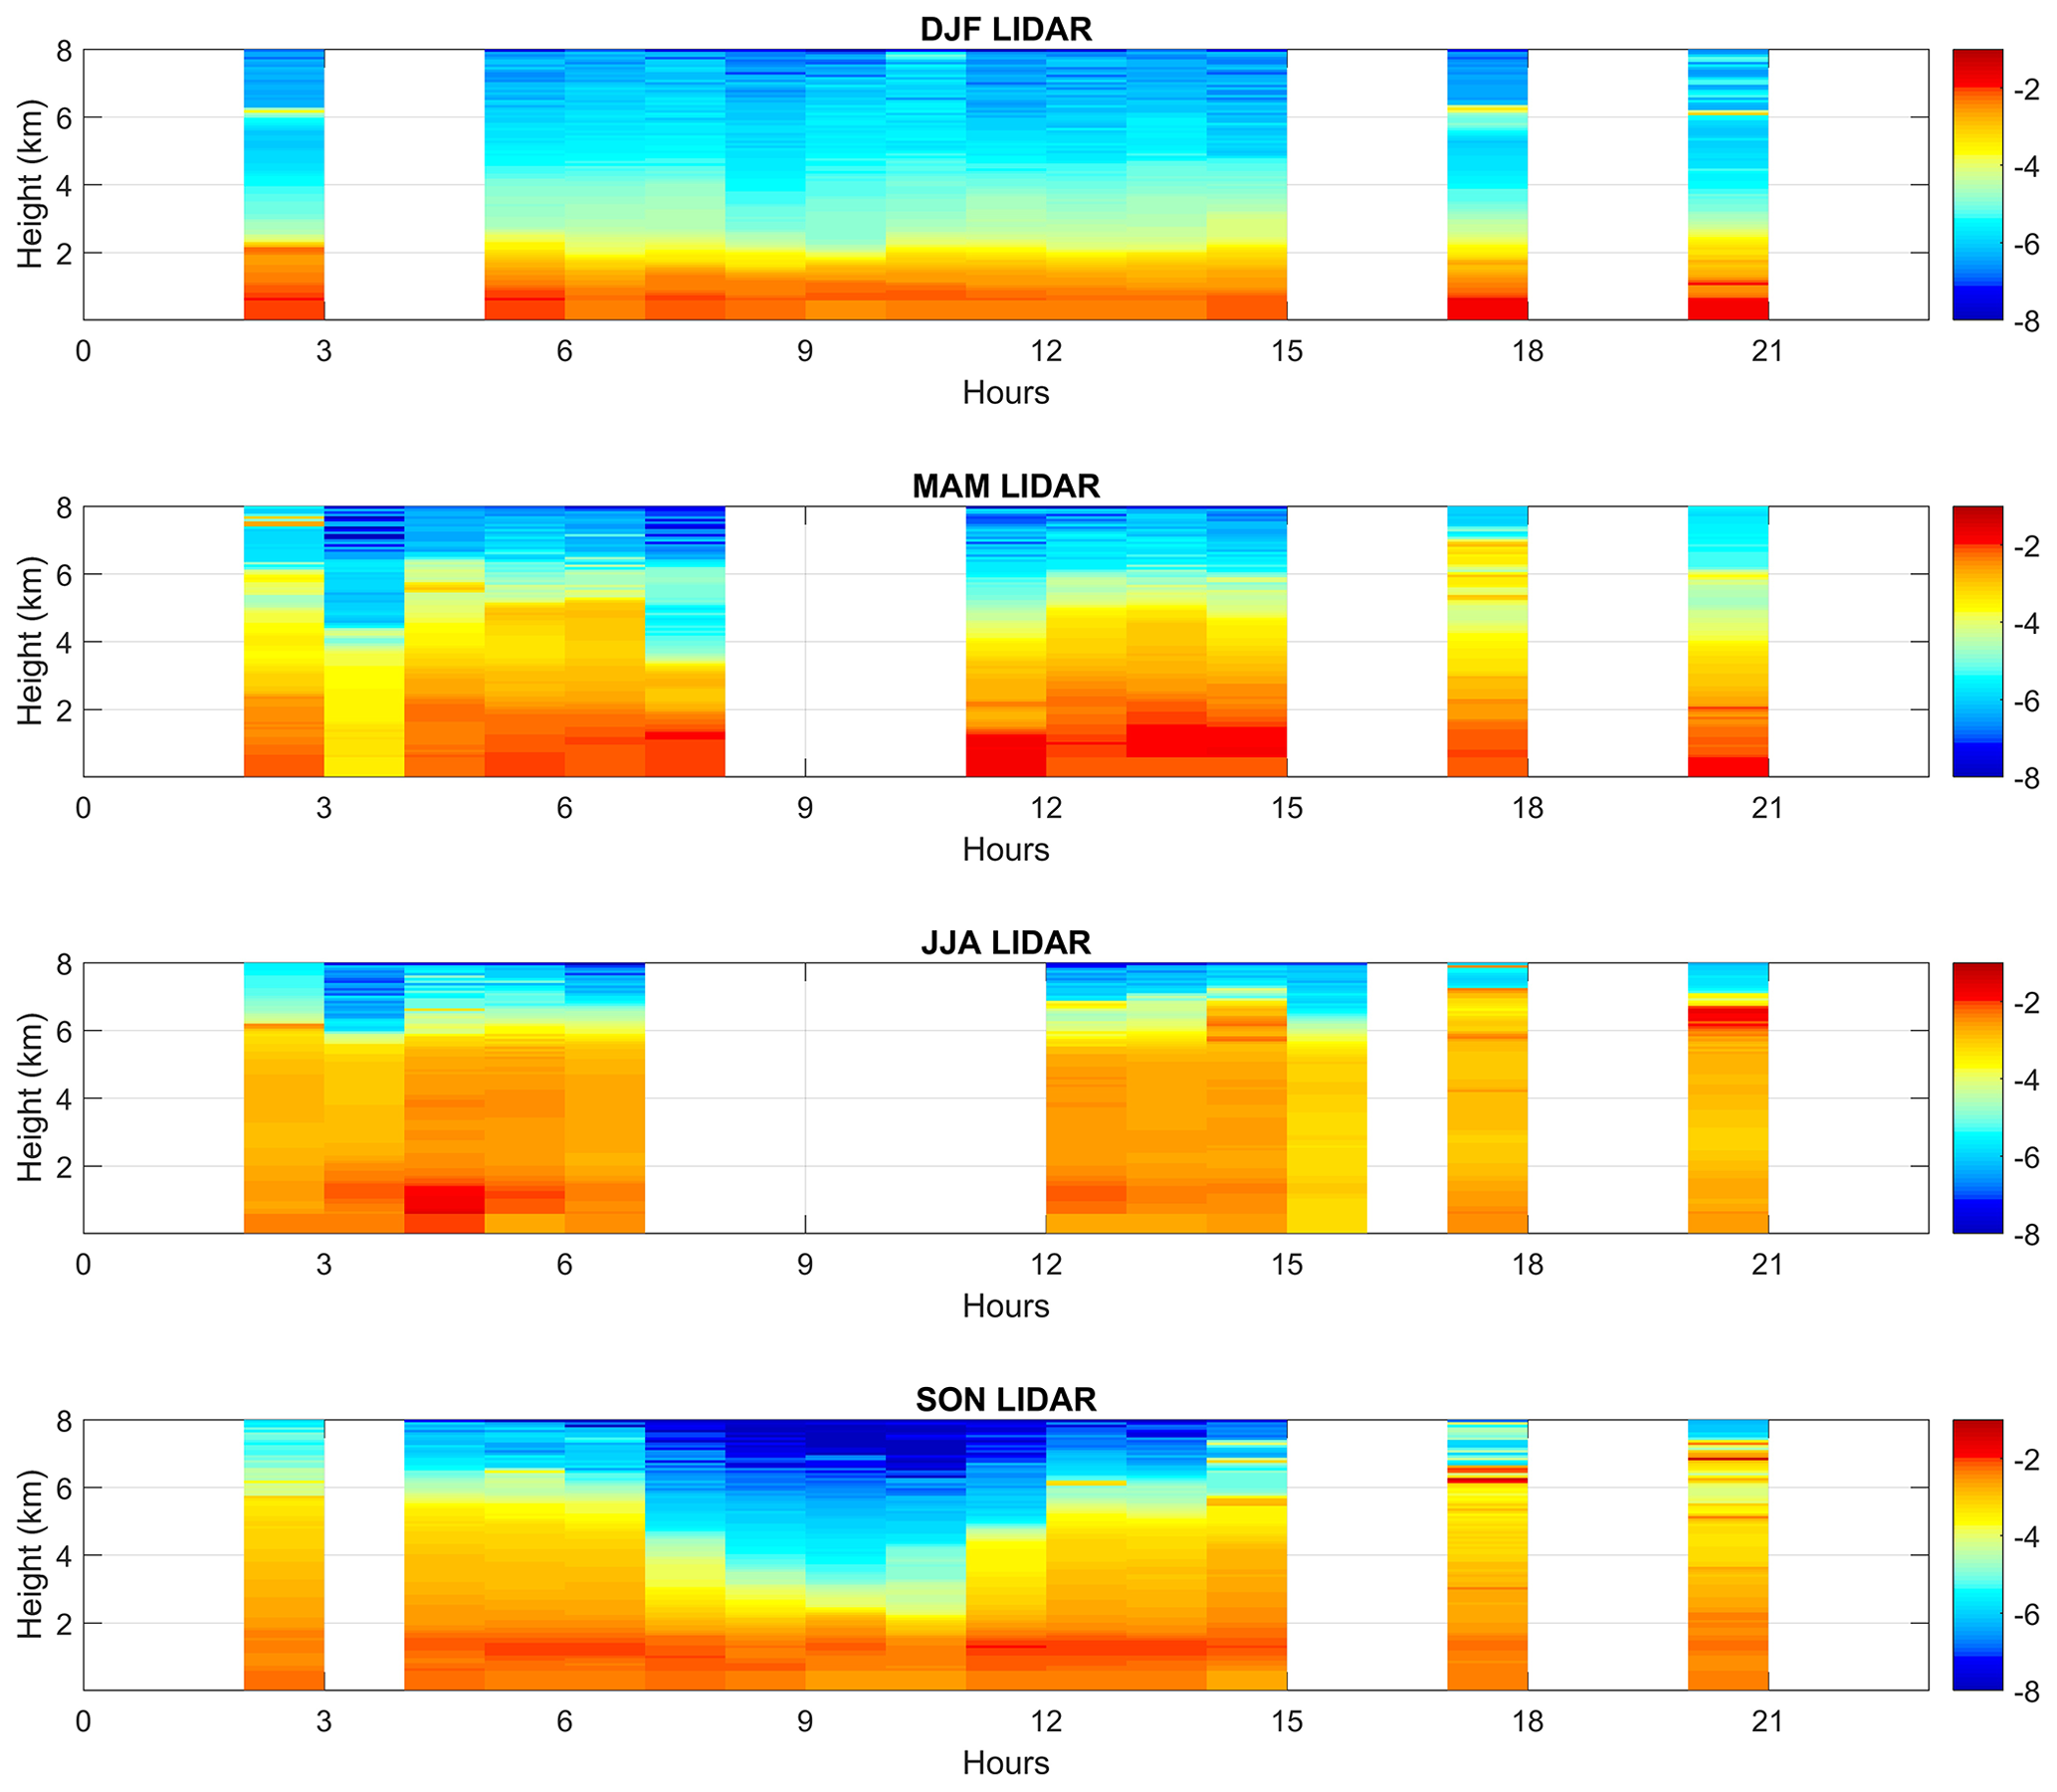
Figure 14Diurnal profile of the natural logarithm of aerosol extinction coefficient at 532 nm (km−1) over the atmospheric column observed by the MPL at KAUST. Times are reported in UTC.
3.5 Interaction of dust aerosols with land/sea breezes
Figure 15 shows the circulation features of land and sea breezes in the vicinity of the KAUST–MPL site. The base map in the figure shows the high-resolution dust source function used in this study, where red hotspots represent the most dominant dust sources. Significant dust sources are observed on both sides of the Sarawat mountain range, i.e., the coastal sides and the eastern slopes. Sea breezes are strongest in spring and summer. In contrast, land breezes are strongest in winter and fall. In the daytime, sea breezes penetrate further inland, and the KAUST–MPL site receives northwesterly winds. At night, the KAUST–MPL site experiences northeasterly land breezes, which are strongest in winter.
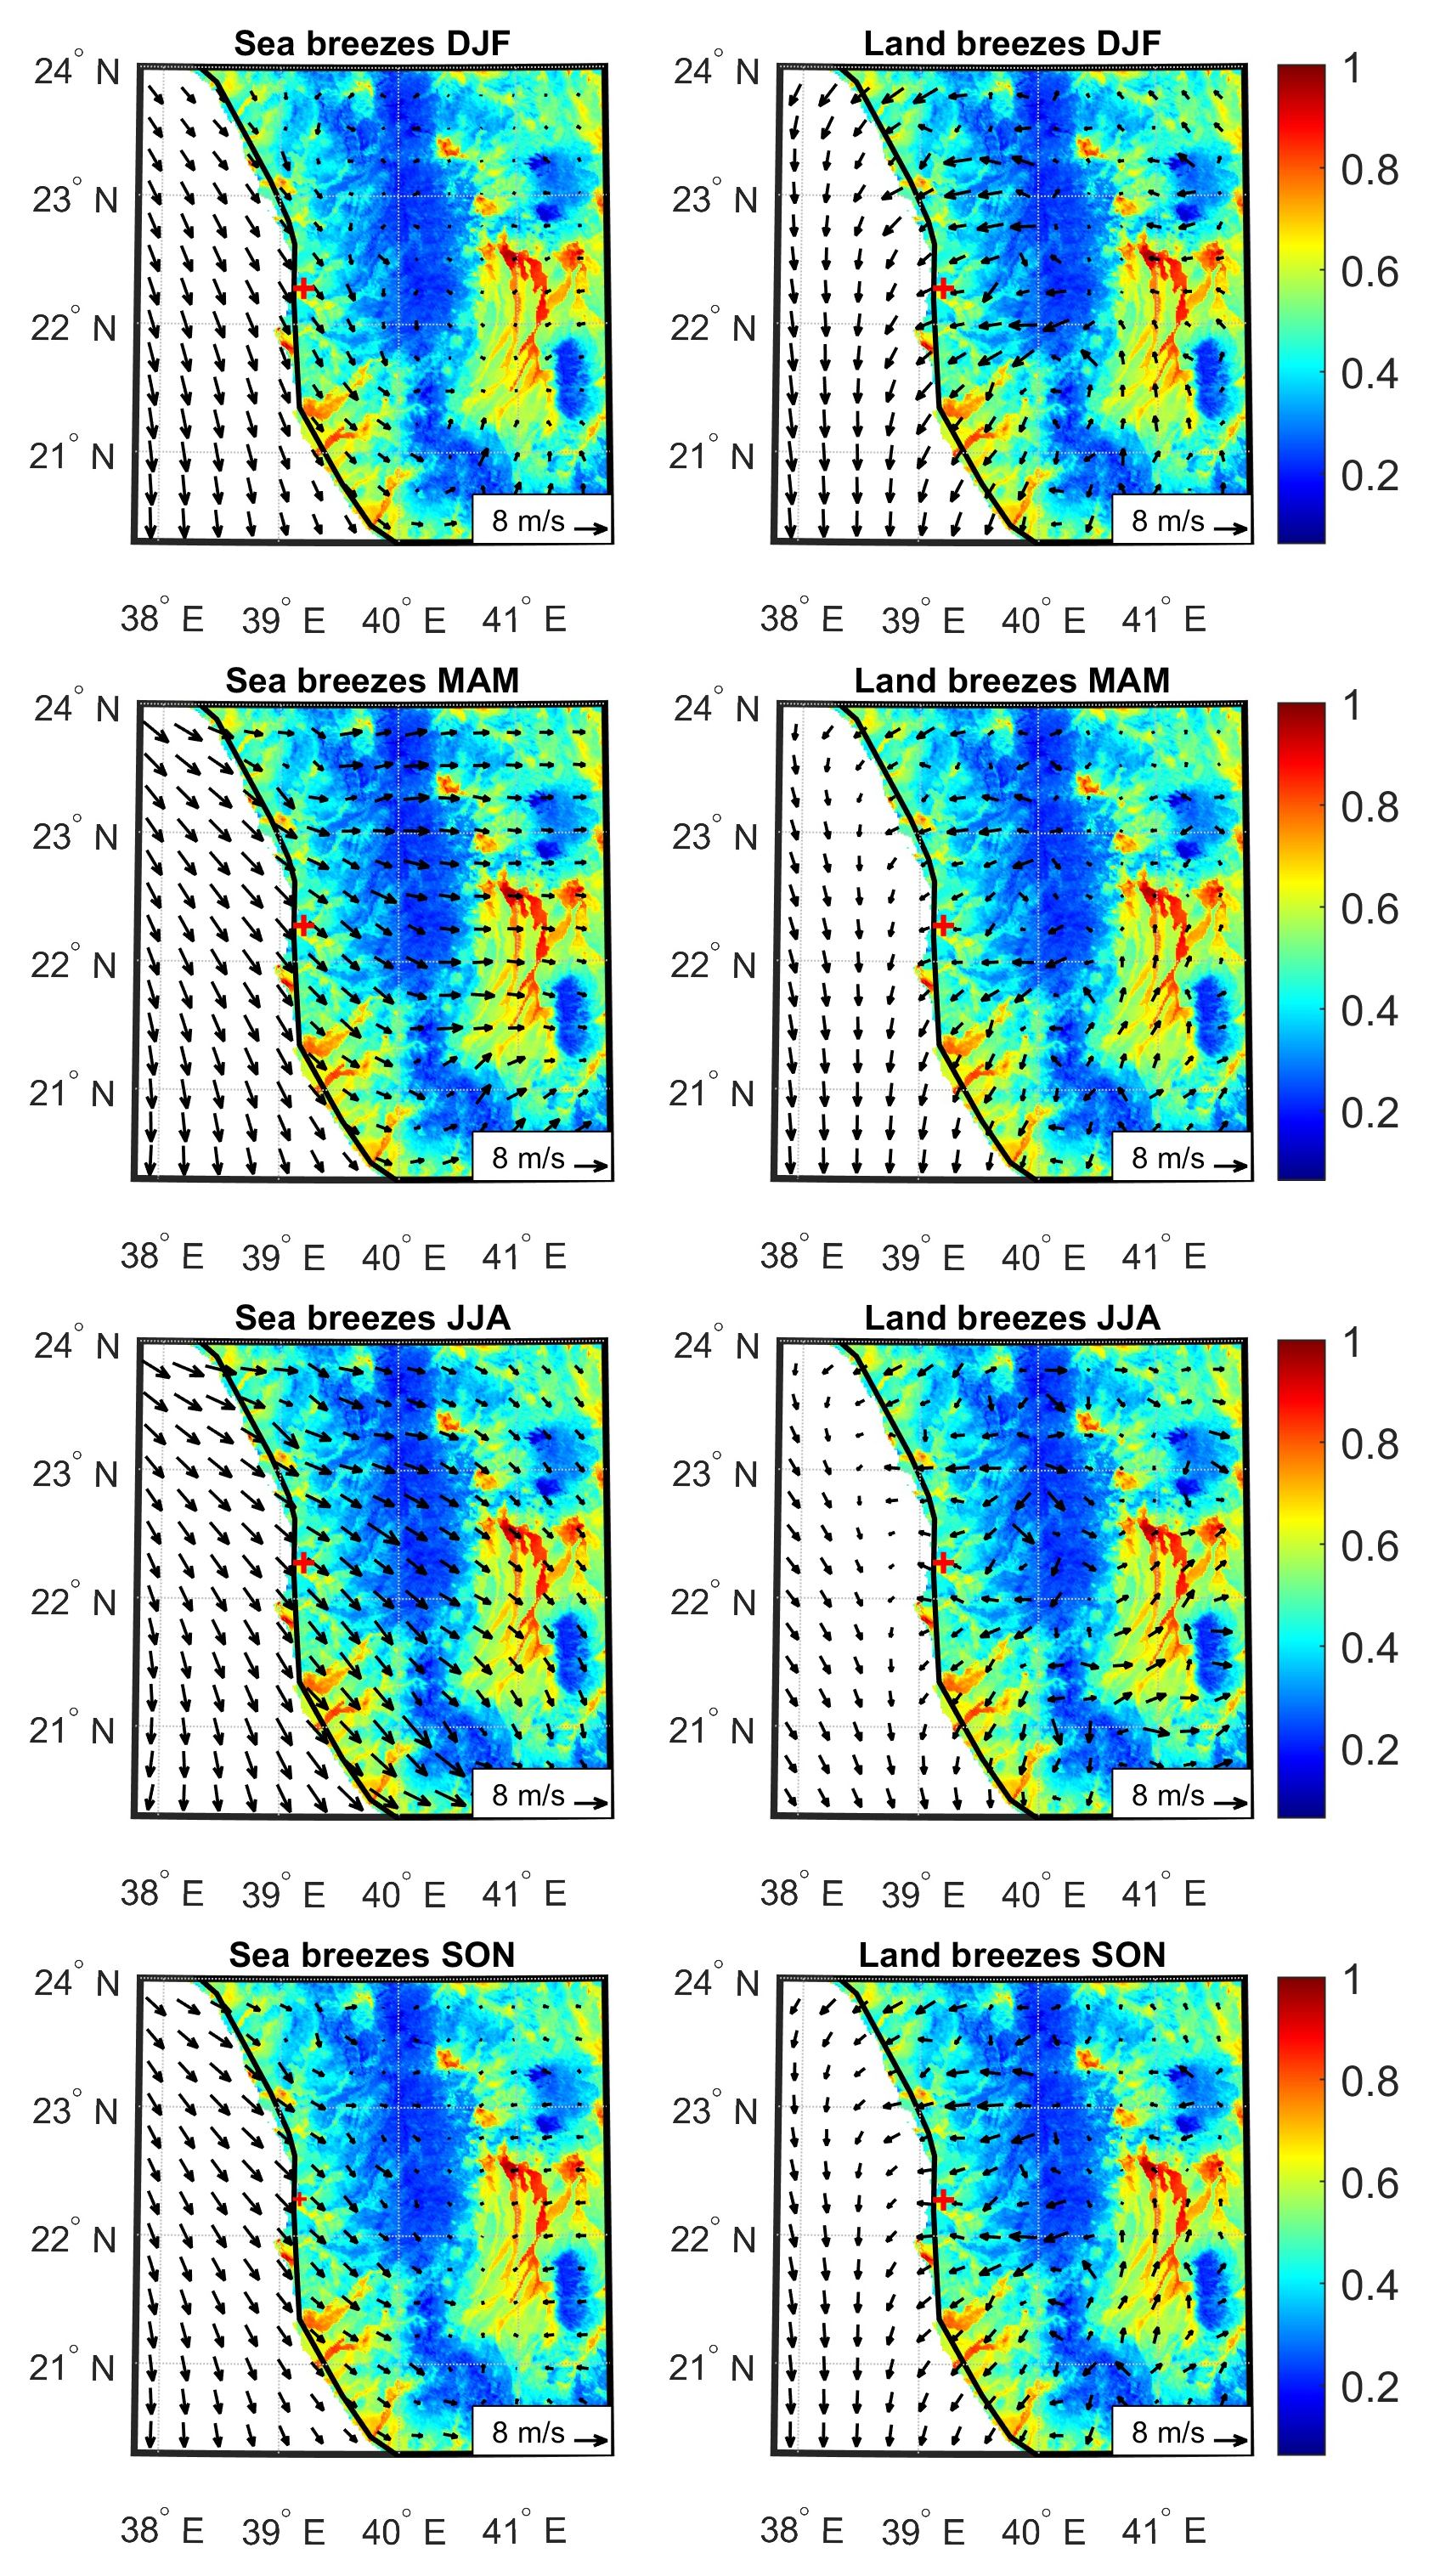
Figure 15Model 10 m wind speed showing the land (right) and sea (left) breezes. The data are averaged during the peaks of land and sea breezes to highlight their patterns, i.e., 01:00 to 03:00 UTC for land breezes (night) and 14:00 to 16:00 UTC for sea breezes (day). The KAUST site is marked by a red (+) mark. The base map shows the high-resolution dust source function (Parajuli and Zender, 2017) used in this study. The values range from zero to one, with the highest value representing the most significant dust source.
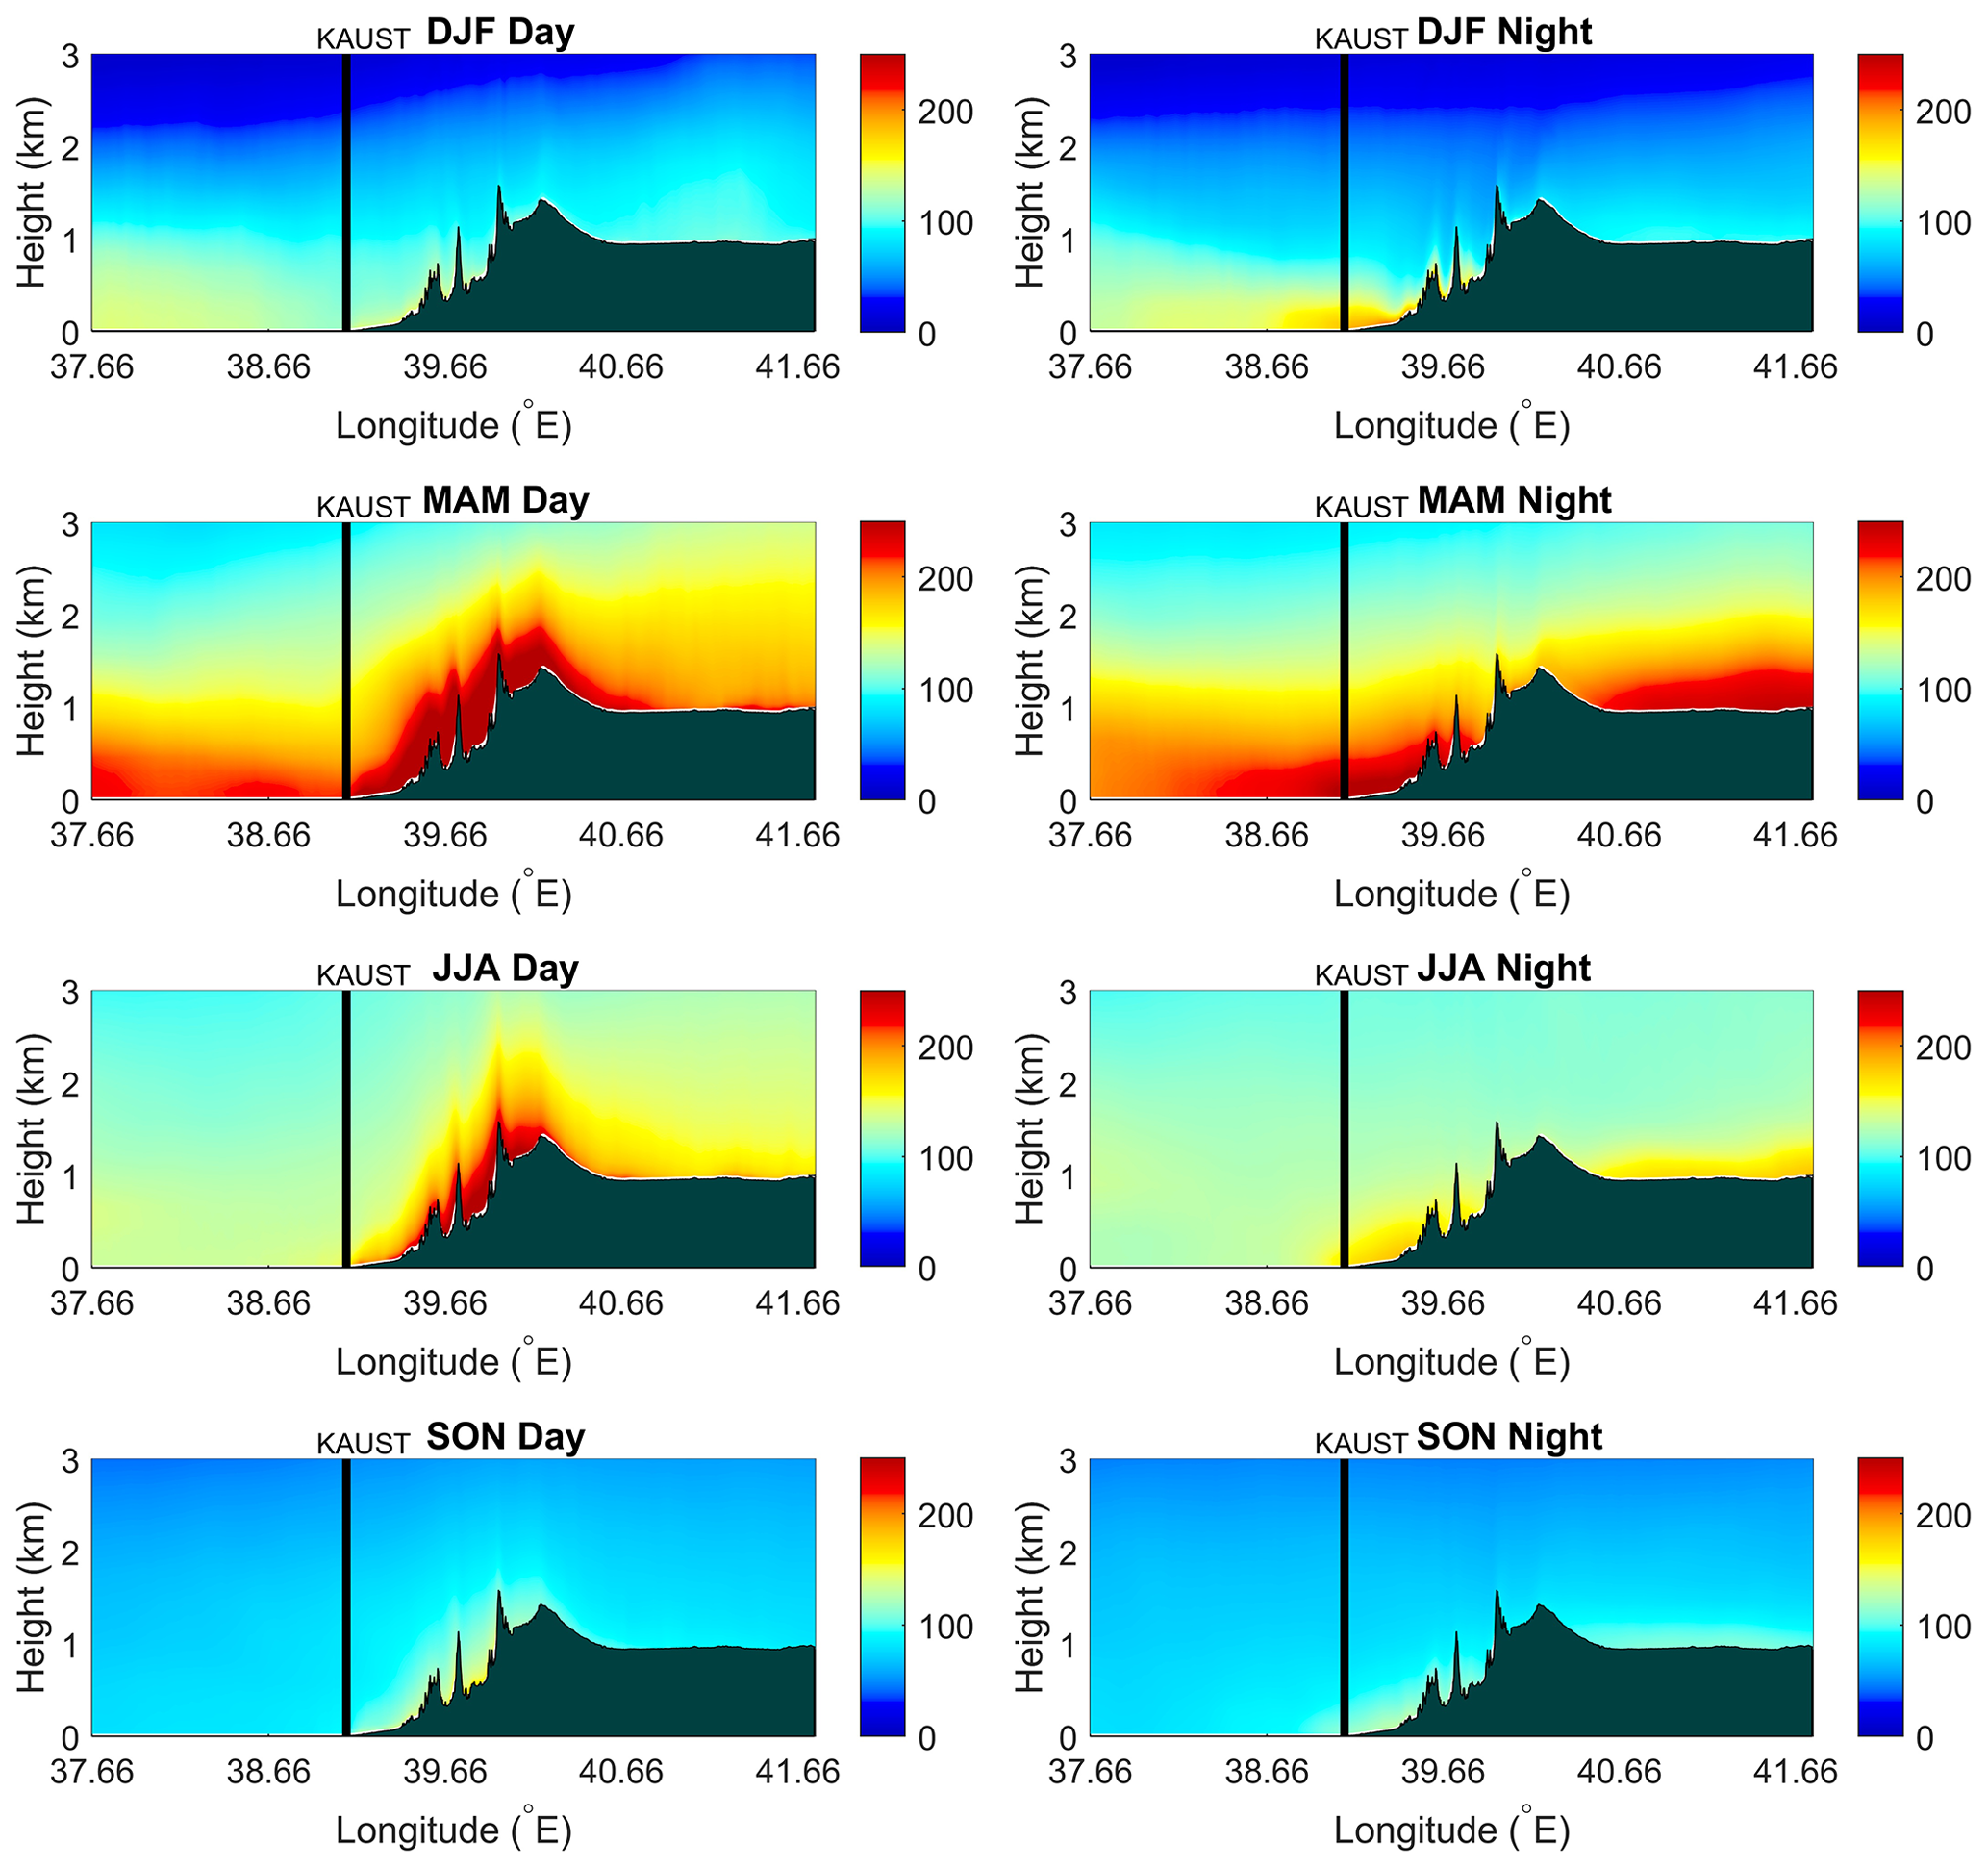
Figure 16Longitudinal cross section, perpendicular to the coastline, of aerosol concentrations (µg m−3) over KAUST. Data are averaged seasonally and presented separately for the day (left column) and night (right column). Data averaged during the same period as in Fig. 15 to demonstrate the effect of land and sea breezes on dust aerosols. The vertical line in black shows the location of the KAUST site. The land profile along the same section is depicted in black shades, the top of which shows the actual land elevation.
Figure 16 shows the total aerosol concentration (µg m−3) within the innermost model domain (d03) in a longitudinal cross section perpendicular to the coastline over KAUST. The section also shows the land profile (black shades) where the Sarawat Mountains that run along the eastern coast of the Red Sea and the relatively flat inland deserts that lie on the eastern side of the mountains are visible. The mountains reach a maximum elevation of ∼1.5 km above sea level. The effect of land and sea breezes on dust is apparent in Fig. 16, as discussed in further detail below.
During winter nights, a thin layer of dust collects over the marine boundary layer and the land near the KAUST site within ∼1 km height. This layer is an accumulation of dust that has been mobilized by land breezes from the coastal plains and the western flanks of the mountains. The coastal plains of the Red Sea are rich in fine fluvial sediments deposited by wadis, which are known sources of dust (Anisimov et al., 2017; Parajuli et al., 2019). The western flanks of the mountains also contain fluvial and intermountain deposits along the slope that are suitable for resuspension (Parajuli et al., 2014). This mobilized dust is transported towards the Red Sea, which seems to occur at low altitudes ∼500 m (Fig. 16). Some dust collects over the Red Sea during the daytime in the winter also, which appears well mixed within the relatively shallow PBL. During the day, the northwesterly sea breezes move landward, preventing the dust emitted from the coastal region from moving over the sea. Therefore, this dust observed during the daytime must be the residual dust that accumulated overnight. The dust mobilization from the coastal area by the sea breezes (daytime) is weaker during the winter.
In the spring, there is very high dust loading over the coastal region and the western flanks of the mountains, which is much higher than in winter. This higher dust loading is consistent with stronger sea breezes in spring than in winter (Fig. 15). The highest dust loading is observed over the slopes of the mountains at a height of 1–1.5 km. Recall that the lidar data show a high dust loading at ∼1–1.5 km height at the KAUST site. Two factors appear to contribute to this high dust loading. First, daytime sea breezes mobilize dust locally from the coastal plains and the western flanks of the mountains. These sea breezes then push the dust inland and upwards along the slope of the mountains, up to 3 km height. At the same time, the northeasterly Harmattan winds also bring dust from the nearby inland deserts towards the mountains. This dust is further uplifted when the dust-laden Harmattan winds encounter the sea breezes coming from the opposite direction. Thus, the interaction of sea breezes with the northeasterly Harmattan winds across the mountains mainly determines the vertical distribution of aerosols over the region. At night, the sea breezes as well as the PBL weaken, and the vertical extent of dust in the atmosphere reduces. The land breezes also appear to transport the dust towards the Red Sea from the western flanks of the mountains at night.
In summer, the patterns of dust mobilization and transport are similar to those in spring but are not quite as pronounced. In fall, the mobilization of dust from the coast and its ocean-ward transport is very weak, and the patterns are similar to those in winter.
Figure 17 shows the daytime and nighttime winds at three altitudes for two specific months in summer (August) and winter (February). Note that the winds are shown at different levels for August and February to highlight the features of land and sea breezes better. The depth of sea breezes and land breezes are different, as expected, with the sea breezes being much deeper than the land breezes, primarily because the PBL is higher during the day than at night. The local topography also plays a role. Sea breezes are still strong up to a height of ∼1150 m; however, the land breezes only reach a height of ∼200 m. By about 450 m, the land breezes subside completely. The land breeze circulation is confined by the height of the mountains, whereas the sea breeze circulation extends to a much higher altitude. The returning flow of the sea breezes takes place at a height of ∼2250 m in the form of northeasterly trade winds, which are responsible for bringing the dust to our site from the inland deserts. The return flow of the land breezes occurs at a height of ∼1500 m, with a change in direction of nearly 180∘ of the lower part of the subtropical westerly jets (de Vries et al., 2013) (see supporting information in Fig. S6). The variation in the pattern of these winds along the vertical dimension is generally consistent with the profile of modeled dust that we presented earlier (Fig. 16).
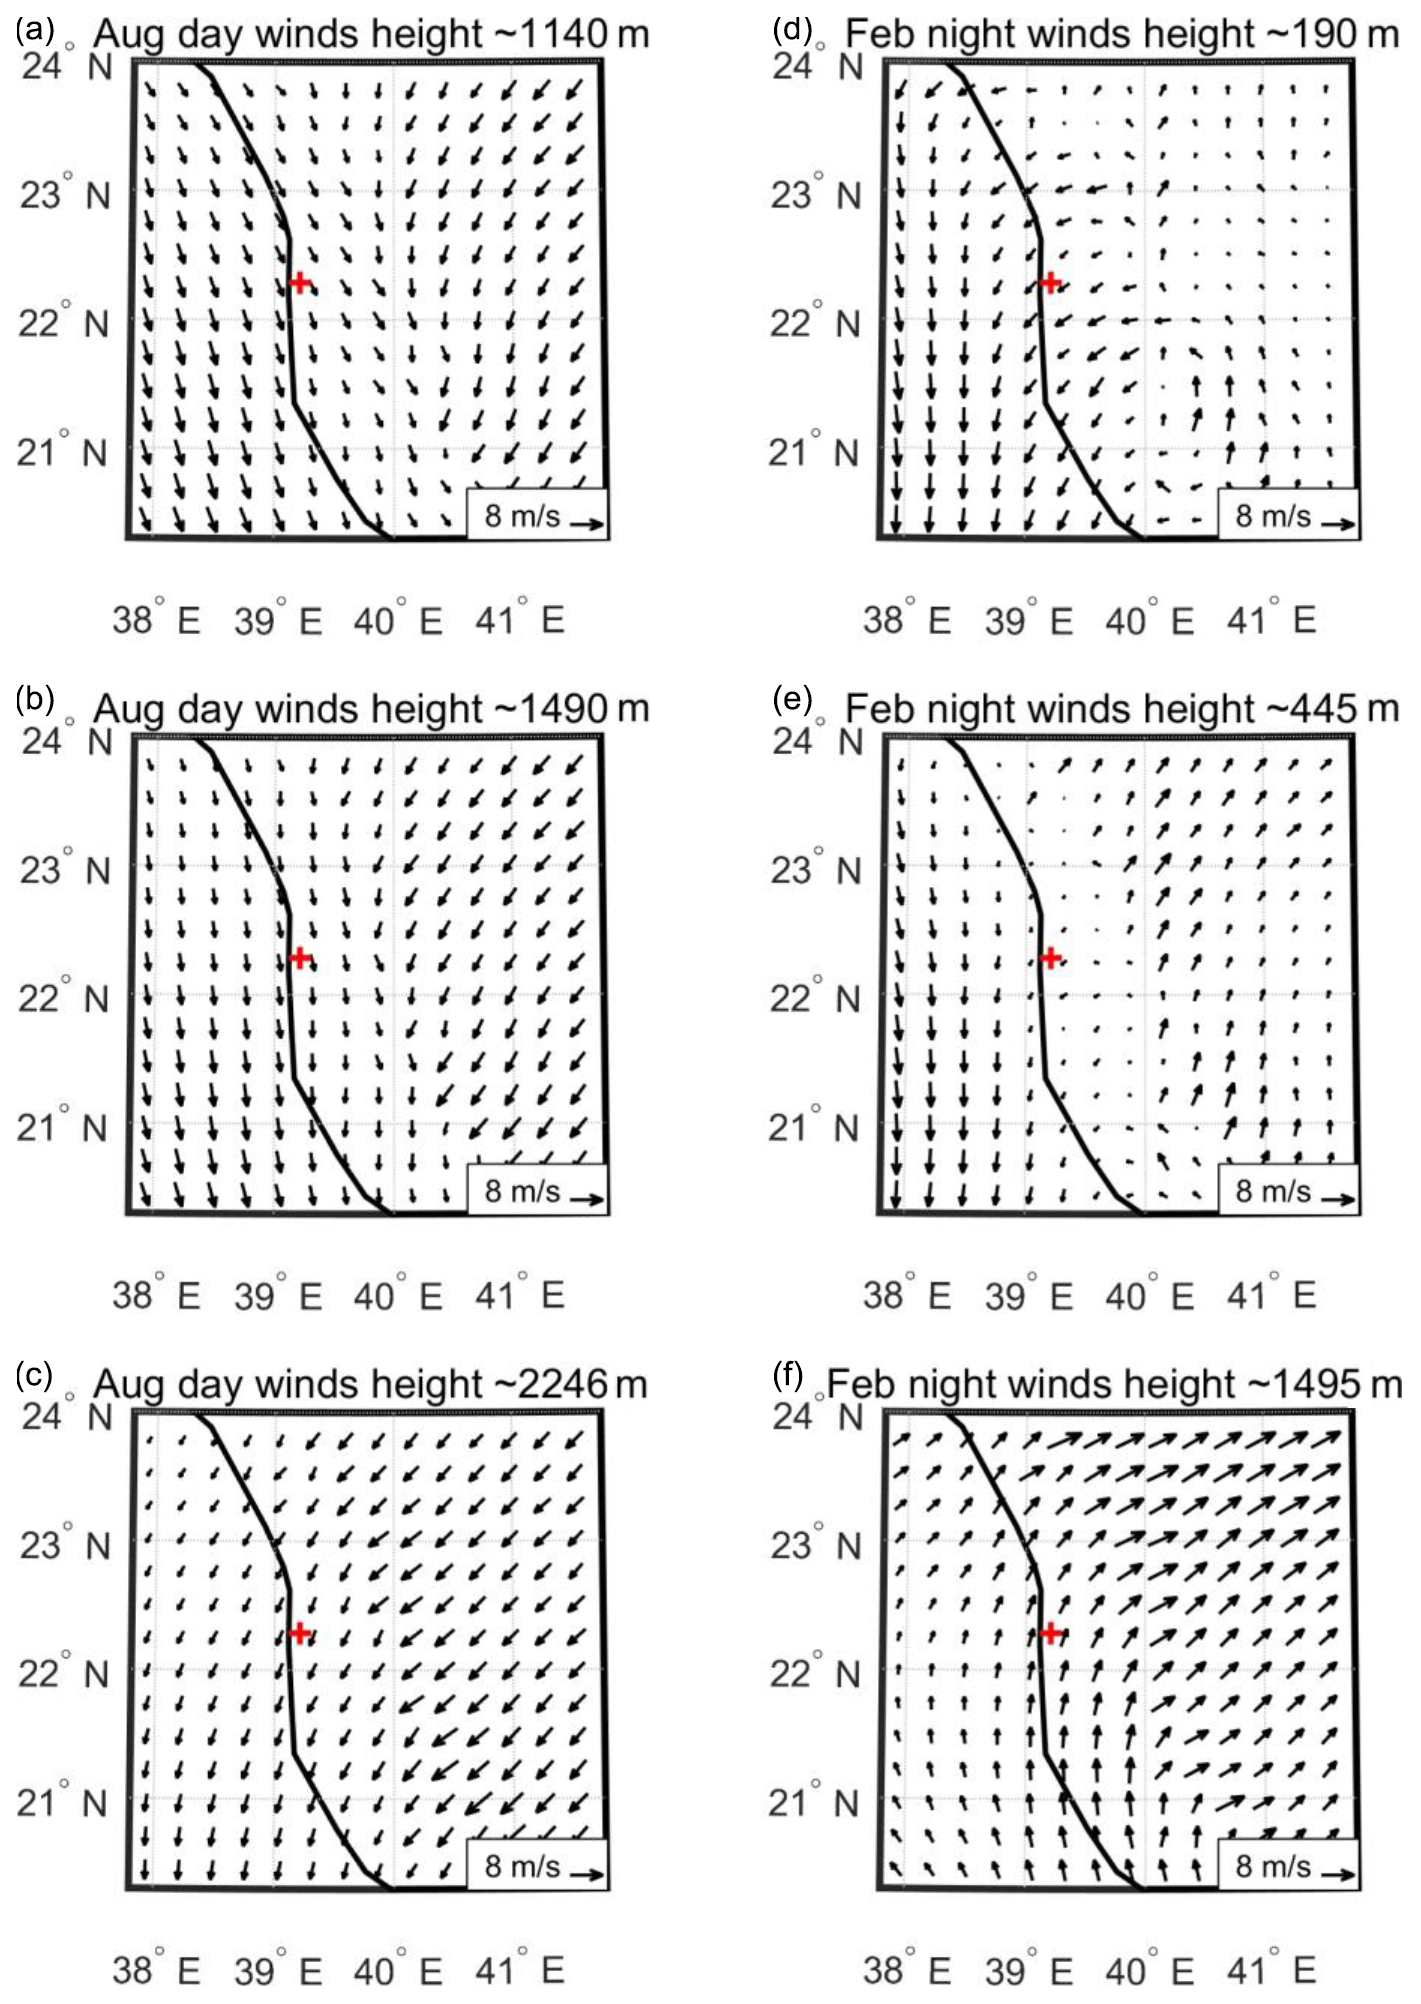
Figure 17Model (WRF) winds at three different elevations for August (a–c) and February (d–f) within the study domain. The KAUST site is marked by a red (+) symbol.
In summary, the timings and patterns of dust emission and transport in the study region are evidently affected by land and sea breezes. Note that, across the larger parts of the Arabian Peninsula, the seasonality of dust mobilization is quite different to our study region, where dust emission and transport are maximal during summer (Parajuli et al., 2019).
4.1 Model performance
The model simulated the surface wind speed at the KAUST site reasonably well as compared to station data (Fig. 3). Accurately representing the surface winds is vital because the dust emission is parameterized as a function of friction wind velocity in WRF-Chem (Marticorena and Bergametti, 1995; LeGrand et al., 2019). Note that dust emissions are generally caused by wind gusts that occur over very short timescales (seconds) (Engelstaedt and Washington, 2007), which are much stronger than the average seasonal wind speed displayed in Fig. 2. We can expect these wind gusts to be represented in our simulations because we have used a very small model time step (8 s) in our d03 domain. Given our primary focus is on vertical aerosol profiles, further analysis of wind gusts is beyond this study's scope.
The model reproduces the AOD time series well in all seasons as compared with several datasets, including AERONET, MODIS, MISR, and MERRA-2 (Fig. 4), with an MBE of 13.4 % against AERONET data. There is some mismatch in the AOD profiles among different datasets during some large-scale dust events, partly because of the difference in sampling and measurement frequencies.
The model successfully captured the evolution of a dust event that occurred in 2015 over the study site in terms of its onset and demise, as well as the height of the dust layer (Fig. 9). Our results were consistent with several previous studies, such as in Yuan et al. (2019) and Anisimov et al. (2018). The model generally reproduced the elevated dust layers at ∼6 km during the dust event (Fig. 9), which were prominently seen in KAUST–MPL observations (Figs. 10 and 11). However, the model underestimated the AOD at KAUST by about 35 % during the event compared to AERONET AOD. Simulating these complex, large-scale dust events is extremely challenging, and thus we do not expect the model to capture them as precisely, since they occur only a few times (∼2–3) in a year. We note that the performance of WRF-Chem in simulating these large-scale dust events is case-specific (e.g., Teixeira et al., 2016; Fernández et al., 2019) and should not be generalized. The model performance was indeed sensitive to the type of dust event (e.g., Kim et al., 2017), the details of the dust-emission processes (Klose and Shao, 2012; Klose and Shao, 2013), the dust source function used (Kalenderski and Stenchikov 2016; Parajuli et al., 2019), and the prescribed size distribution of the emitted dust (Kok et al., 2017; Marenco et al., 2018).
4.2 Aerosol vertical profiles
The seasonal aerosol vertical profiles were consistent among all datasets that we compared viz. KAUST–MPL, MERRA-2, and CALIOP (Figs. 10, 11 and 13). These results are consistent with those reported by Li et al. (2018) over the same region. The WRF-Chem model successfully reproduced the vertical profiles of dust aerosol extinction and concentration in terms of seasonality when compared with the abovementioned datasets. Nearer the surface, the model showed some disagreement with the observational datasets, as also noted in some previous studies (e.g., Hu et al., 2016; Wu et al., 2017; Flaounas et al., 2017). Note that such disagreement between data collected near the surface exists among the observational datasets as well; this disagreement could arise due to differences in the retrieval algorithms used and the resolution of the datasets, as discussed in detail below.
The difference in vertical profiles retrieved from KAUST–MPL and CALIOP data could be related to the differences in the algorithm and resolution between the two datasets. Firstly, while retrieving aerosol extinction profiles, the CALIOP algorithm uses different prescribed extinction-to-backscatter (lidar ratio) for a set of aerosol types from a lookup table (Omar et al., 2009; Winker et al., 2009; Kim et al., 2018). In addition, the CALIOP algorithm has difficulty in identifying the base of aerosol layers accurately. In particular, the level-3 algorithm ignores the “clear air” between the surface and the lowest aerosol layer when averaging to avoid underestimation of extinction in the lower part of the aerosol profile (Winker et al., 2013). In contrast, the MPL algorithm assumes an averaged lidar ratio for the whole column based on the aerosol PSD, refractive index, and sphericity, in such a way that it satisfies both AERONET and MPL co-incident data. Because of the assumption of a constant lidar ratio, MPL retrievals near the surface could be erroneous, especially when multiple aerosol layers are present (Welton et al., 2002a). Secondly, KAUST–MPL is a point measurement that captures the temporal evolution of the dust storms better than CALIOP because it has a higher temporal resolution. For instance, CALIOP can undersample or overlook some dust events that last only for a few hours. On the other hand, CALIOP could sample more spatial details of a dust storm because of its extended coverage along its track compared to KAUST–MPL data. Nonetheless, these two datasets complement one another, and their combined use can be beneficial in understanding the large-scale dust storms.
Analysis of the KAUST–MPL data revealed several interesting features of the vertical profile of aerosols over the study site, which were not documented in earlier studies. For example, we observed a significant difference between the daytime and nighttime vertical profiles of aerosols. Some of these detailed features were not apparent in the model simulations. The model underestimated the nighttime aerosol extinctions at ∼6–7 km height in summer and fall compared to the KAUST–MPL data (Figs. 10 and 11). Although the model data did not identify these dust layers at 6–7 km in the seasonally averaged profiles, the model nonetheless correctly identified these same dust layers during the dust event analyzed in the case study (Fig. 9). This result supports our speculation that the elevated dust layers at ∼6–7 km represent transported dust from inland deserts during large-scale dust events.
It is difficult to identify the exact reason for the above discrepancy between the model and KAUST–MPL data, but there are several possible explanations. First, the model could be deficient in representing the deep convective mixing of dust in the central-peninsula deserts. Second, although the effect of orography on dust seems to be correctly resolved (Fig. 16), the long-range transport of dust from the deserts towards the KAUST site may not be fully detected. Third, part of this discrepancy could also be because of the insufficient model spatial resolution compared to KAUST–MPL data. KAUST–MPL data are a point measurement, while the model data represent the profiles at a 1.3×1.3 km grid cell, which, although high resolution, can still produce a substantial difference, especially in a land–ocean boundary. Finally, the discrepancy could also be due to the limitation of the GRASP algorithm in handling clouds, because of which the aerosol layers observed at 5–7 km height in the nighttime could be contaminated with clouds, as explained further below.
To better understand the origin of two elevated dust layers observed (∼1–2 and 6–7 km) and investigate the possibility of thin-cloud contamination in our MPL retrievals, we analyzed the volume-depolarization profiles provided by the KAUST–MPL, synchronous with the attenuated backscatter profiles used in the retrievals. The average volume depolarization value in the lower atmosphere (1–2 km) was estimated to be 13 %–14 % on average and 7 %–8 % for the upper part (6–7 km) for the selected period. Such values indicate that high extinction values in this altitude range cannot come exclusively from clouds because pure water clouds generally yield a 1 %–2 % depolarization value and ∼30 % or even higher in the case of cirrus clouds (e.g., Del Guasta and Valar, 2003). The lower depolarization value in the upper part could be explained by the fact that the aerosol particle sizes are much finer than those in the lower part. At the same time, a lower depolarization value also suggests the possibility of partial influence by thin clouds. The presence of thin clouds can probably cause some overestimation of aerosol concentrations and extinction at these altitudes. However, such an overestimation is expected to increase the fitting errors, which are easily detectable, as mentioned earlier. To ascertain this with full confidence, we plan a further analysis utilizing simultaneous retrieval of Sun-photometric observations together with backscatter and volume-depolarization profiles provided by KAUST–MPL in the future.
Although both model results and the KAUST–MPL retrievals have their own limitations, both KAUST–MPL and the model data identified two prominent layers of dust over the study site, one at a lower altitude (∼1–2 km) and another at a higher altitude (∼6–7 km). These two dust layers correspond to two different dust sources. The lower dust layer corresponded to dust originating from nearby deserts, and the upper dust layer corresponded to dust coming from more remote sources and further inland. The two layers of dust are typical in this region during dust events. As explained before, a large-scale disturbance usually brings dust from remote sources at higher altitudes (∼6–7 km). When the disturbance comes closer to the site, high surface winds associated with the disturbance also pick up more dust from nearby deserts giving rise to a high dust loading at ∼1–2 km height. Such stratified aerosol layers have been previously observed near land–ocean boundaries, where strong temperature inversion occurs, restricting further mixing of aerosols in the PBL and above (Welton et al., 2002b).
In the lower part (∼1–2 km), the atmospheric dust loading is mostly dominated by coarse-mode particles. In contrast, dust in the upper level (∼6–7 km) typically constitutes long-range transported finer particles. Finer particles can easily reach the upper atmosphere, whereas coarser particles of higher mass fall back to the surface more quickly due to gravitational settling. Thus, coarser particles are usually confined to the lower atmosphere, have shorter atmospheric lifetimes (∼1–3 d), and affect hourly/daily scale climate processes such as the diurnal cycle. On the contrary, smaller particles reach higher altitudes and have longer atmospheric lifetimes. The extinction cross section of an individual large particle is bigger than that of a small particle, but finer particles have stronger radiative effects per unit mass than coarser particles (Khan et al., 2015).
We observed some interannual variability while comparing the vertical profiles for 2015 and 2016, but was not too significant (Fig. S9). Therefore, the observed vertical distribution of dust aerosols can be considered “typical” for our region and possibly for other land–ocean boundaries (e.g., Rasch et al., 2001). This is understandable because the synoptic winds causing large-scale dust events, and the diurnal-scale breezes that affect the dust distribution, both have strong seasonality over the study region (Kalenderski and Stenchikov, 2016; Parajuli et al., 2019). However, as demonstrated by our results, vertical profiles of aerosols can be affected by regional processes such as breezes, which indicate that the profiles can differ across different regions. Therefore, it is vital to examine the aerosol vertical profiles of a region to understand the regional climate.
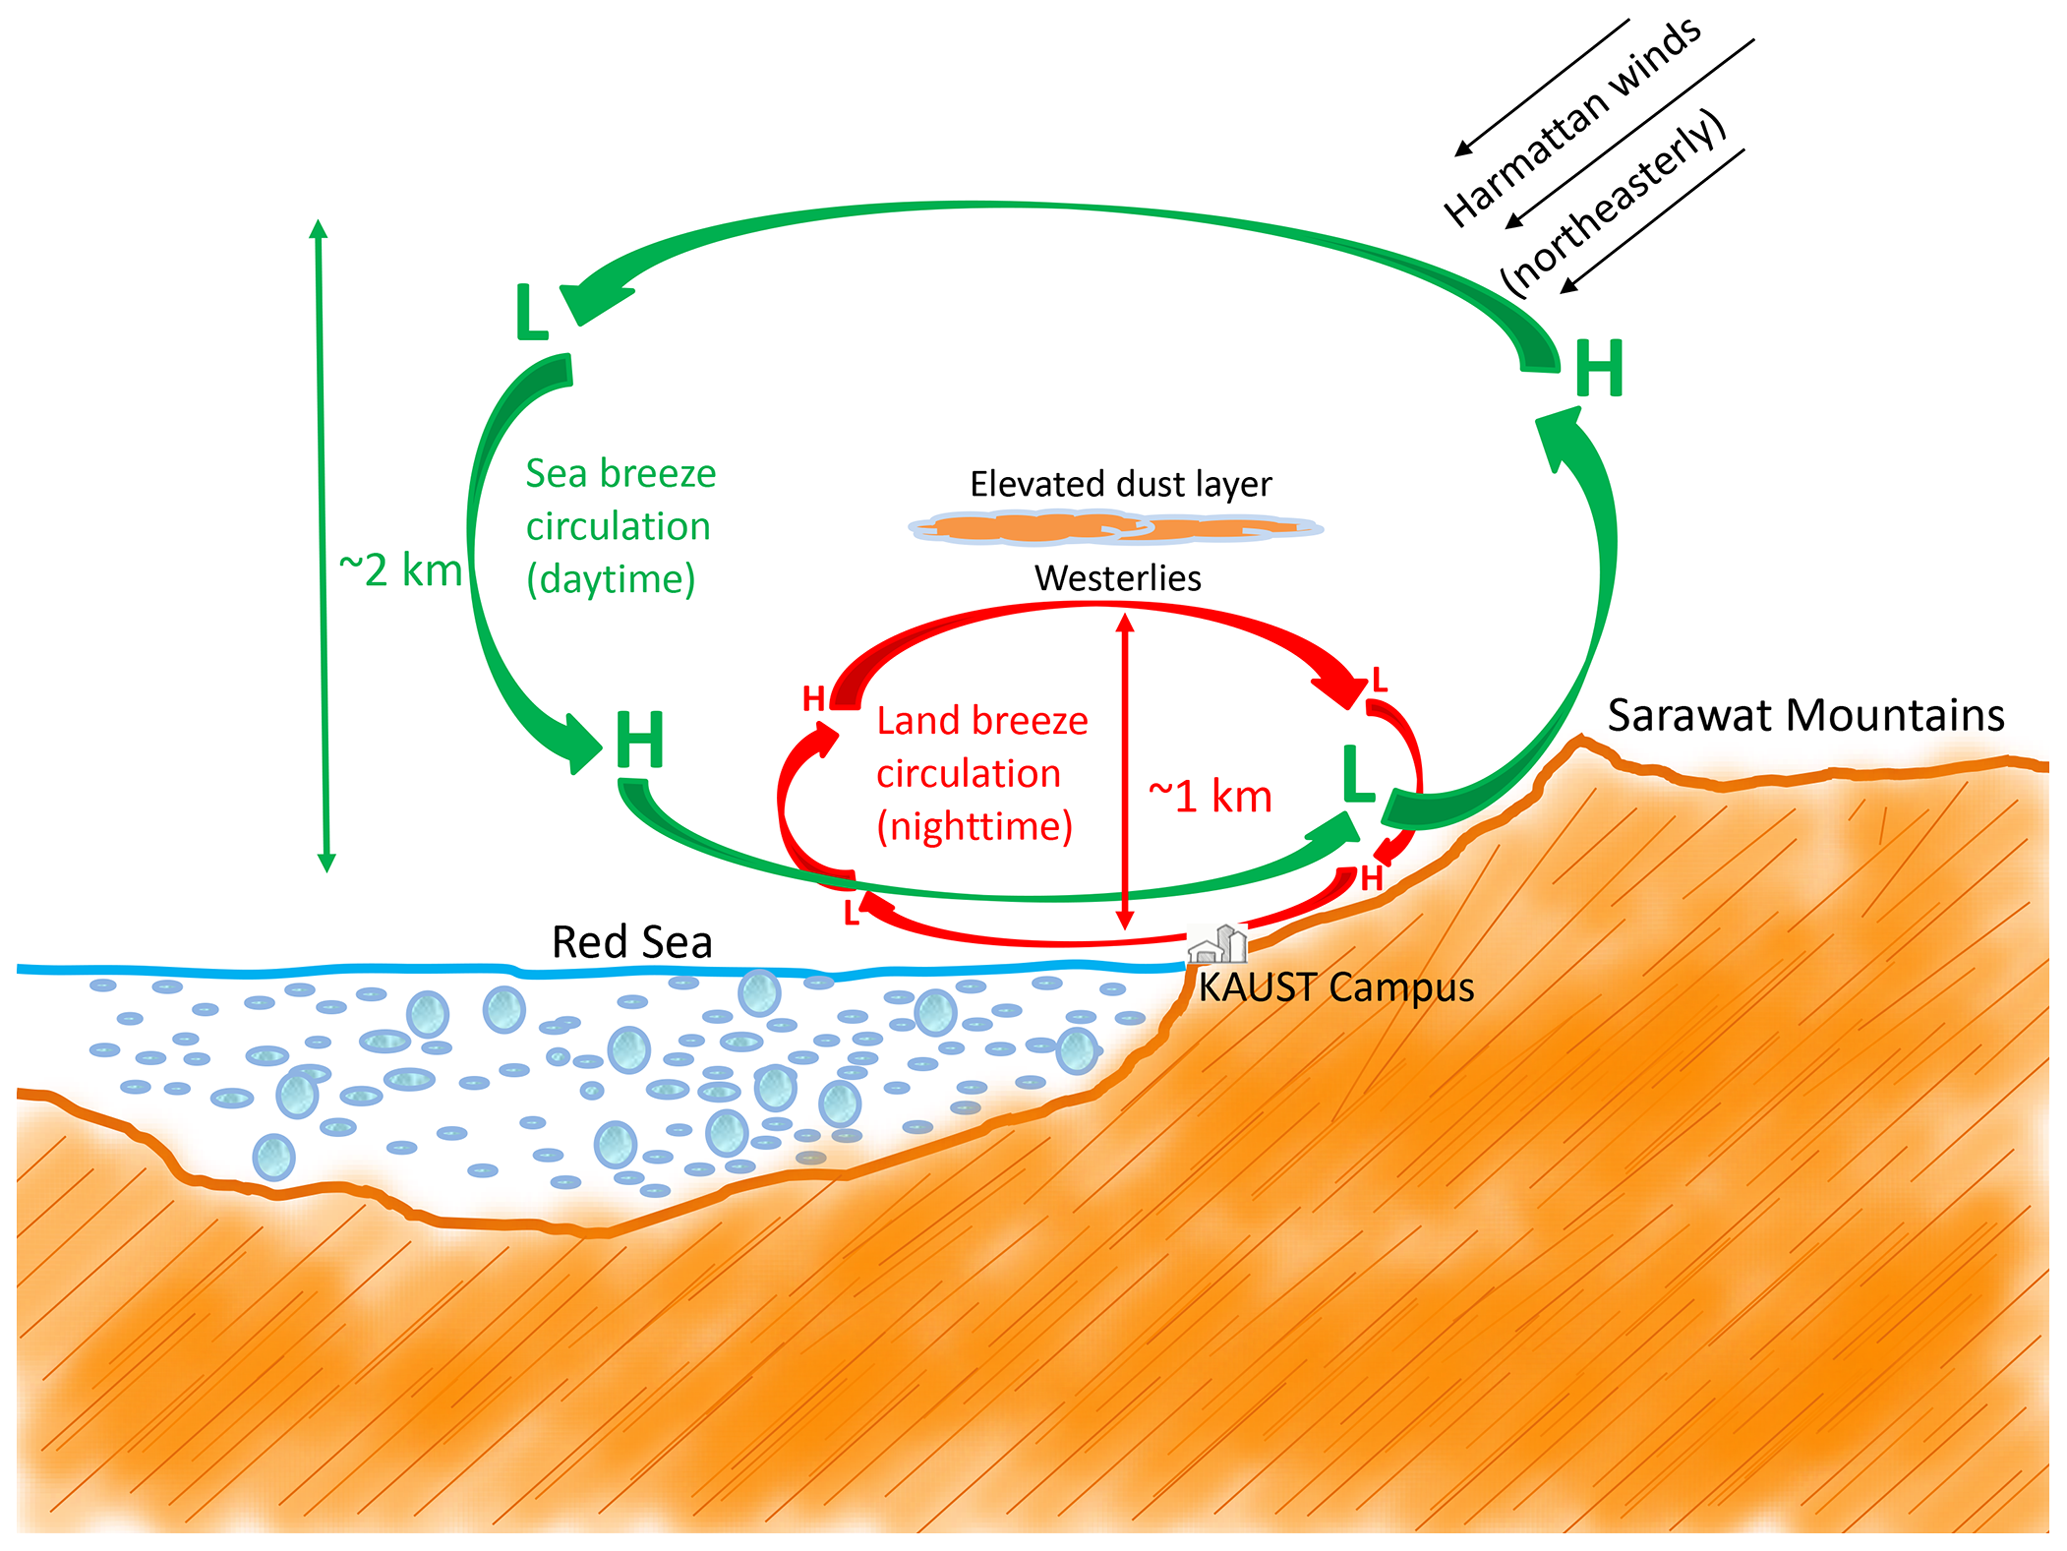
Figure 18Schematic diagram showing sea breeze (daytime, in green) and land breeze (nighttime, in red) circulations and dust distribution over the study site at KAUST.
4.3 Dust–breeze interactions
KAUST–MPL-retrieved aerosol vertical profiles also provided an opportunity to understand how aerosols interact with land and sea breezes over the eastern coast of the Red Sea. The salient features of the land and sea breezes over the study region revealed by our study are summarized in Fig. 18. These fine-level interactions are often poorly resolved in coarse-scale simulations. Our high-resolution simulations ( km) nonetheless correctly resolved these features and showed how breezes affect dust aerosol distribution over the region. Our study is important because the breezes and dust can directly affect the daily life of populations that reside in the coastal area. Furthermore, dust over the region affects the surface temperature of the Red Sea through changes in radiation (Sokolik and Toon, 1996; Osipov et al., 2015; Osipov and Stenchikov, 2018), which could have an enormous impact on the Red Sea climate and marine habitats. Additionally, changes in dust deposition also affect the availability of nutrients delivered to marine ecosystems (Jish Prakash et al., 2015).
4.4 Implications of lidar data in atmospheric modeling
MPL data are invaluable for studying the vertical details of aerosols in the atmosphere because they measure backscatter from aerosols and clouds with a high vertical and temporal resolution (Welton et al., 2002b; Winker et al., 2009). Most satellite data only provide aerosol properties over the entire atmospheric column (e.g., Hsu et al., 2004), which are complemented by the MPL data that provide height, depth, and the particle characteristics of the aerosol layers in the atmosphere. Since satellite data usually have a low temporal resolution and, because many large-scale dust events are short-lived, MPL data can reveal additional characteristics of dust storms.
In regional and global climate models, it is a usual practice to constrain the total AOD using some observations (see, for example, Zhao et al., 2010; Parajuli et al., 2019). While such constraints are desirable because they help to represent columnar atmospheric properties more precisely, they are not sufficient for certain applications such as air quality modeling, for example (Ukhov et al., 2020b). Unless the model correctly represents the aerosol vertical profiles, the model-estimated surface aerosol concentrations may not be reliable. In this context, KAUST–MPL data can be instrumental in constraining the vertical distribution of aerosols in the models. Such constraints would ideally benefit the operational forecasting of dust storms and air quality (Zhang et al., 2015).
Although derived from actual observations, KAUST–MPL retrievals are also subject to uncertainties, and their accuracy is dependent on assumptions made by the retrieval algorithms. A study that compared the GRASP retrieval scheme employed here against in situ measurements showed that the differences were less than 30 % for the different retrieval schemes (Benavent-Oltra et al., 2019).
In this study, we investigated the vertical distribution of aerosols over
the eastern coast of the Red Sea. We used data collected from the only
operating lidar in the region, located on the KAUST campus, together with other collocated observations and high-resolution WRF-Chem model
simulations, to explore three main aspects of dust aerosols. First, we
evaluated how accurately WRF-Chem reproduces the vertical profiles of
aerosols over the study site and examined its performance during a
large-scale dust event of 2015. Second, we investigated the vertical profile
of aerosol extinction and concentrations as well as their seasonal and diurnal variability over the study site. Thirdly, we investigated how the
prevailing land and sea breezes affect the distribution of dust over the
study site, which is located exactly at the land–ocean boundary. This study represents a first attempt to understand and describe the interactions
between breezes and dust in this largely understudied region. The main
findings of this research are summarized as follows.
Model evaluation.
-
The simulated AOD obtained from the high-resolution WRF-Chem model setting is reasonably consistent over the study site across all observational datasets, including AERONET, MODIS, and MISR. The simulated AOD shows a mean bias error (MBE) of ∼13.4 % with the AERONET data.
-
WRF-Chem qualitatively captured the evolution of a large-scale summertime dust event in 2015 over the study site. The model simulated the onset, demise, and the height of the dust storms reasonably well.
-
WRF-Chem simulations show that dust has the highest contribution to total AOD among all aerosol types, contributing up to 92 % in summer. Anthropogenic (sulfate, OC, and BC) and sea salt contributions to the total AOD could reach up to 15 % and 6 %, respectively, especially in winter when both of them are highest.
Vertical profiles of aerosols.
-
Over the study site, most dust is confined in the troposphere, within a height of 8 km. In winter, dust is confined to lower altitudes than in summer, which is consistent with the lower PBL height in winter than in summer.
-
There is a marked difference in the daytime and nighttime vertical profile of aerosols in the study site, as shown by the KAUST–MPL data. We observed a prominent dust layer at ∼5–7 km in the nighttime in the KAUST–MPL data. This elevated dust loading is associated with the dust transported from central-peninsula deserts by the easterly winds during the night, which is mobilized and lifted up by the preceding daytime convection.
-
The seasonally averaged vertical profiles of daytime aerosol extinction are consistent in the KAUST–MPL, MERRA-2, and CALIOP data in all seasons, which is well reproduced by our WRF-Chem simulations. The profiles from the different datasets match better in winter than in summer, consistent with the results of Wu et al. (2017).
Diurnal cycles.
-
There is significant diurnal variation in aerosol loading at the study site in all seasons, as shown by the KAUST–MPL data. Stronger aerosol activity occurs in the early morning during the summer, in the afternoon during the spring, and in the night during the winter.
-
Both sea and land breezes cause dust emissions from the coastal plains and the western flanks of the Sarawat Mountains. Such dust emissions are most prevalent in spring.
Interaction of dust and breezes.
-
Sea breezes push the dust mobilized from the coastal plains up along the slope of the Sarawat Mountains, which subsequently encounters the dust-laden northeasterly trade winds coming from inland deserts, causing elevated dust maxima at a height of ∼1.5 km above sea level across the mountains.
-
The nighttime land breezes are strongest in winter. These easterly/northeasterly land breezes transport dust aerosols from the coastal plains and the mountain slopes towards the Red Sea.
-
The sea breeze circulation is much deeper (∼2 km) than the land breeze circulation (∼1 km), as illustrated in Fig. 18.
The calibrated MPL data used in this study can be obtained from the MPLNET website https://mplnet.gsfc.nasa.gov/ (last access: 4 May 2019). The source code and additional information about the GRASP algorithm can be obtained from the grasp-open web site https://www.grasp-open.com/ (last access: 19 January 2020). MODIS AOD data were downloaded from http://ladsweb.nascom.nasa.gov/data/ (last access: 24 April 2017). MERRA-2 data were obtained from the NASA Goddard Earth Sciences Data and Information Services Center (GES DISC) available at https://disc.sci.gsfc.nasa.gov/daac-bin/FTPSubset2.pl (last access: 14 May 2018). CALIOP data were retrieved from the website of Atmospheric Science Data Center, NASA Langley Research Center, available at https://eosweb.larc.nasa.gov/project/calipso/cloud-free_aerosol_L3_LIDAR_table (last access: 2 November 2017). ECMWF Operational Analysis data are restricted data, which were retrieved from http://apps.ecmwf.int/archive-catalogue/?type=4v&class=od&stream=oper&expver=1 (last access: 26 November 2019) with a membership. EDGAR-4.2 is available at http://edgar.jrc.ec.europa.eu/overview.php?v=42 (last access: 14 December 2019). OMI-HTAP data are available at https://avdc.gsfc.nasa.gov/pub/data/project/OMI_HTAP_emis (last access: 12 December 2019). A copy of the namelist file used for WRF-Chem modeling can be downloaded from https://doi.org/10.25781/KAUST-PBR81 (last access: 22 December 2020, Parajuli et al., 2020).
The supplement related to this article is available online at: https://doi.org/10.5194/acp-20-16089-2020-supplement.
SPP and GLS developed the central scientific concept of the paper. SPP analyzed the data and wrote the paper with inputs from GLS. IS operated and maintained the KAUST–MPL site. SPP conducted WRF-Chem simulations, and AU contributed to code modifications. OD and AL ran the GRASP code. GLS conceived, designed, and oversaw the study. All the authors discussed the results and contributed to the final manuscript.
The authors declare that they have no conflict of interest.
We thank the KAUST Supercomputing Laboratory for providing computing resources. We also thank Anatolii Anisimov for providing SEVIRI images and for helpful discussions. We are grateful to Ellsworth Judd Welton of NASA Goddard Space Flight Center for the help in archiving and processing the raw lidar data. Thanks are also due to Michael Cusack of KAUST for proofreading the manuscript. We are grateful to the three anonymous reviewers whose suggestions greatly helped to improve the manuscript.
This research has been supported by the Belmont Foundation Project (grant no. REP/1/3963-01-01) and KAUST Competitive Research Grant Project (grant no. URF/1/2180-01-01).
This paper was edited by Paola Formenti and reviewed by three anonymous referees.
Abshire, J. B., Sun, X., Riris, H., Sirota, J. M., McGarry, J. F., Palm, S., Yi, D., and Liiva, P.: Geoscience Laser Altimeter System (GLAS) on the ICESat Mission: On-orbit measurement performance, Geophys. Res. Lett., 32, L21S02, https://doi.org/10.1029/2005GL024028, 2005.
Ackerman, S. A.: Remote Sensing Aerosols Using Satellite Infrared observations, J. Geophys. Res., 102, 17069–17079, https://doi.org/10.1029/96JD03066, 1997.
Albugami, S., Palmer, S., Cinnamon, J., and Meersmans, J.: Spatial and Temporal Variations in the Incidence of Dust Storms in Saudi Arabia Revealed from In Situ Observations, Geosciences, 9, 162, https://doi.org/10.3390/geosciences9040162, 2019.
Alharbi, B. H., Maghrabi, A. L., and Tapper, N.: The March 2009 dust event in Saudi Arabia: Precursor and supportive environment, B. Am. Meteorol. Soc., 94, 515–528, https://doi.org/10.1175/BAMS-D-11-00118.1, 2013.
Almazroui, M., Raju, P. V. S., Yusef, A., Hussein, M. A. A., and Omar, M.: Simulation of extreme rainfall event of November 2009 over Jeddah, Saudi Arabia: the explicit role of topography and surface heating, Theor. Appl. Climatol., 132, 89–101, https://doi.org/10.1007/s00704-017-2080-2, 2018.
Anisimov, A., Tao, W., Stenchikov, G., Kalenderski, S., Prakash, P. J., Yang, Z.-L., and Shi, M.: Quantifying local-scale dust emission from the Arabian Red Sea coastal plain, Atmos. Chem. Phys., 17, 993–1015, https://doi.org/10.5194/acp-17-993-2017, 2017.
Anisimov, A., Axisa, D., Kucera, P. A., Mostamandi, S., and Stenchikov, G.: Observations and cloud‐resolving modeling of haboob dust storms over the Arabian peninsula, J. Geophys. Res.-Atmos., 123, 12147–12179. https://doi.org/10.1029/2018JD028486, 2018.
Ansmann, A., Wagner, F., Müller, D., Althausen, D., Herber, A., von Hoyningen-Huene, W., and Wandinger, U.: European pollution outbreaks during ACE 2.: Optical particle properties inferred from multiwavelength lidar and star-Sun photometry, J. Geophys. Res., 107, D15, https://doi.org/10.1029/2001JD001109, 2002.
Bangalath, H. K. and Stenchikov, G.: Role of dust direct radiative effect on the tropical rain belt over Middle East and North Africa: A high-resolution AGCM study, J. Geophys. Res.-Atmos., 120, 4564–4584, https://doi.org/10.1002/2015JD023122, 2015.
Benavent-Oltra, J. A., Román, R., Casquero-Vera, J. A., Pérez-Ramírez, D., Lyamani, H., Ortiz-Amezcua, P., Bedoya-Velásquez, A. E., de Arruda Moreira, G., Barreto, Á., Lopatin, A., Fuertes, D., Herrera, M., Torres, B., Dubovik, O., Guerrero-Rascado, J. L., Goloub, P., Olmo-Reyes, F. J., and Alados-Arboledas, L.: Different strategies to retrieve aerosol properties at night-time with the GRASP algorithm, Atmos. Chem. Phys., 19, 14149–14171, https://doi.org/10.5194/acp-19-14149-2019, 2019.
Boesenberg, J., Alpers, M., Althausen, D., Ansmann, A., Böckmann, C., Eixmann, R., et al.: The German Aerosol Lidar Network: Methodology, Data, Analysis, Report, Max-Planck Institut für Meteorologie, 317, available at: http://hdl.handle.net/21.11116/0000-0003-2DEF-F (last access: 5 December 2020), 2001.
Chaikovsky, A., Ivanov, A., Balin, Yu., Elnikov, A., Tulinov, G., Plusnin, I., Bukin, O., and Chen, B.: Lidar network CIS-LiNet for monitoring aerosol and ozone in CIS regions, Proc. SPIE 6160, Twelfth Joint International Symposium on Atmospheric and Ocean Optics/Atmospheric Physics, 21 April 2006, 616035, https://doi.org/10.1117/12.675920, 2006.
Chen, S.-H. and Sun, W.-Y.: A one-dimensional time dependent cloud model, J. Meteor. Soc. Japan., 80, 99–118, https://doi.org/10.2151/jmsj.80.99, 2002.
Chin, M., Ginoux, P., Kinne, S., Torres, O., Holben, B. N., Duncan, B. N., Martin, R. V., Logan, J. A., Higurashi, A., and Nakajima, T.: Tropospheric aerosol optical thickness from the GOCART model and comparisons with satellite and Sun photometer measurements, J. Atmos. Sci., 59, 461–483, https://doi.org/10.1175/1520-0469(2002)059<0461:TAOTFT>2.0.CO;2, 2002.
Chin, M., Diehl, T., Ginoux, P., and Malm, W.: Intercontinental transport of pollution and dust aerosols: implications for regional air quality, Atmos. Chem. Phys., 7, 5501–5517, https://doi.org/10.5194/acp-7-5501-2007, 2007.
Collins, W. D., Rasch, P. J., Eaton, B. E., Khattatov, B. V., Lamarque, J.-F., and Zender, C. S.: Simulating aerosols using a chemical transport model with assimilation of satellite aerosol retrievals: Methodology for INDOEX, J. Geophys. Res., 106, 7313–7336, https://doi.org/10.1029/2000JD900507, 2001.
Crippa, M., Guizzardi, D., Muntean, M., Schaaf, E., Dentener, F., van Aardenne, J. A., Monni, S., Doering, U., Olivier, J. G. J., Pagliari, V., and Janssens-Maenhout, G.: Gridded emissions of air pollutants for the period 1970–2012 within EDGAR v4.3.2, Earth Syst. Sci. Data, 10, 1987–2013, https://doi.org/10.5194/essd-10-1987-2018, 2018.
Crouvi, O., Dayan, U., Amit, R., and Enzel, Y.: An Israeli haboob: Sea breeze activating local anthropogenic dust sources in the Negev loess, Aeol. Res., 24, 39–52, https://doi.org/10.1016/j.aeolia.2016.12.002, 2017.
Davis, S. R., Farrar, J. T., Weller, R. A., Jiang, H., and Pratt, L. J.: The Land-Sea Breeze of the Red Sea: Observations, Simulations, and Relationships to Regional Moisture Transport, J. Geophys. Res.-Atmos., 124, 13803–13825, https://doi.org/10.1029/2019JD031007, 2019.
Del Guasta, M. and Vallar, E.:, In‐cloud variability of LIDAR depolarization of polar and midlatitude cirrus, Geophys. Res. Lett., 30, 1578, https://doi.org/10.1029/2003GL017163, 2003.
Derimian, Y., Choël, M., Rudich, Y., Deboudt, K., Dubovik, O., Laskin, A., Legrand, M., Damiri, B., Koren, I., Unga, F., Moreau, M., Andreae, M. O., and Karnieli, A.: Effect of sea breeze circulation on aerosol mixing state and radiative properties in a desert setting, Atmos. Chem. Phys., 17, 11331–11353, https://doi.org/10.5194/acp-17-11331-2017, 2017.
de Vries, A. J., Tyrlis, E., Edry, D., Krichak, S. O., Steil, B., and Lelieveld, J.: Extreme precipitation events in the Middle East: Dynamics of the Active Red Sea Trough, J. Geophys. Res.-Atmos., 118, 7087–7108, https://doi.org/10.1002/jgrd.50569, 2013.
Di Biagio, C., Formenti, P., Balkanski, Y., Caponi, L., Cazaunau, M., Pangui, E., Journet, E., Nowak, S., Caquineau, S., Andreae, M. O., Kandler, K., Saeed, T., Piketh, S., Seibert, D., Williams, E., and Doussin, J.-F.: Global scale variability of the mineral dust long-wave refractive index: a new dataset of in situ measurements for climate modeling and remote sensing, Atmos. Chem. Phys., 17, 1901–1929, https://doi.org/10.5194/acp-17-1901-2017, 2017.
Diner, D.: MISR Level 3 Component Global Aerosol product covering a day HDF-EOS File – Version 4 [Data set], NASA Langley Atmospheric Science Data Center DAAC, https://doi.org/10.5067/terra/misr/mil3dae_l3.004, 2009.
Dubovik, O. and King, M. D.: A flexible inversion algorithm for retrieval of aerosol optical properties from Sun and sky radiance measurements, J. Geophys. Res., 105, 20673–20696, https://doi.org/10.1029/2000JD900282, 2000.
Dubovik, O., Herman, M., Holdak, A., Lapyonok, T., Tanré, D., Deuzé, J. L., Ducos, F., Sinyuk, A., and Lopatin, A.: Statistically optimized inversion algorithm for enhanced retrieval of aerosol properties from spectral multi-angle polarimetric satellite observations, Atmos. Meas. Tech., 4, 975–1018, https://doi.org/10.5194/amt-4-975-2011, 2011.
Dubovik, O., Lapyonok, T., Litvinov, P., Herman, M., Fuertes, D., Ducos, F., Lopatin A., Chaikovsky, A., Torres, B., Derimian, Y., Huang, X., Aspetsberger, M., and Federspiel, C.: GRASP: a versatile algorithm for characterizing the atmosphere, SPIE Newsroom, 25, https://doi.org/10.1117/2.1201408.005558, 2014.
Engelstaedter, S. and Washington, R.: Temporal controls on global dust emissions: The role of surface gustiness, Geophys. Res. Lett., 34, L15805, https://doi.org/10.1029/2007GL029971, 2007.
Estoque, M. A.: A theoretical investigation of the sea breeze, Q. J. Roy. Meteor. Soc., 87, 136–146, https://doi.org/10.1002/qj.49708737203, 1961.
Farrar, J., Lentz, S., Churchill, J., Bouchard, P., Smith, J., Kemp, J., Lord, J., Allsup, G., and Hosom, D.: King Abdullah University of Science and Technology (KAUST) mooring deployment cruise and fieldwork report, Technical report, Woods Hole Oceanographic Institution, WHOI-KAUST-CTR-2009, 2, 2009.
Fekih, A. and Mohamed, A.: Evaluation of the WRF model on simulating the vertical structure and diurnal cycle of the atmospheric boundary layer over Bordj Badji Mokhtar (southwestern Algeria), Journal of King Saud University – Science, 31, 602–611, https://doi.org/10.1016/j.jksus.2017.12.004, 2019.
Fernández, A. J., Sicard, M., Costa, M. J., Guerrero-Rascado, J. L., Gómez-Amo, J. L., Molero, F., Barragán, R., Basart, S., Bortoli, D., Bedoya-Velásquez, A. E., and Utrillas, M. P.: Extreme, wintertime Saharan dust intrusion in the Iberian Peninsula: KAUST–MPL monitoring and evaluation of dust forecast models during the February 2017 event, Atmos. Res., 228, 223–241, https://doi.org/10.1016/j.atmosres.2019.06.007, 2019.
Fernández-Camacho, R., Rodríguez, S., de la Rosa, J., Sánchez de la Campa, A. M., Viana, M., Alastuey, A., and Querol, X.: Ultrafine particle formation in the inland sea breeze airflow in Southwest Europe, Atmos. Chem. Phys., 10, 9615–9630, https://doi.org/10.5194/acp-10-9615-2010, 2010.
Flaounas, E., Kotroni, V., Lagouvardos, K., Klose, M., Flamant, C., and Giannaros, T. M.: Sensitivity of the WRF-Chem (V3.6.1) model to different dust emission parametrisation: assessment in the broader Mediterranean region, Geosci. Model Dev., 10, 2925–2945, https://doi.org/10.5194/gmd-10-2925-2017, 2017.
Fountoukis, C., Ayoub, M. A., Ackermann, L., Perez-Astudillo, D., Bachour, D., Gladich, I., and Hoehn, R. D.: Vertical Ozone Concentration Profiles in the Arabian Gulf Region during Summer and Winter: Sensitivity of WRF-Chem to Planetary Boundary Layer Schemes, Aerosol Air Qual. Res., 18, 1183–1197, https://doi.org/10.4209/aaqr.2017.06.0194, 2018.
Gelaro, R., McCarty, W., Suárez, M. J., Todling, R., Molod, A., Takacs, L., Randles, C. A., Darmenov, A., Bosilovich, M. G., Reichle, R., Wargan, K., Coy, L., Cullather, R., Draper, C., Akella, S., Buchard, V., Conaty, A., da Silva, A. M., Gu, W., Kim, G.-K., Koster, R., Lucchesi, R., Merkova, D., Nielsen, J. E., Partyka, G., Pawson, S., Putman, W., Rienecker, M., Schubert, S. D., Sienkiewicz, M., and Zhao, B.: The Modern-Era Retrospective Analysis for Research and Applications, Version 2 (MERRA-2), J. Climate, 30, 5419–5454, https://doi.org/10.1175/JCLI-D-16-0758.1, 2017.
Ginoux, P., Chin, M., Tegen, I., Prospero, J. M., Holben, B., Dubovik, O., and Lin, S.-J.: Sources and distributions of dust aerosols simulated with the GOCART model, J. Geophys. Res., 106, 20255–20273, https://doi.org/10.1029/2000JD000053, 2001.
Gong, S. L.: A parameterization of sea-salt aerosol source function for sub- and super-micron particles, Global Biogeochem. Cycles, 17, 1097, https://doi.org/10.1029/2003GB002079, 2003.
Guerrero-Rascado, J. L., Landulfo, E., Antuña, J. C., de Melo Jorge Barbosa, H., Barja, B., Bastidas, Á. E., Bedoya, A. E., da Costa, R. F., Estevan, R., Forno, R., Gouveia, D. A., Jiménez, C., Larroza, E. G., da Silva Lopes, F. J., Montilla-Rosero, E., de Arruda Moreira, G., Nakaema, W. M., Nisperuza, D., Alegria, D., Múnera, M., Otero, L., Papandrea, S., Pallota, J. V., Pawelko, E., Quel, E. J., Ristori, P., Rodrigues, P. F., Salvador, J., Sánchez, M. F., and Silva, A.: Latin American Lidar Network (LALINET) for aerosol research: Diagnosis on network instrumentation, J. Atmos. Solar-Terr. Phy., 138–139, 112–120, https://doi.org/10.1016/j.jastp.2016.01.001, 2016.
Heese, B. and Wiegner, M.: Vertical aerosol profiles from Raman polarization lidar observations during the dry season AMMA field campaign, J. Geophys. Res., 113, D00C11, https://doi.org/10.1029/2007JD009487, 2008.
Holben, B. N., Eck, T. F., Slutsker, I., Tanré, D., Buis, J. P., Setzer, A., Vermote, E., Reagan, J. A., Kaufman, Y. J., Nakajima, T., Lavenu, F., Jankowiak, I., Smirnov, A.: AERONET – A federated instrument network and data archive for aerosol characterization, Remote Sens. Environ., 66, 1–16, https://doi.org/10.1016/s0034-4257(98)00031-5, 1998.
Hong, S.-Y., Noh, Y., and Dudhia, J.: A new vertical diffusion package with an explicit treatment of entrainment processes, Mon. Weather Rev., 134, 2318–2341, https://doi.org/10.1175/MWR3199.1, 2006.
Hsu, N. C., Tsay, S. C., King, M. D., and Herman, J. R.: Aerosol properties over bright-reflecting source regions, Geosci. Remote Sens., IEEE Transactions on, 42, 557–569, https://doi.org/10.1109/TGRS.2004.824067, 2004.
Hsu, N. C., Jeong, M.-J., Bettenhausen, C., Sayer, A. M., Hansell, R., Seftor, C. S., Huang, J., and Tsay, S.-C.: Enhanced Deep Blue aerosol retrieval algorithm: The second generation, J. Geophys. Res.-Atmos., 118, 9296–9315, https://doi.org/10.1002/jgrd.50712, 2013.
Hu, Z., Zhao, C., Huang, J., Leung, L. R., Qian, Y., Yu, H., Huang, L., and Kalashnikova, O. V.: Trans-Pacific transport and evolution of aerosols: evaluation of quasi-global WRF-Chem simulation with multiple observations, Geosci. Model Dev., 9, 1725–1746, https://doi.org/10.5194/gmd-9-1725-2016, 2016.
Iacono, M. J., Delamere, J. S., Mlawer, E. J., Shephard, M. W., Clough, S. A., and Collins, W. D.: Radiative forcing by long-lived greenhouse gases: Calculations with the AER radiative transfer models, J. Geophys. Res., 113, D13103, https://doi.org/10.1029/2008JD009944, 2008.
Jacobson, M. Z. and Kaufman, Y. J.: Wind reduction by aerosol particles, Geophys. Res. Lett., 33, L24814, https://doi.org/10.1029/2006GL027838, 2006.
Janssens-Maenhout, G., Crippa, M., Guizzardi, D., Dentener, F., Muntean, M., Pouliot, G., Keating, T., Zhang, Q., Kurokawa, J., Wankmüller, R., Denier van der Gon, H., Kuenen, J. J. P., Klimont, Z., Frost, G., Darras, S., Koffi, B., and Li, M.: HTAP_v2.2: a mosaic of regional and global emission grid maps for 2008 and 2010 to study hemispheric transport of air pollution, Atmos. Chem. Phys., 15, 11411–11432, https://doi.org/10.5194/acp-15-11411-2015, 2015.
Jiang, H., Farrar, J. T., Beardsley, Chen, R., and Chen, C.: Zonal surface wind jets across the Red Sea due to mountain gap forcing along both sides of the Red Sea, Geophys. Res. Lett., 36, L19605, https://doi.org/10.1029/2009GL040008, 2009.
Jish Prakash, P., Stenchikov, G., Kalenderski, S., Osipov, S., and Bangalath, H.: The impact of dust storms on the Arabian Peninsula and the Red Sea, Atmos. Chem. Phys., 15, 199–222, https://doi.org/10.5194/acp-15-199-2015, 2015.
Johnson, B. T., Heese, B., McFarlane, S. A., Chazette, P., Jones, A., and Bellouin, N.: Vertical distribution and radiative effects of mineral dust and biomass burning aerosol over West Africa during DABEX, J. Geophys. Res., 113, D00C12, https://doi.org/10.1029/2008JD009848, 2008.
Kahn, R. A., Gaitley, B. J., Martonchik, J. V., Diner, D. J., Crean, K. A., and Holben, B.: Multiangle Imaging Spectroradiometer (MISR) global aerosol optical depth validation based on 2 years of coincident Aerosol Robotic Network (AERONET) observations, J. Geophys. Res., 110, D10S04, https://doi.org/10.1029/2004JD004706, 2005.
Kalenderski, S. and Stenchikov, G.: High-resolution regional modeling of summertime transport and impact of African dust over the Red Sea and Arabian Peninsula, J. Geophys. Res.-Atmos., 121, 6435–6458, https://doi.org/10.1002/2015JD024480, 2016.
Khan, B., Stenchikov, G., Weinzierl, B., Kalenderski, S., and Osipov, S.: Dust plume formation in the free troposphere and aerosol size distribution during the Saharan Mineral Dust Experiment in North Africa, Tellus B, 67, 27170, https://doi.org/10.3402/tellusb.v67.27170, 2015.
Kim, D., Chin, M., Kemp, E. M., Tao, Z., Peters, C. D., and Ginoux, P.: Development of high-resolution dynamic dust source function – A case study with a strong dust storm in a regional model, Atmos. Environ., 159, 11–25, https://doi.org/10.1016/j.atmosenv.2017.03.045, 2017.
Kim, M.-H., Omar, A. H., Tackett, J. L., Vaughan, M. A., Winker, D. M., Trepte, C. R., Hu, Y., Liu, Z., Poole, L. R., Pitts, M. C., Kar, J., and Magill, B. E.: The CALIPSO version 4 automated aerosol classification and lidar ratio selection algorithm, Atmos. Meas. Tech., 11, 6107–6135, https://doi.org/10.5194/amt-11-6107-2018, 2018.
Klose, M. and Shao, Y.: Stochastic parameterization of dust emission and application to convective atmospheric conditions, Atmos. Chem. Phys., 12, 7309–7320, https://doi.org/10.5194/acp-12-7309-2012, 2012.
Klose, M. and Shao, Y.: Large-eddy simulation of turbulent dust emission, Aeol. Res., 8, 49–58, https://doi.org/10.1016/j.aeolia.2012.10.010, 2013.
Kok, J. F., Ridley, D. A., Zhou, Q., Miller, R. L., Zhao, C., Heald, C. L., Ward, D. S., Albani, S., and Haustein, K.: Smaller desert dust cooling effect estimated from analysis of dust size and abundance, Nat. Geosci., 10, 274–278, https://doi.org/10.1038/ngeo2912, 2017.
Kumar, R. K., Attada, R., Dasari, H. P., Vellore, R. K., Abualnaja, Y. O., Asok, K., and Hoteit, I.: On the recent amplification of dust over the Arabian Peninsula during 2002–2012, J. Geophys. Res.-Atmos., 124, 13220–13229, 2019.
Lebel, T., Parker, D. J., Flamant, C., Bourlès, B., Marticorena, B., Mougin, E., Peugeot, C., Diedhiou, A., Haywood, J. M., Ngamini, J. B., Polcher, J., Redelsperger, J.-L., and Thorncroft, C. D.: The AMMA field campaigns: multiscale and multidisciplinary observations in the West African region, Q. J. Roy. Meteor. Soc., 136, 8–33, https://doi.org/10.1002/qj.486, 2010.
LeGrand, S. L., Polashenski, C., Letcher, T. W., Creighton, G. A., Peckham, S. E., and Cetola, J. D.: The AFWA dust emission scheme for the GOCART aerosol model in WRF-Chem v3.8.1, Geosci. Model Dev., 12, 131–166, https://doi.org/10.5194/gmd-12-131-2019, 2019.
Li, W., El-Askary, H., Qurban, M. A., Proestakis, E., Garay, M. J., Kalashnikova, O. V., Amiridis, V., Gkikas, A., Marinou, E., Piechota, T., and Manikandan, K. P.: An Assessment of Atmospheric and Meteorological Factors Regulating Red Sea Phytoplankton Growth, Remote Sens., 10, 673, https://doi.org/10.3390/rs10050673, 2018.
Liu, F., Choi, S., Li, C., Fioletov, V. E., McLinden, C. A., Joiner, J., Krotkov, N. A., Bian, H., Janssens-Maenhout, G., Darmenov, A. S., and da Silva, A. M.: A new global anthropogenic SO2 emission inventory for the last decade: a mosaic of satellite-derived and bottom-up emissions, Atmos. Chem. Phys., 18, 16571–16586, https://doi.org/10.5194/acp-18-16571-2018, 2018.
Lopatin, A., Dubovik, O., Chaikovsky, A., Goloub, P., Lapyonok, T., Tanré, D., and Litvinov, P.: Enhancement of aerosol characterization using synergy of lidar and sun-photometer coincident observations: the GARRLiC algorithm, Atmos. Meas. Tech., 6, 2065–2088, https://doi.org/10.5194/amt-6-2065-2013, 2013.
Mahowald, N. M., Muhs, D. R., Levis, S., Rasch, P. J., Yoshioka, M., Zender, C. S., and Luo, C.: Change in atmospheric mineral aerosols in response to climate: Last glacial period, preindustrial, modern, and doubled carbon dioxide climates, J. Geophys. Res., 111, D10202, https://doi.org/10.1029/2005JD006653, 2006.
Marenco, F., Ryder, C., Estellés, V., O'Sullivan, D., Brooke, J., Orgill, L., Lloyd, G., and Gallagher, M.: Unexpected vertical structure of the Saharan Air Layer and giant dust particles during AER-D, Atmos. Chem. Phys., 18, 17655–17668, https://doi.org/10.5194/acp-18-17655-2018, 2018.
Marticorena, B. and Bergametti, G.: Modeling the atmospheric dust cycle: 1. Design of a soil-derived dust emission scheme, J. Geophys. Res., 100, 16415–16430, https://doi.org/10.1029/95JD00690, 1995.
Miller, S. T. K., Keim, B. D., Talbot, R. W., and Mao, H.: Sea breeze: Structure, forecasting, and impacts, Rev. Geophys., 41, 1011, https://doi.org/10.1029/2003RG000124, 2003.
Monahan, E. C., Spiel, D. E., and Davidson, K. L.: A Model of Marine Aerosol Generation Via Whitecaps and Wave Disruption, in: Oceanic Whitecaps, edited by: Monahan. E. C. and Niocaill, G. M., Oceanographic Sciences Library, Springer, Dordrecht, 2, 167–174, https://doi.org/10.1007/978-94-009-4668-2_16, 1986.
Neuman, C. M., Boulton, J. W., and Sanderson, S.: Wind tunnel simulation of environmental controls on fugitive dust emissions from mine tailings, Atmos. Environ., 43, 520–529, https://doi.org/10.1016/j.atmosenv.2008.10.011, 2009.
Omar, A. H., Winker, D. M., Vaughan, M. A., Hu, Y., Trepte, C. R., Ferrare, R. A., Lee, K. P., Hostetler, C. A., Kittaka, C., Rogers, R. R., and Kuehn, R. E.: The CALIPSO Automated Aerosol Classification and Lidar Ratio Selection Algorithm, J. Atmos. Ocean. Tech., 26, 1994–2014, https://doi.org/10.1175/2009JTECHA1231.1, 2009.
Osipov, S. and Stenchikov, G.: Simulating the regional impact of dust on the Middle East climate and the Red Sea, J. Geophys. Res.-Oceans, 123, 1032–1047, https://doi.org/10.1002/2017JC013335, 2018.
Osipov, S., Stenchikov, G., Brindley, H., and Banks, J.: Diurnal cycle of the dust instantaneous direct radiative forcing over the Arabian Peninsula, Atmos. Chem. Phys., 15, 9537–9553, https://doi.org/10.5194/acp-15-9537-2015, 2015.
Pappalardo, G., Amodeo, A., Apituley, A., Comeron, A., Freudenthaler, V., Linné, H., Ansmann, A., Bösenberg, J., D'Amico, G., Mattis, I., Mona, L., Wandinger, U., Amiridis, V., Alados-Arboledas, L., Nicolae, D., and Wiegner, M.: EARLINET: towards an advanced sustainable European aerosol lidar network, Atmos. Meas. Tech., 7, 2389–2409, https://doi.org/10.5194/amt-7-2389-2014, 2014.
Parajuli, S. P. and Zender, C.: Connecting geomorphology to dust emission through high-resolution mapping of global land cover and sediment supply, Aeol. Res., 27, 47–65, https://doi.org/10.1016/j.aeolia.2017.06.002, 2017.
Parajuli, S. P., Yang, Z.‐L., and Kocurek, G.: Mapping erodibility in dust source regions based on geomorphology, meteorology, and remote sensing, J. Geophys. Res.-Earth Surf., 119, 1977–1994, https://doi.org/10.1002/2014JF003095, 2014.
Parajuli, S. P., Stenchikov, G. L., Ukhov, A., and Kim, H.: Dust emission modeling using a new high‐resolution dust source function in WRF‐Chem with implications for air quality, J. Geophys. Res.-Atmos., 124, 10109–10133, https://doi.org/10.1029/2019JD030248, 2019.
Parajuli, S. P., Stenchikov, G. L., Ukhov, A., Shevchenko, I. Dubovik, O., and Lopatin, A.: Data for Aerosol Vertical Distribution and Interactions with Land/Sea Breezes over the Eastern Coast of the Red Sea from LIDAR Data and High-resolution WRF-Chem Simulations, KAUST repository, https://doi.org/10.25781/KAUST-PBR81, last access: 22 December 2020.
Prospero, J. M.: Long-term measurements of the transport of African mineral dust to the southeastern United States: Implications for regional air quality, J. Geophys. Res., 104, 15917–15927, https://doi.org/10.1029/1999JD900072, 1999.
Rasch, P. J., Collins, W. D., and Eaton, B. E.: Understanding the Indian Ocean Experiment (INDOEX) aerosol distributions with an aerosol assimilation, J. Geophys. Res., 106, 7337–7355, https://doi.org/10.1029/2000JD900508, 2001.
Rémy, S., Benedetti, A., Bozzo, A., Haiden, T., Jones, L., Razinger, M., Flemming, J., Engelen, R. J., Peuch, V. H., and Thepaut, J. N.: Feedbacks of dust and boundary layer meteorology during a dust storm in the eastern Mediterranean, Atmos. Chem. Phys., 15, 12909–12933, https://doi.org/10.5194/acp-15-12909-2015, 2015.
Rinecker, M. M., Suarez, M. J., Gelaro, R., Todling, R., Bacmeister, J., Liu, E., Bosilovich, M. G., Schubert, S. D., Takacs, L., Kim, G. K., Bloom, S., Chen, J., Collins, D., Conaty, A., da Silva, A., Gu, W., Joiner, J., Koster, R. D., Lucchesi, R., Molod, A., Owens, T., Pawson, S., Pegion, P., Redder, C. R., Reichle, R., Robertson, F. R., Ruddick, A. G., Sienkiewicz, M., and Woollen, J.: MERRA: NASA's modern‐era retrospective analysis for research and applications, J. Climate, 24, 3624–3648, https://doi.org/10.1175/JCLI‐D‐11‐00015.1, 2011.
Ryder, C. L., Highwood, E. J., Walser, A., Seibert, P., Philipp, A., and Weinzierl, B.: Coarse and giant particles are ubiquitous in Saharan dust export regions and are radiatively significant over the Sahara, Atmos. Chem. Phys., 19, 15353–15376, https://doi.org/10.5194/acp-19-15353-2019, 2019.
Saide, P. E., Carmichael, G. R., Spak, S. N., Gallardo, L., Osses, A. E., Mena-Carrasco, M. A., and Pagowski, M.: Forecasting urban PM10 and PM2.5 pollution episodes in very stable nocturnal conditions and complex terrain using WRF–Chem CO tracer model, Atmos. Environ., 45, 2769–2780, https://doi.org/10.1016/j.atmosenv.2011.02.001, 2011.
Schepanski, K., Tegen, I., Laurent, B., Heinold, B., and Macke, A.: A new Saharan dust source activation frequency map derived from MSG-SEVIRI IR-channels, Geophys. Res. Lett., 34, L18803, https://doi.org/10.1029/2007GL030168, 2007.
Selezneva, E. S.: The main features of condensation nuclei distribution in the free atmosphere over the European territory of the USSR, Tellus, 18, 525–531, https://doi.org/10.1111/j.2153-3490.1966.tb00265.x, 1966.
Senghor, H., Machu, É., Hourdin, F., and Gaye, A. T.: Seasonal cycle of desert aerosols in western Africa: analysis of the coastal transition with passive and active sensors, Atmos. Chem. Phys., 17, 8395–8410, https://doi.org/10.5194/acp-17-8395-2017, 2017.
Shao, Y., Wyrwoll, K. H., Chappell, A., Huang, J., Lin, Z., McTainsh, G. H., Mikami, M., Tanaka, T. Y., Wang, X., and Yoon, S.: Dust cycle: an emerging core theme in Earth system science, Aeol. Res., 2, 181–204, https://doi.org/10.1016/j.aeolia.2011.02.001, 2011.
Shimizu, A., Nishizawa, T., Jin, Y., Kim, S.-W., Wang, Z., Batdorj, D., and Sugimoto, N.: Evolution of a lidar network for tropospheric aerosol detection in East Asia, Opt. Eng. 56, 031219, https://doi.org/10.1117/1.OE.56.3.031219, 2016.
Simpson, J. E.: Sea breeze and local winds, Cambridge University Press, New York, 1994.
Sokolik, I. N. and Toon, O. B.: Direct radiative forcing by anthropogenic airborne mineral aerosols, Nature, 381, 681–683, https://doi.org/10.1038/381681a0, 1996.
Stephens, G., Winker, D., Pelon, J., Trepte, C., Vane, D., Yuhas, C., L'Ecuyer, T., and Lebsock, M.: CloudSat and CALIPSO within the A-Train: Ten Years of Actively Observing the Earth System, B. Am. Meteorol. Soc., 99, 569–581, https://doi.org/10.1175/BAMS-D-16-0324.1, 2018.
Teixeira, J. C., Carvalho, A. C., Tuccella, P., Curci, G., and Rocha, A.: WRF-chem sensitivity to vertical resolution during a saharan dust event, Phys. Chem. Earth Parts A/B/C, 94, 188–195, https://doi.org/10.1016/j.pce.2015.04.002, 2016.
Tewari, M., Chen, F., Wang, W., Dudhia, J., LeMone, M. A., Mitchell, K., Ek, M., Gayno, G., Wegiel, J., and Cuenca, R. H.: Implementation and verification of the unified NOAH land surface model in the WRF model. 20th conference on weather analysis and forecasting/16th conference on numerical weather prediction, available at: https://www2.mmm.ucar.edu/wrf/users/phys_refs/LAND_SURFACE/noah.pdf (last access: 22 December 2020), pp. 11–15, 2004.
Ukhov, A., Ahmadov, R., Grell, G., and Stenchikov, G.: Improving dust simulations in WRF-Chem model v4.1.3 coupled with GOCART aerosol module, Geosci. Model Dev. Discuss., https://doi.org/10.5194/gmd-2020-92, in review, 2020a.
Ukhov, A., Mostamandi, S., da Silva, A., Flemming, J., Alshehri, Y., Shevchenko, I., and Stenchikov, G.: Assessment of natural and anthropogenic aerosol air pollution in the Middle East using MERRA-2, CAMS data assimilation products, and high-resolution WRF-Chem model simulations, Atmos. Chem. Phys., 20, 9281–9310, https://doi.org/10.5194/acp-20-9281-2020, 2020b.
Ukhov, A., Mostamandi, S., Krotkov, N., Flemming, J., da Silva, A., Li, C., Fioletov. V., McLinden, C., Anisimov, A., Alshehri, Y., and Stenchikov, G.: Study of SO2 pollution in the Middle East using MERRA-2, CAMS data assimilation products, and high-resolution WRF-Chem simulations, J. Geophys. Res.-Atmos., 125, e2019JD031993, https://doi.org/10.1029/2019JD031993, 2020c.
Wang, S. H., Lin, N. H., OuYang, C. F., Wang, J. L., Campbell, J. R., Peng, C. M., Lee, C. T., Sheu, G. R., and Tsay, S. C.: Impact of Asian dust and continental pollutants on cloud chemistry observed in northern Taiwan during the experimental period of ABC/EAREX 2005, J. Geophys. Res., 115, D00K24, https://doi.org/10.1029/2009JD013692, 2010.
Welton, E. J., Voss, K. J., Gordon, H. R., Maring, H., Smirnov, A., Holben, B., Schmid, B., Livingston, J. M., Russell, P. B., Durkee, P. A., Formenti, P., and Andreae, M. O.: Ground-based lidar measurements of aerosols during ACE-2: instrument description, results, and comparisons with other ground-based and airborne measurements, Tellus B, 52, 636–651, https://doi.org/10.1034/j.1600-0889.2000.00025.x, 2000.
Welton, E. J., Campbell, J. R., Spinhirne, J. D., and Scott III, V. S.: Global monitoring of clouds and aerosols using a network of micropulse lidar systems, Proc. SPIE 4153, KAUST–MPL Remote Sensing for Industry and Environment Monitoring, Sendai, Japan, 13 February 2001, https://doi.org/10.1117/12.417040, 2001.
Welton, E. J., Campbell, J. R., Berkoff, T. A., Spinhirne, J. D., Tsay, S. C., Holben, B., Shiobara, M., and Starr, D. O.: The Micro-pulse lidar Network (MPL-Net), Twenty-first International Laser Radar Conference (ILRC21), Quebec City, Canada, 8–12 July 2002, available at: https://ntrs.nasa.gov/search.jsp?R=20020083050 (last access: 5 June 2019), 2002a.
Welton, E. J., Voss, K. J., Quinn, P. K., Flatau, P. J., Markowicz, K., Campbell, J. R., Spinhirne, J. D., Gordon, H. R., and Johnson, J. E.: Measurements of aerosol vertical profiles and optical properties during INDOEX 1999 using micropulse lidars, J. Geophys. Res., 107, 8019, https://doi.org/10.1029/2000JD000038, 2002b.
Wild, O., Zhu, X., and Prather, M. J.: Fast-J: accurate simulation of in- and below cloud photolysis in tropospheric chemical models, J. Atmos. Chem., 37, 245–282, https://doi.org/10.1023/A:1006415919030, 2000.
Winker, D. M., Couch, R. H., and McCormick, M. P.: An overview of LITE: NASA's Lidar In-space Technology Experiment, in Proceedings of the IEEE, 84, 164–180, https://doi.org/10.1109/5.482227, 1996.
Winker, D. M., Vaughan, M. A., Omar, A., Hu, Y., Powell, K. A., Liu, Z., Hunt, W. H., and Young, S. A.: Overview of the CALIPSO Mission and CALIOP Data Processing Algorithms, J. Atmos. Ocean. Tech., 26, 2310–2323, https://doi.org/10.1175/2009JTECHA1281.1, 2009.
Winker, D. M., Tackett, J. L., Getzewich, B. J., Liu, Z., Vaughan, M. A., and Rogers, R. R.: The global 3-D distribution of tropospheric aerosols as characterized by CALIOP, Atmos. Chem. Phys., 13, 3345–3361, https://doi.org/10.5194/acp-13-3345-2013, 2013.
Wu, L., Su, H., Kalashnikova, O. V., Jiang, J. H., Zhao, C., Garay, M. J., Campbell, J. R., and Yu, N.: WRF-Chem simulation of aerosol seasonal variability in the San Joaquin Valley, Atmos. Chem. Phys., 17, 7291–7309, https://doi.org/10.5194/acp-17-7291-2017, 2017.
Yuan, T., Chen, S., Huang, J., Zhang, X., Luo, Y., Ma, X., and Zhang, G.: Sensitivity of simulating a dust storm over Central Asia to different dust schemes using the WRF-Chem model, Atmos. Environ., 207, 16–29, https://doi.org/10.1016/j.atmosenv.2019.03.014, 2019.
Zhang, Y., Liu, Y., Kucera, P. A., Alharbi, B. H., Pan, L., and Ghulam, A.: Dust modeling over Saudi Arabia using WRF-Chem: March 2009 severe dust case, Atmos. Environ., 119, 118–130, https://doi.org/10.1016/j.atmosenv.2015.08.032, 2015.
Zhao, C., Liu, X., Leung, L. R., Johnson, B., McFarlane, S. A., Gustafson Jr., W. I., Fast, J. D., and Easter, R.: The spatial distribution of mineral dust and its shortwave radiative forcing over North Africa: modeling sensitivities to dust emissions and aerosol size treatments, Atmos. Chem. Phys., 10, 8821–8838, https://doi.org/10.5194/acp-10-8821-2010, 2010.