the Creative Commons Attribution 4.0 License.
the Creative Commons Attribution 4.0 License.
 | 22 Dec 2020
Measurement report: Long-term variations in carbon monoxide at a background station in China's Yangtze River Delta region
Yijing Chen
Qianli Ma
Xiaobin Xu
Jie Yao
Wei Gao
This study analyzed the long-term variations in carbon monoxide (CO) mixing ratios from January 2006 to December 2017 at the Lin'an regional atmospheric background station (LAN; 30.3∘ N, 119.73∘ E, 138 m a.s.l.) in China's Yangtze River Delta (YRD) region. The CO mixing ratios were at their highest (0.69 ± 0.08 ppm) and lowest (0.54 ± 0.06 ppm) in winter and summer, respectively. The average daily variation in CO exhibited a double-peaked pattern, with peaks in the morning and evening and a valley in the afternoon. A significant downward trend of −11.3 ppb yr−1 of CO was observed from 2006 to 2017 at the LAN station, which was in accordance with the negative trends of the average CO mixing ratios and total column retrieved from the satellite data (Measurements of Pollution in the Troposphere, MOPITT) over the YRD region during the same period. The average annual CO mixing ratio at the LAN station in 2017 was 0.51 ± 0.04 ppm, which was significantly lower than that (0.71 ± 0.12 ppm) in 2006. The decrease in CO levels was largest in autumn (−15.7 ppb yr−1), followed by summer (−11.1 ppb yr−1), spring (−10.8 ppb yr−1), and winter (−9.7 ppb yr−1). Moreover, the CO levels under relatively polluted conditions (the annual 95th percentiles) declined even more rapidly (−22.4 ppb yr−1, , p<0.05) from 2006 (0.91 ppm) to 2017 (0.58 ppm), and the CO levels under clean conditions (the annual 5th percentiles) showed decreasing evidence but not statistically significant (, p=0.19) throughout the years. The long-term decline and short-term variations in the CO mixing ratios at the LAN station were mainly attributed to the implementation of the anthropogenic pollution control measures in the YRD region and to events like the Shanghai Expo in 2010 and Hangzhou G20 in 2016. The decreased CO level may influence atmospheric chemistry over the region. The average OH reactivity of CO at the LAN station is estimated to significantly drop from 4.1 ± 0.7 s−1 in 2006 to 3.0 ± 0.3 s−1 in 2017.
- Article
(2836 KB) - Full-text XML
-
Supplement
(310 KB) - BibTeX
- EndNote


Carbon monoxide (CO) is a key player in the atmospheric carbon cycle (Novelli et al., 1992). In the troposphere, CO is one of the important air pollutants with high mixing ratios. The volume mixing ratios of CO can reach an order of 10−6 (Khalil and Rasmussen, 1990). CO is also a reactive trace gas that considerably affects health, ecology, and climate and hence recommended by the Global Atmosphere Watch (GAW) of the World Meteorological Organization (WMO) for priority observation. Fossil fuel combustion (mainly in the Northern Hemisphere), biomass combustion (mostly in the Southern Hemisphere), and natural processes (the oxidation of organic compounds, such as methane (CH4) and isoprene) are the main sources of CO (Crutzen et al., 1979; Holloway et al., 2000; Thompson and Cicerone, 1986; Novelli et al., 1998; Andreae and Merlet, 2001; Bakwin et al., 1994). The major sink for CO is its reaction with OH radicals in the troposphere (Holloway et al., 2000; Thompson and Cicerone, 1986; Novelli et al., 1998). The lifetime of CO in the atmosphere ranges from weeks to months, which makes it an ideal tracer for atmospheric transport processes (Seinfeld and Pandis, 2006; Worden et al., 2013). Because CH4 and CO can react with OH radicals (Thompson, 1992; Daniel and Solomon, 1998), certain CO mixing ratios can indirectly cause a decrease in CH4 and an increase in CO2. Therefore, CO is recognized as an important indirect greenhouse gas. Moreover, CO can be an important precursor for the photochemical generation of ozone in rural areas (Demerjian et al., 1972).
Continuous long-term observation is a method for studying large-scale CO sources, sinks, and long-distance transport. This method allows the CO balance to be determined on a regional or global scale (Fang et al., 2014). In the past decades, many studies have explored the long-term change in CO levels through ground-, aircraft-, or satellite-based observations (Yurganov et al., 2010; Worden et al., 2013; Ahmed et al., 2015; Cohen et al., 2018; Wang et al., 2018). Most of these studies have revealed downward trends for CO concentration. For example, Worden et al. (2013) reported that the CO total column over China decreased by 1.6 % ± 0.5 % yr−1 from 2002 to 2012. Ahmed et al. (2015) analyzed long-term CO observations at two urban sites in Seoul and reported a downward trend of CO from 2004 to 2013. Wang et al. (2018) found that from 1998 to 2014, the total column amount of CO over Beijing and Moscow decreased at 1.14 % ± 0.87 % yr−1 and 3.73 % ± 0.39 % yr−1, respectively. Cohen et al. (2018) analyzed the trends of CO in the upper troposphere from 2001 to 2013. In their study, almost all observed trends were negative, with the estimated slopes ranging from −1.37 to −0.59 ppb yr−1. The CO data recorded in the Arctic ice core indicated that the CO mixing ratios in this region decreased after the 1970s (Petrenko et al., 2013).
Ground-based background measurements are crucial for verifying the accuracy of satellite observation data, reflecting the impact of human activities on air quality and climate change, and evaluating the effectiveness of pollution control measures. In China, many air pollutants have been emitted in very large quantities. For example, the emission of CO was estimated to be about 171 Tg in 2010 (Li et al., 2017). To fight against the air pollution, the country has implemented a series of emission control measures in the last decade. The effectiveness of these measures needs to be verified by observational data, in particular the data from background sites. Long-term background observations over a decade are relatively scarce in China. Reports of long-term background observations of CO are very limited in the literature (Meng et al., 2009; Liu et al., 2019; Zhou et al., 2004; Zhang et al., 2011) and none of them present an analysis of CO variations over a decade. The Yangtze River Delta (YRD) is one of the most developed regions in China. The long-term observation of atmospheric background CO allows for a scientific understanding of the CO source and sink cycle in this region. In this study, we present 12-year (from 2006 to 2017) ground-based observations of CO at a background station in the YRD region. We analyze the long-term CO variations and their determinants in the background areas of eastern China. The results of this study function as scientific evidence for evaluating the effectiveness of pollution control policies and as a reference for formulating practicable air pollution management and emission control measures.
The CO mixing ratios analyzed in this study were collected from January 2006 to December 2017 at Lin'an (LAN) station (30∘18′ N, 119∘44′ E, 138.6 m a.s.l), a regional atmospheric background monitoring site in China's Zhejiang Province. The LAN station is one of the seven atmospheric background stations operated by the China Meteorological Administration and also a member station of the World Meteorological Organization (WMO) Global Atmosphere Watch (GAW) program. The measurements at this station reflect the changes in the YRD region's atmospheric background composition (Qi et al., 2012). The LAN station is located approximately 50 km west of Hangzhou (the capital city of Zhejiang Province) and 150 km southwest of Shanghai. It is influenced by a typical subtropical monsoon climate. Figure 1 displays the seasonal variations in temperature (T), air pressure (P), wind speed (WS), and relative humidity (RH) as well as the wind direction (WD) frequency at the LAN station from 2006 to 2017. These data were obtained from regular meteorological observations at the LAN station. As displayed in Fig. 1, the seasonal temperature trend at the LAN station was of a convex shape. The highest and lowest temperatures occurred in July (28.4 ± 1.5 ∘C) and January (4.1 ± 1.8 ∘C), respectively. In opposition to the seasonal change in temperature, the seasonal change in atmospheric pressure at the LAN station showed a concave shape, with the lowest and highest pressures occurring in July (989.51 ± 0.77 hPa) and January (1010.81 ± 1.54 hPa), respectively. The seasonal patterns of the WS and RH at the LAN station were not as clear as those of air temperature and pressure. The seasonal average WS was lowest in winter (1.9 ± 0.1 m/s) and highest in spring (2.1 ± 0.1 m/s). The RH was highest in summer (77 ± 3 %) and lowest in spring (68 ± 2 %). The winds at the LAN station mostly originated from the northeast and southwest, as shown in Fig. 1d. On average, the northeast and southwest winds accounted for 29.2 % and 22.6 % of the winds, respectively. The calm wind frequency was 4 %.

Figure 1Seasonal variations in (a) temperature, air pressure, (b) WS, (c) RH, and (d) WD frequency distribution (the static wind frequency was 4 %) at the LAN station from 2006 to 2017 (an error bar represents 1 standard deviation).
A gas-filter correlation infrared absorption analyzer (48C trace level, Thermo Fisher, USA) was used to measure the surface CO mixing ratios. The analyzer has a limit of detection of 0.04 ppm. Infrared radiation is chopped and passed through a rotating gas-filter lens, half of which is filled with CO and half with nitrogen. Thus, reference and measurement beams are produced in alternation. The beams then pass through a narrow-band interference filter and sample cell. Because the CO in the sample cell can only absorb the measurement beam, and the other gases can absorb both beams, the measurement signal of CO could be obtained by comparing the attenuation intensity between the reference and measurement beams.
The measurement signal from the CO analyzer was recorded every 5 min. Zero check and span check were conducted every 6 and 24 h, respectively. Multipoint (>5) calibration was performed once a month using a standard CO gas mixture (CO in nitrogen). Because the zero point of the instrument drifted with time, we performed linear interpolation between two adjacent zero checks to obtain the zero signals for a given time point between the zero checks. These zero signals were used in the corrections of the CO data. We performed response correction according to the results of multipoint calibrations as well as the zero and span checks (Lin et al., 2009). Finally, we corrected the data according to the quantity transfer and traceability results (Lin et al., 2011a). Valid 5 min data were used to calculate the hourly mean mixing ratios. At least 10 data points were required for any given hour to calculate that hour's mixing ratio. Missing data were caused by the malfunction of the instrument from 1 to 13 February 2007 and from abnormal measurement fluctuations from 30 May to 17 July 2009.
3.1 Observed levels and comparisons with other sites
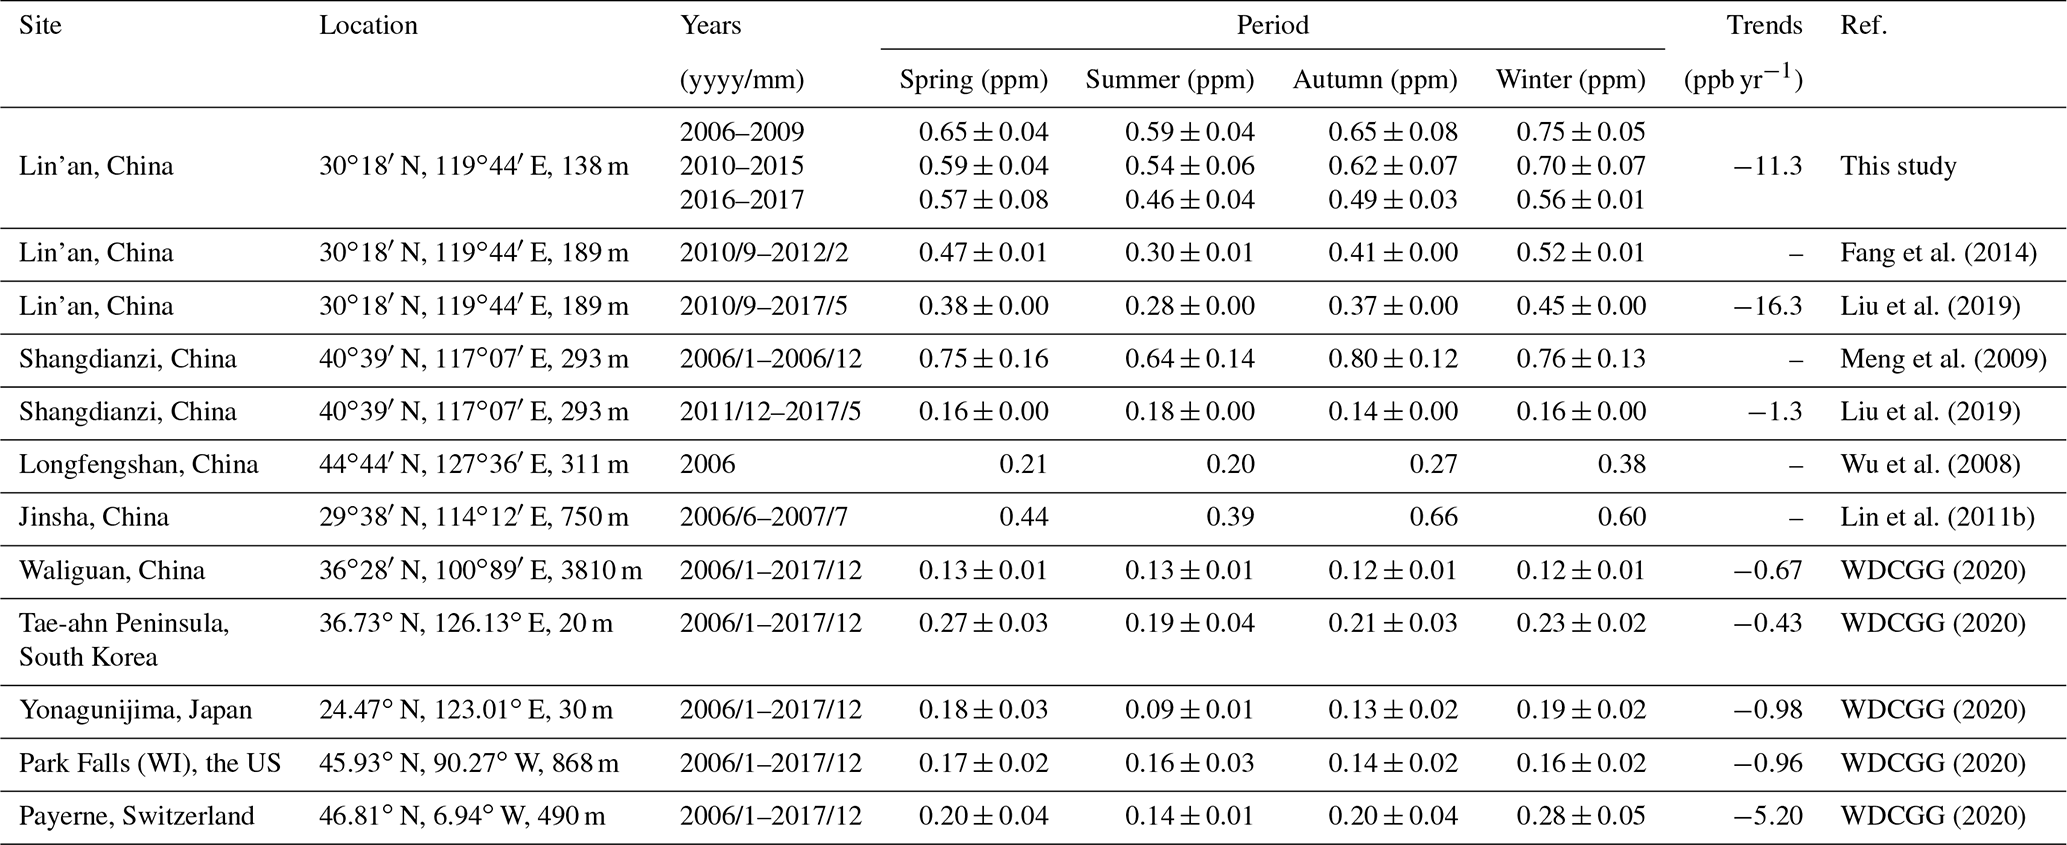
Figure 2 displays the time series of hourly mean CO levels at the LAN station from 1 January 2006 to 31 December 2017 and the linear fitting results of the hourly mean CO mixing ratios. The overall mean (±1 standard deviation) and median values of the CO mixing ratios in the 12 years were 0.62 (±0.23) ppm and 0.57 ppm, respectively. The highest (2.98 ppm) and lowest (0.08 ppm) hourly mean mixing ratios occurred at 17:00 local time (LT) on 10 January 2008 and 18:00 LT on 4 October 2007, respectively. The highest hourly mean CO mixing ratio was considerably lower than the second-level hourly limit (approximately 8 ppm) of the ambient air quality standard in China (GB 3095-2012). The highest (2.38 ppm) and lowest (0.23 ppm) daily mean mixing ratios occurred on 10 January 2008 and 31 August 2011, respectively. The highest daily mean value was also below the daily limit for air quality standard (3.2 ppm). The lowest monthly average CO concentration was 0.39 ppm on August 2011, and the highest concentration was 1.00 ppm on January 2010. The median of daily mean CO levels from January 2006 to December 2017 was 0.58 ppm. The overall CO concentrations at the LAN station were much higher than those observed at the Waliguan global baseline station from 2006–2017 and some regional background stations outside China (Table 1), indicating that east China has been one of the regions with high CO levels. Table 1 also presents a comparison of the seasonal average CO mixing ratios at the LAN station and other background stations in the world from 2006 to 2017. The seasonal CO mixing ratios at the LAN station were marginally lower than those at the Shangdianzi station in northern China (Meng et al., 2009) but were almost 3 times higher than those at many other regional atmospheric background stations outside China, such as the Tae-ahn Peninsula station in South Korea, Yonagunijima station in Japan, Park Falls (WI) station in the US, and Payerne station in Switzerland from 2006 to 2017 (Table 1). Moreover, the CO mixing values observed at the LAN station were nearly 5 times higher than those observed at the Waliguan station, a global baseline station in China. In conclusion, the CO levels at the LAN station were relatively high compared to other regional atmospheric background stations outside China because of more intense anthropogenic emissions in the YRD region.
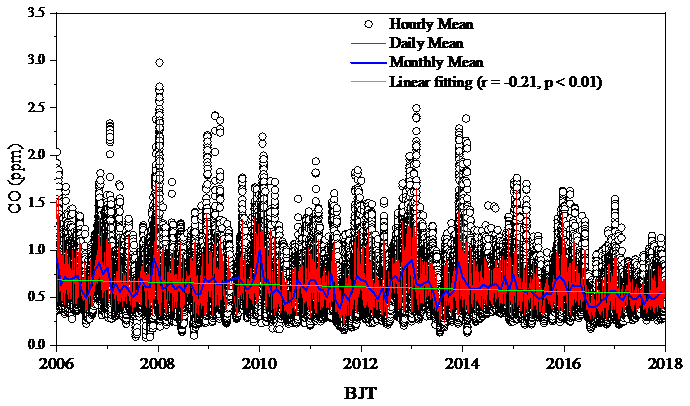
Table 1Comparison of seasonal average CO variations at the LAN station and other similar background stations around the world.
3.2 Seasonal variation
Figure 3 shows the seasonal variations in CO mixing ratios at the LAN station and the number of fire emissions (retrieved from the Global Fire Emissions Database version 4 described in van der Werf et al. (2017) in the YRD region (22–40∘ N, 112–123∘ E) from 2006 to 2017.
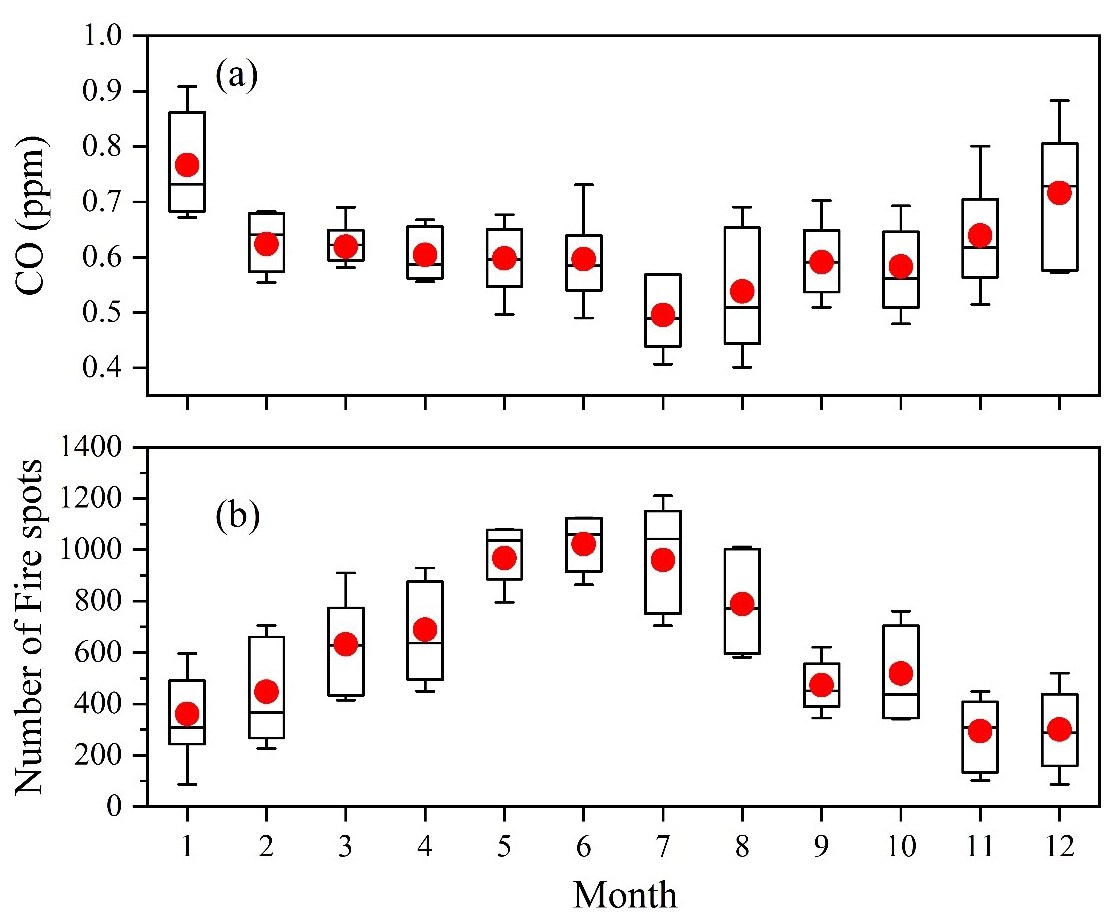
Figure 3Seasonal variations in CO mixing ratios at the LAN station and the number of fire spots in the YRD region from 2006 to 2017. The lines and dots in the box are the median and mean concentrations, respectively; the box's lower and upper limits represent 25th and 75th percentile concentration ranges, respectively; and the lower and upper whiskers correspond to the 10th and 90th percentile values.
As can be seen in Fig. 3a, the average CO mixing ratios were the highest in the winter (0.69 ± 0.08 ppm), followed by the spring (0.61 ± 0.05 ppm), autumn (0.61 ± 0.09 ppm), and summer (0.54 ± 0.06 ppm). In the winter, because of the weak radiation, the photochemical consumption of CO in the atmosphere decreased. Also, the atmospheric stability was high and the diffusion conditions were unfavorable. Therefore, atmospheric CO accumulated easily and reached its maximum concentration in the winter. In comparison, the photochemical reaction was strong in the summer, which resulted in an increase in the mixing ratios of OH radicals and the chemical consumption of atmospheric CO. Moreover, the boundary layer height was relatively high in the summertime, which promoted the vertical diffusion and dilution of CO in the atmosphere. Therefore, the CO mixing ratios were the lowest in the summer. By contrast, the seasonal variations in the number of fire emissions in the YRD region (Fig. 3b) were opposite to the trend of the CO mixing ratios in different months, which indicated that open fire burning was not a main factor affecting the atmospheric CO concentrations at the LAN station from 2006 to 2017.
3.3 Diurnal variation
The daily variations in the CO mixing ratios were influenced by emission sources, atmospheric transport (horizontal and vertical), and the evolution of the atmospheric boundary layer (Xue et al., 2006). Figure 4 displays the average daily variations in the CO mixing ratios at the LAN station, along with the cities Shanghai (Gao et al., 2017), Nanjing (Huang et al., 2013a), and Hangzhou (Zhang et al., 2018). As displayed in Fig. 4, the CO mixing ratios exhibited double peaks, with higher CO levels in the morning and evening but lower CO levels in the afternoon. The peak of the CO mixing ratios at the LAN station mostly occurred in the morning (07:00–10:00 LT) and at night (19:00–24:00 LT). The lowest CO mixing ratios were observed between 12:00 and 16:00 LT. The hourly CO mixing ratios usually reached their minimum value in the afternoon due to the high atmospheric boundary layer, intense vertical diffusion mixing, and sufficient OH radicals at that time (Fang et al., 2014). The planetary boundary layer height (PBLH) is a key indicator of atmospheric mixing state. As shown in Figs. S1 and S2 in the Supplement, the PBLH was rather high during the daytime and usually reached its highest around 14:00 LT, which indicated that the pollutants in the atmosphere were well mixed in the afternoon and corresponded to the time when the lowest CO mixing ratios were observed (Fig. 4). Since the diurnal variations in the PBLHs at four sites were almost similar according to the hourly resolution (Figs. S1 and S2), the little phase shift in the CO mixing ratio peak between different sites was likely attributed to the difference in local emissions. The peak CO mixing ratios at the LAN station occurred during the morning and evening rush hours. This is consistent with those observed in the urban areas of Shanghai (Gao et al., 2017), Nanjing (Huang et al., 2013a), and Hangzhou (Zhang et al., 2018) (Fig. 4). Thus, the CO mixing ratios at the LAN station were affected by the pollutant emissions related to transportation in the surroundings. However, the peak–valley difference of CO at LAN was much smaller than those found in the cities, reflecting reduced impacts from direct emissions on this background site.
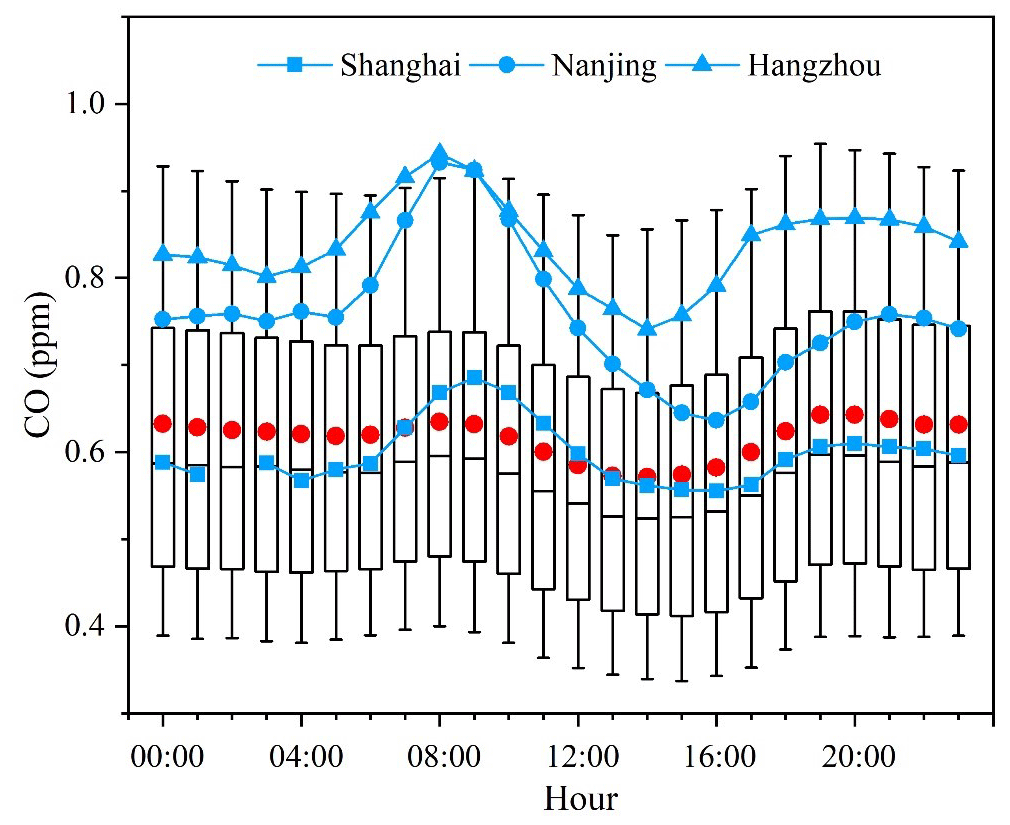
Figure 4Average diurnal variations in CO mixing ratios from 2006 to 2015 in Shanghai, from January to December 2011 in Nanjing, from January to December 2013 in Hangzhou, and from 2006 to 2017 at the LAN station. The lines and red dots in the box are the median and mean CO concentrations at the LAN station, respectively; the box's lower and upper limits represent 25th and 75th percentile concentrations, respectively; and the lower and upper whiskers correspond to the 10th and 90th percentile values.
3.4 Long-term trends
3.4.1 Trends of annual means
Figure 5 shows the change in the annual mean CO mixing ratios at the LAN station from 2006 to 2017. The CO levels varied across the years. The World Expo was held in Shanghai from May to October 2010, when air pollution prevention and control measures were strengthened in Shanghai and its surrounding areas. Because of these strengthened measures, the number of days with good air quality reached its highest value since 2001 (Huang et al., 2013b). Figure 5 also indicates that the average CO mixing ratio in 2010 was lower than those from 2006 to 2009 (1.5 months of data were missing for the summer of 2009). The CO level continued to decline in 2011 but increased in 2012, after which the CO level decreased steadily. China officially implemented the Action Plan for The Prevention and Control of Air Pollution in 2013 (State Council of the People's Republic of China, 2013), which comprehensively intensified air pollution control efforts and reduced multi-pollutant emissions. The plan called for 5-year efforts to improve overall air quality and significantly reduce heavy pollution. As illustrated in Fig. 5, the effects of the aforementioned action plan began to be observed in 2014, and the CO mixing ratios started to decline significantly. Overall, the annual average of CO at LAN showed a decrease trend of 11.3 ppb yr−1 (p<0.01) during 2006–2017. For the period 2010–2017, we obtained a trend of −14 ppb yr−1. This rate of decline in the CO mixing ratio was slightly lower than that (−16.3 ppb yr−1) reported by Liu et al. (2019) for the same station for 2010–2017. The measurements of Liu et al. (2019) were performed using a cavity ring-down spectrometer, their air samples were drawn from a tower (intake height: 50 m a.g.l.), and their trend was based on non-linear fitting on CO values after removing those impacted by local events. The CO decreasing trend obtained in this study is smaller than those reported by Ahmed et al. (2015) with values of −20 and −13 ppb yr−1, respectively, for two urban sites in South Korea during 2004–2013, larger than that reported by Liu et al. (2019) with a value of −1.3 ppb yr−1 for a regional atmospheric background station in northern China during 2011–2017 and about a factor of 2–26 of those found in regional atmospheric background stations in South Korea, Japan, and Switzerland (Table 1).
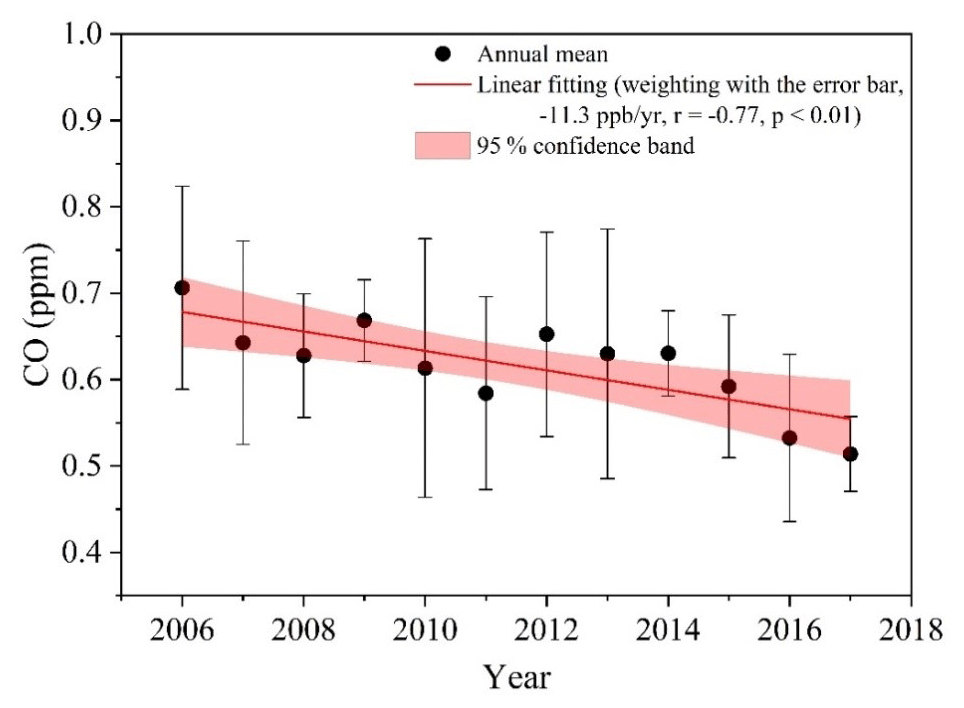
Figure 5Variation in the annual mean CO mixing ratios at the LAN station from 2006 to 2017 (the error bars represent 1 standard deviation calculated from monthly means).
Considering the variation trend in Fig. 5 and the major air pollution control policies adopted during the study period, we divided the study data into three subsets of data (collected during 2006–2009, 2010–2015, and 2016–2017, respectively). The frequency distributions of average daily CO mixing ratios in the three data subsets and the Lorentz curve fitting results are displayed in Fig. 6. Approximately, a unimodal structure of CO frequency distribution was observed for all the datasets. The peak values of the Lorentz curves can be used to characterize the background concentration levels of atmospheric pollutants for a specific time and region (Lin et al., 2011b). The peak of the CO Lorentz curve shifted towards lower mixing ratios over time, and the trailing phenomenon of the fitting curve diminished gradually. The peak concentration of the fitting curve was 0.59 ± 0.01 ppm from 2006 to 2009. During 2010–2015 and 2016–2017, the peak CO concentrations were 0.56 ± 0.01 and 0.49 ± 0.01 ppm, respectively. The peak frequency of the Lorentz curve was higher in 2016–2017 than in 2006–2015. Moreover, the peak width was significantly narrower in 2016–2017 than in 2006–2015. These result from a decrease over time in the regional background mixing ratios of CO.
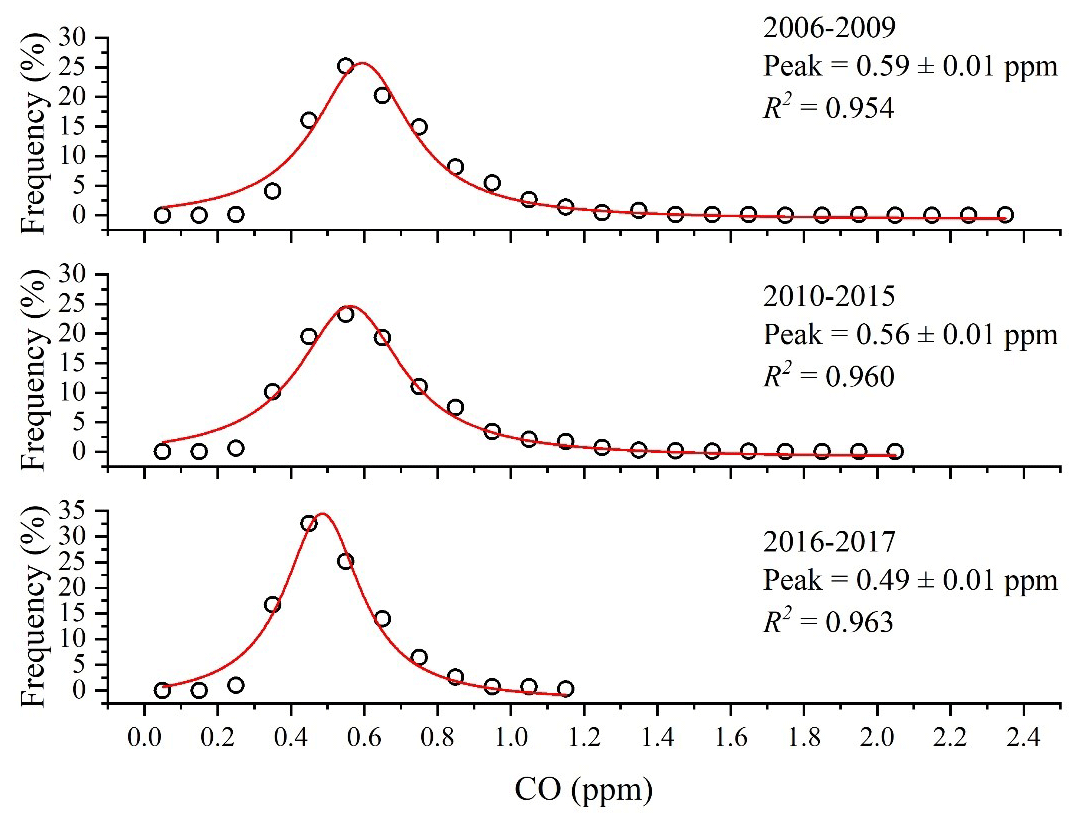
Figure 6Frequency distribution of the CO mixing ratios and Lorentz curve fitting results for different time intervals.
3.4.2 Trends of seasonal means
The time series of seasonal average levels of CO at the LAN station from 2006 to 2017 are displayed in Fig. 7. Linear trends were calculated from the seasonal data, with the standard deviation of monthly mean values being used as a weighting factor. From 2006 to 2017, the seasonal CO mixing ratios exhibited larger fluctuations; nevertheless, an overall significant (p<0.05) decreasing trend was observed in seasons except for the winter. The largest decrease (the slope of linear fitting) in the seasonal CO levels occurred in autumn (−15.7 ppb yr−1), followed by summer (−11.1 ppb yr−1), spring (−10.8 ppb yr−1), and winter (−9.7 ppb yr−1). As indicated in Table 1, the CO mixing ratios at the LAN station in the four seasons between 2016 and 2017 were lower than those between 2006 and 2015, with the largest average decrease of 0.19 ppm occurring in winter.
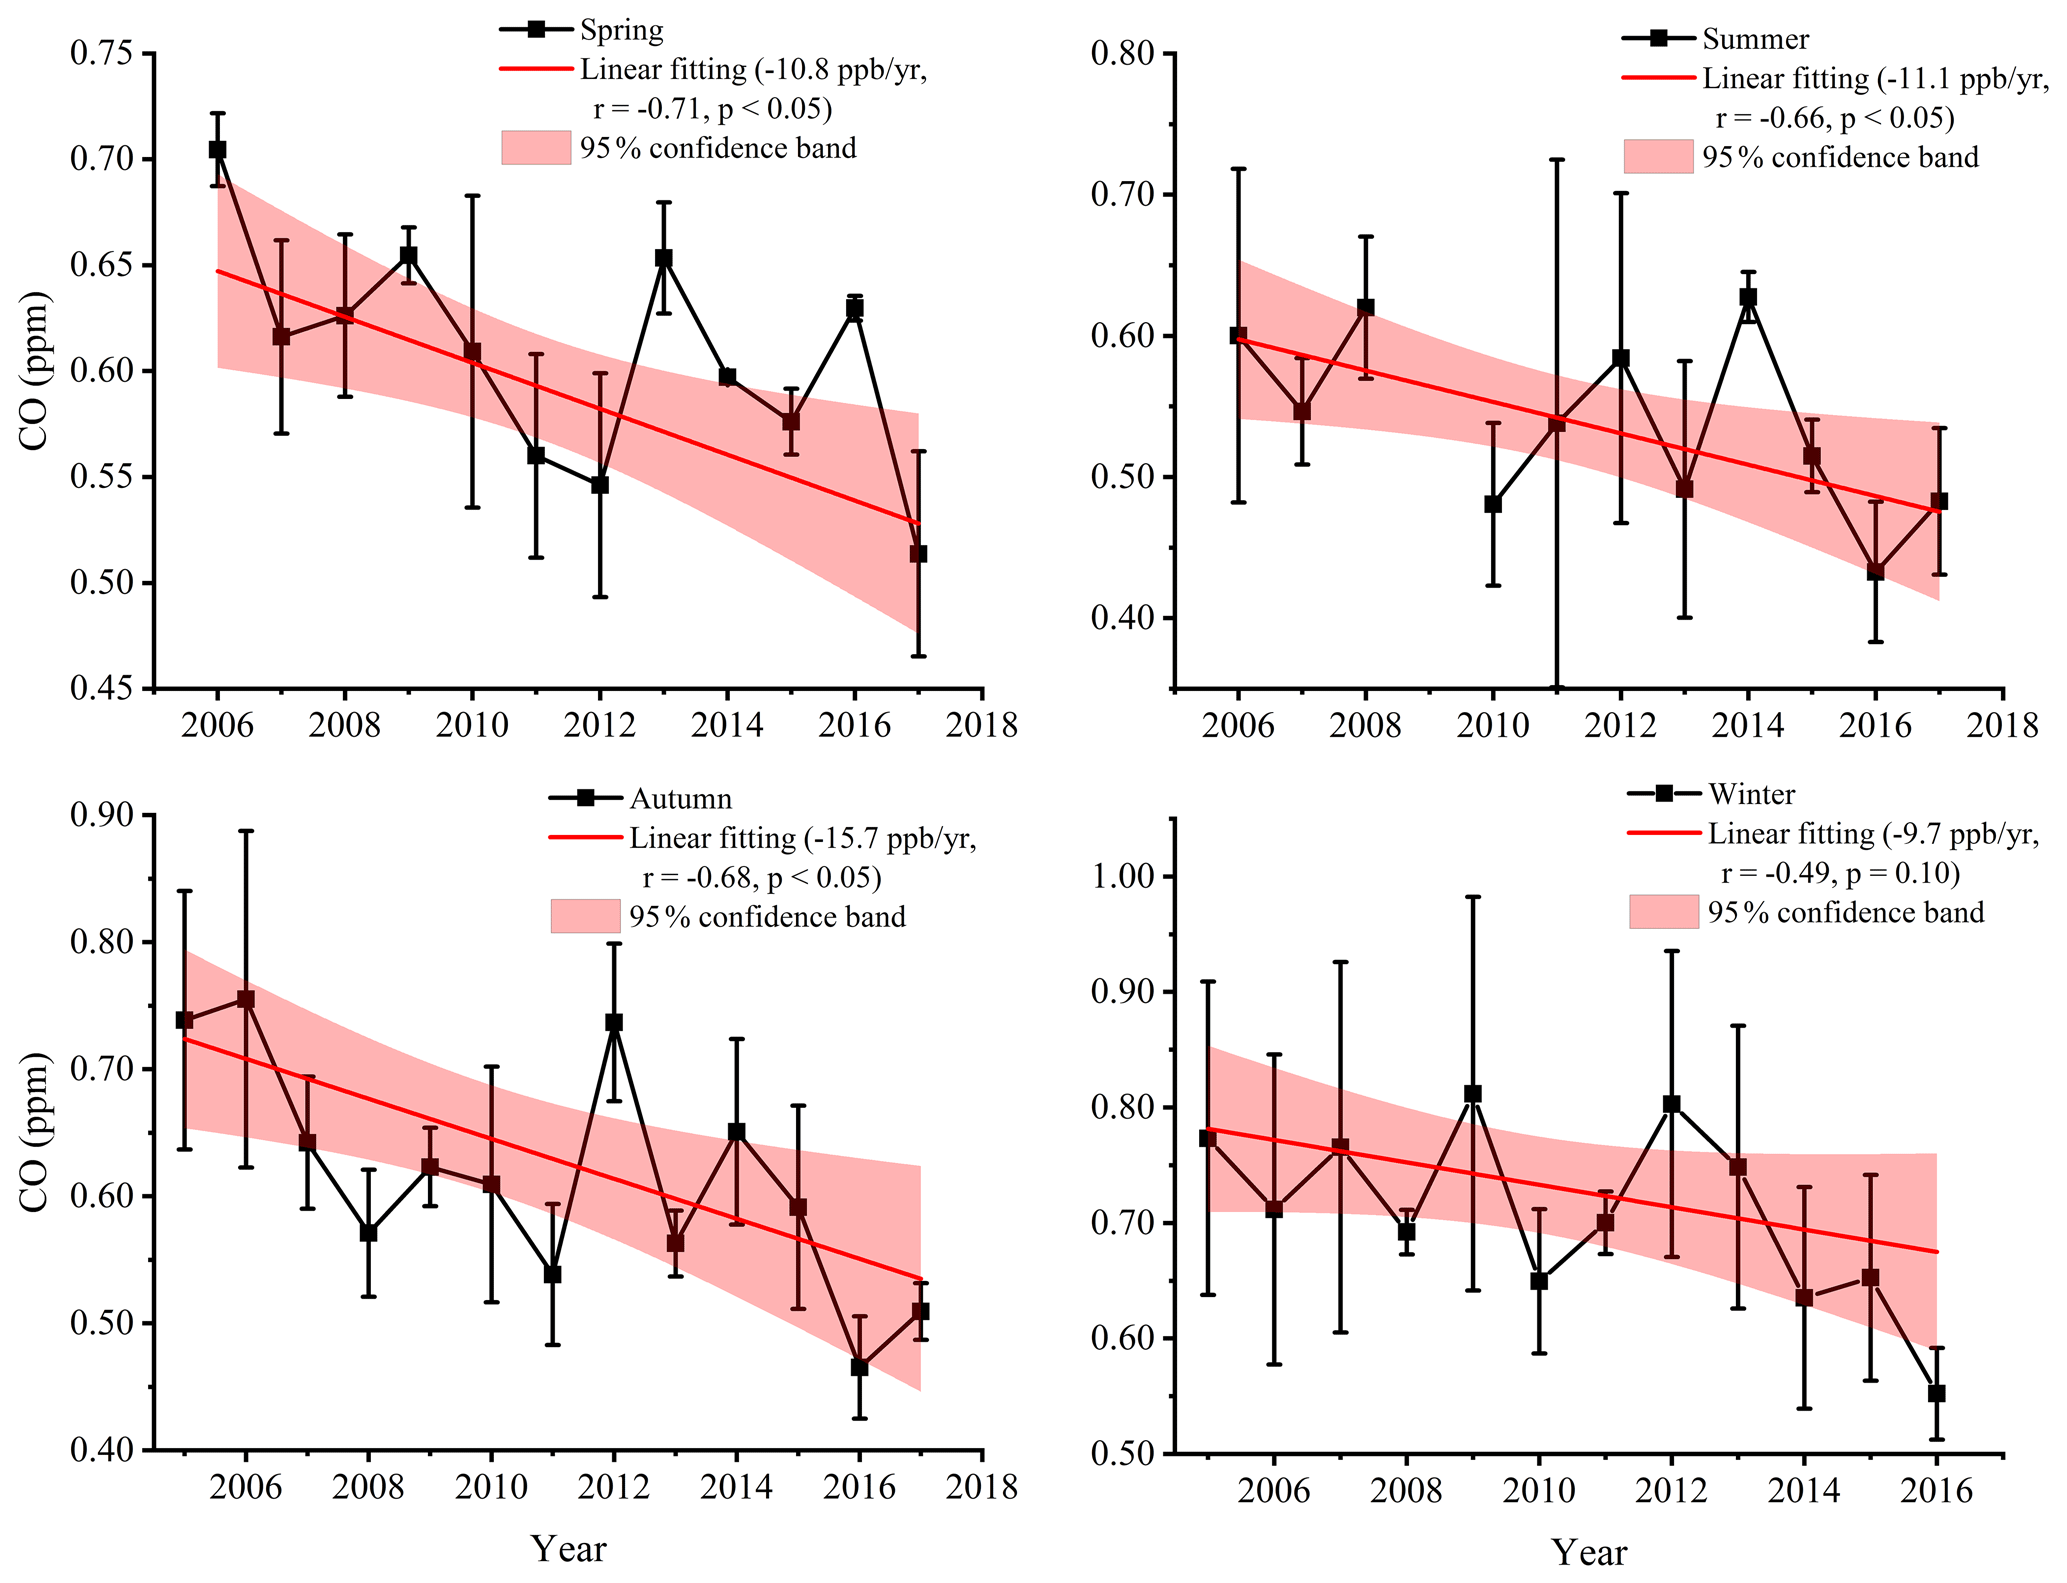
Figure 7Seasonal time series and linear fitting of CO mixing ratios at the LAN station (spring: March to May, summer: June to August, autumn: September to November, and winter: December to February).
3.4.3 Trends of CO levels under clean and polluted conditions
In the annual statistics, the 95th and 5th percentiles of the CO mixing ratios can be viewed as the CO levels in the most polluted and clean (background) air masses, respectively. Here, we use these two quantities to study CO trends under polluted and clean conditions, respectively, at the LAN station. As illustrated in Fig. 8a, the CO concentration under the polluted conditions experienced a significant decreasing trend of −22.4 ppb yr−1 (, p<0.05) from 2006 (0.91 ppm) to 2017 (0.58 ppm), and under the clean condition it descended as well but not statistically significantly (, p=0.19) throughout the years. This suggests that the CO levels in pollution plumes, which are highly impacted by anthropogenic emissions in the YRD region, have been reduced greatly, and the background levels of CO at the LAN station showed a decreasing trend at the same time. Figure 8b shows the average CO concentrations from prevailing (N, NNE, NE, S, SSW, and SW) and other wind directions. As can be seen in Fig. 8b, the annual CO levels from different wind directions generally presented similar patterns, and all of them exhibited a significant (p<0.01) downward trend, suggesting that the CO concentrations in the provinces and cities surrounding the LAN station have all decreased.
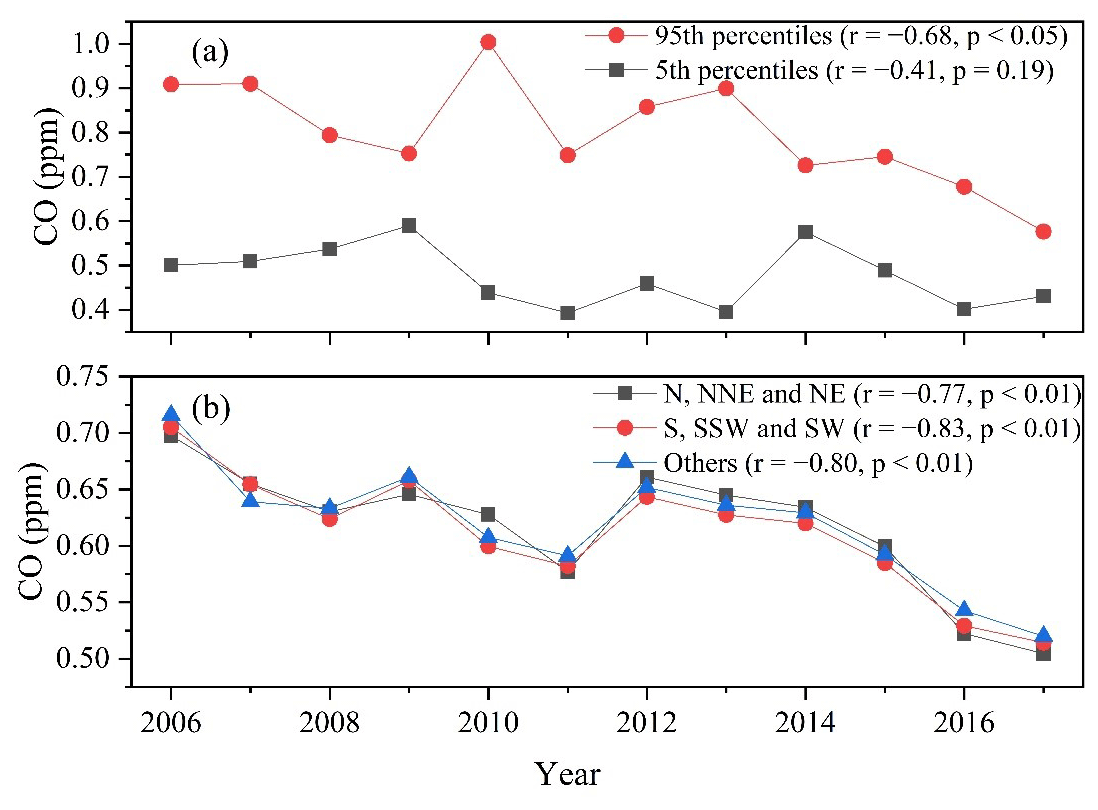
Figure 8Trends of CO mixing ratios at the 95th and 5th percentiles and from different wind directions.
3.5 Causes and implications of the long-term variations
3.5.1 Impacts of Shanghai Expo and G20 in Hangzhou
During the Shanghai Expo in 2010 (from 1 May to 31 October) and Hangzhou G20 in 2016 (from 24 July to 6 September), the Chinese government implemented a series of joint pollution control measures in the cities of the YRD region to ensure good air quality during these mega-events. A satellite-based study (Hao et al., 2011) reported that a 12 % reduction of CO concentration was observed over Shanghai city during the Expo compared to the past 3 years. Zhao et al. (2017) found that the ground CO levels in Hangzhou city decreased by 56 % during G20 as opposed to those in 2015. In order to further evaluate the effect of these control strategies, we compared the annual trends of CO concentrations at the LAN station during the same period as the Shanghai Expo and Hangzhou G20, which are shown in Fig. 9a and b, respectively. The concentration of CO at the LAN station was 0.54 ppm during the Expo and 0.41 ppm during the G20, and the values were lower than those observed in Shanghai city (0.86 ppm) and Hangzhou city (0.53 ppm) in the same period. Sharp decreases (reductions of 18 % during the Expo in 2010 and 35 % during the G20 in 2016) of the CO mixing ratios were observed at the LAN station compared to those during the same periods in the previous years. Since the meteorological conditions (the average values and standard deviations of temperature, air pressure, wind speed, relative humidity, and the wind direction frequency; see Table S1 and Fig. S3) between the Shanghai Expo and Hangzhou G20 and the same periods in the previous year were quite close, the results indicated that the pollution control measures worked well to reduce atmospheric CO concentrations in the YRD region.
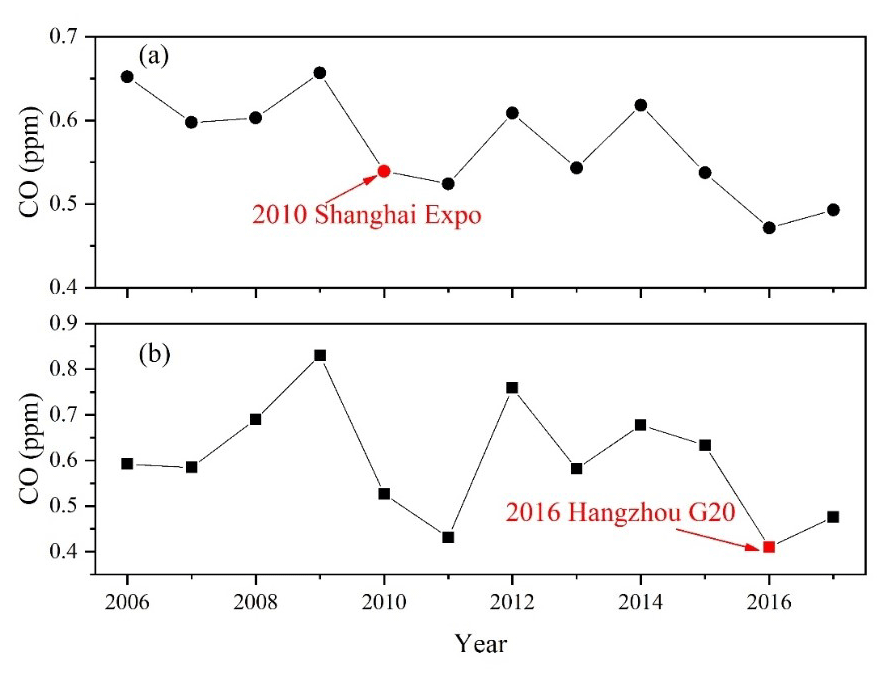
Figure 9Average CO levels for the periods corresponding to (a) the 2010 Shanghai Expo (from 1 May to 31 October) and (b) 2016 Hangzhou G20 (from 24 July to 6 September).
3.5.2 Relationships with meteorological conditions
Atmospheric CO mixing ratios are not only affected by local emission sources and the mixing ratios of atmospheric OH radicals but also by meteorological conditions. Temperature, WS, WD, and other meteorological conditions directly affect atmospheric stability and photochemical reaction intensity, which influence the diffusion, generation, consumption, and lifetime of atmospheric CO (Seinfeld and Pandis, 2006). Meteorological conditions varied across the years of our study period. Such variations affected the comparison of the atmospheric CO mixing ratios between different time intervals, especially when analyzing or evaluating the effectiveness of pollution control policies. To minimize the effects of meteorological conditions on the analysis results, we took temperature, WS, and WD as classification variables and analyzed the variation in the CO mixing ratios under similar meteorological conditions during the three periods. The results are displayed in Fig. 10.
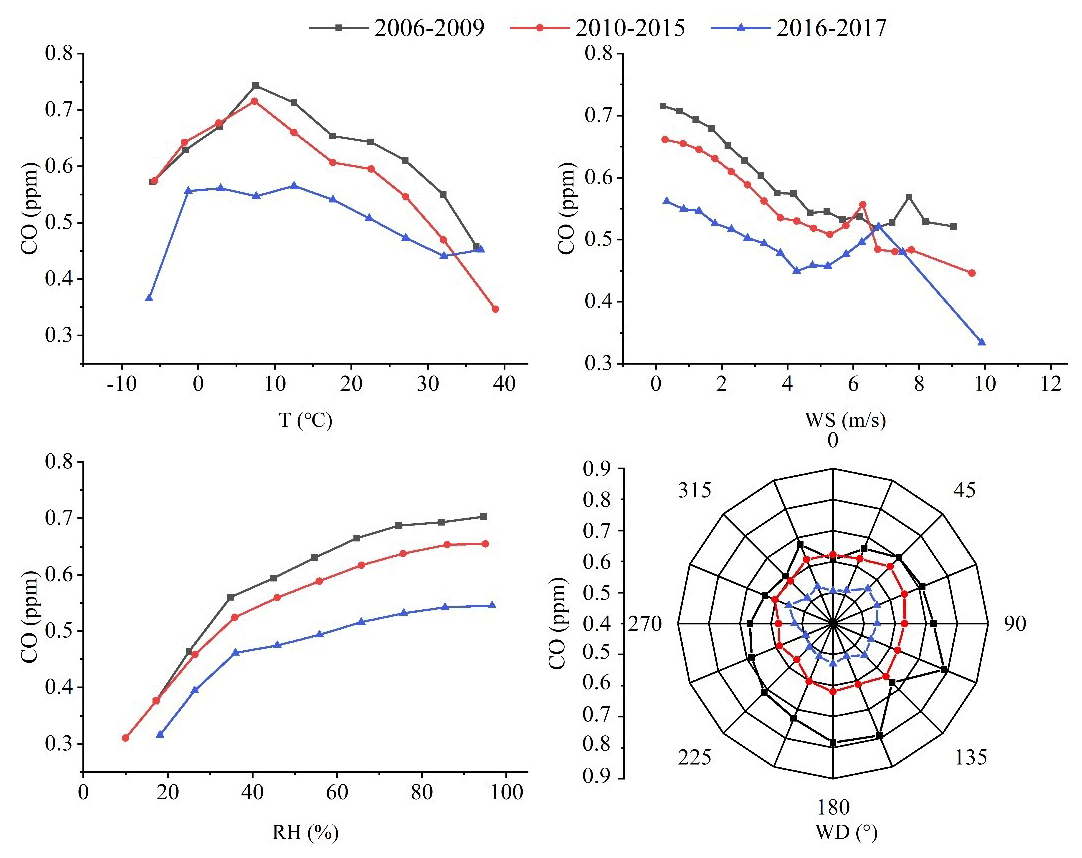
Figure 10Variations in CO mixing ratios in different periods with respect to temperature (T), wind speed (WS), relative humidity (RH), and wind direction (WD). The intervals are 5∘, 0.5 m/s, 10 %, and 22.5∘ for T, WS, RH, and WD, respectively.
As displayed in Fig. 10a, the plot of the CO mixing ratios versus the temperature showed a convex shape, with relatively low concentrations occurring at both high and low temperatures. Generally, because the photochemical reaction of CO intensifies at extremely high temperatures, and strong winds occur at extremely low temperatures, both high temperatures and strong winds can cause low CO mixing ratios. The decrease in the CO mixing ratios in a relatively high-temperature range during 2016–2017 was lower than the corresponding decreases in previous years. This result might be attributable to the summertime increase in energy consumption from the widespread use of air conditioners in China. Compared with 2006–2015, the stable area with high CO mixing ratios started to appear at lower temperatures during 2016–2017, which reflected the effectiveness of pollution control measures on the large emission sources. As displayed in Fig. 10b, as the WS increased within a given range, the CO mixing ratios gradually decreased because of the strengthened diffusion and dilution of the atmosphere. When WS increased to a given level, where this level differed between the time intervals and continually decreased overtime, the CO mixing ratios increased with WS. This may be attributable to the pollution sources being increasingly close to the LAN station because of increased urbanization over time. At a WS of 6–7 m/s, the CO mixing ratios in the different time intervals tended to be consistent. As the WS continued to increase to approximately 8 m/s, the atmospheric CO mixing ratios significantly decreased with the WS. As displayed in Fig. 10c, the CO mixing ratios correlated positively with RH, which is consistent with the results reported by Turkoglu et al. (2004) and Ye et al. (2008). The main sink of CO is the oxidation reaction with OH radicals (Seinfeld and Pandis, 2006). Because water vapor is a precursor of clouds, at higher levels of RH, the atmosphere is more likely to be oversaturated with water and form clouds. Furthermore, because clouds can reflect sunlight and reduce the ultraviolet radiation reaching the ground, the photochemical reaction between CO and OH radicals is weakened (Ye et al., 2008). Figure 10d displayed the change in CO mixing ratios with respect to WD. The figure indicates that CO levels were the highest in the south sector of the LAN station.
Table 2 summarized the average percentage decrease in the CO mixing ratios during 2010–2015 and 2016–2017 relative to CO mixing ratios in the previous time intervals under the same meteorological conditions (temperature, WS, RH, and WD). As indicated in Fig. 10 and Table 2, the CO mixing ratios during 2016–2017 were generally lower than those during 2006–2009 and 2010–2015. Therefore, the meteorology was not the main factor contributing to the descending trend of CO.
Table 2Comparison of the average percentage decline in CO mixing ratios during 2010–2015 and 2016–2017 relative to CO mixing ratios in previous time intervals under the same meteorological factors.

a Compared with 2006–2009. b Compared with 2010–2015.
3.5.3 Changes in emissions in neighboring provinces
China has implemented a comprehensive energy conservation and emission reduction policy since 2006 (Zhao et al., 2008; Lei et al., 2011). Small and old factories and boilers have been gradually replaced by larger and more energy-efficient alternatives. Although the focus of these measures was to control sulfur dioxide emissions, these measures also greatly improved combustion efficiency and thus decreased CO emissions (Zhao et al., 2012). Figure 11 displays the change in the CO emissions in six provinces and cities around the LAN station from 2006 to 2017. The emission data were obtained from the Multiresolution Emission Inventory for China (Li et al., 2017). As indicated in Fig. 11, the average annual CO emissions of the provinces and cities surrounding the LAN station declined significantly (, p<0.01), with an average decline of 170 000 t yr−1. The percentages of CO emission decreased during 2016–2017 in Shanghai city, and in Jiangsu, Zhejiang, Anhui, Fujian, and Jiangxi provinces the percentages were −59.3 %, −25.5 %, −18.6 %, −27.2 %, −40.1 %, and −19.3 %, respectively, relative to CO emission values during 2006–2009.
There was a strong positive correlation (r=0.83, p<0.01) between the annual mean CO concentrations and the anthropogenic emissions of CO in the neighboring provinces. Also, compared with the base year of 2006, the CO concentration in 2017 declined by 18.7 %, which is close to the decline value of 31.3 % for the average anthropogenic emissions of CO in the neighboring provinces. The decreasing percentage of the CO concentrations and the emissions was overall consistent when considering larger uncertainty existing in emission. Therefore, the declined trend of CO at the LAN station might be mainly attributed to the decrease in anthropogenic emissions in the YRD region.
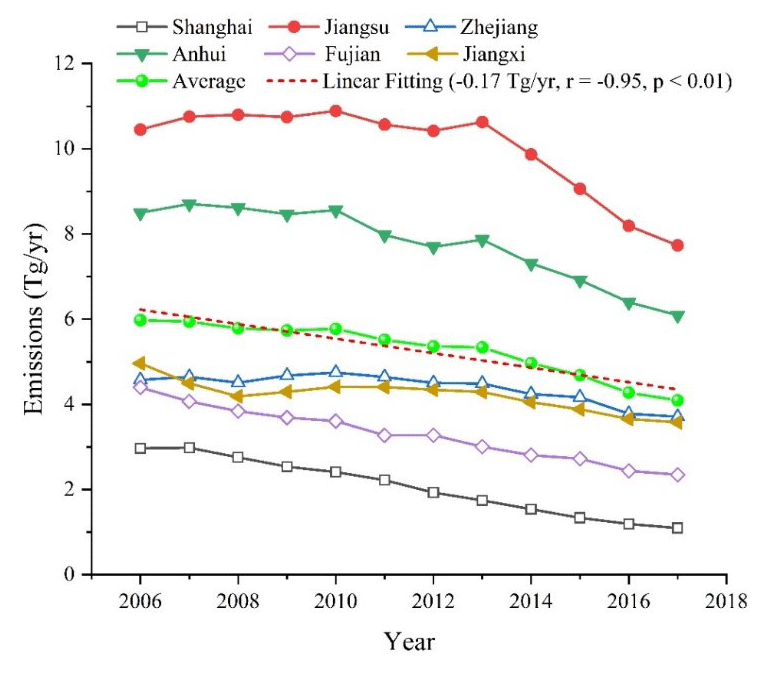
Figure 11CO emissions from 2006 to 2017 in the provinces and cities surrounding LAN station and linear fitting of the average annual CO emissions of the six provinces and cities. Data source: http://meicmodel.org/dataset-mix.html (last access: 1 October 2020).
3.5.4 Implications on regional atmospheric chemistry
The tropospheric CO has been measured on a global scale from the Measurements Of Pollution In The Troposphere (MOPITT) instrument on the spacecraft since 2000 (Deeter et al., 2017). Monthly CO mixing ratios at the surface layer and the CO total column concentrations over the YRD region from 2006 to 2017 were retrieved from MOPITT (MOPITT Algorithm Development Team, 2018; http://www.satdatafresh.com/CO_MOPITT.html, last access: 1 October 2020). We found significant correlations (p<0.05) between surface CO and MOPITT CO (r=0.75 and 0.61 for the MOPITT CO mixing ratio and total column, respectively) data (see Fig. S4), which indicate the good regional representativeness of Lin'an measurements. From 2006 to 2017, the average CO mixing ratio from MOPITT over the YRD region (22.5–39.5∘ N, 112.5–123.5∘ E) in 2006 (0.11 ± 0.02 ppm) was higher than that in 2017 (0.10 ± 0.02 ppm), with a significant declining trend of −0.5 ppb yr−1 (, p<0.01). As for the average CO total column, the value in 2006 (1.91 × 10¹⁸ ± 0.23 × 10¹⁸ molecules/cm2) was also higher than that in 2017 (1.76 × 10¹⁸ ± 0.21 × 10¹⁸ molecules/cm2), with a significant declining trend of molecules/(cm2⋅ yr) (, p<0.05) from 2006 to 2017. They are consistent with the negative trends of the ground CO levels measured in the sites of the WDCGG network (Table 1) and at the LAN station. Although negative trends in both surface and MOPITT CO data were found, their relative decline percent was different. Compared with the base year of 2006, the surface CO declined by 1.6 % annually and MOPITT CO declined by 0.4 % (in mixing ratio) and 0.6 % (in total column), respectively.
The major sink for CO is reaction with OH radical (Seinfeld and Pandis, 2006), so a decrease in the CO concentrations may lead to an increase in the lifetime of OH radical and thus affect the atmospheric OH photochemistry (i.e., ozone production). The lifetime of OH is defined as the inverse of the OH reactivity (i.e., OH loss rates), and the total OH reactivity is calculated by summing over all the products of the OH reactant (CO, volatile organic compounds, nitrogen oxides, etc.) concentrations times their respective rate coefficients with OH (kOH) (Kovacs and Brune, 2001; Di Carlo et al., 2004). The lowest average total OH reactivity (5–6 s−1) was observed in the rural areas around the world (Ren et al., 2005; Ingham et al., 2009). The kOH of CO is 350/(ppm ⋅ min) at the standard temperature of 298 K (Vukovich, 2000), and CO generally contributed 10 %–20 % to the total OH reactivity at the rural sites of China (Lou et al., 2010). From 2006 to 2017, the average OH reactivity of CO at the LAN station exhibited a significant downward trend of −0.07 s−1 yr−1 (, p<0.01) and the average monthly OH reactivity of CO dropped from 4.1 ± 0.7 s−1 in 2006 to 3.0 ± 0.3 s−1 in 2017.
The average annual levels of CO at the LAN station during 2006–2009, 2010–2015, and 2016–2017 were 0.66 ± 0.03 ppm, 0.62 ± 0.03 ppm, and 0.52 ± 0.01 ppm, respectively. From a seasonal perspective, the highest seasonal average CO mixing ratio occurred in winter (0.69 ± 0.08 ppm), followed by spring (0.61 ± 0.05 ppm), autumn (0.61 ± 0.09 ppm), and summer (0.54 ± 0.06 ppm). The average daily variations in the CO concentration exhibited a double-peaked pattern, with high CO concentrations in the morning and evening and low CO concentrations in the afternoon. Such diurnal variations suggest that the CO mixing ratios at the LAN station were affected by traffic pollutant emissions in its surrounding area.
The average annual atmospheric CO mixing ratios at the LAN station exhibited a significant decreasing trend (−11.3 ppb yr−1, p<0.01) from 2006 to 2017, which was consistent with the negative trends of the average CO mixing ratios and total column retrieved from MOPITT over the YRD region. The measurements at the LAN station reflected regional changes in atmospheric background CO mixing ratios in the YRD region well. The largest decrease in the CO level was observed in autumn (−15.7 ppb yr−1), followed by summer (−11.1 ppb yr−1), spring (−10.8 ppb yr−1), and winter (−9.7 ppb yr−1). The significant downward trend of the CO mixing ratios at the LAN station was not caused by meteorological conditions but by strengthened pollution control measures, which indicated that the adopted measures were effective. In spite of the nearly a quarter of reduction during 2006–2017, the CO levels at the LAN station were still much higher than those at other regional atmospheric background stations around the world so that further reductions in CO emissions in the YRD region are needed. The significant decrease in regional CO level has an implication for atmospheric chemistry, considering the role of CO in OH reactivity. From 2006 to 2017, the average OH reactivity of CO at the LAN station exhibited a significant downward trend of −0.07 s−1 yr−1 (, p<0.01) and dropped from 4.1 ± 0.7 s−1 in 2006 to 3.0 ± 0.3 s−1 in 2017.
Our measurement data are deposited to an accessible repository. The data sources of number of fire emissions (https://www.geo.vu.nl/~gwerf/GFED/GFED4) (van der Werf et al., 2017), the annual CO emissions (http://meicmodel.org/dataset-mix.html) (Li et al., 2017), and the CO concentrations retrieved from MOPITT (http://www.satdatafresh.com/CO_MOPITT.html) (MOPITT Algorithm Development Team, 2018) results over the YRD region are all listed in the reference, and the CO concentrations and the meteorological data at the LAN station can be inquired about by contacting the corresponding author.
The supplement related to this article is available online at: https://doi.org/10.5194/acp-20-15969-2020-supplement.
YC, WL, and XX developed the idea for this paper and formulated the research goals. QM and JY carried out the CO field observations at the LAN station. WG provided the CO data in Shanghai. YC and WL wrote and revised the manuscript with contributions from all co-authors.
The authors declare that they have no conflict of interest.
This study was funded by the National Key R&D Program of China (2016YFC0201900), National Natural Science Foundation of China (91744206), and Beijing Science and Technology program (Z181100005418016). We thank the personnel on duty at the LAN station for their assistance. A previous version of this paper was edited by Wallace Academic Editing.
This research has been supported by the National Key R&D Program of China (grant no. 2016YFC0201900), the National Natural Science Foundation of China (grant no. 91744206), and the Beijing Science and Technology program (grant no. Z181100005418016).
This paper was edited by Steven Brown and reviewed by two anonymous referees.
Ahmed, E., Kim, K. H., Jeon, E. C., and Brown, R. J. C.: Long term trends of methane, non methane hydrocarbons, and carbon monoxide in urban atmosphere, Sci. Total Environ., 518, 595–604, https://doi.org/10.1016/j.scitotenv.2015.02.058, 2015.
Andreae, M. O. and Merlet, P.: Emission of trace gases and aerosols from biomass burning, Global Biogeochem. Cy., 15, 955–966, https://doi.org/10.1029/2000GB001382, 2001.
Bakwin, P. S., Tans, P. P., and Novelli, P. C.: Carbon monoxide budget in the northern hemisphere, Geophys. Res. Lett., 21, 433–436, https://doi.org/10.1029/94GL00006, 1994.
Cohen, Y., Petetin, H., Thouret, V., Marécal, V., Josse, B., Clark, H., Sauvage, B., Fontaine, A., Athier, G., Blot, R., Boulanger, D., Cousin, J.-M., and Nédélec, P.: Climatology and long-term evolution of ozone and carbon monoxide in the upper troposphere–lower stratosphere (UTLS) at northern midlatitudes, as seen by IAGOS from 1995 to 2013, Atmos. Chem. Phys., 18, 5415–5453, https://doi.org/10.5194/acp-18-5415-2018, 2018.
Crutzen, P. J., Heidt, L. E., Krasnec, J. P., Pollock, W. H., and Seiler, W.: Biomass burning as a source of atmospheric gases CO, H2, N2O, NO, CH3Cl and COS, Nature, 282, 253–256, https://doi.org/10.1038/282253a0, 1979.
Daniel, J. S. and Solomon, S.: On the climate forcing of carbon monoxide, J. Geophys. Res.-Atmos., 103, 13249–13260, https://doi.org/10.1029/98JD00822, 1998.
Deeter, M. N., Edwards, D. P., Francis, G. L., Gille, J. C., Martínez-Alonso, S., Worden, H. M., and Sweeney, C.: A climate-scale satellite record for carbon monoxide: the MOPITT Version 7 product, Atmos. Meas. Tech., 10, 2533–2555, https://doi.org/10.5194/amt-10-2533-2017, 2017.
Demerjian, K. L., Kerr, J. A., and Calvert, J. G.: The Predicted Effect of Carbon Monoxide on the Ozone Levels in Photochemical Smog Systems, Environ. Lett., 3, 73–80, https://doi.org/10.1080/00139307209435456, 1972.
Di Carlo, P., Brune, W. H., Martinez, M., Harder, H., Lesher, R., Ren, X., Thornberry, T., Carroll, M. A., Young, V., Shepson, P. B., Riemer, D., Apel, E., and Campbell, C.: Missing OH Reactivity in a Forest: Evidence for Unknown Reactive Biogenic VOCs, Science, 304, 722–725, https://doi.org/10.1126/science.1094392, 2004.
Fang, S., Zhou, L., Luan, T., Ma, Q., and Wang, H.: Distribution of CO at Lin'an Station in Zhejiang Province, Environm. Sci., 35, 2454–2459, 2014.
Gao, W., Tie, X., Xu, J., Huang, R., Mao, X., Zhou, G., and Chang, L.: Long-term trend of O3 in a mega City (Shanghai), China: Characteristics, causes, and interactions with precursors, Sci. Total Environ., 603–604, 425–433, https://doi.org/10.1016/j.scitotenv.2017.06.099, 2017.
Global Atmosphere Watch Programme/The World Data Centre for Greenhouse Gases (WDCGG): CO concentrations at the regional atmospheric background stations, available at: https://gaw.kishou.go.jp/, last access: 1 October 2020.
Hao, N., Valks, P., Loyola, D., Cheng, Y. F., and Zimmer, W.: Space-based measurements of air quality during the World Expo 2010 in Shanghai, Environ. Res. Lett., 6, 044004, https://doi.org/10.1088/1748-9326/6/4/044004, 2011.
Holloway, T., Levy II, H., and Kasibhatla, P.: Global distribution of carbon monoxide, J. Geophys. Res.-Atmos., 105, 12123–12147, https://doi.org/10.1029/1999JD901173, 2000.
Huang, X., Wang, T., Zhuang, B., Li, S., Xie, M., Han,Y., Yang, X., Sun, J., Ding, A., and Fu, Z.: Observation and analysis of urban upper atmospheric carbon monoxide in Nanjing, China Environmental Science, 33, 1577–1584, 2013a.
Huang, Y., Wei, H., Duan, Y., and Zhang, Y.: Ambient Air Quality Status and Reason Analysis of Shanghai World Expo, Environmental Monitoring in China, 29, 5–63, https://doi.org/10.19316/j.issn.1002-6002.2013.05.012, 2013b.
Ingham, T., Goddard, A., Whalley, L. K., Furneaux, K. L., Edwards, P. M., Seal, C. P., Self, D. E., Johnson, G. P., Read, K. A., Lee, J. D., and Heard, D. E.: A flow-tube based laser-induced fluorescence instrument to measure OH reactivity in the troposphere, Atmos. Meas. Tech., 2, 465–477, https://doi.org/10.5194/amt-2-465-2009, 2009.
Khalil, M. A. K. and Rasmussen, R. A.: The global cycle of carbon monoxide: Trends and mass balance, Chemosphere, 20, 227–242, https://doi.org/10.1016/0045-6535(90)90098-E, 1990.
Kovacs, T. and Brune, W.: Total OH Loss Rate Measurement, J. Atmos. Chem., 39, 105–122, https://doi.org/10.1023/A:1010614113786, 2001.
Lei, Y., Zhang, Q., Nielsen, C., and He, K.: An inventory of primary air pollutants and CO2 emissions from cement production in China, 1990–2020, Atmos. Environ., 45, 147–154, https://doi.org/10.1016/j.atmosenv.2010.09.034, 2011.
Li, M., Zhang, Q., Kurokawa, J.-I., Woo, J.-H., He, K., Lu, Z., Ohara, T., Song, Y., Streets, D. G., Carmichael, G. R., Cheng, Y., Hong, C., Huo, H., Jiang, X., Kang, S., Liu, F., Su, H., and Zheng, B.: MIX: a mosaic Asian anthropogenic emission inventory under the international collaboration framework of the MICS-Asia and HTAP, Atmos. Chem. Phys., 17, 935–963, https://doi.org/10.5194/acp-17-935-2017, 2017 (data available at: http://meicmodel.org/dataset-mix.html, last access: 1 October 2020).
Lin, H., Wang, Y., Hu, B., Zhu, R., and Wang, Y.: Observation and research on carbon monoxide in the atmosphere of Beijing during the summertime of 2007, Environmental Chemistry, 28, 567–570, 2009.
Lin, W., Xu, X., Yu, D., Dai, X., Zhang, Z., Meng, Z., and Wang, Y.: Quality Control for Reactive Gases Observation at Longfengshan Regional Atmospheric Background Monitoring Station, Meteorological Monthly, 35, 93–100, 2009.
Lin, W., Xu, X., and Zhang, X.: The errors in the claimed concentrations of standard gases used in the observation of reactive gases and recommended solutions, Environ. Chem., 30, 1–4, 2011a.
Lin, W., Xu, X., Sun, J., Liu, X., and Wang, Y.: Study of the background concentrations of reactive gases at Jinsha regional atmospheric background station and the impacts of long-range transport, Sci. China Earth Sci., 54, 1604–1613, https://doi.org/10.3724/SP.J.1146.2006.01085, 2011b.
Liu, S., Fang, S., Liang, M., Sun, W., and Feng, Z.: Temporal patterns and source regions of atmospheric carbon monoxide at two background stations in China, Atmos. Res., 220, 169–180, https://doi.org/10.1016/j.atmosres.2019.01.017, 2019.
Lou, S., Holland, F., Rohrer, F., Lu, K., Bohn, B., Brauers, T., Chang, C. C., Fuchs, H., Häseler, R., Kita, K., Kondo, Y., Li, X., Shao, M., Zeng, L., Wahner, A., Zhang, Y., Wang, W., and Hofzumahaus, A.: Atmospheric OH reactivities in the Pearl River Delta – China in summer 2006: measurement and model results, Atmos. Chem. Phys., 10, 11243–11260, https://doi.org/10.5194/acp-10-11243-2010, 2010.
Meng, Z. Y., Xu, X. B., Yan, P., Ding, G. A., Tang, J., Lin, W. L., Xu, X. D., and Wang, S. F.: Characteristics of trace gaseous pollutants at a regional background station in Northern China, Atmos. Chem. Phys., 9, 927–936, https://doi.org/10.5194/acp-9-927-2009, 2009.
MOPITT Algorithm Development Team: MOPITT (Measurements of Pollution in the Troposphere) Version 8 Product User's Guide, available at: http://www.satdatafresh.com/CO_MOPITT.html (last access: 1 October 2020), 2018.
Novelli, P., Steele, L., and Tans, P.: Mixing Ratios of Carbon Monoxide in the Troposphere, J. Geophys. Res., 97, 20731–20750, https://doi.org/10.1029/92JD02010, 1992.
Novelli, P., Masarie, K. A., and Lang, P.: Distributions and recent changes of carbon monoxide in the lower troposphere, J. Geophys. Res., 103, 19015–19033, https://doi.org/10.1029/98JD01366, 1998.
Petrenko, V. V., Martinerie, P., Novelli, P., Etheridge, D. M., Levin, I., Wang, Z., Blunier, T., Chappellaz, J., Kaiser, J., Lang, P., Steele, L. P., Hammer, S., Mak, J., Langenfelds, R. L., Schwander, J., Severinghaus, J. P., Witrant, E., Petron, G., Battle, M. O., Forster, G., Sturges, W. T., Lamarque, J.-F., Steffen, K., and White, J. W. C.: A 60 yr record of atmospheric carbon monoxide reconstructed from Greenland firn air, Atmos. Chem. Phys., 13, 7567–7585, https://doi.org/10.5194/acp-13-7567-2013, 2013.
Qi, H., Lin, W., Xu, X., Yu, X., and Ma, Q.: Significant downward trend of SO2 observed from 2005 to 2010 at a background station in the Yangtze Delta region, China, Science China Chemistry, 55, 1451–1458, https://doi.org/10.1007/s11426-012-4524-y, 2012.
Ren, X., Brune, W. H., Cantrell, C. A., Edwards, G. D., Shirley, T., Metcalf, A. R., and Lesher, R. L.: Hydroxyl and Peroxy Radical Chemistry in a Rural Area of Central Pennsylvania: Observations and Model Comparisons, J. Atmos. Chem., 52, 231–257, https://doi.org/10.1007/s10874-005-3651-7, 2005.
Seinfeld, J. H. and Pandis, S. N. (Eds.): Atmospheric chemistry and physics : from air pollution to climate change, 2nd ed, A Wiley-Interscience publication, Hoboken, New Jersey, USA, 2006.
State Council of the People's Republic of China: Action plan for the prevention and control of air pollution of the People's Republic of China, available at: http://www.gov.cn/zhengce/content/2013-09/13/content_4561.htm (last access: 25 October 2020), 2013.
Thompson, A. M.: The Oxidizing Capacity of the Earth' s Atmosphere: Probable Past and Future Changes, Science, 256, 1157–1165, https://doi.org/10.1126/science.256.5060.1157, 1992.
Thompson, A. M. and Cicerone, R. J.: Possible perturbations to atmospheric CO, CH4, and OH, J. Geophys. Res.-Atmos., 91, 10853–10864, https://doi.org/10.1029/JD091iD10p10853, 1986.
Türkoğlu, N., Çiçek, İ, and Gürgen, G.: Analysis of effects of meteorological factors on air pollutant concentrations in Ankara, Turkey, Il Nuovo Cimento C, 27, 347–358, https://doi.org/10.1393/ncc/i2004-10032-0, 2004.
van der Werf, G. R., Randerson, J. T., Giglio, L., van Leeuwen, T. T., Chen, Y., Rogers, B. M., Mu, M., van Marle, M. J. E., Morton, D. C., Collatz, G. J., Yokelson, R. J., and Kasibhatla, P. S.: Global fire emissions estimates during 1997–2016, Earth Syst. Sci. Data, 9, 697–720, https://doi.org/10.5194/essd-9-697-2017, 2017 (data available at: https://www.geo.vu.nl/~gwerf/GFED/GFED4/, last access: 1 October 2020).
Vukovich, F.: Weekday/Weekend Differences in OH Reactivity with VOCs and CO in Baltimore, Maryland, J. Air Waste Manage., 50, 1843–1851, https://doi.org/10.1080/10473289.2000.10464205, 2000.
Wang, P., Elansky, N. F., Timofeev, Y. M., Wang, G., Golitsyn, G. S., Makarova, M. V., Rakitin, V. S., Shtabkin, Y., Skorokhod, A. I., Grechko, E. I., Fokeeva, E. V., Safronov, A. N., Ran, L., and Wang, T.: Long-Term Trends of Carbon Monoxide Total Columnar Amount in Urban Areas and Background Regions: Ground- and Satellite-based Spectroscopic Measurements, Adv. Atmos. Sci., 35, 785–795, https://doi.org/10.1007/s00376-017-6327-8, 2018.
Worden, H. M., Deeter, M. N., Frankenberg, C., George, M., Nichitiu, F., Worden, J., Aben, I., Bowman, K. W., Clerbaux, C., Coheur, P. F., de Laat, A. T. J., Detweiler, R., Drummond, J. R., Edwards, D. P., Gille, J. C., Hurtmans, D., Luo, M., Martínez-Alonso, S., Massie, S., Pfister, G., and Warner, J. X.: Decadal record of satellite carbon monoxide observations, Atmos. Chem. Phys., 13, 837–850, https://doi.org/10.5194/acp-13-837-2013, 2013.
Wu, Y., Xu, H., and Yu, D.: Characteristics of CO concentrations at the Longfengshan regional background station, Environ. Chem., 27, 847–848, 2008.
Xue, M., Wang, Y., and Sun, Y.: Measurement on the Atmospheric CO Concentration in Beijing, Environm. Sci., 27, 200–206, 2006.
Ye, F., An, J., Wang, Y., and Yang, J.: Analysis of O3, NOx, CO and correlation meteorological factor at the ground layer in Beijing, Ecology and Environment, 17, 115–122, 2008.
Yurganov, L., McMillan, W., Grechko, E., and Dzhola, A.: Analysis of global and regional CO burdens measured from space between 2000 and 2009 and validated by ground-based solar tracking spectrometers, Atmos. Chem. Phys., 10, 3479–3494, https://doi.org/10.5194/acp-10-3479-2010, 2010.
Zhang, F., Zhou, L. X., Novelli, P. C., Worthy, D. E. J., Zellweger, C., Klausen, J., Ernst, M., Steinbacher, M., Cai, Y. X., Xu, L., Fang, S. X., and Yao, B.: Evaluation of in situ measurements of atmospheric carbon monoxide at Mount Waliguan, China, Atmos. Chem. Phys., 11, 5195–5206, https://doi.org/10.5194/acp-11-5195-2011, 2011.
Zhang, G., Xu, H., Qi, B., Du, R., Gui, K., Wang, H., Jiang, W., Liang, L., and Xu, W.: Characterization of atmospheric trace gases and particulate matter in Hangzhou, China, Atmos. Chem. Phys., 18, 1705–1728, https://doi.org/10.5194/acp-18-1705-2018, 2018.
Zhao, H., Zheng, Y., Wei, L., Guan, Q., and Wang, Z.: Evolution and evaluation of air quality in Hangzhou and its surrounding area during the G20 summit, China Environmental Science, 37, 2016–2024, 2017.
Zhao, Y., Wang, S., Duan, L., Lei, Y., Cao, P., and Hao, J.: Primary air pollutant emissions of coal-fired power plants in China: Current status and future prediction, Atmos. Environ., 42, 8442–8452, https://doi.org/10.1016/j.atmosenv.2008.08.021, 2008.
Zhao, Y., Nielsen, C. P., McElroy, M. B., Zhang, L., and Zhang, J.: CO emissions in China: Uncertainties and implications of improved energy efficiency and emission control, Atmos. Environ., 49, 103–113, https://doi.org/10.1016/j.atmosenv.2011.12.015, 2012.
Zhou, L., Wen, Y., Li, J., Tang, J., and Zhang, X.: Background variation in atmospheric carbon monoxide at Mt. Waliguan, China, Acta Scientiae Circumstantiae, 24, 637–642, 2004.