the Creative Commons Attribution 4.0 License.
the Creative Commons Attribution 4.0 License.
 | 18 Dec 2020
Chemical composition and source apportionment of atmospheric aerosols on the Namibian coast
Danitza Klopper
Paola Formenti
Andreas Namwoonde
Mathieu Cazaunau
Servanne Chevaillier
Anaïs Feron
Cécile Gaimoz
Patrick Hease
Fadi Lahmidi
Cécile Mirande-Bret
Sylvain Triquet
Zirui Zeng
Stuart J. Piketh
The chemical composition of aerosols is of particular importance to assess their interactions with radiation, clouds and trace gases in the atmosphere and consequently their effects on air quality and the regional climate. In this study, we present the results of the first long-term dataset of the aerosol chemical composition at an observatory on the coast of Namibia, facing the south-eastern Atlantic Ocean. Aerosol samples in the mass fraction of particles smaller than 10 µm in aerodynamic diameter (PM10) were collected during 26 weeks between 2016 and 2017 at the ground-based Henties Bay Aerosol Observatory (HBAO; 22∘6′ S, 14∘30′ E; 30 m above mean sea level). The resulting 385 filter samples were analysed by X-ray fluorescence and ion chromatography for 24 inorganic elements and 15 water-soluble ions.
Statistical analysis by positive matrix factorisation (PMF) identified five major components, sea salt (mass concentration: 74.7±1.9 %), mineral dust (15.7±1.4 %,), ammonium neutralised (6.1±0.7 %), fugitive dust (2.6±0.2 %) and industry (0.9±0.7 %). While the contribution of sea salt aerosol was persistent, as the dominant wind direction was south-westerly and westerly from the open ocean, the occurrence of mineral dust was episodic and coincided with high wind speeds from the south-south-east and the north-north-west, along the coastline. Concentrations of heavy metals measured at HBAO were higher than reported in the literature from measurements over the open ocean. V, Cd, Pb and Nd were attributed to fugitive dust emitted from bare surfaces or mining activities. As, Zn, Cu, Ni and Sr were attributed to the combustion of heavy oils in commercial ship traffic across the Cape of Good Hope sea route, power generation, smelting and other industrial activities in the greater region. Fluoride concentrations up to 25 µg m−3 were measured, as in heavily polluted areas in China. This is surprising and a worrisome result that has profound health implications and deserves further investigation. Although no clear signature for biomass burning could be determined, the PMF ammonium-neutralised component was described by a mixture of aerosols typically emitted by biomass burning, but also by other biogenic activities. Episodic contributions with moderate correlations between NO, nss-SO (higher than 2 µg m−3) and nss-K+ were observed, further indicative of the potential for an episodic source of biomass burning.
Sea salt accounted for up to 57 % of the measured mass concentrations of SO, and the non-sea salt fraction was contributed mainly by the ammonium-neutralised component and small contributions from the mineral dust component. The marine biogenic contribution to the ammonium-neutralised component is attributed to efficient oxidation in the moist marine atmosphere of sulfur-containing gas phase emitted by marine phytoplankton in the fertile waters offshore in the Benguela Upwelling System.
The data presented in this paper provide the first ever information on the temporal variability of aerosol concentrations in the Namibian marine boundary layer. This data also provide context for intensive observations in the area.
- Article
(7714 KB) - Full-text XML
-
Supplement
(486 KB) - BibTeX
- EndNote


Atmospheric aerosol particles are emitted from both natural and anthropogenic sources. Depending on their chemical and physical characteristics, airborne aerosol particles modify the Earth's radiative budget by scattering and absorbing solar and terrestrial radiation and by altering cloud lifetime and microphysical and optical properties (Seinfeld and Pandis, 2006). The variability in their source distribution and short lifetime in the atmosphere (typically less than 10 d for particles below 1 µm in diameter and shorter for larger particles) results in an uneven horizontal and vertical spatial distribution of concentrations and physicochemical properties (Seinfeld and Pandis, 2006). As a consequence, their effects on regional atmospheric dynamics and processes are unevenly spread and constantly changing, in stark contrast to the long-lived greenhouse gases, which are well distributed around the globe (Boucher, 2015).
The Namibian coast, and more generally the south-eastern Atlantic region of southern Africa, is amongst the global areas of interest for studying aerosols and their role in Earth's climate (De Graaf et al., 2014a, b; Muhlbauer et al., 2014; Painemal et al., 2014a, b; Wilcox, 2010; Zuidema et al., 2009). Local meteorological conditions in this arid environment are sustained by the effect of cold ocean currents in the Benguela Upwelling System (BUS), one of the strongest oceanic upwelling systems in the world, with very low sea surface temperatures all year round, reaching a minimum in the austral winter (Cole and Villacastin, 2000; Nelson and Hutchings, 1983). This has a stabilising effect on the lower troposphere, resulting in the formation of a semi-permanent stratocumulus (Sc) cloud deck extending between 10 and 30∘ S and between 10∘ W and 10∘ E that tops the marine boundary layer at ∼850 hPa (Muhlbauer et al., 2014; Wood, 2015) and is of global significance for Earth's radiation budget (Klein and Hartmann, 1993; Johnson et al., 2004; Muhlbauer et al., 2014; Wood, 2015).
The region is also known for its high marine phyto- and zoo-plankton, specifically in the northern BUS (Louw et al., 2016). The marine biogenic activity results in the release of gaseous compounds containing sulfur (dimethylsulfide (DMS), SO2, H2S, …) into the atmosphere (Andreae et al., 1994), whose oxidation, particularly in this marine environment, could produce new aerosol particles contributing to the cloud droplet number concentration of the Sc clouds (Charlson et al., 1987; Andreae et al., 1995). The region is also known for the seasonal transport above the Sc of optically thick and widespread smoke layers of biomass burning aerosols emitted from forest fires in southern Africa in the austral dry season (August to October; Lindesay et al., 1996; Swap et al., 2003).
Despite their relevance, very limited research has been conducted to assess the seasonal cycle and long-term variability of the aerosol mass concentration and chemical composition in the region (Andreae et al., 1995; Annegarn et al., 1983; Dansie et al., 2017; Eltayeb et al., 1993; Formenti et al., 1999, 2003b, 2018; Zorn et al., 2008). To fill this gap, the long-term surface monitoring Henties Bay Aerosol Observatory (HBAO) was established in 2012 on the campus of the University of Namibia's Sam Nujoma Marine and Coastal Resources Research Centre (SANUMARC), along the Namibian coast (22∘ S, 14∘ E). HBAO faces the open ocean in an arid environment, far from major point sources of pollution. Episodically through the year, and seasonally between April and the end of July, the station is affected by polluted air masses containing light-absorbing aerosols, mostly from vegetation burning (Formenti et al., 2018).
In this paper, we present the results of the very first long-term measurements of aerosol elemental and water-soluble ionic composition from the analysis of filter samples in the mass fraction of particles smaller than 10 µm in aerodynamic diameter (PM10 fraction) that were collected during 26 non-consecutive sampling weeks in 2016 and 2017.
The paper looks into the temporal variability of measured elemental and water-soluble ionic concentrations and yields the first source apportionment to the PM10 loading.
The research presented in this study is also relevant to the recent intensive observational efforts that took place in Namibia in 2016 and 2017 (Zuidema et al., 2016). Specifically, it provides the long-term context to the intensive filter sampling that was conducted in Henties Bay as part of the Aerosols, RadiatiOn and CLOuds in southern Africa (AEROCLO-sA) project (Formenti et al., 2019).
The HBAO station of Henties Bay, Namibia (22.09∘ S, 14.26∘ E; 30 m above mean sea level, a m.s.l., http://www.hbao.cnrs.fr/, last access: 22 September 2020), is situated 100 m from the shoreline and is surrounded by an arid environment with little to no vegetation, as shown in Fig. 1. Henties Bay is located approximatively 100 km north of Walvis Bay, the largest commercial harbour of Namibia (Namport, 2018). Formenti et al. (2018) showed that the location can be considered a baseline for a large part of the year (August to late April), but May to the end of July it is impacted by the synoptic transport of light-absorbing aerosols, most likely from vegetation burning in southern Africa and possibly but episodically by anthropogenic sources, such as heavy fuel combustion by commercial ships travelling along the coast, especially along the Cape of Good Hope sea route (e.g. Chance et al., 2015; Tournadre, 2014; Zhang et al., 2010).
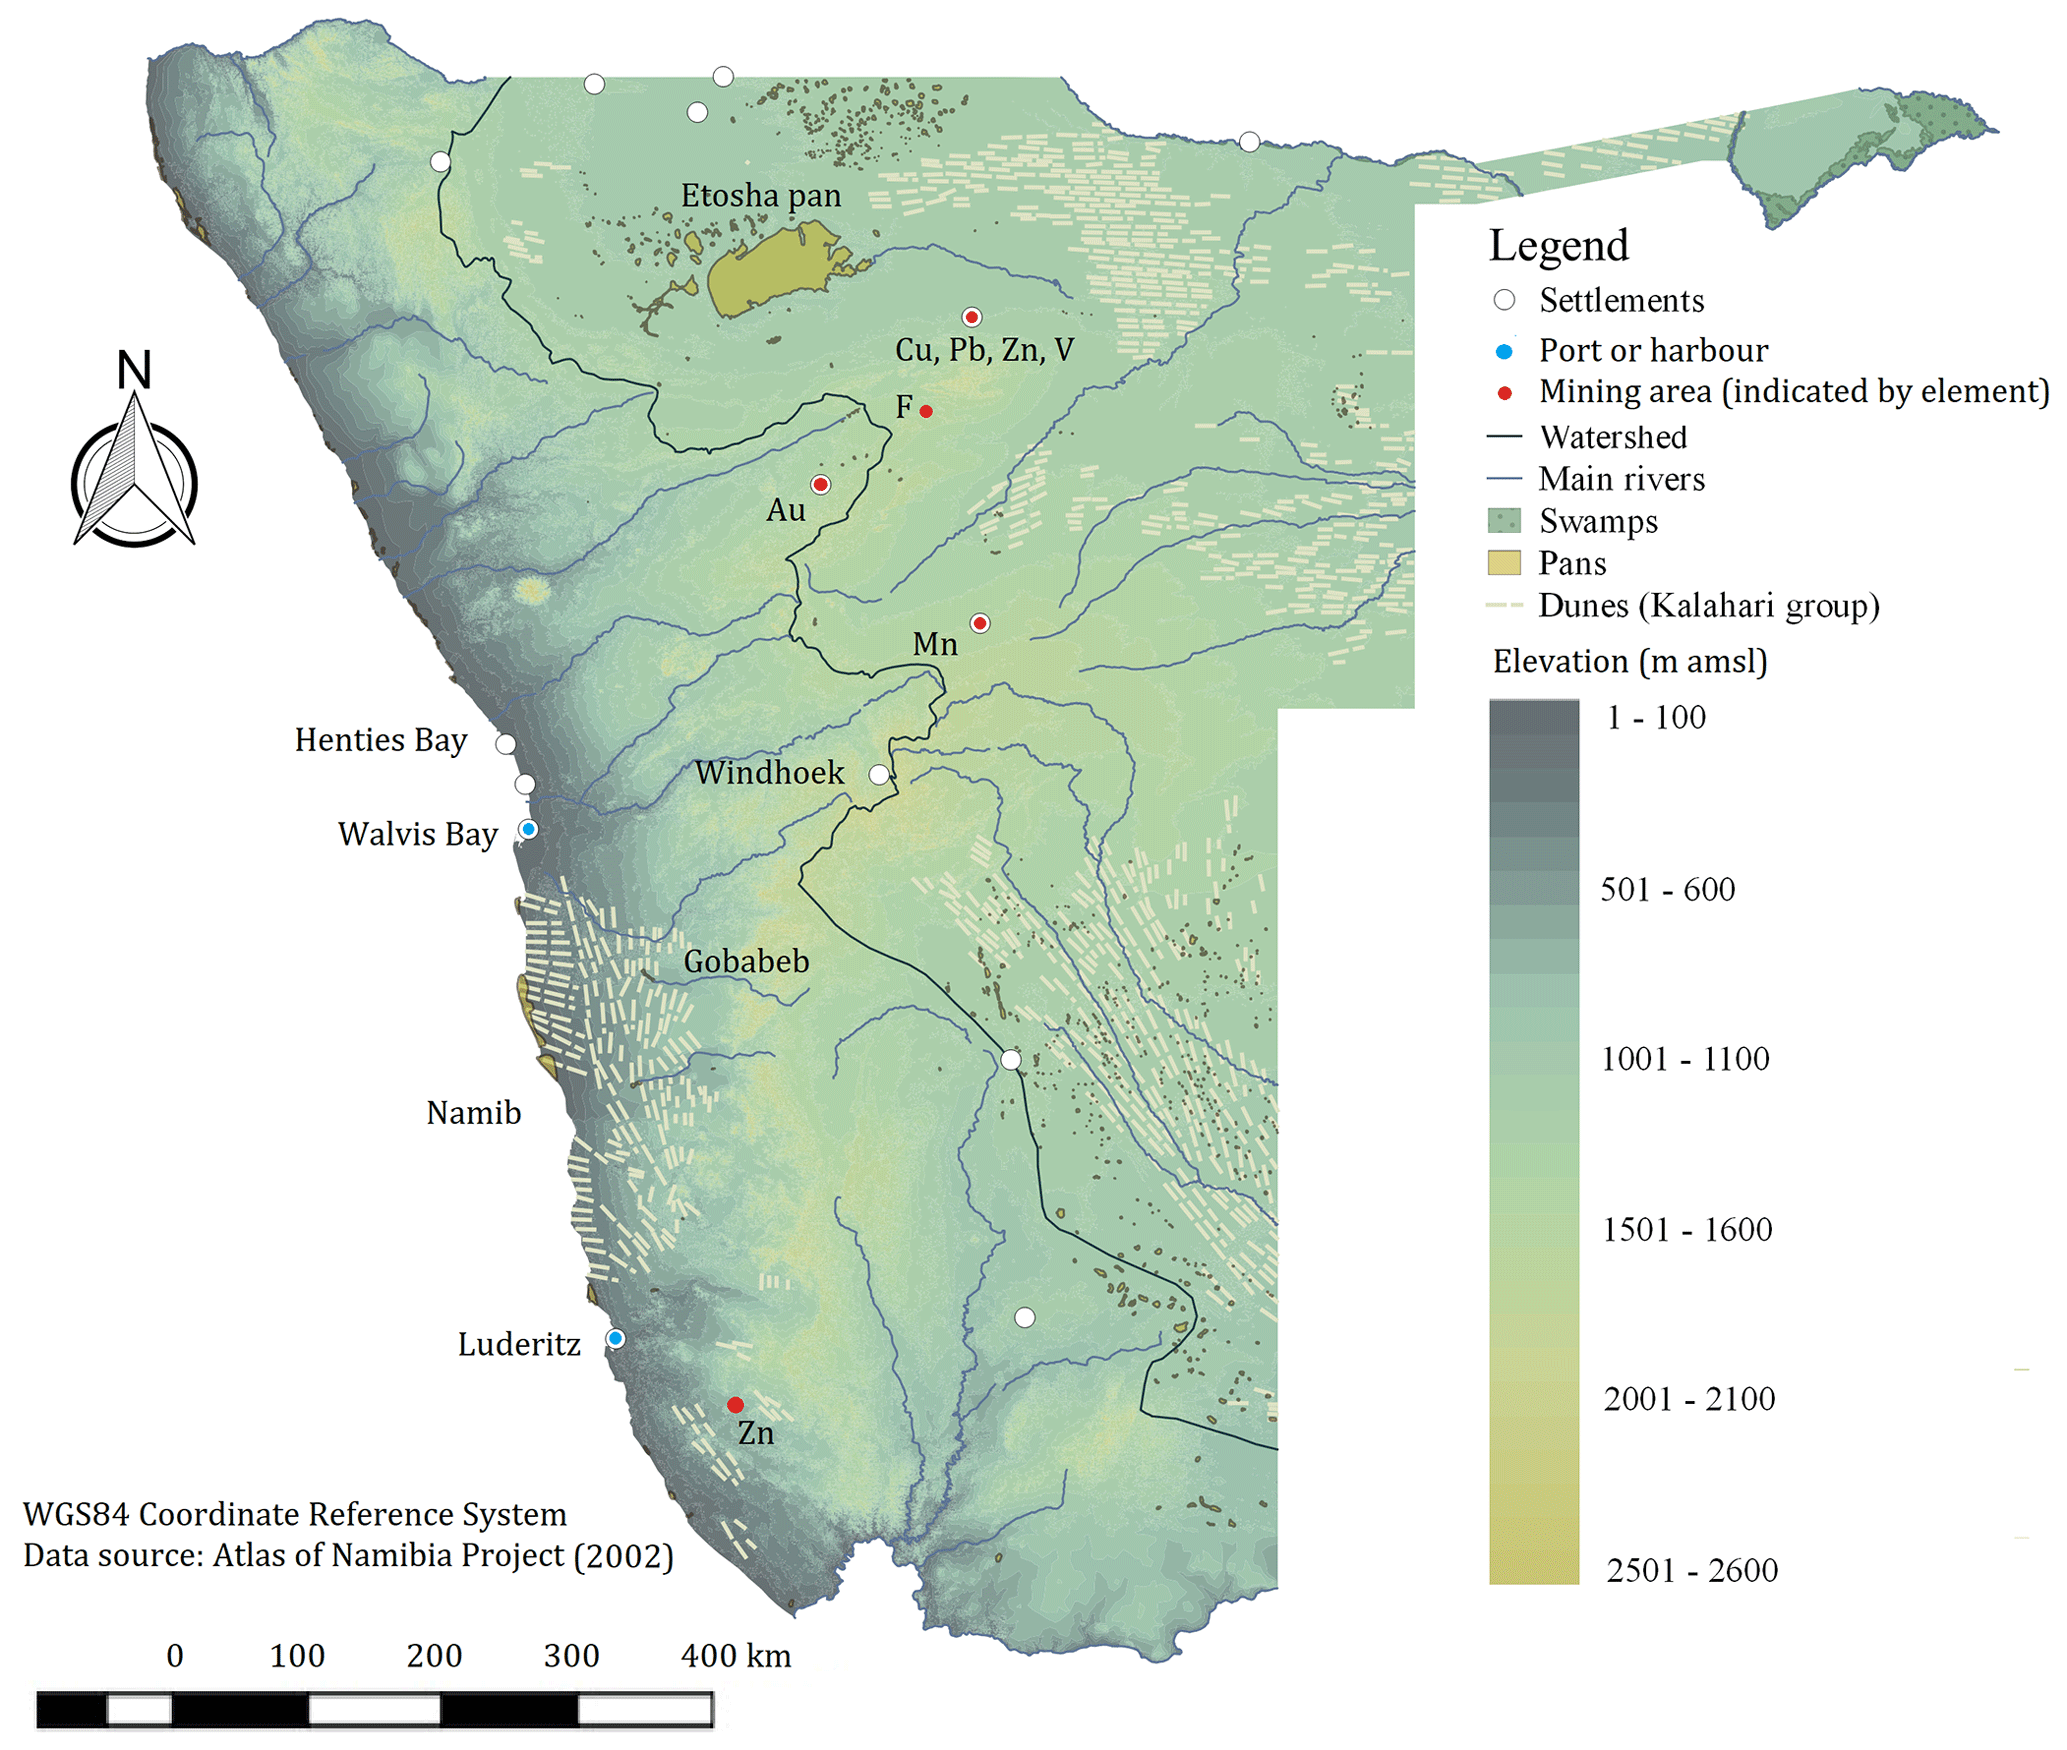
Figure 1Geographical map of Namibia with elevation as a shaded gradient and some of the known emission sources in the region, such as major urban settlements and airports, harbours, pans and swamps, mineral-rich mining operations, labelled by the major element being mined, and dune fields of the Kalahari stratigraphic group (Atlas of Namibia project, 2002).
2.1 Aerosol filter sampling and analysis
An automated sequential air sampler (model Partisol Plus 2025i, Thermo Fisher Scientific, Waltham, MA USA) was used to collect aerosol particles on 47 mm Whatman Nucleopore polycarbonate filters (1 µm pore size). Air was sampled at a flow rate of 1 m3 h−1 through a certified inlet (Rupprecht and Patashnick, Albany, New York, USA) located on the rooftop terrace above the instrument and collecting aerosol particles of aerodynamic diameter lower than 10 µm (PM10 fraction).
Individual filter samples were collected for 9 h during the day (from 09:00 to 18:00 UTC) and during the night (from 21:00 to 06:00 UTC) on an intermittent week on/week off schedule. One blank sample per week was collected. The whole dataset consisted of 385 samples during 2016 and 2017.
Elemental concentrations of 24 elements (Na, Mg, Al, Si, P, S, Cl, K, Ca, Ti, V, Cr, Mn, Fe, Co, Ni, Cu, Zn, As, Sr, Pb, Nd, Cd, Ba) were obtained at LISA by wavelength-dispersive X-ray fluorescence (WD-XRF) using a PW-2404 spectrometer (Panalytical, Almelo, Netherlands), according to the protocol previously described by Denjean et al. (2016). The relative analytical uncertainty on the measured atmospheric concentrations (expressed in ng m−3) is evaluated as 10 %. This represents the upper limit uncertainty, taking into account the following.
-
The uncertainty related to the uniformity of the aerosol deposit on the filters and the scaling error that can occur due to the fact that the area of the deposit which is analysed is smaller than the area of the aerosol deposit
-
The statistical error on the photon counts, in particular for trace elements whose concentrations are close to their detection limits
-
The percent error on the certified mono- and bi-elemental standard concentrations (Micromatter Inc., Surrey, Canada) used for calibration of the XRF apparatus
-
For the lightest elements (Z < 20, Na to Ca), the choice of the correction factor to account for the self-attenuation of the X-ray signal, in particular for particles larger than 1 µm in diameter (Formenti et al., 2011). Constant correction factors (Table S1) were estimated through the sampling period assuming a mean diameter of 4.5 µm to represent the average coarse particle size.
The concentrations of 16 water-soluble ions (F−, propionate, formate, acetate, methanesulfonic acid (MSA), Cl−, Br−, NO, PO, SO, oxalate, Na+, NH, K+, Ca2+ and Mg2+) were obtained at LISA by ion chromatography (IC) with a Metrohm IC 850 device (injection loop of 100 µL). For anionic species, the IC was equipped with a MetrosepA supp 7 (250∕4.0 mm) column associated with a MetrosepA supp 7 guard pre-column heated at 45 ∘C. For simultaneous separation of inorganic and short-chain organic anions, elution has been realised with the following elution gradient (eluent weak: Na2CO3 ∕ NaHCO3 (0.28∕0.1 mM) and eluent strong: Na2CO3 ∕ NaHCO3 (28∕10 mM)), 100 % eluent weak from 0 to 23.5 min; then 15 % eluent strong from 23.5 to 52 min and 100 % eluent weak to finish. The elution flow rate was 0.8 mL min−1. For cationic species, IC has been equipped with a Metrosep C4 (250∕4.0 mm) column associated with a Metrosep C4 guard column heated at 30 ∘C. Elution has been realised with an eluant composed of 0.7 mM of dipicolinic acid and 1.7 mM of nitric acid. The elution flow rate was 0.9 mL min−1. The uncertainty of water-soluble ionic concentrations (also expressed in ng m−3) is within 5 %, the maximum uncertainty obtained during calibration by standard certified mono- and multi-ionic solutions. For each chemical species, the minimum quantification limit (MQL) was calculated as 10 times the square root of the standard deviation of the concentration of laboratory blank samples, corresponding to filter membranes prepared as actual samples but stored and analysed without exposure to external air. Only values above MQL are included in further analyses.
A quality-check assessment of the analysis was performed by comparing the concentrations of Cl, Mg, K, Ca, Na and MSA + SO ∕ S measured by IC and XRF (Fig. S1). The comparison revealed a good linear correlation between the two datasets, with the coefficient of determination (R2) exceeding 0.85 for all the elements. However, some differences in the slopes of the linear correlations are observed when comparing the 2016 and 2017 datasets for Cl− ∕ Cl, Na+ ∕ Na, and Mg2+ ∕ Mg. Mass ratios were 1.3 ± 0.1 (2016) and 1.0 ± 0.1 (2017), 1.3 ± 0.1 (2016) and 0.9 ± 0.1 (2017), and 2.0 ± 0.1 (2016) and 1.7 ± 0.2 (2017) for Cl− ∕ Cl, Na+ ∕ Na, and Mg2+ ∕ Mg, respectively. Conversely, no annual dependence was observed in the slopes of the linear correlations for the mass ratios of Ca2+ ∕ Ca (0.8 ± 0.1), K+ ∕ K (0.6 ± 0.1) and MSA + SO ∕ S (2.7 ± 0.4). The molar ratio of MSA + SO ∕ S was 8.0 ± 1.2 for 2016 and 7.8 ± 0.9 for 2017. These values are in general terms consistent with expectations that these elements, mostly but not exclusively comprising sea salt, should be predominantly soluble in water. However, ratios higher than unity are obtained for Cl− ∕ Cl in 2016, Na+ ∕ Na in 2017, and Mg2+ ∕ Mg for both years. No specific sampling or analytical problems were found. However, the further comparison of their proportions to those expected for seawater (Seinfeld and Pandis, 2006) as well as the possibility that the choice of a mean, time-independent self-attenuation correction factor for Na and Mg would be erroneous suggested to us to discard the XRF results and only use the values obtained by IC for those three elements. For Ca2+ ∕ Ca, K+ ∕ K and SO ∕ S, ratios are consistent with previous observations in marine environments impacted by mineral dust (Formenti et al., 2003a).
2.2 Local winds, air mass trajectories and synoptic meteorology
Local wind speed and direction were measured with two anemometers also located on the rooftop of HBAO: first, a Campbell Scientific 05103, replaced with a Vaisala WXT530 from September 2017 onwards. Measurements were stored as 5 min averages. Wind data were available for all of 2016 and 55 % of the aerosol sampling periods in 2017 (no wind data were available during 19–26 May and 7–14 July 2017).
The NOAA Hybrid Single-Particle Lagrangian Integrated Trajectory (HYSPLIT) model (Stein et al., 2015) was used to evaluate the origin and transport pathway of air masses to HBAO. Seventy-two-hour back trajectories were run every hour for each 9 h long filter sampling period starting at a height of 250 m above ground level (a.g.l.), which effectively models transport into the marine boundary layer (MBL, with a minimum height of ∼500 m over the BUS; Preston-Whyte et al., 1977). This choice also considered the model vertical resolution (23 levels throughout the atmospheric column). The first model vertical level is at 1000 hPa (approximately 110 m a.m.s.l.) and the next is at 975 hPa (approximately 300 m a.m.s.l.). The Global Data Assimilation System (GDAS) reanalysis dataset with a resolution, provided by the National Centre for Environmental Prediction (NCEP), was used. This was preferred to the resolution dataset where the vertical velocity is absent and has to be calculated from the divergence, introducing uncertainties into the model. Trajectories were run through the Rstudio interface using the rich_iannone/splitR (available from https://github.com/rich-iannone/splitr) and Openair (Carslaw and Ropkins, 2017) packages from the open-source libraries.
As a complement, publicly available daily synoptic charts provided by the South African Weather Service (SAWS, https://www.weathersa.co.za/home/historicalsynoptic, last access: 20 February 2020) were analysed for the synoptic-scale-induced flow.
The identification of the origin of the aerosols, complementary to the analysis of the air mass back trajectories and local wind speed and direction, was undertaken by examining the temporal correlations of the elemental and ionic concentrations with known tracers and additionally by positive matrix factorisation (PMF).
3.1 Ratios to unique tracers
The identification and quantification of the aerosol types contributing to the total particle load at HBAO were done by investigating the linear correlation of measured elemental and ionic concentrations and their mass ratios with unique tracers of the atmospheric particulate matter source types expected in the region. These are the following.
-
Sea salt aerosols traced by Na+, constituting 30.6 % of the aerosol mass in seawater (Seinfeld and Pandis, 2006)
-
Marine biogenic emissions during the life cycle of marine phytoplankton in the BUS (Nelson and Hutchings, 1983) and traced by the concentrations of particulate MSA, a unique product of the oxidation of gaseous DMS (Seinfeld and Pandis, 2006)
-
Wind-blown mineral dust liberated from the surface of pans and ephemeral river valleys (Annegarn et al., 1983; Eltayeb et al., 1993; Heine and Völkel, 2010; Dansie et al., 2017), but also during road construction and mining activities (KPMG, 2014). Mineral dust is traced by elemental aluminium, representing aluminosilicate minerals and contributing on average 8.13 % of the global crustal rock composition by mass (Seinfeld and Pandis, 2006), and by the non-sea salt (nss) fraction of Ca2+ to represent calcium carbonate. This is justified by the specific mineralogy of Namibian soils, which are enriched in gypsum (CaSO4OH) and calcite (CaCO3) and present a calcium content higher than the global average (Annegarn et al., 1983; Eltayeb et al., 1993). The apportionment of the sea salt (ss) and non-sea salt (nss) Ca2+ fractions was done using the nominal mass ratio of Ca2+ ∕ Na+ in seawater (0.021; Seinfeld and Pandis, 2006). The evaluation of the mass concentration of calcium carbonate was done by multiplying the measured nss-Ca2+ mass concentration by the CaCO3 ∕ Ca mass ratio of 2.5.
-
Heavy-oil combustion from industry and commercial shipping as well as mining activities traced by elements such as Ni, V, Pb, Cu, and Zn (Ettler et al., 2011; Becagli et al., 2017; Johansson et al., 2017; Kříbek et al., 2018; Sinha et al., 2003; Soto-Viruet, 2015; Vouk and Piver, 1983)
-
Seasonal transport of biomass burning aerosols traced by nss-K+ (Andreae et al., 1998; Andreae and Merlet, 2001). Nss-K+ was calculated from measured K+ assuming the mass ratio K+ ∕ Na+ of 0.036 as in seawater (Seinfeld and Pandis, 2006).
3.2 Positive matrix factorisation
Multivariate statistical methods such as PMF are widely used to identify components or “source” profiles and explore source–receptor relationships using the trace element compositions of atmospheric aerosols (e.g. Schembari et al., 2014; Hopke and Jaffe, 2020). The PMF uses weighted least-squares component analysis to deconvolute the matrix of observed values (X) as , where G and F are the matrices representing the component scores and component loadings, respectively, and E is the matrix of residuals equal to the difference between observed and predicted values (Paatero and Tapper, 1994; Paatero et al., 2014).
In this paper, the multivariate PMF statistical analysis was conducted with the EPA (Environmental Protection Agency) PMF version 5.0 (Norris et al., 2014). The XRF and IC datasets were combined by retaining only elements/ions measured above the MQL in more than 70 samples (that is, at least in 20 % of the collected values). This criterion excluded Ba, Br−, PO and Mn2+. Occasional missing values in the retained elements/ions were replaced by the species median value, as recommended by Norris et al. (2014). Uncertainties for missing values were replaced by a dummy value (99999) to ensure that these samples do not skew the model fit (Norris et al., 2014). In order to weight the concentrations according to their amount, relative uncertainties of 10 %, 20 % and 60 % were attributed to each value of concentration in the input matrix based on their ratio to their respective MQL (larger than 3.3, comprised between 1.25 and 3.3, and comprised between 1 and 1.25, respectively). The final input matrix comprised 385 observations of 33 chemical species. The water-soluble ionic form instead of the elemental form was retained for Mg, Na, Cl, K, Ca and S.
Based on the temporal correlation, the PMF analysis resolves the chemical dataset into a user-specified number of components (“sources”). No completely objective criterion exists for selecting the number of components, and so the model was run considering potential solutions of three to seven sources. Each of these models was run 100 times using randomised seeds. For each of these runs, the robustness of fit was compared and the estimation of the error range of each solution was done by running a classical bootstrap analysis, displacing chemical species in each modelled component and testing the rotational ambiguity of the solutions, and finally also by running a supplementary bootstrap analysis enhanced by displacement of component elements (Norris et al., 2014; Paatero et al., 2014). Fpeak rotations with strengths between −0.5 and 1.5 were tested to further optimise the component solutions.
4.1 Meteorological conditions during sampling
The characteristic synoptic circulation patterns identified over the western coast of southern Africa that are significant for this study include continental–anticyclonic circulation, the south-eastern Atlantic anticyclone, western coastal troughs and barotropic easterly waves, transient baroclinic westerly waves and coastal low-pressure systems (Tyson and Preston-Whyte, 2014). Formenti et al. (2018) found that anticyclonic circulation, both in the form of the South Atlantic anticyclone and the continental anticyclone, is the most persistent circulation pattern over the western coast of Namibia.
Figure 2 shows weekly composite maps of calculated air mass back trajectories (their gridded frequency plot is shown in Fig. S2). Southerly and south-westerly transport occurred year-round and easterly transport mainly occurred during late autumn (May), winter (June, July and August) and early spring (September, October and November). Large-scale north-easterly air mass transport towards HBAO was restricted to the austral autumn and winter, when continental anticyclonic flow dominated the circulation patterns in the lower and mid troposphere. The majority of air masses arriving in the MBL are of marine origin from the southern and south-eastern Atlantic and show the transport of marine air masses toward the subcontinent, divergence at the escarpment and southerly flow induced along the coast. Most of the air masses were transported over coastal waters offshore and along the western coast of South Africa and Namibia and just inland to the north-north-east of HBAO from the sub-continent. Continental plumes arriving at HBAO are transported easterly between 15 and 22∘ S and from as far as 36∘ E.
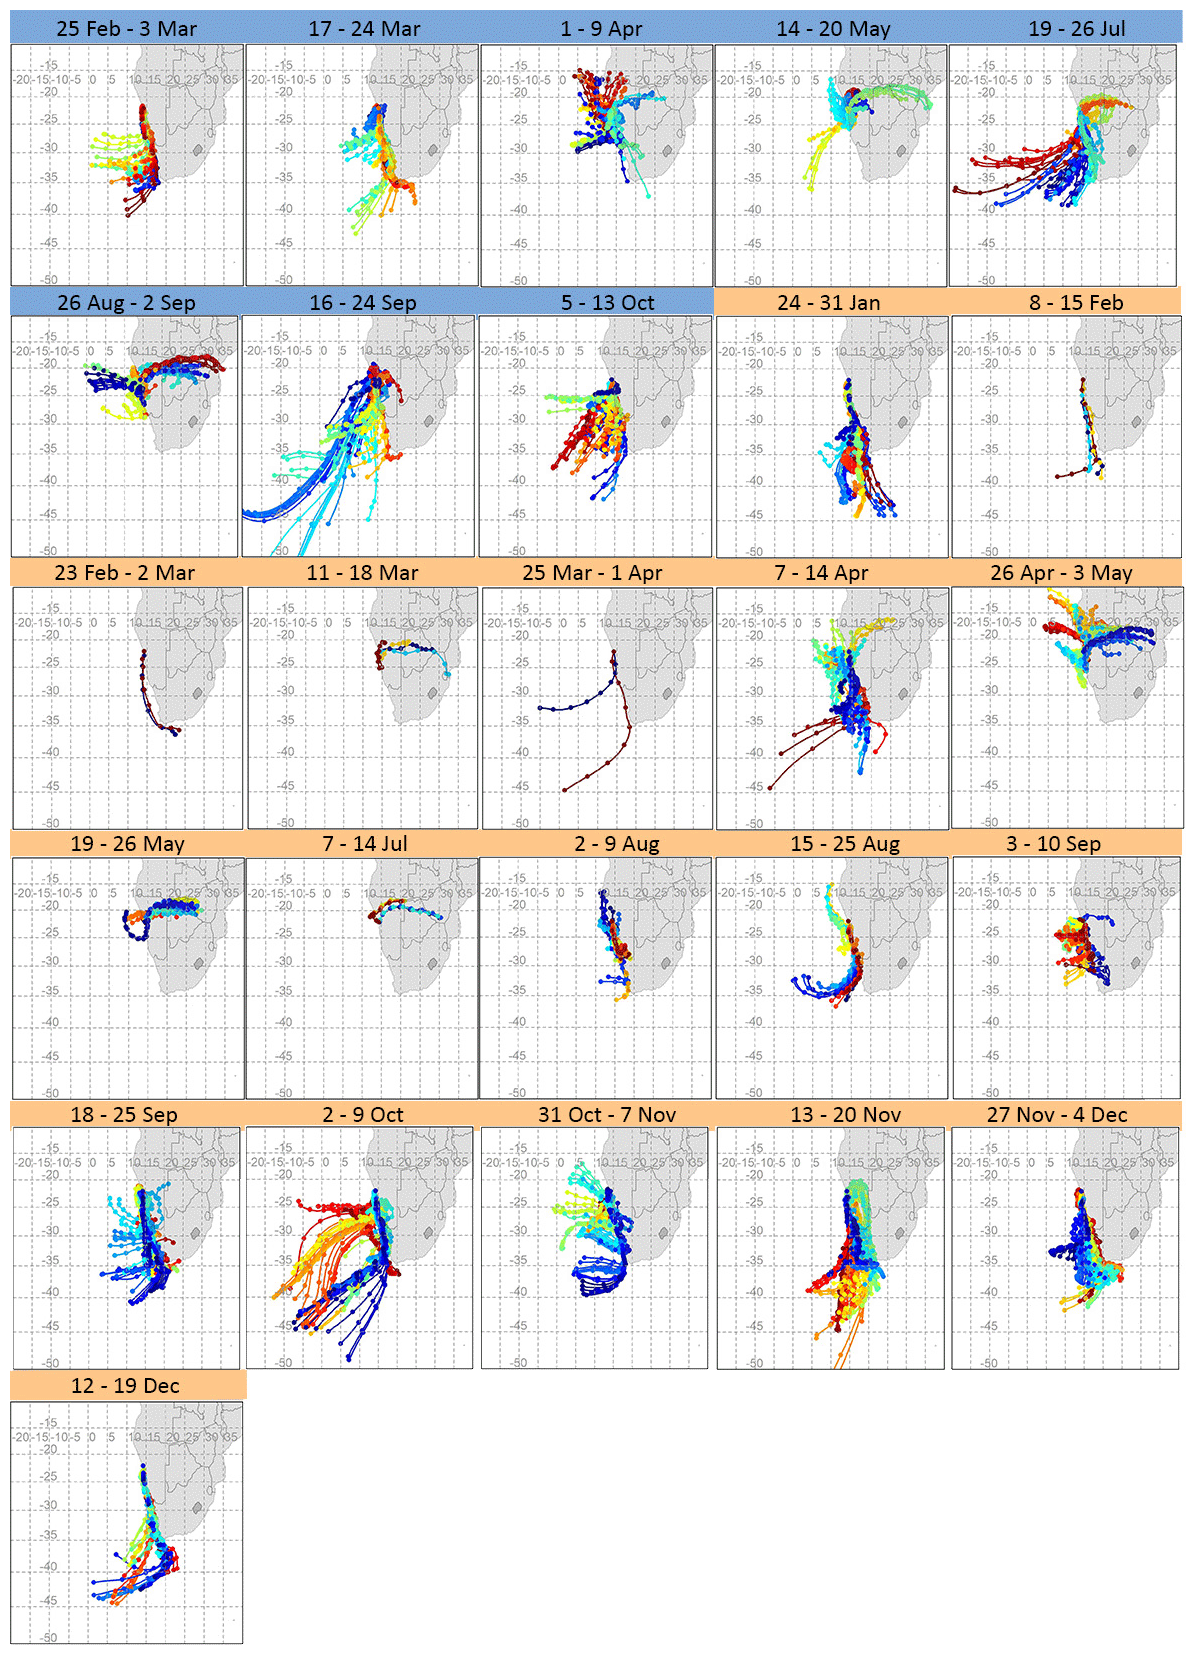
Figure 2Composite maps of 72 h back trajectories for every filter sampling period in 2016 (dates in blue) and 2017 (dates in orange). From these composite maps, a clear distinction can be made between marine air masses and those of continental origin and the potential for variability from these regions in terms of distance travelled and trajectory pathway. The colours are only used to differentiate one set of trajectories from another.
Emissions along these preferred pathways may be of great significance in shaping the regional aerosol background. Some of the known transport regimes are associated with mid-tropospheric easterly winds, responsible for transport off the subcontinent (Swap et al., 1996; Tyson et al., 1996). To the north of HBAO, Adebiyi and Zuidema (2016) observed continental plumes transported off the coast, especially under anticyclonic circulation over the subcontinent and the south-eastern Atlantic Ocean. Tlhalerwa et al. (2012) found berg winds, an easterly perturbation, to be the main agents of aerosol transport and deposition off the coast at Lüderitz, around 500 km south of HBAO, and easterly winds in the boundary layer may transport dust from the subcontinent into the ocean.
The weekly and hourly variability of local surface winds is illustrated in Figs. 3 and 4, respectively. On average the wind is characterised by low speeds during the daytime (4.7 ± 2.2 m s−1, with only 0.3 % calm) and at night (3.3 ± 2.1 m s−1, with 0.6 % calm conditions). The low wind speeds are typical for regions frequently experiencing anticyclonic circulation. The highest wind speeds were recorded for southerly winds, which were persistent throughout the sampling period, except during January 2017 (Fig. 3). The highest wind speed was recorded in the austral spring in both years and reached a maximum of 18.9 m s−1 in the week of 13–20 November 2017.

Figure 3Wind roses showing the wind speed, direction and frequency of occurrence corresponding to each aerosol sampling week in 2016 (dates in blue) and 2017 (dates in orange). The arithmetic mean wind speed for each week is reported in green. For 7–14 July 2017 no surface wind data are available.
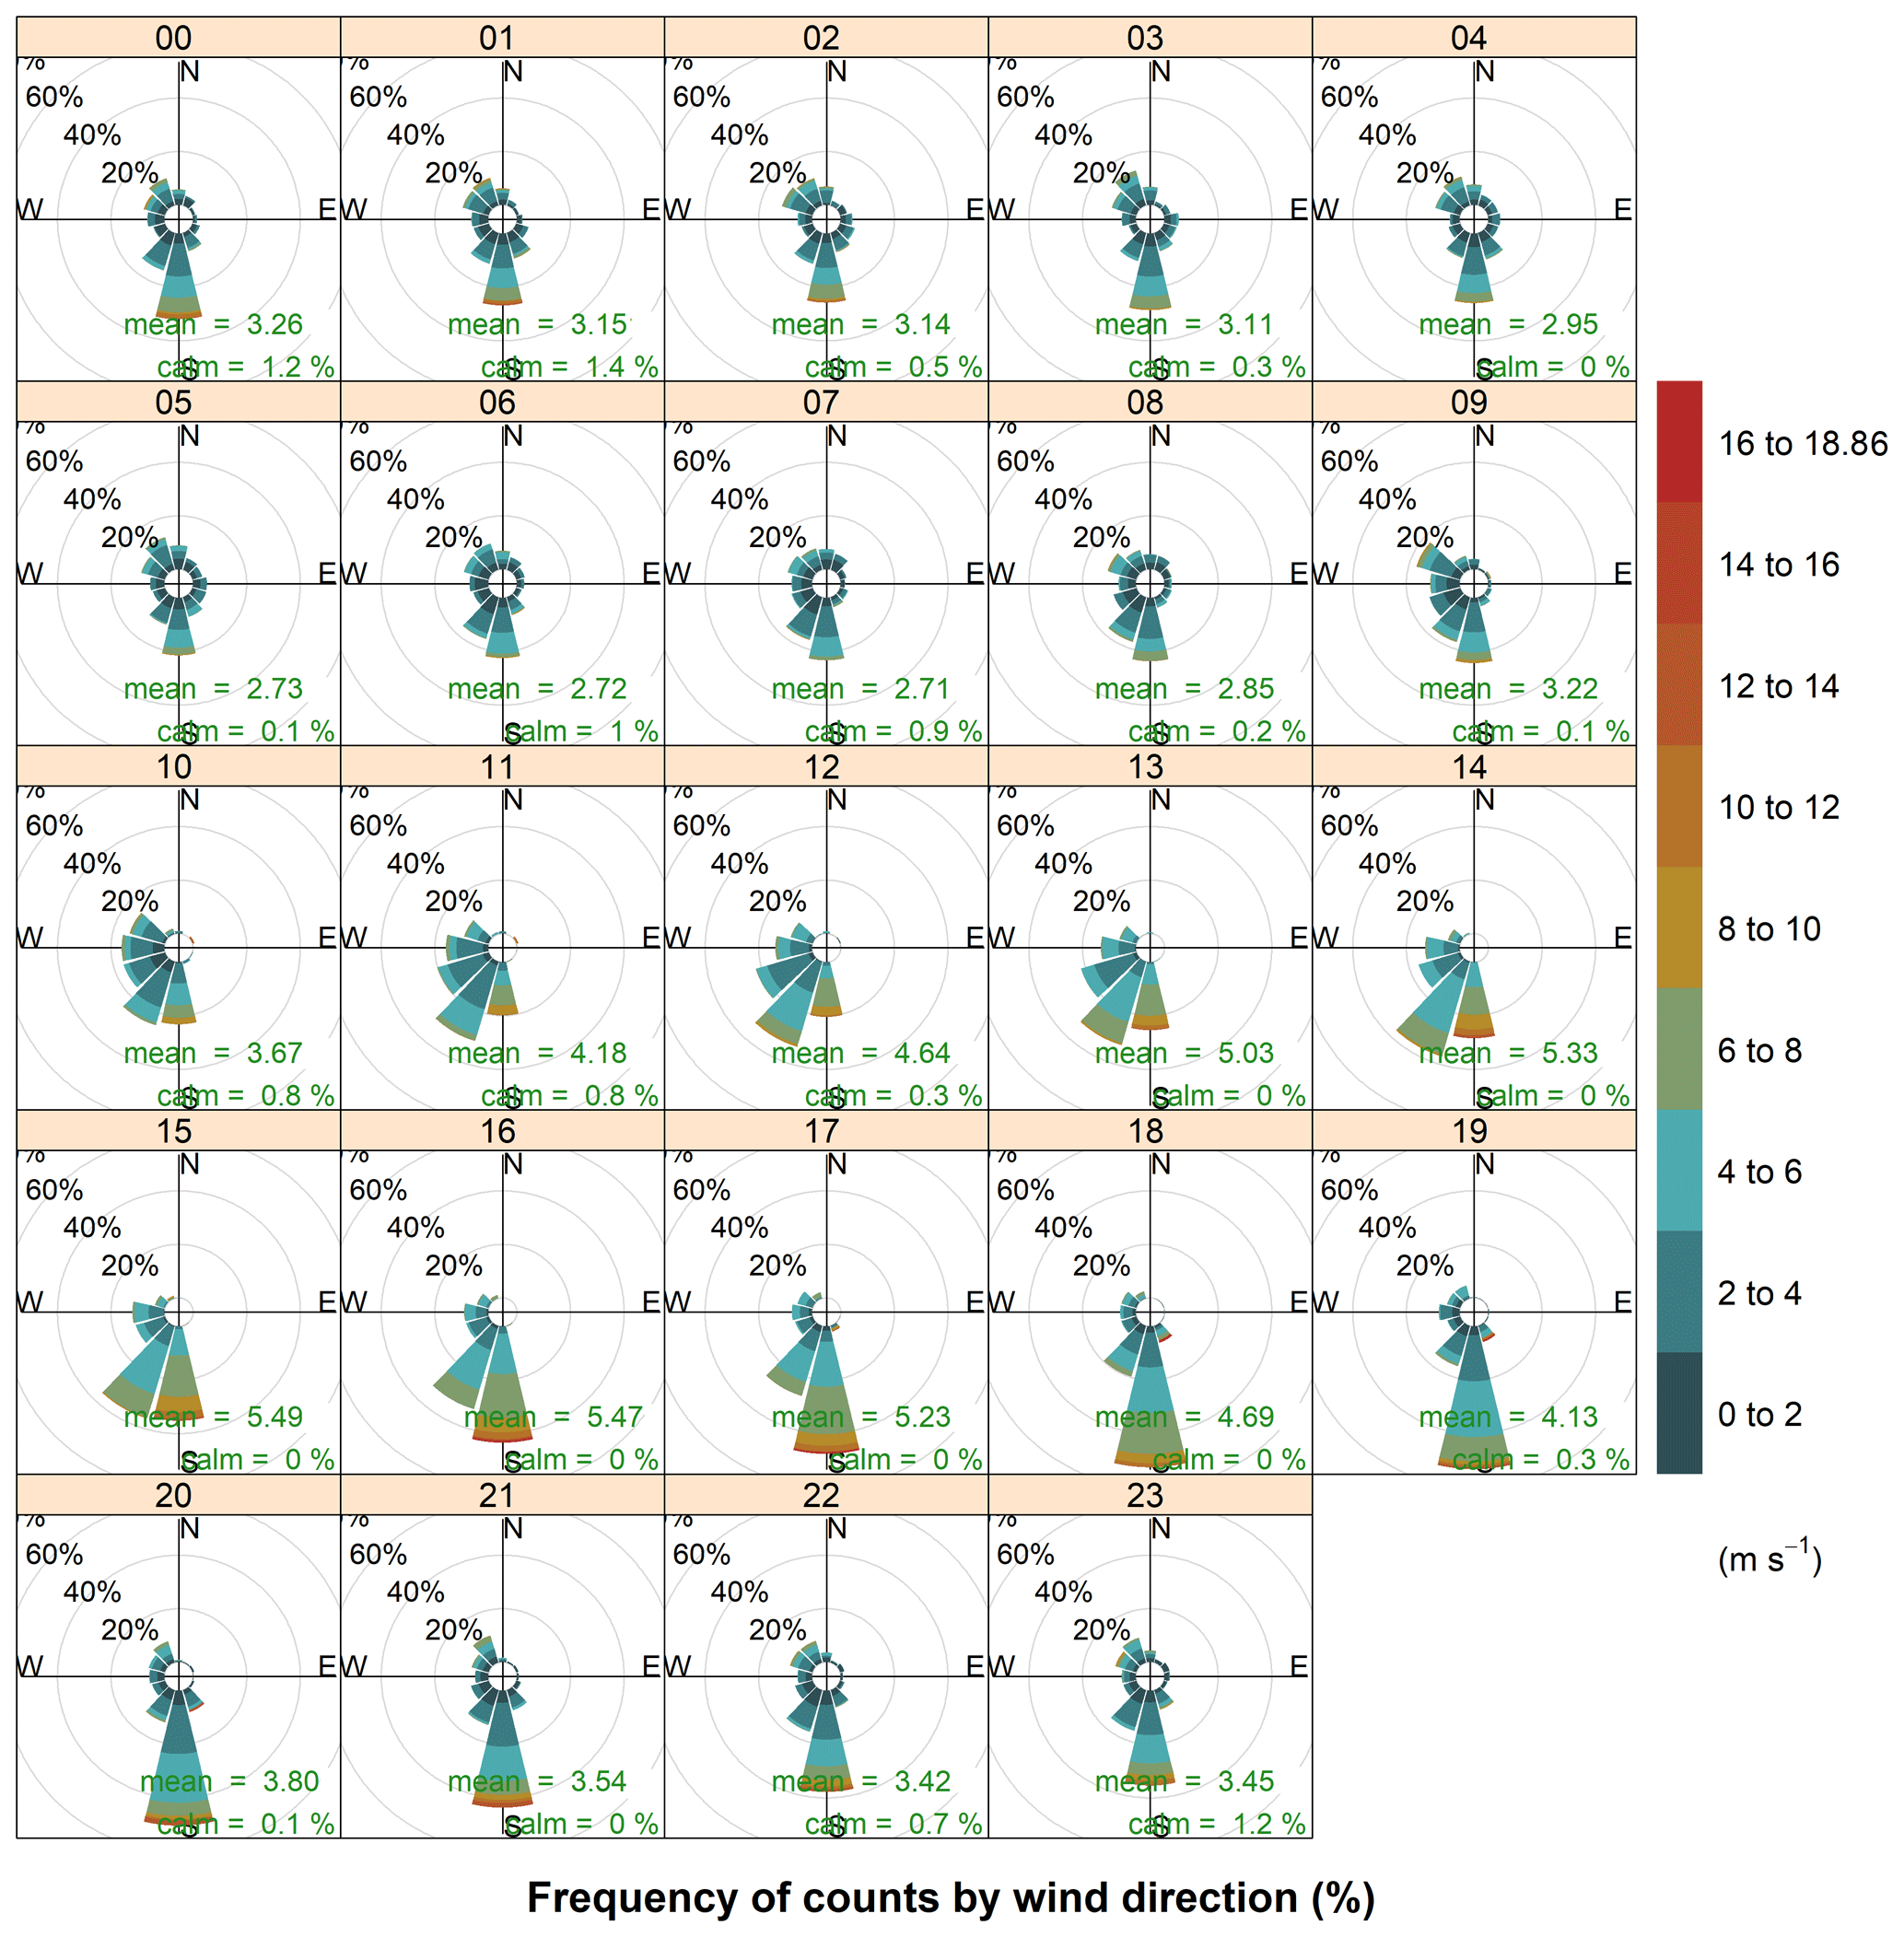
Figure 4Hourly wind roses during the aerosol sampling at HBAO. The arithmetic means and percentage of calm conditions, when wind speeds are below detection, are reported in green. Time is in UTC. For 7–14 July 2017 no surface wind data are available.
Another feature that is promoted by anticyclonic flow is thermally induced land and sea breezes. Sea breezes were a common daytime occurrence at HBAO. The sea breeze is typically characterised by southerly and south-westerly winds. The wind direction is partly a function of the shape of the coastline at Henties Bay and the overlying gradient flow. The daytime land breeze was not observed as frequently as the onshore sea-breeze flows. This supports the conclusion that the mechanisms for onshore flow are a combination of local and large-scale circulation. ENE and northerly winds were seen in July 2016, reaching a maximum speed of 13 m s−1 (mean wind speed of 4.5±2.2 m s−1 for the week of 19–26 July 2016). These are the land breezes that are also most likely to develop on clear stable nights. The northerly flow, in particular, occurred in the early evening and mid-morning (Fig. 4), with no seasonal dependence. Overall, it is important to note that the sea-breeze winds during the day are well defined in the data. At night the land breeze is much less important at Henties Bay than one might expect at a coastal site. This is almost certainly driven by the small thermal gradient that exists between the ocean and land temperatures at night. In the absence of a well-defined gradient, the land breeze does not develop on most nights.
Direct westerly winds occur less frequently at the site. The winds could be observed during the day and the night, indicating that they are not exclusively established as sea-breeze cells. The wind speeds for westerly flow conditions never exceeded 6 m s−1.
Easterly winds were only observed during the warmer months (January to March and September to December, Fig. 3) and during the night-time sampling periods (21:00 to 09:00 UTC), when their speeds remained below 4 m s−1 (Fig. 4). This local circulation is driven by easterly wave or tropical easterly circulation that moves southward during the summer months.
4.2 Variability and apportionment of measured concentrations
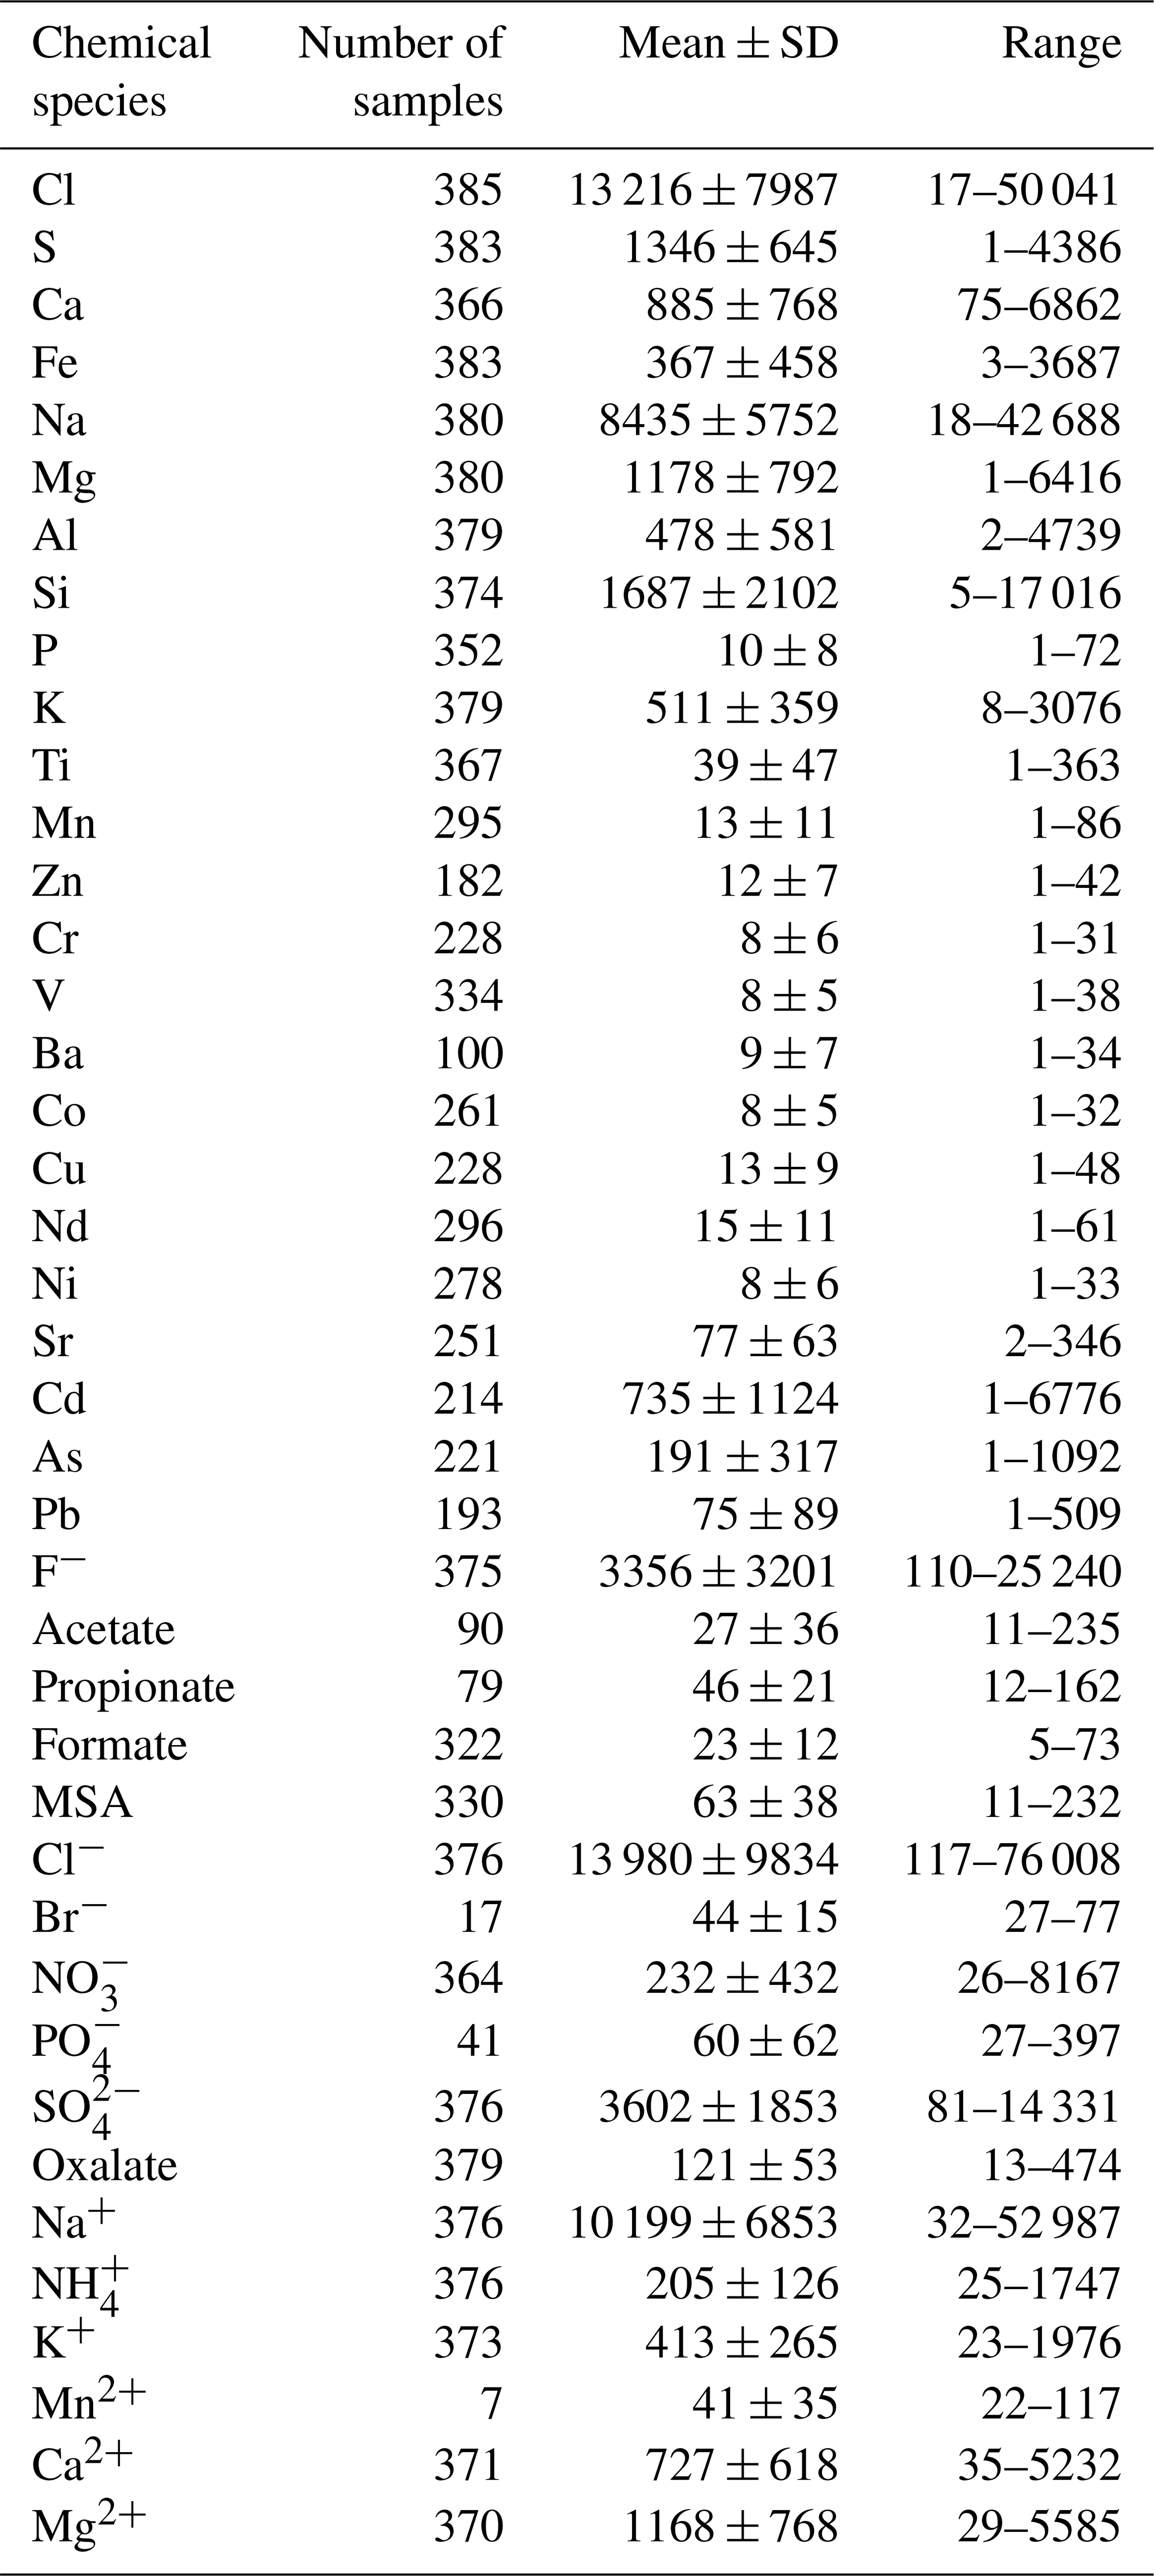
A summary of the measured elemental and water-soluble mass concentrations (arithmetic mean, standard deviation and range of variability) at HBAO during 2016 and 2017 is provided in Table 1. The time series of the mass concentrations of the source tracers discussed in Sect. 3.1 are shown in Fig. 5.
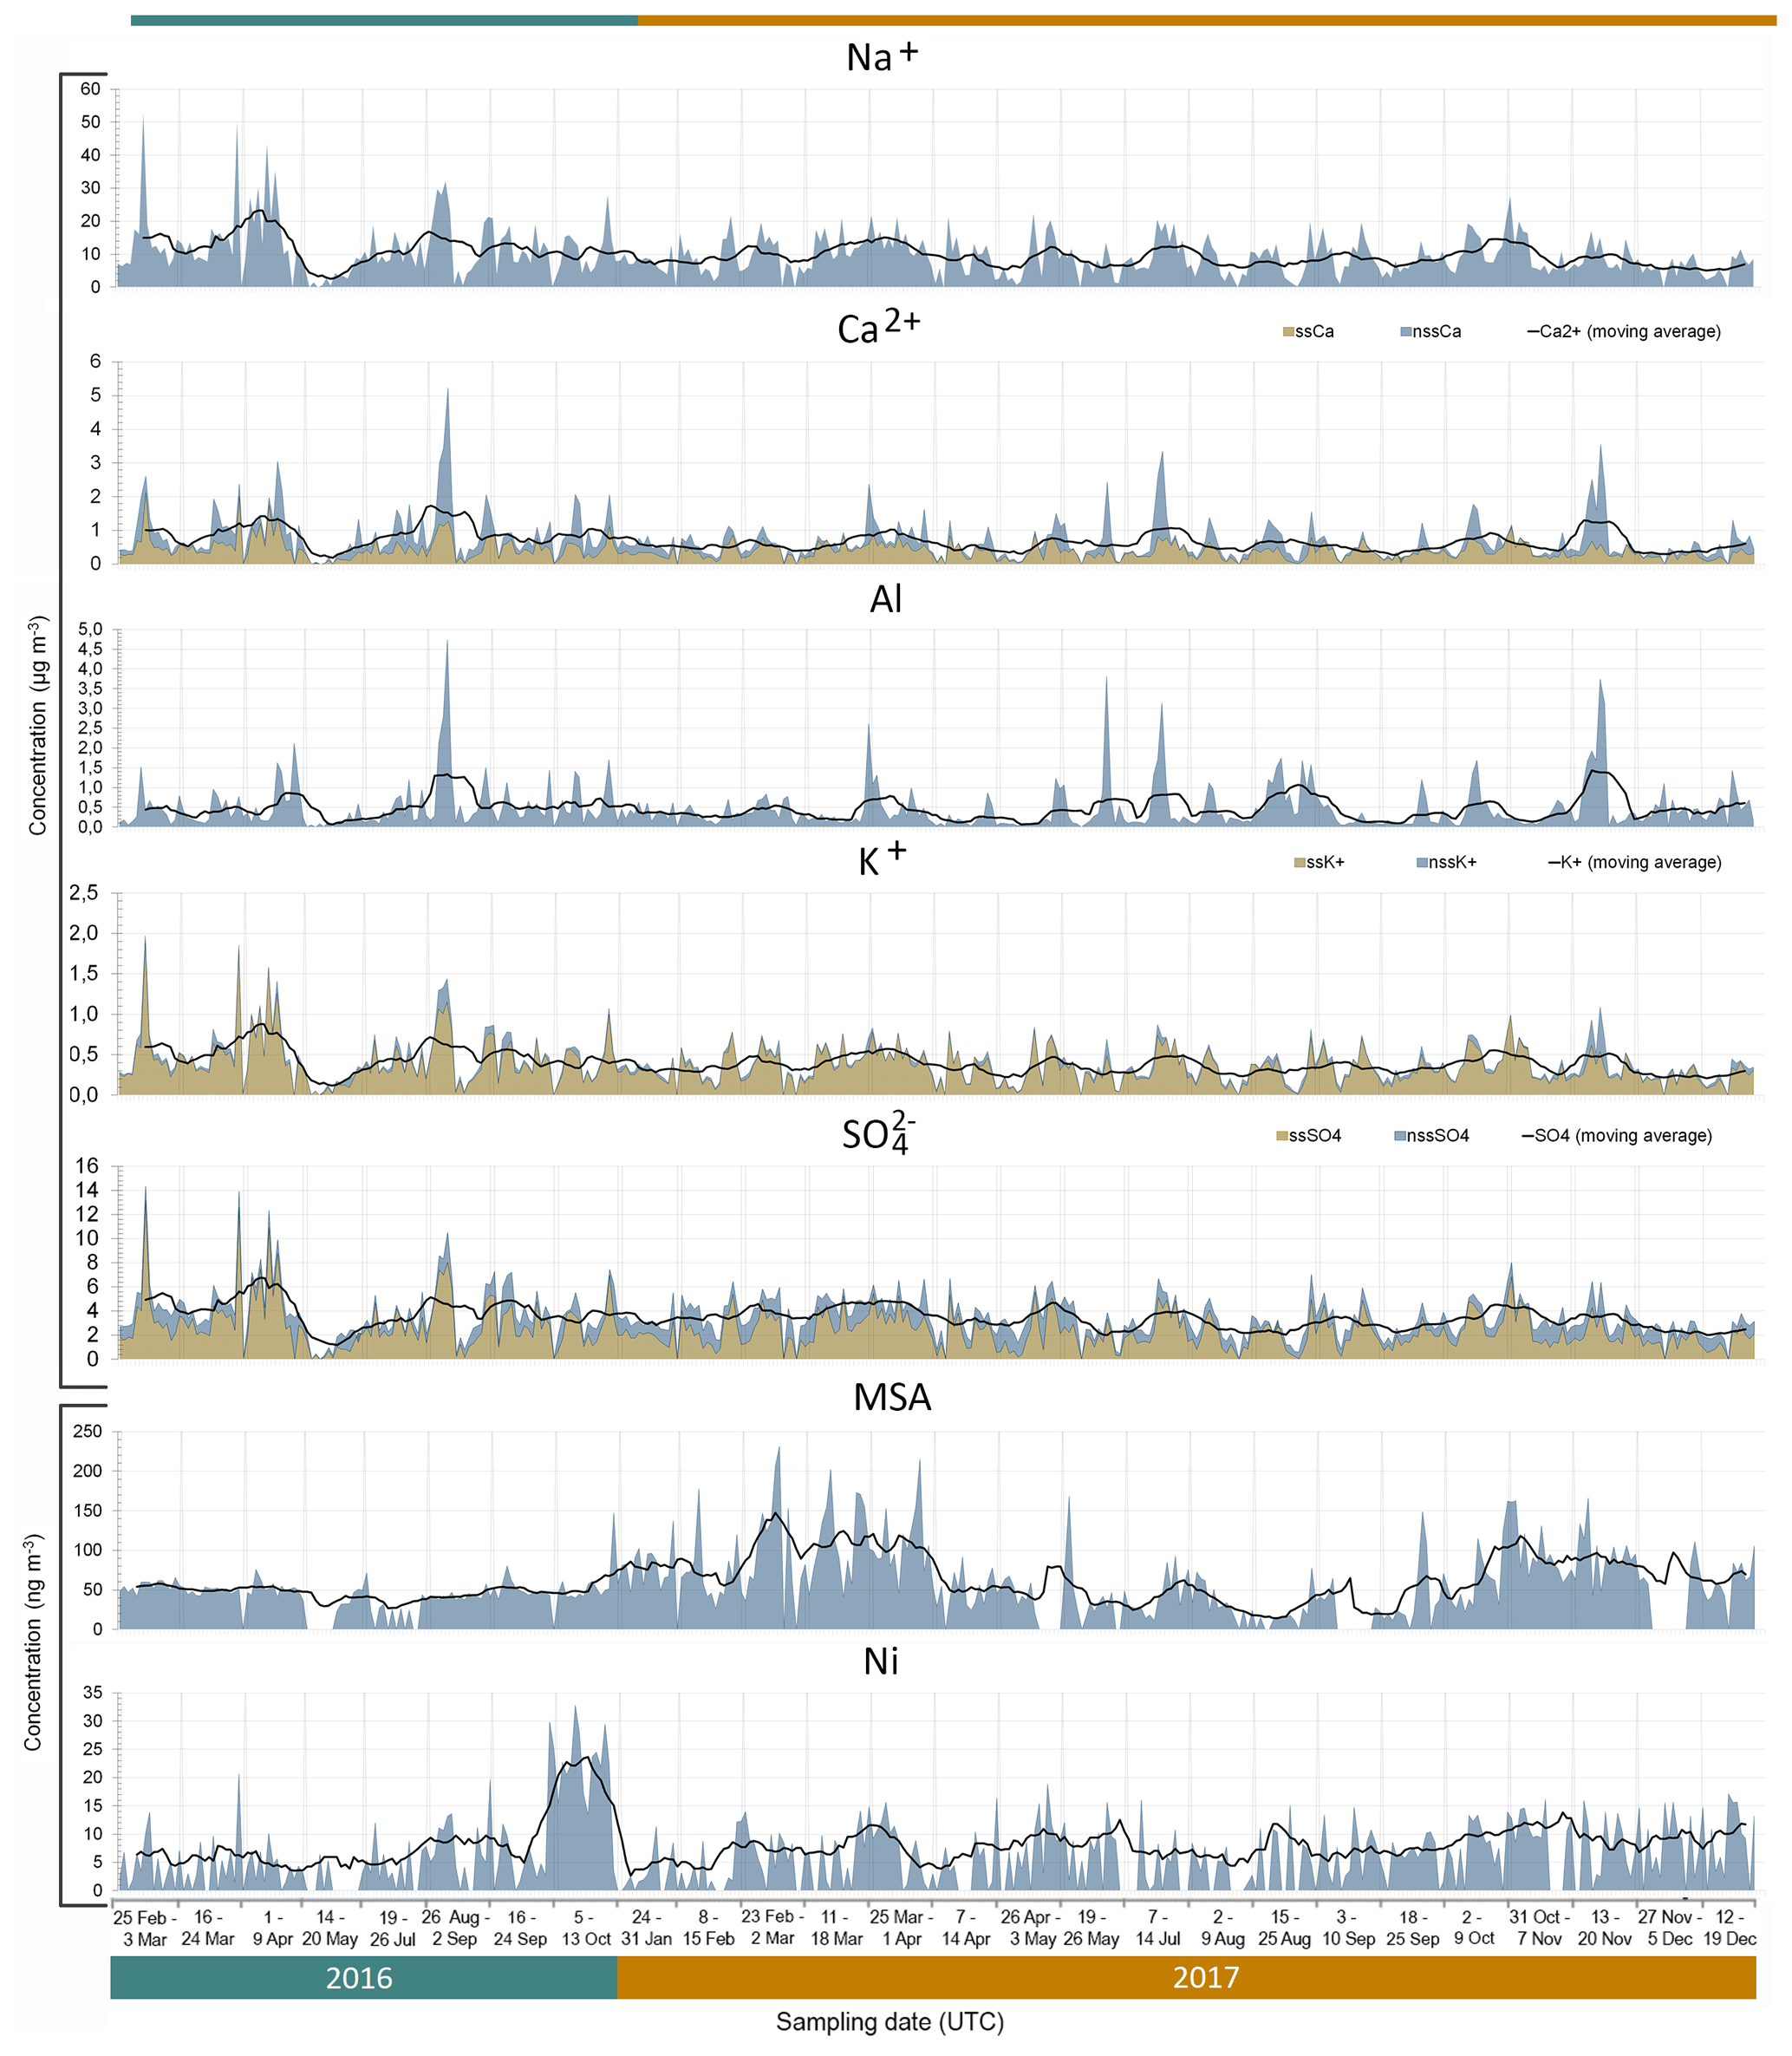
Figure 5Time series (date, time in UTC) of measured concentrations for Na+, Ca2+, Al, K+, SO, MSA and Ni (shaded area). The solid black line indicates the calculated 10-point moving average. The sea salt (ss) components for Ca2+, K+ and SO are indicated by the orange shaded areas, and the non-sea salt (nss) fraction is represented by the blue shaded areas. The time series is non-consecutive and is divided into the 26 sampling weeks by the light grey vertical lines.
Table 1Summary statistics of elemental and water-soluble ionic concentrations measured at HBAO. The second column indicates the number of samples for which values were above the minimum quantification limit (MQL). The arithmetic means with standard deviations (SD) and range of mass concentrations (minimum and maximum) are given in ng m−3.
An Fpeak strength of 0.5 was used to retain the best PMF solution whose five components (sea salt, mineral dust, ammonium neutralised, fugitive dust and industry) are shown in Fig. 6. The relative contribution of those components to the total estimated mass is shown in Fig. S3. Sea salt accounted for the largest fraction of the mass concentration (74.7 ± 1.9 %). Mineral dust accounted for 15.7 (±1.4 %) of the evaluated total mass concentration. The remaining fraction was accounted for by three components characterised by secondary species and heavy metals, ammonium neutralised (6.1 ± 0.7 %), fugitive dust (2.6 ± 0.2 %) and industry (0.9 ± 0.7 %). However, the major tracers of the sea salt component, Na+ and Cl−, were ubiquitous in all components, not surprising considering the continuous inflow of marine air to HBAO. As can be seen in Fig. 6, Na+ and Cl− contributed 35.2 ± 5.8 % of their mass to the mineral dust component, 47.4 (±1.9 %) of the mass of the fugitive dust component, and 1.3 (±17.8 %) of the mass of the industry component.
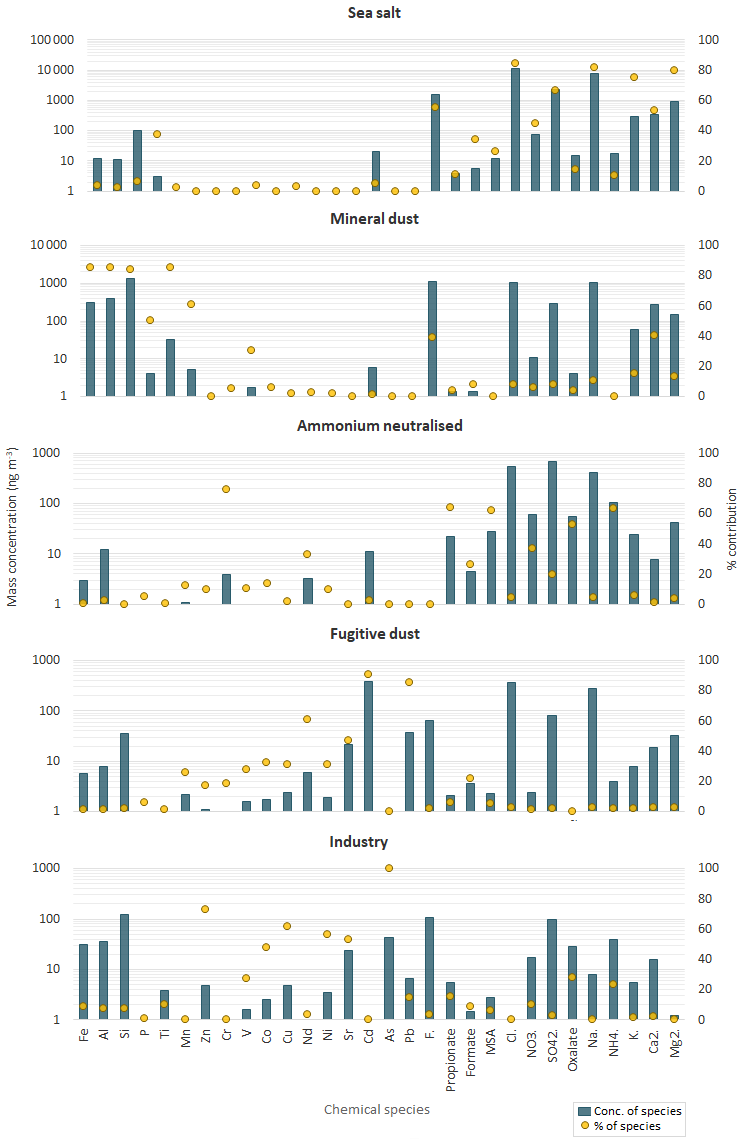
Figure 6Profiles of the five components identified by the PMF analysis. Blue bars denote the mass concentrations of individual elements/ionic species (left logarithmic axis, ng m−3), while the yellow points indicate the percent of species attributed to the source (right axis).
4.2.1 Sea salt
As expected, the major tracers of sea salt aerosols (Cl−, Na+, Mg2+ and K+) were sampled in high concentrations (up to 76, 53, 5.6 and 2.0 µg m−3, respectively) throughout the sampling periods. Their time variability, illustrated in Fig. 5 by the example of Na+, was very similar and characterised by a significant continuous background that could be represented by a 10-point moving average (that is, 90 h). The calculated mean background concentration was 10.1 ± 3.6 µg m−3. No seasonal cycle was evident due to the dominance of southerly and south-westerly winds transporting marine air masses onshore (Fig. 3).
The PMF sea salt component was represented by Na+, Cl−, Mg2+, K+, Ca2+ and SO (Fig. 6) and accounted for 74.7±1.9 % of the total aerosol mass (Fig. S3). Table 2 shows the mass ratios of Cl−, Mg2+, K+, Ca2+, F− and SO to Na+ for 2016 and 2017, calculated as the slopes of their linear regression lines and evaluated by the coefficient of determination (R2). This table also gives the slope of the linear regression lines for the PMF mineral dust component. The experimental values were compared with average ratios in seawater (Seinfeld and Pandis, 2006). The average Cl−/Na+ mass ratio was 1.4 ± 0.1 in 2016 and 1.3±0.1 in 2017 (also consistent for the PMF sea salt component), lower by 25 % than the value expected in seawater of 1.8. This difference has previously been reported in fresh sea salt in acidic marine environments (e.g. Zhang et al., 2010) and is attributed to Cl− depletion via reactions between NaCl and sulfuric and nitric acids. A very good correlation was observed between the ratios of Mg2+ (0.12 ± 0.01) and K+ (0.04 ± 0.01) with Na+ in this dataset and the value reported for seawater (Table 2) (Seinfeld and Pandis, 2006). Conversely, the linear correlation between Ca2+ and Na+ (not shown) was less pronounced (R2=0.61 and 0.42 in 2016 and 2017, respectively). The Ca2+ ∕ Na+ mass ratio was systematically higher than in seawater (0.04), indicating the contribution of crustal calcium typical of the Namibian soils (see Sect. 4.2.2).
Table 2Annual arithmetic mean mass ratios of Cl−, Mg2+, K+, Ca2+, F− and SO with respect to Na+ for 2016 and 2017. The Pearson coefficient of the linear regression (R2) is reported. Mass ratios for average seawater from Seinfeld and Pandis (2006) are shown for comparison. Standard deviations are indicated as SD.

Using the average seawater ratio, the mean sea salt (ss) Ca2+ concentration was estimated as 470 ± 360 ng m−3 and 360 ± 210 ng m−3 for 2016 and 2017, respectively. The mean non-sea salt (nss) Ca2+ concentration was 420 ± 520 and 270 ± 400 ng m−3, respectively, for the two years, representing 47 % and 42 % of the mean measured Ca2+ concentrations. Similarly, for both 2016 and 2017, the ss and nss components of K+ were estimated as 367 ± 246 ng m−3 and 44 ± 54 ng m−3, respectively, accounting for 89 % and 11 % of the K+ mass. The PMF estimated that sea salt contributed 53.0 ± 1.6 % of the calcium and 75.1 ± 2.4 % of the K+ mass.
The mean F− ∕ Na+ mass ratio measured at HBAO was 0.39 ± 0.29 in 2016 and 0.32 ± 0.29 in 2017 and was 0.19 ± 0.01 for the PMF sea salt component, enriched by 2 to 4 orders of magnitude to the average seawater composition (mass ratio ; Table 2).
4.2.2 Mineral dust
The PMF mineral dust component, composed of Si, Al, Fe, Ti, Ca2+, Mn, P, F− and V (Fig. 6), accounted for 15.7 ± 1.4 % of the total estimated mass. The time series of Al and nss-Ca2+ (Fig. 5) were analysed to investigate the temporal variability of airborne mineral dust at Henties Bay. The mean concentrations of mineral dust elements Al, Fe, Ti and Si were higher for night-time sampling between 21:00 and 06:00 UTC and lower in the day (09:00 to 18:00 UTC), in correspondence to easterly winds which were only observed at night and in the early morning (Fig. 4).
Differently from sea salt, the occurrence of mineral dust was not continuous, but episodic. Episodes of mineral dust corresponded to times when the concentrations of Al and nss-Ca2+ exceeded background values (modelled as the 10-point moving average) for a minimum of three consecutively sampled filters. Similar time variability was observed for elemental Fe, Si, Ti and P (not shown). Overall, 19 episodes of mineral dust were identified during the 2 years of sampling (Table S2).
The mean mass concentration of elemental Al was 556 ± 643 ng m−3 in 2016 and 446 ± 551 ng m−3 in 2017, while values peak as high as 4.7 µg m−3 (Table 1). To the best of our knowledge, no other measurements of Al are available in Namibia for comparison. Our arid sampling site is surrounded by loose sand, gravel plains (Matengu et al., 2019) and the deep Omaruru River valley directly north of the sampling site, which is also a recognised source of mineral dust to the offshore waters (Tlhalerwa et al., 2012). While mostly characterised by gravels, some clay-rich deposits are found around the river valley approximately 17 km north-east of HBAO (Matengu et al., 2019). The relatively low aluminium concentrations measured at HBAO suggest that these are not a major local source for the site. The nss-Ca2+ annual mean at HBAO (703 ± 644 ng m−3 in 2016 and 428 ± 437 ng m−3 in 2017) is similar to the concentrations (mean 425 ng m−3 and a maximum of 800 ng m−3) measured in central Namibia at Gobabeb, in the Namib Desert (23∘45′ S, 15∘03′ E; Annegarn et al., 1983). This is also the case for Fe, whose annual mean concentrations at HBAO (372 ± 480 ng m−3 in 2016 and 338 ± 433 ng m−3 in 2017) compare well with the average of 246 ng m−3 (Annegarn et al., 1983).
Table 3 shows the mass ratios for major components of mineral dust as well as some heavy metals (V and Ni). Overall, Si, Fe, and Ti showed very good correlations with Al, as expected for mineral dust (R2 > 0.9). The average mass ratio of Si ∕ Al was 3.7 ± 1.0 in 2016 and 3.4 ± 0.8 in 2017, lower than the average values of 4 to 4.6 expected in global soils and crustal rock (Seinfeld and Pandis, 2006). This is attributed to the size fractionation during aeolian erosion of soils producing airborne dust. As a matter of fact, our average values are consistent with those obtained for particles less than 10 µm in diameter by Eltayeb et al. (1993) at Gobabeb. Our averages, generally higher than in mineral dust from northern Africa (Formenti et al., 2014), compare well with the value (3.4) reported by Caponi et al. (2017) for mineral dust aerosols generated in a laboratory experiment from a soil collected to the north-east of HBAO. The average Fe ∕ Al ratio was 0.74 ± 0.19 in 2016 and 0.76 ± 0.18 in 2017 (0.8 ± 0.3 for the PMF solution), lower than the ratio of 1 reported by Eltayeb et al. (1993). The same is observed for the Ti ∕ Al ratio, which was 0.07 ± 0.22 in 2016 and 0.06 ± 0.03 in 2017 (0.08 ± 0.01 in the PMF solution) but approximately 0.15 in Eltayeb et al. (1993).
Table 3Annual arithmetic mean mass ratios of mineral dust tracers with respect to Al for 2016 and 2017. The Pearson coefficient of the linear regression (R2) is reported. Mass ratios for previous publications are shown for comparison. Standard deviations are indicated as SD.
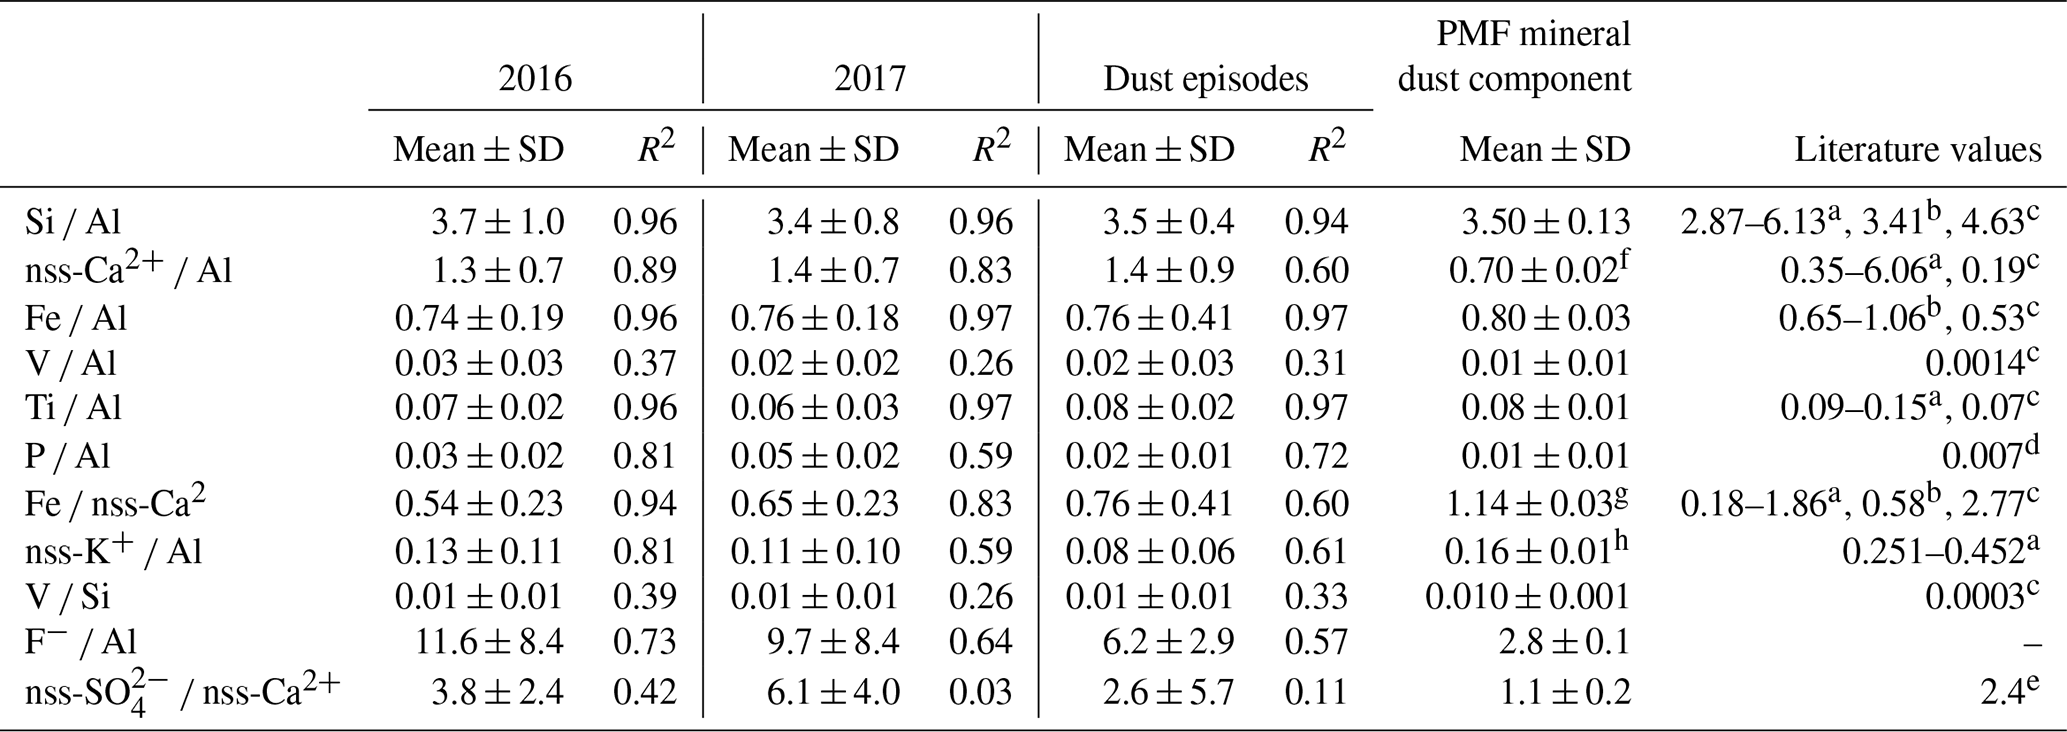
a Eltayeb et al. (1993) from various sites around the central Namib. b Annegarn et al. (1983): Gobabeb, Namibia. c Seinfeld and Pandis (2006): average chemical composition for soils globally. d Formenti et al. (2003a): Cape Verde region. e Mass ratio for gypsum. f Ca2+ ∕ Al ratio. g Fe ∕ Ca2+ ratio. h K+ ∕ Al ratio.
The average nss-Ca2+ ∕ Al ratio was 1.3 ± 0.7 in 2016 and 1.4±0.7 in 2017; however, for the strongest dust episodes (Al values higher than 1 µg m−3), the ratio tended to 1 (Fig. 7). This is in agreement with the specific mineralogy of Namibian soils that are rich in limestone and gypsum (Annegarn et al., 1983; Eltayeb et al., 1993). The PMF analysis attributed 40.5 ± 0.6 % of the total Ca2+ mass to the mineral dust component, of the same order of magnitude as obtained from the chemical apportionment (nss fraction representing 47 % of the total −Ca2+). The SO ∕ Ca2+ mass ratio in the PMF mineral dust was 1.1±0.2, 3 to 4 times lower than the nss-SO ∕ nss-Ca2+ obtained from chemical apportionment and about half the mass ratio for gypsum, which, however, coincided well with the mass ratio obtained when selecting the dust episodes only. The mean Fe ∕ nss-Ca2+ ratio was 0.54 ± 0.23 in 2016 and 0.65 ± 0.23 in 2017, higher than the value of 0.11 ± 0.10 reported by Caponi et al. (2017), pointing to the diversity in soil mineralogy, even at relatively small spatial scales.
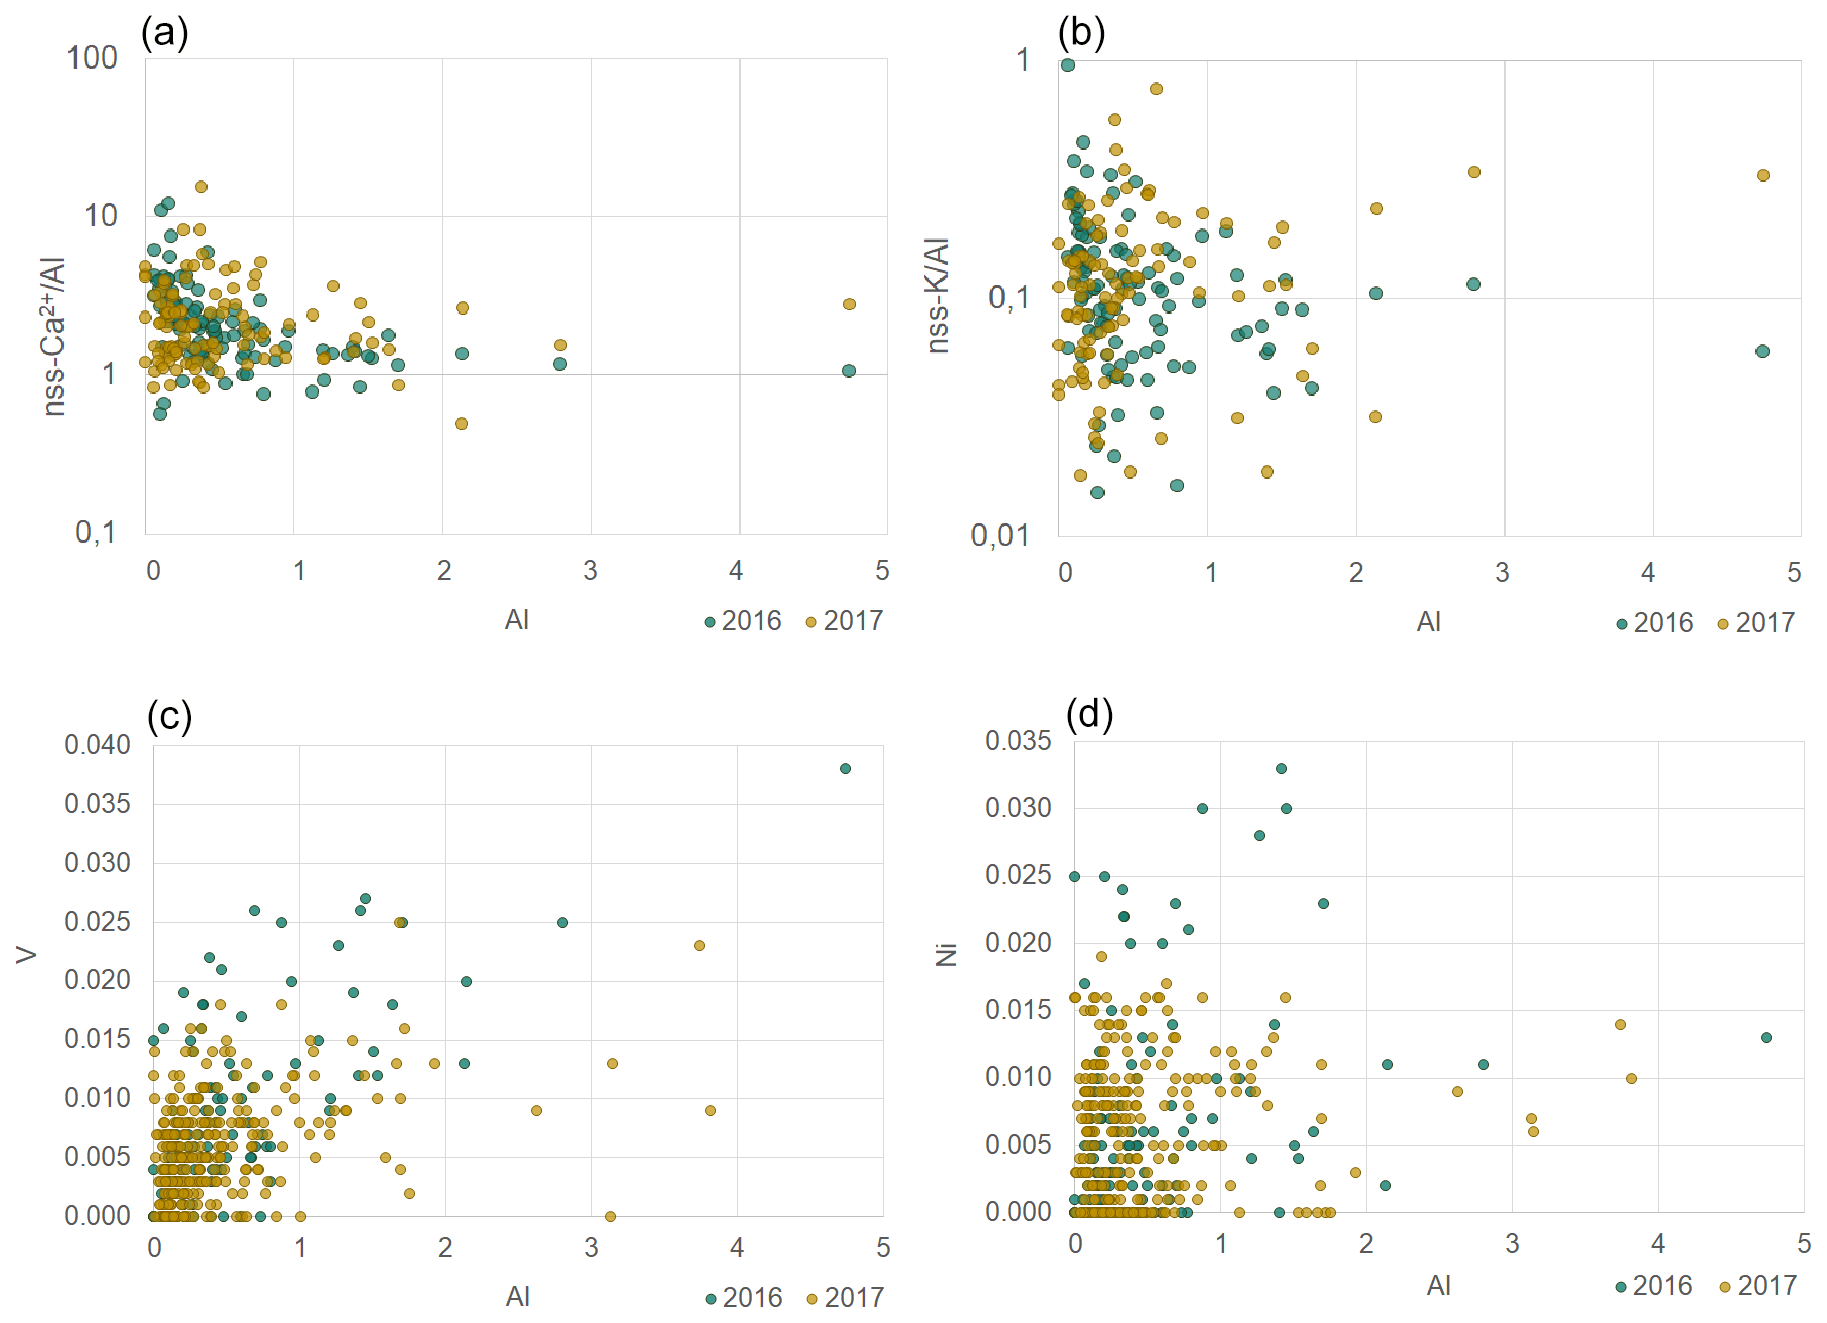
Figure 7Scatterplots of nss-Ca2+ ∕ Al (a), nss-K+ ∕ Al (b), V (c) and Ni (d) ratios to Al for 2016 (blue) and 2017 (orange). Concentrations are expressed in µg m−3. Note the logarithmic y axes in the top plots.
As for nss-Ca2+, values for nss-K+ ∕ Al ratios (Fig. 7) were spread but ranged between 0.1 and 0.5 when Al concentrations exceeded 1 µg m−3. These values are in agreement with those for mineral dust sources in northern Africa (Formenti et al., 2014). The PMF K+ ∕ Al mass ratio was 0.16 ± 0.01, in good agreement with the average nss-K+ ∕ Al (0.13 ± 0.12) by chemical apportionment and half of that reported in the literature (0.25–0.45, Eltayeb et al., 1993).
The average phosphorus concentrations measured at HBAO were 11 ± 9 ng m−3 in 2016 and 14 ± 4 ng m−3 in 2017. Phosphorous was very well correlated with Al in 2016 (R2=0.92) and only moderately correlated in 2017 (R2=0.66). The P ∕ Al mass ratio annual average was 0.03 ± 0.02 in 2016 and 0.05 ± 0.02 in 2017 (0.01 ± 0.01 in the PMF mineral dust). As was observed for the nss-Ca2+ ∕ Al, the P ∕ Al ratio tended to an asymptotic value of 0.02 when Al exceeded 1 µg m−3 (not shown). The PMF result is closer to that reported by Formenti et al. (2003a) for the outflow of Saharan dust to the North Atlantic Ocean (0.0070±0.0004).
4.2.3 Heavy metals
The PMF identified two components characterised by heavy metals, a fugitive dust component (traced by V, Cd, Pb, Nd and Sr) and an industry component, characterised by As, Zn, Cu, Ni and Sr, representing 2.6 (±0.2 %) and 0.9 (±0.7 %) of the total estimated mass.
Vanadium and nickel are naturally occurring in mineral deposits in soils (Annegarn et al., 1983; Maier et al., 2013), but they are also known tracers of heavy-oil combustion, as reported in Becagli et al. (2017) and references therein. Their average concentrations at HBAO were 9 ± 5 ng m−3 (2016) and 7 ± 6 ng m−3 (2017) for V and 8 ± 7 ng m−3 (2016) and 7 ± 4 ng m−3 (2017) for Ni. The highest V concentrations corresponded to south-south-easterly winds, while high Ni concentrations were measured in the south-westerly wind sector (Fig. S4). The annual mean values of V and Ni at HBAO are an order of magnitude larger than measured over the open ocean by Chance et al. (2015), higher than those reported by Hedberg et al. (2005) at towns affected by copper smelters, and comparable to those measured by Isakson et al. (2001) at a Swedish harbour and by Becagli et al. (2017) in the central Mediterranean Sea downwind of a major shipping route.
Vanadium was well correlated with Al when Al exceeded 1 µg m−3 (R2 around 0.4), whereas no correlation between Ni and Al was observed (Fig. 7). Additionally, the correlation of V with Si, also used in the literature as a tracer of mineral dust, was evident while moderate (R2 around 0.4), and no correlation was found for Ni. This differs from what was reported by Becagli et al. (2017), who found that neither V nor Ni was correlated with Si. In our dataset and the PMF mineral dust component (Sect. 4.2.2), both V ∕ Si and Ni ∕ Si ratios were enriched by a factor of 10 or more to reference values for the upper continental crust ( and for V ∕ Si and Ni ∕ Si, respectively; Henderson and Henderson, 2009). The V ∕ Ni mass ratio was 1.7 ± 1.1 for 2016 and 1.3±1.3 in 2017, lower than reported by Lyyränen et al. (1999) and Corbin et al. (2018) for heavy fuel oil in diesel engines and by Becagli et al. (2017) and Viana et al. (2009) in the Mediterranean basin ambient air (2.8–2.9 and 4–5, respectively).
All these elements, and furthermore their poor correlation (R2 around 0.3), suggest that V and Ni do not necessarily have the same sources. Mining activities, likely in the Otavi mountain area (Boni et al., 2007), should account for the high concentrations of V, with additional contributions from heavy-oil combustion, where V is present as an impurity (Isakson et al., 2001, and references therein; Vouk and Piver, 1983). By contrast, combustion of heavy oils seems to be the primary source of Ni.
This hypothesis is supported by the PMF analysis. The PMF apportionment of V and Ni concentrations (Fig. S5) clearly distinguishes the relative source contributions and preferentially associates V with the mineral dust and fugitive dust components but Ni with the industry component.
Moderate to good correlations of V and Ni with Zn (R2 of 0.42 and 0.55, respectively), Cu (0.55 and 0.73) and Pb (0.56 and 0.69) were observed in the dataset. Zn and Pb are found as impurities in bulk fuels for ships (Isakson et al., 2001) and also from copper smelting, as reported in central Chile (Hedberg et al., 2005) and urban air in the United States of America (Ramadan et al., 2000). The mean concentration of Zn at HBAO (11 ± 9 ng m−3) was about 2 orders of magnitude higher than over the south-eastern Atlantic Ocean (Chance et al., 2015) and in air over the arid landscapes (Annegarn et al., 1983). Likewise, the mean Pb concentration (75±89 ng m−3) was 3 orders of magnitude higher than reported by Chance et al. (2015) for soluble Pb and comparable to values measured in the western Mediterranean by Denjean et al. (2016). The PMF separates the largest fractions of Zn and Pb into the industry and fugitive dust components, respectively. Although some of these heavy metals may be sourced from the commercial shipping route offshore, the mass ratios for tracer elements were not in agreement with our results, and so we cannot conclusively name shipping heavy-oil combustion as the source of these heavy metals.
Average concentrations of Cu at HBAO were 8 ± 6 ng m−3, an order of magnitude higher than measured in windblown dust by Annegarn et al. (1983) in the central Namib but 2 orders of magnitude smaller than the average measured by Lee et al. (1999) in highly polluted Hong Kong (125.1 ng m−3). Ettler et al. (2011) showed that copper ore mining and smelting operations in the Zambian copper belt are a significant source of potentially bioavailable copper that, unlike phosphorus, has been found to inhibit plankton growth in laboratory studies (Paytan et al., 2009) and over the western Mediterranean (Jordi et al., 2012). Similar contamination of topsoil was found by Kříbek et al. (2018) at operations in the Tsumeb mining district, Namibia (19∘14′ S, 17∘43′ E). Average Cu concentrations were comparable to values of 4.9 ± 11.5 ng m−3 reported for a town closer to smelters in Chile and an order of magnitude smaller than in the urban environment of the capital city of Santiago (77.5 ± 78.2 ng m−3; Hedberg et al., 2005). The Cu ∕ Ni ratio (1.24 ± 0.20) in the PMF fugitive dust component was about half that reported for soil samples polluted by copper mine tailings from the Gruben River valley (2.03 ± 2.30, Taylor and Kesterton, 2002).
The mean mass concentration of Cd was 1502 ± 1458 ng m−3 in 2016 and 219 ± 163 ng m−3 in 2017. The difference is mainly due to high concentrations in October of 2016 which coincided with high concentrations in all other heavy metals, except for As. Cd concentrations in 2016 were less than that reported for airborne road dust (7.4 ± 7.8 µg m−3), and our 2017 concentrations were of the order of that measured in ambient air (0.14 ± 0.04 µg m−3) in the seaside city of Khobar, Saudi Arabia (El-Sergany and El-Sharkawy, 2011). The Cd ∕ Pb ratio of 9.96 ± 0.21 for the PMF fugitive dust component was slightly higher than 7.14 ± 4.26 in the ambient air of the coastal desert environment in Khobar (El-Sergany and El-Sharkawy, 2011). The correlation of Pb, Nd, Sr in the fugitive dust component may indicate contributions of non-micaceous kimberlites from a variety of source regions across southern Africa (Smith, 1983). The Sr ∕ Nd ratio for the fugitive dust component (3.58) was close to the 3.35 reported for kimberlites at Uintjiesberg in the Northern Cape of South Africa.
4.2.4 Fluoride
One of the striking features of Table 1 is the high mean concentration of F− measured at HBAO (4.3 ± 4.0 µg m−3 in 2016 and 2.8 ± 2.5 µg m−3 in 2017), with peak values as high as 25 µg m−3. Those annual mean concentrations were comparable to the mean 24 h fluoride concentrations measured between 1985 and 1990 over the South African Highveld by Scheifinger and Held (1997). The measured concentrations at HBAO were also comparable to those of heavily polluted areas in China (Feng et al., 2003) and significantly higher than reported for Europe, even in the polluted Venice lagoon (Prodi et al., 2009) or in areas nearby ceramic and glass factories (Calastrini et al., 1998). The peak values at HBAO were significantly higher than maxima reported by these authors and ranging between 1.4 and 2.9 µg m−3. The highest F− concentrations were associated with southerly to easterly winds, that is, from the subcontinent (not shown). The very good correlation of F− with nss-Ca2+, shown in Fig. S6 (R2 equal to 0.76 in 2016 and to 0.84 in 2017), yielded a mean mass ratio of 6.4 and 5.8, respectively, much higher than reported in groundwater, aerosols or precipitation in polluted environments (Feng et al., 2003; Prodi et al., 2009).
The strong relationship with nss-Ca2+ (and a posteriori with Ca2+) drove the PMF apportionment (Fig. S7), which attributed approximately 94 % of the F− mass concentrations to the sea salt and mineral dust components (55.1 ± 1.9 % and 38.8 ± 1.1 %, respectively) and the remaining 6 % to fugitive dust (2.3 ± 0.5 %) and industry (3.8 ± 1.0 %). Possible sources are the emission of fugitive dust during fluorspar mining of carbonatite-related fluorspar deposits at the Okorusu Mine (20∘3′ S, 16∘44′ E) but very likely also the periodic surface mining occurring approximately 20 km south of HBAO to provide gravel for the construction of a major road between Swakopmund and Henties Bay which started late in 2015 (Andreas Namwoonde, personal communication, 2017). The evaporation of fluoride-rich water, leached into groundwater (Wanke et al., 2015, 2017) from fluoride-rich mineral deposits and soils throughout the region and in the coastal waters (Compton and Bergh, 2016; Mänd et al., 2018), would also increase atmospheric F− concentrations. In an analysis of borehole water in Namibia, roughly 80 % of those sites surveyed were deemed unsafe to drink as a direct result of high fluoride concentrations (Christelis and Struckmeier, 2011).
4.2.5 Arsenic
The annual mean of the arsenic concentrations at HBAO was 22 ± 16 ng m−3 in 2016 and 239 ± 344 ng m−3 in 2017. The mean for 2017 is skewed due to two sampling weeks with very high concentrations in the order of those measured in rural and urban-industrial areas affected by mining and smelting emission sources (Hedberg et al., 2005; Šerbula et al., 2010).
The PMF analysis exclusively associated As the industry component along with large fractions of the Zn, Cu, Ni, Sr and Co. Known sources of atmospheric arsenic are biomass burning, heavy-oil combustion and non-ferrous metal smelting operations (Ahoulé et al., 2015; Gomez-Caminero et al., 2001). A possible local source could be the Tsumeb smelter to the north-east of HBAO (KPMG, 2014).
The PMF As ∕ Zn, As ∕ Pb and Zn ∕ Pb ratios were 9.0 ± 0.3, 6.4 ± 0.8 and 0.7 ± 0.1, in good agreement with those reported by Hedberg et al. (2005) for a copper smelter plume in Chile (7.7, 4.5 and 0.6, respectively). This is in good agreement with the fact that no correlations between As and Al or nss-Ca2+ were found, ruling out any major contribution of inorganic arsenic in geologic formations released from mining operations or evaporated from soil and groundwater (Gomez-Caminero et al., 2001). Likewise, no discernible correlation between As and MSA was found, suggesting only a minor release of arsenic by marine algae and plankton (Sanders and Windom, 1980; Shibata et al., 1996).
4.2.6 Secondary aerosols and sulfate
The PMF ammonium neutralised (Fig. 6) comprised secondary species such as by SO, NH, MSA, oxalate, and nitrate, which accounted for 6.1 ± 0.7 % of the estimated aerosol mass.
The annual mean sulfate concentration measured at HBAO was 4.1 ± 2.6 µg m−3 in 2016 and 3.4 ± 1.4 µg m−3 in 2017 (Table 4), higher than previously measured over the southern Atlantic and Pacific oceans (Zhang et al., 2010) and comparable to springtime measurements in the Venice lagoon (Prodi et al., 2009). As already discussed in Formenti et al. (2019), the highest concentrations were measured in spring and autumn, while minima occurred between May and August. SO and Na+ showed good correlation (R2=0.92 in 2016 and 0.83 in 2017, Table 2). However, their annual mass ratios (0.36±0.14 and 0.42 ± 0.23 in 2016 and 2017, respectively) were higher than the expected mass ratio in seawater (0.25; Seinfeld and Pandis, 2006), which was used as a nominal reference to apportion SO into its ss and nss fractions. As a result, up to 57 % of the measured SO mass concentration in the PM10 fraction was attributed to sea salt aerosols, while the nss component was of the order of 43 %. The PMF estimated that the sea salt component contributed 66.6 ± 0.4 % of the total sulfate mass. This is in agreement with previous observations in the South Atlantic Ocean (Andreae et al., 1995; Zhang et al., 2010; Zorn et al., 2008). By contrast, at the remote Brand se Baai site along the Atlantic coast of South Africa (31.5∘ S, 18∘ E), Formenti et al. (1999) reported that sea salt accounted for about 92 % of the total measured elemental sulfur concentrations.
Table 4Reported concentrations for marine biogenic and secondary aerosols for different locations, and especially in the Southern Hemisphere. Concentrations are in µg m−3 unless stated otherwise.
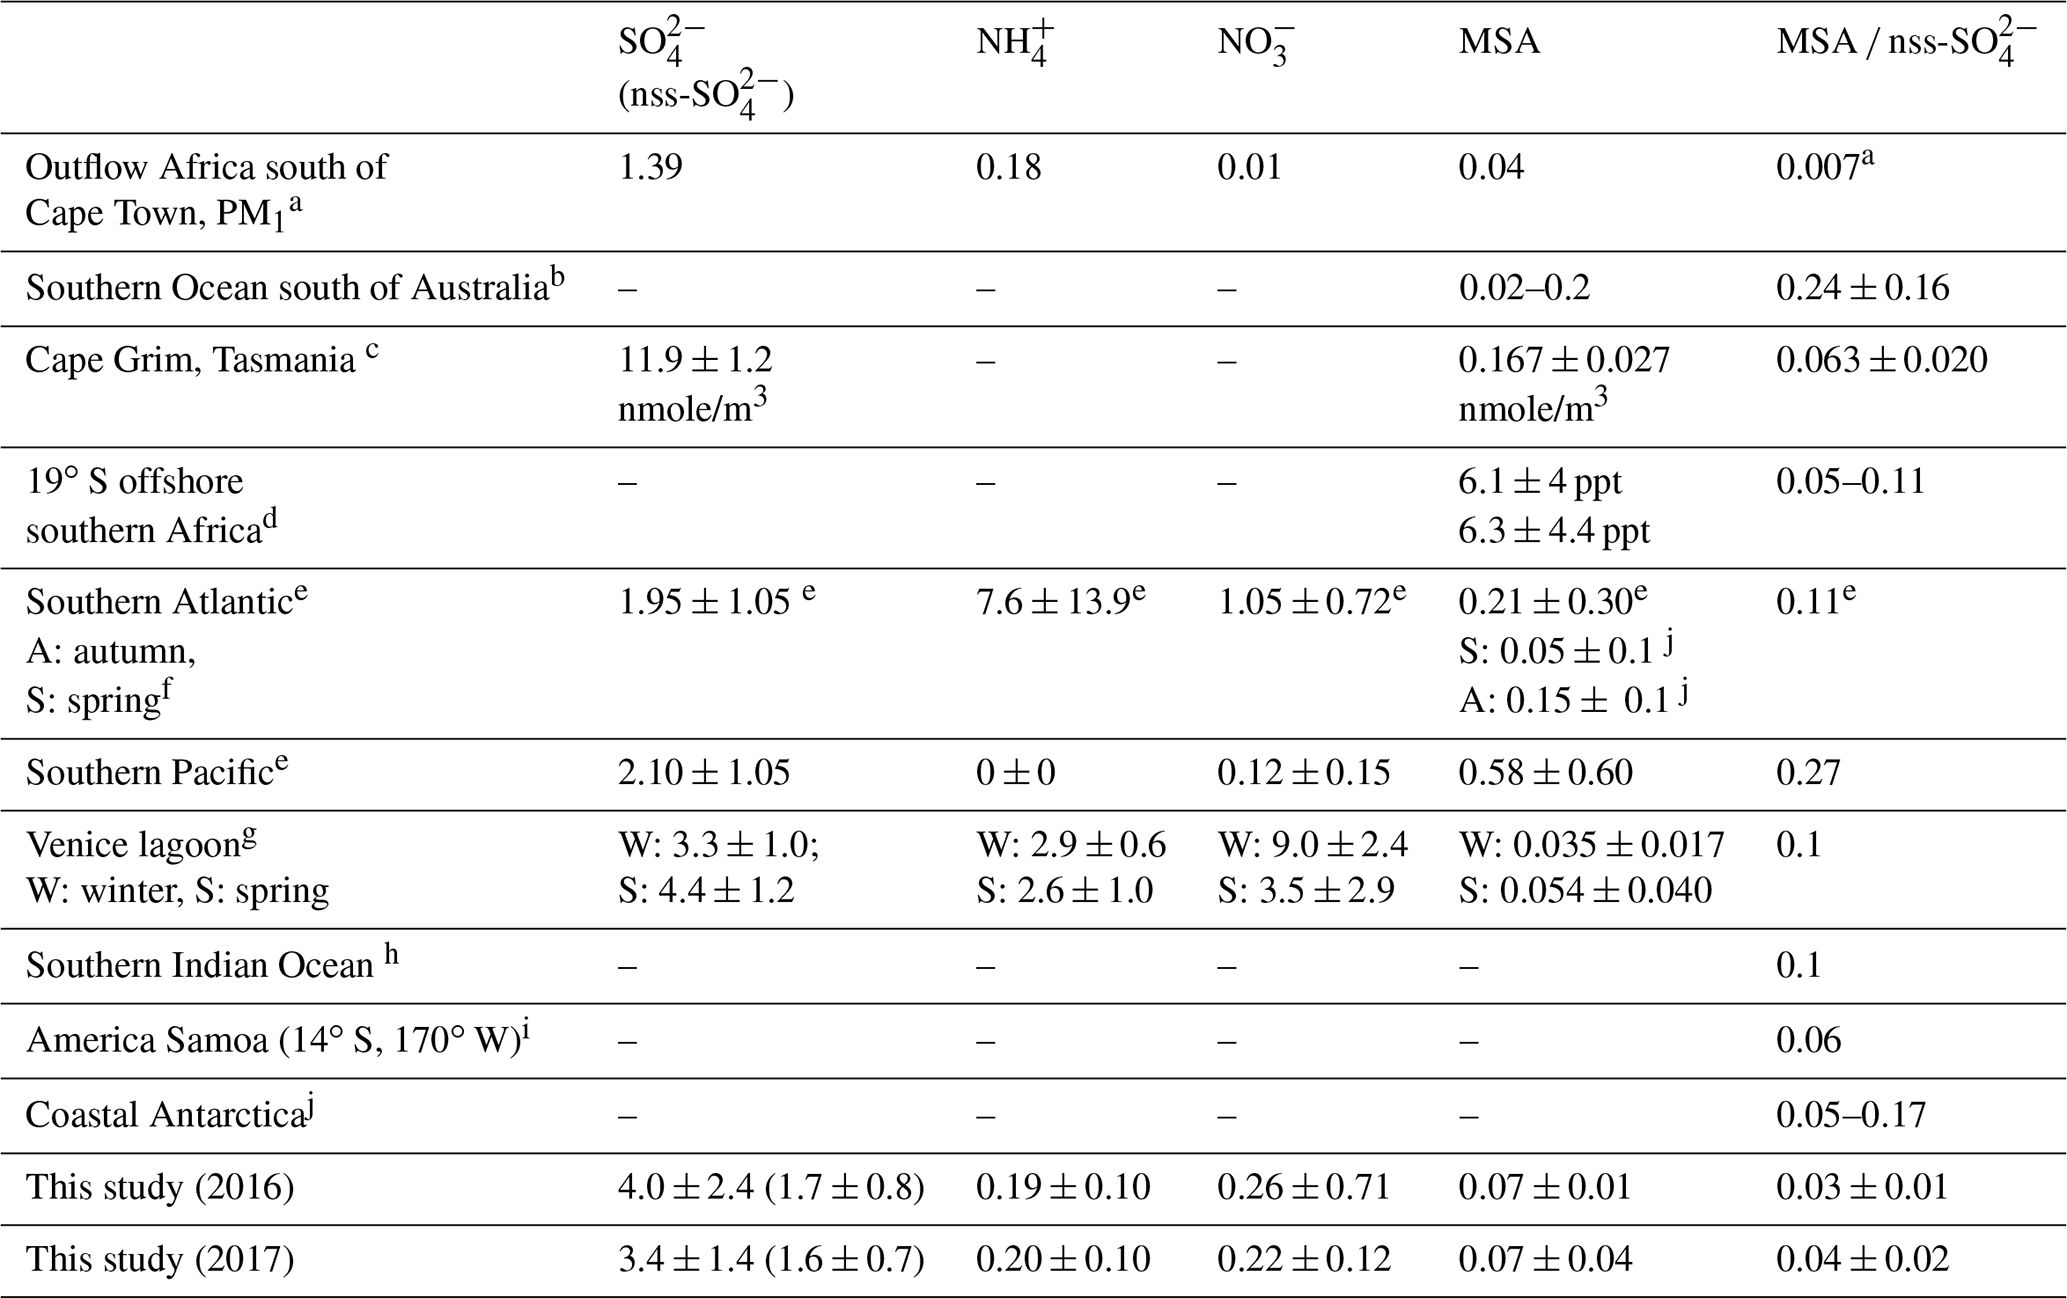
a Zorn et al. (2008); PM1 fraction, calculated with respect to total sulfate. b Quinn et al. (1998). c Ayers et al. (1986). d Andreae et al. (1995). e Zhang et al. (2010); total suspended particulate fraction. f Huang et al. (2017). g Prodi et al. (2009). h Sciare et al. (2000). i Savoie et al. (1994). j Chen et al. (2012).
The MSA concentrations measured at the site ranged between 10 and 230 ng m−3 (Table 1). The mean annual concentration was 63 ± 39 ng m−3, 3 times higher than the mean value of 20 ± 20 ng m−3 (6.2 ± 4.2 ppt) reported by Andreae et al. (1995) over the open ocean along 19∘ S and lower than in the south-eastern Atlantic Ocean (Zhang et al., 2010; Table 4). As already described in Formenti et al. (2019), the MSA concentrations were higher in the austral summer and spring and lower in the austral winter. DMS is more efficiently oxidised in warmer conditions (Ayers et al., 1986; Huang et al., 2017), which explains the higher daytime mean concentrations of marine biogenic products (MSA and nss-SO and lower means at night and in the winter. Springtime averages for MSA were in the range of that measured by Huang et al. (2017) during a springtime cruise over the South Atlantic and by Prodi et al. (2009) in the Venice lagoon (Table 4). The mismatch of seasonality with respect to that of the phytoplankton blooms (Louw et al., 2016) has already been discussed by Formenti et al. (2019) and attributed to the spread of blooms in the BUS region depending on local conditions.
The MSA ∕ nss-SO ratio (Fig. 8) displayed a large range of values (0.01 to 0.12), consistent with that reported in the literature at various geographical locations, especially in the Southern Hemisphere (Table 4). The MSA ∕ SO mass ratio for the PMF component (0.04 ± 0.01) was in agreement with the MSA ∕ nss-SO from the chemical apportionment reported in Table 4. The strong seasonal dependence of MSA ∕ nss-SO is in agreement with that identified by Ayers et al. (1986) for marine biogenic sulfur in the Southern Hemisphere and suggests that the highest concentrations of nss-SO in the PM10 (nss-SO larger than 2 µg m−3) are not necessarily associated with marine biogenic emissions. From measurements at the desert station of Gobabeb, in the Namib Desert, Annegarn et al. (1983) found that only the fine mode of the bimodal distribution of sulfur aerosols, that is, that bearing the lower mass concentrations, would be due to the oxidation of sulfur-containing gaseous emissions during the marine phytoplankton life cycle.
Figure 8 illustrates the NH ∕ nss-SO mass ratio as a function of nss-SO mass concentrations. In both 2016 and 2017, the NH ∕ nss-SO mass ratios were less variable than for MSA ∕ nss-SO. The annual mean NH ∕ nss-SO were 0.13 ± 0.10 in 2016, 0.14±0.08 in 2017, and 0.15 ± 0.01 in 2017. These values are consistent with the mass ratio of 0.18 corresponding to ammonium bisulfate ((NH4)HSO4). Although some losses of NH due to conservation on site and transport to the laboratory in France cannot be excluded, the measured ratios are consistent with previous investigations in remote marine environments reported in Table 4, including offshore southern Africa (Andreae et al., 1995; Quinn et al., 1998).
The average NO ∕ nss-SO ratio at HBAO was of the order of 0.14, significantly smaller than reported by Zhang et al. (2010) over the south-eastern Atlantic. Poor correlation between nss-SO and nss-Ca2+ (not shown) suggests that very little of the sulfate is present as CaSO4, either formed by heterogeneous deposition of SO2 on calcite mineral particles or liberated from the soils as mineral gypsum (Annegarn et al., 1983).
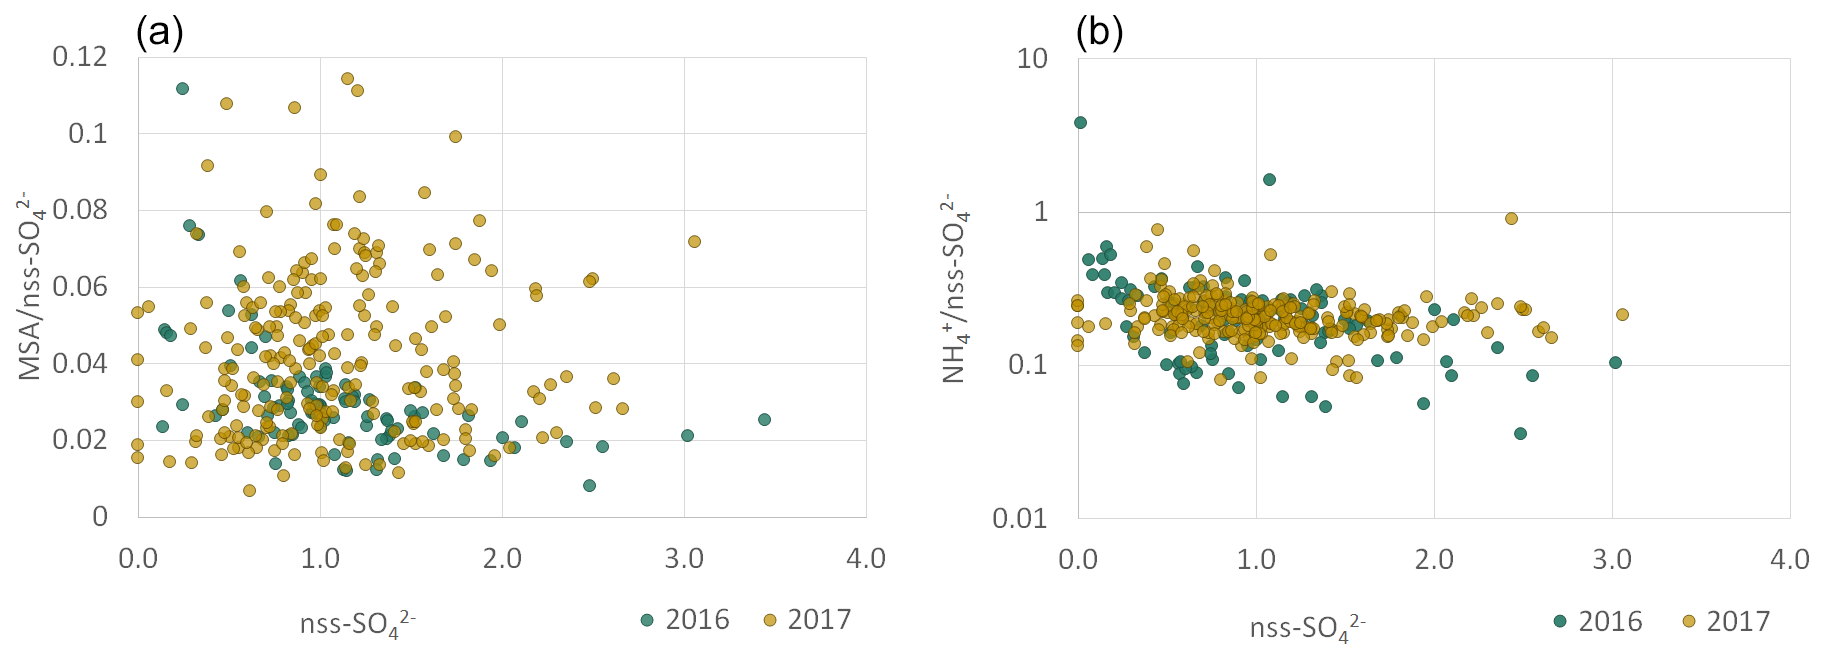
Figure 8Scatterplots for ratios of MSA (a) and NH (b) to nss-SO for 2016 (blue) and 2017 (orange). Concentrations are expressed in µg m−3. Note the logarithmic y axis of the figure in (b).
Finally, the mean annual concentration of oxalate at HBAO was 72 ± 80 ng m−3 in 2016 and 141 ± 50 ng m−3 in 2017. Values at HBAO are consistent with those reported by Zhang et al. (2010) over the south-eastern Atlantic (200 ± 140 ng m−3). Oxalate aerosols in the atmosphere are due to marine biogenic activity and anthropogenic emissions including heavy-oil combustion and biomass burning (Gillett et al., 2007, and references therein). They are also formed by in-cloud processes and oxidation of gaseous precursors followed by condensation (Baboukas et al., 2000). The moderate correlation with NO, nss-SO, and nss-K+, particularly in 2017, could suggest a common origin and possible influence of occasional biomass burning.
This paper presented the first long-term characterisation of the elemental and ionic composition of atmospheric aerosols and the source apportionment of the PM10 mass fraction at the Henties Bay Aerosol Observatory on the western coast of southern Africa, an under-explored region of the world to date.
The study was based on semi-continuous filter sampling at the HBAO site in Namibia in 2016 and 2017, laboratory analysis of the collected samples by X-ray fluorescence and ion chromatography, and PMF apportionment, supported by back-trajectory calculations and the analysis of local winds.
Trajectory analysis for the sampling period from 2016 to 2017 shows four distinct patterns of atmospheric transport to HBAO. Two transport pathways are from the South Atlantic Ocean, directly from the east and the south and south-east. A third transport pathway shows air masses reaching Henties Bay from the north-west. This pathway will likely include constituents that originated over the continent. The fourth more common transport pathway is from central southern Africa. Local wind circulation is influenced by the overlying synoptic circulation patterns as well as local sea-breeze mechanisms. Surface flow to HBAO is predominantly from the south and south-west. South-westerly flow is likely to be linked to sea-breeze circulation as a result of thermal gradients in the daytime between the arid surfaces and the ocean. Land and sea breezes are not common at HBAO due to a weak thermal gradient at night between the ocean and the desert surface.
In general terms, the results presented in this paper are in agreement with the expectations for remote marine regions of the world and previous observations in the area (Andreae et al., 1995; Zhang et al., 2010). Chemical and PMF apportionments showed that the PM10 aerosol load is dominated by natural species such as sea salt, mineral dust, and marine biogenic emissions, accounting for more than 90 % of the mass. As a consequence of the proximity to the seashore of the HBAO sampling station, the majority of the PM10 mass concentration (around 75 %) is due to sea spray, which is persistent at the diurnal and seasonal timescales.
Our analysis provides for the first time investigation of the frequency, intensity, and elemental composition of Namibian mineral dust aerosols. Nineteen episodes of increased Al and nss-Ca2+ concentrations, lasting from 1 to a maximum of 4 d, were detected during the entire sampling period. This corresponds well to the frequency of emission of dust plumes from river valleys, coastal sabkhas, and paleo-lacustrine sources (Etosha and Makgadikgadi pans) observed by various authors (Eckardt and Kuring, 2005; Vickery et al., 2013; Dansie et al., 2017). Our data series does not show any particular time dependence of the frequency or duration of the detected episodes. This is in contrast with the observation by Dansie et al. (2017), that windblown dust derived from the ephemeral river valleys is transported offshore during large easterly wind events, and indicative of the fact that HBAO is the receptor of mineral dust emitted by various sources.
One of the striking findings of this paper was the level of anthropogenic contamination and the concentrations of various pollutants, including heavy metals and fluoride. Formenti et al. (2018) already demonstrated a seasonal increase in the light-absorbing carbon particulate between May and late July, indicative of the surface transport of biomass burning aerosols, and episodically throughout the year, attributed to pollution by ship traffic along the Cape of Good Hope sea route.
While the coarse resolution of air mass back trajectories and the dominance of marine air masses does not allow to distinguish sources at the country scale, the PMF analysis performed in this paper was able to identify the specific and distinct contribution of mining activities, including for road construction for the majority of the heavy metals (for example V). Our results shown that mining activities severely affect the air quality and contribute to concentrations as high as, or even higher than in well-known polluted regions of the world, such as the Venice lagoon (Prodi et al., 2009). The persistence of these high concentrations over the 2 years of sampling is extremely worrying for the affected populations and needs to be addressed by dedicated investigations and decision-making procedures. We suspect that some of that contamination, contributing to the highest heavy metal concentrations in October 2016, might be due to fugitive dust released by the major road construction between Walvis Bay, past Henties Bay and towards Angola that started in the second half of 2016. Having said this, that specific week discarded, there is no significant difference between the concentration levels in 2016 (before road works) and 2017 (during the road works), suggesting that the pollution by heavy metals is a specific feature in the region, with likely implications on weather and climate. One such effect could be the deposition of these metals in the ocean. The deposition of macronutrients (P, Fe) from the outflow of mineral dust is not expected to be relevant for the BUS region, one of the most productive marine environments in the world, while it could be important in fertilising waters near the coast (Dansie et al., 2017) and in the Southern Ocean (Okin et al., 2011). On the other hand, the atmospheric deposition of trace metals (Cr, Cu, Ni, Mn, or Zn) in the aerosols, which play a biological role in enzymes and as structural elements in proteins (Morel and Price, 2003), could affect the marine productivity of the BUS and should be explored in future work. The complexity and diversity of sources, which might contribute to the aerosol population at HBAO, deserve further dedicated investigation.
The long-term time series of aerosol composition at HBAO also provides new and important insights into the contribution of marine emission to the regional aerosol load. Our sampling provides the first long-term measurements of the mass concentrations of MSA in the South Atlantic, and the apportionment of sulfate aerosols, which are important for light scattering and cloud formation. Our data show that sea salt contributes, on average, to around 57 % of the total sulfate mass. The non-sea salt fraction (nss-SO), of the order of 43 %, is partly attributed to the oxidation of sulfur-containing gaseous emissions (DMS, SO2, H2S) during the marine phytoplankton life cycle, likely favoured by night-time fog and overall elevated relative humidity, typical along the coast. However, nss-SO mass concentrations over 2 µg m−3 could be contributed by heavy-oil combustion by commercial ships and industrial processes such as power generation or copper smelting, as well as by episodic biomass burning. Ammonium bisulfate ((NH4)HSO4) was found to be the predominant sulfate forms at HBAO, where, incidentally, we observed dramatic rusting and corrosion of materials through the years. The ongoing data analysis of the AEROCLO-sA field campaign will provide with further insights on the size-dependent apportionment, chemical composition and hygroscopicity of sulfate aerosols, and its relevance as cloud condensation nuclei.
Original and analysed data can be obtained by email request to the corresponding author. The SplitR package is found in Iannone (2020, https://github.com/rich-iannone/splitr). The openair package for R is found in Carslaw and Ropkins (2017). The EPA (Environmental Protection Agency) PMF version 5.0 software is available from https://www.epa.gov/air-research/positive-matrix-factorization-model-environmental-data-analyses (EPA, 2020). The NOAA Air Resources Laboratory (ARL) provides the HYSPLIT transport and dispersion model and/or READY website (https://www.ready.noaa.gov/HYSPLIT.php, NOAA, 2020).
The supplement related to this article is available online at: https://doi.org/10.5194/acp-20-15811-2020-supplement.
DK, PF, SJP, AN, MC, CG and AF performed the filter sampling and operated the wind sensor. PH, SC, FL, CMB, ST, and ZZ performed the XRF and IC analysis of the collected samples. DK performed the back-trajectory calculations, analysis of wind data and PMF. DK and PF analysed the results and integration of the dataset. DK and PF wrote the paper with contributions of SJP, SC and ST and comments from all the co-authors.
Paola Formenti is guest editor for the ACP Special Issue “New observations and related modelling studies of the aerosol–cloud–climate system in the Southeast Atlantic and southern Africa regions”. The remaining authors declare that they have no conflicts of interests.
This article is part of the special issue “New observations and related modelling studies of the aerosol–cloud–climate system in the Southeast Atlantic and southern Africa regions (ACP/AMT inter-journal SI)”. It is not associated with a conference.
Danitza Klopper is grateful for the financial support of the Climatology Research Group of North-West University and the travel scholarship of the French Embassy in South Africa (internship at LISA in summer 2018). The authors are grateful to the NOAA Air Resources Laboratory (ARL) for the provision of the HYSPLIT transport and dispersion model and/or READY website (https://www.ready.noaa.gov/index.php, last access: 17 December 2020) used in this publication. The authors thank the two anonymous referees whose comments significantly improved the paper.
This work has received funding by the French Centre National de la Recherche Scientifique (CNRS) and the South African National Research Foundation (NRF) through the “Groupement de Recherche Internationale Atmospheric Research in southern Africa and the Indian Ocean” (GDRI-ARSAIO) and the Project International de Coopération Scientifique (PICS) “Long-term observations of aerosol properties in Southern Africa” (contract no. 260888) as well as by the Partenariats Hubert Curien (PHC) PROTEA funded in France by the French Ministry of Europe and Foreign Affairs (MEAE), supported by the French Ministry of High Education, Research and Innovation (MESRI), and in South Africa by the National Research Foundation.
This paper was edited by Frank Eckardt and reviewed by two anonymous referees.
Adebiyi, A. A. and Zuidema, P.: The role of the southern African easterly jet in modifying the southeast Atlantic aerosol and cloud environments, Q. J. Roy. Meteor. Soc., 142, 1574–1589, https://doi.org/10.1002/qj.2765, 2016.
Ahoulé, D. G., Lalanne, F., Mendret, J., Brosillon, S., and Maïga, A. H.: Arsenic in African Waters: A Review, Water. Air. Soil Pollut., 226, 302, https://doi.org/10.1007/s11270-015-2558-4, 2015.
Andreae, T. W., Andreae, M. O., and Schebenske, G.: Biogenic sulfur emissions and aerosols over the tropical South Atlantic 1. Dimethylsulfide in seawater and in the atmospheric boundary layer, J. Geophys. Res., 99, 22819–22829, https://doi.org/10.1029/94JD01837, 1994.
Andreae, M. O., Elbert, W., and de Mora, S. J.: Biogenic sulfur emissions and aerosols over the tropical South Atlantic: Atmospheric dimethylsulfide, aerosols and cloud condensation nuclei, J. Geophys. Res.-Atmos., 100, 11335–11356, https://doi.org/10.1029/94JD02828, 1995.
Andreae, M. O., Andreae, T. W., Annegarn, H., Beer, J., Cachier, H., Canut, P., Elbert, W., Maenhaut, W., Salma, I., Wienhold, F. G., Zenker, T., and Planck, M.: Airborne studies of aerosol emissions from savanna fires in southern Africa: 2. Aerosol chemical composition, J. Geophys. Res., 103, 119–128, https://doi.org/10.1029/98JD02280, 1998.
Andreae, M. O. and Merlet, P.: Emission of trace gases and aerosols from biomass burning, Global Biogeochem. Cy., 15, 955–966, https://doi.org/10.1029/2000GB001382, 2001.
Annegarn, H. J., van Grieken, R. E., Bibby, D. M., and von Blottnitz, F.: Background Aerosol Composition in the Namib Desert, South West Africa (Namibia), Atmos. Environ., 17, 2045–2053, https://doi.org/10.1016/0004-6981(83)90361-X, 1983.
Ayers, G. P., Ivey, J. P., and Goodman, H. S.: Sulfate and Methanesulfonate in the Maritime Aerosol at Cape Grim, Tasmania, J. Atmos. Chem., 4, 173–185, https://doi.org/10.1007/BF00053777, 1986.
Baboukas, E. D., Kanakidou, M., and Mihalopoulos, N.: Carboxylic acids in gas and particulate phase above the Atlantic Ocean, J. Geophys. Res., 105, 14459–14471, https://doi.org/10.1029/1999JD900977, 2000.
Becagli, S., Anello, F., Bommarito, C., Cassola, F., Calzolai, G., Di Iorio, T., di Sarra, A., Gómez-Amo, J.-L., Lucarelli, F., Marconi, M., Meloni, D., Monteleone, F., Nava, S., Pace, G., Severi, M., Sferlazzo, D. M., Traversi, R., and Udisti, R.: Constraining the ship contribution to the aerosol of the central Mediterranean, Atmos. Chem. Phys., 17, 2067–2084, https://doi.org/10.5194/acp-17-2067-2017, 2017.
Boni, M. Terracciano, R., Evans, N. J., Laukamp, C., Schneider, J., and Bechstädt, T.: Genesis of Vanadium Ores in the Otavi Mountainland, Namibia, Econ. Geol., 102, 441–469, https://doi.org/10.2113/gsecongeo.102.3.441, 2007.
Boucher, O.: Atmospheric Aerosols, Properties and Climate Impacts, Springer Netherlands, 311 pp., https://doi.org/10.1007/978-94-017-9649-1, 2015.
Calastrini, F., Del Carmine, P., Lucarelli, F., Mandò, P. A., Prati, P., and Zucchiatti, A.: External-beam PIGE for fluorine determination in atmospheric aerosol, Nucl. Instrum. Meth. B, 136–138, 975–980, https://doi.org/10.1016/S0168-583X(97)00750-7, 1998.
Caponi, L., Formenti, P., Massabó, D., Di Biagio, C., Cazaunau, M., Pangui, E., Chevaillier, S., Landrot, G., Andreae, M. O., Kandler, K., Piketh, S., Saeed, T., Seibert, D., Williams, E., Balkanski, Y., Prati, P., and Doussin, J.-F.: Spectral- and size-resolved mass absorption efficiency of mineral dust aerosols in the shortwave spectrum: a simulation chamber study, Atmos. Chem. Phys., 17, 7175–7191, https://doi.org/10.5194/acp-17-7175-2017, 2017.
Carslaw, D. and Ropkins, K.: Package “openair”: Tools for the Analysis of Air Pollution Data, available at: https://github.com/davidcarslaw/openair (last access: 10 December 2020), 2017.
Chance, R., Jickells, T. D., and Baker, A. R.: Atmospheric trace metal concentrations, solubility and deposition fluxes in remote marine air over the south-east Atlantic, Mar. Chem., 177, 1–12, https://doi.org/10.1016/j.marchem.2015.06.028, 2015.
Charlson, R. J., Lovelock, J. E., Andreae, M. O., and Warren, S. G.: Oceanic phytoplankton, atmospheric sulphur, cloud albedo and climate, Nature, 326, 655–661, https://doi.org/10.1038/326655a0, 1987.
Chen, L., Wang, J., Gao, Y., Xu, G., Yang, X., Lin, Q., and Zhang, Y.: Latitudinal distributions of atmospheric MSA and MSA/nss-SO ratios in summer over the high latitude regions of the Southern and Northern Hemispheres, J. Geophys. Res., 117, D10306, https://doi.org/10.1029/2011JD016559, 2012.
Christelis, G. and Struckmeier, W. (Eds.): Groundwater in Namibia, an explanation to the Hydrogeological Map, 2nd ed., Department of Water Affairs, Division Geohydrology, available at: https://www.deutsche-rohstoffagentur.de/EN/Themen/Wasser/Projekte/abgeschlossen/TZ/Namibia/groundwater_namibia.pdf?blob=publicationFile&v=3 (last access: 5 August 2020), 2011.
Cole, J. and Villacastin, C.: Sea surface temperature variability in the northern Benguela upwelling system, and implications for fisheries research, Int. J. Remote Sens., 21, 1597–1617, https://doi.org/10.1080/014311600209922, 2000.
Compton, J. S. and Bergh, E. W.: Phosphorite deposits on the Namibian shelf, Mar. Geol., 380, 290–314, https://doi.org/10.1016/j.margeo.2016.04.006, 2016.
Corbin, J. C., Mensah, A. A., Pieber, S. M., Orasche, J., Michalke, B., Zanatta, M., Czech, H., Massabò, D., Buatier de Mongeot, F., Mennucci, C., El Haddad, I., Kumar, N. K., Stengel, B., Huang, Y., Zimmermann, R., Prévôt, A. S. H., and Gysel, M.: Trace Metals in Soot and PM2.5 from Heavy-Fuel-Oil Combustion in a Marine Engine, Environ. Sci. Technol., 52, 6714–6722, https://doi.org/10.1021/acs.est.8b01764, 2018.
Dansie, A. P., Wiggs, G. F. S., Thomas, D. S. G., and Washington, R.: Measurements of windblown dust characteristics and ocean fertilization potential: The ephemeral river valleys of Namibia, Aeolian Res., 29, 30–41, https://doi.org/10.1016/j.aeolia.2017.08.002, 2017.
De Graaf, M., Bellouin, N., Tilstra, L. G., Haywood, J., and Stammes, P.: Aerosol direct radiative effect of smoke over clouds over the southeast Atlantic Ocean from 2006 to 2009, Geophys. Res. Lett., 41, 7723–7730, https://doi.org/10.1002/2014GL061103, 2014.
Denjean, C., Cassola, F., Mazzino, A., Triquet, S., Chevaillier, S., Grand, N., Bourrianne, T., Momboisse, G., Sellegri, K., Schwarzenbock, A., Freney, E., Mallet, M., and Formenti, P.: Size distribution and optical properties of mineral dust aerosols transported in the western Mediterranean, Atmos. Chem. Phys., 16, 1081–1104, https://doi.org/10.5194/acp-16-1081-2016, 2016.
Eckardt, F. and Kuring, N.: SeaWiFS identifies dust sources in the Namib Desert, Int. J. Remote Sens., 26, 4159–4167, https://doi.org/10.1080/01431160500113112, 2005.
El-Sergany, M. M. and El-Sharkawy, M. F.: Heavy Metal Contamination of Airborne Dust in the Environment of Two Main Cities in the Eastern Province of Saudi Arabia, JKAU Met., Env. Arid L. Agric. Sci, 22, 135–148, https://doi.org/10.4197/Met, 22-1.10, 2011.
Eltayeb, M. A., Van Grieken, R. E., Maenhaut, W., and Annegarn, H. J.: Aerosol-Soil Fractionation for Namib Desert Samples, Atmos. Environ., 27, 669–678, https://doi.org/10.1016/0021-8502(92)90577-I, 1993.
EPA: Positive Matrix Factorization Model for environmental data analyses, available at: https://www.epa.gov/air-research/positive-matrix-factorization-model-environmental-data-analyses, last access: 1 December 2020.
Ettler, V., Mihaljevič, M., Kříbek, B., Majer, V., and Šebek, O.: Tracing the spatial distribution and mobility of metal/metalloid contaminants in Oxisols in the vicinity of the Nkana copper smelter, Copperbelt province, Zambia, Geoderma, 164, 73–84, https://doi.org/10.1016/j.geoderma.2011.05.014, 2011.
Feng, Y., Ogura, N., Feng, Z. W., Zhang, F. Z., and Shimizu, H.: The Concentrations and Sources of Fluoride in Atmospheric Depositions in Beijing, China, Water Air Soil Poll., 145, 95–107, https://doi.org/10.1023/a:1023680112474, 2003.
Formenti, P., Piketh, S. J., and Annegarn, H. J.: Detection of non-sea salt sulphate aerosol at a remote coastal site in South Africa: A PIXE study, Nucl. Instr. Meth. Phys. Res. B, 150, 332–338, https://doi.org/10.1016/S0168-583X(98)01041-6, 1999.
Formenti, P., Elbert, W., Maenhaut, W., Haywood, J., and Andreae, M. O.: Chemical composition of mineral dust aerosol during the Saharan Dust Experiment (SHADE) airborne campaign in the Cape Verde region, September 2000, J. Geophys. Res., 108, 8576, https://doi.org/10.1029/2002JD002648, 2003a.
Formenti, P., Elbert, W., Maenhaut, W., Haywood, J., Osborne, S., and Andreae, M. O.: Inorganic and carbonaceous aerosols during the Southern African Regional Science Initiative (SAFARI 2000) experiment?: Chemical characteristics, physical properties, and emission data for smoke from African biomass burning, J. Geophys. Res., 108, 1–16, https://doi.org/10.1029/2002JD002408, 2003b.
Formenti, P., Schütz, L., Balkanski, Y., Desboeufs, K., Ebert, M., Kandler, K., Petzold, A., Scheuvens, D., Weinbruch, S., and Zhang, D.: Recent progress in understanding physical and chemical properties of African and Asian mineral dust, Atmos. Chem. Phys., 11, 8231–8256, https://doi.org/10.5194/acp-11-8231-2011, 2011.
Formenti, P., Caquineau, S., Desboeufs, K., Klaver, A., Chevaillier, S., Journet, E., and Rajot, J. L.: Mapping the physico-chemical properties of mineral dust in western Africa: mineralogical composition, Atmos. Chem. Phys., 14, 10663–10686, https://doi.org/10.5194/acp-14-10663-2014, 2014.
Formenti, P., Piketh, S. J., Namwoonde, A., Klopper, D., Burger, R., Cazaunau, M., Feron, A., Gaimoz, C., Broccardo, S., Walton, N., Desboeufs, K., Siour, G., Hanghome, M., Mafwila, S., Omoregie, E., Junkermann, W., and Maenhaut, W.: Three years of measurements of light-absorbing aerosols over coastal Namibia: seasonality, origin, and transport, Atmos. Chem. Phys., 18, 17003–17016, https://doi.org/10.5194/acp-18-17003-2018, 2018.
Formenti, P., D'Anna, B., Flamant, C., Mallet, M., Piketh, S. J., Schepanski, K., Waquet, F., Auriol, F., Brogniez, G., Burnet, F., Chaboureau, J., Chauvigné, A., Chazette, P., Denjean, C., Desboeufs, K., Doussin, J., Elguindi, N., Feuerstein, S., Gaetani, M., Giorio, C., Klopper, D., Mallet, M. D., Nabat, P., Monod, A., Solmon, F., Namwoonde, A., Chikwililwa, C., Mushi, R., Welton, E. J., and Holben, B.: The Aerosols, Radiation and Clouds in southern Africa (AEROCLO-sA) field campaign in Namibia: overview, illustrative observations and way forward, B. Am. Meteorol. Soc., 100, 1277–1298, https://doi.org/10.1175/BAMS-D-17-0278.1, 2019.
Gillett, R., Galbally, I., Ayers, G., Selleck, P., Powell, J., Meyer, M., Keywood, M., and Fedele, R.: Oxalic acid and oxalate in the atmosphere, in: Proceedings of the 4th IUAPPA World Congress Clean Air Partnerships: Coming Together for Clean Air, Brisbane, Australia, 9–13 September 2007, available at: http://www.cmar.csiro.au/e-print/internal/2007/gillettrw_xa.pdf (last access: 10 December 2020), 2007.
Gomez-Caminero, A., Howe, P., Hughes, M., Kenyon, E., Lewis, D., Moore, M., Ng, J., Aitio, A., and Becking, G.: Arsenic and Arsenic Compounds, Environmental Health Criteria no. 224, 2nd ed., World Health Organization, Geneva, 2001.
Hedberg, E., Gidhagen, L., and Johansson, C.: Source contributions to PM10 and arsenic concentrations in Central Chile using positive matrix factorization, Atmos. Environ., 39, 549–561, https://doi.org/10.1016/j.atmosenv.2004.11.001, 2005.
Heine, K. and Völkel, J.: Soil Clay Minerals in Namibia and Their Significance for the Terrestrial and Marine Past Global Change Research, Afr. Study Monogr., 40, 31–50, https://doi.org/10.14989/96299, 2010.
Henderson, P. and Henderson, G. M. (Eds.): The Cambridge Handbook of Earth science data, Cambridge University Press, London, 2009.
Hopke, P. K. and Jaffe, D. A.: Letter to the Editor: Ending the Use of Obsolete Data Analysis Methods, Aerosol Air Qual. Res., 20, 688–689, https://doi.org/10.4209/aaqr.2020.01.0001, 2020.
Huang, S., Poulain, L., Van Pinxteren, D., Van Pinxteren, M., Wu, Z., Herrmann, H., and Wiedensohler, A.: Latitudinal and Seasonal Distribution of Particulate MSA over the Atlantic using a Validated Quantification Method with HR-ToF-AMS, Environ. Sci. Technol., 51, 418–426, https://doi.org/10.1021/acs.est.6b03186, 2017.
Iannone, R.: splitr: Use the HYSPLIT model from inside R, R package version 0.4.0.9000, available at: https://github.com/rich-iannone/splitr, last access: 1 December 2020.
Isakson, J., Persson, T. A., and Lindgren, E. S.: Identification and assessment of ship emissions and their effects in the harbour of Göteborg, Sweden, Atmos. Environ., 35, 3659–3666, https://doi.org/10.1016/S1352-2310(00)00528-8, 2001.
Johansson, L., Jalkanen, J., and Kukkonen, J.: Global assessment of shipping emissions in 2015 on a high spatial and temporal resolution, Atmos. Environ., 167, 403–415, https://doi.org/10.1016/j.atmosenv.2017.08.042, 2017.
Johnson, B. T., Shine, K. P., and Forster, P. M.: The semi-direct aerosol effect: Impact of absorbing aerosols on marine stratocumulus, Q. J. Roy. Meteor. Soc., 130, 1407–1422, https://doi.org/10.1256/qj.03.61, 2004.
Jordi, A., Basterretxea, G., Tovar-Sanchez, A., Alastuey, A., and Querol, X.: Copper aerosols inhibit phytoplankton growth in the Mediterranean Sea, P. Natl. Acad. Sci. USA, 109, 21246–21249, https://doi.org/10.1073/pnas.1207567110, 2012.
Klein, S. A. and Hartmann, D. L.: The Seasonal Cycle of Low Stratiform Clouds, J. Climate, 6, 1587–1606, https://doi.org/10.1175/1520-0442(1993)006<1587:TSCOLS>2.0.CO;2, 1993.
KPMG: Namibia Country mining guide: Strategy series, available at: https://assets.kpmg/content/dam/kpmg/pdf/2014/09/namibia-mining-guide.pdf (last access: 10 December 2020), 2014.
Kříbek, B., Šípková, A., Ettler, V., Mihaljevič, M., Majer, V., Knésl, I., Mapani, B., Penížek, V., Vaněk, A., and Sracek, O.: Variability of the copper isotopic composition in soil and grass affected by mining and smelting in Tsumeb, Namibia, Chem. Geol., 493, 121–135, https://doi.org/10.1016/j.chemgeo.2018.05.035, 2018.
Lee, E., Chan, C. K., and Paatero, P.: Application of positive matrix factorization in source apportionment of particulate pollutants in Hong Kong, Atmos. Environ., 33, 3201–3212, https://doi.org/10.1016/S1352-2310(99)00113-2, 1999.
Lindesay, J. A., Andreae, M. O., Goldammer, J. G., Harris, G., Annegarn, H. J., Garstang, M., Scholes, R. J., and van Wilgen, B. W.: International Geosphere-Biosphere Programme/International Global Atmospheric Chemistry SAFARI-92 field experiment: Background and overview, J. Geophys. Res., 101, 23521–23530, https://doi.org/10.1029/96JD01512, 1996.
Louw, D. C., Van Der Plas, A. K., Mohrholz, V., Wasmund, N., Junker, T., and Eggert, A.: Seasonal and interannual phytoplankton dynamics and forcing mechanisms in the Northern Benguela upwelling system, J. Mar. Sys., Elsevier B.V., 157, 124–134, https://doi.org/10.1016/j.jmarsys.2016.01.009, 2016.
Lyyränen, J., Jokiniemi, J., Kauppinen, E. I., and Joutsensaari, J.: Aerosol characterisation in medium-speed diesel engines operating with heavy fuel oils, J. Aerosol Sci., 30, 771–784, https://doi.org/10.1016/S0021-8502(98)00763-0, 1999,
Maier, W. D., Rasmussen, B., Fletcher, I. R., Arnes, S.-J., and Huhma, H.: The Kunene Anorthosite Complex, Namibia, and Its Satellite Intrusions: Geochemistry, Geochronology, and Economic Potential, Econ. Geol., 108, 953–986, 2013.
Mänd, K., Kirsimäe, K., Lepland, A., Crosby, C. H., Bailey, J. V., Konhauser, K. O., Wirth, R., Schreiber, A., and Lumiste, K.: Authigenesis of biomorphic apatite particles from Benguela upwelling zone sediments off Namibia: The role of organic matter in sedimentary apatite nucleation and growth, Geobiology, 16, 640–658, https://doi.org/10.1111/gbi.12309, 2018.
Matengu, B., Xu, Y., and Tordiffe, E.: Hydrogeological characteristics of the Omaruru Delta Aquifer System in Namibia, Hydrogeol. J., 27, 857–883, https://doi.org/10.1007/s10040-018-1913-0, 2019.
Morel, F. M. M. and Price, N. M.: The Biogeochemical Cycles of Trace Metals in the Oceans, Science, 300, 944–947, https://doi.org/10.1126/science.1083545, 2003.
Muhlbauer, A., McCoy, I. L., and Wood, R.: Climatology of stratocumulus cloud morphologies: microphysical properties and radiative effects, Atmos. Chem. Phys., 14, 6695–6716, https://doi.org/10.5194/acp-14-6695-2014, 2014.
Namport: Group Annual Report 2017/2018, available at: https://www.namport.com.na/files/documents/dee_Annual Report 12 months ended 31 March 2018.pdf (last access: 19 February 2020), 2018.
Nelson, G. and Hutchings, L.: The Benguela upwelling area, Prog. Oceanogr., 12, 333–356, https://doi.org/10.1016/0079-6611(83)90013-7, 1983.
NOAA: HYSPLIT, available at: https://www.ready.noaa.gov/HYSPLIT.php, last access: 1 December 2020.
Norris, G., Duvall, R., Brown, S., and Bai, S.: EPA Positive Matrix Factorization (PMF) 5.0 Fundamentals and User Guide, U.S. Environmental Protection Agency, Washington, DC, EPA/600/R-14/108 (NTIS PB2015-105147), 2014.
Okin, G. S., Baker, A. R., Tegen, I., Mahowald, N. M., Dentener, F. J., Duce, R. A., Galloway, J. N., Hunter, K., Kanakidou, M., Kubilay, N., Prospero, J. M., Sarin, M., Surapipith, V., Uematsu, M., and Zhu, T.: Impacts of atmospheric nutrient deposition on marine productivity: Roles of nitrogen, phosphorus, and iron, Global Biogeochem. Cy., 25, 1–10, https://doi.org/10.1029/2010gb003858, 2011.
Paatero, P. and Tapper, U.: Positive Matrix Factorization: A non-negative factor model with optimal utilization of error estimates of data values, Environmetrics, 5, 111–126, https://doi.org/10.1002/env.3170050203, 1994.
Paatero, P., Eberly, S., Brown, S. G., and Norris, G. A.: Methods for estimating uncertainty in factor analytic solutions, Atmos. Meas. Tech., 7, 781–797, https://doi.org/10.5194/amt-7-781-2014, 2014.
Painemal, D., Kato, S., and Minnis, P.: Boundary layer regulation in the southeast Atlantic cloud microphysics during the biomass burning season as seen by the A-train satellite constellation, J. Geophys. Res., 119, 11288–11302, https://doi.org/10.1002/2014JD022182, 2014a.
Painemal, D., Xu, K., Cheng, A., Minnis, P., and Palikonda, R.: Mean Structure and Diurnal Cycle of Southeast Atlantic Boundary Layer Clouds: Insights from Satellite Observations and Multiscale Modeling Framework Simulations, J. Climate, 28, 324–341, https://doi.org/10.1175/JCLI-D-14-00368.1, 2014b.
Paytan, A., Mackey, K. R. M., Chen, Y., Lima, I. D., Doney, S. C., Mahowald, N., Labiosa, R., and Post, A. F.: Toxicity of atmospheric aerosols on marine phytoplankton, P. Natl. Acad. Sci. USA, 106, 4601–4605, https://doi.org/10.1073/pnas.0811486106, 2009.
Preston-Whyte, R. A., Diab, R. D., and Tyson, P. D.: Towards an inversion climatology of Southern Africa: Part II, non-surface inversions in the lower atmosphere, South African Geogr. J., 59, 45–59, https://doi.org/10.1080/03736245.1977.9713494, 1977.
Prodi, F., Belosi, F., Contini, D., Santachiara, G., Di Matteo, L., Gambaro, A., Donateo, A., and Cesari, D.: Aerosol fine fraction in the Venice Lagoon: Particle composition and sources, Atmos. Res., 92, 141–150, https://doi.org/10.1016/j.atmosres.2008.09.020, 2009.
Quinn, P. K., Coffman, D. J., Kapustin, V. N., Bates, T. S., and Covert, D. S.: Aerosol optical properties in the marine boundary layer during the First Aerosol Characterization Experiment (ACE 1) and the underlying chemical and physical aerosol properties, J. Geophys. Res., 103, 16547–16563, 1998.
Ramadan, Z., Song, X.-H., and Hopke, P. K.: Identification of sources of phoenix aerosol by positive matrix factorization, J. Air. Waste. Manage., 50, 1308–1320, https://doi.org/10.1080/10473289.2000.10464173, 2000.
Sanders, J. G. and Windom, H. L.: The uptake and reduction of arsenic species by marine algae, Estuar. Coast. Mar. Sci., 10, 555–567, https://doi.org/10.1016/S0302-3524(80)80075-2, 1980.
Savoie, D. L., Prospero, J. M., Arimoto, R., and Duce, R. A.: Non‐sea‐salt sulfate and methanesulfonate at American Samoa, Atmopsheres, 99, 3587–3596, https://doi.org/10.1029/93JD03337, 1994.
Scheifinger, H. and Held, G.: Aerosol behaviour on the South African Highveld, Atmos. Environ., 31, 3497–3509, https://doi.org/10.1016/S1352-2310(97)00217-3, 1997.
Seinfeld, J. H. and Pandis, S. N.: Atmospheric Chemistry and Physics: From Air Pollution to Climate Change, 2nd ed., John Wiley & Sons, Hoboken, New Jersey., 2006.
Schembari, C., Bove, M. C., Cuccia, E., Cavalli, F., Hjorth, J., Massabò, D., Nava, S., Udisti, R., and Prati, P.: Source apportionment of PM10 in the Western Mediterranean based on observations from a cruise ship, Atmos. Environ., 98, 510–518, https://doi.org/10.1016/j.atmosenv.2014.09.015, 2014.
Sciare, J., Baboukas, E., Krischke, U., Belviso, S., Bardouki, H., and Mihalopoulos, N.: Spatial and temporal variability of atmospheric sulfur-containing gases and particles during the Albatross campaign, J. Geophys. Res., 105, 14433–14448, https://doi.org/10.1029/1999JD901155, 2000.
Šerbula, S. M., Antonijević, M. M., Milošević, N. M., Milić, S. M., and Ilić, A. A.: Concentrations of particulate matter and arsenic in Bor (Serbia), J. Hazard. Mater., 181, 43–51, https://doi.org/10.1016/j.jhazmat.2010.04.065, 2010.
Shibata, Y., Sekiguchi, M., Otsuki, A., and Morita, M.: Arsenic compounds in zoo- and phyto-plankton of marine origin, Appl. Organomet. Chem., 10, 713–719, https://doi.org/10.1002/(SICI)1099-0739(199611)10:9<713::AID-AOC536>3.0.CO;2-U, 1996.
Sinha, P., Hobbs, P. V., Yokelson, R. J., Christian, T. J., Kirchstetter, T. W., and Bruintjes, R.: Emissions of trace gases and particles from two ships in the southern Atlantic Ocean, Atmos. Environ., 37, 2139–2148, https://doi.org/10.1016/S1352-2310(03)00080-3, 2003.
Soto-Viruet, Y.: The Mineral Industries of Angola and Namibia, U.S. Geol. Surv., Minerals Y(November), 1–12, available at: https://www.usgs.gov/centers/nmic/africa-and-middle-east#na (last access: 10 December 2020), 2015.
South African Weather Service (SAWS): Historical Synoptic, available at: https://www.weathersa.co.za/home/historicalsynoptic, last access: 14 December 2020.
Smith, C. B.: Pb, Sr and Nd isotopic evidence for sources of southern African Cretaceous kimberlites, Nature, 304, 51–54, https://doi.org/10.1017/CBO9781107415324.004, 1983.
Stein, A. F., Draxler, R. R., Rolph, G. D., Stunder, B. J. B., Cohen, M. D., and Ngan, F.: Noaa's hysplit atmospheric transport and dispersion modeling system, B. Am. Meteorol. Soc., 96, 2059–2077, https://doi.org/10.1175/BAMS-D-14-00110.1, 2015.
Swap, R., Garstang, M., Macko, S. A., Tyson, P. D., Maenhaut, W., Artaxo, P., Kållberg, P., and Talbot, R.: The long-range transport of southern African aerosols to the tropical South Atlantic, J. Geophys. Res., 101, 23777–23791, https://doi.org/10.1029/95JD01049, 1996.
Swap, R. J., Annegarn, H. J., Suttles, J. T., King, M. D., Platnick, S., Privette, J. L., and Scholes, R. J.: Africa burning: A thematic analysis of the Southern African Regional Science Initiative (SAFARI 2000), J. Geophys. Res., 108, 8465, https://doi.org/10.1029/2003JD003747, 2003.
Taylor, M. P. and Kesterton, R. G. H.: Heavy metal contamination of an arid river environment: Gruben River, Namibia, Geomorphology, 42, 311–327, https://doi.org/10.1016/S0169-555X(01)00093-9, 2002.
Tlhalerwa, K., Freiman, M. T., and Piketh, S. J.: Aerosol Deposition off the Southern African West Coast by Berg Winds, S. Afr. Geogr. J., 87, 152–161, https://doi.org/10.1080/03736245.2005.9713838, 2012.
Tournadre, J.: Anthropogenic pressure on the open ocean: The growth of ship traffic revealed by altimeter data analysis, Geophys. Res. Lett., 41, 7924–7932, https://doi.org/10.1002/2014GL061786, 2014.
Tyson, P. D., Garstang, M., Swap, R., Kållberg, P., and Edwards, M.: An air transport climatology for subtropical Southern Africa, Int. J. Climatol., 16, 265–291, https://doi.org/10.1002/(SICI)1097-0088(199603)16:3<265::AID-JOC8>3.0.CO;2-M, 1996.
Tyson, P. D. and Preston-Whyte, R. A.: The Weather and Climate of Southern Africa, 2nd ed., Oxford University Press Southern Africa, Cape Town, 2014.
Viana, M., Amato, F., Alastuey, A., Querol, X., Moreno, T., Dos Santos, S. G., Herce, M. D., and Fernández-Patier, R.: Chemical tracers of particulate emissions from commercial shipping, Environ. Sci. Technol., 43, 7472–7477, https://doi.org/10.1021/es901558t, 2009.
Vickery, K. J., Eckardt, F. D., and Bryant, R. G.: A sub-basin scale dust plume source frequency inventory for southern Africa, 2005–2008, Geophys. Res. Lett., 40, 5274–5279, https://doi.org/10.1002/grl.50968, 2013.
Vouk, V. B. and Piver, W. T.: Metallic Elements in Fossil Fuel Combustion Products: Amounts and Form of Emissions and Evaluation of Carcinogenicity and Mutagenicity, Environ. Health Persp., 47, 201–225, https://doi.org/10.1289/ehp.8347201, 1983.
Wanke, H., Nakwafila, A., Hamutoko, J. T., Lohe, C., Neumbo, F., Petrus, I., David, A., Beukes, H., Masule, N., and Quinger, M.: Hand dug wells in Namibia: An underestimated water source or a threat to human health?, J. Phys. Chem. Earth, 76–78, 104–113, https://doi.org/10.1016/j.pce.2015.01.004, 2015.
Wanke, H., Ueland, J. S., and Hipondoka, M. H. T.: Spatial analysis of fluoride concentrations in drinking water and population at risk in Namibia, Water SA, 43, 413–422, https://doi.org/10.4314/wsa.v43i3.06, 2017.
Wilcox, E. M.: Stratocumulus cloud thickening beneath layers of absorbing smoke aerosol, Atmos. Chem. Phys., 10, 11769–11777, https://doi.org/10.5194/acp-10-11769-2010, 2010.
Wood, R.: Stratus and stratocumulus, in Encyclopedia of Atmospheric Sciences, 2nd ed., vol. 2, edited by: North, G. R., Pyle, J., and Zhang, F., Elsevier, 196–200, 2015.
Zhang, M., Chen, J. M., Wang, T., Cheng, T. T., Lin, L., Bhatia, R. S., and Hanvey, M.: Chemical characterization of aerosols over the Atlantic Ocean and the Pacific Ocean during two cruises in 2007 and 2008, J. Geophys. Res., 115, 1–15, https://doi.org/10.1029/2010JD014246, 2010.
Zorn, S. R., Drewnick, F., Schott, M., Hoffmann, T., and Borrmann, S.: Characterization of the South Atlantic marine boundary layer aerosol using an aerodyne aerosol mass spectrometer, Atmos. Chem. Phys., 8, 4711–4728, https://doi.org/10.5194/acp-8-4711-2008, 2008.
Zuidema, P., Painemal, D., De Szoeke, S., and Fairall, C.: Stratocumulus cloud-top height estimates and their climatic implications, J. Climate, 22, 4652–4666, https://doi.org/10.1175/2009JCLI2708.1, 2009.
Zuidema, P., Redemann, J., Haywood, J., Wood, R., Piketh, S., Hipondoka, M., and Formenti, P.: Smoke and Clouds above the Southeast Atlantic: Upcoming Field Campaigns Probe Absorbing Aerosol's Impact on Climate, B. Am. Meteorol. Soc., 97, 1131–1135, https://doi.org/10.1175/BAMS-D-15-00082.1, 2016.
- Abstract
- Introduction
- Experimental methods
- Source identification and apportionment
- Results and discussion
- Conclusions and significance of results
- Data availability
- Author contributions
- Competing interests
- Special issue statement
- Acknowledgements
- Financial support
- Review statement
- References
- Supplement