the Creative Commons Attribution 4.0 License.
the Creative Commons Attribution 4.0 License.
 | 18 Dec 2020
A foehn-induced haze front in Beijing: observations and implications
Zhaobin Sun
Donald H. Lenschow
Mingyu Zhou
Youjun Dou
Zhigang Cheng
Yaoting Wang
Qingchun Li
Despite frequent foehns in the Beijing–Tianjin–Hebei (BTH) region, there are only a few studies of their effects on air pollution in this region, or elsewhere. Here, we discuss a foehn-induced haze front (HF) event using observational data to document its structure and evolution. Using a dense network of comprehensive measurements in the BTH region, our analyses indicate that the foehn played an important role in the formation of the HF with significant impacts on air pollution. Northerly warm–dry foehn winds, with low particulate concentration in the northern area, collided with a cold–wet polluted air mass to the south and formed an HF in the urban area. The HF, which is associated with a surface wind convergence line and distinct contrasts of temperature, humidity and pollutant concentrations, resulted in an explosive growth of particulate concentration. As the plain–mountain wind circulation was overpowered by the foehn, a weak pressure gradient due to the different air densities between air masses was the main factor forcing advances of the polluted air mass into the clean air mass, resulting in severe air pollution over the main urban areas. Our results show that the foehn can affect air pollution through two effects: direct wind transport of air pollutants, and altering the air mass properties to inhibit boundary layer growth and thus indirectly aggravating air pollution. This study highlights the need to further investigate the foehn and its impacts on air pollution in the BTH region.
- Article
(12698 KB) - Full-text XML
-
Supplement
(3712 KB) - BibTeX
- EndNote


Air pollution issues in China have been widely discussed and studied in recent decades. The region encompassing Beijing city, Tianjin city and Hebei Province, i.e., the Beijing–Tianjin–Hebei (BTH) region, is one of most polluted areas in China and has a very high level of 2.5 µm diameter particles (PM2.5) (Han et al., 2014; Gao et al., 2015; Jiang et al., 2015a; Wang et al., 2015). Furthermore, severe haze events occur frequently in the BTH region, especially in autumn and winter (Wang et al., 2013; F. Sun et al., 2014; Sun et al., 2016; Zhang et al., 2015; Li et al., 2016, 2017), and negatively affect human health (Guo et al., 2017). Stagnant weather conditions and large anthropogenic emissions in this region are the main reasons for the severe haze and pollution (Zhao et al., 2013; Liu et al., 2013; Wang et al., 2013; Zhang et al., 2014, 2015; Liu et al., 2017). Previous studies have shown feedbacks between aerosol and meteorological variables (e.g., Steiner et al., 2013; Tie et al., 2017; Huang et al., 2018; K. Li et al., 2018; Wu et al., 2019). A high concentration of PM2.5 can weaken turbulence (Ren et al., 2019) and enhance stability in the planetary boundary layer (PBL), resulting in decreased PBL height and consequently increased PM2.5 concentrations (Su et al., 2018), i.e., a positive feedback between aerosols and PBL height (Petäjä et al., 2016). Liu et al. (2018) found another positive feedback: decreased PBL height can increase relative humidity (RH) and, in turn, enhance secondary aerosol (SA) formation and further enhance particulate concentration, weaken solar radiation and further decrease PBL height.
During severe haze events in the BTH region, PM2.5 concentrations can increase as much as 200 µg m−3 in several hours (Zhong et al., 2017). On the one hand, SA formation through aerosol hygroscopic growth is one of the main reasons causing this explosive growth of particular matter (Han et al., 2015; Y. L. Sun et al., 2014; Chen et al., 2019). Huang et al. (2014), for example, found that severe haze pollution events were mostly the result of SA. On the other hand, vertical and horizontal transport can also produce an explosive growth of particles. Observations have shown that downward transport by large coherent eddies also produced explosive growth of surface PM2.5 concentrations (Han et al., 2018; J. Li et al., 2018). Complex topography, land use and land cover (e.g., the Taihang and Yan Mountains, the Jing-Jin-Ji city cluster, and Bohai Bay in the BTH region) can also induce local circulations that affect air pollutant concentrations (Liu et al., 2009; Wang et al., 2017). The distribution of air pollutants in Beijing and Tianjin is readily modified by mountain–valley and sea–land breezes. Regional transport by local- and weather-scale wind systems contributes significantly to the formation of severe haze events in the BTH region (Zheng et al., 2015; Sun et al., 2016; Ma et al., 2017; Jiang et al., 2015b). Dang and Liao (2019) reported that regional transport was the most important process for the formation of severe winter haze days in the BTH region, with a relative contribution of 65.3 %. Transport of aerosols to the BTH region by multi-scale circulations was also reported by Miao et al. (2017). However, due to a lack of dense vertical and horizontal spatial coverage of meteorological and aerosol observations, aerosol transport mechanisms and their effect on the explosive growth of particles in the BTH region are uncertain on both urban and smaller scales.
During a severe haze pollution event in 2015 in Beijing, a haze front (HF) was reported on an internet social network and also was intensively observed, e.g., by scanning lidars and instrument networks during the 3-year field campaign of the Study of Urban Impacts on Rainfall and Fog/Haze (SURF; Liang et al., 2018). This HF was identified by a sharp contrast in PM2.5 concentration and a convergence line in the surface wind field. It resulted in PM2.5 concentration increases of more than 200 µg m−3 in a half hour or less when it passed over. This visible haze front in Beijing resembled the smog front noted by Ahrens (2003) but differed in that its formation mechanism was foehn winds. The foehn is characterized by a decrease in cloudiness on the lee side of mountains and warm, dry, strong and gusty winds (Brinkmann, 1971; Richner and Hächler, 2013). The foehn warming mechanisms are summarized into four types (Elvidge and Renfrew, 2016): isentropic drawdown, latent heating and precipitation, mechanical mixing due to turbulence, and radiative heating. Foehns occur downstream of most major mountain ridges in the world (Drechsel and Mayr, 2008; Nkemdirim and Leggat, 1978; Norte, 2015; Takane and Kusaka, 2011; Zhao et al., 1993). Beijing is located on the plains adjacent to the southwest–northeast-oriented Taihang Mountains and the northwest–southeast-oriented Yan Mountains to the west and north, respectively. Due to this topography, Beijing is often affected by foehns especially in the plains areas adjacent to the mountains (Li et al., 2016; Wang et al., 2012a, b). The temperature can increase sharply in a short time: for example, Luo et al. (2020) has reported an intense foehn warming event in which surface air temperature increased by more than 10∘ per hour in Beijing (Luo et al., 2020). Despite a long history of foehn investigations, there are few studies of the influence of foehns on air pollution, especially in the BTH region which has, for decades, been a worldwide hotspot for studying air pollution (Gohm et al., 2009; Li et al., 2015; McGowan et al., 1996, 2002). Also, very few studies have reported foehn-related fronts. Vergeiner (2004) reported a “minifront” or a convergence line between the up-valley flow and the down-valley foehn flow that was maintained in the Wipp Valley, Austria. Li et al. (2015) found that a ground-based foehn colliding with a thermally driven valley breeze formed a minifront in Ürümqi, China, indicating that the foehn can play a critical role in the formation of severe air pollution events in that area. Nonetheless, foehn-related haze fronts seem to have never been investigated in the BTH region. Foehns usually come from western, northwestern and northern mountain areas in the Hebei–Beijing region, which are usually less polluted than the adjacent plains area in this region. Hence, foehns tend to increase visibility and decrease PM2.5 concentrations in plains areas (Yang et al., 2018). In our case study, the foehn initially decreased PM2.5 concentrations in the northern plains area of Beijing and then interacted with a polluted air mass, leading to severe pollution in the urban area. This latter dramatic consequence has not been reported in previous studies. The goal of our study was to investigate the structure and formation of this foehn-related haze front on small scales in order to improve our understanding of the role of the foehn in air pollution events in the BTH region. Intensive measurements from SURF as well as routine measurements across the BTH region and historic data sets are described in Sect. 2. In Sect. 3, we examine the characteristics and evolution of the haze front. In Sect. 4, we compare the formation of a sea breeze front and a haze front and discuss the main reason for HF propagation and the role of the foehn on air pollution. Section 5 is a summary.
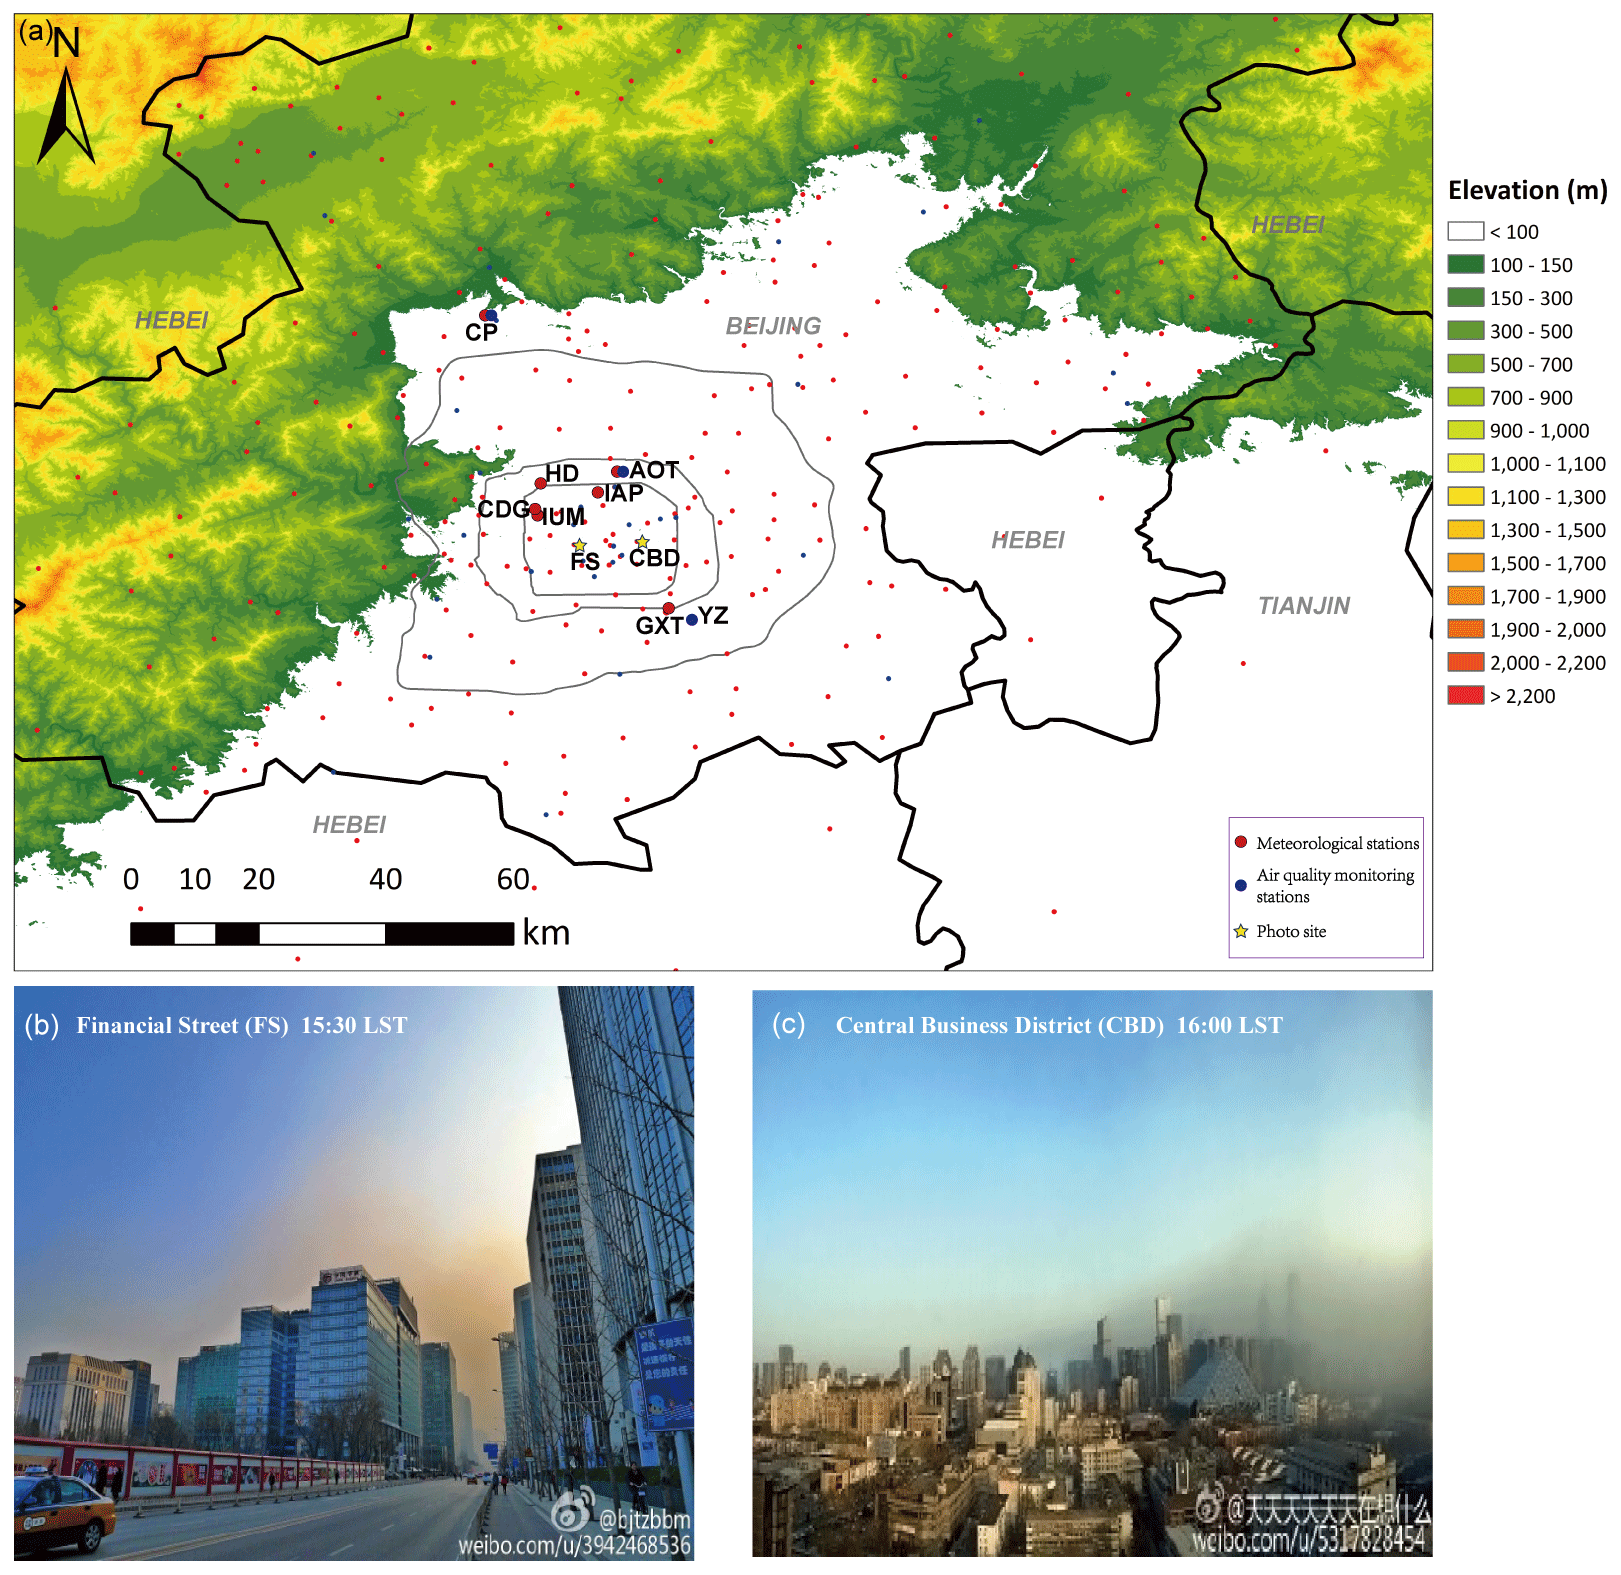
Figure 1(a) Locations of observational stations (larger symbols with site name: main stations used here) along with the fourth, fifth and sixth ring roads (gray lines) in Beijing, China. Anonymous photos from Sina Weibo (like Twitter but in Chinese) at (b) Financial Street (FS) at 15:30 CST (China Standard Time, UTC+8) and (c) Central Business District (CBD) at 16:00 on 24 December 2015. Locations for taking the photos are shown as yellow stars in the upper map.
Table 1Latitude, longitude, altitude, site type and instrumentation at the main sites in Fig. 1.

AWS: automated weather station; MPL: micropulse lidar; PPI: plain position indicator.
Figure 1 and Table 1 show the main observation sites mentioned here. The IAP site, which has been operated by the Institute of Atmospheric Physics (IAP) since 1978, has a 325 m high meteorological tower collocated with a ground-based Doppler lidar (Windcube 100S, Leosphere) and a mini-micropulse aerosol lidar (Mini-MPL, SigmaSpace). The Doppler lidar profiled the mean wind using the Doppler beam swing (DBS) scan mode. The Mini-MPL lidar profiled aerosols and normalized relative backscatter (NRB). Wind direction and speed, air temperature, and relative humidity were measured at 15 levels (8, 15, 32, 47, 65, 80, 100, 120, 140, 160, 180, 200, 240, 280, 320 m) on the tower. Three-dimensional sonic anemometers, downward- and upward-pointing pyrgeometers and pyranometers (CNR1, Kipp & Zonen), and CO2∕H2O concentration sensors (LI-7500) were installed at 47, 140 and 280 m. The instrumentation at the IAP site is described in detail by J. Li et al. (2018).
A Mini-MPL lidar was installed at the top of the office building of the Institute of Urban Meteorology (IUM), executing a plan-position indicator (PPI) scan mode at a 5∘ elevation angle and every 10∘ of azimuth angle from 230 to 340∘ (Fig. 5d). Collocated with the Mini-MPL lidar, a portable automated weather station (AWS) measured wind speed and direction, air temperature, and relative humidity at the IUM building top, about 30 m above the ground level. In order to compare surface meteorological variables around the IUM site with other surface stations, meteorological data every 5 min from an AWS at the Chedougou (CDG) site, ∼1 km north of the IUM site, were jointly analyzed with data from IUM. An air quality station on the ground ∼40 m south of the IUM office building provided 5 min mean PM2.5 concentrations. A weather camera facing west was also installed in a room on the ninth floor of the office building taking photos every 30 s. An operational wind profiler was installed at the Haidian (HD) national weather station site. We also used radio soundings launched twice daily at the Guanxiangtai (GXT) site. Hourly observations of PM2.5 from all the air quality stations were obtained from the website of the Ministry of Ecology and Environmental of the People's Republic of China (http://106.37.208.233:20035, last access: 15 December 2020). We used hourly PM2.5 data at the Aotizhongxin (AOT) site, ∼3 km northeast of the IAP site, and the Yizhuang (YZ) site, ∼4 km northeast of the GXT site, to roughly represent PM2.5 concentrations at IAP and GXT, respectively. At the Changping (CP) site, the AWS of the Beijing Meteorology Service (BMS) is very close to the air quality station of the Beijing Municipal Ecological Environment Bureau (BMEEB). During the study period, the Himawari satellite provided cloud images over the Beijing area every 10 min. Pictures of this infrequent haze front were initially released by internet social communities (e.g., Sina Weibo – equivalent to Chinese Twitter). Based on time and location information, we selected two photos shown in Fig. 1. All the observation heights used in this study are from ground level (a.g.l.). Also, in order to investigate foehn occurrence frequency and its relationship to PM2.5 concentrations in Beijing, 1 year of AWS data at CP, AOT, and GXT as well as PM2.5 data at CP, AOT and YZ from 1 March 2015 to 29 February 2016 are used.
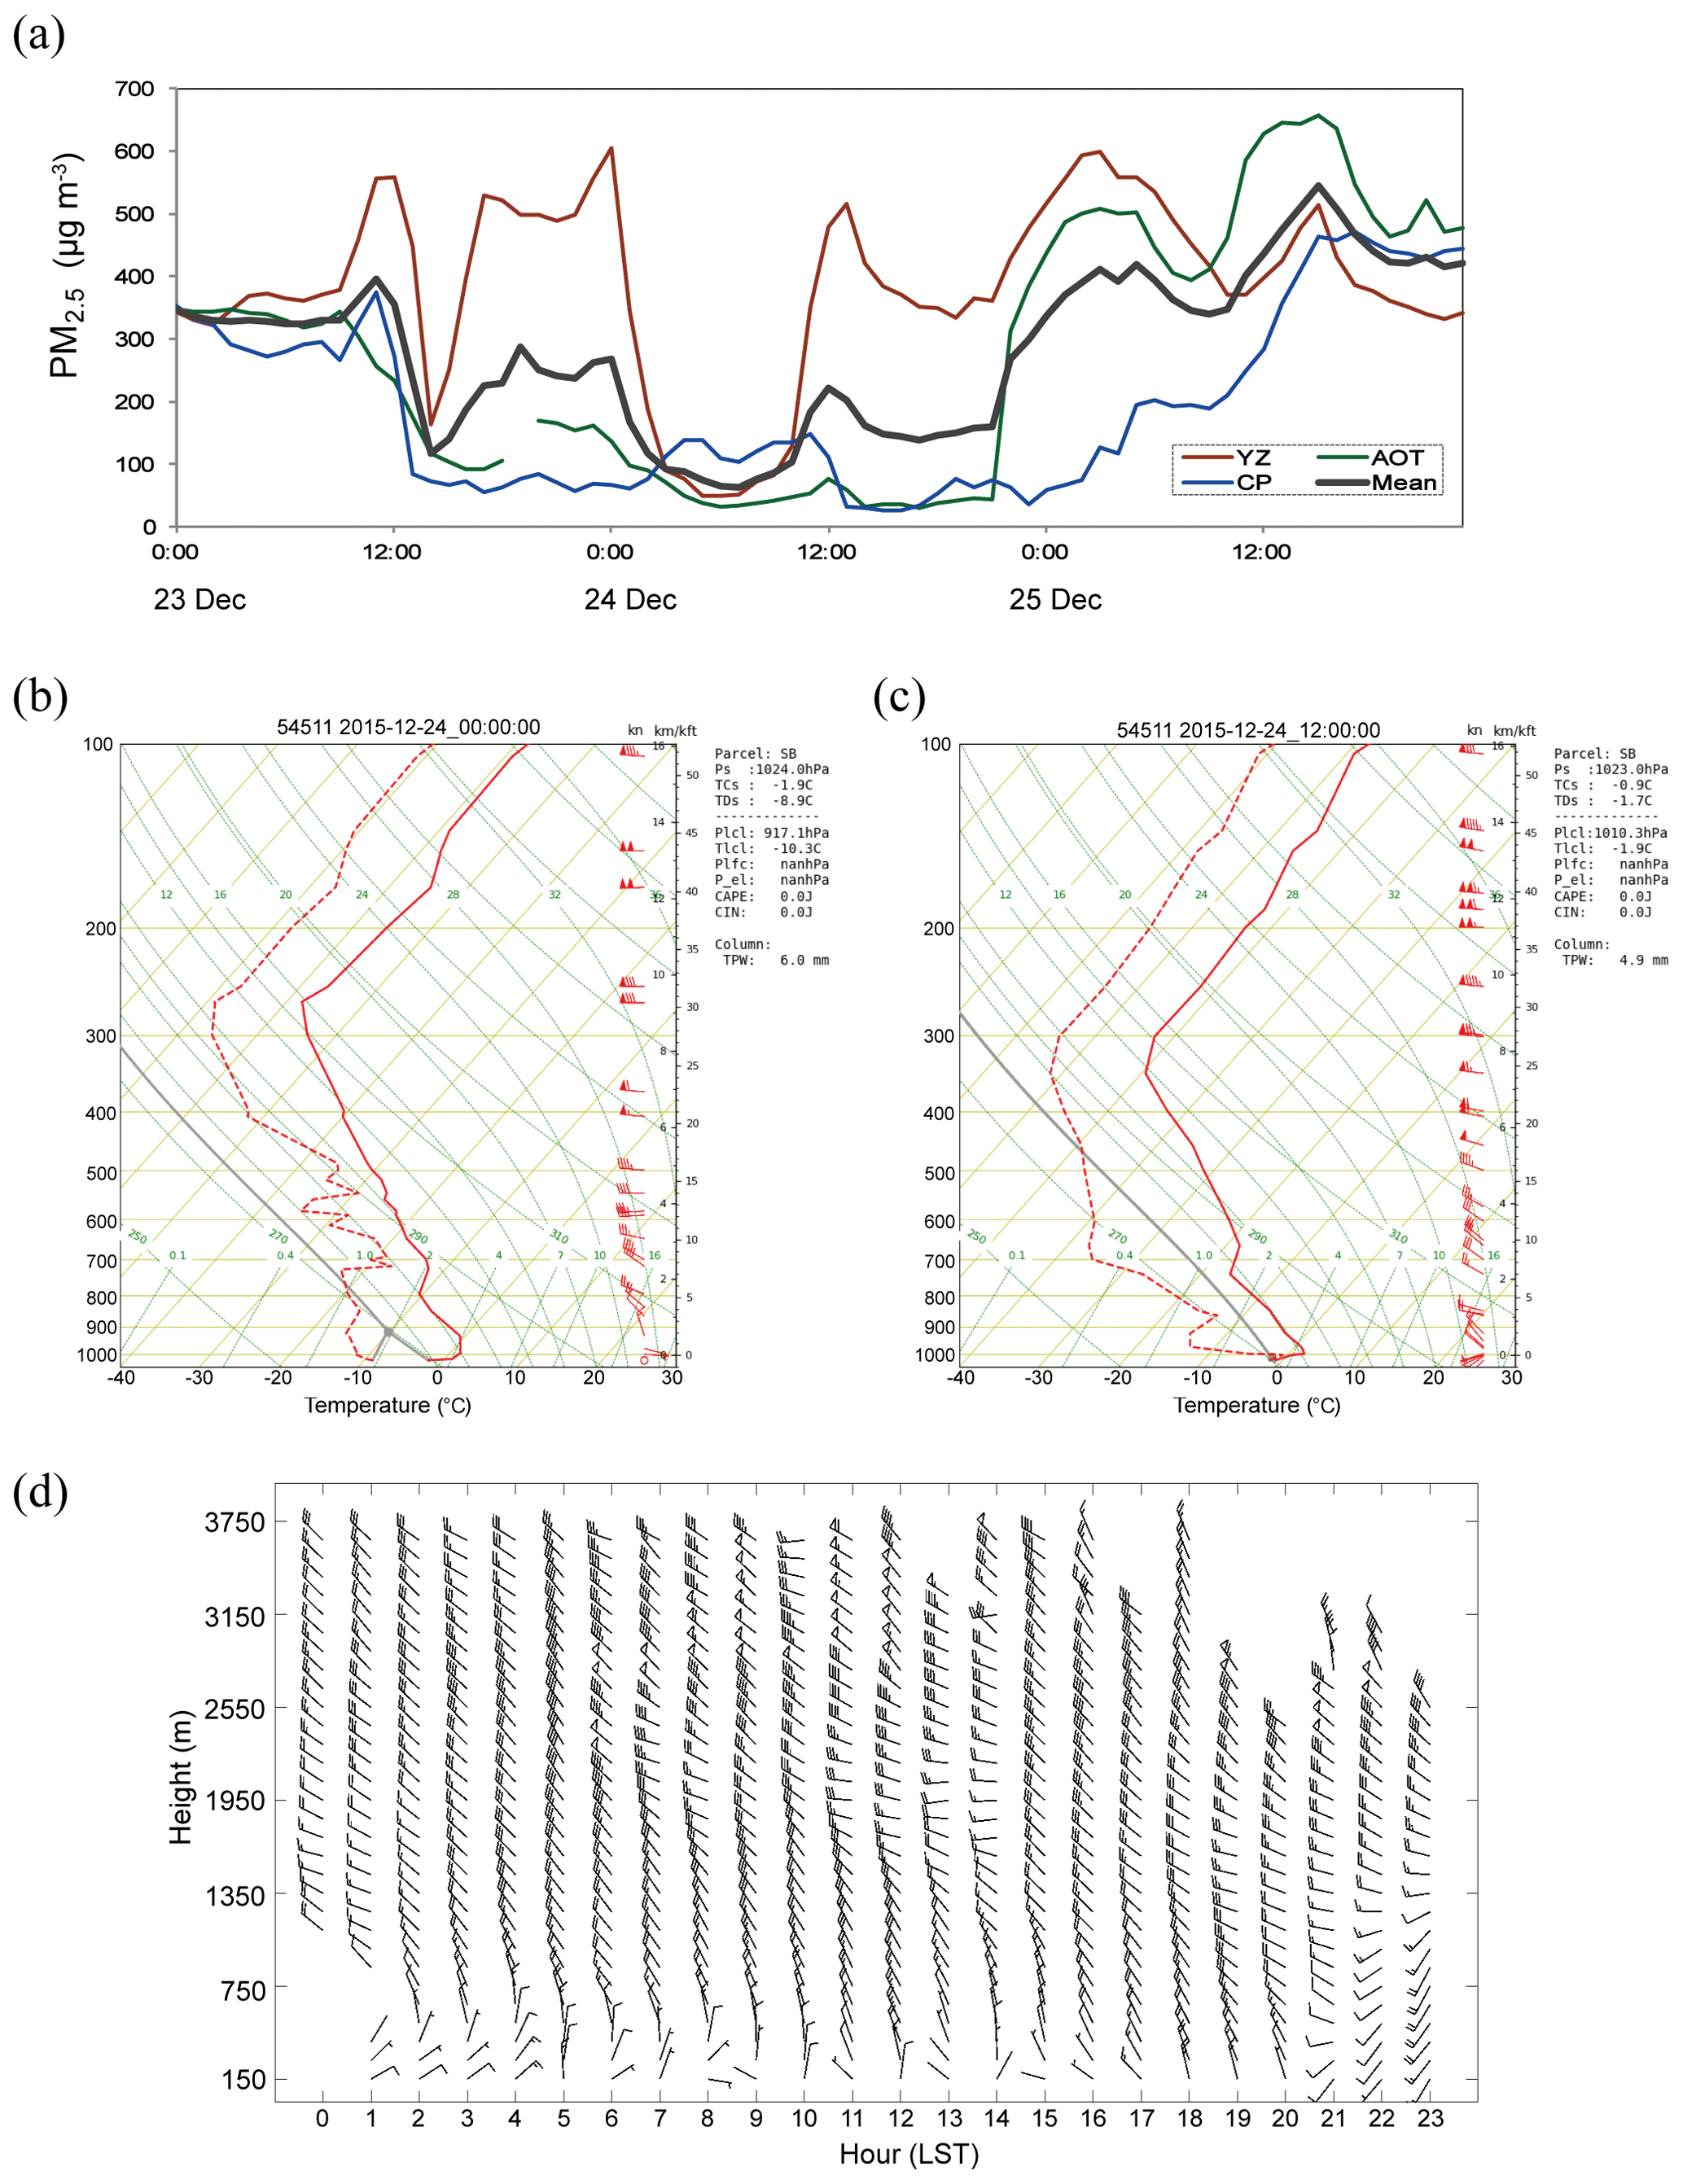
Figure 2(a) Hourly-mean PM2.5 concentration of CP, AOT, YZ and three-station mean in Beijing from 23 to 25 December. Temperature (solid), dew point (dashed) and wind vectors (in knots) from the radiosonde profiles at (b) 00:00 UTC and (c) 12:00 UTC at GXT. (d) Hourly wind-vector profiles from the wind profiler at HD on 24 December 2015.

Figure 3The 500 hPa weather maps at (a) 08:00 LST and (b) 20:00 LST, the 800 hPa weather maps at (c) 08:00 LST and (d) 20:00 LST, and surface maps at (e) 08:00 LST and (f) 20:00 LST on 24 December 2015. The administrative boundaries of Beijing are marked in brown.
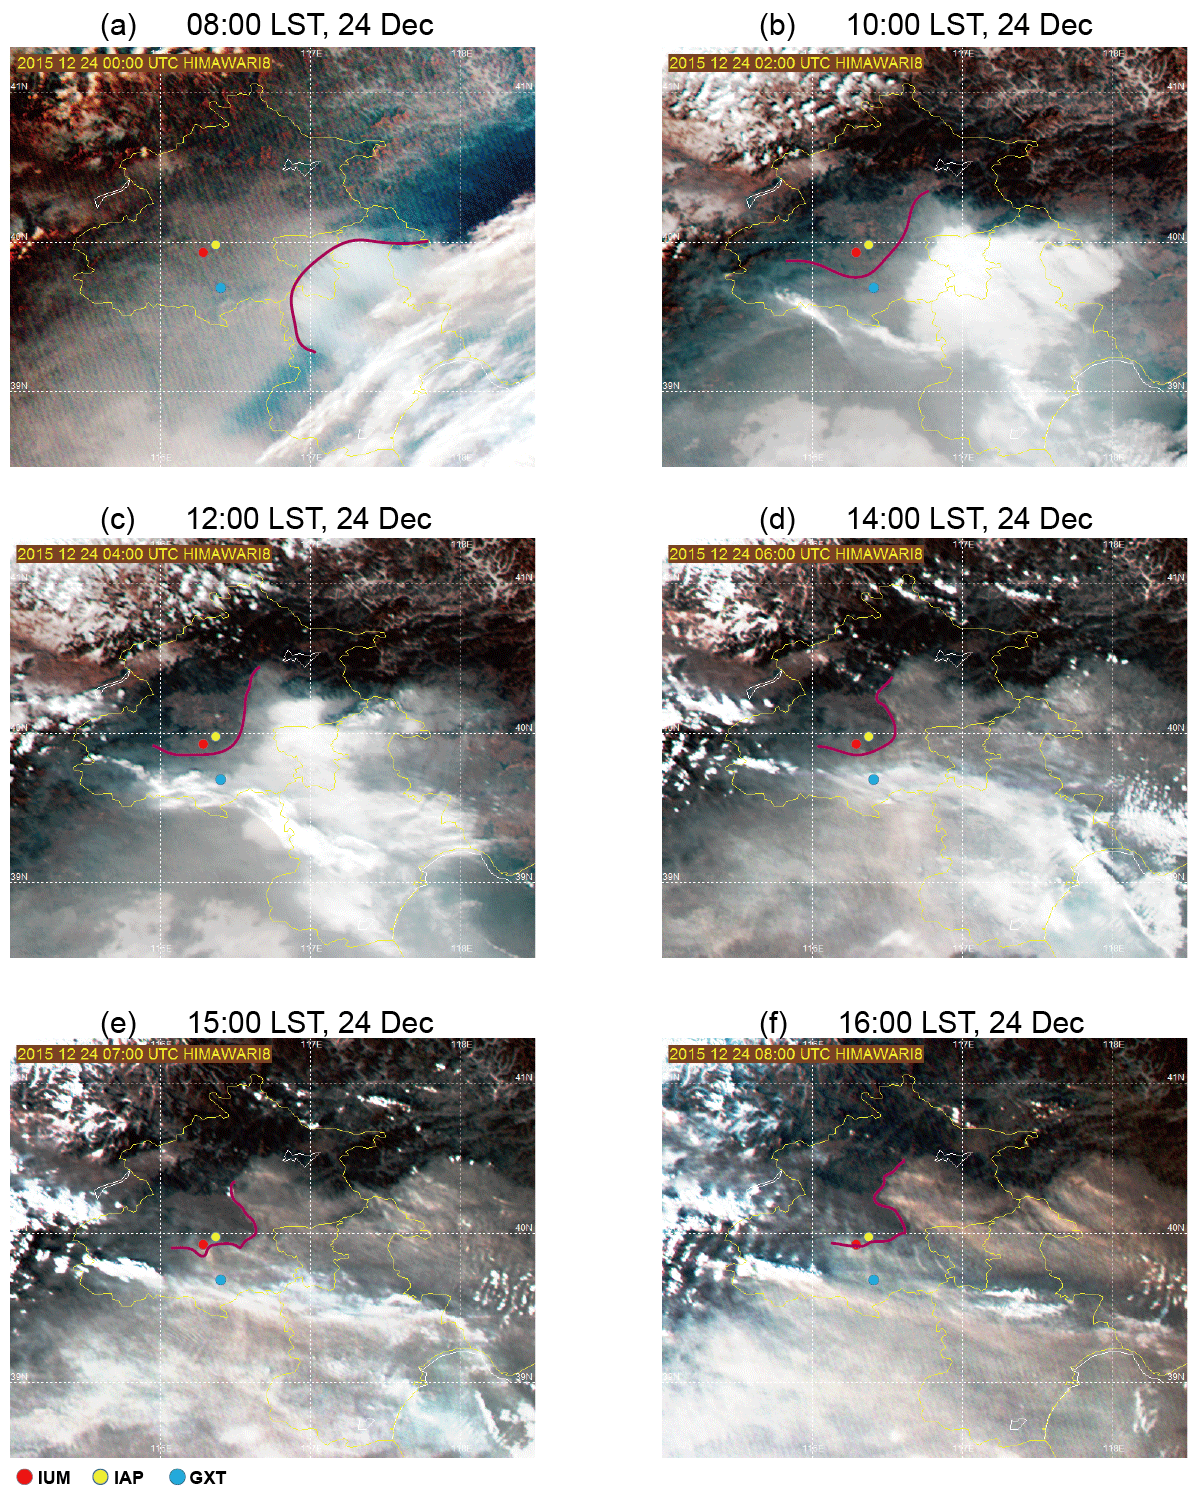
Figure 4Cloud images from the visible channels of the Himawari satellite at (a) 08:00 LST, (b) 10:00 LST, (c) 12:00 LST, (d) 14:00 LST, (e) 15:00 LST and (f) 16:00 LST on 24 December 2015. Red, yellow and blue dots are the locations of IUM, IAP and GXT, respectively. The purple lines indicate the location of the haze front.
3.1 Regional background of weather conditions and air pollution
A 500 hPa trough passed Beijing at 08:00 LST (local standard time; Beijing time) on 24 December (Fig. 3a). Meanwhile, the winds at 850 hPa were predominantly northwesterly (Fig. 3c), which agreed well with the radiosonde (Fig. 2b) and wind profiler (Fig. 2c) observations. Winds were predominantly northeasterly or northerly at ∼500 m a.g.l. (Figs. 2d, 9c). On the surface, fog was reported in Hebei and Shandong provinces, and easterly light winds were reported in Beijing by surface meteorological stations (Fig. 3e). At 20:00 LST, the 500 hPa trough moved to eastern China and the eastern part of the Korean peninsula (Fig. 3b). The upper air flow at 850 hPa continued northwesterly (Fig. 3d). There was a weak surface high centered north of Beijing. The pressure gradient was weak with weak southwesterly surface flow in Beijing (Figs. 2c, 3f). The synoptic pattern at 20:00 LST, with a weak surface pressure gradient, southerly weak flows and no obvious synoptic weather system passage, is one situation that can typically exacerbate air pollution. According to Wang and Zhang (2020), this circulation pattern accounts for 46 % of all circulation types during winter in the BTH region.
This HF occurred on 24 December 2015 after a severe air pollution event. The mean PM2.5 concentrations of CP, AOT and YZ varied between 300–400 µg m−3 on the morning of 23 December, which is a severe Air Quality Index (AQI) pollution level (Fig. 2a). Thereafter, two significant PM2.5 concentrations decreasing occurred at around noon and midnight on that day. During the day on 24 December, the mean PM2.5 concentration decreased to 73 µg m−3 at 07:00 LST. At 11:00 LST, the PM2.5 concentration at YZ sharply increased 221 µg m−3 in 1 h. At 13:00 LST, the PM2.5 concentration of CP decreased from 112 to 32 µg m−3. The PM2.5 concentration at AOT stayed below 80 µg m−3 until 22:00 LST when its PM2.5 concentration sharply increased 268 µg m−3 in 1 h. The following day, the mean PM2.5 concentration exceeded 500 µg m−3 at 14:00 LST.
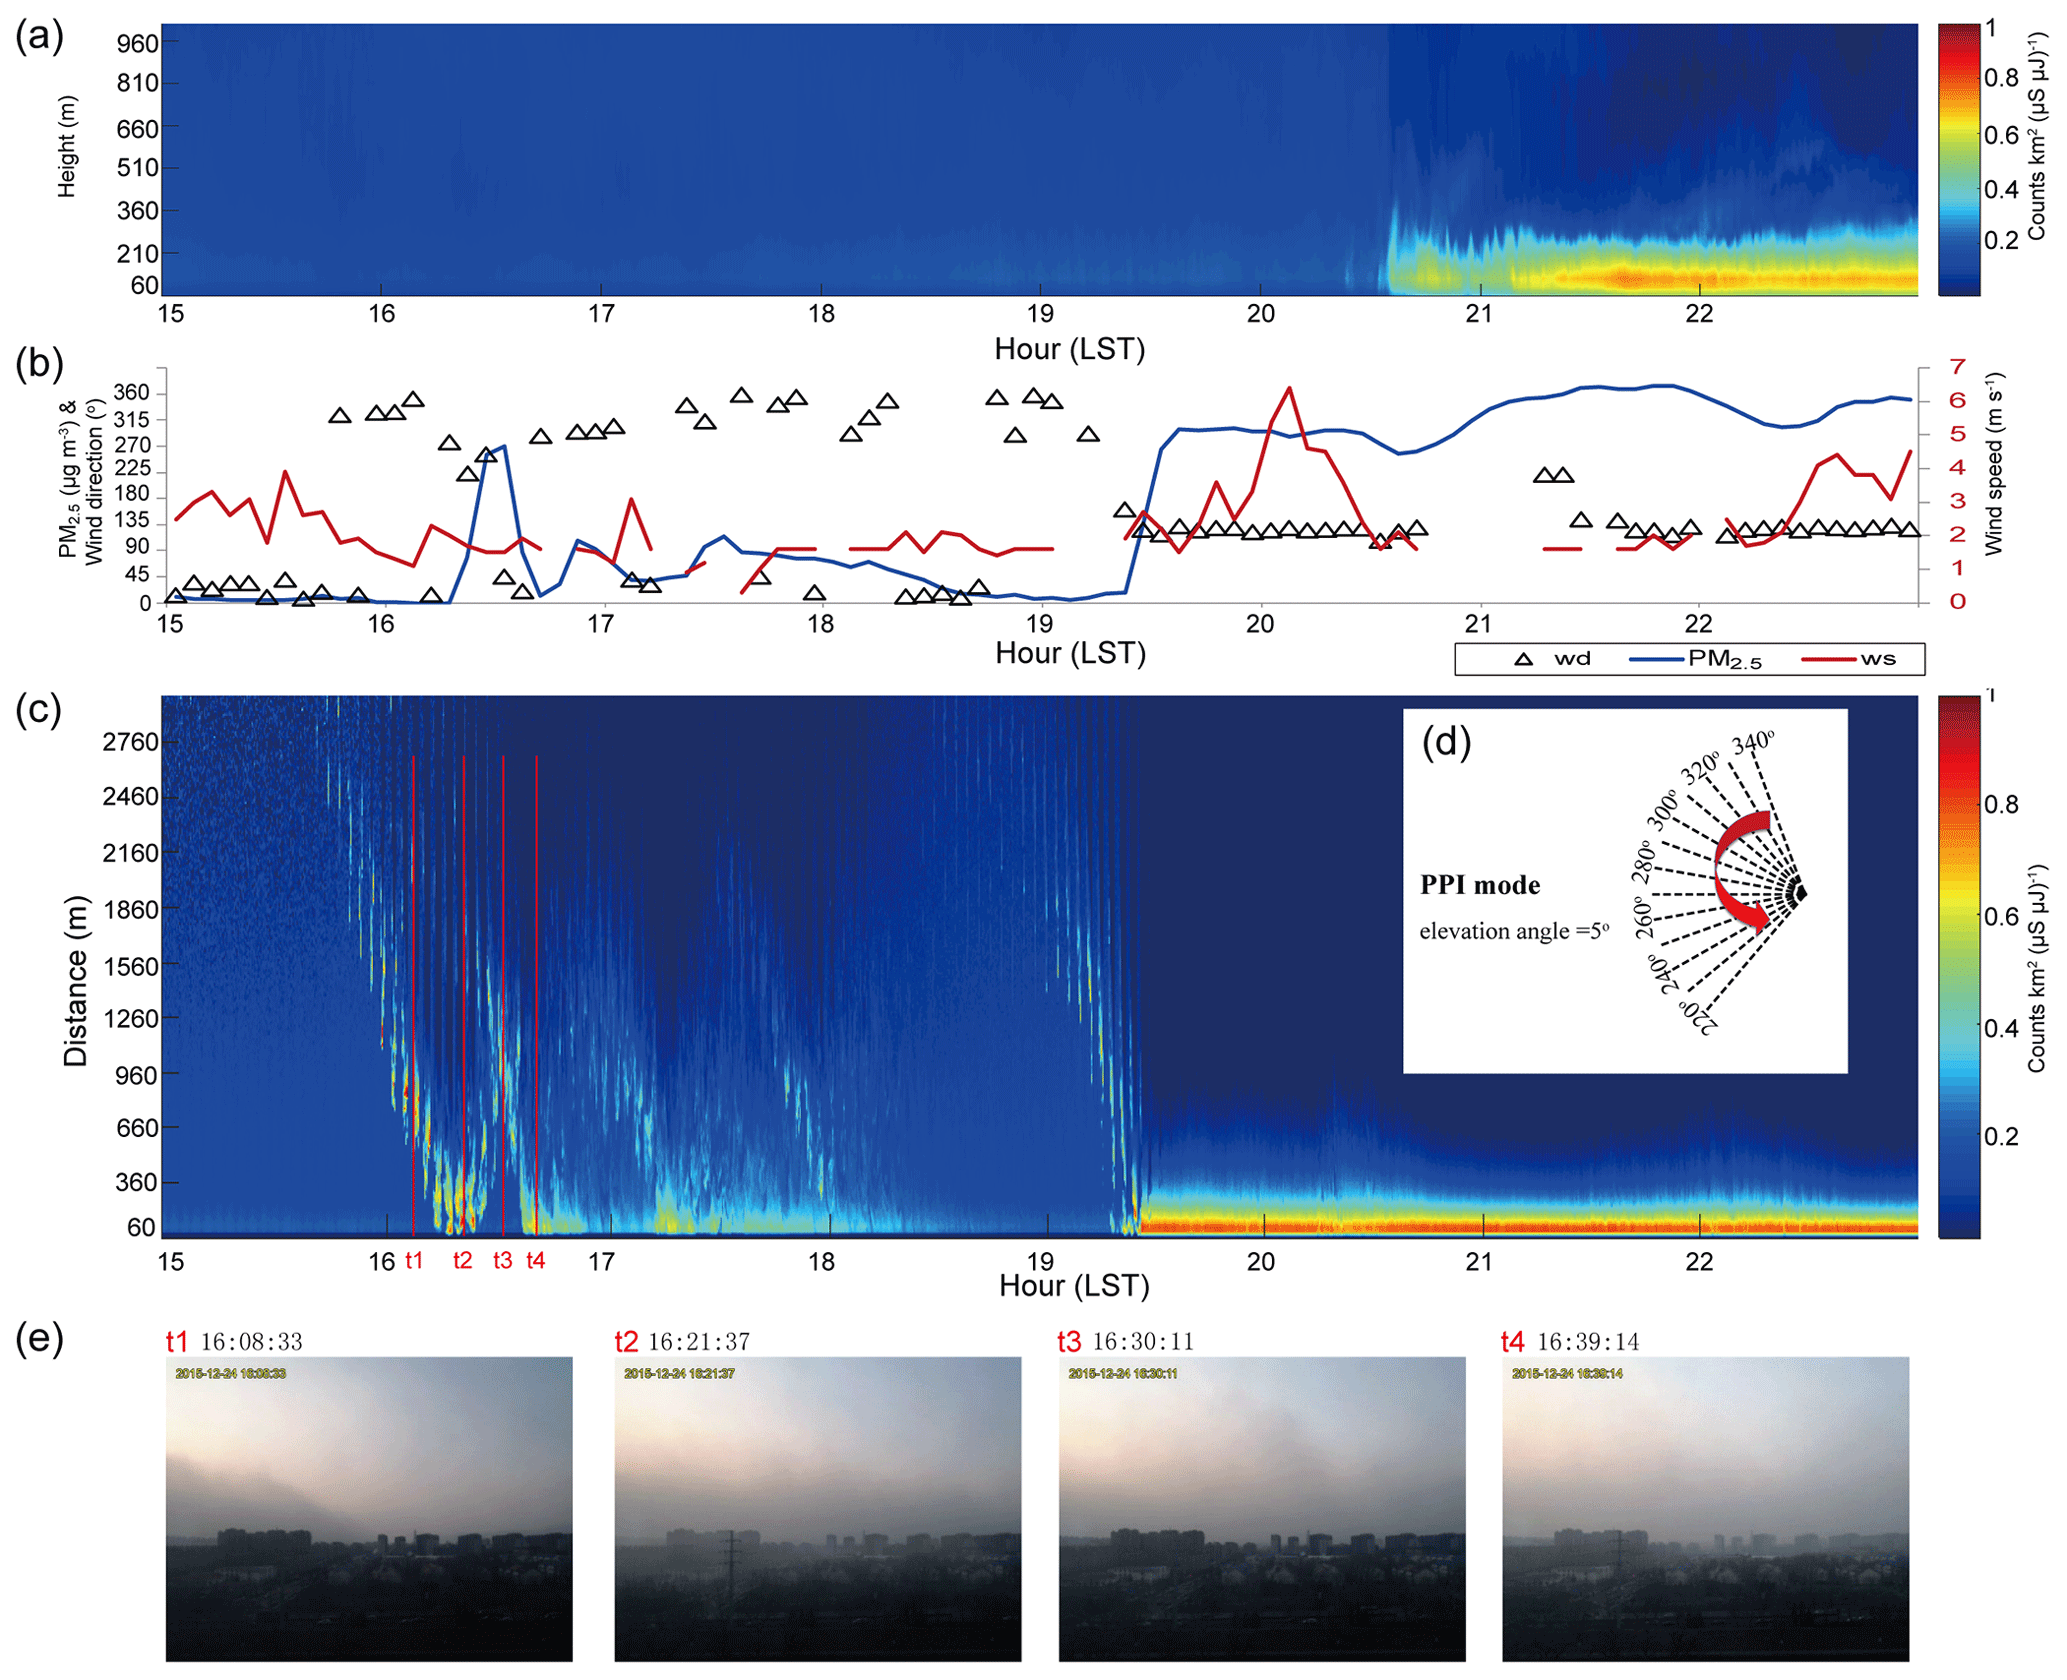
Figure 5(a) Vertical normalized relative backscatter (NRB) from the Mini-MPL at IAP. (b) The 5 min average wind speed (red line), wind direction (triangles) and PM2.5 concentrations (blue line) at IUM. (c) The NRB from a Mini-MPL at IUM scanning in (d) plan-position indicator (PPI) mode using 10∘ horizontal angle intervals from 340 to 220∘ and at 5∘ elevation angle. (e) Four photos taken by the weather camera at IUM at times t1, t2, t3 and t4, which are marked as red lines in panel (c).
3.2 The evolution and characteristics of the HF and foehn winds
The visible channel true-color images from the Himawari satellite clearly showed the movement and evolution of the HF. Normally, on the true-color satellite images, clouds look white and gray and tend to have texture; haze is usually featureless and pale gray or a dingy white; fog looks similar to the color of clouds but without texture. However, clouds, fog and haze are sometimes difficult to distinguish from satellite imagery. Hence, we referred to weather phenomena, visibility and PM2.5 concentration observed by surface meteorological and air quality stations to distinguish them. A dense fog covered northeastern Tianjin and half of Xianghe county of Hebei Province at 08:00 LST (Fig. 4a). Meanwhile, the Beijing area was clear with low pollution. Southwest–northeast-oriented clouds partly shadowed the fog in Tianjin and Bohai Bay. West of the fog, the gray-white shading indicated hazy air with its front extending just into the boundary of Beijing (Fig. 4a). The edge of the hazy air mass corresponding to the HF line began to impact the GXT site (the blue dot, Figs. 4b, 11) at 10:00 LST followed by expanding fog areas. The HF line moved slowly to the northwest while the fog areas shrank quickly due to increasing solar radiation. A west–east-oriented high cloud street overlapped the hazy and foggy areas (Fig. 4d). After 16:00 LST, the fog disappeared and the HF line subsequently impacted the FS, CBD and IUM sites (Figs. 1, 5), leaving a smaller unpolluted urban area on the northwestern plains area in Beijing.

Figure 6Temperature (colored dots coded according to the bottom color bar), wind vectors (2 m s−1 is one full bar) and PM2.5 concentrations (purple circles; the size of the circle represents concentration values) in the plains area within and around Beijing at (a) 12:00 LST and (b) 16:00 LST. The blue lines indicate the haze front location.
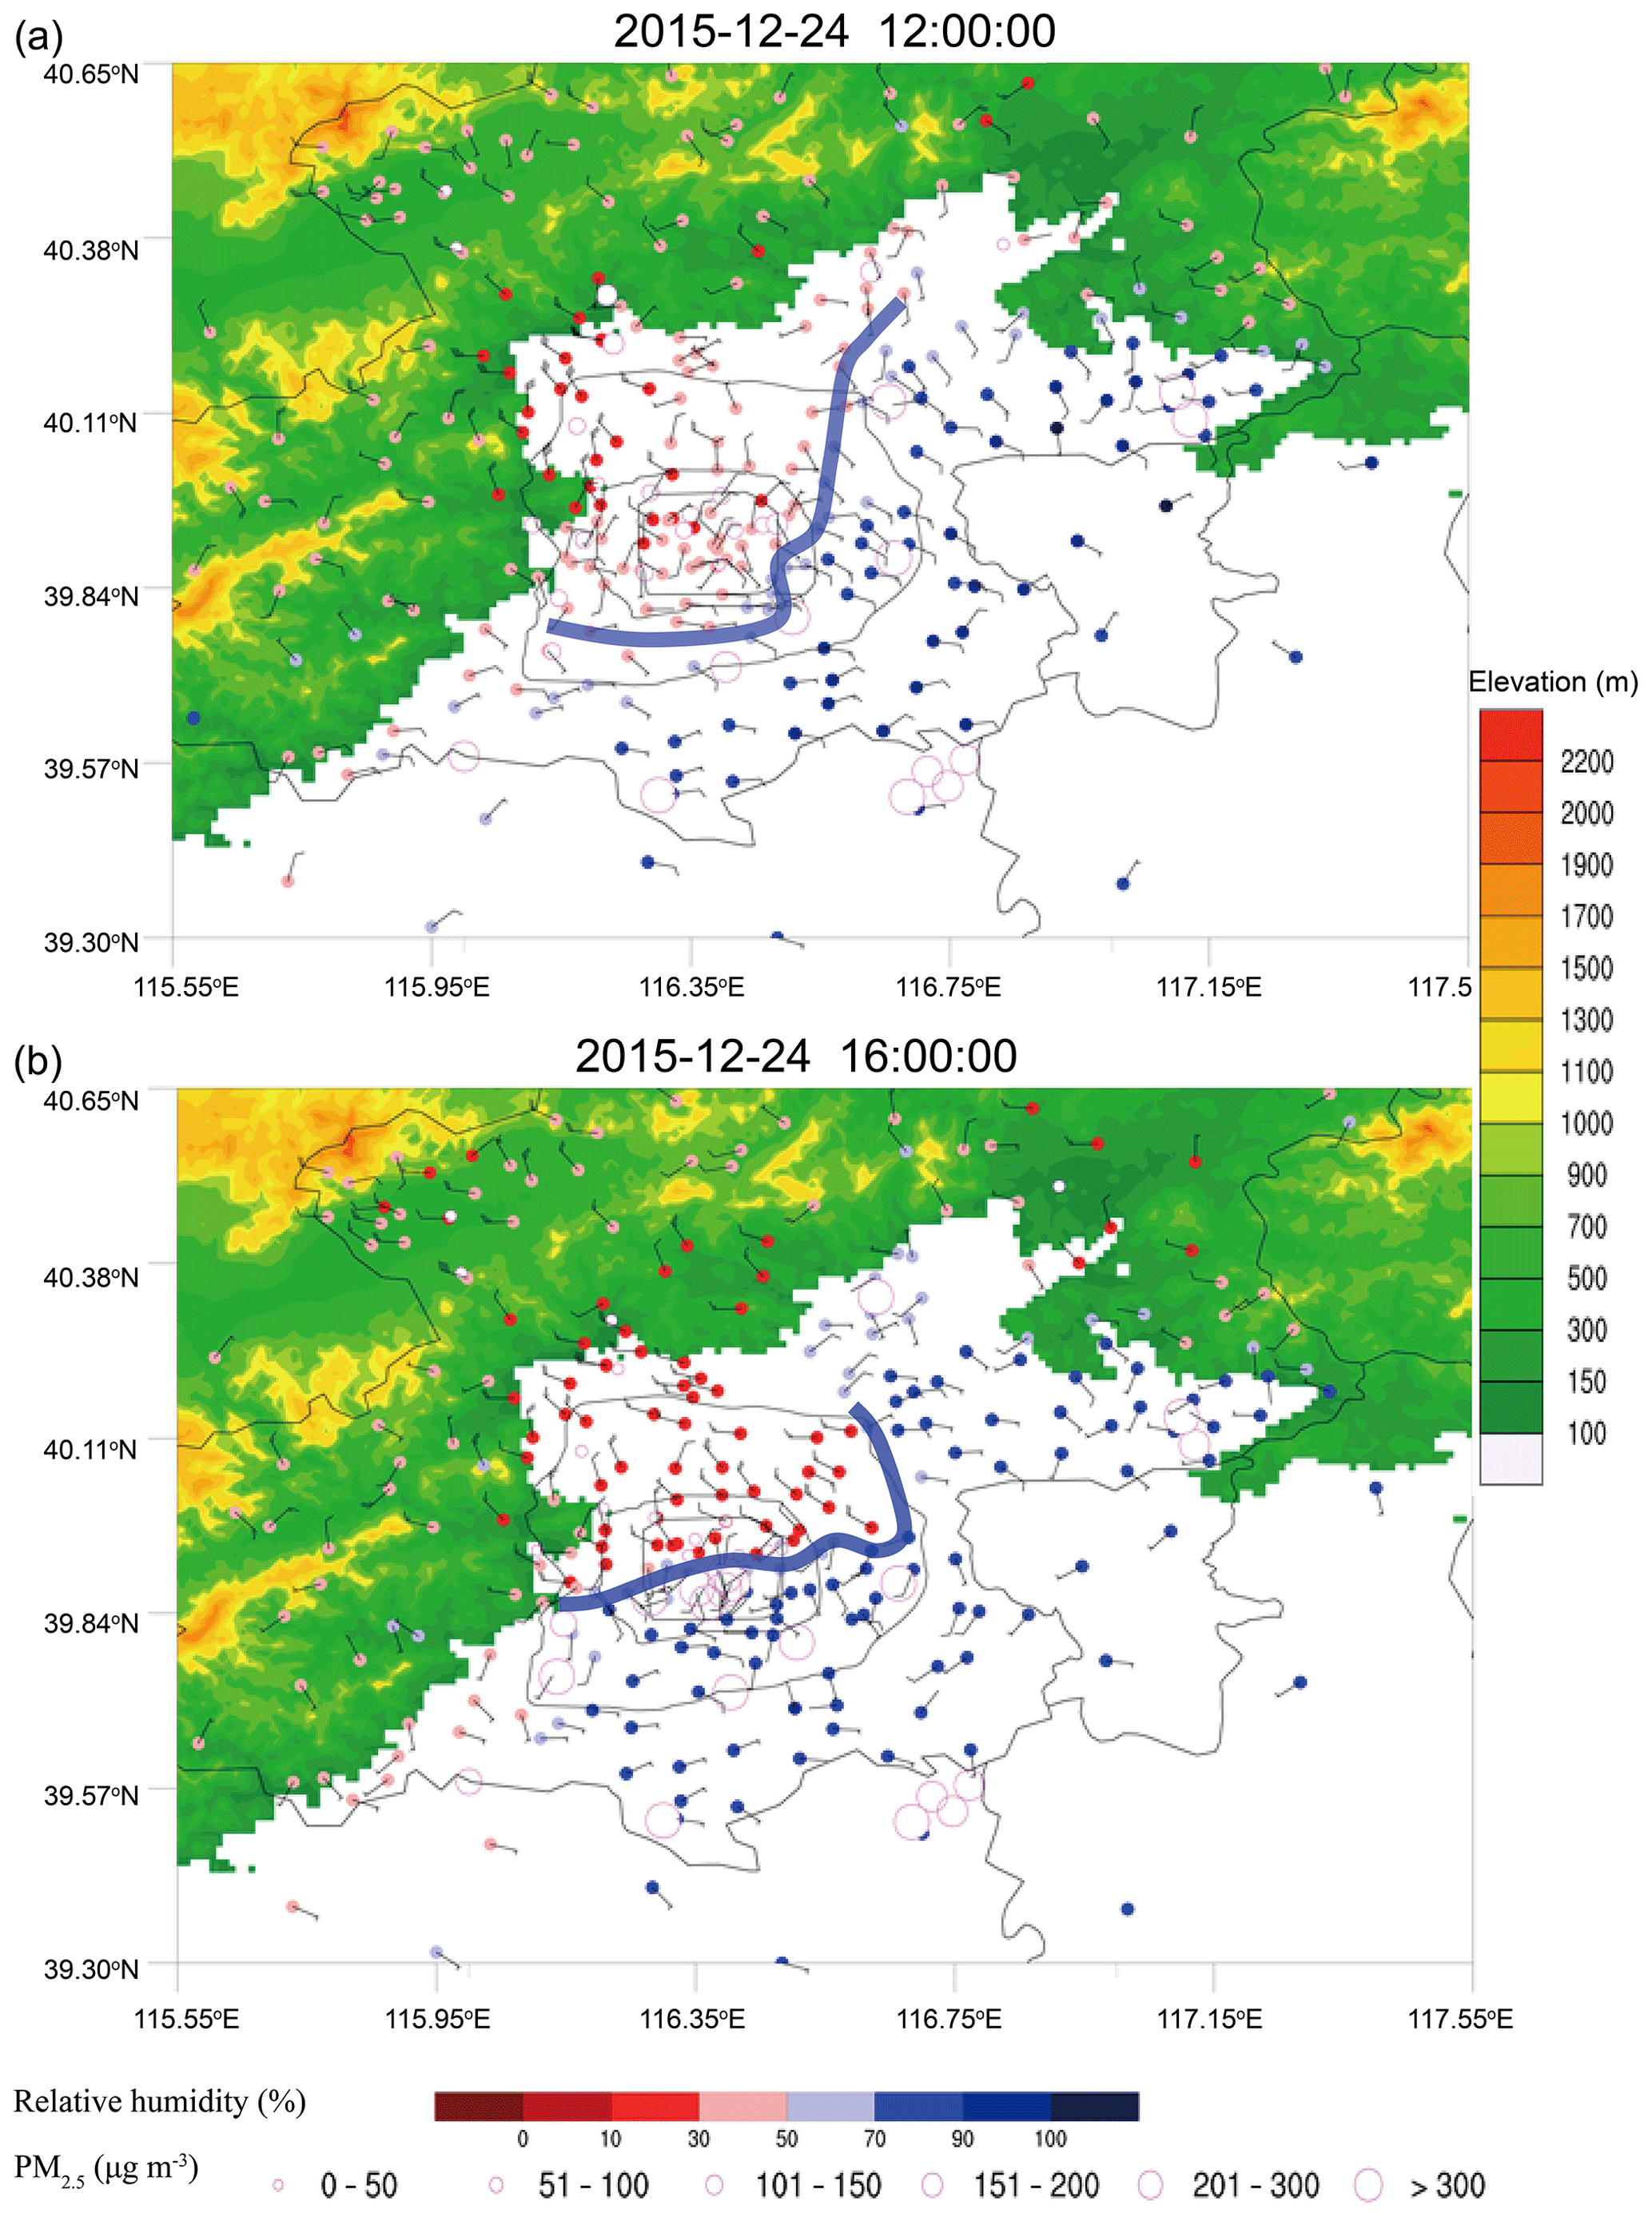
Figure 7Same as Fig. 6 but with relative humidity.
Based on the dense AWSs and air quality monitoring station coverage, the HF line was identified by sharp contrasts in PM2.5 concentrations, temperature and humidity between the warm and cold air masses and the convergence line of the surface wind field (Figs. 6–7, S1–S3), which was also consistent with the front edge of the hazy air mass seen in the satellite images (Fig. 4). The foehn winds, with higher temperature and lower humidity, first occurred in the northwestern plain area and its adjacent mountain area with northerly winds at speeds of 6–10 m s−1 from 11:00 to 12:00 LST (Fig. 6a). The foehn winds with the warm, dry, and clean air collided with more southerly or southeasterly winds with the cold, wet, and polluted air and resulted in oscillations of the HF line (Figs. 6–7). The HF line slowly advanced northwesterly with the southern part moving at about 2.5 km h−1 (Figs. 6, S2). The PM2.5 contrast between the clean and polluted air masses was more than 200 µg m−3 (Fig. 11). At 16:00 LST, the west–east-oriented HF line crossed the main urban area and reached the IUM site (Figs. 6b, 7b). As the foehn began to decrease in intensity and retreat, and radiative heating decreased in late afternoon, the warm–dry air mass became weaker and shrank, leading to dissolution of the HF. After the northerly gusty winds decreased after sunset, the polluted air mass moved consistently toward the relative warm–dry and clean areas, resulting in severe pollution over most of the plains except for a small area on the northwestern plains adjacent to the mountains (Figs. S2–S3, S6–S7).
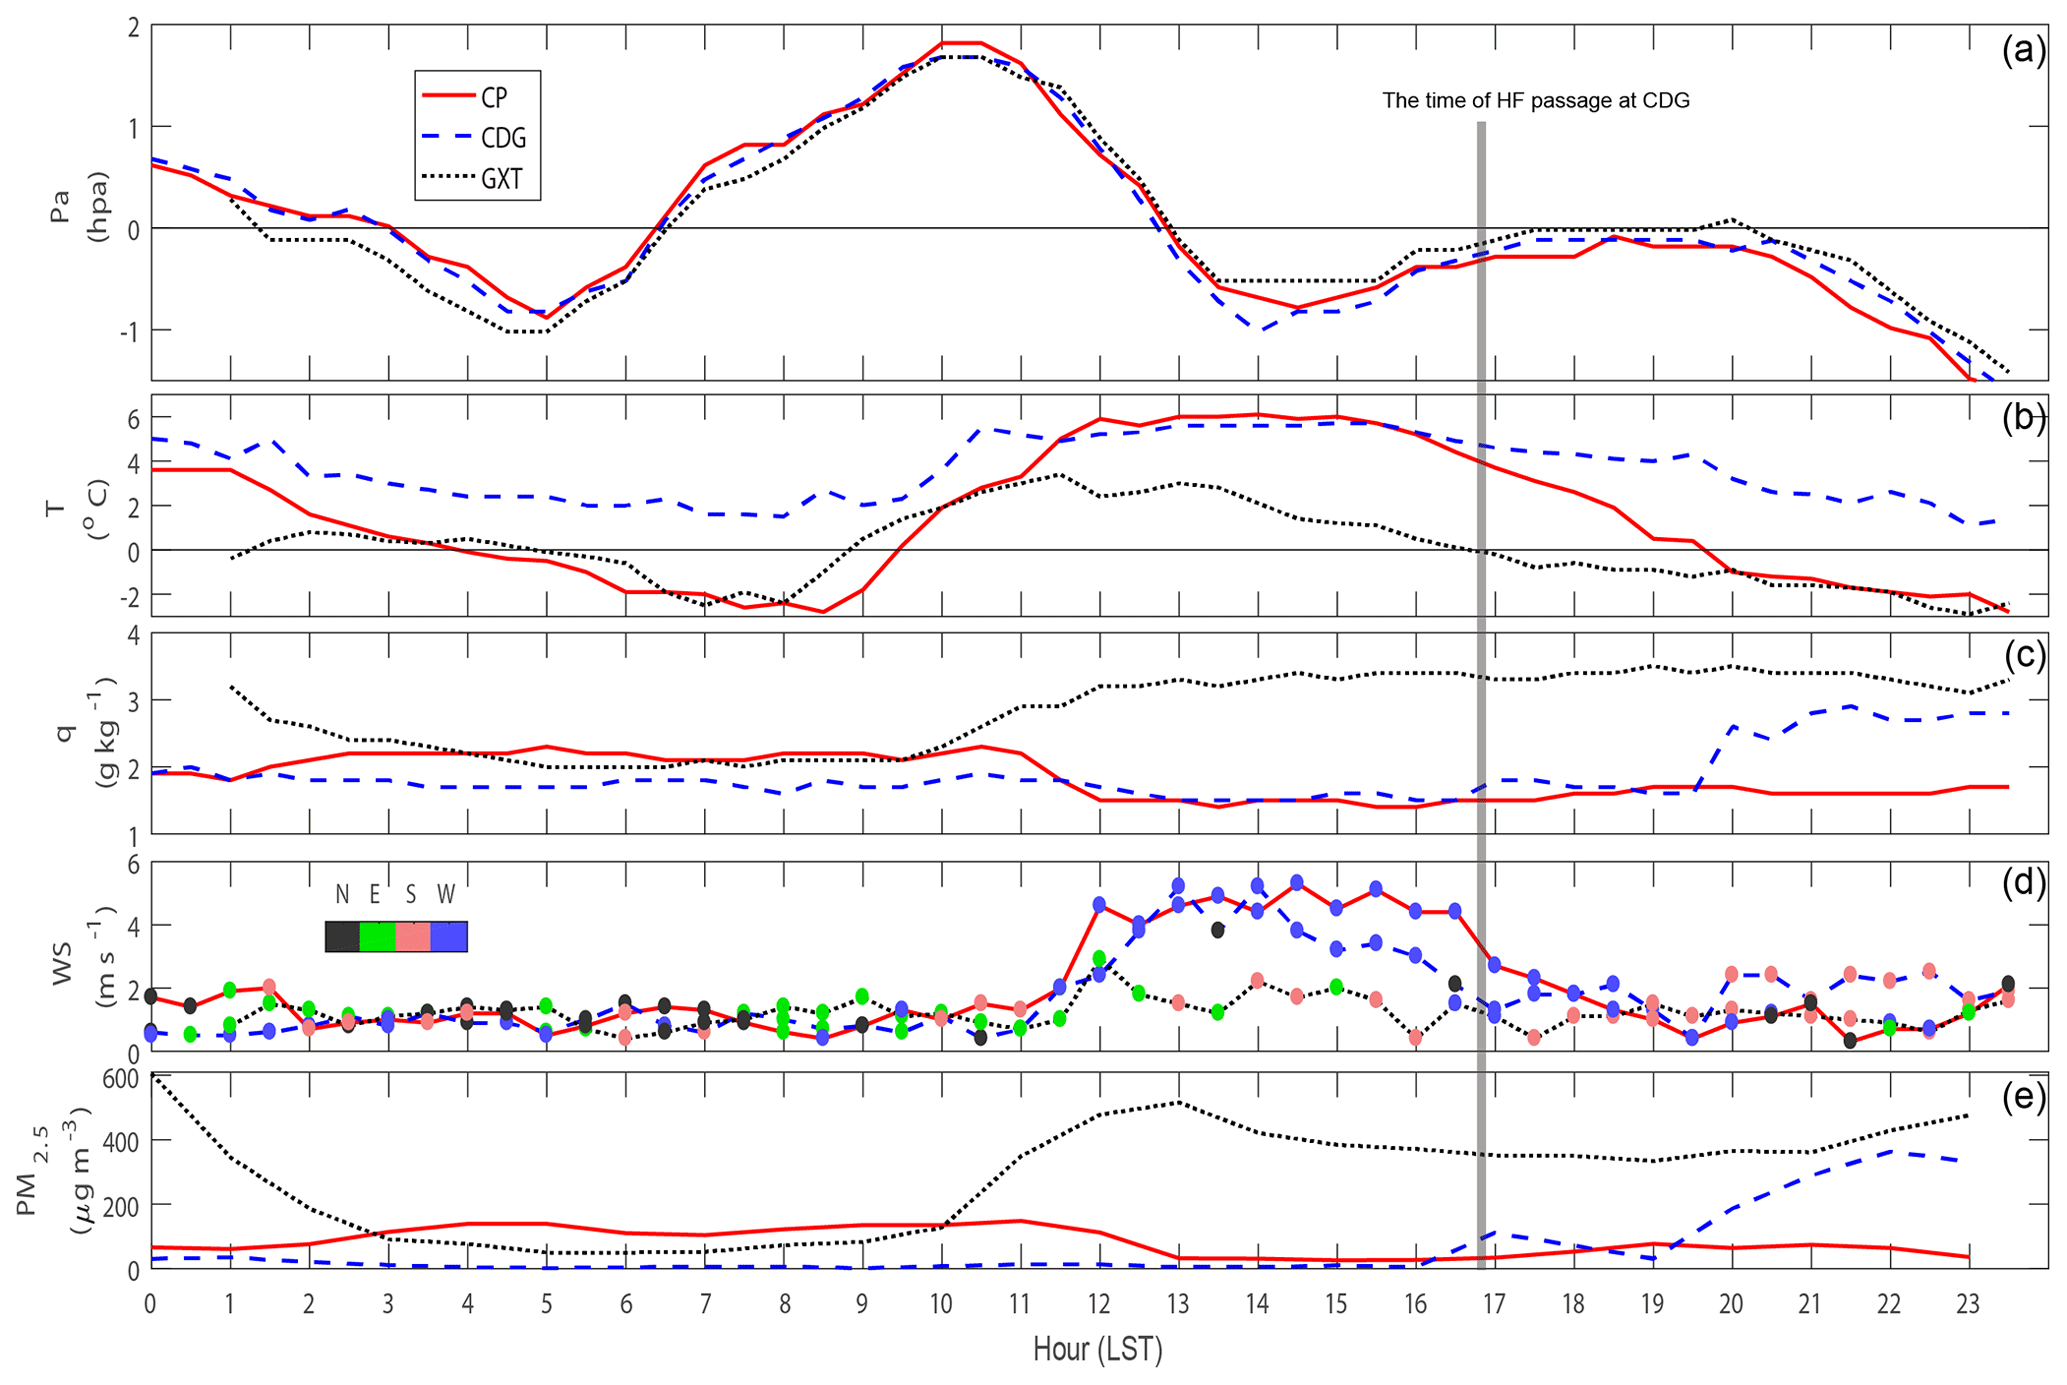
Figure 8Half-hourly (a) pressure anomaly, (b) air temperature, (c) specific humidity, and (d) wind speed (lines) and wind directions (colored dots), and (e) hourly PM2.5 concentration at CP (red line), CDG (blue dash line) and GXT (black dash line) on 24 December 2015. The gray line indicates the time of HF passage at CDG.
We used the CP, CDG and GXT sites (locations in Fig. 1) to investigate characteristics before and after the hazy air mass passed through. The northernmost site CP was mostly unaffected by the hazy air mass during 24 December. The southernmost site GXT was affected by the hazy air mass the earliest at 10:00 LST on 24 December. Afterward, the PM2.5 concentration at GXT varied from 349 to 515 µg m−3 until midnight (Fig. 8e). The PM2.5 concentration at CP was the lowest among three sites, with a maximum of 148 µg m−3 at 11:00 LST and a minimum of 26 µg m−3 at 15:00 LST. The half-hourly temperature record showed that air temperature at CP increased significantly at 11:00 LST due to the foehn; in contrast, air temperature decreased significantly at CDG and GXT. Meanwhile, humidity decreased and wind speed increased at CP due to the foehn. The warm and dry foehn wind was initially detected over the northwestern mountains and plains of Changping District (formerly Changping County) at around 11:00 LST, with a significant increase in temperature and the north wind component and decrease in humidity. Wind profiler observations at HD also showed enhanced upper-air winds. From 10:00 to 13:00 LST, air temperature increased from 1.9 to 6 ∘C, relative humidity decreased from 49 % to 24 %, and wind speed increased from 1 to 4.6 m s−1 at CP. The foehn affected CDG at about 12:00 LST and IAP at 13:00 LST before colliding with a cold, wet and hazy air mass. At 11:00 LST, an urban heat island (UHI) formed in the main urban areas mainly due to intense solar heating under a clear and clean sky but also from the heat released by urban activities. At 12:00 LST, the warm–dry air mass driven by the gusty foehn merged with the UHI, enlarging the coverage of the warm air mass. When the HF passed over CDG, the humidity and PM2.5 concentrations significantly increased and the pressure slightly increased, but the temperature slightly decreased (Fig. 8). CDG was also affected by the foehn at around 12:00 LST, 1.5 h later than CP, with accompanying temperature and wind speed increases and a decrease in humidity.
Aerosol lidar observations showed fine structures of the HF and its evolution. The Mini-MPL at IUM scanned the HF passage using the PPI mode (Fig. 5c). The lidar initially detected a hazy air mass to the southwest far away from the lidar site. As the HF approached, the outline of the polluted air mass was clearly visible against the sky and buildings on the weather camera photos (t1, Fig. 5e). When the HF arrived at the IUM site, the building view was blurred by the hazy air mass (t2, Fig. 5e). Surface wind direction changed suddenly from NNW to WSW. The PM2.5 concentration jumped from ∼10 to 269 µg m−3 in 10 min (Fig. 5b). The wind direction suddenly changed to northerly at 16:30 LST, resulting in an abrupt PM2.5 concentration decrease to 11 µg m−3 (Fig. 5b), and the visibility increased as evidenced by some visible buildings (t3, Fig. 5e). In less than 10 min, the wind direction reverted again from N to NNW, resulting in a PM2.5 concentration increase to 106 µg m−3 (Fig. 5b), and again blurred the building view at 16:39 LST (t4, Fig. 5e). The scans showed five pollution waves successively impacting the site and consequently led to severe pollution at 19:30 LST at IUM (Fig. 5b, c). The IAP site, 8 km northeast of IUM, was affected by the hazy air mass at around 20:30 LST according to vertically scanning lidar observations at this site (Fig. 5a).
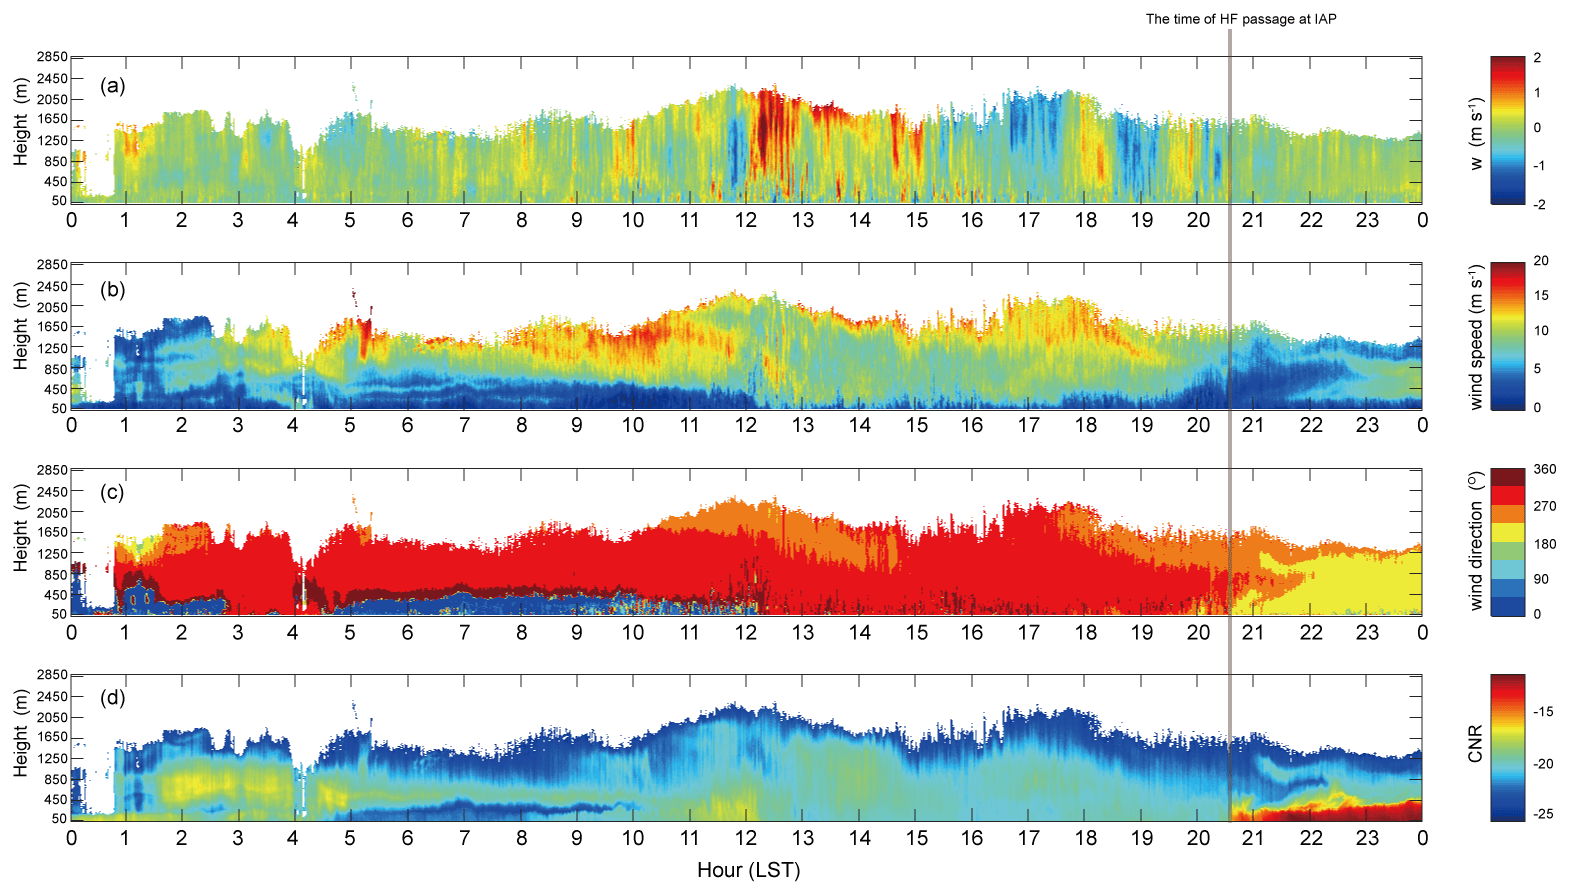
Figure 9Doppler lidar observations of (a) vertical wind velocity, (b) horizontal wind speed, (c) wind direction, and (d) carrier–noise ratio (CNR) at IAP on 24 December 2015. The gray line indicates the time of HF passage at IAP.

Figure 10Temporal variations of (a) temperature (colored contours) and wind vectors, (b) relative humidity (colored contours) and wind vectors at 15 levels on the IAP tower, and (c) vertical velocity standard deviation at 47 and 280 m on the IAP tower on 24 December 2015. The gray line indicates the time of HF passage at IAP.
Using the Doppler lidar and the 325 m tower concurrent observations at IAP, we analyzed the vertical structure of the foehn winds and the HF. At around noon, the Doppler lidar detected a northwesterly wind and a significant increased updraft between 450 and 1250 m height above the surface, and the wind direction below 500 m changed from northeast to northwest (Fig. 9). Concurrently, the tower temperatures also significantly increased and relative humidity decreased, and the wind profiles changed below 320 m (Fig. 10a–b), which implies that IAP was affected by the foehn at this time. The temperature and turbulence increased significantly mainly between 12:00 and 19:00 LST (Fig. 10c). As the HF approached, the wind weakened, the wind direction changed to the southwest and the humidity increased sharply. The boundary layer became more stably stratified near the surface, leading to enhanced pollution in the lowest few 100 m.
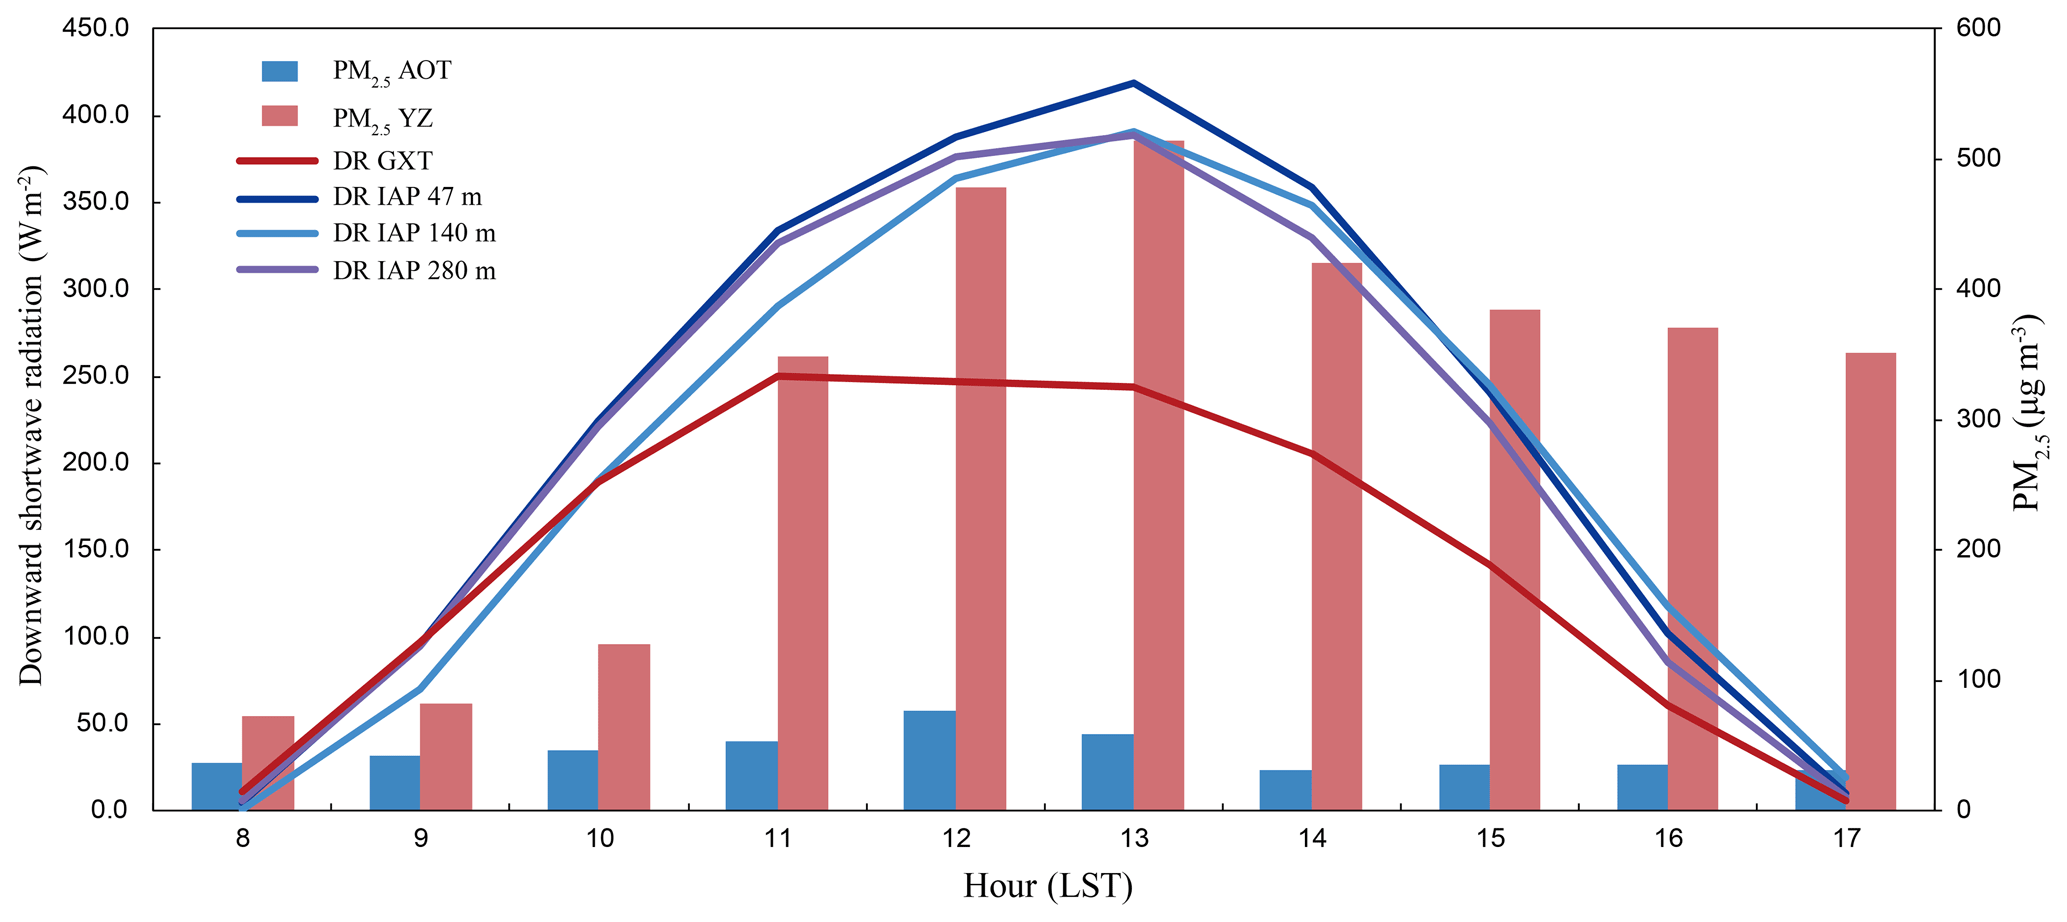
Figure 11The temporal variations of PM2.5 concentrations at AOT (blue bars) and YZ (red bars), and downward shortwave radiation at GXT and at heights of 47, 140 and 280 m on the IAP tower during daytime on 24 December 2015.
The solar radiation discrepancy between the clean and the polluted air mass was pronounced. Figure 11 shows downward shortwave radiation (DR) at IAP and GXT, as well as PM2.5 concentrations at AOT and YZ. Aerosols reduced the DR to 225 W m−2 at GXT at 11:00 LST, which is 36 W m−2 less than IAP. The radiation difference between IAP and GXT was 174 W m−2 at 13:00 LST. Meanwhile, the PM2.5 concentration was 456 µg m−3 higher at YZ than AOT. At GXT, higher concentrations of aerosol particles in the polluted air mass scattered more solar radiation and reduced the amount of solar radiation at the ground, leading to weaker turbulence and lower PBL height, which further enhanced the aerosol concentration near the ground. In contrast, at IAP there was less aerosol, more radiation and stronger turbulence resulting in a deeper PBL and less air pollution near the ground.
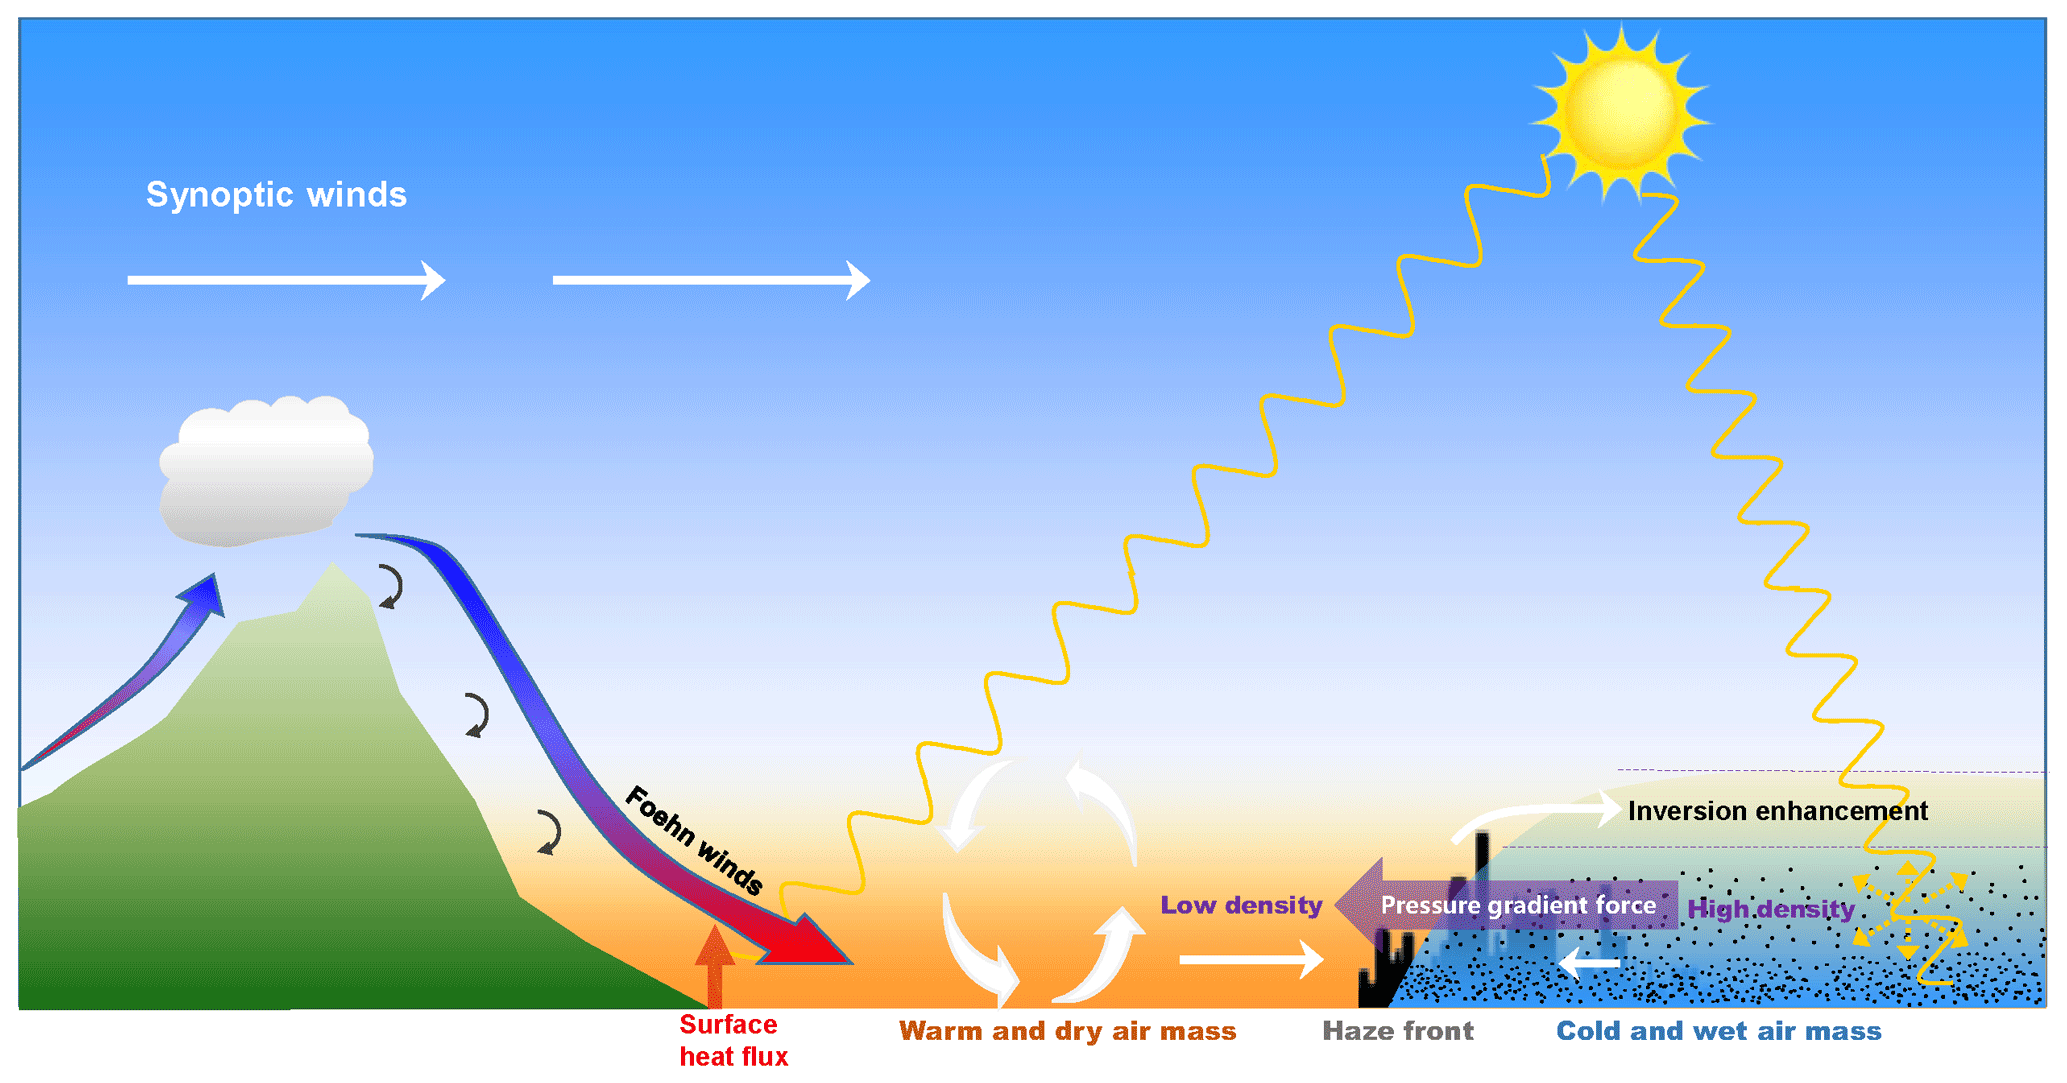
The formation of the HF is illustrated in Fig. 12. The fundamental process of HF formation is similar to the concept of colliding density currents discussed by Simpson (1997) and Kingsmill et al. (2003), due to the collision of a gust front with a sea breeze front (SBF). This results in high concentrations of pollutants in the convergence zone of the front (Yoshikado and Tsuchida, 1996; Dong et al., 2017; Li et al., 2019). As noted by Miller et al. (2003), who described the structure and characteristics of the SBF in detail, the sea breeze occurs under mostly-cloud-free skies, when the surface of the land heats up more rapidly than the sea. But in our case, the coastal area of Bohai Bay was covered mostly by clouds, fog, and haze during the daytime (Fig. 4), which decreased the contrast between the land and the sea and inhibited the sea breeze. Also, sea breezes occur normally around 11:00 LST in the Bohai Bay area in winter, which is later than in summer (Qiu and Fang, 2013). The typical speed of a SBF is 3.4 m s−1 (Simpson et al., 1977), considerably larger than the observed HF speed of ∼0.7 m s−1. Although the front we studied was not a SBF, the SBF has some similarities in shape and formation to the HF in our study. The sea breeze is one example of a gravity or density current, which is primarily a horizontal flow generated by a density difference of only a few percent. Field studies have confirmed that the SBF, as part of the sea breeze gravity current, has aspects of the sea breeze head (SBH), which had been simulated by Simpson (1994, 1997) using laboratory tanks and two bodies of water of slightly different densities. Likewise, in our case, a temperature difference between the warm and cold air mass resulted in a density difference between these air masses. Figures S4–S7 show air density distribution overlapping surface wind vectors and PM2.5 concentrations. Note that the biggest gradient of air density corresponds to the wind convergence line as well as the HF line. Both (i) the radiative heating difference between northern and southern areas and (ii) the difference between warm and dry foehns are key factors producing warm air masses. Southern hazy air masses reflect more solar radiation and thus inhibit an increase in surface temperature and turbulence mixing, leading to colder and denser air. In contrast, solar radiative heating enhances heating of the northerly clear and cleaner air mass which concurrently was affected by the warm foehn, leading to warmer and less dense air. The lower-density air mass collides with the higher-density air mass and subsequently overrides the denser air mass (Figs. 1c, 5e, 12). This aspect is very similar to the SBF. The warmer air overriding the cold–wet air mass also intensifies the inversion at the top of the boundary between two air masses, limiting the growth rate of the underlying layer and increasing its pollutant concentration. The interface between the warm–dry air mass and the cold–wet air mass formed the HF and a significant convergence line at the surface. This kind of convergence line can sometimes be found during air pollution events when pollutants transferred by southerly winds encounter northerly mountain winds at night in the BTH region (Li et al., 2019; Liang et al., 2018).
Typically for clear daytime conditions, the horizontal temperature differences between the air over mountains and the adjacent plains can produce upslope, up-valley, and plain–mountain winds, which are usually weak and often overpowered by strong foehns (Whiteman, 2000), and intensified wind speed in the upper air (Fig. 2d) as is the case here. Our results also show that the pressure difference between air masses is about 0.2 hPa before and after the HF passage (Fig. 8). This pressure gradient forcing creates a seesaw clash between the polluted and the clean air masses. The polluted air mass repeatedly encroaches into the clean air mass and is pushed back by the clean air mass. Eventually the polluted air mass wins. The lidar observed five wave-like polluted air invasions (Fig. 5). Thus the pressure difference between the air masses due to different air densities, although small, caused the hazy air mass to slowly swing north or northwest and inflicted severe pollution on the urban area. Li et al. (2016) showed that the polluted aerosol concentration in southern Beijing is normally higher than in the urban and northern rural areas of Beijing (Li et al., 2016). For typical regional air pollution events in Beijing, air pollutants are mainly transported from surrounding areas, especially Hebei Province and Tianjin, south of Beijing (Zheng et al., 2015; Zheng et al., 2018). Both urban heat island effects and aerosol radiation forcing result in polluted areas that are colder with higher air density than less polluted areas, leading to a weak pressure gradient between more polluted and less polluted air masses. During the daytime, the pressure gradient forcing by air density is overwhelmed by the forcing of plain–mountain winds, valley breezes and urban heat island circulations, enhancing pollution transport from southern to northern areas. At night, if mountain–plain winds and mountain breezes are weak, the pressure gradient forcing by air density can transport polluted air toward less polluted areas, which seems not to have been discussed previously. It implies that the weak pressure gradient could play an important role in pollution transport during the weak mountain–plain wind system and mountain–valley breeze periods.
Table 2Number of foehn cases in Beijing from 1 March 2015 to 29 February 2016.
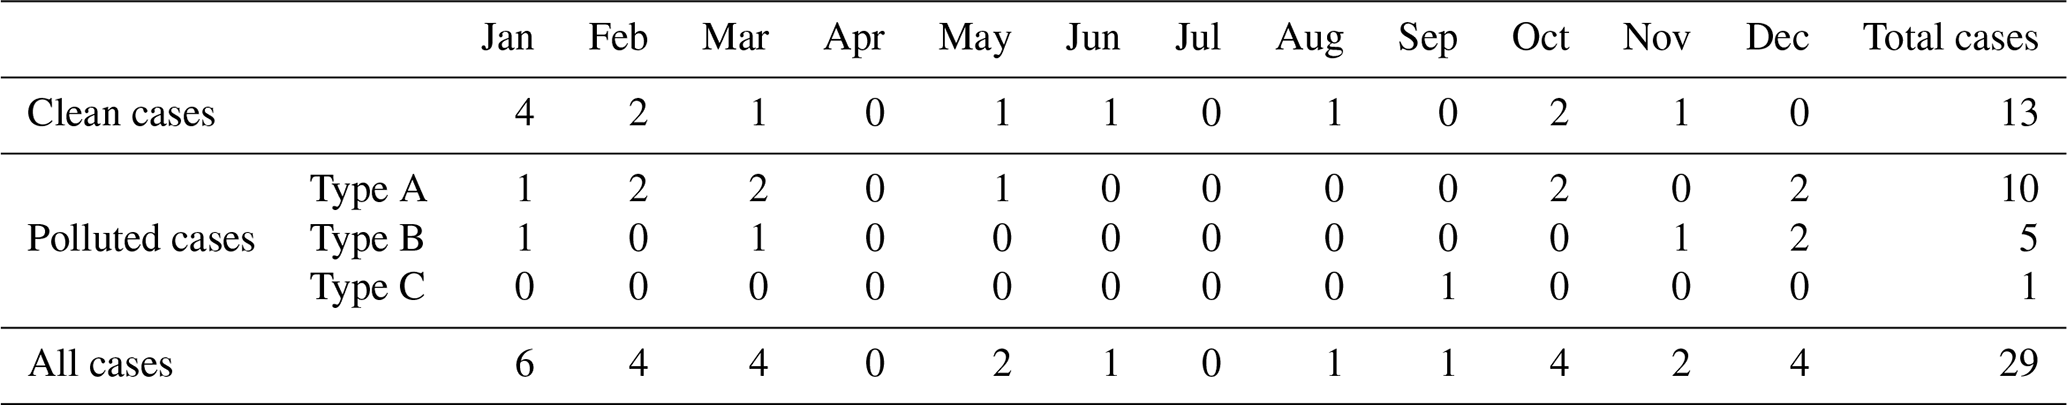
Clean cases: foehn cases in which average PM2.5 concentrations for CP,
AOT and YZ are less than 50 µg m−3.
Polluted cases: foehn cases in which average PM2.5 concentrations for CP, AOT
and YZ are greater than 50 µg m−3.
Type A: polluted cases where PM2.5 concentrations for CP, AOT and YZ
sites decreased within 24 h from the onset of foehn winds.
Type B: polluted cases where PM2.5 concentrations for CP, AOT and YZ
sites initially decreased and then increased within 24 h from the onset of
foehn winds.
Type C: polluted cases where PM2.5 concentrations for CP, AOT and YZ
sites increased within 24 h from the onset of foehn winds.
All cases: all clean cases and polluted cases.
In order to investigate the occurrence frequency of the foehn in Beijing, we analyzed 1 year of AWS data (PM2.5 data) at three sites, CP (CP), AOT (AOT) and GXT (YZ), representing northern suburban, urban and southern suburban areas, respectively (Table 2). For daily data sampled hourly, if meteorological variables of the CP site at 1 h meet the following criteria – (1) 1 h temperature increase is the highest among the three sites and greater than 1.5 ∘C and at least 1.0 ∘C higher than that at the GXT site, (2) 1 h relative humidity tendency is negative, and (3) hourly wind direction is greater than 270∘ or less than 90∘ – we define this day as a foehn case day. These criteria ensure that the CP site adjacent to the mountains has the most significant warming among three sites with the foehn coming from the mountain and with a relative humidity decrease, i.e., a typical foehn case. Note in Table 2 that during the months from OCT to MAR when severe haze events are also frequent in Beijing, there is a higher foehn frequency than other months. There are 16 foehn cases, about 55 % of all cases, connected to air pollution events. In 10 cases, PM2.5 concentrations for all sites decreased 24 h after the foehn's occurrence (Type A). In one case, PM2.5 concentrations for all sites increased after the foehn's occurrence (Type B). In five cases, including the case in this article, PM2.5 concentrations for all sites initially decreased and then increased 24 h after the foehn's occurrence (Type C). The foehn's effects on air pollution can be direct or indirect. The direct effect is that gusty foehns transport air pollutants, resulting in increasing or decreasing pollution concentration depending on whether the foehns are polluted or clean. The more complicated indirect effect is alteration of air mass properties and boundary layer structure by dry and warm foehn winds, which then influences air pollution. It is worth noting that Type B cases in Table 2, accounting for 17 % of total foehn cases, are likely due to the indirect effect leading to heavier air pollution and should be investigated further.
This is the first study to our knowledge in which an HF related to the foehn in the BTH region has been analyzed. Based on observations collected during SURF-15, we studied an HF on 24 December 2015 in Beijing. This HF was formed by the collision between a cold–humid polluted air mass with higher density and a warm–dry clean air mass with lower density which was mainly due to the foehn. Initially, fog occupied the plains areas southeast of Beijing associated with a hazy air mass early in the morning. The hazy–foggy air mass developed and invaded Beijing around noon. The fog dissipated in the afternoon. The warm–dry downslope foehn began to impact the northern plains before noon and moved south, gradually affecting other plains sites until colliding with the cold–wet polluted air mass south and east of the urban areas, leading to a convergence line and the HF boundary at noon. As the HF passed by surface sites, PM2.5 concentrations increased by more than 200 µg m−3 in 10 min. Following the HF, four surges of polluted air invaded the IUM site and consequently produced severe pollution. The HF boundary was clearly visible from satellite images and weather camera photos during the daytime. The formation of the HF is very similar to the SBF, although the front in our study cannot be explained as an SBF due to weak radiation and temperature contrast between the land and sea, its earlier occurrence time, and long distance inland. The sloped boundary of the HF tilts toward the polluted air mass as a result of the warm–dry clean air mass overriding the cold–wet polluted air mass. The HF slowly swings toward northern and northwestern clean areas. Our results show that as the foehn wind weakened and retreated, the weak pressure gradient between the warm–dry air mass and the cold–wet air mass was the main factor forcing the polluted air mass to slowly move north or northwest.
We segregate the effect of the foehn on air pollution into two types: a direct and an indirect effect. This foehn-induced HF event gives us a good opportunity to investigate both direct and indirect effects of the foehn on air pollution and haze events. Some studies have revealed the direct effect of the foehn on air pollution: stronger gusty foehns could diminish or even eliminate air pollutants. For the seldom-studied indirect effect of the foehn, enhanced differences in radiation and air density between clean and polluted air masses results in a weak pressure gradient between air masses, which allows the polluted air mass to invade the clean air mass. This mechanism could be more dominant especially when upslope winds, valley winds and plain–mountain winds retreat after sunset in Beijing. Also, warm–dry foehns could affect urban heat island and atmosphere stratification in the boundary layer and further affect air pollution.
Although air pollution events in BTH region have been studied from different aspects over decades, few studies have investigated the influence of the foehn on air pollution. Therefore, we recommend further studies on the formation mechanism of the foehn and its effects on air pollution in the BTH region.
The PM2.5 data are available on the website sources from the China Environmental Monitoring Station and the Beijing Environmental Protection Testing Center. Other data are available at http://www.ium.cn:8088/ (last access: 15 December 2020), which archives the SURF filed data collected from 2015 and 2016. All data used in this study can also be requested from the corresponding author (jli@ium.cn).
The video shows the haze front's passage, dramatic withdrawal and comeback in urban areas (https://doi.org/10.5446/49791, Li, 2020).
The supplement related to this article is available online at: https://doi.org/10.5194/acp-20-15793-2020-supplement.
JL and MZ had the original idea; JL, ZS, YD, ZC, YW and QL performed the integrative data analysis; JL, ZS and DHL wrote the manuscript. All authors discussed the results and commented on the paper.
The authors declare that they have no conflict of interest.
The authors would like to thank the anonymous reviewers for their helpful comments. This work was supported by the National Natural Science Foundation of China (41875123), the National Key Research and Development Program of China (2018YFF0300101), the Beijing Natural Science Foundation of China (grant no. 8171002), and the Ministry of Science and Technology of China (grant no. 2016YFC0203302). The National Center for Atmospheric Research is sponsored by the US National Science Foundation.
This research has been supported by the National Natural Science Foundation of China (grant no. 41875123), the National Key Research and Development Program of China (grant no. 2018YFF0300101), the Beijing Natural Science Foundation of China (grant no. 8171002), and the Ministry of Science and Technology of China (grant no. 2016YFC0203302).
This paper was edited by Geraint Vaughan and reviewed by two anonymous referees.
Ahrens, C. D.: Meteorology Today: An Introduction to Weather, Climate and the Environment, Thomson Learning, USA, 2003.
Brinkmann, W.: What is a foehn?, Weather, 26, 230–239, https://doi.org/10.1002/j.1477-8696.1971.tb04200.x, 1971.
Chen, J., Li, Z., Lv, M., Wang, Y., Wang, W., Zhang, Y., Wang, H., Yan, X., Sun, Y., and Cribb, M.: Aerosol hygroscopic growth, contributing factors, and impact on haze events in a severely polluted region in northern China, Atmos. Chem. Phys., 19, 1327–1342, https://doi.org/10.5194/acp-19-1327-2019, 2019.
Dang, R. and Liao, H.: Severe winter haze days in the Beijing–Tianjin–Hebei region from 1985 to 2017 and the roles of anthropogenic emissions and meteorology, Atmos. Chem. Phys., 19, 10801–10816, https://doi.org/10.5194/acp-19-10801-2019, 2019.
Dong, G., Yu, L., and Hao, T.: Analysis of meteorological characteristics of heavy haze process in Tianjin in autumn and winter and the role of sea breeze, Environ. Sci. Technol., 40, 117–123, 2017 (in Chinese).
Drechsel, S. and Mayr, J.: Objective forecasting of Foehn winds for a subgrid-scale Alpine Valley, Weather Forecast., 23, 205–218, https://doi.org/10.1175/2007WAF2006021.1, 2008.
Elvidge, A. D. and Renfrew, I. A.: The Causes of Foehn Warming in the Lee of Mountains, B. Am. Meteorol. Soc., 97, 455–466, https://doi.org/10.1175/bams-d-14-00194.1, 2016.
Gao, Y., Zhang, M., Liu, Z., Wang, L., Wang, P., Xia, X., Tao, M., and Zhu, L.: Modeling the feedback between aerosol and meteorological variables in the atmospheric boundary layer during a severe fog–haze event over the North China Plain, Atmos. Chem. Phys., 15, 4279–4295, https://doi.org/10.5194/acp-15-4279-2015, 2015.
Gohm, A., Harnisch, F., Vergeiner, J., Obleitner, F., Schnitzhofer, R., Hansel, A., Fix, A., Neiniger, B., Emeis, S., and Schafer, K.: Air pollution transport in an Alpine valley: Results from airborne and ground-based observations, Bound.-Lay. Meteorol., 131, 441–463, https://doi.org/10.1007/s10546-009-9371-9, 2009.
Guo, H., Cheng, T., Gu, X., Wang, Y., Chen, H., Bao, F., Shi, S., Xu, B., Wang, W., Zuo, X., Zhang, X., and Meng, C.: Assessment of PM2.5 concentrations and exposure throughout China using ground observations, Sci. Total Environ., 601–602, 1024–1030, https://doi.org/10.1016/j.scitotenv.2017.05.263, 2017.
Han, S., Hao, T., Zhang, Y., Liu, J., Li, P., Cai, Z., Zhang, M., Wang, Q., and Zhang, H.: Vertical observation and analysis on rapid formation and evolutionary mechanisms of a prolonged haze episode over Central-Eastern China, Sci. Total Environ., 616–617, 135–146, https://doi.org/10.1016/j.scitotenv.2017.10.278, 2018.
Han, T., Liu, X., Zhang, Y., Qu, Y., Zeng, L., Hu, M., and Zhu, T.: Role of secondary aerosols in haze formation in summer in the Megacity Beijing, J. Environ. Sci., 31, 51–60, https://doi.org/10.1016/j.jes.2014.08.026, 2015.
Han, X., Zhang, M., Gao, J., Wang, S., and Chai, F.: Modeling analysis of the seasonal characteristics of haze formation in Beijing, Atmos. Chem. Phys., 14, 10231–10248, https://doi.org/10.5194/acp-14-10231-2014, 2014.
Huang, R. J., Zhang, Y., Bozzetti, C., Ho, K. F., Cao, J. J., Han, Y., Daellenbach, K. R., Slowik, J. G., Platt, S. M., Canonaco, F., Zotter, P., Wolf, R., Pieber, S. M., Bruns, E. A., Crippa, M., Ciarelli, G., Piazzalunga, A., Schwikowski, M., Abbaszade, G., Schnelle-Kreis, J., Zimmermann, R., An, Z., Szidat, S., Baltensperger, U., El Haddad, I., and Prevot, A. S.: High secondary aerosol contribution to particulate pollution during haze events in China, Nature, 514, 218–222, https://doi.org/10.1038/nature13774, 2014.
Huang, X., Wang, Z., and Ding, A.: Impact of Aerosol-PBL Interaction on Haze Pollution: Multiyear Observational Evidences in North China, Geophys. Res. Lett., 45, 8596–8603, https://doi.org/10.1029/2018gl079239, 2018.
Jiang, C., Wang, H., Zhao, T., Li, T., and Che, H.: Modeling study of PM2.5 pollutant transport across cities in China's Jing–Jin–Ji region during a severe haze episode in December 2013, Atmos. Chem. Phys., 15, 5803–5814, https://doi.org/10.5194/acp-15-5803-2015, 2015b.
Jiang, J. K., Zhou, W., Cheng, Z., Wang, S. X., He, K. B., and Hao, J. M.: Particulate Matter Distributions in China during a Winter Period with Frequent Pollution Episodes (January 2013), Aerosol Air Qual. Res., 15, 494–503, https://doi.org/10.4209/aaqr.2014.04.0070, 2015a.
Kingsmill, D. E. and Crook, N. A.: An observational study of atmospheric bore formation from colliding density currents, Mon. Weather Rev., 131, 2985–3002, https://doi.org/10.1175/1520-0493(2003)131<2985:Aosoab>2.0.Co;2, 2003.
Li, J.: A haze front in Beijing, TIB AV-Portal, https://doi.org/10.5446/49791, 2020.
Li, J., Du, H., Wang, Z., Sun, Y., Yang, W., Li, J., Tang, X., and Fu, P.: Rapid formation of a severe regional winter haze episode over a mega-city cluster on the North China Plain, Environ. Pollut., 223, 605–615, https://doi.org/10.1016/j.envpol.2017.01.063, 2017.
Li, J., Sun, J., Zhou, M., Cheng, Z., Li, Q., Cao, X., and Zhang, J.: Observational analyses of dramatic developments of a severe air pollution event in the Beijing area, Atmos. Chem. Phys., 18, 3919–3935, https://doi.org/10.5194/acp-18-3919-2018, 2018.
Li, K., Liao, H., Cai, W., and Yang, Y.: Attribution of Anthropogenic Influence on Atmospheric Patterns Conducive to Recent Most Severe Haze Over Eastern China, Geophys. Res. Lett., 45, 2072–2081, https://doi.org/10.1002/2017gl076570, 2018.
Li, L., Wang, Z., Zhang, D., Chen, T., Jiang, L., and Li, Y.: Analysis of heavy air pollution episodes in Beijing during 2013–2014, Chinese Environ. Sci., 36, 27–35, 2016 (in Chinese).
Li, Q., Li, J., Zheng, Z., Wang, Y., and Yu, M.: Influence of Mountain Valley Breeze and Sea Land Breeze in Winter on Distribution of Air Pollutants in Beijing-Tianjin-Hebei Region, Environ. Sci., 40, 513–524, https://doi.org/10.13227/j.hjkx.201803193, 2019 (in Chinese).
Li, X., Xia, X., Wang, L., Cai, R., Zhao, L., Feng, Z., Ren, Q., and Zhao, K.: The role of foehn in the formation of heavy air pollution events in Urumqi, China. J. Geophys. Res.-Atmos., 120, 5371–5384, https://doi.org/10.1002/2014jd022778, 2015.
Liang, X., Miao, S., Li, J., Bornstein, R., Zhang, X., Gao, Y., Cao, X., Chen, F., Cheng, Z., Clements, C., Debberdt, W., Ding, A., Ding, D., Dou, J. J., Dou, J. X., Dou, Y., Grimoond, C. S. B., Gonzalez-Cruz, J., He, J., Huang, M., Huang, X., Ju, S., Li, Q., Niyogi, D., Quan, J., Sun, J., Sun, J. Z., Yu, M., Zhang, J., Zhang, Y., Zhao, X., Zheng, Z., and Zhou, M.: SURF: Understanding and predicting urban convection and haze, B. Am. Meteorol. Soc., 99, 1391–1413, https://doi.org/10.1175/bams-d-16-0178.1, 2018.
Liu, Q., Jia, X., Quan, J., Li, J., Li, X., Wu, Y., Chen, D., Wang, Z., and Liu, Y.: New positive feedback mechanism between boundary layer meteorology and secondary aerosol formation during severe haze events, Sci. Rep.-UK, 8, 6095, https://doi.org/10.1038/s41598-018-24366-3, 2018.
Liu, S., Liu, Z., Li, J., Wang, Y., Ma, Y., Sheng, L., Liu, H., Liang, F., Xin, G., and Wang, J.: Numerical simulation for the coupling effect of local atmospheric circulations over the area of Beijing, Tianjin and Hebei province, Sci. China Ser. D, 52, 382–392, https://doi.org/10.1007/s11430-009-0030-2, 2009.
Liu, T., Gong, S., He, J., Yu, M., Wang, Q., Li, H., Liu, W., Zhang, J., Li, L., Wang, X., Li, S., Lu, Y., Du, H., Wang, Y., Zhou, C., Liu, H., and Zhao, Q.: Attributions of meteorological and emission factors to the 2015 winter severe haze pollution episodes in China's Jing-Jin-Ji area, Atmos. Chem. Phys., 17, 2971–2980, https://doi.org/10.5194/acp-17-2971-2017, 2017.
Liu, X. G., Li, J., Qu, Y., Han, T., Hou, L., Gu, J., Chen, C., Yang, Y., Liu, X., Yang, T., Zhang, Y., Tian, H., and Hu, M.: Formation and evolution mechanism of regional haze: a case study in the megacity Beijing, China, Atmos. Chem. Phys., 13, 4501–4514, https://doi.org/10.5194/acp-13-4501-2013, 2013.
Luo, R., Zheng, Y. G., and Chen, M.: Mechanism of a rare night sudden intense warming event in Beijing and surrounding area, Meteorol. Monthly, 46, 478–489, 2020 (in Chinese).
Ma, Q., Wu, Y., Zhang, D., Wang, X., Xia, Y., Liu, X., Tian, P., Han, Z., Xia, X., Wang, Y., and Zhang, R.: Roles of regional transport and heterogeneous reactions in the PM2.5 increase during winter haze episodes in Beijing, Sci. Total Environ., 599–600, 246–253, https://doi.org/10.1016/j.scitotenv.2017.04.193, 2017.
McGowan, H. A., Sturman, P. A., and Owens, F. L.: Aeolian dust transport and deposition by foehn winds in an alpine environment, Lake Tekapo, New Zealand, Geomorphology, 15, 135–146, https://doi.org/10.1016/0169-555X(95)00123-M, 1996.
McGowan, H. A., Sturman, A. P., Kossmann, M., and Zawar-Reza, P.: Observation of foehn onset in the Southern Alps, New Zealand, Meteorol. Atmos. Phys., 79, 215–230, https://doi.org/10.1007/s007030200004, 2002.
Miao, Y., Guo, J., Liu, S., Liu, H., Zhang, G., Yan, Y., and He, J.: Relay transport of aerosols to Beijing-Tianjin-Hebei region by multi-scale atmospheric circulations, Atmos. Environ., 165, 35–45, https://doi.org/10.1016/j.atmosenv.2017.06.032, 2017.
Miller, S. T. K., Keim B. D., Talbot R. W., and Mao H.: Sea breeze: Structure, forecasting, and impacts, Rev. Geophys., 41, 1–31, https://doi.org/10.1029/2003rg000124, 2003.
Nkemdirim, L. C. and Leggat, K.: The effect of Chinook weather on urban heat islands and air pollution, Water Air Soil Pollut., 9, 53–67, 1978.
Norte, F.: Understanding and Forecasting Zonda Wind (Andean Foehn) in Argentina: A Review, Atmos. Climate Sci., 5, 163–193, https://doi.org/10.4236/acs.2015.53012, 2015.
Petäjä, T., Järvi, L., Kerminen, V.-M., Ding, A. J., Sun, J. N., Nie, W., Kujansuu, J., Virkkula, A., Yang, X., Fu, C. B., Zilitinkevich, S., and Kulmala, M.: Enhanced air pollution via aerosol-boundary layer feedback in China, Sci. Rep.-UK, 6, 18998, https://doi.org/10.1038/srep18998, 2016.
Qiu, X. and Fang, S.: Progress of Sea-Land Breeze Study and Characteristics of Sea-Land Breeze in Three Coastal Areas in China, Meteorol. Monthly, 39, 186–193, https://doi.org/10.7519/j.issn.1000-0526.2013.02.007, 2013 (in Chinese).
Ren, Y., Zhang, H., Wei, W., Wu, B., Cai, X., and Song, Y.: Effects of turbulence structure and urbanization on the heavy haze pollution process, Atmos. Chem. Phys., 19, 1041–1057, https://doi.org/10.5194/acp-19-1041-2019, 2019.
Richner, H. and Hächler, P.: Understanding and forecasting Alpine foehn, in: Mountain Weather Research and Forecasting, Springer Atmospheric Sciences, edited by: Chow, F. K., De Walker, S. F. J., and Snyder, B. J., 219–260, Springer, the Netherlands, 2013.
Simpson, J. E.: Sea Breeze and Local Wind, 234 pp., Cambridge Univ. Press, New York, 1994.
Simpson, J. E.: Gravity Currents in the Environment and the Laboratory, 244 pp., Cambridge Univ. Press, New York, 1997.
Simpson, J. E., Mansfield, D. A., and Milford, J. R.: Inland penetration of sea-breeze fronts, Q. J. Roy. Meteor. Soc., 103, 47–76, 1977.
Steiner, A. L., Mermelstein, D., Cheng, S. J., Twine, T. E., and Oliphant, A.: Observed Impact of Atmospheric Aerosols on the Surface Energy Budget, Earth Interact., 17, 1–22, https://doi.org/10.1175/2013ei000523.1, 2013.
Su, T., Li, Z., and Kahn, R.: Relationships between the planetary boundary layer height and surface pollutants derived from lidar observations over China: regional pattern and influencing factors, Atmos. Chem. Phys., 18, 15921–15935, https://doi.org/10.5194/acp-18-15921-2018, 2018.
Sun, F., Zhang, D., Sun, R., Dong, X., Wang, X., Wang, Z., and Cheng, N.: Typical heavy pollution episode analysis on PM2.5 in winter of Beijing, Environment Monitoring in China, 30, 1–12, https://doi.org/10.3969/j.issn.1002-6002.2014.06.001, 2014 (in Chinese).
Sun, Y., Chen, C., Zhang, Y., Xu, W., Zhou, L., Cheng, X., Zheng, H., Ji, D., Li, J., Tang, X., Fu, P., and Wang, Z.: Rapid formation and evolution of an extreme haze episode in Northern China during winter 2015, Sci. Rep.-UK, 6, 27151, https://doi.org/10.1038/srep27151, 2016.
Sun, Y. L., Jiang, Q., Wang, Z. F., Fu, P. Q., Li, J., Yang, T., and Yin, Y.: Investigation of the sources and evolution processes of severe haze pollution in Beijing in January 2013, J. Geophys. Res.-Atmos., 119, 4380–4398, https://doi.org/10.1002/2014jd021641, 2014.
Takane, Y. and Kusaka, H.: Formation Mechanisms of the Extreme High Surface Air Temperature of 40.9 ∘C Observed in the Tokyo Metropolitan Area: Considerations of Dynamic Foehn and Foehnlike Wind, J. Appl. Meteor. Climatol., 50, 1827–1841, https://doi.org/10.1175/JAMC-D-10-05032.1, 2011.
Tie, X., Huang, R.-J., Cao, J., Zhang, Q., Cheng, Y., Su, H., Chang, D., Pöschl, U., Hoffmann, T., Dusek, U., Li, G., Worsnop, D. R., and O'Dowd, C. D.: Severe Pollution in China Amplified by Atmospheric Moisture, Sci. Rep.-UK, 7, 15760, https://doi.org/10.1038/s41598-017-15909-1, 2017.
Vergeiner, J.: South foehn studies and a new foehn classification scheme in theWipp and Inn Valley, PhD thesis, Univ. of Innsbruck, Austria, 2004.
Wang, X. and Zhang, R.: Effects of atmospheric circulations on the interannual variation in PM2.5 concentrations over the Beijing–Tianjin–Hebei region in 2013–2018, Atmos. Chem. Phys., 20, 7667–7682, https://doi.org/10.5194/acp-20-7667-2020, 2020.
Wang, Y., Yao, L., Wang, L., Liu, Z., Ji, D., Tang, G., Zhang, J., Sun, Y., Hu, B., and Xin, J.: Mechanism for the formation of the January 2013 heavy haze pollution episode over central and eastern China, Sci. China Earth Sci., 57, 14–25, https://doi.org/10.1007/s11430-013-4773-4, 2013.
Wang, Y., Bao, S., Wang, S., Hu, Y., Shi, X., Wang, J., Zhao, B., Jiang, J., Zheng, M., Wu, M., Ruseel, A., Wang, Y., and Hao, J.: Local and regional contributions to fine particulate matter in Beijing during heavy haze episodes, Sci. Total Environ., 580, 283–296, https://doi.org/10.1016/j.scitotenv.2016.12.127, 2017.
Wang, Y. H., Liu, Z. R., Zhang, J. K., Hu, B., Ji, D. S., Yu, Y. C., and Wang, Y. S.: Aerosol physicochemical properties and implications for visibility during an intense haze episode during winter in Beijing, Atmos. Chem. Phys., 15, 3205–3215, https://doi.org/10.5194/acp-15-3205-2015, 2015.
Wang, Z., Ding, Y., Zhang, Y., Fan, J., Zhang, S., and Tian, L.: Feature and Mechanism of the Foehn Weather on East Slope Taihang Mountains: Case Analysis of the Effects of Lee Wave on Foehn Occurring and Moving, Plateau Meteorology, 31, 555–561, 2012a (in Chinese).
Wang, Z., Ding, Y., Zhang, Y., Wang, C., Li J., and Gu, Y.: Feature and Mechanism of the Foehn Weather on East Slope Taihang Mountains: Statistic Feature, Plateau Meteorology, 31, 547–554, 2012b (in Chinese).
Whiteman, C. D.: Mountain Meteorology: Fundamentals and Applications, Oxford Univ. Press, New York, 2000.
Wu, J., Bei, N., Hu, B., Liu, S., Zhou, M., Wang, Q., Li, X., Liu, L., Feng, T., Liu, Z., Wang, Y., Cao, J., Tie, X., Wang, J., Molina, L. T., and Li, G.: Is water vapor a key player of the wintertime haze in North China Plain?, Atmos. Chem. Phys., 19, 8721–8739, https://doi.org/10.5194/acp-19-8721-2019, 2019.
Yang, X., Yang, M., Li, J., and Zhang, S.: Impact Analysis of a Taihang Mountain Fohn on Haze Intensity, Meteorol. Monthly, 44, 313–319, https://doi.org/10.7519/j.issn.1000-0526.2018.02.011, 2018.
Yoshikado, H. and Tsuchida, M.: High levels of winter air pollution uder the influence of the urban heat island along the shore of Tokyo Bay, J. Appl. Meteorol., 35, 1804–1813, 1996.
Zhang, B., Wang, Y., and Hao, J.: Simulating aerosol–radiation–cloud feedbacks on meteorology and air quality over eastern China under severe haze conditionsin winter, Atmos. Chem. Phys., 15, 2387–2404, https://doi.org/10.5194/acp-15-2387-2015, 2015.
Zhang, R. H., Li, Q., and Zhang, R. N.: Meteorological conditions for the persistent severe fog and haze event over eastern China in January 2013, Sci. China Earth Sci., 57, 26–35, https://doi.org/10.1007/s11430-013-4774-3, 2014.
Zhao, S., Wang, R., Guo, Y., Tan, J., and Shi, Z.: The Foehn in the Middle Range of Taihang Mountain, Meteorol. Monthly, 19, 3–6, 1993 (in Chinese).
Zhao, X. J., Zhao, P. S., Xu, J., Meng,, W., Pu, W. W., Dong, F., He, D., and Shi, Q. F.: Analysis of a winter regional haze event and its formation mechanism in the North China Plain, Atmos. Chem. Phys., 13, 5685–5696, https://doi.org/10.5194/acp-13-5685-2013, 2013.
Zheng, G. J., Duan, F. K., Su, H., Ma, Y. L., Cheng, Y., Zheng, B., Zhang, Q., Huang, T., Kimoto, T., Chang, D., Pöschl, U., Cheng, Y. F., and He, K. B.: Exploring the severe winter haze in Beijing: the impact of synoptic weather, regional transport and heterogeneous reactions, Atmos. Chem. Phys., 15, 2969–2983, https://doi.org/10.5194/acp-15-2969-2015, 2015.
Zheng, Z., Xu, G., Yang, Y., Wang, Y., and Li, Q.: Statistical characteristics and the urban spillover effect of haze pollution in the circum-Beijing region, Atmos. Pollut. Res., 9, 1062–1071, https://doi.org/10.1016/j.apr.2018.04.004, 2018.
Zhong, J., Zhang, X., Wang, Y., Sun, J., Zhang, Y., Wang, J., Tan, K., Shen, X., Che, H., Zhang, L., Zhang, Z., Qi, X., Zhao, H., Ren, S., and Li, Y.: Relative contributions of boundary layer meteorological factors to the explosive growth of PM2.5 during the red-alert heavy pollution episodes in Beijing in December 2016, J. Meteorol. Res.-PRC, 31, 809–819, https://doi.org/10.1007/s13351-017-7088-0, 2017.