the Creative Commons Attribution 4.0 License.
the Creative Commons Attribution 4.0 License.
Exploring the drivers of the increased ozone production in Beijing in summertime during 2005–2016
Wenjie Wang
David D. Parrish
Min Shao
Ziwei Mo
Sihua Lu
Min Hu
Xin Fang
Yusheng Wu
Limin Zeng
Yuanhang Zhang
In the past decade, average PM2.5 concentrations decreased rapidly under the strong pollution control measures in major cities in China; however, ozone (O3) pollution emerged as a significant problem. Here we examine a unique (for China) 12-year data set of ground-level O3 and precursor concentrations collected at an urban site in Beijing (PKUERS, campus of Peking University), where the maximum daily 8 h average (MDA8) O3 concentration and daytime Ox (O3+NO2) concentration in August increased by 2.3±1.2 ppbv ( %) yr−1 and 1.4±0.6 ( %) yr−1, respectively, from 2005 to 2016. In contrast, daytime concentrations of nitrogen oxides (NOx) and the OH reactivity of volatile organic compounds (VOCs) both decreased significantly. Over this same time, the decrease of particulate matter (and thus the aerosol optical depth) led to enhanced solar radiation and photolysis frequencies, with near-surface J(NO2) increasing at a rate of 3.6±0.8 % yr−1. We use an observation-based box model to analyze the combined effect of solar radiation and ozone precursor changes on ozone production rate, P(O3). The results indicate that the ratio of the rates of decrease of VOCs and NOx (about 1.1) is inefficient in reducing ozone production in Beijing. P(O3) increased during the decade due to more rapid atmospheric oxidation caused to a large extent by the decrease of particulate matter. This elevated ozone production was driven primarily by increased actinic flux due to PM2.5 decrease and to a lesser extent by reduced heterogeneous uptake of HO2. Therefore, the influence of PM2.5 on actinic flux and thus on the rate of oxidation of VOCs and NOx to ozone and to secondary aerosol (i.e., the major contributor to PM2.5) is important for determining the atmospheric effects of controlling the emissions of the common precursors of PM2.5 and ozone when attempting to control these two important air pollutants.
Please read the corrigendum first before continuing.
-
Notice on corrigendum
The requested paper has a corresponding corrigendum published. Please read the corrigendum first before downloading the article.
-
Article
(1610 KB)
- Corrigendum
-
Supplement
(246 KB)
-
The requested paper has a corresponding corrigendum published. Please read the corrigendum first before downloading the article.
- Article
(1610 KB) - Full-text XML
- Corrigendum
-
Supplement
(246 KB) - BibTeX
- EndNote
Tropospheric ozone (O3) plays a key role in the oxidizing capacity of the atmosphere and affects the global climate; high concentrations of ground-level ozone are harmful to human health and ecosystems (Monks et al., 2015; Fiore et al., 2009). Ozone is produced rapidly in sun-lit polluted air by photochemical oxidation of volatile organic compounds (VOCs) in the presence of nitrogen oxides (NOx ≡ NO+NO2) (Atkinson, 2000). In recent years, China has undergone rapid economic development, resulting in higher demand for energy and greater usage of fossil fuels. As a result, high emissions to the atmosphere produce heavy pollution in eastern China, which now suffers from severe ozone pollution, especially in urban areas, where the daily maximum 8 h average (MDA8) ozone level often exceeds the standard of 80 ppb (Li et al., 2014; Wang et al., 2011; Zhang et al., 2014; Lu et al., 2018; Li et al., 2019a). A recent study reported that the national warm-season (April–September) fourth highest MDA8 ozone level (86.0 ppb) and the number of days with MDA8 values of >70 ppb were much higher than regional averages in Japan, South Korea, Europe, or the United States (Lu et al., 2018). Satellite observations found that regional ozone concentrations in eastern China increased by 7 % between 2005 and 2010 (Verstraeten et al., 2015). From 2013 to 2017, the O3 concentrations in 74 cities as a whole showed an upward trend with the Beijing-Tianjin-Hebei region being the most serious (Li et al., 2019a; Lu et al., 2018). Better understanding of the causes of elevated ozone in China is important for developing effective emission control strategies to reduce the ozone pollution problem.
Aerosols impact ozone production primarily in two ways: alteration of photolysis rates by aerosol radiative influence and heterogeneous reactions occurring on the aerosol surface. The reduction of photolysis frequencies by the extinction effect of aerosol and thus its influence on ozone production has been explored in the past (Dickerson et al., 1997; Castro et al., 2001; Real and Sartelet, 2011; Gerasopoulos et al., 2012; Wang et al., 2019). Absorbing aerosols reduce photolysis frequencies throughout the boundary layer, and as a result they decrease near-surface photochemical ozone production (de Miranda et al., 2005; Jacobson, 1998; Wendisch et al., 1996; Raga et al., 2001). Conversely, scattering aerosols in the boundary layer increase photolysis frequencies throughout the troposphere and thereby increase ozone production aloft (Jacobson, 1998; Tian et al., 2019; Dickerson et al., 1997). The importance of aerosol heterogeneous reactions in ozone photochemistry in China has been previously investigated in model studies (Lou et al., 2014; Li et al., 2018b; Xu et al., 2012; Li et al., 2019a). The effects of NO2, NO3, and N2O5 heterogeneous reactions showed opposite O3 concentration changes in VOC-limited and NOx-limited regions. In a VOC-limited region, NO2, NO3, and N2O5 heterogeneous reactions led to ozone concentration increases (Lou et al., 2014; Xu et al., 2012). The heterogeneous reaction of HO2 decreases ozone production in both VOC-limited and NOx-limited regions by decreasing the reaction rate of HO2 with NO (Lou et al., 2014; Li et al., 2019a).
In the past decade, eastern China has experienced severe fine particulate matter (PM2.5) pollution in winter (Zhang et al., 2016), and this issue has been the main focus of the government's air pollution control strategy. These stringent emission control measures have significantly decreased the concentrations of particulate matter in many Chinese cities. During 2008–2013, ground-level PM2.5 estimated from satellite-retrieved aerosol optical depth (AOD) in China declined at a rate of 0.46 (Z. W. Ma et al., 2016). Another study indicated that the annual average concentration of PM2.5 in Beijing decreased by 1.5 and 27 % in total from 2000 to 2015 under the implementation of 16 phases of air pollution control measures (Lang et al., 2017). Hu et al. (2017) reported that PM2.5 in Beijing declined significantly from 2006 to 2016 when solar radiation increased (Hu et al., 2017). However, despite the reduction in emissions of particulate matter (PM) and ozone precursors, ozone concentrations increased.
In Beijing, the second largest city in China with rapid economic development and urbanization in recent years, ozone pollution is one of the worst among China's cities. Thus, Beijing is a representative city in which to study urban ozone pollution in China. Despite extensive study of the relationship between ozone and its precursors in Beijing and other megacities in China (Zhang et al., 2014; Chou et al., 2011; Lu et al., 2019; Liu et al., 2012), there remains a lack of understanding of the cause of the long-term surface ozone concentration increase that accompanied reductions in precursor emissions. In this study, we utilize measurements from a representative urban site in Beijing to explore how the variations in solar radiation and heterogeneous reactions influence the trend of ozone and the coupling effect of aerosol and ozone precursor changes on ozone production. Our overall goal is to determine the extent to which increasing actinic flux caused by the decline in PM contributed to the observed increase in ozone concentrations. This research provides a clearer understanding of how efforts to reduce PM concentrations affect ozone concentrations, and it thus informs air quality improvement efforts in China's urban areas.
2.1 Measurements of air pollutants, photolysis frequencies, and aerosol surface concentration
Ambient air pollutants and photolysis frequencies were measured at an urban site in Beijing in August between 2005 and 2016. The site (39.99∘ N, 116.31∘ E) was located on the roof of a six-story building (∼20 m above the ground level) on the campus of Peking University (PKUERS) near the 4th Ring Road with a high density of traffic but without obvious industrial or agricultural sources (Wehner et al., 2008). Temporal trends of air pollutants and composition of VOCs are thought to be representative of the whole of Beijing (Wang et al., 2010; Xu et al., 2011; Zhang et al., 2012). Measured parameters include O3, NOx, CO, SO2, C2–C10 VOCs, photolysis frequencies, and aerosol surface concentration. The measurement techniques are included in the Table 1.
Table 1Instruments deployed in the measurement campaign undertaken in August during 2005–2016 and used for data analysis.
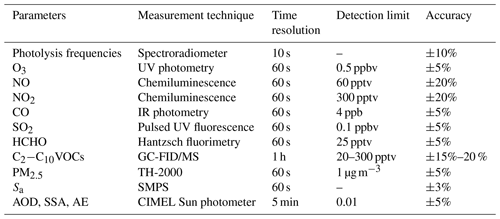
During 2006 and 2008, ambient levels of VOCs were measured using an online GC-FID (gas chromatograph with flame ionization detector) system built by the Research Center for Environmental Changes (RCEC; Taiwan). A detailed description of this system and QA/QC (quality assurance and quality control) procedures can be found in Wang et al. (2004). During August 2007 and 2009, ambient VOCs were measured using a commercial GC-FID/PID (photoionization detector) system (Syntech Spectra GC955 series 600/800 analyzer) (Xie et al., 2008; Zhang et al., 2014). From 2010 to 2016, VOCs were measured using a cryogen-free online GC-MS/FID system developed by Peking University. A detailed description of this system and QA/QC procedures can be found in Yuan et al. (2012) and Wang et al. (2014). Formaldehyde (HCHO) concentrations were measured by Hantzsch fluorimetry.
Photolysis frequencies (including J(O1D), J(NO2), J(HONO), J(HCHO)M, J(HCHO)R, J(H2O2)) were calculated from solar actinic flux spectra measured by a spectroradiometer as described by Bohn et al. (2008). The particle number size distributions were measured by a system consisting of two scanning mobility particle sizers: Nano-SMPS, TSI DMA3085 + CPC3776 and TSI DMA3081 + CPC3775. Aerosol surface concentration (Sa) during 2006–2016 was calculated from the measured particle number size distributions between 3 and 700 nm by assuming the particles are spherical in shape.
2.2 Estimate of photolysis frequencies
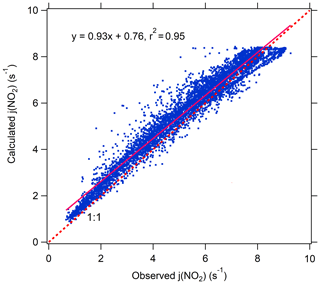
Photolysis frequencies were measured in August 2011–2014 and 2016. The Tropospheric Ultraviolet and Visible (TUV) radiation model (version 5.3) was used to calculate photolysis frequencies in August over the entire 2006–2016 period under clear-sky conditions. TUV uses the Discrete Ordinate Algorithm (DISORT) with four streams and calculates the actinic flux spectra with a wavelength range of 280–420 nm in 1 nm steps and resolution. We used observed aerosol optical properties including AOD, single scattering albedo (SSA), Ångström exponent (AE), and total ozone column to constrain the TUV model (Madronich, 1993). The calculated values agree well with measured results as shown in Fig. 1 indicating that the TUV model accurately calculated the photolysis frequencies. Data of photolysis frequencies under cloudless conditions were selected according to the presence of AOD data since AOD measurements were not possible under cloudy conditions.
2.3 Measurements of aerosol optical properties
Aerosol optical properties were measured with a CIMEL Sun photometer (AERONET level 1.5 and level 2.0 data collection, http://aeronet.gsfc.nasa.gov/, last access: 1 August 2019) at the Beijing-CAMS site (39.933∘ N, 116.317∘ E) and at the Beijing site (39.977∘ N, 116.381∘ E). The instrumentation, data acquisition, retrieval algorithms, and calibration procedure (which conform to the standards of the AERONET global network) are described in detail by Fotiadi et al. (2006). The solar extinction measurements taken every 3 min within the spectral range 340–1020 nm were used to compute AOD at 340, 380, 440, 500, 675, 870, 970, and 1020 nm. The overall uncertainty in AOD data under cloud-free conditions was 0.02 at a wavelength of 440 nm (Dubovik and King, 2000). In this study, AOD at the wavelength of 380 nm was chosen for analysis. This wavelength was selected as it is more representative of J(NO2). In addition to AOD, that network also provided single scattering albedo (SSA) and Ångström exponent (AE) data.
Cloud optical thickness (COT) was acquired from Aura satellite measurements with a time resolution of 24 h. Total ozone column was obtained by OMI (Ozone Monitoring Instrument), using overpass data.
2.4 Trend analysis method
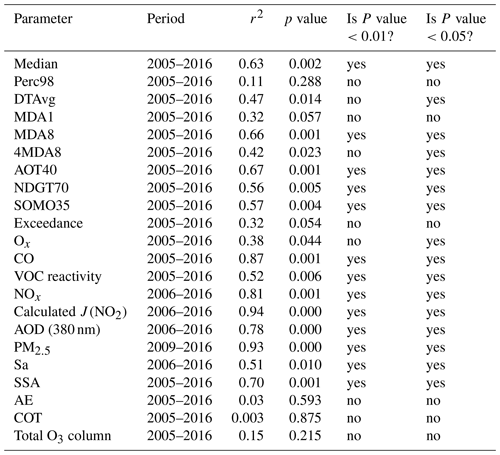
A simple linear regression (the least-squares method) was implemented to investigate temporal trends of ozone, precursors, aerosol optical properties, PM2.5, and photolysis frequencies. The null hypothesis is that air pollutants and time have no linear relationship, and this was tested using the standard F-statistic test (ratio of the mean-square regression to the mean-square residual). The p value associated with the F statistic is the probability of mistakenly rejecting the null hypothesis (; ). The p values for the trends of different parameters are summarized in Table 2.
2.5 Chemical box model
Ozone production rate, P(O3), is calculated by a chemical box model. This model is based on the compact Regional Atmospheric Chemical Mechanism version 2 (RACM) described by Goliff et al. (2013), which includes 17 stable inorganic species, 4 inorganic intermediates, 55 stable organic compounds, and 43 intermediate organic compounds. Compounds that are not explicitly treated in the RACM are lumped into species with similar functional groups. The isoprene mechanism includes a more detailed mechanism based on the Leuven Isoprene Mechanism (LIM) proposed by Peeters et al. (2009). A detailed description of this model can be found in Tan et al. (2017).
In this study, the model was constrained by measured hourly average CO, NO2, O3, SO2, NMHCs (56 species of non-methane hydrocarbons), HCHO, photolysis frequencies, temperature, pressure, and relative humidity. HONO was not measured. HONO concentrations are generally underestimated by the gas-phase reaction source of HONO (OH+NO → HONO) in urban areas due to the emission of HONO and the heterogeneous reaction of NOx at surfaces to form HONO, both of which are related to NOx concentration. As a result, the HONO concentration was calculated according to the concentration of NO2 and the observed ratio of HONO to NO2 at an urban site in Beijing, which had a marked diurnal cycle (Hendrick et al., 2014). For the model calculation, the ratio of HONO to NO2 is equal to 0.08 at 06:00 LT (all times in this paper are given in local time unless stated otherwise) and decreases linearly from 0.08 to 0.01 during 06:00–10:00, reflecting increasing photolysis of HONO, and maintains the value of 0.01 during 10:00–18:00. In this study, we focused on daytime P(O3) (06:00–18:00); thus, the nocturnal HONO concentrations were not required.
RO2, HO2, and OH were simulated by the box model to calculate the ozone production and loss rates as shown in Eqs. (1) and (2) as derived by Mihelcic et al. (2003).
where θ is the fraction of O1D from ozone photolysis that reacts with water vapor. i and j represent the number of species of RO2 and alkenes, respectively.
The model runs were performed in a time-dependent mode with 2 d spin-up time. A 24 h lifetime was introduced for all simulated species, such as secondary species and radicals, to approximately simulate dry deposition and other losses of these species (Lu et al., 2013). This lifetime corresponds to an assumed deposition velocity of 1.2 cm s−1 and a well-mixed boundary layer height of about 1 km. Sensitivity tests show that this assumed deposition lifetime has a relatively small influence on the reactivity of modeled oxidation products and ROx radicals.
Aerosols can influence O3 production by heterogeneous reactions such as uptake of HO2, NO2, N2O5, and NO3. For these species, the heterogeneous uptake of HO2 is expected to have the largest effect on rapid ozone production in summertime and VOC-limited conditions (Li et al., 2019a). Thus, the effect of heterogeneous reaction of HO2 on ozone production was simulated in the chemical box model using RH-corrected aerosol surface concentration (Saw) and uptake coefficient of HO2. The rate of change in HO2 due to irreversible uptake is expressed by Eq. (3).
where C, v, and are the gas-phase concentration, mean molecular velocity, and uptake coefficient, respectively. To derive Saw, we used the measured hygroscopic factor (Liu et al., 2009) and measured RH to correct the measurement-derived Sa to ambient conditions. In this study, we chose provided by laboratory measurements of HO2 uptake by aerosol particles collected at two mountain sites in eastern China (Taketani et al., 2012). The effects of HO2 uptake on P(O3) in Beijing in 2006 were simulated assuming that the product of HO2 uptake by aerosols is either H2O or H2O2. The results indicate that the two scenarios showed no significant difference because the recycling of HOx radicals from H2O2 is inefficient (Li et al., 2019a). In the following simulations in this study, the product of HO2 uptake by aerosols is taken to be H2O.
Heterogeneous uptake of N2O5, NO2, and NO3 was included in the chemical box model. This includes for converting N2O5 to HNO3 (Wang et al., 2017), for conversion of NO2 to HONO and HNO3 (which yields a good simulation of HONO∕NO2 concentration ratios in China; Shah et al., 2020), and for conversion of NO3 to HNO3 (Jacob, 2000).
3.1 Trend of ozone
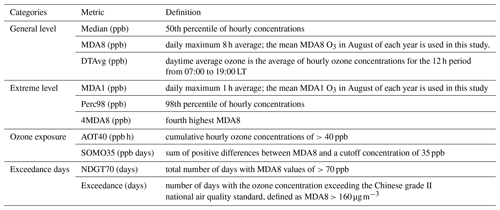
Ozone pollution levels can be characterized by a number of metrics. Table 3 lists 10 ozone metrics and their definition summarized by Lu et al. (2018). We classify these indicators into four categories: (1) metrics that characterize general levels of ozone, such as median value of hourly ozone concentrations (median), daily maximum 8 h average ozone concentration (MDA8), and daytime average ozone concentration (DTAvg); (2) metrics that characterize extreme levels of ozone, such as daily maximum 1 h average ozone concentration (MDA1), 98th percentile of hourly ozone concentrations (Perc98), and fourth highest MDA8 (4MDA8); (3) metrics that characterize ozone exposure, such as cumulative hourly ozone concentrations of >40 ppb (AOT40) and sum of positive differences between MDA8 and a cutoff concentration of 35 ppb (SOMO35); (4) the metrics that characterize the days when the ozone exceeds the standard, such as total number of days with MDA8 values of >70 ppb (NDGT70) and number of days with the ozone concentration exceeding the Chinese grade II national air quality standard (Exceedance). Figure 2 presents variations in these four categories of ozone metrics at the PKUERS site during the study periods. The results show that overall all metrics increased during the 12-year period. However, the percent increase, the p value, and the correlation coefficient vary between metrics. The median, DTAvg, and MDA8 indicators, which characterize the general concentration levels of ozone, increased at rates of 2.8 %–5.7 % yr−1. The metrics that characterize the extreme concentration levels of ozone increased more slowly (1.2 %–2.7 % yr−1). Among them, Perc98 had the smallest rate of increase, only 1.2 % yr−1, and the correlation is not significant (p=0.29, r2=0.11). This indicates that increases in the extreme ozone pollution was less significant. In contrast, the increase rates of the ozone exposure metrics AOT40 and SOMO35 are faster, 8.4 % yr−1 and 8.3 % yr−1, respectively, than the metrics that characterize ozone concentrations. The NDGT70 and Exceedance metrics, related to the number of days of ozone exceeding the standard, showed the fastest increases, 10 % yr−1 and 9.8 % yr−1, respectively.
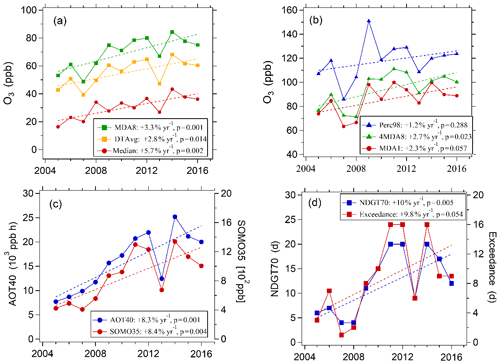
Figure 2Variations in multiple O3 metrics at the PKUERS site in Beijing in August between 2005 and 2016.
As shown in Fig. 3, from 2005 to 2016 MDA8 O3 concentrations increased at a rate of 2.3±1.2 ppbv (3.3±1.8 %) yr−1 (r2=0.66) at the PKUERS site, which corresponds to a total MDA8 ozone concentration increase of 25.3 ppbv. Meanwhile, Ox (O3+NO2) concentrations increased at a slower rate of 1.4±0.6 ppbv (1.9±0.8 %) yr−1, due to the decrease in NOx concentrations (Fig. 5).
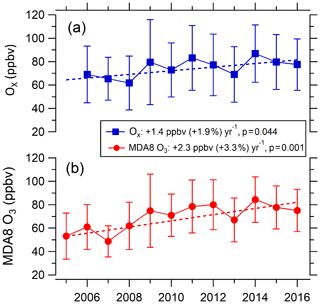
Figure 3Variations in average MDA8 O3 and daytime (07:00–19:00) average Ox in Beijing in August between 2005 and 2016.
Temperature and wind speed, which can directly influence ozone production and concentrations, showed no significant trend during 2005–2016 (Fig. 4). The average temperatures in summer were between 26 and 31 ∘C. The temperature in 2005 was the lowest and in 2007 it was the highest. The average wind speeds were less than 2.5 m s−1 in all years. The average relative humidity may have decreased slightly (∼1.5 % yr−1). In summary, we believe that meteorological factors did not play more than a minor role in the overall Beijing O3 trend. Therefore, our discussion focuses on photochemical processes.
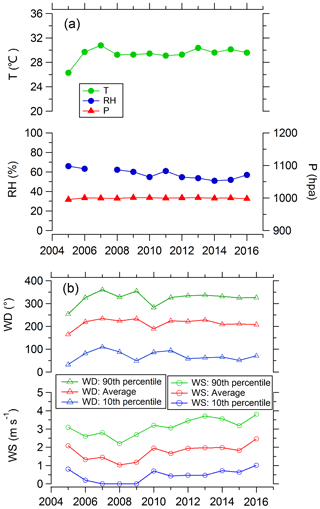
Figure 4Variations in daytime (07:00–19:00) averages of meteorological conditions including temperature (T), relative humidity (RH), wind direction (WD), and wind speed (WS) in Beijing in August during 2005–2016.
The ozone concentration observed at a receptor site depends on two contributions: regional background ozone and local photochemical production. We have no direct measurements of the long-term trend of regional background ozone in Beijing, but others have reported measurements of ozone at regional background sites in China. At a baseline Global Atmospheric Watch (GAW) station in the northeastern Tibetan Plateau region (Mt. Waliguan; 36.28∘ N, 100.9∘ E) the average annual daytime ozone concentration increased at a rate of 0.24 ppb yr−1, over the 1994 to 2013 period, but there was no significant trend in summer (Xu et al., 2018). The measurement at a rural station (Dingling site) in Beijing (40.29∘ N, 116.22∘ E; 34 km northwest of the observation site in this study) showed a decrease of ozone at a rate of −0.47 ppb yr−1 over the 2004 to 2015 period (Cheng et al., 2016). The MDA8 ozone concentration at the Shangdianzi site, a background station in Beijing, showed an increasing trend of 1.1 ppb yr−1 during 2004–2014 (Z. Ma et al., 2016). Additionally, there were very small trends of O3 concentrations at the background site (Dongtan) in Shanghai, located to the south of the North China Plain (Gao et al., 2017). However, these background sites in Beijing and Shanghai may be strongly affected by local emissions. MDA8 ozone concentrations at the Changdao site, a background site in the east of the North China Plain that is much less influenced by local emissions, increased slowly (+1.2 ppbv yr−1, r2=0.11), but that rate is not statistically significant (p=0.25) during 2013–2019 (Fig. S1 in the Supplement). Based on these reports of smaller and variable trends, we assume that the trend in regional background ozone in the North China Plain made only a minor contribution to the relatively larger ozone trend observed at the PKUERS site ( ppbv yr−1, r2=0.66, p=0.001). We thus surmise that the increase in O3 at the PKUERS site was mainly due to “local” photochemistry driven by emissions of ozone precursors from the central urban and surrounding suburban areas of Beijing.
3.2 Trend of gaseous precursors
This increase in ozone concentrations is opposite to the decreasing trend of its precursors, including VOCs, CO, and NOx (Fig. 5). The overall change in the total OH loss rate due to VOCs (VOC reactivity) was −0.36 s−1 yr−1 (−6.0 % yr−1). For anthropogenic VOCs, the highest reactivity was generally contributed by alkene species, with an average value over the 11 years of 2.00±0.43 s−1, followed by aromatics and alkanes, with average reactivities of 1.51±0.74 and 0.92±0.60 s−1, respectively. Thus, the alkenes and aromatics are more important for O3 production than are alkanes. The trends for alkenes, aromatics, and alkanes were a decreases of 0.14 s−1 (7.1 %), 0.12 s−1 (7.9 %), and 0.065 s−1 (7.0 %) yr−1, respectively, indicating that alkenes and aromatics also played the dominant role in the reduction of anthropogenic VOC reactivity. The rate of decrease in VOCs at the PKUERS site is similar to that reported for Los Angeles by Warneke et al. (2012) and Pollack et al. (2013) (7.3 %–7.5 % yr−1 over 50 years). The decrease in anthropogenic VOCs in Los Angeles was predominantly attributed to decreasing emissions from motor vehicles due to increasingly strict emissions standards. Similarly, a previous study at the PKUERS site indicated that the decreasing anthropogenic VOC was mainly attributed to the reduction of gasoline evaporation and vehicular exhaust under the implementation of stricter emissions standards for new vehicles and specific control measures for in-use vehicles (M. Wang et al., 2015). For naturally emitted VOCs (mainly isoprene), the OH reactivity had little trend with large fluctuations, as the emissions of plants vary greatly with temperature and light intensity. Therefore, the decrease in total VOCs reactivity was dominated by the decrease in anthropogenic VOCs. Similarly, CO, which is mainly contributed by anthropogenic emissions, decreased rapidly (9.3 % yr−1) during 2006–2016.
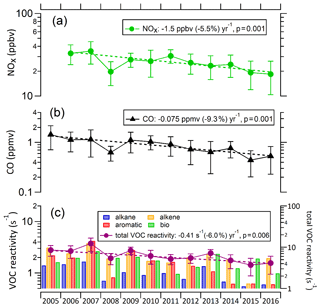
Figure 5Variations in geometric mean of daytime NOx, CO, and VOC reactivity in Beijing in August between 2005 and 2016. VOCs reactivity is depicted by reactivity of each species (left axis) and total VOC reactivity (right axis). On the y axes, a log scale is used.
NOx data in 2005 were not available. Therefore, the trend of NOx during 2006–2016 was analyzed. Daytime concentrations of NOx at the PKUERS site also decreased significantly from 2006 to 2016 (Fig. 5), with a slope (excluding 2008, which had a much lower NOx concentration due to enhanced emission controls implemented during the Olympic Games) of −1.48 ppbv yr−1 (−5.5 % yr−1, r2=0.81). The decrease in NOx was mainly due to the reduction in vehicle exhaust and coal combustion (Zhao et al., 2013). The decrease in NOx was significantly faster than that found in Los Angeles by Pollack et al. (2013) (2.6 % yr−1 over 50 years). In contrast to Beijing, Los Angeles O3 concentrations have continuously decreased from 1980 to 2010 (Parrish et al., 2016). The ratio of the rates of decrease of VOCs and NOx in Los Angeles (2.9) is significantly greater than unity and larger than that at the PKUERS site (1.1), which possibly can be a contributing cause of the opposite trends of ozone in the two regions. It worth noting that the precursor concentrations in 2008, the Olympic Games year, were particularly low, but ozone was nevertheless on the regression line. The monthly average ratio of VOC reactivity to NOx concentration in 2008 is 0.28 s−1 ppbv−1, higher than the average ratio of VOC reactivity to NOx concentration during 2006–2016 (0.24 s−1 ppbv−1). The adverse reduction ratio of VOC to NOx is the main cause of inefficient reduction in O3 level in 2008, which is consistent with the study of Chou et al. (2011).
Since 2013, under the implementation of the Action Plan on Air Pollution Prevention and Control (http://www.gov.cn/zwgk/2013-09/12/content_2486773.htm, last access: 1 August 2019), more stringent emission control measures were implemented to restrict industrial and vehicle emissions. As a result, there are indications that both VOCs and NOx decreased faster over the 2013 to 2016 period: 0.81 s−1 yr−1 (16 % yr−1, r2=0.71) and 1.94 ppbv yr−1 (9.3 % yr−1, r2=0.78) for VOC reactivity and NOx, respectively. This could be the cause of the decline in O3 concentrations from 2014 to 2016.
3.3 Trend of particulate matter
From 2009 to 2016, PM2.5 concentrations declined rapidly, achieving the air quality standard of China (35 µg m−3) in 2016 (Fig. 6). Since 2000, Beijing had implemented 16 phases of air pollution control measures, mainly including the controlling of industry, motor vehicle, coal combustion, and fugitive dust pollution, which was effective for the reduction in PM2.5 (Lang et al., 2017). Especially the strengthening of the reduction in coal combustion, which was gradually replaced by natural gas since 2004, favored improved visibility in Beijing (Zhao et al., 2011).
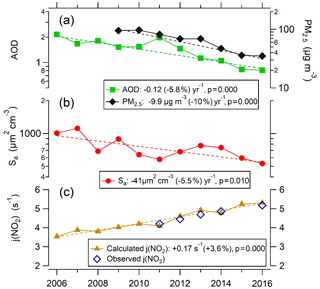
Figure 6Variations in daytime (07:00–19:00) averages of AOD (380 nm), PM2.5, Sa, J(NO2) calculated J(NO2) by TUV in Beijing in August between 2006 and 2016. AOD and J(NO2) are both corresponding to cloudless weather. On the y axes, a log scale is used for PM2.5, AOD, and Sa, and a linear scale is used for J(NO2).
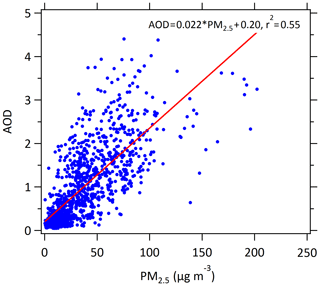
As shown in Fig. 6, from 2006 to 2016 AOD decreased at a rate of 9.3 % yr−1. The correlation between AOD and PM2.5 can be determined from the observations of PM2.5 and AOD in August during 2009–2016 at the PKUERS site (Fig. 7). AOD and PM2.5 are linearly correlated with a correlation coefficient of +0.74. This result indicates that the decrease in PM2.5 was the primary cause of the reduction in AOD. In addition to PM2.5, relative humidity also has an important effect on AOD. The decrease in relative humidity during 2006–2016 (Fig. 4) would reduce the hygroscopic growth of aerosol, leading to a weakened extinction effect of particulate matter on solar radiation (Qu et al., 2015). It is worth noting that although PM2.5 in 2011 was lower than that in 2010, AOD in 2011 was higher than that in 2010 (Fig. 6). For one reason, the relative humidity in 2011 was higher. Additionally, the aerosol type, atmospheric boundary layer height and the vertical structure of aerosol distribution also affects the dependence of AOD on PM2.5 (Zheng et al., 2017), probably contributing to the scatter about the AOD versus PM2.5 relationship shown in Fig. 7.
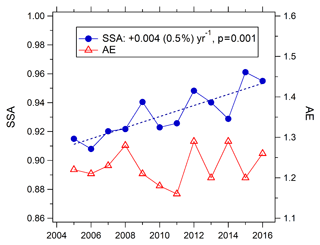
Monthly-mean AE (380/550 nm) in August showed no overall trend during 2006–2016 (Fig. 8). The monthly AE means were between 0.87 and 1.2, suggesting that the size-distribution of aerosol was generally stable during this period. Monthly-mean SSA (440 nm) in August showed an upward trend of +0.004 yr−1 (+0.45 % yr−1, p=0.001) during 2006–2016 (Fig. 8), indicating the proportion of the light-absorbing component of aerosols (e.g., black carbon) has decreased, due to the stringent and effective controls on the burning of biomass/biofuel and coal (Ni et al., 2014; Cheng et al., 2013). This result is consistent with the studies of Lang et al. (2017) and X. M. Wang et al. (2016), which indicated that black carbon in China's megacities has decreased rapidly over the past decade.
3.4 Trend of photolysis frequencies
The influence of solar radiation on O3 photochemistry can be described by actinic flux (or photolysis frequencies). We chose J(NO2) as a representative photolysis frequency to analyze the trend of actinic flux. Wang et al. (2019) studied the quantitative relationship between J(NO2) and AOD at the PKUERS site, and found that J(NO2) and AOD showed a clear nonlinear negative correlation at a given SZA (solar zenith angle), with slopes ranging from −1.3 to s−1 at AOD <0.7, indicating a significant extinction effect of AOD on actinic flux near the ground.
The J(NO2) calculated by the TUV model under clear-sky conditions shows an upward trend of 3.6 % yr−1 from 2005 to 2016 and agrees well with the 5 years of observed values from 2011 to 2016 (Fig. 6). According to sensitivity analysis of TUV, the decrease in AOD plays a dominant role in the J(NO2) increase, contributing about 80 % of the total. Additionally, the increase in SSA also contributes significantly to J(NO2) increase, contributing about 17 %.
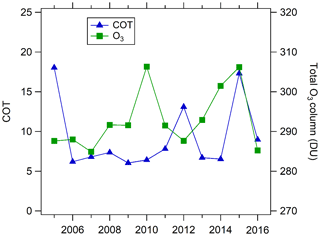
In addition to aerosol optical properties, the photolysis frequency in the planetary boundary layer is affected by other factors, including cloud extinction, ground reflection, absorption by gases such as O3, and Rayleigh scattering by gases. The ground reflection is relatively stable for different years in the same city with stable ground covering. The change in Rayleigh scattering of gases and absorption of NO2, SO2, and HCHO plays a negligible role in the variation in photolysis frequencies according to sensitivity analysis of the TUV model. This is consistent with the results of Barnard et al. (2004). As shown in Fig. 9, the total ozone column fluctuated between 285–307 DU (Dobson unit) without a significant overall trend. The magnitude of total ozone column variation (22 DU) can change J(O1D) by about 10 %, but it plays a negligible role in changing other photolysis frequencies according to sensitivity analysis using the TUV model. The cloud optical thickness (COT) for most years was relatively stable, ranging from 6 to 8, but in 2005, 2012, and 2015 COT was significantly larger (Fig. 9). As there was no significant trend of COT, we surmised that the light-extinction effect of clouds did not play a key role in determining the trend of photolysis frequencies.
3.5 Combined effect of changes in ozone precursors and aerosols on ozone production
We investigated the overall effect of the changes in VOCs, NOx, photolysis frequency, and aerosol uptake of HO2 on ozone production rate using the chemical box model. We focus on the period during 2006–2016 due to the lack of NOx data in 2005. By testing the response of P(O3) as calculated from Eq. (1) to the changes of VOCs and NOx concentrations (Fig. 10), we concluded that photochemical environment of the PKUERS site was, on average, in the VOC-limited regime. This result is consistent with previous studies (Zhang et al., 2014; Chou et al., 2011). Under this condition, the long-term decrease in VOCs in Beijing has contributed to a decrease in P(O3), while the decrease in NOx has tended to increase P(O3). As shown in Fig. 11, when the increases in photolysis frequencies and aerosol uptake of HO2 were not included in the calculation, the simulated daytime average P(O3) decreased slightly at a rate of 1.1 % yr−1. This indicates that the ratio of the rates of decrease of VOCs and NOx (about 1.1) is nearly inefficient in reducing ozone production in Beijing. However, when the increase in photolysis frequencies was included in the model calculation, the calculated daytime average P(O3) showed an increasing trend of 2.2 % yr−1. This result indicates that the increase in photolysis frequencies more than compensated for the downward trend of O3 production driven by decreased VOCs and NOx, leading to increasing O3 production through the decade. The photochemical box model calculations indicate that the increase in photolysis frequencies has two major impacts on P(O3) – an increase in primary production of OH through accelerated photolysis of O3, HONO, HCHO, and other carbonyl compounds and an accelerated radical recycling of OH as VOCs are oxidized. As particulate matter has decreased and photolysis frequencies correspondingly have increased, a more rapidly decreasing rate of the VOC to NOx ratio is required to achieve a significant reduction in O3 in the future.
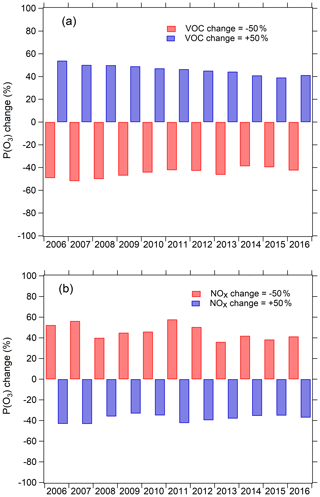
Figure 10Sensitivity of monthly daytime mean P(O3) to VOCs and NOx simulated by box model during 2006–2016. VOCs and NOx are increased by 50 % or decreased by 50 % to test the fractional change in monthly daytime mean P(O3).
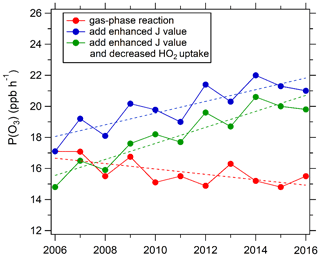
Figure 11Trend of monthly daytime mean P(O3) simulated by the chemical box model. Red dots: only the gas-phase reactions are considered in the box model constrained by observed photolysis frequencies from 2006 for all 11 years. Blue dots: the box model as above, but constrained by the photolysis frequencies derived for each year. Green dots: the box model constrained by the photolysis frequencies derived for each year with the changing aerosol uptake of HO2 also considered.
The simulated P(O3) in the afternoon hours (12:00–15:00) when ozone production is active and HOx levels are high increased at a rate of 1.3 % yr−1, which is lower than the increasing rate of daytime average P(O3) (2.2 % yr−1) (Fig. S2). Hollaway et al. (2019) show that the impacts of aerosols on the summertime photolysis of NO2 and ozone at surface in Beijing are important before 11:00 and after 15:00 but very limited in afternoon hours due to smaller SZA and lower light absorption of aerosol (i.e., higher SSA) in the afternoon. However, the diurnal variation of simulated P(O3) in this study indicates that the influence of aerosols on P(O3) is still significant in the afternoon, leading to average P(O3) decreased by ∼18 % (Fig. S3), which is slightly lower than the mean daytime decrease (26 %). This is because the average AOD in the afternoon (1.4) is significantly higher than that before 11:00 (0.94) and after 15:00 (1.1) despite the smaller SZA and higher SSA.
When we include heterogeneous uptake of HO2 in the model, the calculated P(O3) increases at a faster rate of 2.9 % yr−1 due to the overall reduced aerosol surface concentration (Sa), which reduces heterogeneous uptake of HO2 (Fig. 11). This result indicates that the effect of heterogeneous uptake of HO2 contributed roughly 0.7 % yr−1 to the P(O3) increase. Hence, our result indicates that the increase in photolysis rates due to PM decrease plays a more important role than the decrease in heterogeneous uptake of HO2 by aerosols in accelerating ozone production in Beijing. Previous measurements indicate that the uptake coefficient varies widely from 0.003 to 0.5 with a strong dependence on the aerosol concentration of transition metal ions such as Cu(II) (Zou et al., 2019; Taketani et al., 2008; Lakey et al., 2015; Matthews et al., 2014; Lakey et al., 2016). This strong dependence on aerosol composition implies that a single assumed value for has large uncertainty. used in our simulation is likely an overestimate of the effect of heterogeneous uptake of HO2 on ozone production rate at the PKUERS site.
A few heterogeneous chemical reactions of nitrogen oxides are thought to be potential influential factors of ozone production. For example, the heterogeneous uptake of NO2 to produce HNO3 and HONO and the heterogeneous uptake of NO3 and N2O5 to produce HNO3. Our simulation indicates that the reduced heterogeneous uptake of NOx caused P(O3) to increase by only ∼2.2 % during 2006–2016. Li et al. (2019a) also reported that the effect of heterogeneous uptake of nitrogen oxides on ozone is very small under VOC-limited and summertime conditions in the North China Plain. Our simulated result in summertime Beijing, where VOC-limited photochemistry dominates, is consistent with the result of Li et al. (2019a).
In summertime, PM in the Beijing urban area is mainly formed by the secondary conversion of gaseous precursors (Han et al., 2015; Guo et al., 2014), indicating that VOCs and NOx are not only the precursors of ozone but also the main precursors of PM in this urban area. In addition, observations in Beijing have shown that the secondary components of PM, including secondary organic matter, ammonium sulfate and ammonium nitrate, dominate the light extinction of PM (Han et al., 2014, 2017; Q. Q. Wang et al., 2015). As a result, reductions in VOCs and NOx are expected to lead to a decrease in secondary PM formation and thus to further enhancement in solar radiation (or actinic flux). Therefore, in order to reduce ozone effectively, the contribution of VOCs and NOx to secondary PM formation and their effect on solar radiation must be comprehensively considered. However, the summertime formation of PM is quite complex; the conversion efficiency of gaseous precursors to aerosols and the resulting influence on ozone production is a research area that requires further study.
3.6 Additional considerations
One limitation of this study is that the photochemical box model is constrained by surface observations and hence may not accurately represent some aspects of the photochemistry through the full depth of the planetary boundary layer over Beijing. Here we briefly consider several of these aspects. (1) The treatment of ozone and precursor concentrations of VOC and NOx likely are accurately represented, because rapid daytime vertical mixing ensures that there is only a small vertical gradient in the concentrations of these relatively long-lived species. (2) In daytime, the HONO lifetime is so short that it may be largely confined to near the surface, where it has surface sources (heterogeneous reaction of H2O and NO2 and emissions on surfaces). Therefore, the estimated HONO based on near-surface NO2 concentrations may overestimate average boundary layer HONO concentrations; however, in this study the influence of HONO on the calculation is relatively small, so this is not a large source of error. (3) The model is constrained by surface measurements of photolysis frequencies, but these surface measurements do not accurately quantify the actinic flux throughout the boundary layer. Figure 12 presents the vertical profiles of J(NO2) simulated by the TUV model for aerosol properties representative of Beijing. A thick layer of aerosol effectively reduces radiation at the bottom of the layer but not at the top, where radiation may be enhanced due to upward scattering from the aerosol below (Dickerson et al., 1997; Jacobson, 1998). Overall, vertical average J(NO2) increased by 32 % from 2006 to 2016, which is comparable to the surface increase (36 %). These simulations indicate that the increased trend of J(NO2) derived from surface observations do approximate the trend through the entire boundary layer. However, there is a shift in the vertical profile of J(NO2) that is important. The crossing point between the J(NO2) profile of 2006 and zero AOD profile is above the PBL (planetary boundary layer), while in 2016 the J(NO2) profile crosses the zero AOD profile within the PBL. This means that as the AOD is reduced further, changes in the vertical average J(NO2) will be limited, since increases in J(NO2) near the top of the PBL will compensate for decreases near the surface. Additionally, this also denotes that the role of PM2.5 may be more important under condition like 2006, but will be limited under condition like 2016 when there is offsetting effect for PBL ozone by vertical mixing caused by larger ozone vertical gradient (Gao et al., 2020).
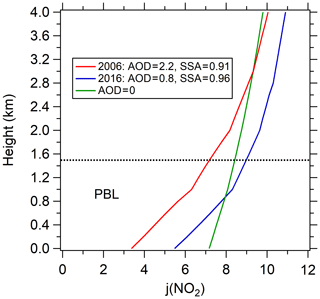
Figure 12Vertical profiles of J(NO2) simulated by the TUV model in Beijing. Three scenarios are simulated: the model parameters are (1) AOD =2.2 and SSA =0.91 in August 2006, (2) AOD =0.8 and SSA =0.96 in August 2016, and (3) AOD =0. The daytime average SZA =53∘ is used for all simulations. The dotted line represents the top of the boundary layer.
Quantitative studies suggested that the impact of aerosols via affecting photolysis rates on net ozone production (Cai et al., 2013; Wang et al., 2019; Castro et al., 2001) is more than on surface ozone concentrations (Jacobson, 1998; G. Li et al., 2011; J. Li et al., 2011; J. Wang et al., 2016). Moreover, several different transport model studies (Xing et al., 2017; Li et al., 2018a; Li et al., 2019b) also show that the impact of PM2.5 on summer surface ozone concentrations is not important, which is different from the relatively large change in net ozone production in this study. There are several possible causes of this difference. (1) The net ozone production characterizes the local ozone production level but cannot completely represent ozone concentrations that are also influenced by regional transport of ozone (Streets et al., 2007; Wang et al., 2020; Moghani et al., 2018). (2) The light-extinction effect of aerosols led to ozone at the top of the PBL being entrained by turbulence to the surface to partly counteract the reduction in surface ozone photochemical production induced by aerosols (Gao et al., 2020). (3) AOD decreased by 58 % in Beijing in this study, which is higher than that of regional AOD decrease in eastern China (20 %) (Li et al., 2019a). (4) The photolysis rates in this study are determined using the observed AOD SSA and confirmed by ground-level measurements of photolysis frequencies, while photolysis rates are determined using an online algorithm in other transport model studies. The different calculation procedures also contribute to the different results between our study and other transport model studies.
During the past decade, China has devoted very substantial resources to improving the environment. These efforts have improved atmospheric particulate matter loading, but ambient ozone levels have continued to increase. Based on the long-term measurements at a representative site in Beijing, we explored the factors driving the increase in ozone production. Consistent with the implementation of stringent emission control measures, concentrations of PM2.5 and ozone precursors (VOCs and NOx) decreased rapidly, but in contrast surface O3 and Ox concentrations increased. This investigation finds that the primary cause of the O3 increase is that decreasing PM concentrations led to an increase in actinic flux, which in turn increased the photochemical production of ozone. This result indicates that the influence of aerosol on ozone production is important for determining the full range of manifold atmospheric effects that result from reducing the emissions of the O3 and PM precursors.
The data can be accessed upon contact with the corresponding authors.
The supplement related to this article is available online at: https://doi.org/10.5194/acp-20-15617-2020-supplement.
WW acquired, analyzed, and interpreted the data; drafted the article; and revised it critically. XL substantially contributed to conception and design and revised the article critically. DDP, MS, and ZM revised the article critically. YL, SL, MH, XF, YW, LZ, and YZ collected data.
The authors declare that they have no conflict of interest.
This work was supported by the Major Program of the National Natural Science Foundation of China. We thank Hongbin Chen and Philippe Goloub for data management of AOD and other aerosol optical properties on AERONET.
This research has been supported by the Major Program of the National Natural Science Foundation of China (grant nos. 91644222, 91644108).
This paper was edited by Yugo Kanaya and reviewed by Ke Li and one anonymous referee.
Atkinson, R.: Atmospheric chemistry of VOCs and NOx, Atmos. Environ., 34, 2063–2101, 2000.
Barnard, J. C., Chapman, E. G., Fast, J. D., Schmelzer, J. R., Slusser, J. R., and Shetter, R. E.: An evaluation of the FAST-J photolysis algorithm for predicting nitrogen dioxide photolysis rates under clear and cloudy sky conditions, Atmos. Environ., 38, 3393–3403, https://doi.org/10.1016/j.atmosenv.2004.03.034, 2004.
Bohn, B., Corlett, G. K., Gillmann, M., Sanghavi, S., Stange, G., Tensing, E., Vrekoussis, M., Bloss, W. J., Clapp, L. J., Kortner, M., Dorn, H.-P., Monks, P. S., Platt, U., Plass-Dülmer, C., Mihalopoulos, N., Heard, D. E., Clemitshaw, K. C., Meixner, F. X., Prevot, A. S. H., and Schmitt, R.: Photolysis frequency measurement techniques: results of a comparison within the ACCENT project, Atmos. Chem. Phys., 8, 5373–5391, https://doi.org/10.5194/acp-8-5373-2008, 2008.
Cai, Y. F., Wang, T. J., and Xie, M.: Impacts of atmospheric particles on surface ozone in Nanjing, Climatic Environment Research, 18, 251–260, 2013 (in Chinese).
Castro, T., Madronich, S., Rivale, S., Muhlia, A., and Mar, B.: The influence of aerosols on photochemical smog in Mexico City, Atmos. Environ., 35, 1765–1772, https://doi.org/10.1016/S1352-2310(00)00449-0, 2001.
Cheng, N., Li, Y., Zhang, D., Chen, T., Sun, F., Chen, C., and Meng, F.: Characteristics of Ground Ozone Concentration over Beijing from 2004 to 2015: Trends, Transport, and Effects of Reductions, Atmos. Chem. Phys. Discuss., https://doi.org/10.5194/acp-2016-508, 2016.
Cheng, Y., Engling, G., He, K.-B., Duan, F.-K., Ma, Y.-L., Du, Z.-Y., Liu, J.-M., Zheng, M., and Weber, R. J.: Biomass burning contribution to Beijing aerosol, Atmos. Chem. Phys., 13, 7765–7781, https://doi.org/10.5194/acp-13-7765-2013, 2013.
Chou, C. C.-K., Tsai, C.-Y., Chang, C.-C., Lin, P.-H., Liu, S. C., and Zhu, T.: Photochemical production of ozone in Beijing during the 2008 Olympic Games, Atmos. Chem. Phys., 11, 9825–9837, https://doi.org/10.5194/acp-11-9825-2011, 2011.
de Miranda, R. M., Andrade, M. D., and Fattori, A. P.: Preliminary studies of the effect of aerosols on nitrogen dioxide photolysis rates in the city of Sao Paulo, Brazil, Atmos. Res., 75, 135–148, https://doi.org/10.1016/j.atmosres.2004.12.004, 2005.
Dickerson, R. R., Kondragunta, S., Stenchikov, G., Civerolo, K. L., Doddridge, B. G., and Holben, B. N.: The Impact of Aerosols on Solar Ultraviolet Radiation and Photochemical Smog, Science, 278, 827–830, https://doi.org/10.1126/science.278.5339.827, 1997.
Dubovik, O. and King, M. D.: A flexible inversion algorithm for retrieval of aerosol optical properties from Sun and sky radiance measurements, J. Geophys. Res., 105, 20673–20696, https://doi.org/10.1029/2000jd900282, 2000.
Fiore, A. M., Dentener, F. J., Wild, O., Cuvelier, C., Schultz, M. G., Hess, P., Textor, C., Schulz, M., Doherty, R. M., Horowitz, L. W., MacKenzie, I. A., Sanderson, M. G., Shindell, D. T., Stevenson, D. S., Szopa, S., Van Dingenen, R., Zeng, G., Atherton, C., Bergmann, D., Bey, I., Carmichael, G., Collins, W. J., Duncan, B. N., Faluvegi, G., Folberth, G., Gauss, M., Gong, S., Hauglustaine, D., Holloway, T., Isaksen, I. S. A., Jacob, D. J., Jonson, J. E., Kaminski, J. W., Keating, T. J., Lupu, A., Marmer, E., Montanaro, V., Park, R. J., Pitari, G., Pringle, K. J., Pyle, J. A., Schroeder, S., Vivanco, M. G., Wind, P., Wojcik, G., Wu, S., and Zuber, A.: Multimodel estimates of intercontinental source-receptor relationships for ozone pollution, J. Geophys. Res., 114, D04301, https://doi.org/10.1029/2008jd010816, 2009.
Fotiadi, A., Hatzianastassiou, N., Drakakis, E., Matsoukas, C., Pavlakis, K. G., Hatzidimitriou, D., Gerasopoulos, E., Mihalopoulos, N., and Vardavas, I.: Aerosol physical and optical properties in the Eastern Mediterranean Basin, Crete, from Aerosol Robotic Network data, Atmos. Chem. Phys., 6, 5399–5413, https://doi.org/10.5194/acp-6-5399-2006, 2006.
Gao, J., Li, Y., Zhu, B., Hu, B., Wang, L., and Bao, F.: What have we missed when studying the impact of aerosols on surface ozone via changing photolysis rates?, Atmos. Chem. Phys., 20, 10831–10844, https://doi.org/10.5194/acp-20-10831-2020, 2020.
Gao, W., Tie, X. X., Xu, J. M., Huang, R. J., Mao, X. Q., Zhou, G. Q., and Chang, L. Y.: Long-term trend of O3 in a mega City (Shanghai), China: Characteristics, causes, and interactions with precursors, Science Total Environ., 603, 425–433, https://doi.org/10.1016/j.scitotenv.2017.06.099, 2017.
Gerasopoulos, E., Kazadzis, S., Vrekoussis, M., Kouvarakis, G., Liakakou, E., Kouremeti, N., Giannadaki, D., Kanakidou, M., Bohn, B., and Mihalopoulos, N.: Factors affecting O-3 and NO2 photolysis frequencies measured in the eastern Mediterranean during the five-year period 2002–2006, J. Geophys. Res., 117, D22305, https://doi.org/10.1029/2012jd017622, 2012.
Goliff, W. S., Stockwell, W. R., and Lawson, C. V.: The regional atmospheric chemistry mechanism, version 2, Atmos. Environ., 68, 174–185, https://doi.org/10.1016/j.atmosenv.2012.11.038, 2013.
Guo, S., Hu, M., Zamora, M. L., Peng, J., Shang, D., Zheng, J., Du, Z., Wu, Z., Shao, M., Zeng, L., Molina, M. J., and Zhang, R.: Elucidating severe urban haze formation in China, P. Natl. Acad. Sci. USA, 111, 17373–17378, https://doi.org/10.1073/pnas.1419604111, 2014.
Han, T. T., Liu, X. G., Zhang, Y. H., Qu, Y., Gu, J. W., Ma, Q., Lu, K. D., Tian, H. Z., Chen, J., Zeng, L. M., Hu, M., and Zhu, T.: Characteristics of Aerosol Optical Properties and Their Chemical Apportionments during CAREBeijing 2006, Aerosol Air Qual. Res., 14, 1431–1442, https://doi.org/10.4209/aaqr.2013.06.0203, 2014.
Han, T. T., Liu, X. G., Zhang, Y. H., Qu, Y., Zeng, L. M., Hu, M., and Zhu, T.: Role of secondary aerosols in haze formation in summer in the Megacity Beijing, J. Environ. Sci., 31, 51–60, https://doi.org/10.1016/j.jes.2014.08.026, 2015.
Han, T. T., Xu, W. Q., Li, J., Freedman, A., Zhao, J., Wang, Q. Q., Chen, C., Zhang, Y. J., Wang, Z. F., Fu, P. Q., Liu, X. G., and Sun, Y. L.: Aerosol optical properties measurements by a CAPS single scattering albedo monitor: Comparisons between summer and winter in Beijing, China, J. Geophys. Res.-Atmos., 122, 2513–2526, https://doi.org/10.1002/2016jd025762, 2017.
Hendrick, F., Müller, J.-F., Clémer, K., Wang, P., De Mazière, M., Fayt, C., Gielen, C., Hermans, C., Ma, J. Z., Pinardi, G., Stavrakou, T., Vlemmix, T., and Van Roozendael, M.: Four years of ground-based MAX-DOAS observations of HONO and NO2 in the Beijing area, Atmos. Chem. Phys., 14, 765–781, https://doi.org/10.5194/acp-14-765-2014, 2014.
Hollaway, M., Wild, O., Yang, T., Sun, Y., Xu, W., Xie, C., Whalley, L., Slater, E., Heard, D., and Liu, D.: Photochemical impacts of haze pollution in an urban environment, Atmos. Chem. Phys., 19, 9699–9714, https://doi.org/10.5194/acp-19-9699-2019, 2019.
Hu, B., Zhao, X., Liu, H., Liu, Z., Song, T., Wang, Y., Tang, L., Xia, X., Tang, G., Ji, D., Wen, T., Wang, L., Sun, Y., and Xin, J.: Quantification of the impact of aerosol on broadband solar radiation in North China, Scientific Reports, 7, 44851, https://doi.org/10.1038/srep44851, 2017.
Jacob, D. J.: Heterogeneous chemistry and tropospheric ozone, Atmos. Environ., 34, 2131–2159, 2000.
Jacobson, M. Z.: Studying the effects of aerosols on vertical photolysis rate coefficient and temperature profiles over an urban airshed, J. Geophys. Res.-Atmos., 103, 10593–10604, https://doi.org/10.1029/98jd00287, 1998.
Lakey, P. S. J., George, I. J., Whalley, L. K., Baeza-Romero, M. T., and Heard, D. E.: Measurements of the HO2 Uptake Coefficients onto Single Component Organic Aerosols, Environ. Sci. Technol., 49, 4878–4885, https://doi.org/10.1021/acs.est.5b00948, 2015.
Lakey, P. S. J., George, I. J., Baeza-Romero, M. T., Whalley, L. K., and Heard, D. E.: Organics Substantially Reduce HO2 Uptake onto Aerosols Containing Transition Metal ions, J. Phys. Chem. A, 120, 1421–1430, https://doi.org/10.1021/acs.jpca.5b06316, 2016.
Lang, J. L., Zhang, Y. Y., Zhou, Y., Cheng, S. Y., Chen, D. S., Guo, X. U., Chen, S., Li, X. X., Xing, X. F., and Wang, H. Y.: Trends of PM2.5 and Chemical Composition in Beijing, 2000-2015, Aerosol Air Qual. Res., 17, 412–425, https://doi.org/10.4209/aaqr.2016.07.0307, 2017.
Li, G., Bei, N., Tie, X., and Molina, L. T.: Aerosol effects on the photochemistry in Mexico City during MCMA-2006/MILAGRO campaign, Atmos. Chem. Phys., 11, 5169–5182, https://doi.org/10.5194/acp-11-5169-2011, 2011.
Li, J., Wang, Z., Wang, X., Yamaji, K., Takigawa, M., Kanaya, Y., Pochanart, P., Liu, Y., Irie, H., and Hu, B.: Impacts of aerosols on summertime tropospheric photolysis frequencies and photochemistry over Central Eastern China, Atmos. Environ., 45, 1817–1829, 2011.
Li, J., Lu, K., Lv, W., Li, J., Zhong, L., Ou, Y., Chen, D., Huang, X., and Zhang, Y.: Fast increasing of surface ozone concentrations in Pearl River Delta characterized by a regional air quality monitoring network during 2006–2011, J. Environ. Sci., 26, 23–36, 2014.
Li, J., Chen, X., Wang, Z., Du, H., Yang, W., Sun, Y., Hu, B., Li, J., Wang, W., and Wang, T.: Radiative and heterogeneous chemical effects of aerosols on ozone and inorganic aerosols over East Asia, Sci. Total Environ., 622, 1327–1342, 2018a.
Li, J., Chen, X. S., Wang, Z. F., Du, H. Y., Yang, W. Y., Sun, Y. L., Hu, B., Li, J. J., Wang, W., Wang, T., Fu, P. Q., and Huang, H. L.: Radiative and heterogeneous chemical effects of aerosols on ozone and inorganic aerosols over East Asia, Sci. Total Environ., 622, 1327–1342, https://doi.org/10.1016/j.scitotenv.2017.12.041, 2018b.
Li, K., Jacob, D. J., Liao, H., Shen, L., Zhang, Q., and Bates, K. H.: Anthropogenic drivers of 2013–2017 trends in summer surface ozone in China, P. Natl. Acad. Sci. USA, 116, 422–427, https://doi.org/10.1073/pnas.1812168116, 2019a.
Li, K., Jacob, D. J., Liao, H., Zhu, J., Shah, V., Shen, L., Bates, K. H., Zhang, Q., and Zhai, S.: A two-pollutant strategy for improving ozone and particulate air quality in China, Nat. Geosci., 12, 906–910, https://doi.org/10.1038/s41561-019-0464-x, 2019b.
Liu, X., Zhang, Y., Jung, J., Gu, J., Li, Y., Guo, S., Chang, S.-Y., Yue, D., Lin, P., Kim, Y. J., Hu, M., Zeng, L., and Zhu, T.: Research on the hygroscopic properties of aerosols by measurement and modeling during CAREBeijing-2006, J. Geophys. Res., 114, D00G16, https://doi.org/10.1029/2008JD010805, 2009.
Liu, Z., Wang, Y., Gu, D., Zhao, C., Huey, L. G., Stickel, R., Liao, J., Shao, M., Zhu, T., Zeng, L., Amoroso, A., Costabile, F., Chang, C.-C., and Liu, S.-C.: Summertime photochemistry during CAREBeijing-2007: ROx budgets and O3 formation, Atmos. Chem. Phys., 12, 7737–7752, https://doi.org/10.5194/acp-12-7737-2012, 2012.
Lou, S. J., Liao, H., and Zhu, B.: Impacts of aerosols on surface-layer ozone concentrations in China through heterogeneous reactions and changes in photolysis rates, Atmos. Environ., 85, 123–138, https://doi.org/10.1016/j.atmosenv.2013.12.004, 2014.
Lu, K., Fuchs, H., Hofzumahaus, A., Tan, Z., Wang, H., Zhang, L., Schmitt, S. H., Rohrer, F., Bohn, B., Broch, S., Dong, H., Gkatzelis, G. I., Hohaus, T., Holland, F., Li, X., Liu, Y., Liu, Y., Ma, X., Novelli, A., Schlag, P., Shao, M., Wu, Y., Wu, Z., Zeng, L., Hu, M., Kiendler-Scharr, A., Wahner, A., and Zhang, Y.: Fast Photochemistry in Wintertime Haze: Consequences for Pollution Mitigation Strategies, Environ. Sci. Technol., 53, 10676–10684, https://doi.org/10.1021/acs.est.9b02422, 2019.
Lu, K. D., Hofzumahaus, A., Holland, F., Bohn, B., Brauers, T., Fuchs, H., Hu, M., Häseler, R., Kita, K., Kondo, Y., Li, X., Lou, S. R., Oebel, A., Shao, M., Zeng, L. M., Wahner, A., Zhu, T., Zhang, Y. H., and Rohrer, F.: Missing OH source in a suburban environment near Beijing: observed and modelled OH and HO2 concentrations in summer 2006, Atmos. Chem. Phys., 13, 1057–1080, https://doi.org/10.5194/acp-13-1057-2013, 2013.
Lu, X., Hong, J., Zhang, L., Cooper, O. R., Schultz, M. G., Xu, X., Wang, T., Gao, M., Zhao, Y., and Zhang, Y.: Severe Surface Ozone Pollution in China: A Global Perspective, Environ. Sci. Technol. Lett., 5, 487–494, https://doi.org/10.1021/acs.estlett.8b00366, 2018.
Ma, Z., Xu, J., Quan, W., Zhang, Z., Lin, W., and Xu, X.: Significant increase of surface ozone at a rural site, north of eastern China, Atmos. Chem. Phys., 16, 3969–3977, https://doi.org/10.5194/acp-16-3969-2016, 2016.
Ma, Z. W., Hu, X. F., Sayer, A. M., Levy, R., Zhang, Q., Xue, Y. G., Tong, S. L., Bi, J., Huang, L., and Liu, Y.: Satellite-Based Spatiotemporal Trends in PM2.5 Concentrations: China, 2004-2013, Environ. Health Persp., 124, 184–192, https://doi.org/10.1289/ehp.1409481, 2016.
Madronich, S.: The Atmosphere and UV-B Radiation at Ground Level, Environmental UV Photobiology, 1–39, https://doi.org/10.1007/978-1-4899-2406-3_1, 1993.
Matthews, P. S. J., Baeza-Romero, M. T., Whalley, L. K., and Heard, D. E.: Uptake of HO2 radicals onto Arizona test dust particles using an aerosol flow tube, Atmos. Chem. Phys., 14, 7397–7408, https://doi.org/10.5194/acp-14-7397-2014, 2014.
Mihelcic, D., Holland, F., Hofzumahaus, A., Hoppe, L., Konrad, S., Musgen, P., Patz, H. W., Schafer, H. J., Schmitz, T., Volz-Thomas, A., Bachmann, K., Schlomski, S., Platt, U., Geyer, A., Alicke, B., and Moortgat, G. K.: Peroxy radicals during BERLIOZ at Pabstthum: Measurements, radical budgets and ozone production, J. Geophys. Res., 108, 8254, https://doi.org/10.1029/2001jd001014, 2003.
Moghani, M., Archer, C. L., and Mirzakhalili, A.: The importance of transport to ozone pollution in the US Mid-Atlantic, Atmos. Environ., 191, 420–431, 2018.
Monks, P. S., Archibald, A. T., Colette, A., Cooper, O., Coyle, M., Derwent, R., Fowler, D., Granier, C., Law, K. S., Mills, G. E., Stevenson, D. S., Tarasova, O., Thouret, V., von Schneidemesser, E., Sommariva, R., Wild, O., and Williams, M. L.: Tropospheric ozone and its precursors from the urban to the global scale from air quality to short-lived climate forcer, Atmos. Chem. Phys., 15, 8889–8973, https://doi.org/10.5194/acp-15-8889-2015, 2015.
Ni, M. J., Huang, J. X., Lu, S. Y., Li, X. D., Yan, J. H., and Cen, K. F.: A review on black carbon emissions, worldwide and in China, Chemosphere, 107, 83–93, https://doi.org/10.1016/j.chemosphere.2014.02.052, 2014.
Parrish, D. D., Xu, J., Croes, B., and Shao, M.: Air quality improvement in Los Angeles-perspectives for developing cities, Front. Env. Sci. Eng., 10, 11, https://doi.org/10.1007/s11783-016-0859-5, 2016.
Peeters, J., Nguyen, T. L., and Vereecken, L.: HOx radical regeneration in the oxidation of isoprene, Phys. Chem. Chem. Phys., 11, 5935–5939, https://doi.org/10.1039/b908511d, 2009.
Pollack, I. B., Ryerson, T. B., Trainer, M., Neuman, J. A., Roberts, J. M., and Parrish, D. D.: Trends in ozone, its precursors, and related secondary oxidation products in Los Angeles, California: A synthesis of measurements from 1960 to 2010, J. Geophys. Res.-Atmos., 118, 5893–5911, https://doi.org/10.1002/jgrd.50472, 2013.
Qu, W. J., Wang, J., Zhang, X. Y., Wang, D., and Sheng, L. F.: Influence of relative humidity on aerosol composition: Impacts on light extinction and visibility impairment at two sites in coastal area of China, Atmos. Res., 153, 500–511, https://doi.org/10.1016/j.atmosres.2014.10.009, 2015.
Raga, G. B., Castro, T., and Baumgardner, D.: The impact of megacity pollution on local climate and implications for the regional environment: Mexico City, Atmos. Environ., 35, 1805–1811, https://doi.org/10.1016/s1352-2310(00)00275-2, 2001.
Real, E. and Sartelet, K.: Modeling of photolysis rates over Europe: impact on chemical gaseous species and aerosols, Atmos. Chem. Phys., 11, 1711–1727, https://doi.org/10.5194/acp-11-1711-2011, 2011.
Shah, V., Jacob, D. J., Li, K., Silvern, R. F., Zhai, S., Liu, M., Lin, J., and Zhang, Q.: Effect of changing NOx lifetime on the seasonality and long-term trends of satellite-observed tropospheric NO2 columns over China, Atmos. Chem. Phys., 20, 1483–1495, https://doi.org/10.5194/acp-20-1483-2020, 2020.
Streets, D. G., Fu, J. S., Jang, C. J., Hao, J. M., and Yu, C.: Air quality during the 2008 Beijing Olympic Games, Atmos. Environ., 41, 4800–4492, 2007.
Taketani, F., Kanaya, Y., and Akimoto, H.: Kinetics of heterogeneous reactions of HO2 radical at ambient concentration levels with (NH4)2SO4 and NaCl aerosol particles, J. Phys. Chem. A, 112, 2370–2377, 2008.
Taketani, F., Kanaya, Y., Pochanart, P., Liu, Y., Li, J., Okuzawa, K., Kawamura, K., Wang, Z., and Akimoto, H.: Measurement of overall uptake coefficients for HO2 radicals by aerosol particles sampled from ambient air at Mts. Tai and Mang (China), Atmos. Chem. Phys., 12, 11907–11916, https://doi.org/10.5194/acp-12-11907-2012, 2012.
Tan, Z., Fuchs, H., Lu, K., Hofzumahaus, A., Bohn, B., Broch, S., Dong, H., Gomm, S., Häseler, R., He, L., Holland, F., Li, X., Liu, Y., Lu, S., Rohrer, F., Shao, M., Wang, B., Wang, M., Wu, Y., Zeng, L., Zhang, Y., Wahner, A., and Zhang, Y.: Radical chemistry at a rural site (Wangdu) in the North China Plain: observation and model calculations of OH, HO2 and RO2 radicals, Atmos. Chem. Phys., 17, 663–690, https://doi.org/10.5194/acp-17-663-2017, 2017.
Tian, R., Ma, X., Jia, H., Yu, F., Sha, T., and Zan, Y.: Aerosol radiative effects on tropospheric photochemistry with GEOS-Chem simulations, Atmos. Environ., 208, 82–94, 2019.
Verstraeten, W. W., Neu, J. L., Williams, J. E., Bowman, K. W., Worden, J. R., and Boersma, K. F.: Rapid increases in tropospheric ozone production and export from China, Nat. Geosci., 8, 690–695, 2015.
Wang, B., Shao, M., Lu, S. H., Yuan, B., Zhao, Y., Wang, M., Zhang, S. Q., and Wu, D.: Variation of ambient non-methane hydrocarbons in Beijing city in summer 2008, Atmos. Chem. Phys., 10, 5911–5923, https://doi.org/10.5194/acp-10-5911-2010, 2010.
Wang, H., Lu, K., Tan, Z., Sun, K., Li, X., Hu, M., Shao, M., Zeng, L., Zhu, T., and Zhang, Y.: Model simulation of NO3, N2O5 and ClNO2 at a rural site in Beijing during CAREBeijing-2006, Atmos. Res., 196, 97–107, 2017.
Wang, J., Allen, D. J., Pickering, K. E., Li, Z., and He, H.: Impact of aerosol direct effect on East Asian air quality during the EAST-AIRE campaign, J. Geophys. Res.-Atmos., 121, 6534–6554, 2016.
Wang, J. L., Din, G. Z., and Chan, C. C.: Validation of a laboratory-constructed automated gas chromatograph for the measurement of ozone precursors through comparison with a commercial analogy, J. Chromatogr. A, 1027, 11–18, https://doi.org/10.1016/j.chroma.2003.08.099, 2004.
Wang, M., Zeng, L., Lu, S., Shao, M., Liu, X., Yu, X., Chen, W., Yuan, B., Zhang, Q., Hu, M., and Zhang, Z.: Development and validation of a cryogen-free automatic gas chromatograph system (GC-MS/FID) for online measurements of volatile organic compounds, Analytical Methods, 6, 9424–9434, https://doi.org/10.1039/c4ay01855a, 2014.
Wang, M., Shao, M., Chen, W., Lu, S., Liu, Y., Yuan, B., Zhang, Q., Zhang, Q., Chang, C.-C., Wang, B., Zeng, L., Hu, M., Yang, Y., and Li, Y.: Trends of non-methane hydrocarbons (NMHC) emissions in Beijing during 2002–2013, Atmos. Chem. Phys., 15, 1489–1502, https://doi.org/10.5194/acp-15-1489-2015, 2015.
Wang, P., Wang, T., and Ying, Q.: Regional source apportionment of summertime ozone and its precursors in the megacities of Beijing and Shanghai using a source-oriented chemical transport model, Atmos. Environ., 224, 117337, https://doi.org/10.1016/j.atmosenv.2020.117337, 2020.
Wang, Q. Q., Sun, Y. L., Jiang, Q., Du, W., Sun, C. Z., Fu, P. Q., and Wang, Z. F.: Chemical composition of aerosol particles and light extinction apportionment before and during the heating season in Beijing, China, J. Geophys. Res.-Atmos., 120, 12708–12722, https://doi.org/10.1002/2015jd023871, 2015.
Wang, W., Li, X., Shao, M., Hu, M., Zeng, L., Wu, Y., and Tan, T.: The impact of aerosols on photolysis frequencies and ozone production in Beijing during the 4-year period 2012–2015, Atmos. Chem. Phys., 19, 9413–9429, https://doi.org/10.5194/acp-19-9413-2019, 2019.
Wang, X. M., Chen, W. H., Chen, D. H., Wu, Z. Y., and Fan, Q.: Long-term trends of fine particulate matter and chemical composition in the Pearl River Delta Economic Zone (PRDEZ), China, Front. Env. Sci. Eng., 10, 53–62, https://doi.org/10.1007/s11783-014-0728-z, 2016.
Wang, Y., Zhang, Y., Hao, J., and Luo, M.: Seasonal and spatial variability of surface ozone over China: contributions from background and domestic pollution, Atmos. Chem. Phys., 11, 3511–3525, https://doi.org/10.5194/acp-11-3511-2011, 2011.
Warneke, C., de Gouw, J. A., Holloway, J. S., Peischl, J., Ryerson, T. B., Atlas, E., Blake, D., Trainer, M., and Parrish, D. D.: Multiyear trends in volatile organic compounds in Los Angeles, California: Five decades of decreasing emissions, J. Geophys. Res., 117, D00V17, https://doi.org/10.1029/2012JD017899, 2012.
Wehner, B., Birmili, W., Ditas, F., Wu, Z., Hu, M., Liu, X., Mao, J., Sugimoto, N., and Wiedensohler, A.: Relationships between submicrometer particulate air pollution and air mass history in Beijing, China, 2004–2006, Atmos. Chem. Phys., 8, 6155–6168, https://doi.org/10.5194/acp-8-6155-2008, 2008.
Wendisch, M., Mertes, S., Ruggaber, A., and Nakajima, T.: Vertical profiles of aerosol and radiation and the influence of a temperature inversion: Measurements and radiative transfer calculations, J. Appl. Meteorol., 35, 1703–1715, https://doi.org/10.1175/1520-0450(1996)035<1703:VPOAAR>2.0.CO;2, 1996.
Xie, X., Shao, M., Liu, Y., Lu, S., Chang, C.-C., and Chen, Z.-M.: Estimate of initial isoprene contribution to ozone formation potential in Beijing, China, Atmos. Environ., 42, 6000–6010, https://doi.org/10.1016/j.atmosenv.2008.03.035, 2008.
Xing, J., Wang, J., Mathur, R., Wang, S., Sarwar, G., Pleim, J., Hogrefe, C., Zhang, Y., Jiang, J., Wong, D. C., and Hao, J.: Impacts of aerosol direct effects on tropospheric ozone through changes in atmospheric dynamics and photolysis rates, Atmos. Chem. Phys., 17, 9869–9883, https://doi.org/10.5194/acp-17-9869-2017, 2017.
Xu, J., Ma, J. Z., Zhang, X. L., Xu, X. B., Xu, X. F., Lin, W. L., Wang, Y., Meng, W., and Ma, Z. Q.: Measurements of ozone and its precursors in Beijing during summertime: impact of urban plumes on ozone pollution in downwind rural areas, Atmos. Chem. Phys., 11, 12241–12252, https://doi.org/10.5194/acp-11-12241-2011, 2011.
Xu, J., Zhang, Y. H., Zheng, S. Q., and He, Y. J.: Aerosol effects on ozone concentrations in Beijing: A model sensitivity study, J. Environ. Sci., 24, 645–656, https://doi.org/10.1016/s1001-0742(11)60811-5, 2012.
Xu, W., Xu, X., Lin, M., Lin, W., Tarasick, D., Tang, J., Ma, J., and Zheng, X.: Long-term trends of surface ozone and its influencing factors at the Mt Waliguan GAW station, China – Part 2: The roles of anthropogenic emissions and climate variability, Atmos. Chem. Phys., 18, 773–798, https://doi.org/10.5194/acp-18-773-2018, 2018.
Yuan, B., Shao, M., de Gouw, J., Parrish, D. D., Lu, S., Wang, M., Zeng, L., Zhang, Q., Song, Y., Zhang, J., and Hu, M.: Volatile organic compounds (VOCs) in urban air: How chemistry affects the interpretation of positive matrix factorization (PMF) analysis, J. Geophys. Res., 117, D24302, https://doi.org/10.1029/2012JD018236, 2012.
Zhang, J. P., Zhu, T., Zhang, Q. H., Li, C. C., Shu, H. L., Ying, Y., Dai, Z. P., Wang, X., Liu, X. Y., Liang, A. M., Shen, H. X., and Yi, B. Q.: The impact of circulation patterns on regional transport pathways and air quality over Beijing and its surroundings, Atmos. Chem. Phys., 12, 5031–5053, https://doi.org/10.5194/acp-12-5031-2012, 2012.
Zhang, L., Shao, J. Y., Lu, X., Zhao, Y. H., Hu, Y. Y., Henze, D. K., Liao, H., Gong, S. L., and Zhang, Q.: Sources and Processes Affecting Fine Particulate Matter Pollution over North China: An Adjoint Analysis of the Beijing APEC Period, Environ. Sci. Technol., 50, 8731–8740, https://doi.org/10.1021/acs.est.6b03010, 2016.
Zhang, Q., Yuan, B., Shao, M., Wang, X., Lu, S., Lu, K., Wang, M., Chen, L., Chang, C.-C., and Liu, S. C.: Variations of ground-level O3 and its precursors in Beijing in summertime between 2005 and 2011, Atmos. Chem. Phys., 14, 6089–6101, https://doi.org/10.5194/acp-14-6089-2014, 2014.
Zhao, B., Wang, S. X., Liu, H., Xu, J. Y., Fu, K., Klimont, Z., Hao, J. M., He, K. B., Cofala, J., and Amann, M.: NOx emissions in China: historical trends and future perspectives, Atmos. Chem. Phys., 13, 9869–9897, https://doi.org/10.5194/acp-13-9869-2013, 2013.
Zhao, P., Zhang, X., Xu, X., and Zhao, X.: Long-term visibility trends and characteristics in the region of Beijing, Tianjin, and Hebei, China, Atmos. Res., 101, 711–718, 2011.
Zheng, C., Zhao, C., Zhu, Y., Wang, Y., Shi, X., Wu, X., Chen, T., Wu, F., and Qiu, Y.: Analysis of influential factors for the relationship between PM2.5 and AOD in Beijing, Atmos. Chem. Phys., 17, 13473–13489, https://doi.org/10.5194/acp-17-13473-2017, 2017.
Zou, Q., Song, H., Tang, M., and Lu, K.: Measurements of HO2 uptake coefficient on aqueous (NH4)2SO4 aerosol using aerosol flow tube with LIF system, Chin. Chem. Lett., 30, 2236–2240, https://doi.org/10.1016/j.cclet.2019.07.041, 2019.
The requested paper has a corresponding corrigendum published. Please read the corrigendum first before downloading the article.
- Article
(1610 KB) - Full-text XML
- Corrigendum
-
Supplement
(246 KB) - BibTeX
- EndNote


