the Creative Commons Attribution 4.0 License.
the Creative Commons Attribution 4.0 License.
 | 15 Dec 2020
Concentrations and biosphere–atmosphere fluxes of inorganic trace gases and associated ionic aerosol counterparts over the Amazon rainforest
Robbie Ramsay
Chiara F. Di Marco
Matthias Sörgel
Mathew R. Heal
Samara Carbone
Paulo Artaxo
Alessandro C. de Araùjo
Marta Sá
Christopher Pöhlker
Jost Lavric
Meinrat O. Andreae
The Amazon rainforest presents a unique, natural laboratory for the study of surface–atmosphere interactions. Its alternation between a near-pristine marine-influenced atmosphere during the wet season and a vulnerable system affected by periodic intrusions of anthropogenic pollution during the dry season provides an opportunity to investigate some fundamental aspects of boundary-layer chemical processes. This study presents the first simultaneous hourly measurements of concentrations, fluxes, and deposition velocities of the inorganic trace gases NH3, HCl, HONO, HNO3, and SO2 as well as their water-soluble aerosol counterparts , Cl−, , and over the Amazon. Species concentrations were measured in the dry season (from 6 October to 5 November 2017), at the Amazon Tall Tower Observatory (ATTO) in Brazil, using a two-point gradient wet-chemistry instrument (GRadient of AErosols and Gases Online Registration, GRAEGOR) sampling at 42 and 60 m. Fluxes and deposition velocities were derived from the concentration gradients using a modified form of the aerodynamic gradient method corrected for measurement within the roughness sub-layer. Findings from this campaign include observations of elevated concentrations of NH3 and SO2 partially driven by long-range transport (LRT) episodes of pollution and the substantial influence of coarse Cl− and particulate on overall aerosol mass burdens. From the flux measurements, the dry season budget of total reactive nitrogen dry deposition at the ATTO site was estimated as −2.9 kg N . HNO3 and HCl were deposited continuously at a rate close to the aerodynamic limit. SO2 was deposited with an average daytime surface resistance (Rc) of 28 s m−1, whilst aerosol components showed average surface deposition velocities of 2.8 and 2.7 mm s−1 for and , respectively. Deposition rates of and Cl− were higher at 7.1 and 7.8 mm s−1, respectively, reflecting their larger average size. The exchange of NH3 and HONO was bidirectional, with NH3 showing emission episodes in the afternoon and HONO in the early morning hours. This work provides a unique dataset to test and improve dry deposition schemes for these compounds for tropical rainforest, which have typically been developed by interpolation from conditions in temperate environments. A future campaign should focus on making similar measurements in the wet season in order to provide a complete view of the annual pattern of inorganic trace gas and coarse aerosol biosphere–atmosphere exchange over tropical rainforest.
- Article
(8996 KB) - Full-text XML
- BibTeX
- EndNote


The Amazon rainforest is one of the last remaining wildernesses on Earth, which – through a select combination of environmental and geographical factors – acts as a critical, living driver of global climate (Malhi et al., 2008). It is a vast region of near-undisturbed verdant growth, covering almost 60 % of the total land area of Brazil and constituting almost 40 % of global tropical forest cover (Baccini et al., 2012). It stores an estimated 160 Pg of organic carbon in its soils (Gloor et al., 2012), and it harbours an immense atmospheric oxidative capacity driven by a powerful hydrological cycle (Lelieveld et al., 2008). The strong coupling between the forest and the atmosphere (and the sensitive feedbacks between them that regulate atmospheric composition) has earned the Amazon rainforest the sobriquet of the “Green Ocean” (Martin et al., 2016; Roberts et al., 2001; Williams et al., 2002) and the “biogeochemical reactor” (Pöhlker et al., 2012; Andreae, 2001). It is therefore not only a near-pristine microcosm of the pre-Anthropocene but also acts as a continental “natural laboratory” to study unmodified surface–atmosphere exchange processes.
However, the combination of global climate change and the intensification of human development within and on the periphery of the rainforest has left the Amazonian biome in a precarious situation (Davidson et al., 2012). Emissions of pollutants from agricultural activities, biomass burning and deforestation in the vicinity of the rainforest can perturb its surface–atmosphere exchange processes (Ganzeveld and Lelieveld, 2004) and cause changes in the local, regional and even global climate (Lenton et al., 2008).
While measurements of the atmospheric composition and surface–atmosphere exchange process of the Amazon rainforest have been conducted since the late 1980s (e.g. Andreae and Andreae, 1988; Artaxo et al., 1993; Martin et al., 2010a), there remain significant knowledge gaps. Fundamental questions such as the magnitude of inorganic trace gas fluxes and the chemical speciation of coarse aerosols remain partially unanswered. A pressing need is for more baseline measurements of gases and aerosols in order to quantify the impact of anthropogenic changes.
This latter point has been addressed by the establishment of the Amazon Tall Tower Observatory (ATTO). Located in a pristine rainforest site 150 km NE of the city of Manaus, the site provides the baseline measurements of meteorology, trace gases and aerosol required to quantify the impact of natural and anthropogenic change (Andreae et al., 2015). Recent output has included a long-term overview of cloud condensation nuclei over the Amazon rainforest (Pöhlker et al., 2016, 2018), observations of the enhancement of deep convection over the rainforest by ultrafine particles (Fan et al., 2018) and the influence of African volcanic emissions on long-range transport of pollutants to the ATTO site (Saturno et al., 2018b; Holanda et al., 2020). However, several inorganic trace gases and their aerosol counterparts are currently not routinely measured due to the intense labour and resource requirements. The aim of this work was to make such measurements via an intensive observation campaign; in particular, we aimed to derive the first time series of simultaneous flux measurements of these species at this tropical rainforest site.
The gas species of interest include ammonia (NH3), nitrous acid (HONO), hydrogen chloride (HCl), nitric acid (HNO3) and sulfur dioxide (SO2), which is the precursor to atmospheric sulfuric acid. As the primary basic gas in the atmosphere, NH3 is important as the precursor of various ammonium salts, particularly NH4NO3, formed by the temperature- and humidity-dependent reaction between NH3 and HNO3. These salts act as light-scattering aerosols in the atmosphere, altering the Earth’s total albedo and consequently affecting regional and global climate (Fiore et al., 2015). Depending on environmental conditions, ammonium salts can be particularly long lived, and their eventual decomposition above nitrogen-limited ecosystems – such as the Amazon rainforest – can lead to disturbances in soil fertility, vegetation composition and pollution of groundwater sources (Fowler et al., 2013). The dynamic equilibrium between NH3, HNO3, and NH4NO3 makes it difficult to determine the surface–atmosphere exchange of the individual members of the triad. To date, very few simultaneous measurements of each component in real time and with high time resolution exist (Ramsay et al., 2018; Trebs et al., 2006; Twigg et al., 2011; Wolff et al., 2010b), and no measurements exist for tropical rainforest.
Measurements of HONO are also critically required due to its potential contribution to atmospheric hydroxyl radical (OH) concentrations. The OH radical is the primary daytime oxidant in the Amazon rainforest, and it is principally formed via ultraviolet (UV) photodissociation of ozone in the presence of water vapour. In the tropics, where there is intense solar radiation and high humidity, concentrations of the OH radical are elevated relative to the global median (Kuhn et al., 2007; Lelieveld et al., 2002; Taraborrelli et al., 2012). The photodissociation of HONO also yields OH and so may make a crucial contribution to sustaining the overall oxidative capacity above the Amazon rainforest. Non-negligible concentrations of HONO have been reported at urban (Lee et al., 2016), agricultural (Laufs et al., 2017; Twigg et al., 2011) and rural European forest sites (Sörgel et al., 2011), but there are currently no published measurements of HONO concentrations or fluxes above tropical rainforest.
There is also a need for better quantification of aerosols, particularly chemically speciated particulate matter, aerosol deposition velocities and surface–atmosphere exchange behaviour. The majority of aerosol measurements at the ATTO site have so far focused on the submicron (< PM1) size fraction, reflecting the importance of these particles in seeding cloud condensation nuclei and their seasonal and temporal variability driven by biomass burning (Artaxo et al., 2013; Martin et al., 2010b; Pöschl et al., 2010; Pöhlker et al., 2016, 2018). Studies of coarse particles are limited (Talbot et al., 1990; Moran-Zuloaga et al., 2018; Whitehead et al., 2016) but have confirmed that coarse fraction aerosols are driven by the transport of dust, sea salt, primary biogenic aerosols and particles transported in smoke from biomass burning. While number concentrations and chemically speciated submicron aerosol particles have been measured, there are currently no flux or deposition velocity data for chemically speciated fine- or coarse-mode particles for the Amazon rainforest.
Determination of concentrations and fluxes of trace gases and aerosol components requires precise, high time resolution measurements. Instruments must also be sensitive to the often very low concentrations in remote locations such as the Amazon rainforest. Compounding these requirements is the potential impact of gas–particle interactions that must be considered for accurate descriptions of surface–atmosphere exchange. This requires concurrent multi-species measurements.
Development in automated wet-chemistry instruments has led to the construction of the GRadient of AErosols and Gases Online Registration (GRAEGOR), which is capable of simultaneously measuring the concentrations of the inorganic trace gases NH3, HCl, HONO, HNO3 and SO2 as well as their associated water-soluble aerosol counterparts , Cl−, , and at two separate heights at hourly resolution (Thomas et al., 2009). Fluxes for each of these species can then be derived from the two concentrations using a modified version of the aerodynamic gradient method (AGM), from which hourly values for the deposition velocities (Vd) of each species can also be determined. A number of campaigns have now confirmed the suitability of GRAEGOR for measuring vertical concentration gradients and fluxes of these trace gases and aerosol components (Ramsay et al., 2018; Thomas et al., 2009; Twigg et al., 2011; Wolff et al., 2010b).
The overall aim of this study was to resolve some of the knowledge gaps in the biosphere–atmosphere exchange of inorganic trace gases and aerosols to and from tropical rainforest. We present here the concentrations, fluxes and deposition velocities of the trace gases NH3, HCl, HONO, HNO3 and SO2 as well as their associated aerosol counterparts , Cl−, , and as measured by GRAEGOR wet-chemistry two-point gradient system during a period of the 2017 dry season at the ATTO site. Using supplementary measurements of non-refractory chemically differentiated submicron aerosol and concentrations of atmospheric equivalent black carbon, we elucidate the lifetime, behaviour, and origins of the measured trace gases and aerosols.
2.1 Site description
The measurements presented here are from an intensive observation campaign conducted at the ATTO site from 6 October to 5 November 2017. Situated on a level plateau located 12 km north-west of the Uatumã River, the ATTO site lies 150 km north-east of the Manaus urban region. The site is located within the Amazon time zone (UTC − 4 h). All times presented in this work are given as local time. The vegetation is composed of dense, undisturbed upland rainforest (terra firme), with a rich tree diversity (≈ 140 tree species per hectare) (Andreae et al., 2015). Based on the height of the tallest trees, the canopy height (hc) is 37.5 m (Chor et al., 2017). The site lies within the central Amazonian region and experiences an annual oscillation between wet and dry seasons with transitional periods, driven by the position of the Intertropical Convergence Zone (ICTZ). The wet season, typically lasting between February and May when the ICTZ is south of the ATTO site, is characterised by north-easterly (NE) trade winds bringing air masses from the North Atlantic. These travel over hundreds of kilometres of untouched rainforest, leading to near-pristine atmospheric conditions at the site. The conditions are termed “near pristine” as regional sources of anthropogenic pollution can still intrude at the site during this time period. Conversely, the dry season (which lasts from August to November) is characterised by air masses arriving from the south-east, predominately travelling over urban and agricultural areas of Brazil. As a result, they often bring anthropogenic emissions of trace gases and associated aerosols to the ATTO site, leading to elevated concentrations of species such as black carbon and carbon monoxide (Saturno et al., 2018a). Both seasons are also affected by long-range transport from Africa (Holanda et al., 2020; Wang et al., 2016).
In addition to a base camp, electrical installations and various container units that house instruments, the site is composed of three measurement towers: an 80 m mast used for aerosol measurements; an 80 m walk-up tower (2∘ 08.637′ S, 58∘ 59.992′ W; 120 m a.s.l.), which can accommodate larger instrumentation; and a 325 m tower (2∘ 08.602′ S, 59∘ 00.003′ W; 120 m a.s.l.), on which instruments for long-term measurements are installed. The GRAEGOR system for this campaign was installed on the 80 m walk-up tower.
For the consideration of flux fetch distance, wherein accurate measures of fluxes for a surface are limited by the homogenous extent of the surface’s roughness elements, a flux footprint and thus fetch requirement of 5.2 km was calculated based on the geometric mean of the sample heights and from the formulation given by Monteith and Unsworth (2013). Consequently, the fetch distance lies within the region of terra firme forest which extends 5.5 km in all directions from the tower.
2.2 Instrumentation
2.2.1 GRadient of AErosols and Gases Online Registration (GRAEGOR)
GRAEGOR (ECN, the Netherlands) is a semiautonomous wet-chemistry instrument capable of online quantification of the concentrations of the water-soluble inorganic trace gases NH3, HCl, HONO, HNO3 and SO2, as well as their associated aerosol counterparts , Cl−, , and , at hourly resolution at two separate heights (Thomas et al., 2009). It consists of two sample boxes and a detector box at ground level. For this study, the sample boxes were set at two heights on the 80 m walk-up tower: z1= 42 m and z2= 60 m.
Each sample box consists of a horizontally aligned wet rotating annular denuder (WRD) (Keuken et al., 1988) and a steam jet aerosol collector (SJAC) (Slanina et al., 2001) connected in series. Air is simultaneously drawn through both sample boxes at a rate of 16.7 L min−1, which is kept constant through critical orifices located downstream of the SJACs. The inlets of the sample boxes are directly connected to the WRDs via a 0.3 m length high-density polyethylene (HDPE) tubing, which minimises losses of HNO3 and NH3. A HDPE insect gauze is attached to the filters, preventing insects or coarse debris entering the filter. The air streams first pass through the WRDs, which are coated in a continuously replenishing sorption solution of 18.2 MΩ double-deionised (DDI) water. Water-soluble trace gases contained within the laminar air flows diffuse into the liquid sorption solution, which is then fed to the detector box at ground level for analysis. Free of trace gases, the air streams then enter the SJACs and are mixed with water vapour fed from the DDI solution. This precipitates a supersaturation event, such that any particles contained in the air streams rapidly (0.1 s) grow to droplets of 2 µm diameter. The particle-containing droplets are then separated from the air steams by use of a cyclone, and they are fed as liquid samples to the detector box. To prevent biological contamination of the WRDs, the DDI solution includes 0.6 mL of 30 % hydrogen peroxide (H2O2) (9.8 M) per 10 L of DDI.
A series of liquid-pressure regulators were placed in the path of the liquid samples being fed to the detector box in order to prevent damage to it caused by the high hydrostatic pressures in the 42 and 60 m high sample columns. Liquid samples from the SJACs and WRDs are analysed for and NH3, respectively, by a flow injection analysis (FIA) unit (Norman et al., 2009; Wyers et al., 1993). A 761 compact ion chromatography (IC) unit (Metrohm, Switzerland), equipped with a Dionex AS12 column, determines the liquid concentrations of HCl ∕ Cl−, HONO ∕ , HNO3 ∕ and SO2 ∕ in the WRD/SJAC liquid streams, respectively, based on the measured anion conductivity of the samples compared to a 50 ppb Br− reference standard added to the sample solution, taking into account the specific conductivities of the various ions compared with Br−. A flow control scheme enables continuous analysis of liquid samples. Air concentrations relative to moist air, reported as mass concentrations at ambient temperature and pressure, are derived from the measured liquid concentrations according to
where cliq is the liquid concentration of the species measured; Qsample, QBr, and Qair are the sample, internal Br− standard, and air-mass flow rates, respectively; and cIS and cBr are the expected internal standard concentration and the detected concentration of the internal standard, respectively. The ratio of the molecular weights for air (Mwi(air)) and liquid (Mwi(liq)) are included to account for the mass differences between the measured ions in the liquid sample and the corresponding gas-phase species. For aerosol species, this ratio is equal to 1. GRAEGOR therefore provides a half-hourly-averaged measurement of trace gas and aerosol concentrations for each height and species.
The concentrations of the trace gases and aerosols measured by GRAEGOR are expressed in terms of mass per volume in units of µg m−3 at ambient temperature and pressure. Equivalent ambient molar mixing ratios (ri), with respect to moist air, were calculated using the following formulation:
where R is the gas constant (8.314 ), Mi is the molecular weight of the trace gas or aerosol, ci is the concentration in µg m−3 of the trace gas or aerosol, p is the air pressure in pascal (Pa), and T is the temperature in kelvin (K).
Calibration of the FIA unit is autonomous, conducted 24 h after GRAEGOR begins measurement after start up and every 72 h afterwards. The calibration uses three liquid sample concentrations of 0, 50 and 500 ppb. For this study, a total of 10 autonomous internal calibrations took place. The IC unit is continuously calibrated by the addition of the 50 ppb Br− internal standard which is added to every liquid IC sample.
Sample box airflows were monitored continuously via the pressure drop across a flow restrictor, calibrated every 5 d using a model 4140 mass flowmeter (TSI, USA) measuring at ambient volumes (L min−1). Additional checks of the instrument performance were conducted daily, e.g. visual checks that the WRDs or SJACs were not contaminated.
Due to the short inlet length and absence of any size selection, measurements of aerosol taken by GRAEGOR are of water-soluble total suspended particulate (TSP). Furthermore, as the instrument measures any compound that dissociates to form the measured anion, GRAEGOR has a number of potential artefacts. These include interferences in HONO measurements from NO2 during periods of high SO2 concentrations (discussed in detail in Sect. 4.3) (Spindler et al., 2003) and interference in HNO3 measurements at night from dinitrogen pentoxide (N2O5). Nevertheless, GRAEGOR has proven capable of time-resolved flux measurements in previous campaigns (Ramsay et al., 2018; Twigg et al., 2011; Wolff et al., 2010b).
2.2.2 Supplementary measurements
The ATTO site is equipped with an extensive suite of other instruments that provide long-term observations of meteorology, gases and particle properties. Wind speed, wind direction, sensible heat (H), air pressure (p) and frictional velocity (u*) were measured at 46 m on the 80 m walk-up tower using an ultrasonic anemometer (Gill WindMaster). Continuous measurements of relative humidity and air temperature (both measured using a Vaisala HMP45C-L), rainfall (HS Hyquist TB4-L rain gauge) and net radiation (Kipp & Zonnen net radiometer) were also available. Concentrations of equivalent black carbon (BCe) were measured by an Aethalometer (Magee Scientific AE33) at 325 m on the ATTO tall tower, and concentrations of carbon monoxide (CO) were measured at 52 m by a Picarro CKADS18. Also presented in this study are concentrations of , Cl−, and recorded by a time-of-flight aerosol chemical species monitor (ToF-ACSM, Aerodyne Inc) at 321 m on the ATTO tall tower.
2.3 Micrometeorology
2.3.1 Modified aerodynamic gradient method
The aerodynamic gradient method (AGM) is based upon flux-gradient similarity theory, which assumes that the flux of a tracer c (such as a gas or particle) can be determined if its vertical concentration gradient and its diffusion coefficient are known (Foken, 2008). In this study, a modified hybrid form of the AGM is used, whereby the flux of a trace gas or aerosol species can be determined from the vertical concentration difference of the species (Δc) and a series of stability parameters and the friction velocity (u*) derived by eddy-covariance from fast-response ultrasonic anemometry (Flechard, 1998):
Here, κ is the dimensionless von Kármán constant (κ= 0.41); z2 and z1 are the heights at which the concentrations were measured (60 and 42 m, respectively, in this study); d is the zero-plane displacement height in metres; ΨH is the integrated form of the heat stability correction term, included to account for deviations from the log-linear profile; and ζ = is a dimensionless atmospheric stability parameter based on L, the Obukhov length. By convention, a negative flux value denotes deposition to the surface, while a positive flux denotes an emission from the surface.
The zero-plane displacement height, d, is a critical parameter for calculation of the flux, and for a closed canopy is related to the canopy height, hc (d=(0.66 to 0.9) × hc). The analysis of this campaign uses a value of d = 33.4 m as determined by Chor et al. (2017) from measurements of the logarithmic wind profile at the same tower.
2.3.2 Calculation of dry deposition velocities
The dry deposition velocity (Vd) is the negative ratio of the flux of the species to its concentration at a reference height (z) with consideration to the zero-plane displacement height:
For gases, the deposition velocity can also be determined from the resistance analogy for dry deposition (Fowler and Unsworth, 1979; Wesely et al., 1985). Here, Vd is the reciprocal of the sum of the aerodynamic resistance Ra, the quasi-laminar boundary layer resistance Rb and the canopy resistance Rc:
Ra and Rb can be calculated from Eqs. (6) and (7) (Garland, 1977):
where ΨM is the integrated form of the momentum stability correction term; B is the sub-layer Stanton number (Foken, 2008), which is the product of the turbulent Reynolds number and the Schmidt number.
If the Vd of a trace gas is known from its flux via Eq. (4) and Ra and Rb are calculated using micrometeorological data, the canopy resistance Rc can be inferred from rearranging Eq. (5). Similarly, a theoretical maximum deposition velocity (Vmax) for a trace gas can be determined if Ra and Rb are known, by setting Rc = 0, which is equivalent to assuming perfect absorption of the gas by the canopy:
The deposition of particles is more difficult to parameterise using the dry deposition resistance analogy, due to the different behaviour of particles compared to gases. In particular, the physical transport of particles through the quasi-laminar boundary layer is dependent on processes other than Brownian diffusion, such as impaction and interception. Consequently, although aerosol deposition velocities can be calculated as per Eq. (4), the associated theoretical Vmax – which depends on measurements of Rb – cannot. Furthermore, due to the complexity in modelling the deposition process for larger particles, the deposition velocity for a particle is often replaced by an associated surface deposition velocity (Vds) value, parameterised by Wesely et al. (1985):
2.3.3 Correction factors for AGM in roughness sub-layer
The aerodynamic gradient method is ultimately based on Monin–Obukhov similarity theory (MOST). One of its assumptions is that fluxes are measured in the inertial sub-layer, where fluxes deviate little with height. For this reason, the inertial sub-layer is often termed the “constant flux layer” (CFL). However, in the roughness sub-layer (RSL), which extends over the individual roughness elements of the surface, MOST does not strictly hold (Garratt, 1980). As a result, one of the underlying assumptions of the AGM is invalid, and consequently flux measurements using AGM can be erroneous (De Ridder, 2010).
Over forests, the roughness sub-layer can extend to almost 3 times the height of the canopy. Indeed, it is virtually impossible to make gradient flux measurements that avoid measuring within the roughness sub-layer, both for logistical reasons but also because gradients become increasingly weak at higher height and because of the limitations of the CFL (Dias-Júnior et al., 2019). As with other studies, the flux measurements presented here were made at least partially within the RSL of the rainforest, where the height of the canopy was 37.1 m and the roughness sub-layer height therefore extended to an estimated 111 m.
As the profiles of concentrations and turbulence deviate from the logarithmic shape assumed by Eq. (3) within the RSL, fluxes calculated with the standard approach are likely to be underestimated compared to the true flux value (Raupach and Legg, 1984). However, the overall flux-gradient relationship within the roughness sub-layer can still hold (Simpson et al., 1998) and be used to determine fluxes, but correction factors (also termed enhancement factors) must be implemented to account for measuring within the roughness sub-layer.
Work by Chor et al. (2017) at the ATTO site has led to development of such a correction factor, hereafter termed γF, that can be applied to flux measurements made using AGM above tropical rainforest. The γF value is dependent upon atmospheric stability, with a larger correction factor applied during stable atmospheric conditions compared to unstable conditions. This reflects the findings made by Zahn et al. (2016) over tropical rainforest, that the solar zenith angle alters the predictions of scalars by MOST in the roughness sub-layer, with best agreement between observations and predictions at noon. Using measurements of L as a parameter for stable and unstable atmospheric stability, the values of γF developed by Chor et al. (2017) were applied to AGM flux calculations throughout this study; after, it was verified that they provide good agreement between measured and theoretically derived deposition velocities for HCl and HNO3 (see Sect. 3.3.1).
2.4 Estimation of errors
2.4.1 GRAEGOR limit of detection (LOD)
The concentration limit of detection (LOD) (defined as 3σ above the background signal, where σ is the standard deviation) is of critical importance when measuring in regions of very low concentrations such as the Amazon rainforest. The LOD for each species measured by GRAEGOR was determined from a field blank test, which was conducted during the campaign over a 22 h period from 18:00 on 23 October to 16:00 on 24 October 2017 (local time). As detailed by Thomas et al. (2009), the field blank test to determine concentration LODs involves switching off the sample box air pump and sealing the air inlets of the samples boxes while leaving the rest of the system operating under measurement conditions. LODs are then determined as 3σ from the resulting background signal. Concentration LODs determined during this campaign are presented in Table 1 for individual trace gases and associated aerosol species.
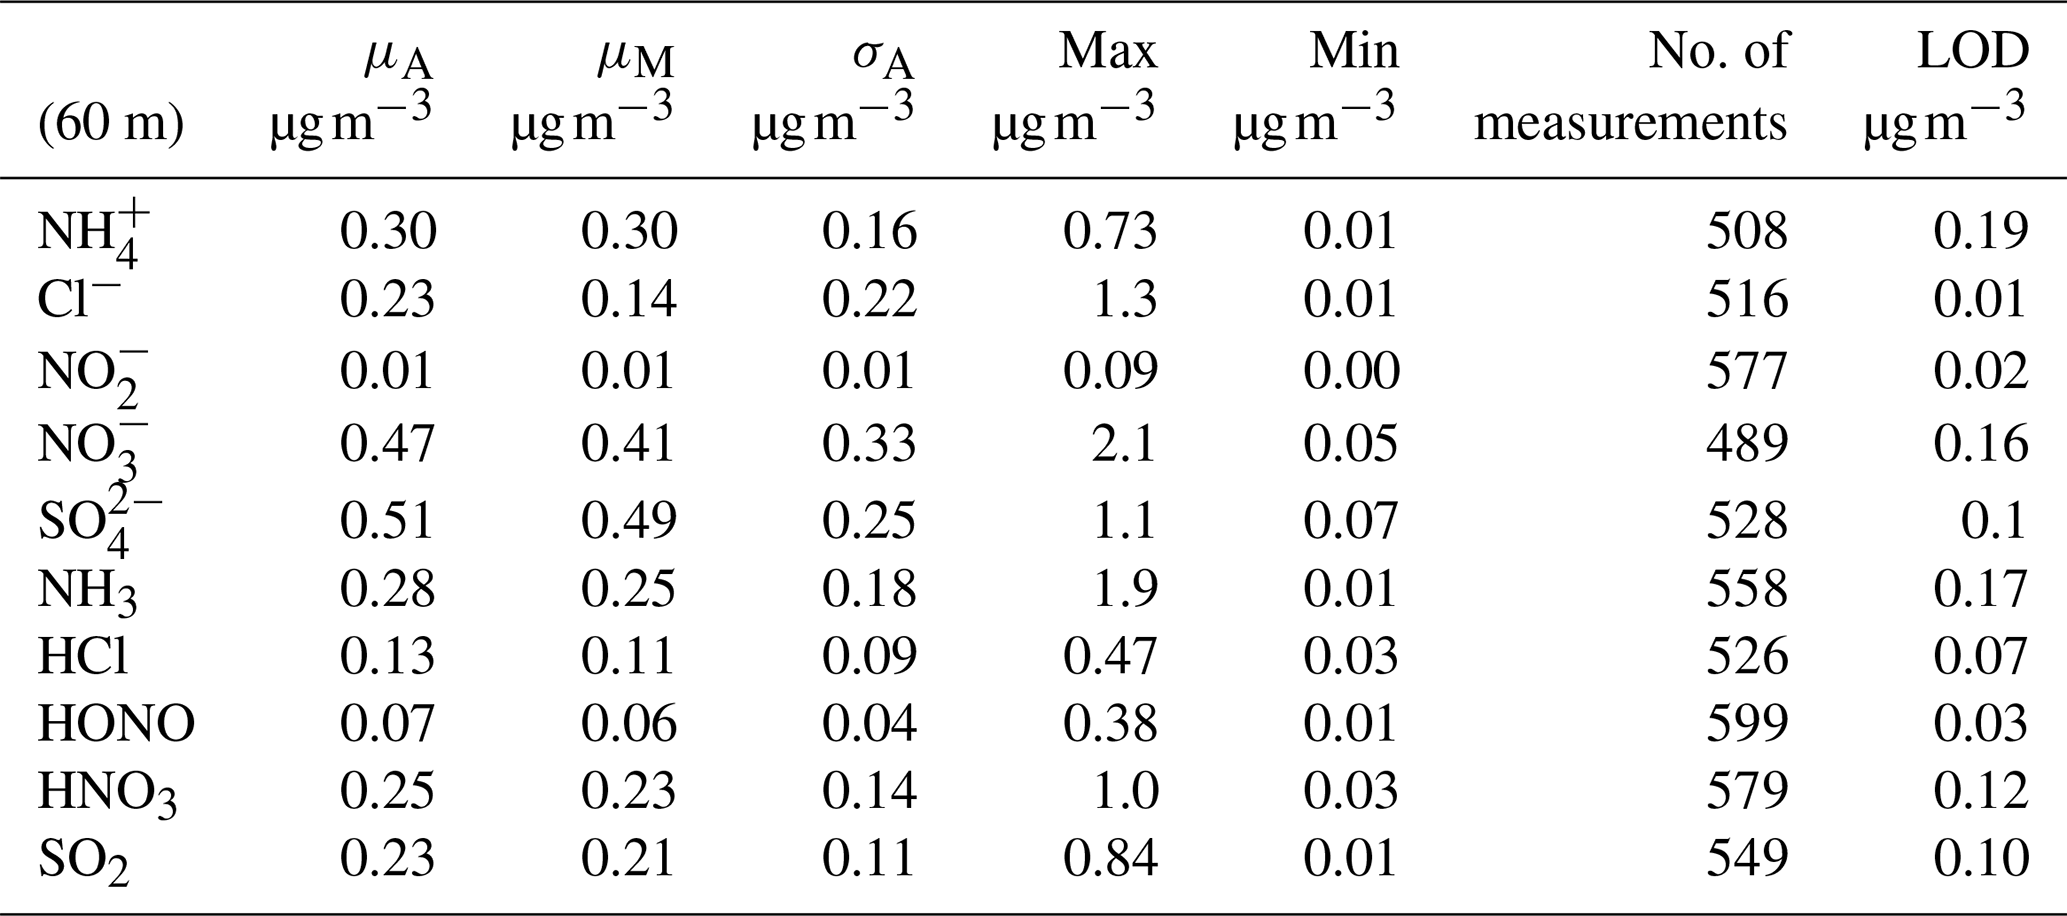
Table 1Mean (μA), median (μM), arithmetic standard deviation (σA), maximum, minimum and number of measurements for water-soluble aerosol and inorganic trace gas concentration measurements taken at 60 m on the 80 m tower, with associated limit of detection (LOD) values for each species based on 30 min values.
2.4.2 Error in concentration measurements
The overall error in concentration measurements (σm) for the trace gases and aerosol components can be expressed as the product of the mixing ratio (m) with the individual error measurements, estimated by using a Gaussian error propagation approach (Trebs et al., 2004):
Each term in the propagation product denotes a measurement parameter and its associated standard deviation (σχ). In order, these are the mixing ratio of the compounds found in the liquid sample (mliq), the mixing ratio of the Br− standard (Br(SD)), the flow rate of the internal Br− standard (QBr), the mixing ratio (as analysed by the IC system) of the Br− standard (mBr) and the air-mass flow through the system (Qair). This formulation applies strictly for calculating the error in concentration measurement of species measured using IC. For NH3 and , which were analysed using FIA, the error in concentration measurement can also be determined by using Eq. (10), omitting the terms for Br(SD) and m(Br), and replacing the factor QBr with QS, which is the flow rate of the liquid sample. Calculated uncertainties ranged from 9 % to 19 %, with QS, QBr and mBr being the largest contributors to total measurement uncertainty.
2.4.3 Error in flux measurements
As outlined by Wolff et al. (2010b) and Ramsay et al. (2018), the flux measurement error (σF) for a trace gas or aerosol is composed of two terms: the product of the error in the concentration difference (Δc) and its associated standard deviation () with the error in the flux-gradient relationship (here, expressed as a transfer velocity), which is dominated by the error in u* (); and the flux (F) of the trace gas or aerosol measured:
The error in the concentration difference can be determined through extended side-by-side measurements, where both sample boxes are placed at the same height and are supplied with a common air inlet. The instrument is then allowed to operate normally. The concentrations measured by both sampling boxes during this side-by-side sampling period are plotted against each other and fit with orthogonal regression. Using the orthogonal fit equation, the concentrations for the side-by-side sampling period and the wider campaign can then be corrected to account for systematic errors between each sample box. After correction, the remaining scatter in the side-by-side sampling concentrations (the residuals) is used to determine the error in the concentration difference. For the ATTO campaign, extended side-by-side measurements were conducted on 6 November at the end of the measurement period, with both sample boxes placed at 60 m.
The value of is dependent upon the sonic anemometer used to measure u* and the atmospheric stability at the time of measurement (Foken, 2008; Nemitz et al., 2009). For this campaign, a value of 10 % for was used during non-neutral conditions and 12 % for neutral conditions.
The median error values in flux calculations, as a percentage of flux values, are presented for trace gases and aerosol components in Tables 2 and 3, respectively. These values are in line with those calculated for previous studies (Ramsay et al., 2018; Thomas et al., 2009; Wolff et al., 2010a).
Table 2Mean (μA), median (μM), maximum and minimum values of post-roughness sub-layer correction for fluxes, deposition velocities (Vd), theoretical maximum deposition velocities (Vmax) and canopy resistances (Rc) for the inorganic trace gases measured during Amazon Tall Tower Observatory campaign. The number of fluxes calculated is quoted as number of measurements, and the median error in flux measurements as a percentage of flux values for each individual trace gas species (σF) is included as part of the statistical summary for fluxes.
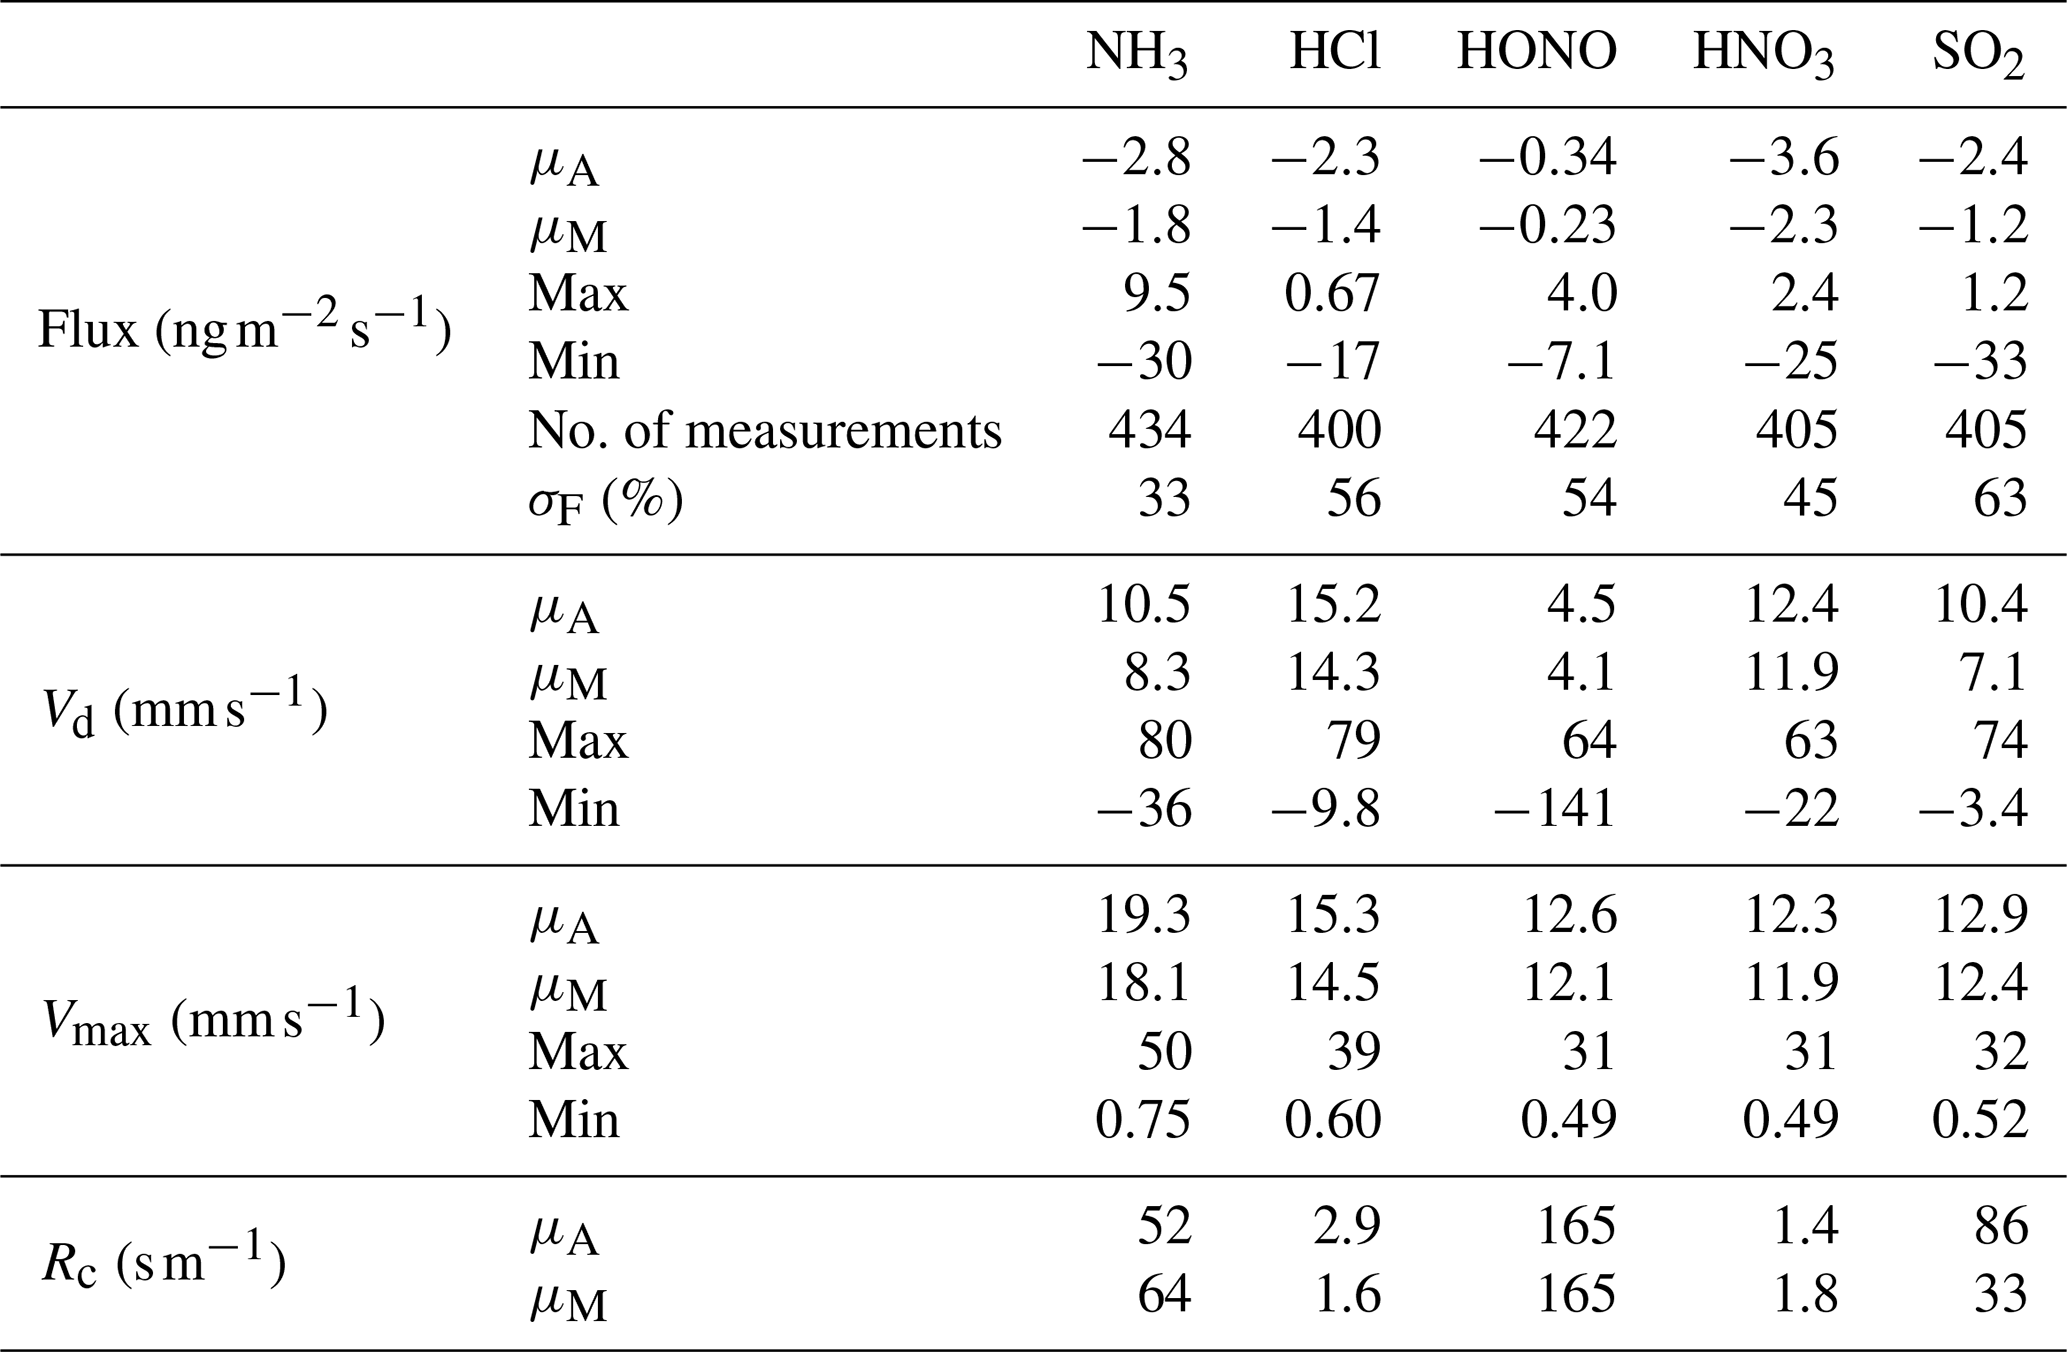
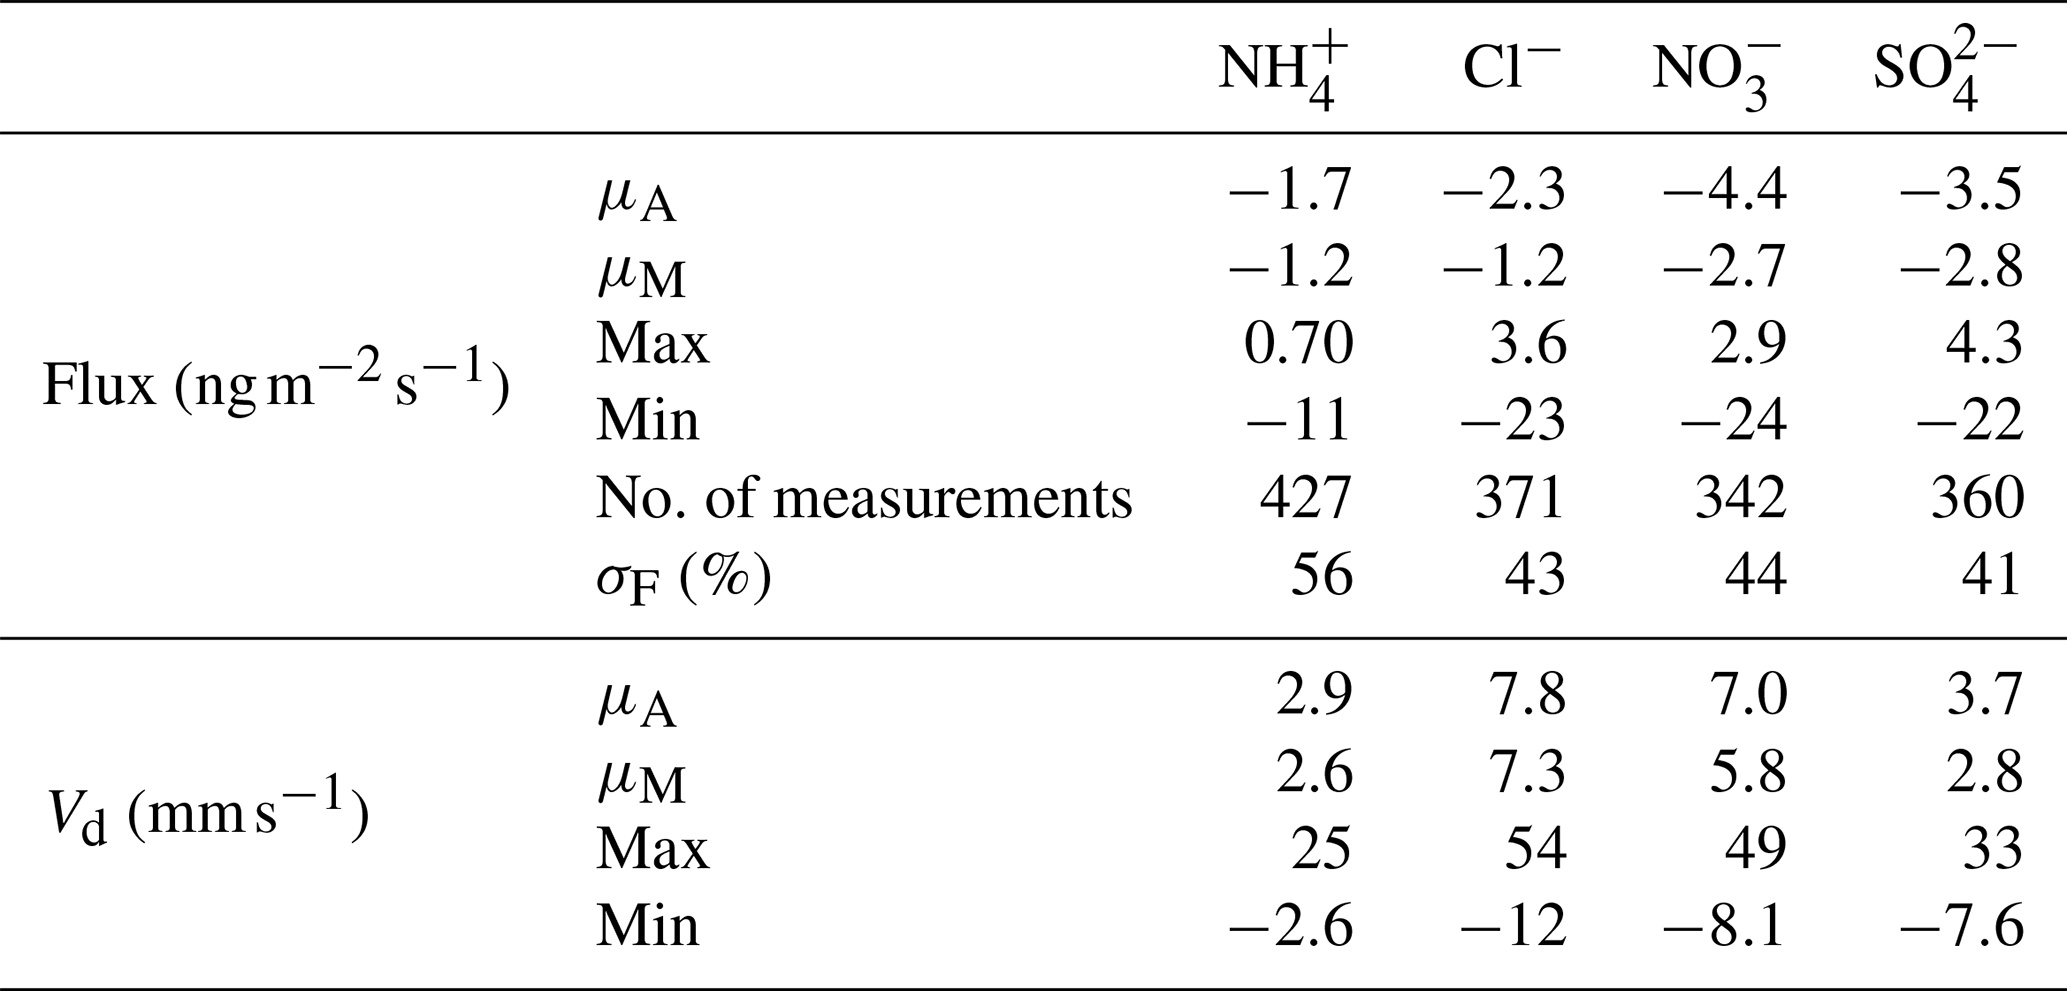
Table 3Mean (μA), median (μM), maximum and minimum values of post-roughness sub-layer correction for fluxes and deposition velocities (Vd) for the water-soluble aerosols measured during the Amazon Tall Tower Observatory campaign. The number of fluxes calculated is quoted as number of measurements, and the median error in flux measurements as a percentage of flux values for each individual aerosol species (σF) is included as part of the statistical summary for fluxes.
3.1 Meteorology and indicators of pollution
Figure 1 presents hourly time series of the net radiation, rainfall, relative humidity, air temperature, wind direction and wind speed measured during the campaign. Also presented are the mass concentration of black carbon () and mixing ratio of carbon monoxide (cCO). The values of and cCO have been used in previous studies at ATTO to demarcate periods of near-pristine and polluted conditions. Thus Pöhlker et al. (2018) defined “pristine rainforest” (PR) conditions as periods when values are <0.01 µg m−3 for over 6 h. Alternatively, or in combination with , periods when cCO values are below the monthly background CO concentrations recorded at the Ascension Island hemispheric background reference station (https://www.esrl.noaa.gov/gmd/dv/site/?stacode=ASC, last access: 22 December 2019) are also considered PR conditions. During this campaign, there were no recorded periods when or cCO met these criteria and therefore no period of PR conditions. This is typical for dry season conditions (Pöhlker et al., 2016).
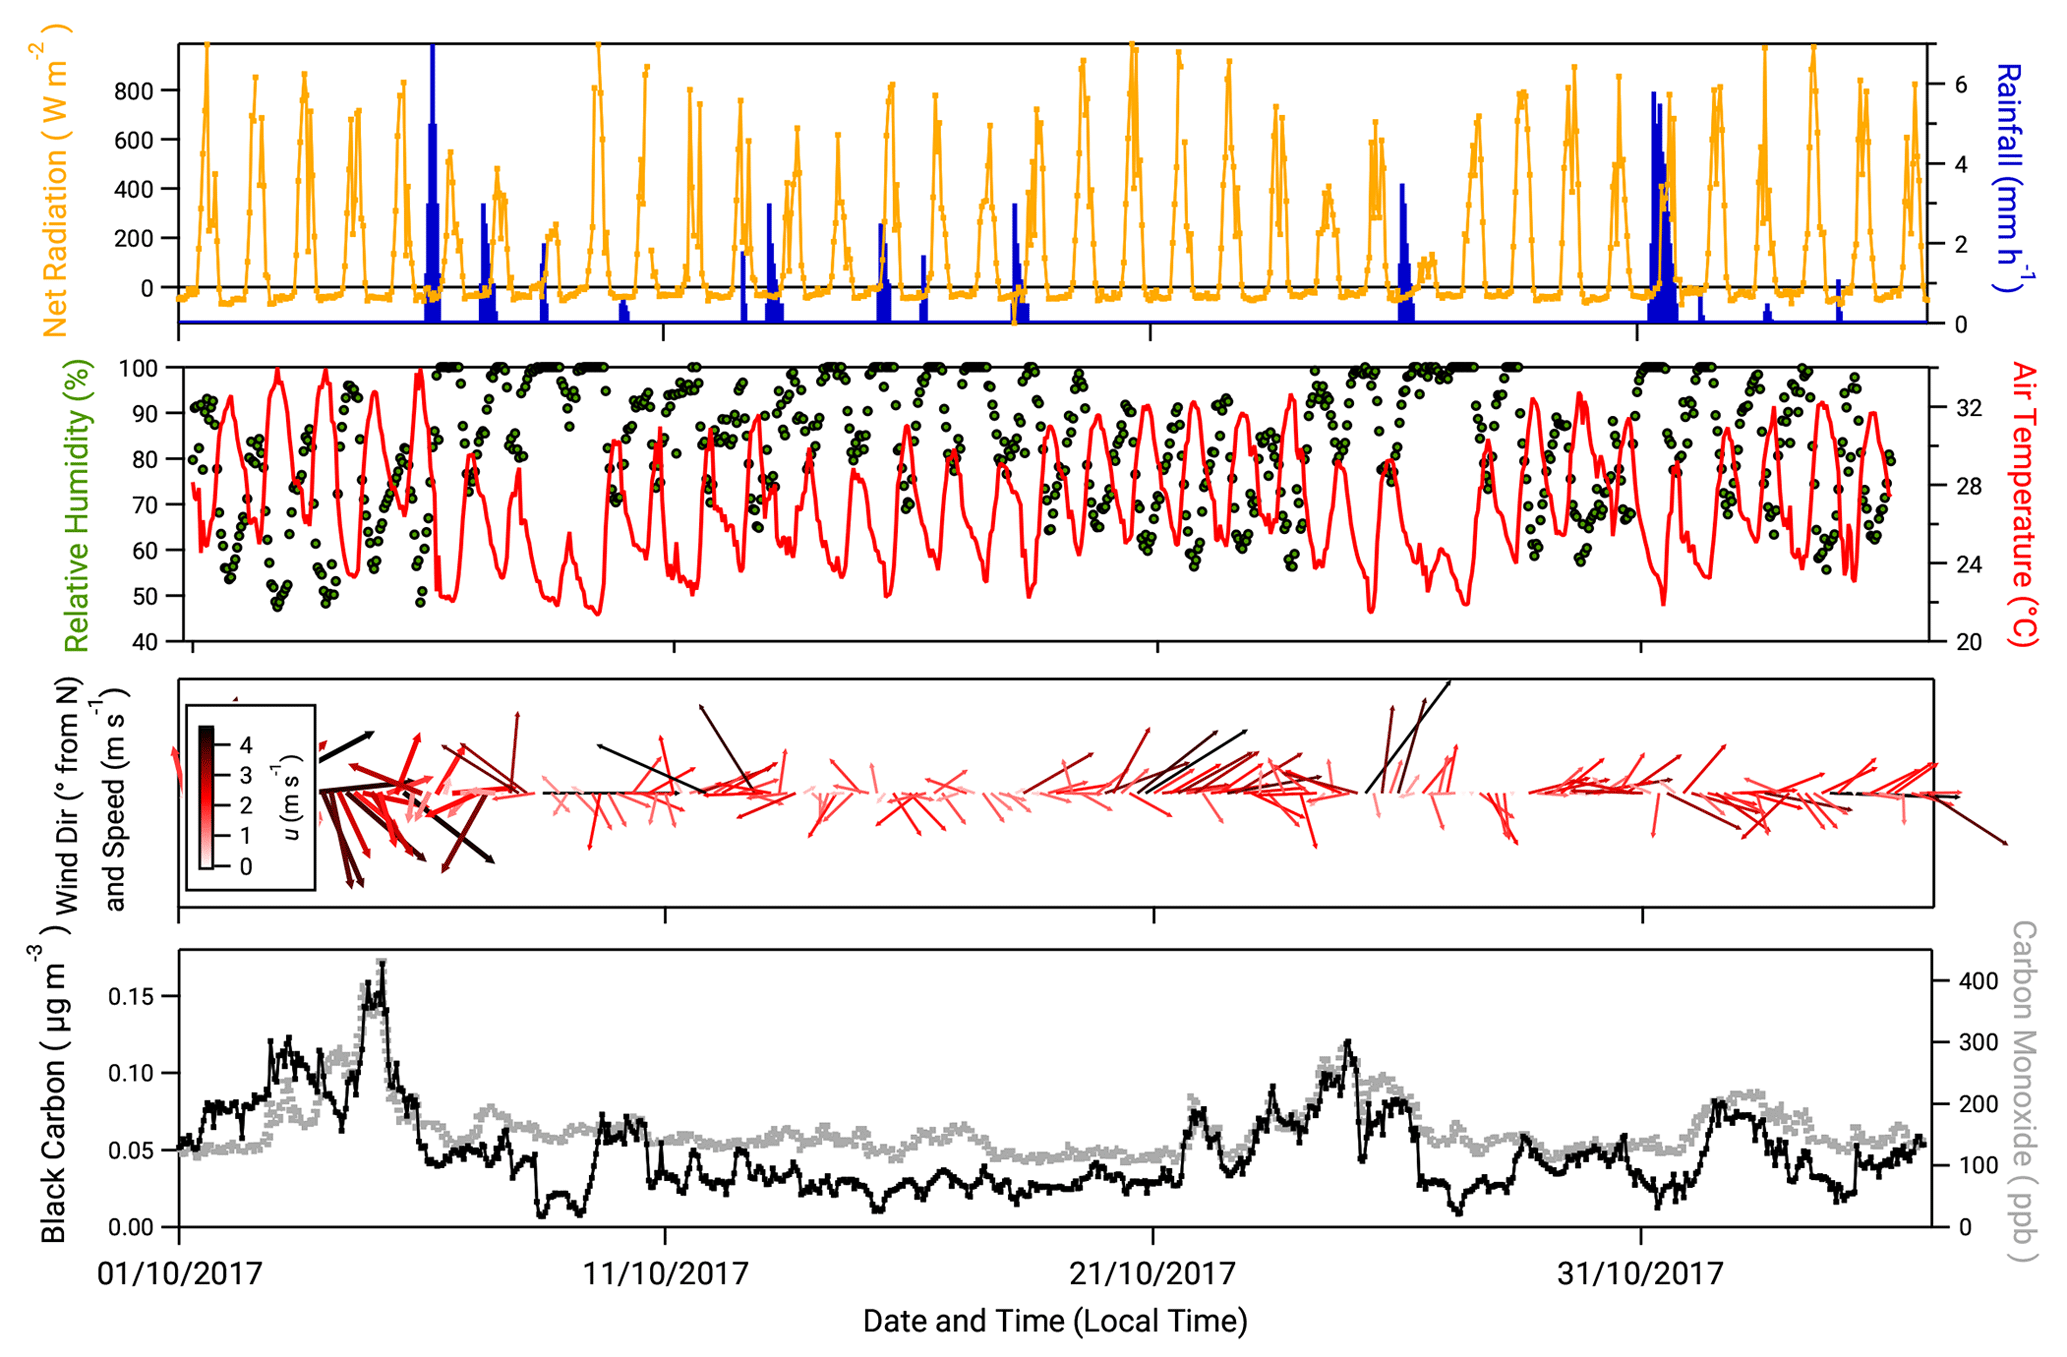
Figure 1Meteorological and supplementary measurements taken during the campaign. From top, net radiation, hourly rainfall, relative humidity, air temperature, wind speed and wind direction (arrows scaled to wind speed and orientated from 0∘ N) and concentrations of black carbon and carbon monoxide.
While PR conditions (according to the above definition) were not observed, there were periods when over a 6 h period was close to falling below 0.01 µg m−3. For example, between 12:00 on 8 October and 09:00 on 9 October, values varied between 0.01 and 0.02 µg m−3. Periods where values approach the PR criterion were associated with periods of rainfall and north to north-easterly winds. For the remainder of this paper, periods when the values of and cCO approached conditions for PR status (0.01 µg m−3 and 150 ppb, respectively, over 6 h) are termed “near-PR” conditions.
Conversely, there are periods when and cCO values notably exceeded their mean values (0.04 µg m−3 and 280 ppb, respectively), e.g. the period between 21 and the 25 October (Fig. 1). During this time, values of increase steadily from 0.04 µg m−3 to a maximum of 0.12 µg m−3 at 00:00 on 25 October. A sharp decrease in occurs at 04:00 on the same day, coinciding with a period of precipitation, the first since 18 October. This 5 d period is also noted for comparatively drier, warmer conditions and a prevailing wind direction from the east to south-east. Periods when there was a 6 h exceedance of the mean value of (0.04 µg m−3) with associated drier, warmer conditions are referred to hereafter as “polluted” conditions.
3.2 Concentrations of inorganic trace gases and associated aerosol counterparts
Summary statistics for the inorganic trace gases and associated aerosol counterparts measured at 60 m are presented in Table 1. The table also includes the associated limit of detection values. The time series of inorganic trace gas concentrations, in µg m−3 and ppb, at 42 and 60 m are shown in Fig. 2, and the corresponding time series of associated aerosol concentrations are shown in Fig. 3. For comparison, Fig. 3 also presents the concentrations of particulate , Cl−, and measured by the ToF-ACSM taken at 321 m on the Amazon tall tower. Gaps in the GRAEGOR time series are due to automated calibrations of the instrument, instrument failure, or periods when liquid or air flow were unstable.

Figure 2Time series of hourly concentrations (primary left axis, mass concentrations; secondary right axis, molar mixing ratios) of inorganic trace gas species measured by GRAEGOR at 42 m (yellow, mass concentration; solid black line, molar mixing ratio) and 60 m (green, mass concentration; dashed grey line, molar mixing ratio) on the 80 m tower at the Amazon Tall Tower Observatory site.
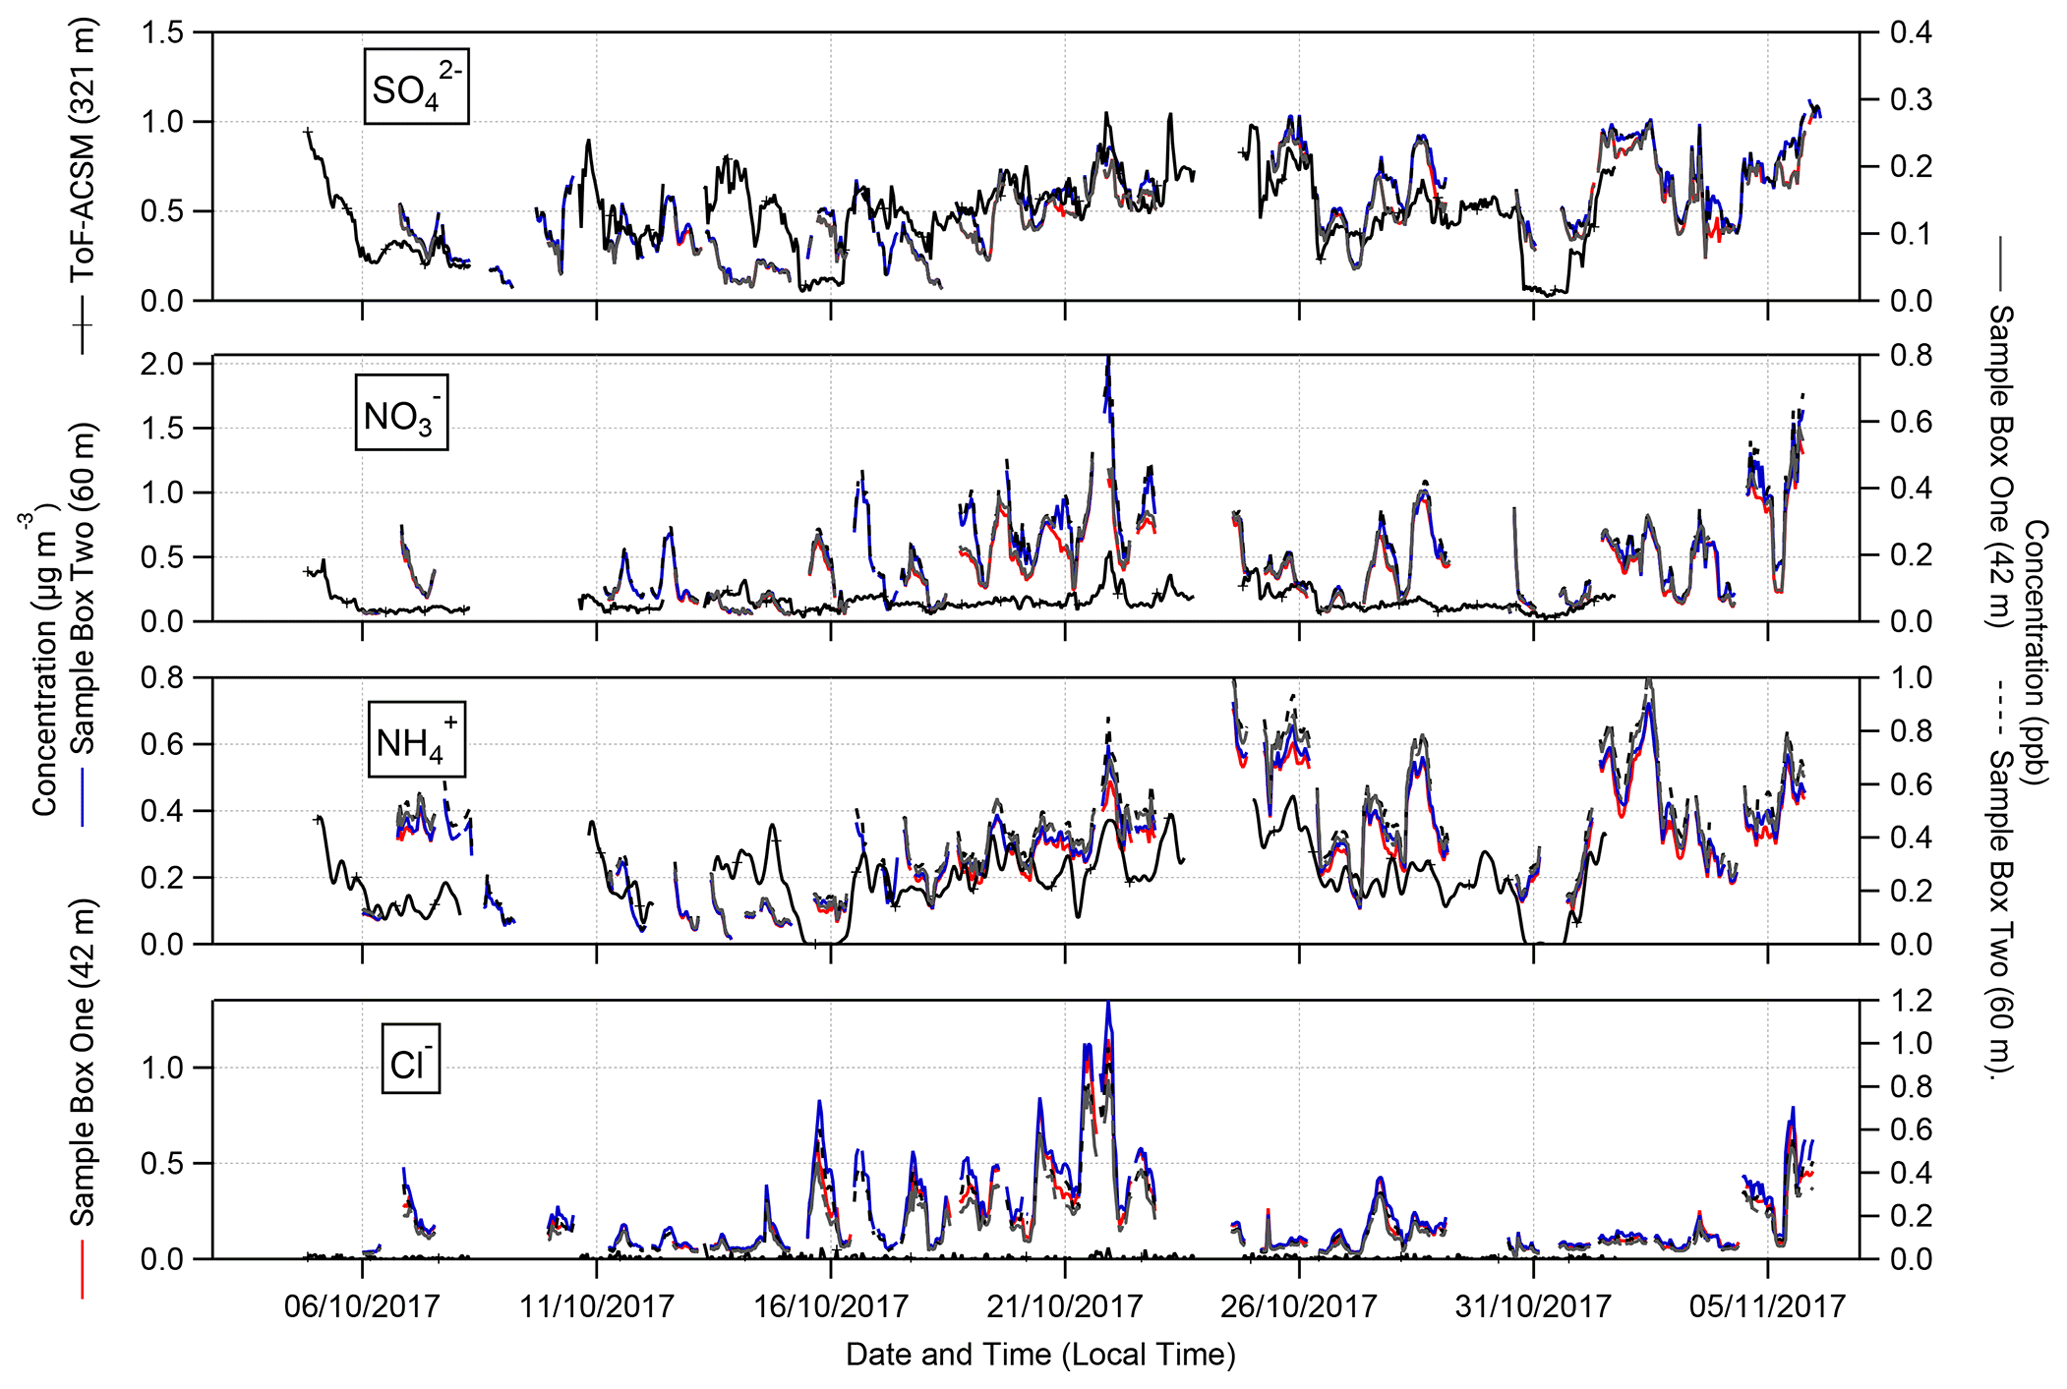
Figure 3Time series of hourly concentrations (primary left axis, mass concentrations; secondary right axis, molar mixing ratios) of water-soluble aerosol species measured by GRAEGOR at 42 m (red, mass concentration; solid black line, molar mixing ratio) and 60 m (blue, mass concentration; dashed grey line, molar mixing ratio) on the 80 m tower, as well as ToF-ACSM at 321 m (black) at the Amazon tall tower, at the Amazon Tall Tower Observatory site.
Table 1 shows that the mean and median concentrations of all trace gases and associated aerosol species exceeded their limit of detection except for nitrite (). Particulate is particularly difficult to quantify using wet-chemistry methods owing to its low ambient concentrations. Previous attempts to measure using GRAEGOR at rural sites have also been unsuccessful (Ramsay et al., 2018; Wolff et al., 2010b). Consequently, data are not discussed further in this paper.
All aerosol species (with the exception of ) had mean and median concentrations greater than the associated inorganic trace gases. This was the case at both measurement heights. For example, the mean and median concentration values of at 42 m (0.30 and 0.28 µg m−3, respectively) exceeded those recorded for NH3 at the same height (0.27 and 0.22 µg m−3). The difference is most pronounced between and HNO3 and between and SO2, with a mean value of 0.47 µg m−3 for at 60 m compared to a corresponding mean value of 0.25 µg m−3 at the same height for HNO3 and a mean value of 0.51 µg m−3 for at 60 m compared to a mean value of 0.23 µg m−3 for SO2 at the same height. The predominance of aerosol phase over gas phase for these species has been noted at other rural forest sites; for example, Wolff et al. (2010b) reported median and HNO3 concentrations of 0.48 and 0.12 µg m−3 using GRAEGOR above a rural forest in SE Germany.
Concentrations varied between near-PR and polluted periods. Minimum values for all aerosol and gas species – which fall below their respective instrumental LODs – occurred during near-PR conditions. Conversely, the maximum concentration values recorded for all species occurred during the longest polluted period of the campaign (21–25 October). In particular, Cl− and reach their respective maximum concentrations of 1.35 and 2.07 µg m−3 at 23:00 on 21 October. Concentrations of NH3 and HNO3 increase from 21 October to reach maximum values of 1.94 and 1.04 µg m−3, respectively, at noon on 23 October.
The extent of agreement in aerosol concentrations between GRAEGOR at 60 m and the ToF-ACSM at 321 m depends on the species (Fig. 3). Measurements of are in best agreement. Linear regression analysis for the full campaign showed a near 1:1 agreement between measured by GRAEGOR and ToF-ACSM (m= 0.89, R2= 0.45). During the period from 18 to 26 October, agreement was particularly good (m= 0.97, R2= 0.65). Similarly, although not as statistically robust as for the measurements, there is near-linear relationship between concentrations measured by GRAEGOR at 60 m and ToF-ACSM at 321 m (m= 0.85, R2= 0.35).
In contrast, there are significant differences between GRAEGOR and ToF-ACSM measurements for both and Cl−. While there is some agreement in overall trends between GRAEGOR and ToF-ACSM measurements of , with both instruments recording a maximum in at 23:00 on 21 October 2018 (ToF-ACSM = 0.54 µg m−3, GRAEGOR, 60 m = 2.07 µg m−3), in general the GRAEGOR measurements of are a factor of 3–4 larger than those from the ToF-ACSM. The difference in Cl− concentration is even more pronounced. The median concentration for Cl− from the ToF-ACSM is 0.02 µg m−3, whilst the median value from GRAEGOR at 60 m is 0.14 µg m−3. A percentage of 93 % of the GRAEGOR Cl− measurements are above its LOD of 15 ng m−3. We discuss the reasons for the discrepancy between ToF-ACSM and GRAEGOR measurements of and Cl− further in Sect. 4.3.2.
The median (0.06 µg m−3, 0.03 ppb) and mean (0.07 µg m−3, 0.04 ppb) values for the inorganic trace gas nitrous acid (HONO) remained above the detection limit of the instrument (30 ng m−3) at both sampling heights. Although the diel cycle of HONO exhibited a maximum during night and a minimum during the day (0.02 µg m−3 at 14:00), it remained above the detection limit even during daylight hours (Fig. 4), which, given the high photolysis rate of HONO during daytime, implies the presence of a daytime source. The measured mean concentration of HONO of this study is similar to measurements of HONO taken over rural and pristine areas (Spataro and Ianniello, 2014), but it is below the 0.1 to 0.8 ppb values that are measured at some urban sites (Hendrick et al., 2014). We discuss the potential sources for HONO at the ATTO field site in Sect. 4.4.2.
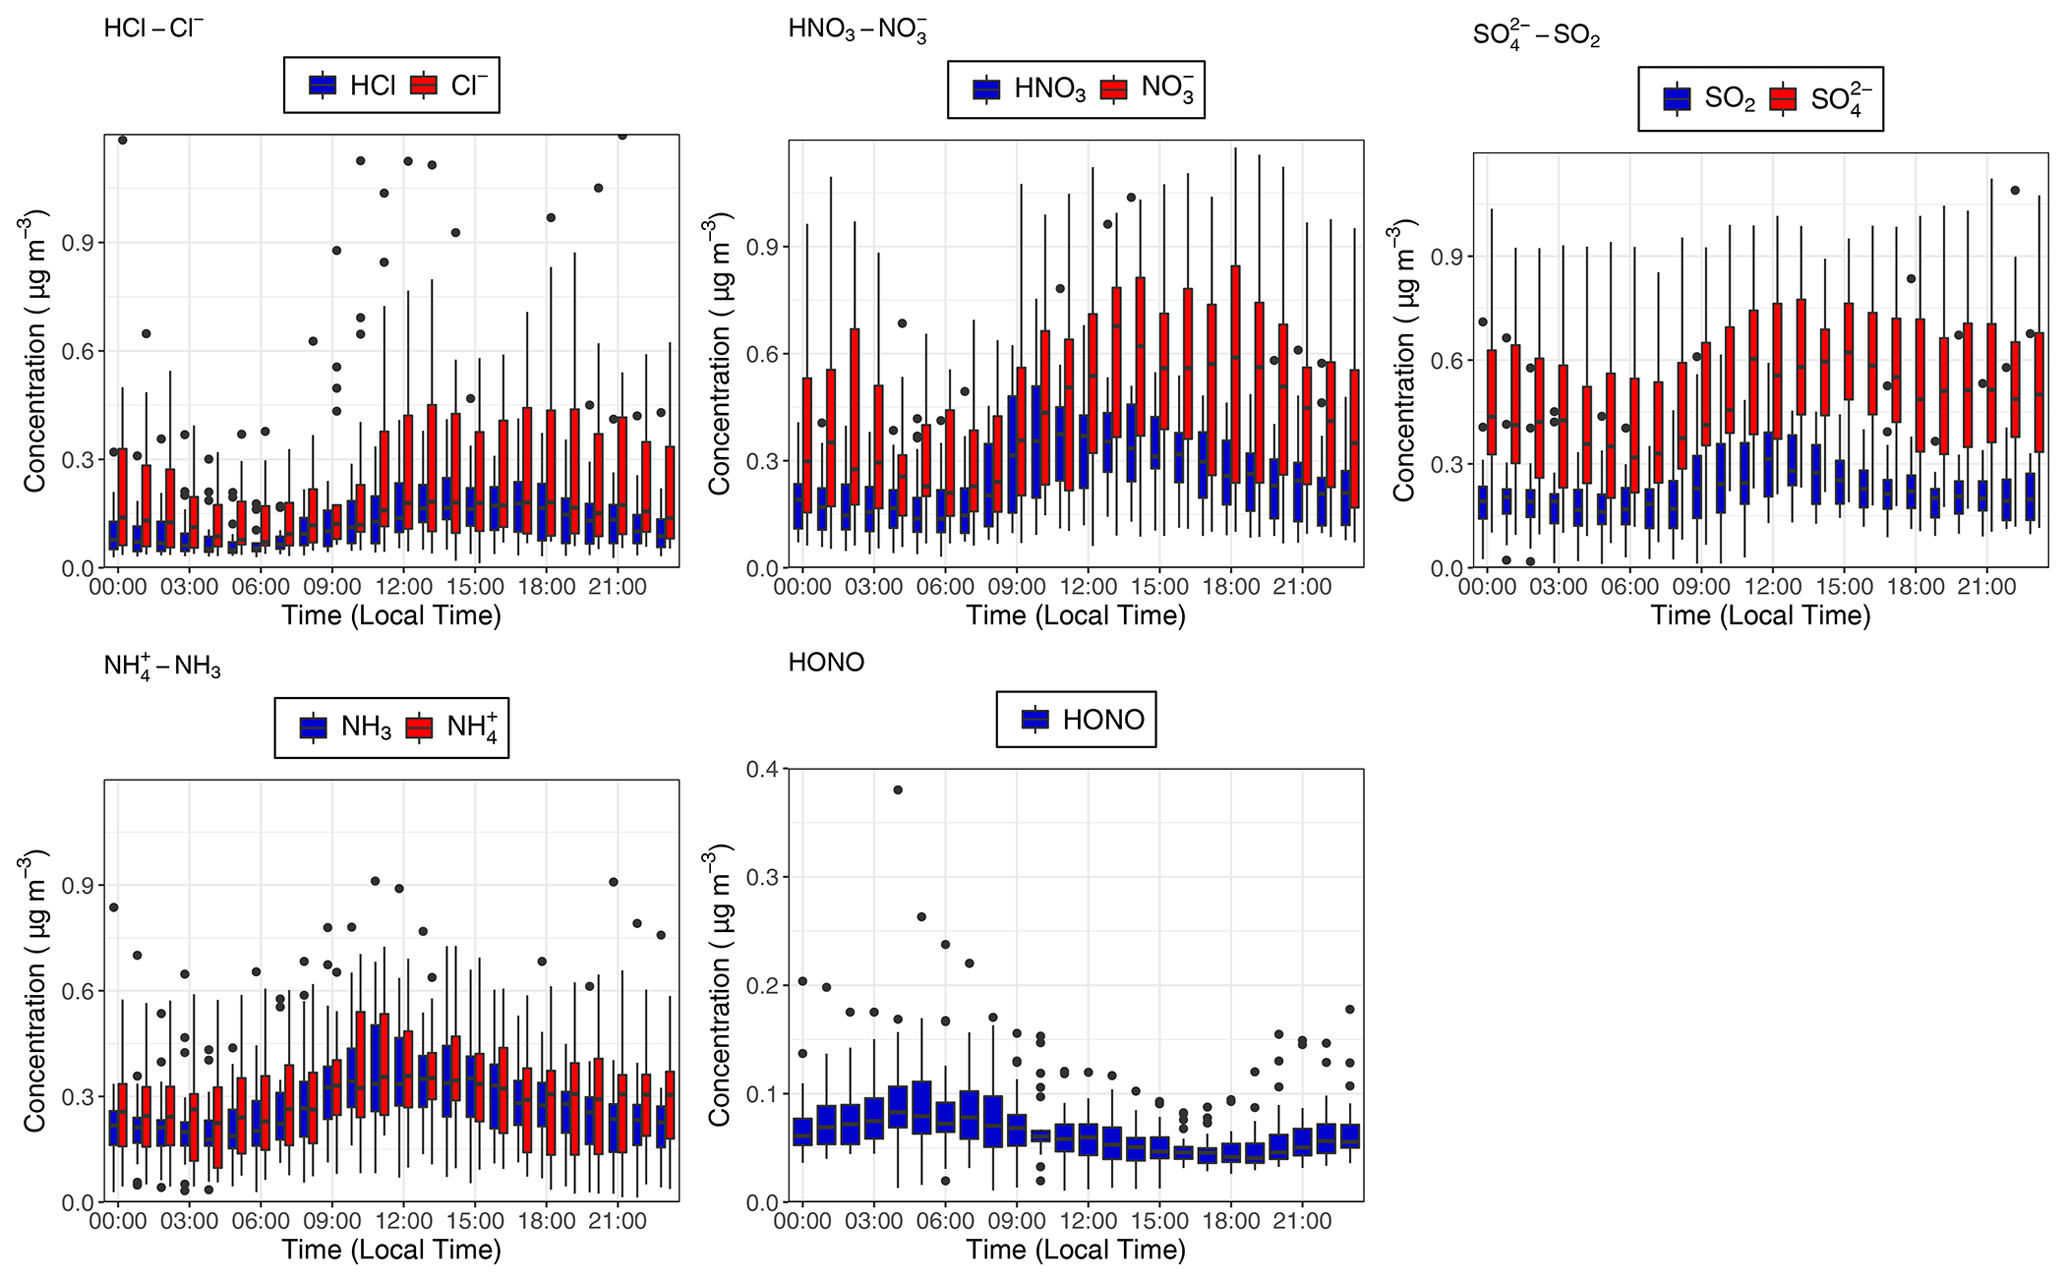
Figure 4Median hourly diel concentrations for the inorganic trace gases NH3, SO2, HONO, HNO3 and HCl in blue, as well as their paired associated aerosol counterparts , , and Cl− in red at the 60 m sampling height measured during the campaign. The lower and upper edges of each box correspond to the first and third quartiles, respectively, while the whiskers extend to the largest and smallest values which do not exceed 1.5 times the inter-quartile range from their respective hinge. Black dots outside the plots are values which exceed 1.5 times the inter-quartile range.
Similarly, median diel SO2 concentrations remained above the LOD throughout the campaign. SO2 is usually considered a marker for anthropogenic emissions, but its presence at concentrations above detectable limits during near-PR conditions might be at least in part supported by biogenic sources. Previous measurements had found SO2 concentrations close to the lowest values observed in this study and had attributed them partly to biogenic emissions (Andreae et al., 1990a; Andreae and Andreae, 1988). There are also periods when the trace gas HCl – another marker of anthropogenic emissions, originating from combustion activities and the reaction of sea salt with HNO3 – is recorded at elevated concentrations above its detection limit.
3.3 Fluxes, deposition velocities and canopy resistances
3.3.1 Fluxes of inorganic trace gases
Figure 5 shows the average diel cycles of the deposition velocities in comparison with those of Vmax for HCl and HNO3. Two sets of values are presented: values calculated using the standard modified aerodynamic gradient method (Sect. 2.3.1) without the application of a correction factor for measuring within the roughness sub-layer, termed “pre-correction values”, and values calculated with the application of a flux correction factor developed by Chor et al. (2017), γF, discussed in Sect. 2.3.3, which adjusts values derived from the aerodynamic gradient method when measuring in the roughness sub-layer, termed “post-correction values”. Due to their high water solubility (and resulting large effective Henry coefficient), HCl and HNO3 are expected to deposit at Vmax (Lelieveld and Crutzen, 1991), unless chemical conversions affect their fluxes (Nemitz et al., 2000; Twigg et al., 2011). The correction brings the Vd for these gases in close agreement with Vmax, within the measurement error. The correction increases the average Vd of HNO3 from 10.2 to 12.4 mm s−1 (average Vmax= 12.3 mm s−1) and that of HCl from 12.5 to 15.2 mm s−1 (average Vmax= 15.3 mm s−1). This suggests that, overall, the γF correction works well, and the remainder of the paper discusses post-correction values only. With this consideration in mind, Fig. 6 shows the average diurnal cycles of the post-γF-corrected deposition velocity in comparison with that of Vmax for the remaining trace gases measured: NH3, HONO and SO2 .
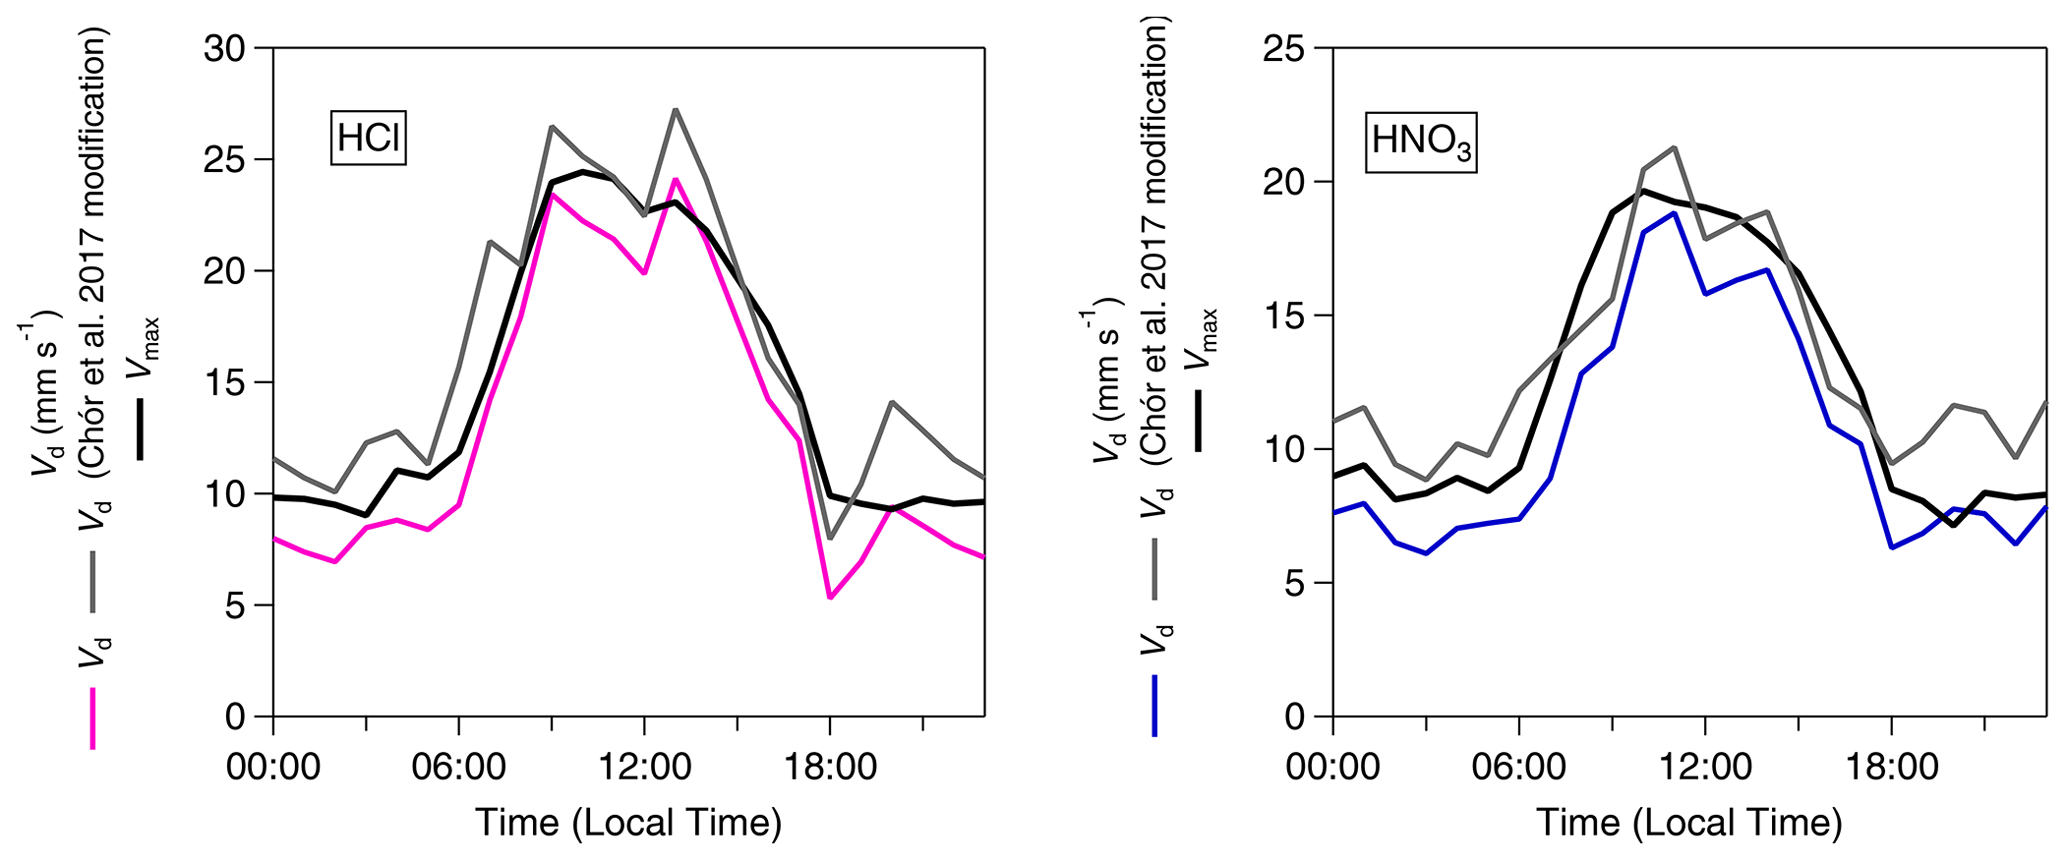
Figure 5Inorganic trace gas deposition velocities (Vd) pre- and post-correction values with γF (Chor et al., 2017) and calculated theoretical maximum deposition velocities (Vmax) for HCl and HNO3.
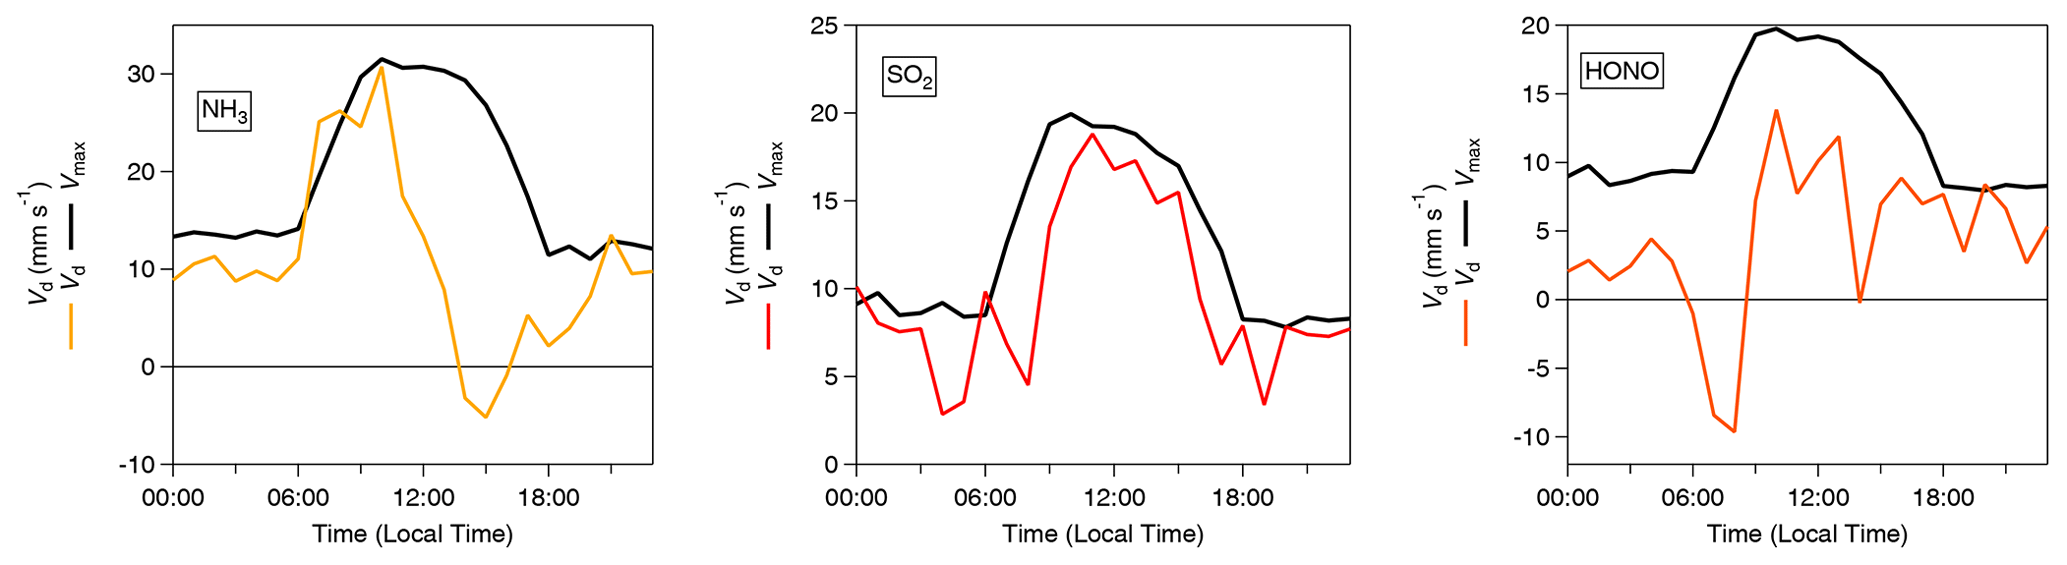
Figure 6Inorganic trace gas deposition velocities (Vd) (post-correction values) with γF (Chor et al., 2017) and calculated theoretical maximum deposition velocities (Vmax) for NH3, SO2 and HONO.
Table 2 presents a statistical summary of the calculations for fluxes, deposition velocities (Vd), theoretical maximum deposition velocities (Vmax) and canopy resistances (Rc) for the inorganic trace gases measured during the campaign. As discussed above, with the roughness sub-layer correction of Chor et al. (2017), both HCl and HNO3 are observed to deposit at Vmax within the error of the measurement, with a canopy resistance < 3 s m−1, although the results would be sensitive to the Rb parameterisation used, which forests can vary significantly depending on the ecosystem and climatic conditions (Jensen and Hummelshøj, 1995).
Time series for the post-filtered fluxes of the inorganic trace gases measured are shown in Fig. 7. The inorganic trace gases HNO3, SO2 and HCl were nearly always deposited to the surface. Any upward fluxes calculated for these gases lay within their respective error ranges. Fluxes which exceed the median values for these gases and the maximum calculated fluxes for these species, were recorded during the drier, warmer polluted conditions that prevailed from 18 to 26 October 2017. For example, the maximum calculated flux for SO2 and the largest flux of any species measured during the campaign, was −33 , which occurred on 21 October at 11:00. Conversely, while increased deposition fluxes are observed for NH3 and HONO during this same period, multiple periods of emission were recorded for these gases throughout the campaign. Although the predominant pattern of surface–atmosphere exchange throughout the campaign for HONO and NH3 was deposition to the surface, as reflected in their respective median flux and Vd values, periods of emission are a significant proportion of overall surface–atmosphere exchange. For HONO and NH3, respectively, 26 % and 19 % of calculated fluxes were positive, i.e. emissions. The median diel pattern of trace gas emissions is highlighted in Fig. 8. HONO emissions were concentrated in the early morning, with positive median values indicating a prevalent pattern of emission present at 07:00 and 08:00. In contrast, NH3 emissions were observed in the afternoon, from 14:00 to 16:00. The other trace gases – HCl, HNO3 and SO2 – showed maximum deposition fluxes in the afternoon, with decreased fluxes during the night and early morning hours.
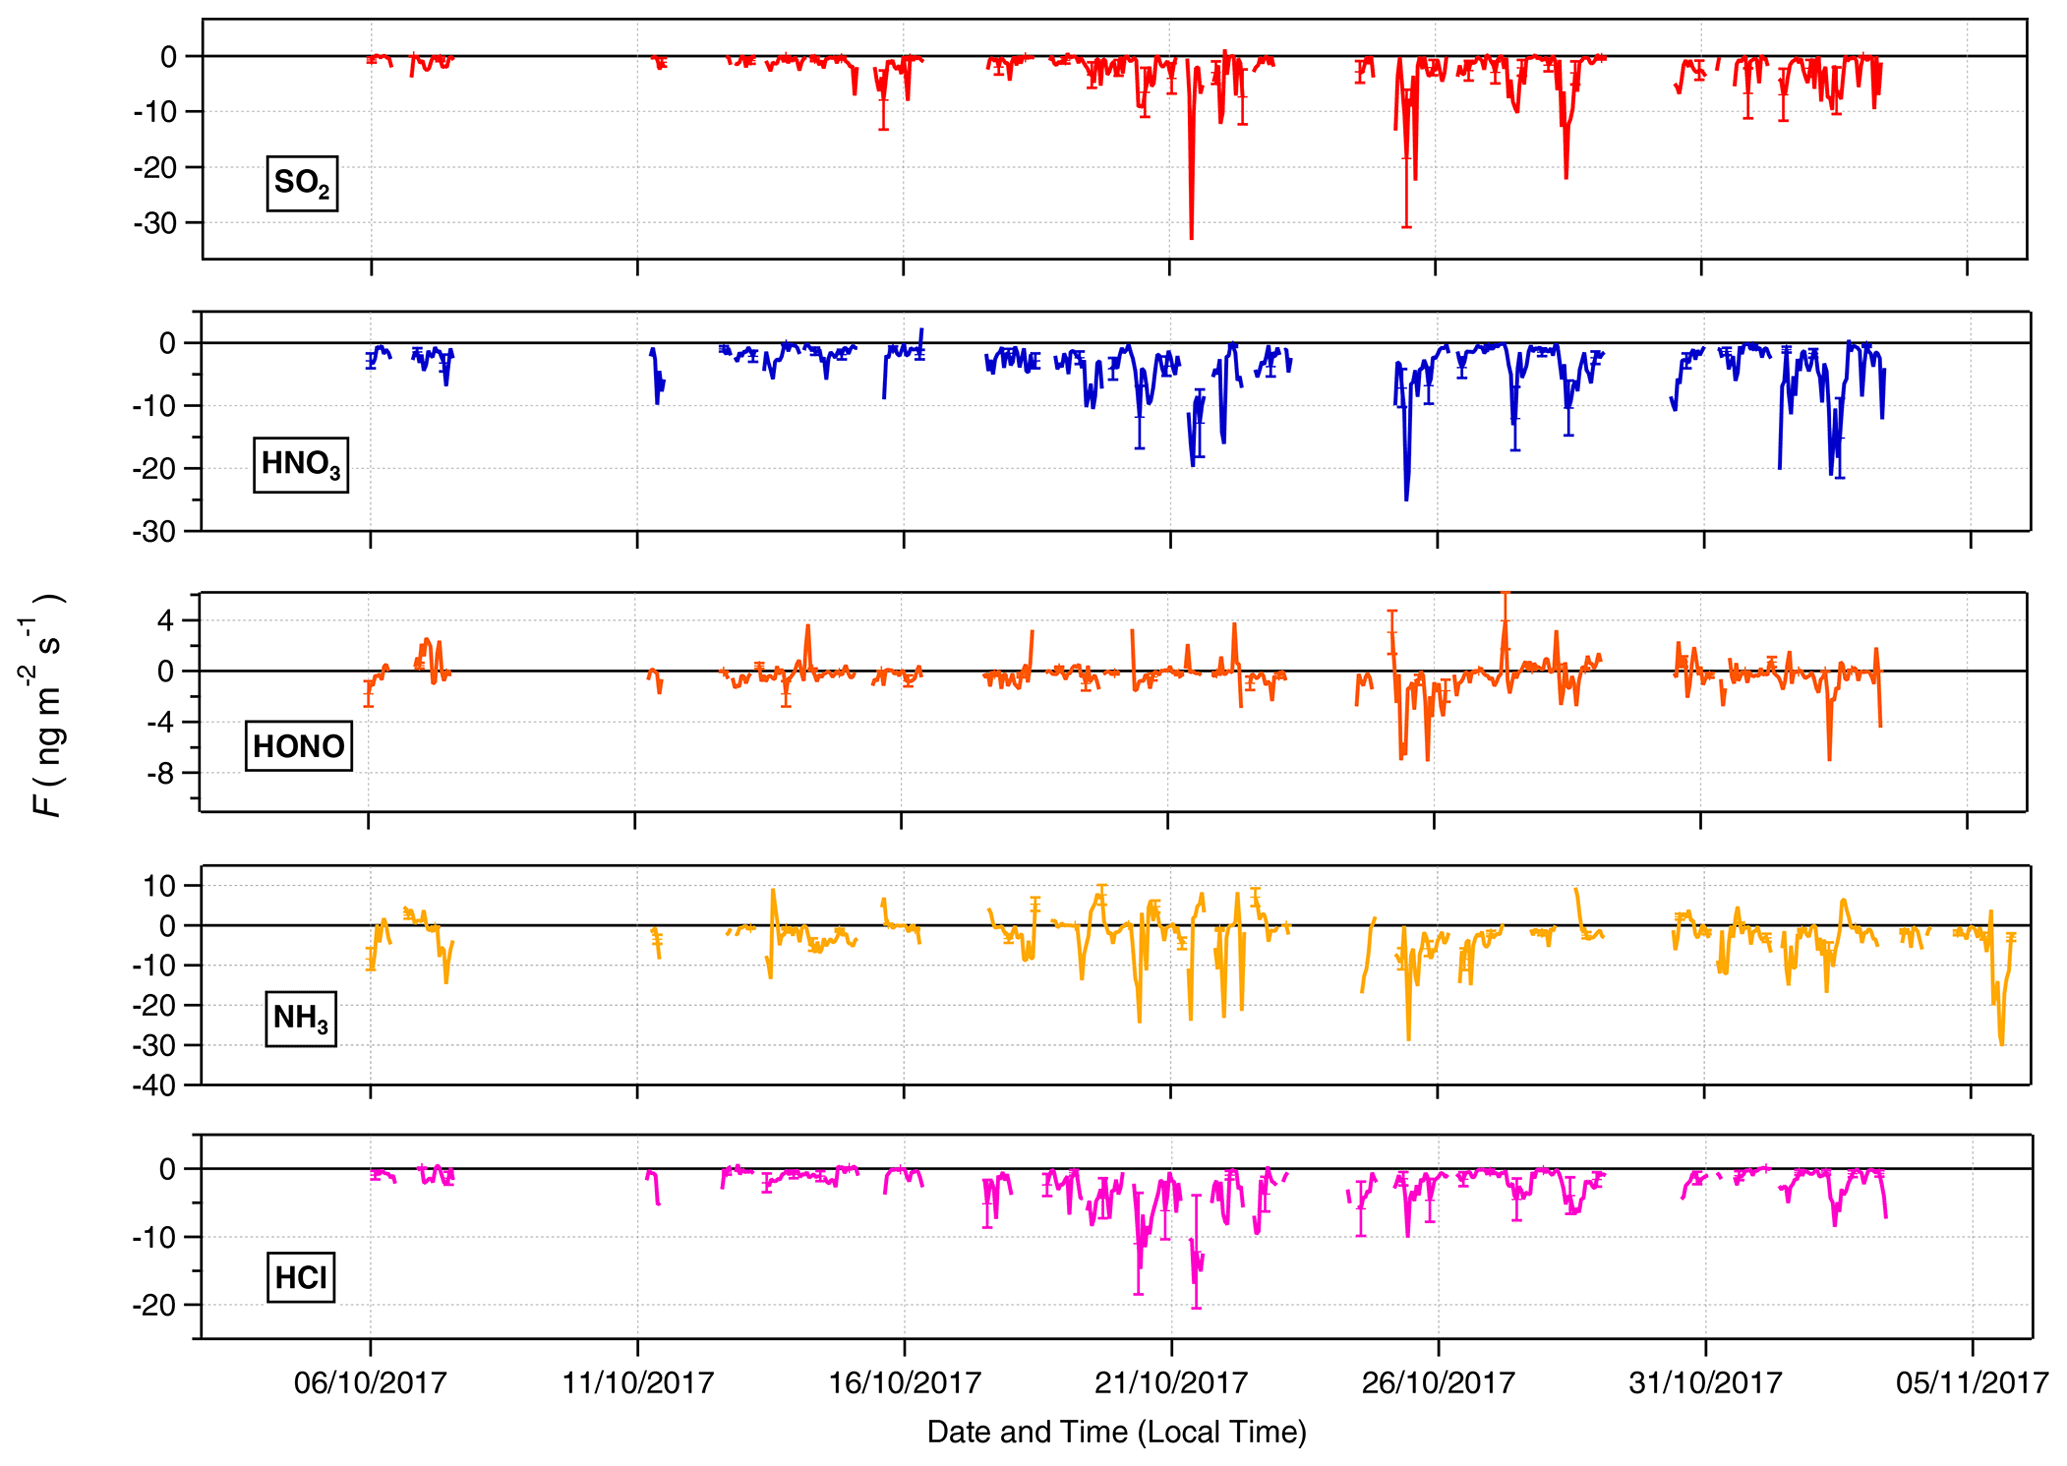
Figure 7Time series of filtered fluxes for the inorganic trace gas species measured during the campaign.
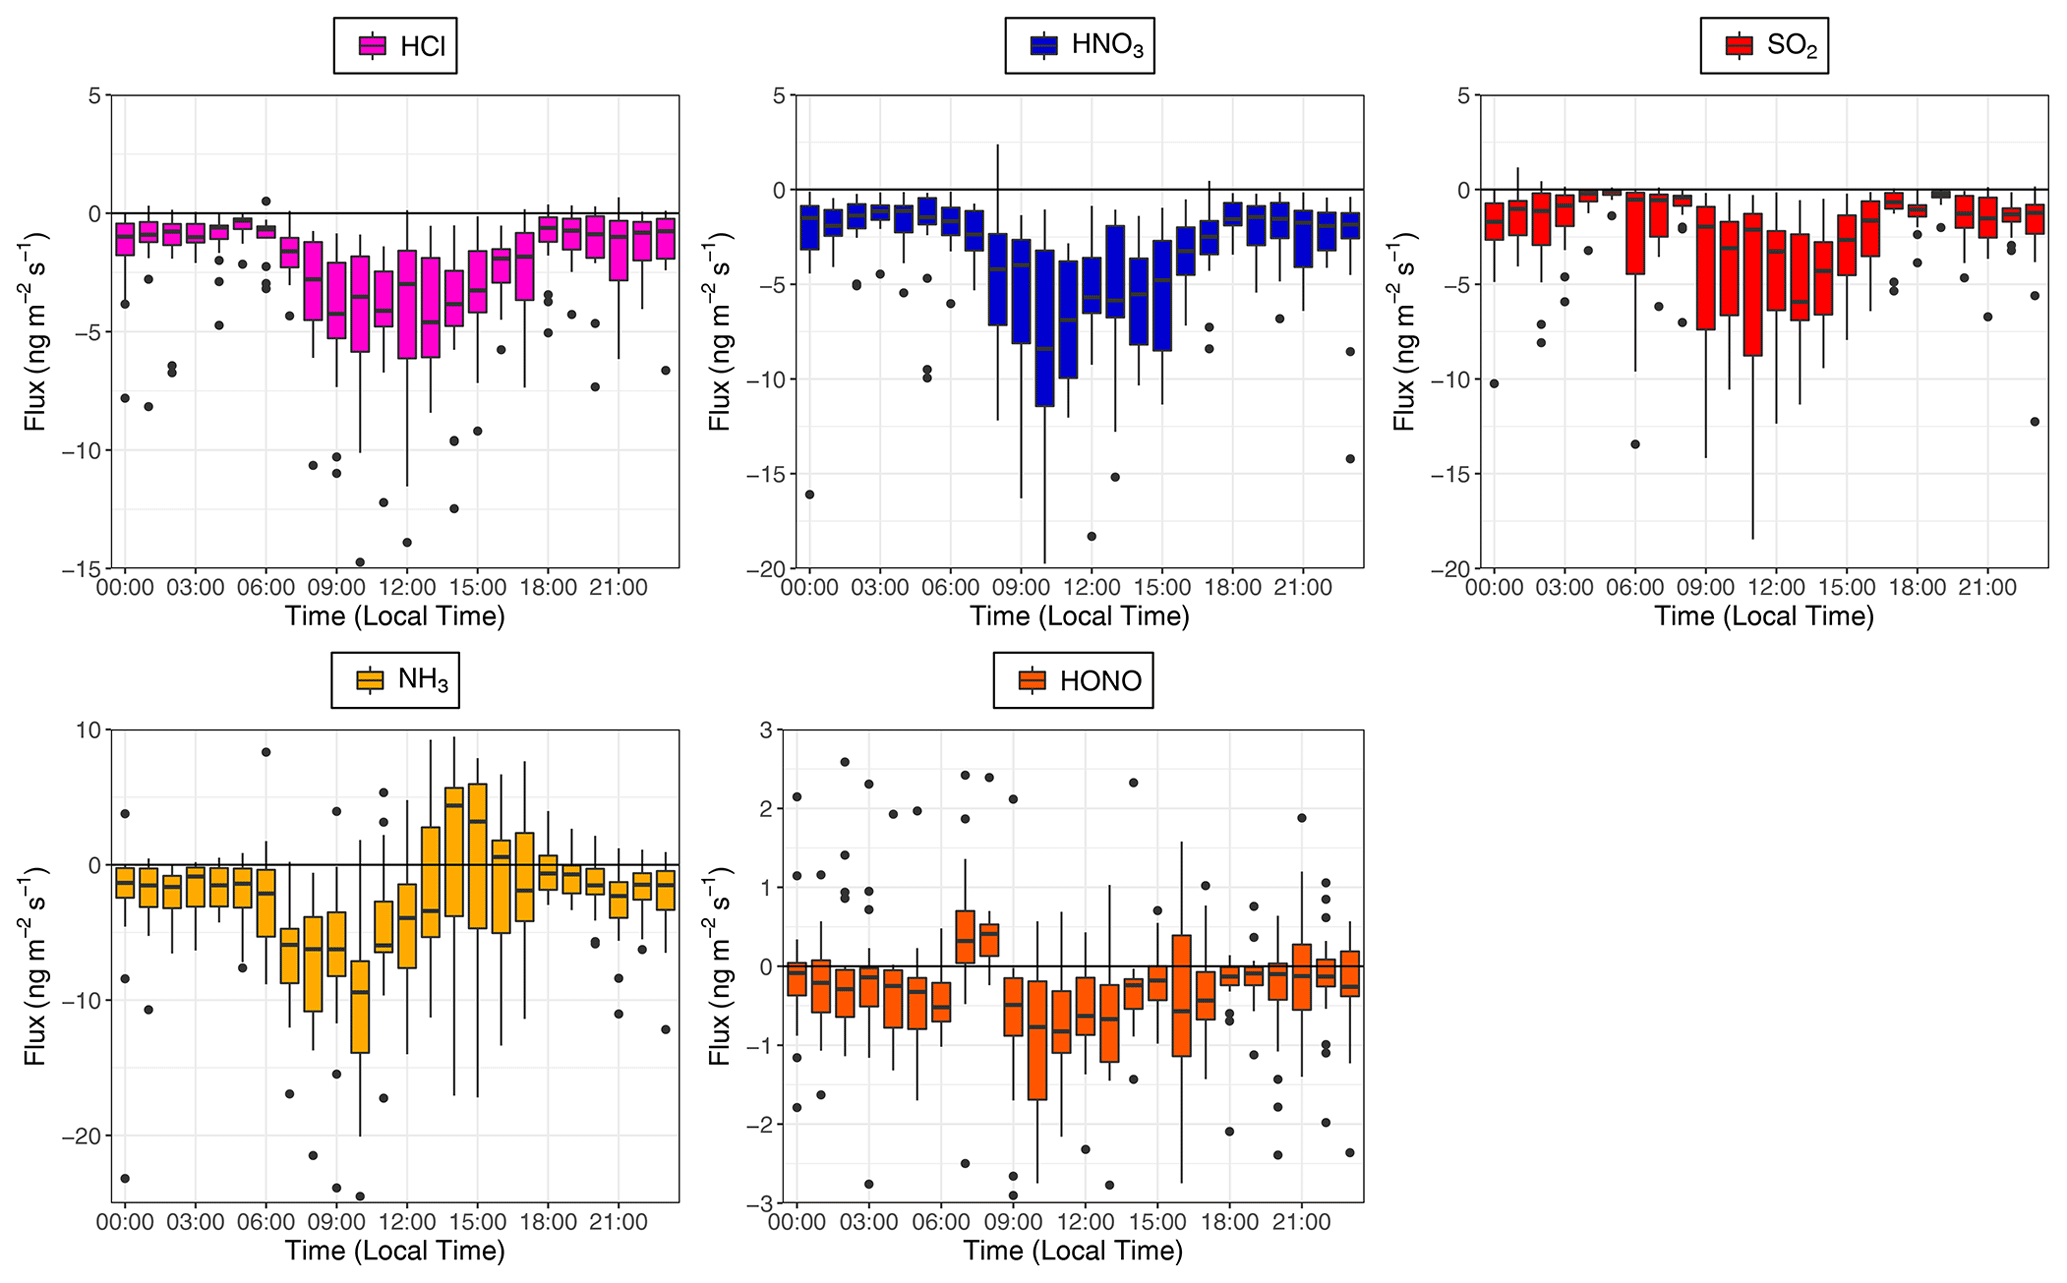
Figure 8Calculated median diel fluxes of inorganic trace gas species measured during the campaign. From top left (clockwise) – HCl, HNO3, SO2, HONO and NH3. The lower and upper edges of each box correspond to the first and third quartiles, respectively, while the whiskers extend to the largest and smallest values which do not exceed 1.5 times the inter-quartile range from their respective hinge. Black dots outside the plots are values which exceed 1.5 times the inter-quartile range.
3.3.2 Fluxes of associated ionic aerosol counterparts
A statistical summary of fluxes and deposition velocities for the aerosol species is presented in Table 3. Also included for each species is the minimum detectable flux (FLOD) and the percentages of calculated fluxes which exceed this value (fLOD %).
Median Vd values for and were 2.64 and 2.81 mm s−1, respectively. In the comparison of GRAEGOR and ToF-ACSM concentration measurements outlined in Sect. 3.2, we found a reasonable agreement for and , considering the difference in measurement height and instrumentation. Given that the ToF-ACSM measures only the submicron (< 1 µm particle diameter) range, this suggests that the and quantified by GRAEGOR were also dominated by the submicron range. From process-orientated modelling of aerosol Vd, it has been suggested that particle Vd increases over increasingly rough surfaces (Petroff et al., 2008b). In a meta-analysis of field flux data, Gallagher et al. (2002) parameterised this relationship as a function of the surface deposition velocity, Vds, and the surface roughness (given as the surface roughness length, z0, in metres):
Using the median value of the surface roughness lengths calculated at the site (and including only lengths with a valid calculated value of aerosol Vd) yields a value of 2.86 m for z0. Substituting this into the Eq. (12) parameterisation suggests a Vds of 2.1 mm s−1 for submicron particles. Values of and Vd converted to Vds values using Eq. (9) result in median Vds values for and of 2.9 and 3.3 mm s−1, respectively. Although these values are higher than the parameterised value, Eq. (12) was derived specifically for particles in the range 0.1–0.2 µm. Larger particle sizes would have higher Vds values for a given value of u* (Davidson et al., 1982; Slinn, 1982). Thus, if the particle size range for and exceeds 0.2 µm but remains in the submicron range the measured median Vd would exceed the parameterised value.
In contrast to Vds values for and , which are in the range for parameterised values for the site, the median Vds values for Cl− and are 3 to 4 times greater than the parameterised value of 2.1 mm s−1. The median Vds value for Cl− is 10.2 mm s−1, while for it is 7.6 mm s−1. As the parameterised value holds only for particle diameters between 0.1 and 0.2 µm and considering that modelling indicates an increase in Vds with increasing particle size, the larger median Vds values for Cl− and are consistent with GRAEGOR vs. ACSM comparison, which suggests that these aerosol counterparts were present in the supermicron (> PM1) fraction.
A time series of the aerosol counterpart fluxes is presented in Fig. 9. The predominant direction of surface–atmosphere exchange for all aerosol species was deposition, as reflected in the median flux values in Table 3. However, individual emission fluxes were recorded for all species, with the maximum emission values for Cl− and (+3.6 and +4.3 , respectively) being particularly large. The time series of values is filtered for identifiable errors in measurement and for micrometeorological values that fall outside specified limits (Sect. 2.4.3). These emission fluxes are therefore unlikely to be caused by instrumentation faults or calculation errors. They are, however, limited in duration and overall extent – positive particle emissions are never observed consecutively, occurring exclusively within 1 h periods, and constitute only between < 1 % () and 5 % (Cl−) of total fluxes. While particle emission fluxes have previously been observed with GRAEGOR (Nemitz et al., 2004; Twigg et al., 2011), these previous observations have occurred during periods of known flux divergence.
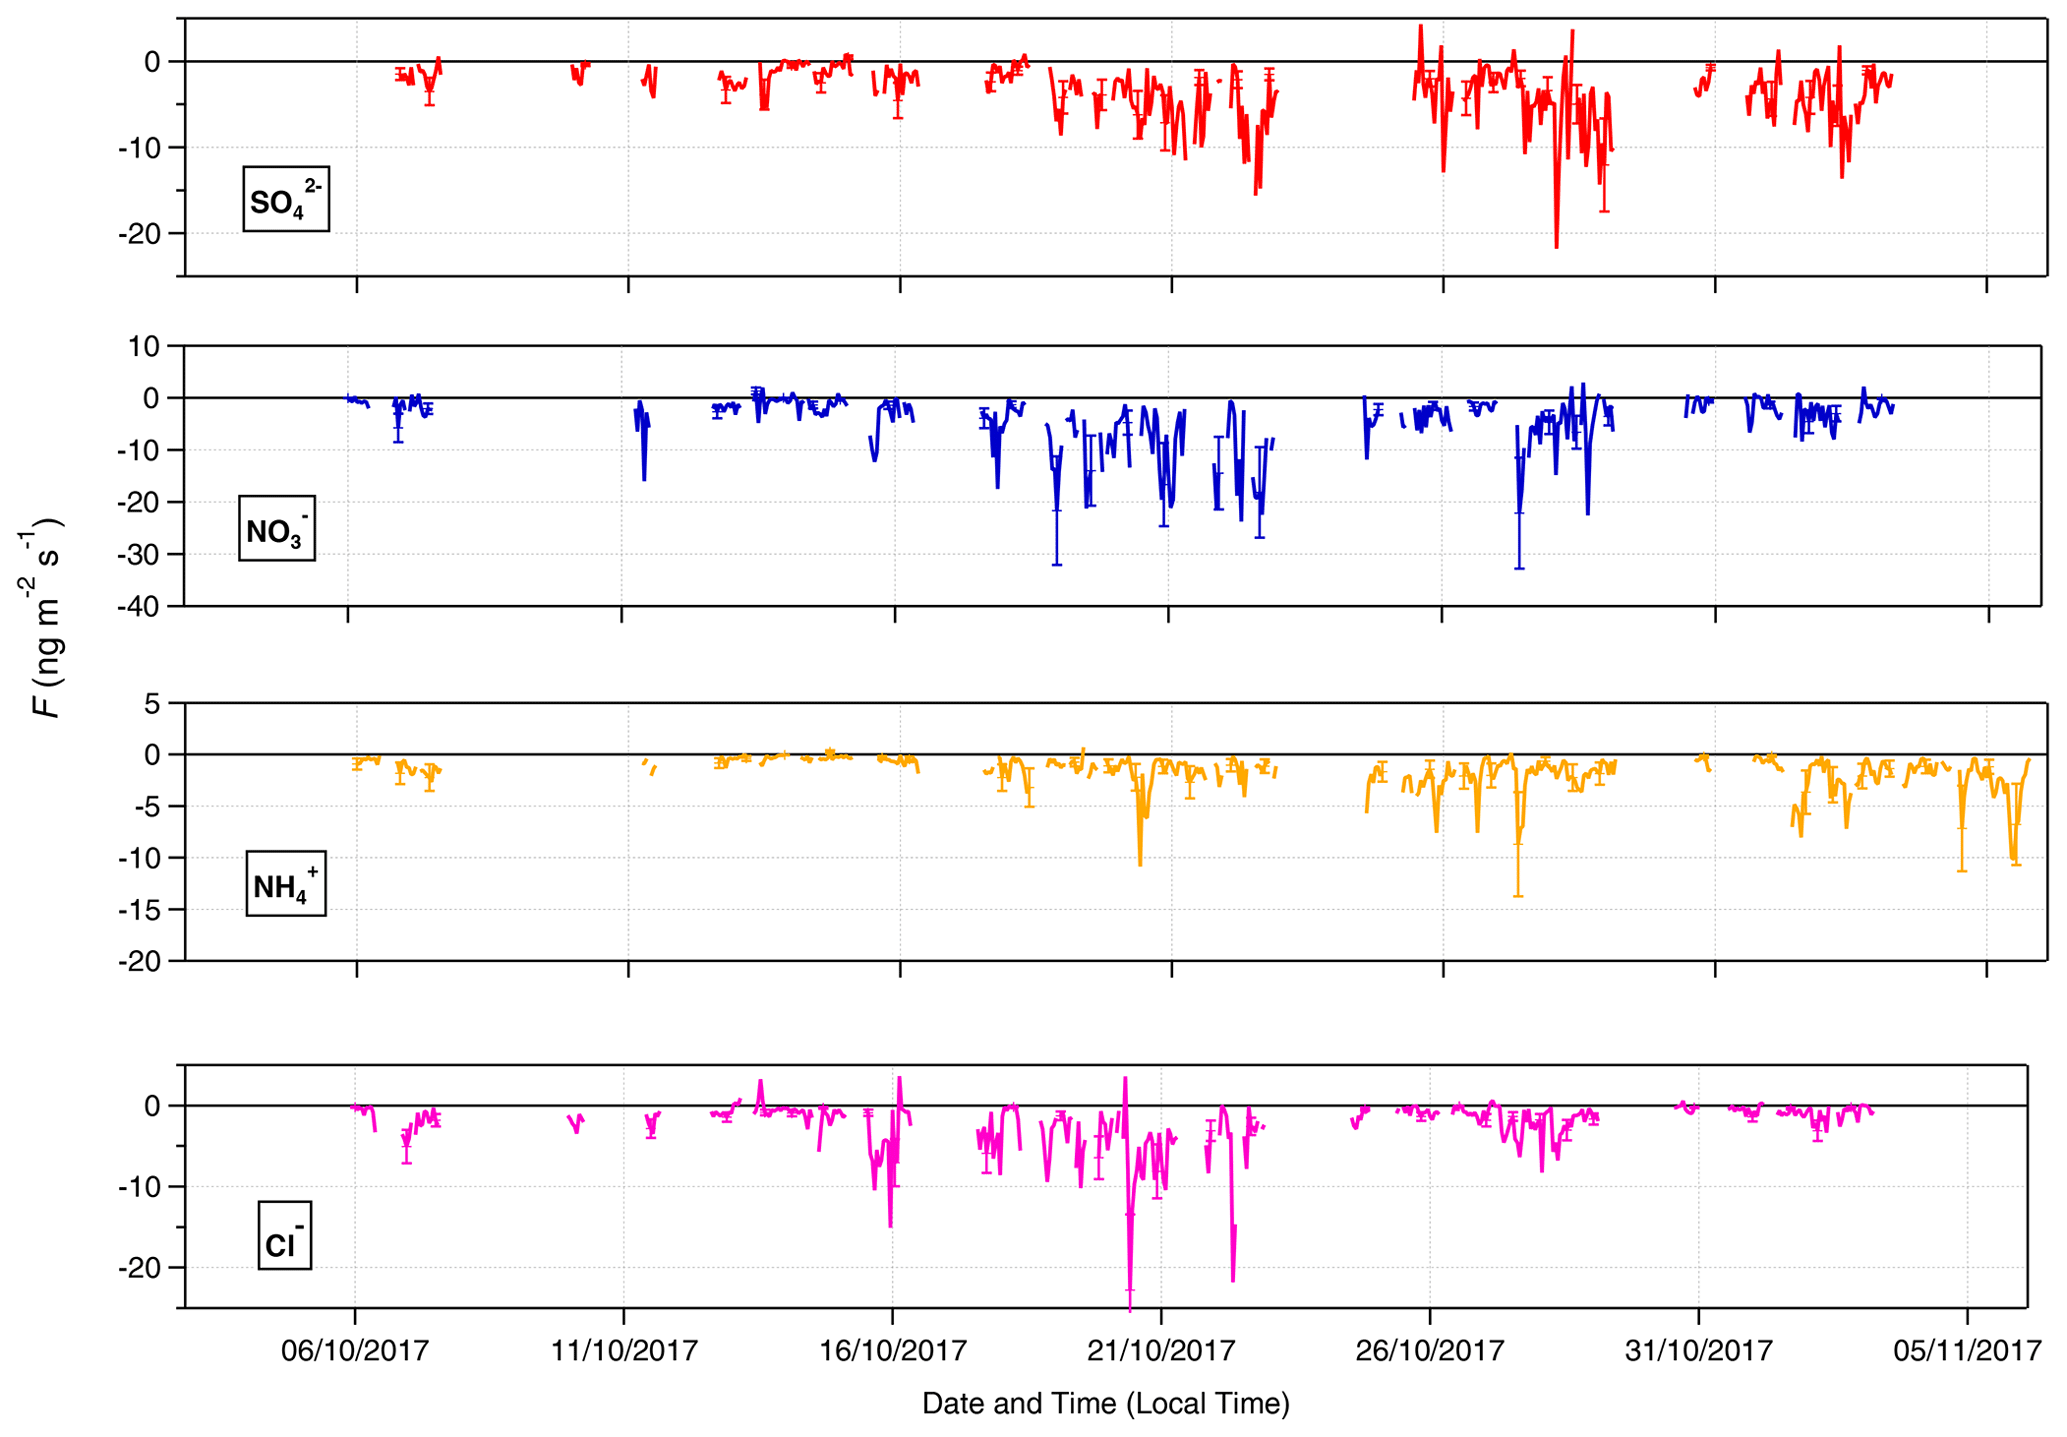
Figure 9Time series of filtered fluxes for the aerosol counterpart species measured during the campaign.
4.1 Long-range transport of pollutants – the influence of biomass burning on measurements
All measured gas and aerosol species show significant differences in concentrations between near-pristine and polluted periods (Figs. 2 and 3). The minimum recorded concentrations for all species are during periods when BCe < 0.02 µg m−3 and cCO < 150 ppb. Conversely, maximum concentrations for all species occur between 21 and 25 October 2017, during which time the concentration of BCe peaks at 0.14 µg m−3 at midnight on the 25 October along with a peak in cCO of 300 ppb. Calculated fluxes exhibit the same behaviour, with maximum deposition fluxes occurring during the relatively polluted period. The gases NH3, HCl and SO2 all have maximum deposition values on 21 October, with a pronounced deposition of −33 for SO2 at 11:00 on this day. While HNO3 also shows large deposition fluxes on 21 and 22 October, its maximum deposition value is on 25 October when the HONO flux is also at its maximum deposition value.
For the relatively polluted period from 21 to 25 October, there is evidently a marked increase in concentrations and fluxes above the average dry season background levels. Anthropogenic activity, principally biomass burning, may be the driver for this increase. This can be assessed from the strength of correlation between trace gases and aerosol concentrations and measured concentrations of BCe, which acts as a marker for biomass burning and for anthropogenic emissions in general. For all species, Spearman rank correlation coefficients were statistically significant (p < 0.05), suggesting a monotonic relation between all inorganic trace gases and associated aerosols with BCe. Correlations with BCe were strongest for NH3 (rs= 0.60) and SO2 (rs= 0.51), which was also the case for their respective aerosol phases. The weakest correlation between a gas and BCe was for HCl (rs= 0.29). HONO and HNO3, while not as strongly correlated with BCe as NH3 and SO2, showed a moderate positive correlation. Conversely, there was a weak positive correlation between and BCe and a very weak positive correlation for Cl−.
To determine the origin of the polluted air masses arriving at the ATTO site during the relatively polluted period of the campaign when BCe concentrations were largest, back-trajectory analysis was conducted. Ten-day air-mass back-trajectories arriving every 3 h at a height of 500 m a.s.l. between 18 and 25 October 2017 were obtained from the HYSPLIT-4 air trajectory model (Stein et al., 2015) and the Global Data Assimilation System (GDAS) meteorology dataset at resolution, and they were analysed using the openair package for R (Carslaw and Ropkins, 2012). The ensemble of back-trajectories per week of the campaign, with associated frequency trajectory plots, is shown in Fig. 11. Trajectories arriving during the third week (20–26 October), when increased concentrations of pollutants were measured, are notable for their origin near the south-west coast of Africa. They are also differentiated from the other trajectories by the frequency with which they travel further south over the interior of Brazil, veering sharply to arrive at the site from a southerly direction and thus from over the populated areas to the east of Manaus. Figure A1 focuses on the path of the daily trajectories grouped by week in the regional area surrounding the ATTO site, with the location of fires (recorded by the National Aeronautics and Space Administration’s Fire Information for Resource Management Service) overlaid. During the period of increased concentrations from 19 to 24 October, trajectories travel over areas where frequent fires were recorded.
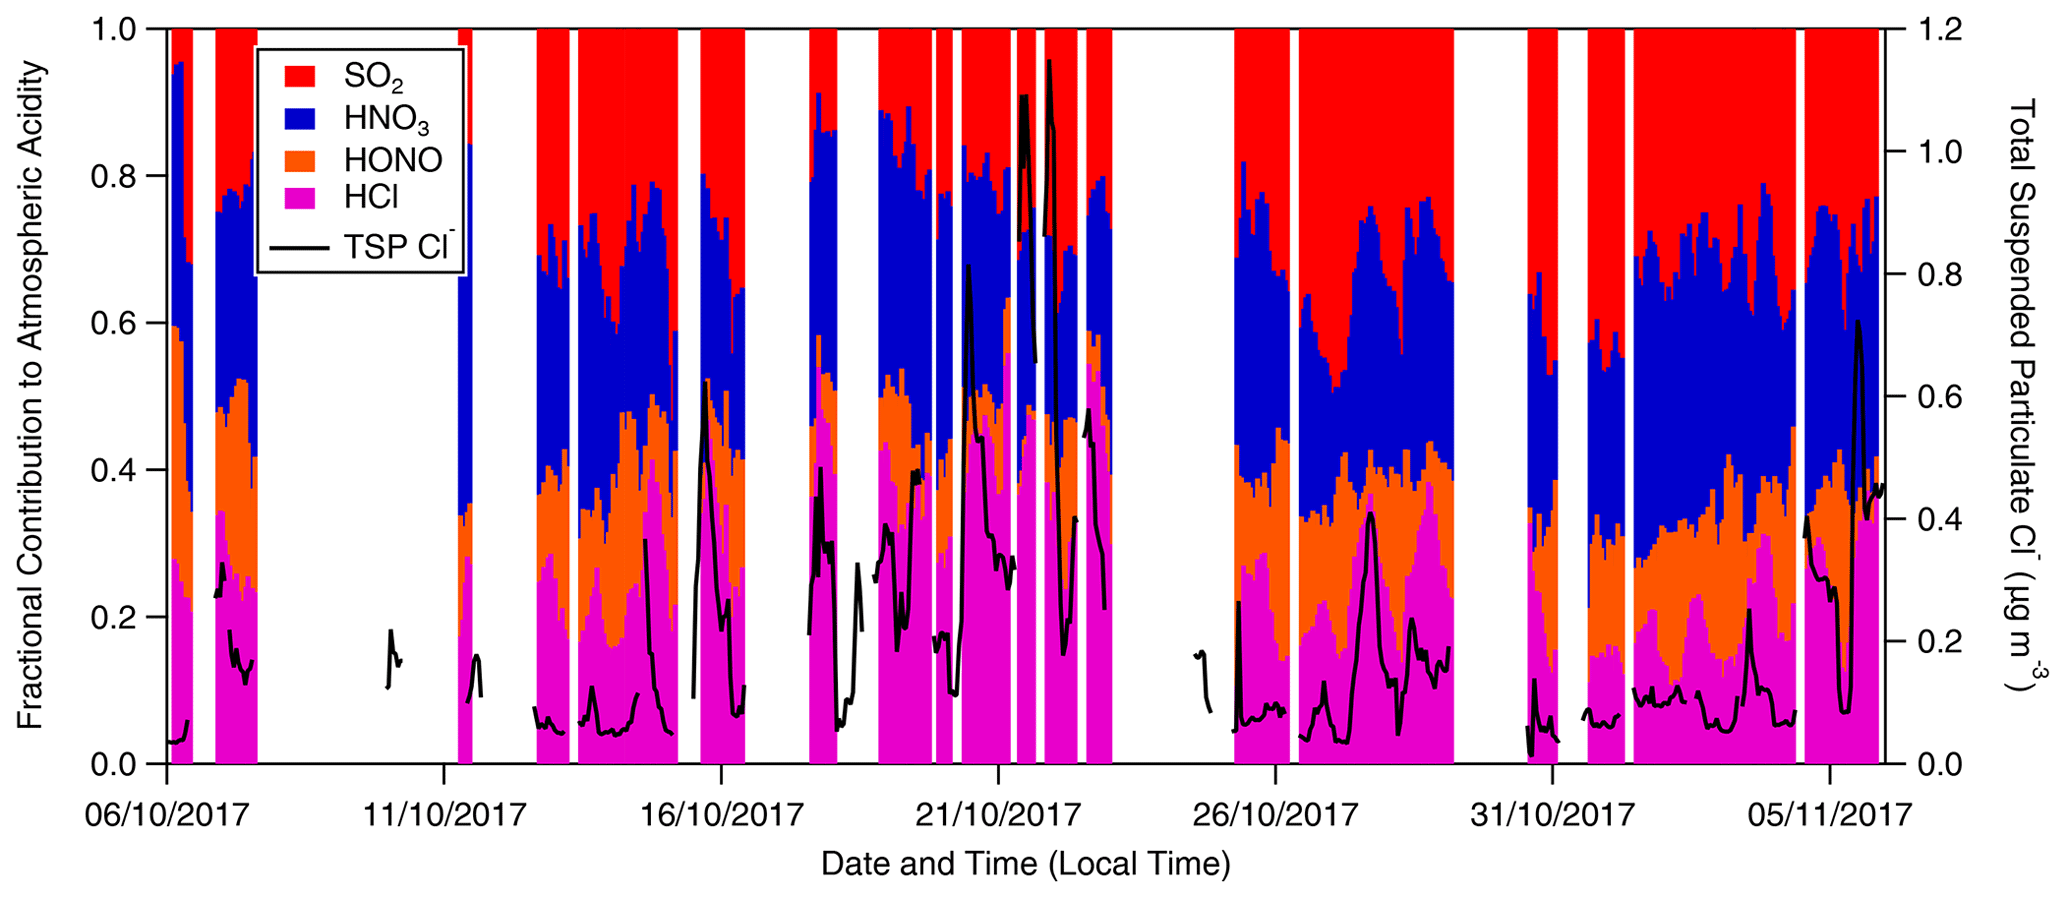
Figure 10Fractional contribution to total measured inorganic acidity from SO2, HNO3, HONO and HCl as measured by GRAEGOR at 60 m (hourly resolution). The concentration of inorganic particulate Cl− is included as an indicator of periods when sea salt or chloride containing particulate was present at the ATTO site.
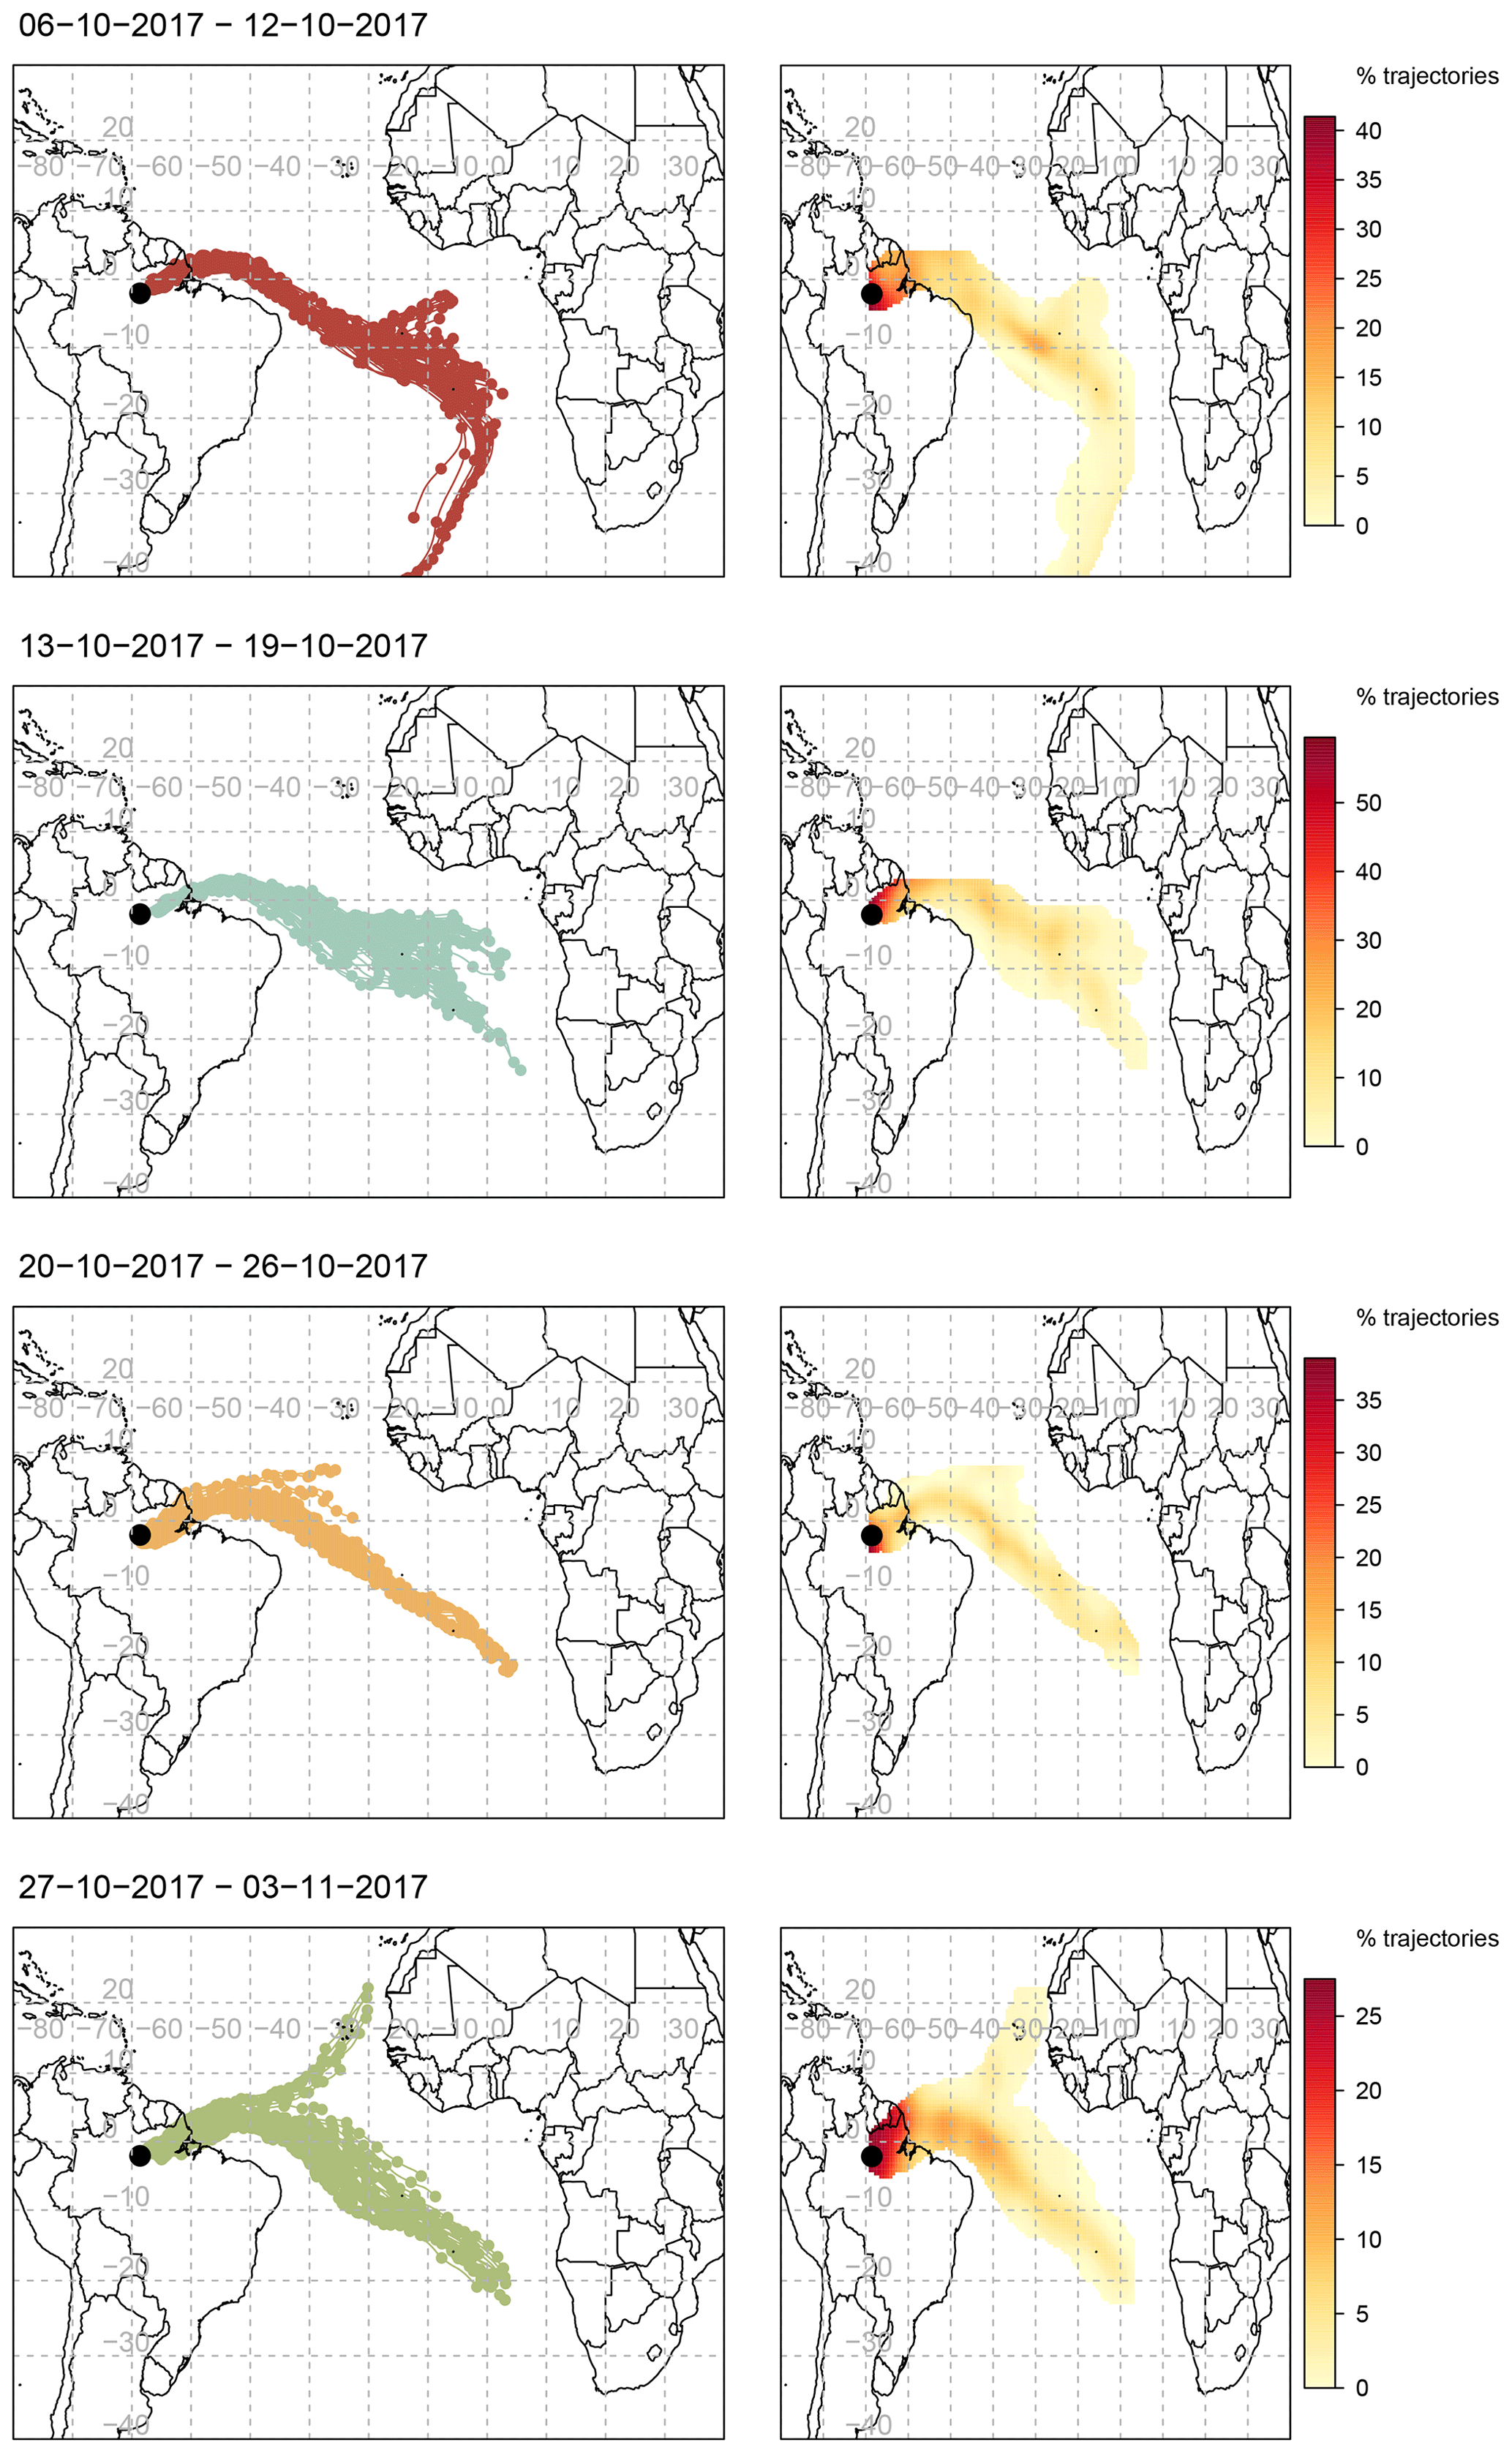
Figure 11Air-mass back-trajectories arriving at the 80 m walk-up tower on each day every 3 h from 00:00 local time over the period from 6 October to 3 November 2017, grouped by week, and coupled with associated frequency trajectory plots. The duration of each trajectory is 10 d, marks indicate 12 h intervals. Modelled using NOAA HYSPLIT-4 using GDAS1 meteorology.
This back-trajectory analysis provides some insight into the origins of the polluted air masses during 21 to 25 October. During the dry season, a mixture of regional and remote sources contributes to the pollution over the Amazon Basin, with local sources from deforestation and biomass burning being predominant (Andreae et al., 2012; Pöhlker et al., 2019). Pollution from the densely populated north-east coast of Brazil adds to the pollution burden throughout the relatively polluted period (Andreae et al., 2018). In addition to this dry season background pollution, there are periods when long-range transport of pollutants contributes to the overall pollution burden observed at the ATTO site. The sources for the majority of these long-range transport (LRT) episodes during the dry season are located in southern Africa (Holanda et al., 2020), with volcanic eruptions (Saturno et al., 2018a) and biomass burning (Pöhlker et al., 2018; Andreae et al., 2018) as two of the attributed causes. As the 10 d back-trajectories for 21 to 24 October originate at the west coast of southern Africa, it is likely that the increased concentrations and fluxes of the longer-lived aerosol species are due to the long-range transport of biomass burning pollution from southern Africa.
The inorganic gases and aerosol species measured during the ATTO campaign at elevated concentrations during polluted periods are consistent with signatures of biomass burning; this has been confirmed by investigations into the chemical constituents of smoke from biomass burning in laboratory studies (McMeeking et al., 2009), field studies from atmospheric monitoring stations located near biomass burning point sources (Aurela et al., 2016) and aircraft measurements of plumes from biomass burning (Andreae et al., 2018; Aruffo et al., 2016; Fiedler et al., 2011). Biomass burning is an important source of reactive nitrogen emissions, and emissions of NH3 from biomass burning are the second most important source of global emissions behind agriculture, accounting for 14 % of total terrestrial emissions (Van Damme et al., 2014; Whitburn et al., 2015). The predominant source for the production of HNO3 and HONO in the troposphere is the OH-driven oxidation of NO2, which occurs in conditions of elevated NO2 concentrations. In remote areas, where background levels of NO2 are low, the production of HNO3 is limited. However, with injections of anthropogenically derived NO2 into the atmosphere above remote areas, the efficient scavenging of OH by elevated NO2 concentrations leads to the formation (and subsequent deposition) of HNO3 (Mannschreck et al., 2004). Emissions of NOx from burning during the southern African biomass burning season is a significant contributor to free tropospheric NOx in the southern hemisphere (Adon et al., 2010; Galanter et al., 2000). Finally, elevated concentrations of SO2 and HCl as well as submicron particles such as and have previously been measured in biomass burning plumes, during both ground and aircraft measurements (Burling et al., 2010; Yokelson et al., 2011; Andreae et al., 1998), and the corresponding emission factors have been compiled in Andreae (2019). Adachi et al. (2020) found that the number fractions of sea salt and mineral dust measured during the Green Ocean Amazon Campaign (February to March 2014) increased threefold during periods when LRT occurred.
The evidence from the correlation and back-trajectory analyses suggests that the presence of SO2 and NH3 (and also of and ) was primarily driven by biomass burning. For the period from 21 to 24 October, concentrations of and may have been elevated due to biomass burning in the region surrounding the ATTO site, with the possible complement of plumes from biomass burning originating in southern Africa. Figure A2 highlights this link by presenting concentration-weighted trajectory analyses, which determine the geographic origin for concentration levels of a select species, for BCe, and . Areas determined as the source for the highest measured concentration of these three species align with areas in which the most intense (as determined by the fire radiative power of each fire count) biomass burning occurred regionally.
While this holds partly for HONO and HNO3, it only weakly holds for , HCl and Cl−. An alternative origin for these species must therefore be considered and is discussed further in Sect. 4.2.3 and 4.3.2 for HCl and for and Cl−, respectively.
4.2 Gas-phase concentrations and their controls
4.2.1 Relative contribution of acidic inorganic trace gases to total atmospheric acidity
The relative proportions of inorganic trace gases over the ATTO site during the campaign can give important insight into the overall atmospheric chemistry. As the primary basic gas in the atmosphere, NH3 can react with the acidic gases HCl, HNO3 and H2SO4 (produced by the oxidation of SO2) to form ammonium salts whose lifetime and behaviour are dependent upon the associated gas. To investigate the importance of the various acidic gases for total acidity at this remote Amazon site, the fractional contribution to total inorganic acid loading for HCl, HONO, HNO3 and SO2 as measured by GRAEGOR was determined (Fig. 10). Taken as an arithmetic mean value, the fractional contributions of SO2, HNO3 and HCl are similar. While not as significant a contributor in comparison, HONO also contributes at an average fraction of 0.13, which remains consistent throughout the duration of the campaign. The contributions of SO2 and HNO3 average at 0.31 and 0.30, respectively, whilst the contribution of HCl averages at 0.26 but fluctuates throughout the campaign, varying between ∼ 0.05–0.10 during near-pristine conditions to almost 0.40 during the polluted period from 19 to 25 October.
4.2.2 Urban plumes, NOx and reactive nitrogen formation
Fossil fuel combustion is the primary anthropogenic (and overall predominant) source for NO2 in the troposphere. The increase in HNO3 concentrations on 25 October (also resulting in increased deposition fluxes) could be due to air masses that picked up emissions of NOx (NO2+NO) from the urban areas of Manaus and Santarém. Measurements of NO2 downwind and west of the Manaus urban area showed elevated NO2 concentrations in remote areas affected by emission plumes from the city (Kuhn et al., 2010; Trebs et al., 2012; Abou Rafee et al., 2017; Martin et al., 2017). With air masses arriving at the site from the south and south-east, which had travelled over the eastern suburbs of Manaus and the city of Santarém, respectively, it is likely that NO2 plumes are responsible for the elevated HNO3 observed on 25 October.
4.2.3 Biogenic drivers of HCl concentrations
While a moderate, positive monotonic relation exists between concentrations of HCl and BCe, it is unlikely that the presence of HCl above the detection limit of GRAEGOR could be sustained throughout the campaign solely through anthropogenic emissions. HCl is highly reactive and water soluble, with a mean lifetime of ≈ 36 h (Graedel and Keene, 1995; Kritz and Rancher, 1980). Consequently, it is unlikely that regional or global biomass burning could contribute meaningfully to the HCl concentrations observed at this remote site. The peak in HCl concentrations observed during the relatively polluted periods of the campaign could be a result of biomass burning from local sources in close proximity, but an alternative explanation must be considered for the background concentrations of HCl. Globally, much of the HCl derives from the displacement reaction of HNO3 with aerosol Cl− compounds; this typically happens with NaCl sea salt but potentially other Cl− compounds at this site (see Sect. 4.3.2 below). A further potential contributor is oxidation of methyl chloride (CH3Cl), whose predominant natural source is tropical forest (Yokouchi et al., 2002; Xiao et al., 2010). The emissions are driven principally by dipterocarps and ferns (Blei et al., 2010), whose emission rates are unaffected by abiotic conditions (Yokouchi et al., 2015). Gebhardt et al. (2008) measured an average emission for CH3Cl of 9.5 over Guyanese and Surinamese rainforest, while Moore et al. (2005) reported CH3Cl concentrations above a rainforest canopy in Rondônia, Brazil, confirming that the Amazon rainforest region is a net regional source for CH3Cl.
Sanhueza (2001) proposed an OH-driven oxidation pathway for CH3Cl that terminates with stoichiometric production of HCl. It is thus possible that the tropical forest emissions of CH3Cl, combined with the local high oxidative capacity, could yield the background HCl concentrations observed in this study. However, to confirm this idea, simultaneous measurements of CH3Cl and HCl concentrations would be required, together with confirmation of Sanhueza’s postulated CH3Cl oxidation pathway.
4.2.4 Anthropogenic and biogenic drivers of SO2 concentrations
This campaign presents the first tower measurements of time-resolved SO2 fluxes over tropical rainforest. Standard commercial SO2 monitors struggle to resolve such low concentrations. Although aircraft (Andreae and Andreae, 1988), denuder tube (Adon et al., 2013) and filter pack (Paralovo et al., 2019) measurements of SO2 over rainforest exist, they lack the time resolution of the measurements during this campaign or do not measure fluxes. This study has shown that LRT pollution episodes can significantly enhance SO2 deposition fluxes (a maximum deposition flux of −33.2 was recorded during the most polluted period of the campaign) and that even during relatively pristine conditions SO2 concentrations remained above the LOD. As Fig. 12 demonstrates, the close correlation between SO2 and BCe suggests that long-term measurements of SO2 over tropical rainforest may be worthwhile as a further method to identify episodes of increased pollution or biomass burning. Long-term measurements would also show whether concentrations of SO2 remain above detection limits during the pristine conditions of the wet season and help determine potential sources during these periods. It is possible that a biogenic source may have contributed to SO2 measured during the relatively pristine conditions. For example, SO2 could derive from the oxidation by OH of dimethyl sulfide emitted from the rainforest (Jardine et al., 2015).

Figure 12Time series of hourly SO2 and BCe concentrations, highlighting the close correlation between SO2 and BCe measurements throughout the campaign.
4.3 Aerosol concentrations
4.3.1 Aerosol mass fraction – comparison with ACSM
The comparison between ACSM and GRAEGOR water-soluble aerosol concentrations in Sect. 3.2 indicates good agreement between them for and but significant divergence for and, in particular, Cl−.
Long-term measurements of aerosol chemical composition at the ATTO site using an ACSM have been conducted since 2014, and the first publication of data from 2015 suggested that aerosol chemical speciation varied surprisingly little across the wet and dry seasons (Andreae et al., 2015). As recorded by the ACSM during this campaign, organic aerosols are always the dominant mass fraction (compromising ∼ 70 % of aerosol), followed by (10 %–15 %), BCe (5 %–11 %), (∼ 5 %), (∼ 4 %) and finally Cl− as the smallest contributor. Focusing only on the aerosol species measured by both GRAEGOR and ACSM during this dry season campaign, the average ACSM mass fractions are 55 % , 22 % , 18 % and 5 % Cl−. As Fig. 13 demonstrates, the total mass fraction contribution to the inorganic particulate as measured by GRAEGOR suggests that the contribution of and Cl− is more significant than suggested by previous measurements. The relative contribution of each species to TSP as measured by GRAEGOR in this campaign (in descending order) is = 34.4 %, = 30.8 %, = 19.0 % and Cl− = 15.3 %. In comparison to ACSM measurements, the relative proportion of is reduced, becomes the second most abundant species with an almost equal contribution to , and Cl− – while remaining the smallest contributor to total mass – has a greater relative contribution to the mass of TSP. Talbot et al. (1990) measured a similar contribution order for the dry season using ion chromatography, with contributing the most to the total mass fraction and Cl− the least, but with a differing proportion ( = 51 %, = 26 %, = 19 %, and Cl− = 4 %). Variations in the ion proportions may be attributable to differences in the number and intensity of long-range transport episodes, which contribute Cl− and , during a given field campaign.
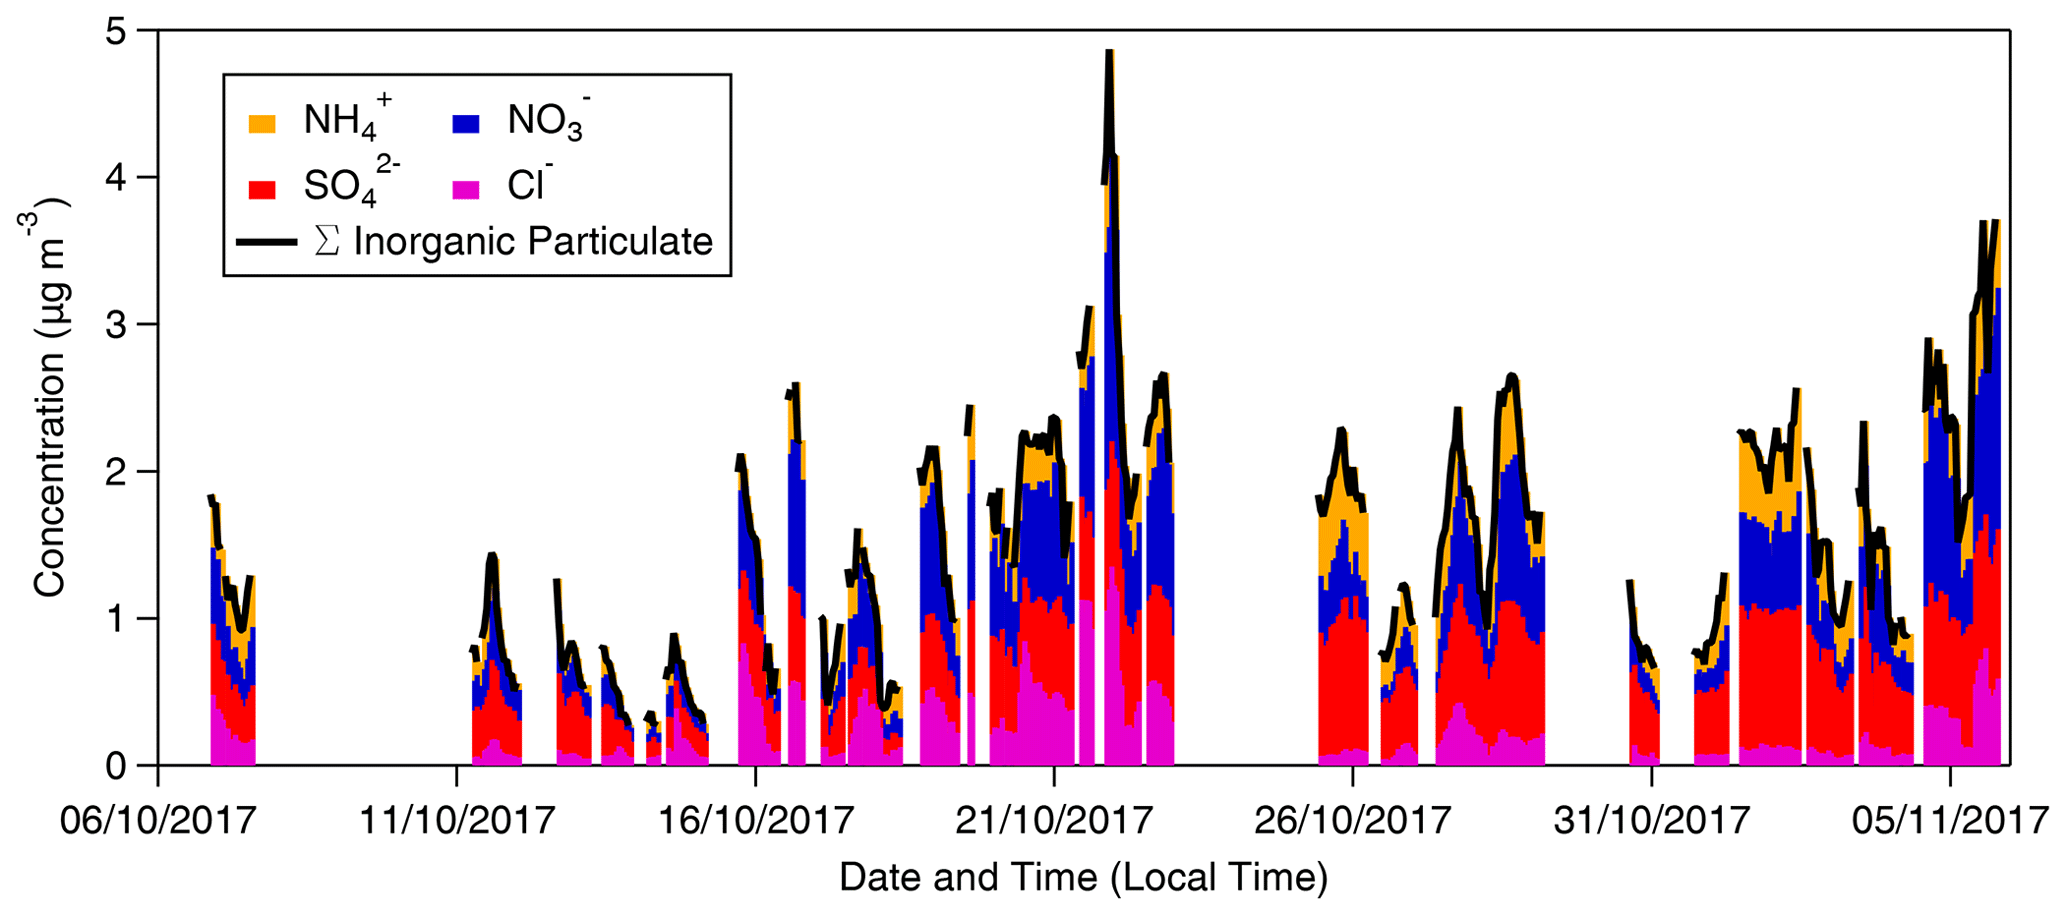
Figure 13Summed mass and speciation of inorganic particulate recorded by GRAEGOR at 80 m throughout period of campaign.
The ACSM samples only the submicron (PM1) aerosol size range, while GRAEGOR samples TSP (< 50–100 µm particle diameter). Furthermore, the ACSM only detects non-refractory aerosol compounds and is therefore insensitive to refractory sea salt and crustal material (Fröhlich et al., 2013). The close similarity in and measurements between the two instruments suggests that the majority of and particles during the campaign were contained within submicron aerosol and that the represented semivolatile ammonium compounds. Conversely, the difference between ACSM and GRAEGOR measurements suggests that most of the was contained within the coarse mode and/or represented non-volatile compounds such as NaNO3 and Ca(NO3)2, and almost all of the Cl− measured by GRAEGOR in this campaign was found in the coarse-mode and/or as NaCl. Previous work had found Cl− to be exclusively associated with the coarse fraction (Talbot et al., 1988, 1990). This is consistent with thermodynamic considerations which would suggest that volatile NH4NO3 aerosol, the compound typically measured by the ACSM, should not exist at the high temperature and relatively low gas-phase concentrations of NH3 and HNO3 at this site. This was confirmed using the ISORROPIA-2 (Fountoukis and Nenes, 2007) thermodynamic modelling framework.
4.3.2 Potential origins for coarse Cl− and
Consistent with the insensitivity of the ACSM to refractory particles, a possible source for coarse Cl− aerosols could be sea salt. Although a continental site, intrusions of sea salt through long-range transport have been noted previously at ATTO (Talbot et al., 1990; Moran-Zuloaga et al., 2018). The presence of sea salt could also account for a source of coarse , as the reaction between HNO3 and NaCl would result in the formation of the coarse aerosol NaNO3 (Dasgupta et al., 2007), a refractory aerosol component that would not be detected by the ACSM. The reaction of HNO3 with sea salt would also form HCl, the measured concentrations of which are closely linked to those of Cl− in this campaign. Alternatively, the strong link between HCl and Cl− concentrations could be accounted for by biomass burning emissions arriving at the ATTO site, whereby Cl− particulate from biomass burning is principally in the form of fine KCl (Pratt et al., 2011). Other crustal material, such as dust and soil particles which are recorded in elevated amounts at ATTO during the dry season (Moran-Zuloaga et al., 2018), could provide a source of coarse . These can include a variety of -containing mineral species, such as NaNO3, Ca(NO3)2 and Mg(NO3)2 (Karydis et al., 2016). The surface of dust and suspended soil particles could also act as a sink for HCl in the marine boundary layer (Sullivan et al., 2007), allowing the heterogeneous formation of coarse Cl− particulate.
It has been shown previously that primary biological aerosol particles (PBAPs) contribute the majority of the mass fraction of measured coarse aerosol in the Amazon (Pöschl et al., 2010). The PBAPs over the rainforest consist of a variety of different biological materials, such as plant and animal matter fragments, algae, pollen and fungal spores. The latter contributor is particularly important, as fungi which actively discharge their spores through liquid jets have been identified by Elbert et al. (2007) to be a source of inorganic ions in particulate matter. Fungi that actively discharge their spores do so via a liquid jet, whereby spores are forcibly discharged from a spore sac (ascus) along with a liquid mix of sugars and ions, of which Cl− forms a significant fraction (Trail et al., 2005). The spore itself can rupture under conditions of high relative humidity, resulting in the formation of fragments containing inorganic ions (China et al., 2016). In a chemical imaging analysis of such spore fragments above the Amazon rainforest, China et al. (2018) found that almost 40 %–60 % of these fragments contain Na+ and Cl− associated as a salt, which appeared “morphologically similar to dry sea salt” and which grew to supermicron sizes in conditions of high relative humidity. The contribution of fungal spores to total Na+ mass during the wet season over the rainforest was estimated as ∼ 69 % by the same study, with the conclusion that measured concentrations of coarse Na+ and Cl− could mistakenly be ascribed to marine sources rather than to locally originating fungal spore emissions. As discussed in Sect. 4.3.2, emission fluxes for Cl− are recorded throughout the campaign and occurred during cooler, wetter periods at night. As noted by Elbert et al. (2007), fungal spore emissions also predominantly occur under the same conditions. The possibility that Cl− concentrations measured during this campaign are biogenically driven through the active discharge or rupturing of localised fungal spore emissions should therefore not be discounted.
4.4 Surface–atmosphere exchange of inorganic trace gases and aerosols
4.4.1 Dry deposition of HCl, HNO3 and SO2
As detailed in Sect. 3.3.1, HCl, HNO3 and SO2 were always deposited with no instances of emissions. The surface canopy resistance (Rc) for these gases was calculated for the campaign using a rearranged form of Eq. (5). As expected on the basis of their high water solubility, HNO3 and HCl deposited with a very small average canopy resistance of 1.42 and 2.92 s m−1, respectively, which is not significantly different from zero given the typical uncertainty in the Rb parameterisation used to infer this value. By contrast, the average canopy resistance for SO2 in this campaign was considerable, with a mean value of 86 s m−1 throughout the entirety of the campaign, and a potentially more robust mean value of 28 s m−1 for measurements during daytime. Using his widely used dry deposition parameterisation, Wesely (1989) derives a typical Rc value of 120 s m−1 for SO2 for deciduous forests with “lush vegetation” during “midsummer”, evaluated at an incoming solar irradiance of 800 W m−2. In the absence of tropical flux measurements, the appropriateness of the value for tropical forest has never been tested. While the observed average in this work is 3 times less than Wesely’s parameterisation, the daytime average value from this campaign covers a wider set of meteorological conditions than used for the calculation of the modelled SO2 Rc.
Zhang et al. (2003) elaborated upon Wesely's dry deposition parameterisation through the development of a new formulation for the non-stomatal resistance component of the model. Modelled vd values for a variety of chemical species, including SO2, were developed for different land use classifications (LUCs), including broadleaf tropical forest. While Zhang et al. (2003) notes good agreement between modelled and observed vd values for LUCs such as short grasses and crops, the mean measured vd for SO2 during this campaign deviates significantly from its corresponding modelled value for a tropical broadleaf LUC. This study measured a mean vd of 10.4 mm s−1 for SO2, while Zhang et al. (2003) suggests values between 1.5 and 3.8 mm s−1, with the limits for dry and wet canopies, respectively. As with the comparison with Wesely (1989), the appropriateness of modelled values have not been tested due to the lack of corresponding measurements. Similarly, the values for this campaign cover a wide range of meteorological conditions.
4.4.2 Bidirectional exchange of HONO and NH3
Both HONO and NH3 fluxes revealed periods of emission from the rainforest, with 26 % of all HONO fluxes and 19% of NH3 fluxes recorded as emissions. Due to the complexities of the chemical and physiological parameters controlling NH3 emissions from the canopy surface to the atmosphere, discussion of the NH3 fluxes measured in this study are considered in a separate paper (Ramsay et al., 2020), which investigates inter alia the influence of leaf wetness and modelled canopy compensation points upon NH3 bidirectional exchange with reference to established models of NH3 surface–atmosphere exchange. It demonstrates that the observed NH3 emissions are consistent with stomatal emission during the warmest part of the day and shows that measured leaf wetness is a more successful parameter in describing the cuticular deposition process than relative humidity and vapour pressure deficit. The present paper therefore focuses on discussion of the observed emissions of HONO at this site.
The median diel fluxes of HONO in Fig. 7 show emission in the early morning after dawn (from 07:00 to 09:00), with deposition dominating throughout the rest of the day. Three possible explanations are considered here. The first considers the influence of soil emissions below the forest canopy. HONO emissions from soil have been observed in a number of studies (Sörgel et al., 2011, 2015; Twigg et al., 2011), with possible sources including the volatilisation of HONO from soil nitrite (Su et al., 2011), the temperature-dependent activity of ammonia-oxidising bacteria (Oswald et al., 2013; Scharko et al., 2015) or the oxidation of hydroxylamine released from soil microorganisms (Ermel et al., 2018; Wu et al., 2019). During night-time, radiative cooling above the forest causes stable stratification, generating a nocturnal boundary layer that prevents mixing between the air below and above the canopy (Foken, 2008; Tóta et al., 2008). Consequently, HONO emissions from the soil would accumulate below the canopy. At dawn, turbulent mixing starts to break up the nocturnal boundary layer, generating unstable conditions and a mixed layer. This creates a “venting” effect where the below-canopy accumulated HONO is transported upwards and appears as an early morning emission flux. Such venting episodes, representing negative storage fluxes, are commonly observed for CO2 over tall vegetation and have been noted previously also in tower measurements above rainforests for CO2 (Araújo et al., 2002), methane (Querino et al., 2011) and particles (Whitehead et al., 2010), with Querino et al. (2011) recording maximum median diel CO2 and CH4 fluxes between 06:00 and 10:00, similar to the period of maximum median diel HONO emissions here. CO2 flux measurements taken at the ATTO site concurrently with this study also showed a characteristic early morning flux, supporting the explanation of a venting effect for the HONO emissions.
However, morning HONO emissions have also been observed at short vegetation sites (Laufs et al., 2017; Di Marco et al., 2021; Ramsay et al., 2018), where storage effects are much smaller and which therefore must have resulted from a different mechanism. This is that early morning HONO emissions are a consequence of the photolysis of HNO3 (Zhou et al., 2011). Accumulation of HNO3 on leaf surfaces during night-time results in a reservoir of HNO3 within the canopy. At dawn, incoming solar radiation photolyses this reservoir, resulting in the formation of exited NO2 radicals that – in the presence of photosensitising organics such as humic acid (George et al., 2005; Stemmler et al., 2007) – are reduced to HONO. The concurrent breakdown of the nocturnal boundary layer again results in an upward emission flux of HONO. However, while Zhou et al. (2011) recorded emissions of HONO from forests between the hours just after dawn until late afternoon, with maximum fluxes recorded around solar noon, in this study emissions occurred predominately during the hours immediately after dawn. While emissions were recorded at noon and during the afternoon on certain days, medial diel emissions were confined to 07:00 to 09:00. Furthermore, Sörgel et al. (2015) has shown that this pathway would have a negligible effect on HONO formation based on the kinetic values for the pathway. Future work should measure the gradients of HONO above and below the canopy, preferably by taking a concentration gradient extending from below canopy to above canopy, to determine whether HONO accumulation below canopy during stable night-time conditions is occurring, followed by venting during morning hours due to turbulent mixing.
Finally, transient emission blips following sunrise have been observed for NH3 during several studies, where they were attributed to desorption of NH3 that had been dissolved in dew and microscopic water layers overnight. As these water layers evaporate in the morning, concentrations increase to a point where they get driven into the gas phase. Studies (Di Marco et al., 2021; Rubio et al., 2002, 2008; He et al., 2006) have postulated that the same process occurs for HONO and contributes to the bidirectional exchange seen during some of the aforementioned observations. They show that timing is indeed consistent with the temporal dynamics of the emission at a UK grassland site. At ATTO, the temporal dynamics of the NH3 flux were different, with emission peaks occurring later in the day than for HONO, and it was therefore concluded that desorption did not contribute to the NH3 emission fluxes (Ramsay et al., 2020). It therefore remains unclear why desorption would have been more important for HONO than for NH3.
It is important to note that measurements of HONO by the GRAEGOR system are not artefact free. As detailed by Spindler et al. (2003), the presence of SO2 and NO2 on wet denuder walls can introduce a positive artefact that results in an overestimate of HONO concentrations, which – if using a gradient system with two or more wet denuders set at different heights – can result in erroneous concentration gradient profiles. Correction algorithms exist for general application (Spindler et al., 2003) and specifically for GRAEGOR (Ramsay et al., 2018) that allow the influence of the artefact to be quantified using concentrations of SO2 and NO2. However, for this campaign, no correction was necessary as the SO2 concentration recorded during the campaign was 5 to 10 times lower than those relevant to artefact formation.
4.4.3 Deposition of water-soluble aerosols
The recorded deposition velocities of the aerosol species are consistent with the GRAEGOR/ACSM intercomparison: and Cl− aerosols were predominantly contained in the coarse fraction, while and were contained within the submicron aerosol. From a process-orientated approach (Davidson et al., 1982; Slinn, 1982; Slinn and Slinn, 1980), the deposition velocity of a particle is dependent upon its size. For particles > 0.1 µm, deposition velocity (normalised against u*) increases with increasing particle diameter. As outlined in Sect. 3.3.2, the close agreement between measured and deposition velocities (and parameterised values for 0.1–0.2 µm size range aerosols) above tropical rainforest suggest that these aerosols were contained in the fine mode. These observed deposition velocities also agree well with modelled deposition velocities for < 1 µm diameter particles above forest with similar mean roughness lengths and u* values as recorded at ATTO (Petroff et al., 2008a). Conversely, the larger observed deposition velocities for (5.8 mm s−1) and Cl− (7.3 mm s−1) exceed the parameterised values obtained using the formulation of Gallagher et al. (2002) and fit within the modelled values given by Petroff et al. (2008a) for particles in the 2–10 µm range above surfaces with a similar roughness length.
As detailed in Sect. 3.3.2., occasional periods of apparent particle emissions from the rainforest were recorded throughout the campaign for all aerosol species measured. Deviations from near-exclusive deposition were rare (between 1 %–3 % of all measured fluxes), confined to 1 h periods, and are unlikely to be due to measurement error. Similar to the emissions of HONO recorded during this campaign, upward particle fluxes may be caused by early morning turbulent mixing generating upward entrainment fluxes into the growing mixing layer. Whitehead et al. (2010) recorded a similar pattern of particle emissions at a tropical rainforest site in North Borneo, as did Ahlm et al. (2009) at a rainforest site in the Amazon Basin located 120 km south-west of the ATTO site. However, both studies recorded a more predominant pattern of early morning emissions than here. Whitehead et al. (2010) recorded particle emissions for almost all mornings, while Ahlm et al. (2009) reported 40 % of all particle fluxes as emissions. Both studies record later (08:00–09:00) emission periods. As both studies measured total particle number which was not chemically speciated, it is possible that the flux behaviour of the organic fraction of aerosol – which dominates the total aerosol mass fraction over tropical rainforest – is a more important driver for observed particle emissions than the aerosol species measured during this campaign.
4.5 Dry deposition budget of reactive nitrogen for the Amazon rainforest based on dry season observations
The dry deposition of total reactive nitrogen to the ATTO site as derived from the GRAEGOR measurements ( ) during this study relies on the assumption that values for in October are representative for the year overall. With this caveat, the annual dry deposition of for the ATTO site is estimated to be 1.7 kg N . The contribution of each reactive nitrogen species to this total is presented in Table 4.
Table 4Contribution of reactive nitrogen species to total (Σ ()) reactive nitrogen dry deposition budget for ATTO in kg N , inferred from fluxes measured during the campaign.
Although dry deposition totals based on direct observation are rare for this biome, this estimate for dry should be considered limited in scope due to the lack of a wet deposited value based on direct measurement. For example, Trebs et al. (2006) previously reported that wet is the predominant contributor to total over the Amazon rainforest. Furthermore, the present study’s value of does not include water-soluble organic nitrogen (WSON), which can constitute up to 43 % of total nitrogen in the aerosol phase during the dry season (Mace et al., 2003).
This study’s dry deposition value of −1.7 kg N based on dry season measurements is of the same order as the equivalent estimate of −3.7 kg N by Trebs et al. (2006) inferred from concentration measurements over a remote pasture site situated in the Amazon Basin. The measurement period for the study by Trebs et al. (2006) occurred from 12 September to 14 November 2002. As noted by Trebs et al. (2006), measurements included in September occur during the tail end of the peak agricultural season in the Amazon Basin. The stronger influence of agricultural activities and closer proximity of biomass burning at the pasture site in the study by Trebs et al. (2006) may explain the slightly higher total .
4.6 Comparisons of measured concentrations of trace gases and associated aerosols with previous studies
Whilst this was a 1-month study limited to the dry season, during which local, regional and global biomass burning contributed to observed concentrations, it provides some insight into the atmospheric composition of an ecosystem for which there are few measurements overall. Placing these measurements in context with similar regional and local studies above tropical rainforest sites provides an impression of the spatial and temporal representativeness of this study.
For aerosols, measurements of PM10 concentrations (both cations and anions) taken by high-volume air samplers between 2008 and 2016 over the Cuieiras ZF2 natural reserve approximately 130 km west of the ATTO site have recently become available (Custodio et al., 2019), allowing a local comparison for measured aerosol concentrations between GRAEGOR and filter sampling. For Cl− and , the average measurements taken by GRAEGOR are between 2.5 and 4 times greater than the average from 10 samples collected by the high-volume air samplers during the dry seasons in the period 2008 to 2016. Conversely, the average dry season concentrations recorded by the GRAEGOR is 0.3 times that recorded by the high-volume samplers. concentrations recorded by both measurement techniques are approximately equivalent.
Measurements of aerosol composition taken during the Amazon Boundary Layer Experiment (ABLE-2A) (Talbot et al., 1988) provide mean concentration values for the same species measured during this study. Talbot et al. (1988) measures a mean atmospheric concentration in the mixed layer for as 12 nmol−3 or 0.22 µg m−3 and for as 5.2 nmol−3 or 0.5 µg m−3. These values are higher than those measured in this study (mean concentration of = 0.16 µg m−3 and = 0.25 µg m−3). In comparison, the mean concentrations measured during ABLE-2A of (4.4 nmol−3 or 0.22 µg m−3) and Cl− (1.2 nmol−3 or 0.04 µg m−3) are lower than those measured during this study.
Discrepancies in the measurements of these aerosol species between wet-chemistry instruments and high-volume air sampler systems have previously been noted by Trebs et al. (2008), who found a similar order of magnitude difference in measurements between a WRD-SJAC system and a high-volume air sampler in tropical conditions. They also reported that high-volume air samplers measured lower concentrations of Cl− and compared to wet-chemistry instruments, although this pattern was only observed during periods of low concentrations of Cl− and . Loss of Cl− and from high-volume filters has been reported frequently, and this issue in fact led to the development of the SJAC sampling system, which does not suffer from this artefact (Slanina et al., 2001). Trebs et al. (2008) attributed higher high-volume air sampler concentrations to the decomposition of organosulfates on filters during storage, as well as to environmental conditions such as high relative humidity that may have introduced both positive and negative artefacts on the filter substrate.
The most comprehensive previous report of NH3, SO2 and HNO3 concentrations over remote tropical rainforests is by Adon et al. (2010), who presented long-term measurements over Cameroonian rainforest using passive denuder tubes. For the dry season, Adon et al. (2010) reported a similar concentration of SO2 and HNO3 but reported a significantly higher concentration of NH3 (a dry season average of 2.9 µg m−3 compared to 0.28 µg m−3 reported in this study). Adon et al. (2010) postulated that the NH3 concentrations recorded over their rainforest site were driven by biomass burning, similar to the conclusion drawn in this study. It is possible that the intensity, proliferation and proximity of biomass burning at the Cameroonian site may therefore be heightened in comparison to the ATTO site, resulting in greater measurements of NH3 concentrations.
Trebs et al. (2004), using a wet annular rotating denuder with steam jet aerosol collector system – effectively a single-height GRAEGOR instrument – measured the same suite of inorganic trace gases and associated aerosols as this study but at a pasture site located in the southern Amazon Basin. Measurements in the dry season had similar mean and median concentrations of HNO3 as this study, but higher concentrations of HCl, HONO and NH3 (a mean concentration of 2 ppb NH3 compared to 0.5 ppb NH3 as measured by this study) and with SO2 having the lowest concentration of the inorganic trace gases measured. As a fractional contribution to acid loading, this suggests that HCl is even more dominant than at the ATTO site, which is expected for an active pasture site with local biomass burning compared with the ATTO pristine rainforest site.
This study employed a two-point wet-chemistry instrument (GRAEGOR) to measure online hourly-resolved concentrations and fluxes of the inorganic trace gases NH3, HCl, HONO, HNO3 and SO2 as well as their associated water-soluble aerosol counterparts , Cl−, , and for a 1-month period over the Amazon rainforest. While measurements of aerosol concentrations were below the detection limit, this study presents for the first time the concentrations, fluxes and deposition velocities for several species during the Amazon dry season. This study has also confirmed the applicability of the Chor et al. (2017) flux enhancement factor (γF) for correcting fluxes measured using the aerodynamic gradient method within the roughness sub-layer above tropical rainforest. Some of the key findings are summarised below:
-
Influence of local, regional and potentially global transport of pollutants. Elevated concentrations of SO2 and NH3, together with BCe and cCO proxies for anthropogenic emissions, were noted at several points during the campaign. Back-trajectory analysis for particularly polluted conditions showed that air masses arriving at the ATTO site during this period travelled over large urban areas to the south and south-east of the site, as well as over areas with fires. For some air masses during the polluted periods of the campaign, air-mass trajectories were recorded which originated along the coast or interior of south-west Africa. This area is a location of biomass burning during the August–October period. Long-range transport episodes, driven by African biomass burning, could therefore contribute to an overall background of increased pollution during the Amazon dry season.
-
Bidirectional exchange of inorganic trace gases and aerosols. While the gases HCl, HNO3 and SO2 were uniformly deposited to the rainforest canopy, 26 % of all HONO fluxes and 19 % of NH3 fluxes were recorded as emissions. For HONO and the aerosol species, the occurrence of venting – whereby the accumulation of a gas or aerosol species below or on the canopy is swiftly entrained into the mixed layer through early morning turbulence – is suggested as an explanation for the instances of emission.
-
Influence of coarse aerosol on total aerosol fraction above Amazon rainforest. This study presents the first online measurements of chemically speciated aerosol concentration in inorganic suspended particulates and, by comparison with the ACSM, in the coarse fraction. The contribution of Cl− and to the total aerosol mass is substantially higher than in the submicron fraction and concentrations of both components are significantly larger than had previously been estimated on the basis of ACSM and AMS measurements. The deposition velocities of Cl− and aerosol were consistent with them being predominantly in the coarse size fraction. The presence of coarse aerosol at the ATTO site could be derived from a combination of sources, including biomass burning point sources within the region, from sea salt advected to the site by intrusions of marine air and from biogenic crustal material such as fungal spores.
An estimate of total reactive nitrogen dry deposition ( ) for the Amazon rainforest has also been presented on the basis that these dry season measurements are representative for the total year. The estimated annual value for based on measurements was −1.7 kg N , a net deposition of reactive nitrogen to the rainforest with the largest contributor being NH3, contributing 0.74 kg N to the overall total. This value presents the first estimate for reactive nitrogen dry deposition to rainforests based on in situ measurements of reactive nitrogen species. Our results show that dry deposition is of similar magnitude as earlier estimates of wet deposition. For example, Lesack and Melack (1996) estimated a wet deposition value of +2.4 kg N for total nitrogen, which includes particulate nitrogen and dissolved organic nitrogen, while Andreae et al. (1990b) estimated a wet deposition flux of 2.1 kg N in the form of ammonium and nitrate.
The measurements presented here confirm the importance of measuring chemically speciated inorganic trace gases and associated aerosols above rainforest as, by doing so, important atmosphere exchange processes (venting from the forest floor, increased deposition during pollution episodes) and knowledge of aerosol speciation (the importance of the coarse mode on total aerosol mass) become apparent. With the implementation of the ATTO 325 m tower, the potential now exists for further long-term measurements of inorganic trace gases and aerosols using GRAEGOR or commercial GRAEGOR derivatives (such as the Monitor for Aerosols and Gases in Ambient Air, MARGA, Metrohm Applikon). Replicating this study in the wet season and including measurements of the concentrations and fluxes of water-soluble organic nitrogen through modifications to GRAEGOR are potential avenues for future investigation.
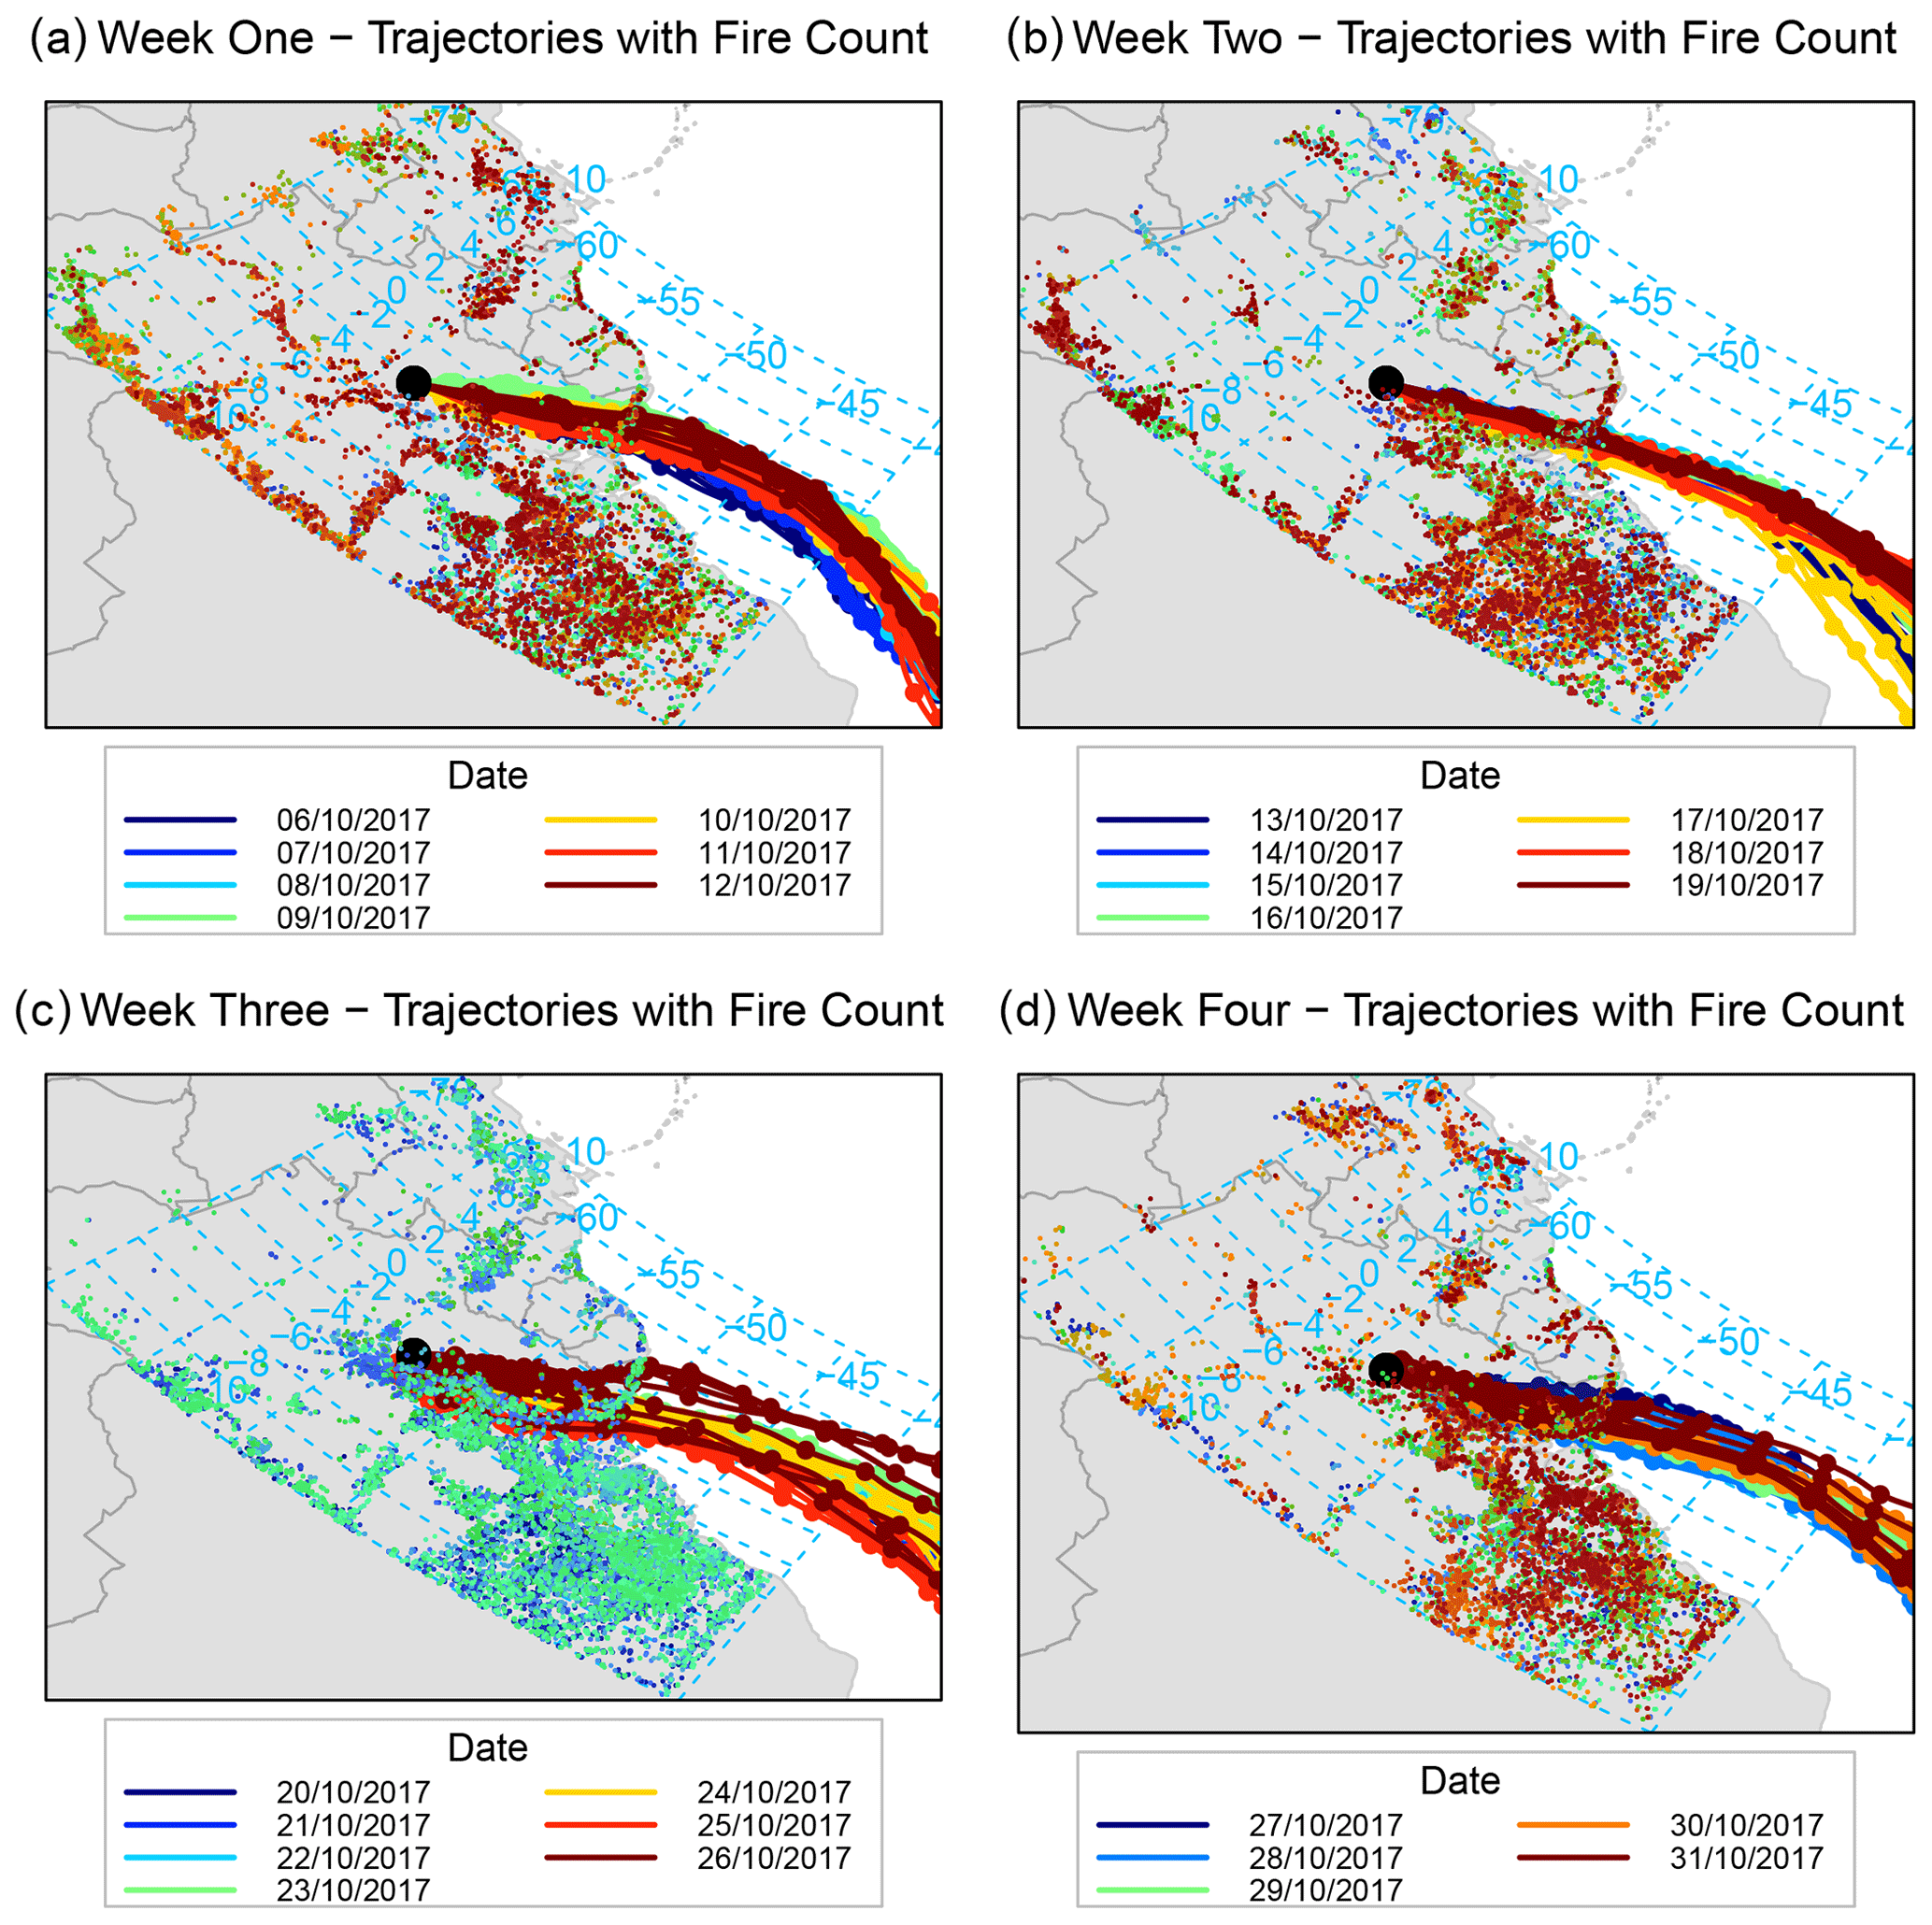
Figure A1Air-mass back-trajectories arriving at the 80 m walk-up tower on each day every 3 h from 00:00 local time over the period from 6 October 2017 to 31 October 2017, grouped by week, and further subdivided by day, for the regional area surrounding the ATTO site. Fire count data are included as an overlay to each weekly plot, with fire count coloured according to the date on which the fire was recorded by satellite imagery.
Figure A2Concentration-weighted trajectory analysis for (from left) BCe, and , with fire data overlaid. Fire data are coloured (scale, from light grey to black) by fire intensity, a measure of the fire radiative power of the individual fire.
Since the data are currently not in an online, accessible repository, data can be provided on request from the co-authors.
EN, CDFM, MRH, MS, PA and MA devised the study and secured the funding. GRAEGOR measurements were taken by RR and CDFM. GRAEGOR data were processed by RR with input from CDFM, EN, MRH, and MS. ToF-ACSM measurements were taken by SC. BCe and cCO measurements were taken by CP and JL. AA and MS provided ancillary measurement data, including micrometeorological data. RR interpreted the data with contributions from EN, CDFM, MRH, MS and MA. RR led the article writing with contributions from all the authors.
The authors declare that they have no conflict of interest.
This work was enabled through a studentship funded jointly by The University of Edinburgh School of Chemistry and the Max Planck Institute for Chemistry. Chiara Francesca Di Marco, Eiko Nemitz and the GRAEGOR instrument were supported by the UK Natural Environment Research Council award number NE/R016429/1 as part of UK-SCAPE, which is part of the National Capability programme. We thank the Instituto Nacional de Pesquisas da Amazonia (INPA) and the Max Planck Society for continuous support. We acknowledge the support by the German Federal Ministry of Education and Research (BMBF contract 01LB1001A and 01LK1602B) and the Brazilian Ministério da Ciência, Tecnologia e Inovação (MCTI/FINEP contract 01.11.01248.00) as well as the Amazon State University (UEA), FAPEAM, LBA/INPA and SDS/CEUC/RDS-Uatumã. We acknowledge funding from FAPESP (Fundação de Amparo à Pesquisa do Estado de São Paulo) trough grant 2017/17047-0. We acknowledge the use of data and imagery from Land, Atmosphere Near real-time Capability for EOS and Fire Information for Resource Management System (LANCE FIRMS) operated by NASA's Earth Science Data and Information System (ESDIS) with funding provided by NASA Headquarters. The authors are grateful for the support of the Amazon Tall Tower Observatory staff and visiting researchers. In particular, the authors would like to thank Reiner Ditz, Andrew Crozier, Stefan Wolff, Pedro Assis and Isabella Hrabe de Angelis for their support throughout the campaign. We thank the associate editor and reviewers for their comments and suggestions through the peer review process.
This research has been supported by the UK Natural Environment Research Council (grant no. NE/R016429/1), the German Federal Ministry of Education and Research (grant no. 01LB1001A), the German Federal Ministry of Education and Research (grant no. 01LK1602B), the Fundação de Amparo à Pesquisa do Estado de São Paulo (grant no. 2017/17047-0) and the Brazilian Ministério da Ciência, Tecnologia e Inovação (MCTI/FINEP contract 01.11.01248.00).
This paper was edited by Manish Shrivastava and reviewed by two anonymous referees.
Abou Rafee, S. A., Martins, L. D., Kawashima, A. B., Almeida, D. S., Morais, M. V. B., Souza, R. V. A., Oliveira, M. B. L., Souza, R. A. F., Medeiros, A. S. S., Urbina, V., Freitas, E. D., Martin, S. T., and Martins, J. A.: Contributions of mobile, stationary and biogenic sources to air pollution in the Amazon rainforest: a numerical study with the WRF-Chem model, Atmos. Chem. Phys., 17, 7977–7995, https://doi.org/10.5194/acp-17-7977-2017, 2017. a
Adachi, K., Oshima, N., Gong, Z., de Sá, S., Bateman, A. P., Martin, S. T., de Brito, J. F., Artaxo, P., Cirino, G. G., Sedlacek III, A. J., and Buseck, P. R.: Mixing states of Amazon basin aerosol particles transported over long distances using transmission electron microscopy, Atmos. Chem. Phys., 20, 11923–11939, https://doi.org/10.5194/acp-20-11923-2020, 2020. a
Adon, M., Galy-Lacaux, C., Yoboué, V., Delon, C., Lacaux, J. P., Castera, P., Gardrat, E., Pienaar, J., Al Ourabi, H., Laouali, D., Diop, B., Sigha-Nkamdjou, L., Akpo, A., Tathy, J. P., Lavenu, F., and Mougin, E.: Long term measurements of sulfur dioxide, nitrogen dioxide, ammonia, nitric acid and ozone in Africa using passive samplers, Atmos. Chem. Phys., 10, 7467–7487, https://doi.org/10.5194/acp-10-7467-2010, 2010. a, b, c, d
Adon, M., Galy-Lacaux, C., Delon, C., Yoboue, V., Solmon, F., and Kaptue Tchuente, A. T.: Dry deposition of nitrogen compounds (NO2, HNO3, NH3), sulfur dioxide and ozone in west and central African ecosystems using the inferential method, Atmos. Chem. Phys., 13, 11351–11374, https://doi.org/10.5194/acp-13-11351-2013, 2013. a
Ahlm, L., Nilsson, E. D., Krejci, R., Mårtensson, E. M., Vogt, M., and Artaxo, P.: Aerosol number fluxes over the Amazon rain forest during the wet season, Atmos. Chem. Phys., 9, 9381–9400, https://doi.org/10.5194/acp-9-9381-2009, 2009. a, b
Andreae, M. O.: The Biosphere: Pilot or Passenger on Spaceship Earth?, in: Contributions to Global Change Research, edited by: Heinen, D., Hoch, S., Krafft, T., Moss, C., Scheidt, P., and Welschhoff, A., National Committee on Global Change Research, Bonn, Germany, 59–66, https://doi.org/10.17617/3.36, 2001. a
Andreae, M. O.: Emission of trace gases and aerosols from biomass burning – an updated assessment, Atmos. Chem. Phys., 19, 8523–8546, https://doi.org/10.5194/acp-19-8523-2019, 2019. a
Andreae, M. O. and Andreae, T. W.: The cycle of biogenic sulfur compounds over the Amazon Basin: 1. Dry season, J. Geophys. Res.-Atmos., 93, 1487–1497, https://doi.org/10.1029/JD093iD02p01487, 1988. a, b, c
Andreae, M. O., Berresheim, H., Bingemer, H., Jacob, D. J., Lewis, B. L., Li, S.-M., and Talbot, R. W.: The atmospheric sulfur cycle over the Amazon Basin: 2. Wet season, J. Geophys. Res.-Atmos., 95, 16813–16824, https://doi.org/10.1029/JD095iD10p16813, 1990a. a
Andreae, M. O., Talbot, R. W., Berresheim, H., and Beecher, K. M.: Precipitation chemistry in central Amazonia, J. Geophys. Res.-Atmos., 95, 16987–16999, https://doi.org/10.1029/JD095iD10p16987, 1990b. a
Andreae, M. O., Andreae, T. W., Annegarn, H., Beer, J., Cachier, H., Le Canut, P., Elbert, W., Maenhaut, W., Salma, I., Wienhold, F. G., and Zenker, T.: Airborne studies of aerosol emissions from savanna fires in southern Africa: 2. Aerosol chemical composition, J. Geophys. Res.-Atmos., 103, 32119–32128, https://doi.org/10.1029/98JD02280, 1998. a
Andreae, M. O., Artaxo, P., Beck, V., Bela, M., Freitas, S., Gerbig, C., Longo, K., Munger, J. W., Wiedemann, K. T., and Wofsy, S. C.: Carbon monoxide and related trace gases and aerosols over the Amazon Basin during the wet and dry seasons, Atmos. Chem. Phys., 12, 6041–6065, https://doi.org/10.5194/acp-12-6041-2012, 2012. a
Andreae, M. O., Acevedo, O. C., Araùjo, A., Artaxo, P., Barbosa, C. G. G., Barbosa, H. M. J., Brito, J., Carbone, S., Chi, X., Cintra, B. B. L., da Silva, N. F., Dias, N. L., Dias-Júnior, C. Q., Ditas, F., Ditz, R., Godoi, A. F. L., Godoi, R. H. M., Heimann, M., Hoffmann, T., Kesselmeier, J., Könemann, T., Krüger, M. L., Lavric, J. V., Manzi, A. O., Lopes, A. P., Martins, D. L., Mikhailov, E. F., Moran-Zuloaga, D., Nelson, B. W., Nölscher, A. C., Santos Nogueira, D., Piedade, M. T. F., Pöhlker, C., Pöschl, U., Quesada, C. A., Rizzo, L. V., Ro, C.-U., Ruckteschler, N., Sá, L. D. A., de Oliveira Sá, M., Sales, C. B., dos Santos, R. M. N., Saturno, J., Schöngart, J., Sörgel, M., de Souza, C. M., de Souza, R. A. F., Su, H., Targhetta, N., Tóta, J., Trebs, I., Trumbore, S., van Eijck, A., Walter, D., Wang, Z., Weber, B., Williams, J., Winderlich, J., Wittmann, F., Wolff, S., and Yáñez-Serrano, A. M.: The Amazon Tall Tower Observatory (ATTO): overview of pilot measurements on ecosystem ecology, meteorology, trace gases, and aerosols, Atmos. Chem. Phys., 15, 10723–10776, https://doi.org/10.5194/acp-15-10723-2015, 2015. a, b, c
Andreae, M. O., Afchine, A., Albrecht, R., Holanda, B. A., Artaxo, P., Barbosa, H. M. J., Borrmann, S., Cecchini, M. A., Costa, A., Dollner, M., Fütterer, D., Järvinen, E., Jurkat, T., Klimach, T., Konemann, T., Knote, C., Krämer, M., Krisna, T., Machado, L. A. T., Mertes, S., Minikin, A., Pöhlker, C., Pöhlker, M. L., Pöschl, U., Rosenfeld, D., Sauer, D., Schlager, H., Schnaiter, M., Schneider, J., Schulz, C., Spanu, A., Sperling, V. B., Voigt, C., Walser, A., Wang, J., Weinzierl, B., Wendisch, M., and Ziereis, H.: Aerosol characteristics and particle production in the upper troposphere over the Amazon Basin, Atmos. Chem. Phys., 18, 921–961, https://doi.org/10.5194/acp-18-921-2018, 2018. a, b, c
Araújo, A. C., Nobre, A. D., Kruijt, B., Elbers, J. A., Dallarosa, R., Stefani, P., von Randow, C., Manzi, A. O., Culf, A. D., Gash, J. H. C., Valentini, R., and Kabat, P.: Comparative measurements of carbon dioxide fluxes from two nearby towers in a central Amazonian rainforest: The Manaus LBA site, J. Geophys. Res.-Atmos., 107, 8090, https://doi.org/10.1029/2001JD000676, 2002. a
Artaxo, P., Gerab, F., and Rabello, M. L. C.: Elemental composition of aerosol particles from two atmospheric monitoring stations in the Amazon Basin, Nuclear Instruments and Methods in Physics Research Section B, 75, 277–281, https://doi.org/10.1016/0168-583X(93)95658-R, 1993. a
Artaxo, P., Rizzo, L. V., Brito, J. F., Barbosa, H. M. J., Arana, A., Sena, E. T., Cirino, G. G., Bastos, W., Martin, S. T., and Andreae, M. O.: Atmospheric aerosols in Amazonia and land use change: from natural biogenic to biomass burning conditions, Faraday Discuss., 165, 203–235, https://doi.org/10.1039/C3FD00052D, 2013. a
Aruffo, E., Biancofiore, F., Di Carlo, P., Busilacchio, M., Verdecchia, M., Tomassetti, B., Dari-Salisburgo, C., Giammaria, F., Bauguitte, S., Lee, J., Moller, S., Hopkins, J., Punjabi, S., Andrews, S. J., Lewis, A. C., Palmer, P. I., Hyer, E., Le Breton, M., and Percival, C.: Impact of biomass burning emission on total peroxy nitrates: fire plume identification during the BORTAS campaign, Atmos. Meas. Tech., 9, 5591–5606, https://doi.org/10.5194/amt-9-5591-2016, 2016. a
Aurela, M., Beukes, J., van Zyl, P., Vakkari, V., Teinilä, K., Saarikoski, S., and Laakso, L.: The composition of ambient and fresh biomass burning aerosols at a savannah site, South Africa, S. Afr. J. Sci., 112, 1–8, https://doi.org/10.17159/sajs.2016/20150223, 2016. a
Baccini, A., Goetz, S. J., Walker, W. S., Laporte, N. T., Sun, M., Sulla-Menashe, D., Hackler, J., Beck, P. S. A., Dubayah, R., Friedl, M. A., Samanta, S., and Houghton, R. A.: Estimated carbon dioxide emissions from tropical deforestation improved by carbon-density maps, Nat. Clim. Change, 2, 182, https://doi.org/10.1038/nclimate1354, 2012. a
Blei, E., Hardacre, C. J., Mills, G. P., Heal, K. V., and Heal, M. R.: Identification and quantification of methyl halide sources in a lowland tropical rainforest, Atmos. Environ., 44, 1005–1010, https://doi.org/10.1016/j.atmosenv.2009.12.023, 2010. a
Burling, I. R., Yokelson, R. J., Griffith, D. W. T., Johnson, T. J., Veres, P., Roberts, J. M., Warneke, C., Urbanski, S. P., Reardon, J., Weise, D. R., Hao, W. M., and de Gouw, J.: Laboratory measurements of trace gas emissions from biomass burning of fuel types from the southeastern and southwestern United States, Atmos. Chem. Phys., 10, 11115–11130, https://doi.org/10.5194/acp-10-11115-2010, 2010. a
Carslaw, D. C. and Ropkins, K.: openair – An R package for air quality data analysis, Environ. Modell. Softw., 27/28, 52–61, https://doi.org/10.1016/j.envsoft.2011.09.008, 2012. a
China, S., Wang, B., Weis, J., Rizzo, L., Brito, J., Cirino, G. G., Kovarik, L., Artaxo, P., Gilles, M. K., and Laskin, A.: Rupturing of Biological Spores As a Source of Secondary Particles in Amazonia, Environ. Sci. Technol., 50, 12179–12186, https://doi.org/10.1021/acs.est.6b02896, 2016. a
China, S., Burrows, S. M., Wang, B., Harder, T. H., Weis, J., Tanarhte, M., Rizzo, L. V., Brito, J., Cirino, G. G., Ma, P.-L., Cliff, J., Artaxo, P., Gilles, M. K., and Laskin, A.: Fungal spores as a source of sodium salt particles in the Amazon basin, Nat. Commun., 9, 4793, https://doi.org/10.1038/s41467-018-07066-4, 2018. a
Chor, T. L., Dias, N. L., Araújo, A., Wolff, S., Zahn, E., Manzi, A., Trebs, I., Sá, M. O., Teixeira, P. R., and Sörgel, M.: Flux-variance and flux-gradient relationships in the roughness sublayer over the Amazon forest, Agr. Forest Meteorol., 239, 213–222, https://doi.org/10.1016/j.agrformet.2017.03.009, 2017. a, b, c, d, e, f, g, h, i
Custodio, D., Alves, C., Jomolca, Y., and de Castro Vasconcellos, P.: Carbonaceous components and major ions in PM10 from the Amazonian Basin, Atmos. Res., 215, 75–84, https://doi.org/10.1016/j.atmosres.2018.08.011, 2019. a
Dasgupta, P. K., Campbell, S. W., Al-Horr, R. S., Ullah, S. M. R., Li, J., Amalfitano, C., and Poor, N. D.: Conversion of sea salt aerosol to NaNO3 and the production of HCl: Analysis of temporal behavior of aerosol chloride/nitrate and gaseous HCl/HNO3 concentrations with AIM, Atmos. Environ., 41, 4242–4257, https://doi.org/10.1016/j.atmosenv.2006.09.054, 2007. a
Davidson, C. I., Miller, J. M., and Pleskow, M. A.: The influence of surface structure on predicted particle dry deposition to natural grass canopies, Water Air Soil Poll., 18, 25–43, https://doi.org/10.1007/BF02419401, 1982. a, b
Davidson, E. A., de Araújo, A. C., Artaxo, P., Balch, J. K., Brown, I. F., Bustamante, M. M. C., Coe, M. T., DeFries, R. S., Keller, M., Longo, M., Munger, J. W., Schroeder, W., Soares-Filho, B. S., Souza, C. M., and Wofsy, S. C.: The Amazon basin in transition, Nature, 481, 321, https://doi.org/10.1038/nature10717, 2012. a
De Ridder, K.: Bulk Transfer Relations for the Roughness Sublayer, Bound.-Lay. Meteorol., 134, 257–267, https://doi.org/10.1007/s10546-009-9450-y, 2010. a
Dias-Júnior, C. Q., Dias, N. L., dos Santos, R. M. N., Sörgel, M., Araújo, A., Tsokankunku, A., Ditas, F., de Santana, R. A., von Randow, C., Sá, M., Pöhlker, C., Toledo Machado, L. A., de Sá, L. D., Moran-Zuloaga, D., Janssen, R., Acevedo, O., Oliveira, P., Fisch, G., Chor, T., and Manzi, A.: Is There a Classical Inertial Sublayer Over the Amazon Forest?, Geophys. Res. Lett., 46, 5614–5622, https://doi.org/10.1029/2019GL083237, 2019. a
Di Marco, C. F., Kramer, L. J., Twigg, M. M., Crilley, L., Ramsay, R., Cowan, N. J., Coyle, M., Jones, M. R., Leeson, S. R., Bloss, W. J., and Nemitz, E.: Measurement and modeling of HONO exchange at a grassland site, in preparation, 2021. a, b
Elbert, W., Taylor, P. E., Andreae, M. O., and Pöschl, U.: Contribution of fungi to primary biogenic aerosols in the atmosphere: wet and dry discharged spores, carbohydrates, and inorganic ions, Atmos. Chem. Phys., 7, 4569–4588, https://doi.org/10.5194/acp-7-4569-2007, 2007. a, b
Ermel, M., Behrendt, T., Oswald, R., Derstroff, B., Wu, D., Hohlmann, S., Stönner, C., Pommerening-Röser, A., Könneke, M., Williams, J., Meixner, F. X., Andreae, M. O., Trebs, I., and Sörgel, M.: Hydroxylamine released by nitrifying microorganisms is a precursor for HONO emission from drying soils, Sci. Rep.-UK, 8, 1877, https://doi.org/10.1038/s41598-018-20170-1, 2018. a
Fan, J., Rosenfeld, D., Zhang, Y., Giangrande, S. E., Li, Z., Machado, L. A. T., Martin, S. T., Yang, Y., Wang, J., Artaxo, P., Barbosa, H. M. J., Braga, R. C., Comstock, J. M., Feng, Z., Gao, W., Gomes, H. B., Mei, F., Pöhlker, C., Pöhlker, M. L., Pöschl, U., and de Souza, R. A. F.: Substantial convection and precipitation enhancements by ultrafine aerosol particles, Science, 359, 411–418, https://doi.org/10.1126/science.aan8461, 2018. a
Fiedler, V., Arnold, F., Ludmann, S., Minikin, A., Hamburger, T., Pirjola, L., Dörnbrack, A., and Schlager, H.: African biomass burning plumes over the Atlantic: aircraft based measurements and implications for H2SO4 and HNO3 mediated smoke particle activation, Atmos. Chem. Phys., 11, 3211–3225, https://doi.org/10.5194/acp-11-3211-2011, 2011. a
Fiore, A. M., Naik, V., and Leibensperger, E. M.: Air Quality and Climate Connections, JAPCA J. Air Waste Ma., 65, 645–685, https://doi.org/10.1080/10962247.2015.1040526, 2015. a
Flechard, C. R.: Turbulent Exchange of Ammonia Above Vegetation, PhD thesis, University of Nottingham, UK, 231 pp., 1998. a
Foken, T.: Micrometeorology, Springer Berlin and Heidelberg, Germany, https://doi.org/10.1007/978-3-540-74666-9, 2008. a, b, c, d
Fowler, D. and Unsworth, M. H.: Turbulent transfer of sulphur dioxide to a wheat crop, Q. J. Roy. Meteor. Soc., 105, 767–783, https://doi.org/10.1002/qj.49710544603, 1979. a
Fountoukis, C. and Nenes, A.: ISORROPIA II: a computationally efficient thermodynamic equilibrium model for K+–Ca2+–Mg2+–NH–Na+–SO–NO–Cl−–H2O aerosols, Atmos. Chem. Phys., 7, 4639–4659, https://doi.org/10.5194/acp-7-4639-2007, 2007. a
Fowler, D., Coyle, M., Skiba, U., Sutton, M. A., Cape, J. N., Reis, S., Sheppard, L. J., Jenkins, A., Grizzetti, B., Galloway, J. N., Vitousek, P., Leach, A., Bouwman, A. F., Butterbach-Bahl, K., Dentener, F., Stevenson, D., Amann, M., and Voss, M.: The global nitrogen cycle in the Twenty-first century, Philos. T. Roy. Soc. B, 368, 20130164, https://doi.org/10.1098/rstb.2013.0164, 2013. a
Fröhlich, R., Cubison, M. J., Slowik, J. G., Bukowiecki, N., Prévôt, A. S. H., Baltensperger, U., Schneider, J., Kimmel, J. R., Gonin, M., Rohner, U., Worsnop, D. R., and Jayne, J. T.: The ToF-ACSM: a portable aerosol chemical speciation monitor with TOFMS detection, Atmos. Meas. Tech., 6, 3225–3241, https://doi.org/10.5194/amt-6-3225-2013, 2013. a
Galanter, M., Levy II, H., and Carmichael, G. R.: Impacts of biomass burning on tropospheric CO, NOx, and O3, J. Geophys. Res.-Atmos., 105, 6633–6653, https://doi.org/10.1029/1999JD901113, 2000. a
Gallagher, M. W., Nemitz, E., Dorsey, J. R., Fowler, D., Sutton, M. A., Flynn, M., and Duyzer, J.: Measurements and parameterizations of small aerosol deposition velocities to grassland, arable crops, and forest: Influence of surface roughness length on deposition, J. Geophys. Res.-Atmos., 107, 4154, https://doi.org/10.1029/2001JD000817, 2002. a, b
Ganzeveld, L. and Lelieveld, J.: Impact of Amazonian deforestation on atmospheric chemistry, Geophys. Res. Lett., 31, L06105, https://doi.org/10.1029/2003GL019205, 2004. a
Garland, J. A.: The Dry Deposition of Sulphur Dioxide to Land and Water Surfaces, P. Roy. Soc. A-Math. Phy., 354, 245–268, https://doi.org/10.1098/rspa.1977.0066, 1977. a
Garratt, J. R.: Surface influence upon vertical profiles in the atmospheric near-surface layer, Q. J. Roy. Meteor. Soc., 106, 803–819, https://doi.org/10.1002/qj.49710645011, 1980. a
Gebhardt, S., Colomb, A., Hofmann, R., Williams, J., and Lelieveld, J.: Halogenated organic species over the tropical South American rainforest, Atmos. Chem. Phys., 8, 3185–3197, https://doi.org/10.5194/acp-8-3185-2008, 2008. a
George, C., Strekowski, R. S., Kleffmann, J., Stemmler, K., and Ammann, M.: Photoenhanced uptake of gaseous NO2 on solid organic compounds: a photochemical source of HONO?, Faraday Discuss., 130, 195–210, https://doi.org/10.1039/B417888M, 2005. a
Gloor, M., Gatti, L., Brienen, R., Feldpausch, T. R., Phillips, O. L., Miller, J., Ometto, J. P., Rocha, H., Baker, T., de Jong, B., Houghton, R. A., Malhi, Y., Aragão, L. E. O. C., Guyot, J.-L., Zhao, K., Jackson, R., Peylin, P., Sitch, S., Poulter, B., Lomas, M., Zaehle, S., Huntingford, C., Levy, P., and Lloyd, J.: The carbon balance of South America: a review of the status, decadal trends and main determinants, Biogeosciences, 9, 5407–5430, https://doi.org/10.5194/bg-9-5407-2012, 2012. a
Graedel, T. E. and Keene, W. C.: Tropospheric budget of reactive chlorine, Global Biogeochem. Cy., 9, 47–77, https://doi.org/10.1029/94GB03103, 1995. a
He, Y., Zhou, X., Hou, J., Gao, H., and Bertman, S. B.: Importance of dew in controlling the air-surface exchange of HONO in rural forested environments, Geophys. Res. Lett., 33, L02813, https://doi.org/10.1029/2005GL024348, 2006. a
Hendrick, F., Müller, J.-F., Clémer, K., Wang, P., De Mazière, M., Fayt, C., Gielen, C., Hermans, C., Ma, J. Z., Pinardi, G., Stavrakou, T., Vlemmix, T., and Van Roozendael, M.: Four years of ground-based MAX-DOAS observations of HONO and NO2 in the Beijing area, Atmos. Chem. Phys., 14, 765–781, https://doi.org/10.5194/acp-14-765-2014, 2014. a
Holanda, B. A., Pöhlker, M. L., Walter, D., Saturno, J., Sörgel, M., Ditas, J., Ditas, F., Schulz, C., Franco, M. A., Wang, Q., Donth, T., Artaxo, P., Barbosa, H. M. J., Borrmann, S., Braga, R., Brito, J., Cheng, Y., Dollner, M., Kaiser, J. W., Klimach, T., Knote, C., Krüger, O. O., Fütterer, D., Lavrič, J. V., Ma, N., Machado, L. A. T., Ming, J., Morais, F. G., Paulsen, H., Sauer, D., Schlager, H., Schneider, J., Su, H., Weinzierl, B., Walser, A., Wendisch, M., Ziereis, H., Zöger, M., Pöschl, U., Andreae, M. O., and Pöhlker, C.: Influx of African biomass burning aerosol during the Amazonian dry season through layered transatlantic transport of black carbon-rich smoke, Atmos. Chem. Phys., 20, 4757–4785, https://doi.org/10.5194/acp-20-4757-2020, 2020. a, b, c
Jardine, K., Yañez-Serrano, A. M., Williams, J., Kunert, N., Jardine, A., Taylor, T., Abrell, L., Artaxo, P., Guenther, A., Hewitt, C. N., House, E., Florentino, A. P., Manzi, A., Higuchi, N., Kesselmeier, J., Behrendt, T., Veres, P. R., Derstroff, B., Fuentes, J. D., Martin, S. T., and Andreae, M. O.: Dimethyl sulfide in the Amazon rain forest, Global Biogeochem. Cy., 29, 19–32, https://doi.org/10.1002/2014GB004969, 2015. a
Jensen, N. and Hummelshøj, P.: Derivation of canopy resistance for water vapour fluxes over a spruce forest, using a new technique for the viscous sublayer resistance, Agr. Forest Meteorol., 73, 339–352, https://doi.org/10.1016/0168-1923(94)05083-I, 1995. a
Karydis, V. A., Tsimpidi, A. P., Pozzer, A., Astitha, M., and Lelieveld, J.: Effects of mineral dust on global atmospheric nitrate concentrations, Atmos. Chem. Phys., 16, 1491–1509, https://doi.org/10.5194/acp-16-1491-2016, 2016. a
Keuken, M. P., Schoonebeek, C. A. M., van Wensveen-Louter, A., and Slanina, J.: Simultaneous sampling of NH3, HNO3, HCl, SO2 and H2O2 in ambient air by a wet annular denuder system, Atmos. Environ., 22, 2541–2548, https://doi.org/10.1016/0004-6981(88)90486-6, 1988. a
Kritz, M. A. and Rancher, J.: Circulation of Na, Cl, and Br in the tropical marine atmosphere, J. Geophys. Res.-Oceans, 85, 1633–1639, https://doi.org/10.1029/JC085iC03p01633, 1980. a
Kuhn, U., Andreae, M. O., Ammann, C., Araújo, A. C., Brancaleoni, E., Ciccioli, P., Dindorf, T., Frattoni, M., Gatti, L. V., Ganzeveld, L., Kruijt, B., Lelieveld, J., Lloyd, J., Meixner, F. X., Nobre, A. D., Pöschl, U., Spirig, C., Stefani, P., Thielmann, A., Valentini, R., and Kesselmeier, J.: Isoprene and monoterpene fluxes from Central Amazonian rainforest inferred from tower-based and airborne measurements, and implications on the atmospheric chemistry and the local carbon budget, Atmos. Chem. Phys., 7, 2855–2879, https://doi.org/10.5194/acp-7-2855-2007, 2007. a
Kuhn, U., Ganzeveld, L., Thielmann, A., Dindorf, T., Schebeske, G., Welling, M., Sciare, J., Roberts, G., Meixner, F. X., Kesselmeier, J., Lelieveld, J., Kolle, O., Ciccioli, P., Lloyd, J., Trentmann, J., Artaxo, P., and Andreae, M. O.: Impact of Manaus City on the Amazon Green Ocean atmosphere: ozone production, precursor sensitivity and aerosol load, Atmos. Chem. Phys., 10, 9251–9282, https://doi.org/10.5194/acp-10-9251-2010, 2010. a
Laufs, S., Cazaunau, M., Stella, P., Kurtenbach, R., Cellier, P., Mellouki, A., Loubet, B., and Kleffmann, J.: Diurnal fluxes of HONO above a crop rotation, Atmos. Chem. Phys., 17, 6907–6923, https://doi.org/10.5194/acp-17-6907-2017, 2017. a, b
Lee, J. D., Whalley, L. K., Heard, D. E., Stone, D., Dunmore, R. E., Hamilton, J. F., Young, D. E., Allan, J. D., Laufs, S., and Kleffmann, J.: Detailed budget analysis of HONO in central London reveals a missing daytime source, Atmos. Chem. Phys., 16, 2747–2764, https://doi.org/10.5194/acp-16-2747-2016, 2016. a
Lelieveld, J. and Crutzen, P. J.: The role of clouds in tropospheric photochemistry, J. Atmos. Chem., 12, 229–267, https://doi.org/10.1007/BF00048075, 1991. a
Lelieveld, J., Peters, W., Dentener, F. J., and Krol, M. C.: Stability of tropospheric hydroxyl chemistry, J. Geophys. Res.-Atmos., 107, 4715, https://doi.org/10.1029/2002JD002272, 2002. a
Lelieveld, J., Butler, T. M., Crowley, J. N., Dillon, T. J., Fischer, H., Ganzeveld, L., Harder, H., Lawrence, M. G., Martinez, M., Taraborrelli, D., and Williams, J.: Atmospheric oxidation capacity sustained by a tropical forest, Nature, 452, 737, https://doi.org/10.1038/nature06870, 2008. a
Lenton, T. M., Held, H., Kriegler, E., Hall, J. W., Lucht, W., Rahmstorf, S., and Schellnhuber, H. J.: Tipping elements in the Earth's climate system, P. Natl. Acad. Sci. USA, 105, 1786–1793, https://doi.org/10.1073/pnas.0705414105, 2008. a
Lesack, L. F. W. and Melack, J. M.: Mass balance of major solutes in a rainforest catchment in the Central Amazon: Implications for nutrient budgets in tropical rainforests, Biogeochemistry, 32, 115–142, https://doi.org/10.1007/BF00000355, 1996. a
Mace, K. A., Artaxo, P., and Duce, R. A.: Water-soluble organic nitrogen in Amazon Basin aerosols during the dry (biomass burning) and wet seasons, J. Geophys. Res.-Atmos., 108, 4512, https://doi.org/10.1029/2003JD003557, 2003. a
Malhi, Y., Roberts, J. T., Betts, R. A., Killeen, T. J., Li, W., and Nobre, C. A.: Climate Change, Deforestation, and the Fate of the Amazon, Science, 319, 169–172, https://doi.org/10.1126/science.1146961, 2008. a
Mannschreck, K., Gilge, S., Plass-Duelmer, C., Fricke, W., and Berresheim, H.: Assessment of the applicability of NO-NO2-O3 photostationary state to long-term measurements at the Hohenpeissenberg GAW Station, Germany, Atmos. Chem. Phys., 4, 1265–1277, https://doi.org/10.5194/acp-4-1265-2004, 2004. a
Martin, S. T., Andreae, M. O., Althausen, D., Artaxo, P., Baars, H., Borrmann, S., Chen, Q., Farmer, D. K., Guenther, A., Gunthe, S. S., Jimenez, J. L., Karl, T., Longo, K., Manzi, A., Müller, T., Pauliquevis, T., Petters, M. D., Prenni, A. J., Pöschl, U., Rizzo, L. V., Schneider, J., Smith, J. N., Swietlicki, E., Tota, J., Wang, J., Wiedensohler, A., and Zorn, S. R.: An overview of the Amazonian Aerosol Characterization Experiment 2008 (AMAZE-08), Atmos. Chem. Phys., 10, 11415–11438, https://doi.org/10.5194/acp-10-11415-2010, 2010. a
Martin, S. T., Andreae, M. O., Artaxo, P., Baumgardner, D., Chen, Q., Goldstein, A. H., Guenther, A., Heald, C. L., Mayol-Bracero, O. L., McMurry, P. H., Pauliquevis, T., Pöschl, U., Prather, K. A., Roberts, G. C., Saleska, S. R., Silva Dias, M. A., Spracklen, D. V., Swietlicki, E., and Trebs, I.: Sources and properties of Amazonian aerosol particles, Rev. Geophys., 48, RG2002, https://doi.org/10.1029/2008RG000280, 2010b. a
Martin, S. T., Artaxo, P., Machado, L. A. T., Manzi, A. O., Souza, R. A. F., Schumacher, C., Wang, J., Andreae, M. O., Barbosa, H. M. J., Fan, J., Fisch, G., Goldstein, A. H., Guenther, A., Jimenez, J. L., Pöschl, U., Silva Dias, M. A., Smith, J. N., and Wendisch, M.: Introduction: Observations and Modeling of the Green Ocean Amazon (GoAmazon2014/5), Atmos. Chem. Phys., 16, 4785–4797, https://doi.org/10.5194/acp-16-4785-2016, 2016. a
Martin, S. T., Artaxo, P., Machado, L., Manzi, A. O., Souza, R. A. F., Schumacher, C., Wang, J., Biscaro, T., Brito, J., Calheiros, A., Jardine, K., Medeiros, A., Portela, B., de Sá, S. S., Adachi, K., Aiken, A. C., Albrecht, R., Alexander, L., Andreae, M. O., Barbosa, H. M. J., Buseck, P., Chand, D., Comstock, J. M., Day, D. A., Dubey, M., Fan, J., Fast, J., Fisch, G., Fortner, E., Giangrande, S., Gilles, M., Goldstein, A. H., Guenther, A., Hubbe, J., Jensen, M., Jimenez, J. L., Keutsch, F. N., Kim, S., Kuang, C., Laskin, A., McKinney, K., Mei, F., Miller, M., Nascimento, R., Pauliquevis, T., Pekour, M., Peres, J., Petäjä, T., Pöhlker, C., Pöschl, U., Rizzo, L., Schmid, B., Shilling, J. E., Dias, M. A. S., Smith, J. N., Tomlinson, J. M., Tóta, J., and Wendisch, M.: The Green Ocean Amazon Experiment (GoAmazon2014/5) Observes Pollution Affecting Gases, Aerosols, Clouds, and Rainfall over the Rain Forest, B. Am. Meteorol. Soc., 98, 981–997, https://doi.org/10.1175/BAMS-D-15-00221.1, 2017. a
McMeeking, G. R., Kreidenweis, S. M., Baker, S., Carrico, C. M., Chow, J. C., Collett Jr., J. L., Hao, W. M., Holden, A. S., Kirchstetter, T. W., Malm, W. C., Moosmüller, H., Sullivan, A. P., and Wold, C. E.: Emissions of trace gases and aerosols during the open combustion of biomass in the laboratory, J. Geophys. Res.-Atmos., 114, D19210, https://doi.org/10.1029/2009JD011836, 2009. a
Monteith, J. and Unsworth, M.: Principles of Environmental Physics: Plants, Animals, and the Atmosphere: Fourth Edition, Elsevier, Oxford, https://doi.org/10.1016/C2010-0-66393-0, 2013. a
Moore, R. M., Gut, A., and Andreae, M. O.: A pilot study of methyl chloride emissions from tropical woodrot fungi, Chemosphere, 58, 221–225, https://doi.org/10.1016/j.chemosphere.2004.03.011, 2005. a
Moran-Zuloaga, D., Ditas, F., Walter, D., Saturno, J., Brito, J., Carbone, S., Chi, X., Hrabě de Angelis, I., Baars, H., Godoi, R. H. M., Heese, B., Holanda, B. A., Lavrič, J. V., Martin, S. T., Ming, J., Pöhlker, M. L., Ruckteschler, N., Su, H., Wang, Y., Wang, Q., Wang, Z., Weber, B., Wolff, S., Artaxo, P., Pöschl, U., Andreae, M. O., and Pöhlker, C.: Long-term study on coarse mode aerosols in the Amazon rain forest with the frequent intrusion of Saharan dust plumes, Atmos. Chem. Phys., 18, 10055–10088, https://doi.org/10.5194/acp-18-10055-2018, 2018. a, b, c
Nemitz, E., Sutton, M. A., Wyers, G., Otjes, R. P., Schjoerring, J. K., Gallagher, M. W., Parrington, J., Fowler, D., and Choularton, T. W.: Surface/atmosphere exchange and chemical interaction of gases and aerosols over oilseed rape, Agr. Forest Meteorol., 105, 427–445, https://doi.org/10.1016/S0168-1923(00)00207-0, 2000. a
Nemitz, E., Sutton, M. A., Wyers, G. P., Otjes, R. P., Mennen, M. G., van Putten, E. M., and Gallagher, M. W.: Gas-particle interactions above a Dutch heathland: II. Concentrations and surface exchange fluxes of atmospheric particles, Atmos. Chem. Phys., 4, 1007–1024, https://doi.org/10.5194/acp-4-1007-2004, 2004. a
Nemitz, E., Hargreaves, K. J., Neftel, A., Loubet, B., Cellier, P., Dorsey, J. R., Flynn, M., Hensen, A., Weidinger, T., Meszaros, R., Horvath, L., Dämmgen, U., Frühauf, C., Löpmeier, F. J., Gallagher, M. W., and Sutton, M. A.: Intercomparison and assessment of turbulent and physiological exchange parameters of grassland, Biogeosciences, 6, 1445–1466, https://doi.org/10.5194/bg-6-1445-2009, 2009. a
Norman, M., Spirig, C., Wolff, V., Trebs, I., Flechard, C., Wisthaler, A., Schnitzhofer, R., Hansel, A., and Neftel, A.: Intercomparison of ammonia measurement techniques at an intensively managed grassland site (Oensingen, Switzerland), Atmos. Chem. Phys., 9, 2635–2645, https://doi.org/10.5194/acp-9-2635-2009, 2009. a
Oswald, R., Behrendt, T., Ermel, M., Wu, D., Su, H., Cheng, Y., Breuninger, C., Moravek, A., Mougin, E., Delon, C., Loubet, B., Pommerening-Röser, A., Sörgel, M., Pöschl, U., Hoffmann, T., Andreae, M. O., Meixner, F. X., and Trebs, I.: HONO Emissions from Soil Bacteria as a Major Source of Atmospheric Reactive Nitrogen, Science, 341, 1233–1235, https://doi.org/10.1126/science.1242266, 2013. a
Paralovo, S. L., Barbosa, C. G. G., Carneiro, I. P. S., Kurzlop, P., Borillo, G. C., Schiochet, M. F. C., Godoi, A. F. L., Yamamoto, C. I., de Souza, R. A. F., Andreoli, R. V., Ribeiro, I. O., Manzi, A. O., Kourtchev, I., Bustillos, J. O. V., Martin, S. T., and Godoi, R. H. M.: Observations of particulate matter, NO2, SO2, O3, H2S and selected VOCs at a semi-urban environment in the Amazon region, Sci. Total Environ., 650, 996–1006, https://doi.org/10.1016/j.scitotenv.2018.09.073, 2019. a
Petroff, A., Mailliat, A., Amielh, M., and Anselmet, F.: Aerosol dry deposition on vegetative canopies. Part I: Review of present knowledge, Atmos. Environ., 42, 3625–3653, https://doi.org/10.1016/j.atmosenv.2007.09.043, 2008a. a, b
Petroff, A., Mailliat, A., Amielh, M., and Anselmet, F.: Aerosol dry deposition on vegetative canopies. Part II: A new modelling approach and applications, Atmos. Environ., 42, 3654–3683, https://doi.org/10.1016/j.atmosenv.2007.12.060, 2008b. a
Pöhlker, C., Wiedemann, K. T., Sinha, B., Shiraiwa, M., Gunthe, S. S., Smith, M., Su, H., Artaxo, P., Chen, Q., Cheng, Y., Elbert, W., Gilles, M. K., Kilcoyne, A. L. D., Moffet, R. C., Weigand, M., Martin, S. T., Pöschl, U., and Andreae, M. O.: Biogenic Potassium Salt Particles as Seeds for Secondary Organic Aerosol in the Amazon, Science, 337, 1075–1078, https://doi.org/10.1126/science.1223264, 2012. a
Pöhlker, M. L., Pöhlker, C., Ditas, F., Klimach, T., Hrabe de Angelis, I., Araújo, A., Brito, J., Carbone, S., Cheng, Y., Chi, X., Ditz, R., Gunthe, S. S., Kesselmeier, J., Könemann, T., Lavrič, J. V., Martin, S. T., Mikhailov, E., Moran-Zuloaga, D., Rose, D., Saturno, J., Su, H., Thalman, R., Walter, D., Wang, J., Wolff, S., Barbosa, H. M. J., Artaxo, P., Andreae, M. O., and Pöschl, U.: Long-term observations of cloud condensation nuclei in the Amazon rain forest – Part 1: Aerosol size distribution, hygroscopicity, and new model parametrizations for CCN prediction, Atmos. Chem. Phys., 16, 15709–15740, https://doi.org/10.5194/acp-16-15709-2016, 2016. a, b, c
Pöhlker, M. L., Ditas, F., Saturno, J., Klimach, T., Hrabě de Angelis, I., Araùjo, A. C., Brito, J., Carbone, S., Cheng, Y., Chi, X., Ditz, R., Gunthe, S. S., Holanda, B. A., Kandler, K., Kesselmeier, J., Könemann, T., Krüger, O. O., Lavrič, J. V., Martin, S. T., Mikhailov, E., Moran-Zuloaga, D., Rizzo, L. V., Rose, D., Su, H., Thalman, R., Walter, D., Wang, J., Wolff, S., Barbosa, H. M. J., Artaxo, P., Andreae, M. O., Pöschl, U., and Pöhlker, C.: Long-term observations of cloud condensation nuclei over the Amazon rain forest – Part 2: Variability and characteristics of biomass burning, long-range transport, and pristine rain forest aerosols, Atmos. Chem. Phys., 18, 10289–10331, https://doi.org/10.5194/acp-18-10289-2018, 2018. a, b, c, d
Pöhlker, C., Walter, D., Paulsen, H., Könemann, T., Rodríguez-Caballero, E., Moran-Zuloaga, D., Brito, J., Carbone, S., Degrendele, C., Després, V. R., Ditas, F., Holanda, B. A., Kaiser, J. W., Lammel, G., Lavrič, J. V., Ming, J., Pickersgill, D., Pöhlker, M. L., Praß, M., Löbs, N., Saturno, J., Sörgel, M., Wang, Q., Weber, B., Wolff, S., Artaxo, P., Pöschl, U., and Andreae, M. O.: Land cover and its transformation in the backward trajectory footprint region of the Amazon Tall Tower Observatory, Atmos. Chem. Phys., 19, 8425–8470, https://doi.org/10.5194/acp-19-8425-2019, 2019. a
Pöschl, U., Martin, S. T., Sinha, B., Chen, Q., Gunthe, S. S., Huffman, J. A., Borrmann, S., Farmer, D. K., Garland, R. M., Helas, G., Jimenez, J. L., King, S. M., Manzi, A., Mikhailov, E., Pauliquevis, T., Petters, M. D., Prenni, A. J., Roldin, P., Rose, D., Schneider, J., Su, H., Zorn, S. R., Artaxo, P., Andreae, M. O., Pöschl, U., Martin, S. T., Sinha, B., Chen, Q., Gunthe, S. S., Huffman, J. A., Borrmann, S., Farmer, D. K., Garland, R. M., Helas, G., Jimenez, J. L., King, S. M., Manzi, A., Mikhailov, E., Pauliquevis, T., Petters, M. D., Prenni, A. J., Roldin, P., Rose, D., Schneider, J., Su, H., Zorn, S. R., Artaxo, P., and Andreae, M. O.: Rainforest Aerosols as Biogenic Nuclei of Clouds and Precipitation in the Amazon, Science, 329, 1513–1516, https://doi.org/10.1126/science.1191056, 2010. a, b
Pratt, K. A., Murphy, S. M., Subramanian, R., DeMott, P. J., Kok, G. L., Campos, T., Rogers, D. C., Prenni, A. J., Heymsfield, A. J., Seinfeld, J. H., and Prather, K. A.: Flight-based chemical characterization of biomass burning aerosols within two prescribed burn smoke plumes, Atmos. Chem. Phys., 11, 12549–12565, https://doi.org/10.5194/acp-11-12549-2011, 2011. a
Querino, C. A. S., Smeets, C. J. P. P., Vigano, I., Holzinger, R., Moura, V., Gatti, L. V., Martinewski, A., Manzi, A. O., de Araújo, A. C., and Röckmann, T.: Methane flux, vertical gradient and mixing ratio measurements in a tropical forest, Atmos. Chem. Phys., 11, 7943–7953, https://doi.org/10.5194/acp-11-7943-2011, 2011. a, b
Ramsay, R., Di Marco, C. F., Heal, M. R., Twigg, M. M., Cowan, N., Jones, M. R., Leeson, S. R., Bloss, W. J., Kramer, L. J., Crilley, L., Sörgel, M., Andreae, M., and Nemitz, E.: Surface–atmosphere exchange of inorganic water-soluble gases and associated ions in bulk aerosol above agricultural grassland pre- and postfertilisation, Atmos. Chem. Phys., 18, 16953–16978, https://doi.org/10.5194/acp-18-16953-2018, 2018. a, b, c, d, e, f, g, h
Ramsay, R., Di Marco, C. F., Heal, M. R., Sörgel, M., Artaxo, P., Andreae, M. O., and Nemitz, E.: Measurement and modelling of the dynamics of NH3 surface-atmosphere exchange over the Amazonian rainforest, Biogeosciences Discuss., https://doi.org/10.5194/bg-2020-219, in review, 2020. a, b
Raupach, M. R. and Legg, B. J.: The uses and limitations of flux-gradient relationships in micrometeorology, Agr. Water Manage., 8, 119–131, https://doi.org/10.1016/0378-3774(84)90049-0, 1984. a
Roberts, G. C., Andreae, M. O., Zhou, J., and Artaxo, P.: Cloud condensation nuclei in the Amazon Basin: “marine” conditions over a continent?, Geophys. Res. Lett., 28, 2807–2810, https://doi.org/10.1029/2000GL012585, 2001. a
Rubio, M. A., Lissi, E., and Villena, G.: Nitrite in rain and dew in Santiago city, Chile. Its possible impact on the early morning start of the photochemical smog, Atmos. Environ., 36, 293–297, https://doi.org/10.1016/S1352-2310(01)00356-9, 2002. a
Rubio, M. A., Lissi, E., and Villena, G.: Factors determining the concentration of nitrite in dew from Santiago, Chile, Atmos. Environ., 42, 7651–7656, https://doi.org/10.1016/j.atmosenv.2008.05.055, 2008. a
Sanhueza, E.: Hydrochloric acid from chlorocarbons: a significant global source of background rain acidity, Tellus B, 53, 122–132, https://doi.org/10.3402/tellusb.v53i2.16568, 2001. a
Saturno, J., Ditas, F., Penning de Vries, M., Holanda, B. A., Pöhlker, M. L., Carbone, S., Walter, D., Bobrowski, N., Brito, J., Chi, X., Gutmann, A., Hrabe de Angelis, I., Machado, L. A. T., Moran-Zuloaga, D., Rüdiger, J., Schneider, J., Schulz, C., Wang, Q., Wendisch, M., Artaxo, P., Wagner, T., Pöschl, U., Andreae, M. O., and Pöhlker, C.: African volcanic emissions influencing atmospheric aerosols over the Amazon rain forest, Atmos. Chem. Phys., 18, 10391–10405, https://doi.org/10.5194/acp-18-10391-2018, 2018. a, b
Saturno, J., Holanda, B. A., Pöhlker, C., Ditas, F., Wang, Q., Moran-Zuloaga, D., Brito, J., Carbone, S., Cheng, Y., Chi, X., Ditas, J., Hoffmann, T., Hrabe de Angelis, I., Könemann, T., Lavrič, J. V., Ma, N., Ming, J., Paulsen, H., Pöhlker, M. L., Rizzo, L. V., Schlag, P., Su, H., Walter, D., Wolff, S., Zhang, Y., Artaxo, P., Pöschl, U., and Andreae, M. O.: Black and brown carbon over central Amazonia: long-term aerosol measurements at the ATTO site, Atmos. Chem. Phys., 18, 12817–12843, https://doi.org/10.5194/acp-18-12817-2018, 2018. a
Scharko, N. K., Schütte, U. M. E., Berke, A. E., Banina, L., Peel, H. R., Donaldson, M. A., Hemmerich, C., White, J. R., and Raff, J. D.: Combined Flux Chamber and Genomics Approach Links Nitrous Acid Emissions to Ammonia Oxidizing Bacteria and Archaea in Urban and Agricultural Soil, Environ. Sci. Technol., 49, 13825–13834, https://doi.org/10.1021/acs.est.5b00838, 2015. a
Simpson, I. J., Thurtell, G. W., Neumann, H. H., Den Hartog, G., and Edwards, G. C.: The Validity of Similarity Theory in the Roughness Sublayer Above Forests, Bound.-Lay. Meteorol., 87, 69–99, https://doi.org/10.1023/A:1000809902980, 1998. a
Slanina, J., ten Brink, H. M., Otjes, R. P., Even, A., Jongejan, P., Khlystov, A., Waijers-Ijpelaan, A., Hu, M., and Lu, Y.: The continuous analysis of nitrate and ammonium in aerosols by the steam jet aerosol collector (SJAC): extension and validation of the methodology, Atmos. Environ., 35, 2319–2330, https://doi.org/10.1016/S1352-2310(00)00556-2, 2001. a, b
Slinn, S. A. and Slinn, W. G. N.: Predictions for particle deposition on natural waters, Atmos. Environ., 14, 1013–1016, https://doi.org/10.1016/0004-6981(80)90032-3, 1980. a
Slinn, W. G. N.: Predictions for particle deposition to vegetative canopies, Atmos. Environ., 16, 1785–1794, https://doi.org/10.1016/0004-6981(82)90271-2, 1982. a, b
Sörgel, M., Trebs, I., Serafimovich, A., Moravek, A., Held, A., and Zetzsch, C.: Simultaneous HONO measurements in and above a forest canopy: influence of turbulent exchange on mixing ratio differences, Atmos. Chem. Phys., 11, 841–855, https://doi.org/10.5194/acp-11-841-2011, 2011. a, b
Sörgel, M., Trebs, I., Wu, D., and Held, A.: A comparison of measured HONO uptake and release with calculated source strengths in a heterogeneous forest environment, Atmos. Chem. Phys., 15, 9237–9251, https://doi.org/10.5194/acp-15-9237-2015, 2015. a, b
Spataro, F. and Ianniello, A.: Sources of atmospheric nitrous acid: State of the science, current research needs, and future prospects, JAPCA J. Air Waste Ma., 64, 1232–1250, https://doi.org/10.1080/10962247.2014.952846, 2014. a
Spindler, G., Hesper, J., Brüggemann, E., Dubois, R., Müller, T., and Herrmann, H.: Wet annular denuder measurements of nitrous acid: laboratory study of the artefact reaction of NO2 with S(IV) in aqueous solution and comparison with field measurements, Atmos. Environ., 37, 2643–2662, https://doi.org/10.1016/S1352-2310(03)00209-7, 2003. a, b, c
Stein, A. F., Draxler, R. R., Rolph, G. D., Stunder, B. J. B., Cohen, M. D., and Ngan, F.: NOAA's HYSPLIT Atmospheric Transport and Dispersion Modeling System, B. Am. Meteorol. Soc., 96, 2059–2077, https://doi.org/10.1175/BAMS-D-14-00110.1, 2015. a
Stemmler, K., Ndour, M., Elshorbany, Y., Kleffmann, J., D'Anna, B., George, C., Bohn, B., and Ammann, M.: Light induced conversion of nitrogen dioxide into nitrous acid on submicron humic acid aerosol, Atmos. Chem. Phys., 7, 4237–4248, https://doi.org/10.5194/acp-7-4237-2007, 2007. a
Su, H., Cheng, Y., Oswald, R., Behrendt, T., Trebs, I., Meixner, F. X., Andreae, M. O., Cheng, P., Zhang, Y., and Pöschl, U.: Soil Nitrite as a Source of Atmospheric HONO and OH Radicals, Science, 333, 1616–1618, https://doi.org/10.1126/science.1207687, 2011. a
Sullivan, R. C., Guazzotti, S. A., Sodeman, D. A., Tang, Y., Carmichael, G. R., and Prather, K. A.: Mineral dust is a sink for chlorine in the marine boundary layer, Atmos. Environ., 41, 7166–7179, https://doi.org/10.1016/j.atmosenv.2007.05.047, 2007. a
Talbot, R. W., Andreae, M. O., Andreae, T. W., and Harriss, R. C.: Regional aerosol chemistry of the Amazon Basin during the dry season, J. Geophys. Res., 93, 1499, https://doi.org/10.1029/JD093iD02p01499, 1988. a, b, c
Talbot, R. W., Andreae, M. O., Berresheim, H., Artaxo, P., Garstang, M., Harriss, R. C., Beecher, K. M., and Li, S. M.: Aerosol chemistry during the wet season in central Amazonia: The influence of long-range transport, J. Geophys. Res.-Atmos., 95, 16955–16969, https://doi.org/10.1029/JD095iD10p16955, 1990. a, b, c, d
Taraborrelli, D., Lawrence, M. G., Crowley, J. N., Dillon, T. J., Gromov, S., Groß, C. B. M., Vereecken, L., and Lelieveld, J.: Hydroxyl radical buffered by isoprene oxidation over tropical forests, Nat. Geosci., 5, 190–193, https://doi.org/10.1038/ngeo1405, 2012. a
Thomas, R. M., Trebs, I., Otjes, R., Jongejan, P. A. C., ten Brink, H., Phillips, G., Kortner, M., Meixner, F. X., and Nemitz, E.: An Automated Analyzer to Measure Surface-Atmosphere Exchange Fluxes of Water Soluble Inorganic Aerosol Compounds and Reactive Trace Gases, Environ. Sci. Technol., 43, 1412–1418, https://doi.org/10.1021/es8019403, 2009. a, b, c, d, e
Tóta, J., Fitzjarrald, D. R., Staebler, R. M., Sakai, R. K., Moraes, O. M. M., Acevedo, O. C., Wofsy, S. C., and Manzi, A. O.: Amazon rain forest subcanopy flow and the carbon budget: Santarém LBA-ECO site, J. Geophys. Res.-Biogeo., 113, G00B02, https://doi.org/10.1029/2007JG000597, 2008. a
Trail, F., Gaffoor, I., and Vogel, S.: Ejection mechanics and trajectory of the ascospores of Gibberella zeae (anamorph Fuarium graminearum), Fungal Genet. Biol., 42, 528–533, https://doi.org/10.1016/j.fgb.2005.03.008, 2005. a
Trebs, I., Meixner, F. X., Slanina, J., Otjes, R., Jongejan, P., and Andreae, M. O.: Real-time measurements of ammonia, acidic trace gases and water-soluble inorganic aerosol species at a rural site in the Amazon Basin, Atmos. Chem. Phys., 4, 967–987, https://doi.org/10.5194/acp-4-967-2004, 2004. a, b
Trebs, I., Lara, L. L., Zeri, L. M. M., Gatti, L. V., Artaxo, P., Dlugi, R., Slanina, J., Andreae, M. O., and Meixner, F. X.: Dry and wet deposition of inorganic nitrogen compounds to a tropical pasture site (Rondônia, Brazil), Atmos. Chem. Phys., 6, 447–469, https://doi.org/10.5194/acp-6-447-2006, 2006. a, b, c, d, e, f
Trebs, I., Andreae, M. O., Elbert, W., Mayol-Bracero, O. L., Soto-García, L. L., Rudich, Y., Falkovich, A. H., Maenhaut, W., Artaxo, P., Otjes, R., and Slanina, J.: Aerosol Inorganic Composition at a Tropical Site: Discrepancies Between Filter-Based Sampling and a Semi-Continuous Method, Aerosol Sci. Tech., 42, 255–269, https://doi.org/10.1080/02786820801992899, 2008. a, b
Trebs, I., Mayol-Bracero, O. L., Pauliquevis, T., Kuhn, U., Sander, R., Ganzeveld, L., Meixner, F. X., Kesselmeier, J., Artaxo, P., and Andreae, M. O.: Impact of the Manaus urban plume on trace gas mixing ratios near the surface in the Amazon Basin: Implications for the NO-NO2-O3 photostationary state and peroxy radical levels, J. Geophys. Res.-Atmos., 117, D05307, https://doi.org/10.1029/2011JD016386, 2012. a
Twigg, M. M., House, E., Thomas, R., Whitehead, J., Phillips, G. J., Famulari, D., Fowler, D., Gallagher, M. W., Cape, J. N., Sutton, M. A., and Nemitz, E.: Surface/atmosphere exchange and chemical interactions of reactive nitrogen compounds above a manured grassland, Agr. Forest Meteorol., 151, 1488–1503, https://doi.org/10.1016/j.agrformet.2011.06.005, 2011. a, b, c, d, e, f, g
Van Damme, M., Wichink Kruit, R., Schaap, M., Clarisse, L., Clerbaux, C., Coheur, P.-F., Dammers, E., Dolman, A., and Erisman, J.: Evaluating 4 years of atmospheric ammonia (NH3) over Europe using IASI satellite observations and LOTOS-EUROS model results, J. Geophys. Res.-Atmos., 119, 9549–9566, https://doi.org/10.1002/2014JD021911, 2014. a
Wang, Q., Saturno, J., Chi, X., Walter, D., Lavric, J. V., Moran-Zuloaga, D., Ditas, F., Pöhlker, C., Brito, J., Carbone, S., Artaxo, P., and Andreae, M. O.: Modeling investigation of light-absorbing aerosols in the Amazon Basin during the wet season, Atmos. Chem. Phys., 16, 14775–14794, https://doi.org/10.5194/acp-16-14775-2016, 2016. a
Wesely, M. L.: Parameterization of surface resistances to gaseous dry deposition in regional-scale numerical models, Atmos. Environ., 23, 1293–1304, https://doi.org/10.1016/0004-6981(89)90153-4, 1989. a, b
Wesely, M. L., Cook, D. R., Hart, R. L., and Speer, R. E.: Measurements and parameterization of particulate sulfur dry deposition over grass, J. Geophys. Res.-Atmos., 90, 2131–2143, https://doi.org/10.1029/JD090iD01p02131, 1985. a, b
Whitburn, S., Van Damme, M., Kaiser, J. W., van der Werf, G. R., Turquety, S., Hurtmans, D., Clarisse, L., Clerbaux, C., and Coheur, P.-F.: Ammonia emissions in tropical biomass burning regions: Comparison between satellite-derived emissions and bottom-up fire inventories, Atmos. Environ., 121, 42–54, https://doi.org/10.1016/j.atmosenv.2015.03.015, 2015. a
Whitehead, J. D., Gallagher, M. W., Dorsey, J. R., Robinson, N., Gabey, A. M., Coe, H., McFiggans, G., Flynn, M. J., Ryder, J., Nemitz, E., and Davies, F.: Aerosol fluxes and dynamics within and above a tropical rainforest in South-East Asia, Atmos. Chem. Phys., 10, 9369–9382, https://doi.org/10.5194/acp-10-9369-2010, 2010. a, b, c
Whitehead, J. D., Darbyshire, E., Brito, J., Barbosa, H. M. J., Crawford, I., Stern, R., Gallagher, M. W., Kaye, P. H., Allan, J. D., Coe, H., Artaxo, P., and McFiggans, G.: Biogenic cloud nuclei in the central Amazon during the transition from wet to dry season, Atmos. Chem. Phys., 16, 9727–9743, https://doi.org/10.5194/acp-16-9727-2016, 2016. a
Williams, E., Rosenfeld, D., Madden, N., Gerlach, J., Gears, N., Atkinson, L., Dunnemann, N., Frostrom, G., Antonio, M., Biazon, B., Camargo, R., Franca, H., Gomes, A., Lima, M., Machado, R., Manhaes, S., Nachtigall, L., Piva, H., Quintiliano, W., Machado, L., Artaxo, P., Roberts, G., Renno, N., Blakeslee, R., Bailey, J., Boccippio, D., Betts, A., Wolff, D., Roy, B., Halverson, J., Rickenbach, T., Fuentes, J., and Avelino, E.: Contrasting convective regimes over the Amazon: Implications for cloud electrification, J. Geophys. Res.-Atmos., 107, 8082, https://doi.org/10.1029/2001JD000380, 2002. a
Wolff, V., Trebs, I., Ammann, C., and Meixner, F. X.: Aerodynamic gradient measurements of the NH3-HNO3-NH4NO3 triad using a wet chemical instrument: an analysis of precision requirements and flux errors, Atmos. Meas. Tech., 3, 187–208, https://doi.org/10.5194/amt-3-187-2010, 2010a. a
Wolff, V., Trebs, I., Foken, T., and Meixner, F. X.: Exchange of reactive nitrogen compounds: concentrations and fluxes of total ammonium and total nitrate above a spruce canopy, Biogeosciences, 7, 1729–1744, https://doi.org/10.5194/bg-7-1729-2010, 2010b. a, b, c, d, e, f
Wu, D., Horn, M. A., Behrendt, T., Müller, S., Li, J., Cole, J. A., Xie, B., Ju, X., Li, G., Ermel, M., Oswald, R., Fröhlich-Nowoisky, J., Hoor, P., Hu, C., Liu, M., Andreae, M. O., Pöschl, U., Cheng, Y., Su, H., Trebs, I., Weber, B., and Sörgel, M.: Soil HONO emissions at high moisture content are driven by microbial nitrate reduction to nitrite: tackling the HONO puzzle, ISME J., 13, 1688–1699, https://doi.org/10.1038/s41396-019-0379-y, 2019. a
Wyers, G. P., Otjes, R. P., and Slanina, J.: A continuous-flow denuder for the measurement of ambient concentrations and surface-exchange fluxes of ammonia, Atmos. Environ., 27, 2085–2090, https://doi.org/10.1016/0960-1686(93)90280-C, 1993. a
Xiao, X., Prinn, R. G., Fraser, P. J., Simmonds, P. G., Weiss, R. F., O'Doherty, S., Miller, B. R., Salameh, P. K., Harth, C. M., Krummel, P. B., Porter, L. W., Mühle, J., Greally, B. R., Cunnold, D., Wang, R., Montzka, S. A., Elkins, J. W., Dutton, G. S., Thompson, T. M., Butler, J. H., Hall, B. D., Reimann, S., Vollmer, M. K., Stordal, F., Lunder, C., Maione, M., Arduini, J., and Yokouchi, Y.: Optimal estimation of the surface fluxes of methyl chloride using a 3-D global chemical transport model, Atmos. Chem. Phys., 10, 5515–5533, https://doi.org/10.5194/acp-10-5515-2010, 2010. a
Yokelson, R. J., Burling, I. R., Urbanski, S. P., Atlas, E. L., Adachi, K., Buseck, P. R., Wiedinmyer, C., Akagi, S. K., Toohey, D. W., and Wold, C. E.: Trace gas and particle emissions from open biomass burning in Mexico, Atmos. Chem. Phys., 11, 6787–6808, https://doi.org/10.5194/acp-11-6787-2011, 2011. a
Yokouchi, Y., Ikeda, M., Inuzuka, Y., and Yukawa, T.: Strong emission of methyl chloride from tropical plants, Nature, 416, 163–165, https://doi.org/10.1038/416163a, 2002. a
Yokouchi, Y., Takenaka, A., Miyazaki, Y., Kawamura, K., and Hiura, T.: Emission of methyl chloride from a fern growing in subtropical, temperate, and cool-temperate climate zones, J. Geophys. Res.-Biogeo., 120, 1142–1149, https://doi.org/10.1002/2015JG002994, 2015. a
Zahn, E., Dias, N. L., Araújo, A., Sá, L. D. A., Sörgel, M., Trebs, I., Wolff, S., and Manzi, A.: Scalar turbulent behavior in the roughness sublayer of an Amazonian forest, Atmos. Chem. Phys., 16, 11349–11366, https://doi.org/10.5194/acp-16-11349-2016, 2016. a
Zhang, L., Brook, J. R., and Vet, R.: A revised parameterization for gaseous dry deposition in air-quality models, Atmos. Chem. Phys., 3, 2067–2082, https://doi.org/10.5194/acp-3-2067-2003, 2003. a, b, c
Zhou, X., Zhang, N., Teravest, M., Tang, D., Hou, J., Bertman, S., Alaghmand, M., Shepson, P., Anne Carroll, M., Griffith, S., Dusanter, S., and Stevens, P.: Nitric acid photolysis on forest canopy surface as a source for tropospheric nitrous acid, Nat. Geosci., 4, 440–443, https://doi.org/10.1038/ngeo1164, 2011. a, b
laboratoryto study the processes which govern the exchange of gases and aerosols to and from the atmosphere. This study investigated these processes by measuring the atmospheric concentrations of trace gases and particles at the Amazon Tall Tower Observatory. We found that the long-range transport of pollutants can affect the atmospheric composition above the Amazon rainforest and that the gases ammonia and nitrous acid can be emitted from the rainforest.
laboratoryto study the processes which govern the exchange of...