the Creative Commons Attribution 4.0 License.
the Creative Commons Attribution 4.0 License.
 | 11 Dec 2020
Measurement report: Source and mixing state of black carbon aerosol in the North China Plain: implications for radiative effect
Qiyuan Wang
Li Li
Jiamao Zhou
Jianhuai Ye
Wenting Dai
Huikun Liu
Yong Zhang
Renjian Zhang
Jie Tian
Yang Chen
Yunfei Wu
Weikang Ran
Junji Cao
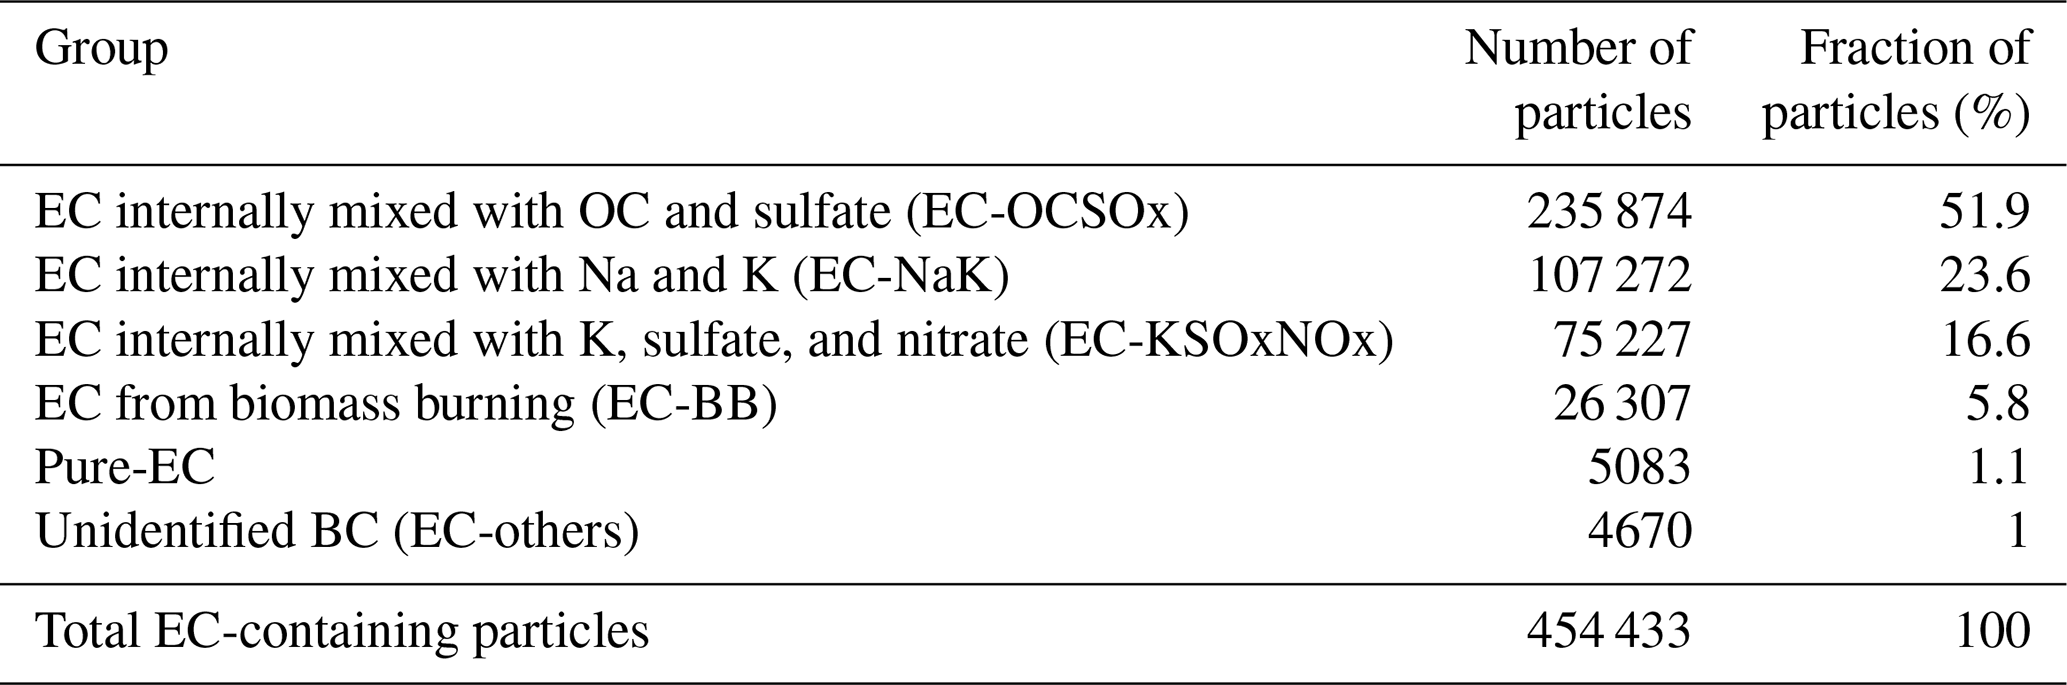
Establishment of the sources and mixing state of black carbon (BC) aerosol is essential for assessing its impact on air quality and climatic effects. A winter campaign (December 2017–January 2018) was performed in the North China Plain (NCP) to evaluate the sources, coating composition, and radiative effects of BC under the background of emission reduction. Results showed that the sources of liquid fossil fuels (i.e., traffic emissions) and solid fuels (i.e., biomass and coal burning) contributed 69 % and 31 % to the total equivalent BC (eBC) mass, respectively. These values were arrived at by using a combination of multi-wavelength optical approach with the source-based aerosol absorption Ångström exponent values. The air quality model indicated that local emissions were the dominant contributors to BC at the measurement site. However, regional emissions from NCP were a critical factor for high BC pollution. A single-particle aerosol mass spectrometer identified six classes of elemental carbon (EC)-containing particles. They included EC coated by organic carbon and sulfate (52 % of total EC-containing particles); EC coated by Na and K (24 %); EC coated by K, sulfate, and nitrate (17 %); EC associated with biomass burning (6 %); pure-EC (1 %); and others (1 %). Different BC sources exhibited distinct impacts on the EC-containing particles. A radiative transfer model showed that the amount of detected eBC can produce an atmospheric direct radiative effect of +18.0 W m−2 and a heating rate of 0.5 K d−1. This study shows that reductions of solid fuel combustion-related BC may be an effective way of mitigating regional warming in the NCP.
- Article
(8393 KB) - Full-text XML
-
Supplement
(968 KB) - BibTeX
- EndNote


In the few past decades, black carbon (BC) aerosol has attracted considerable attention due to its substantial effects on the climate and atmospheric environment (Bond et al., 2013). It has strong light-absorption abilities that lead to substantive climate change in the global atmosphere (+1.1 W m−2). It is considered to be the second largest anthropogenic warming agent after carbon dioxide (Bond et al., 2013). In addition, the high atmospheric BC loading inhibits the development of a planetary boundary layer and enhances haze pollution (Ding et al., 2016). Reducing atmospheric BC loading is regarded as a win–win intervention for mitigating climate change and improving air quality (Kopp and Mauzerall, 2010).
Different emission sources (e.g., fossil fuel and biomass burning) and complex physicochemical properties (e.g., morphology, size, and coating composition) have hindered the efforts to assess the climatic and environmental impacts of BC (Vignati et al., 2010). To determine BC sources, current methods rely on data obtained from offline filter-based or online spectroscopic techniques (Briggs and Long, 2016). Among them, the carbon isotope approach (Zhang et al., 2015) and multi-wavelength optical method (Zotter et al., 2017) are often used to determine BC sources. The carbon isotope approach can be used to obtain relatively accurate results of BC sources. However, the analysis is limited by the time resolution of the filter samples. The multi-wavelength optical method utilizes online data and has the advantage of a superior time resolution when determining BC sources. The principle of the multi-wavelength optical method is based on Beer–Lambert's Law. It utilizes measured aerosol light absorption at different wavelengths (Sandradewi et al., 2008). However, due to the lack of source-specific aerosol absorption Ångström exponent (AAE), studies often cite AAEs from previous literature, with fuel types being distinct among studies (Kalogridis et al., 2018; Zheng et al., 2019). These components induce potential uncertainties in using the multi-wavelength optical method. Therefore, a diverse set of AAEs from different source emissions are needed to improve the performance of this method.
Black carbon mixing state is when another chemical composition is coated on BC particles (internally mixed) or exists as separate particles (externally mixed). Freshly emitted BC particles (e.g., diesel vehicle emissions) exhibit typical external mixing, but over time, they become internally mixed with other non-BC materials (e.g., organics, sulfate, and nitrate) during atmospheric processes (Eriksson et al., 2017). Compared to uncoated BC particles, the coated ones enhance the absorption efficiency of solar radiation by a factor of 1.2–2.0. This factor is strongly correlated with the chemical composition of the coatings on BC particles and their thickness (Wang et al., 2014; Fierce et al., 2016; Liu et al., 2017). Determination of BC mixing states through observation is challenging. Advances in online mass spectrometric techniques have enabled the elucidation of chemical characteristics of BC coatings. Based on this method, studies have reported direct observations of chemical compositions associated with BC-containing particles and their evolutionary features in the atmosphere (Zhang et al., 2014; Arndt et al., 2017).
China is a hotspot for anthropogenic BC emissions. It accounts for up to 14 % of the global BC radiative forcing (Li et al., 2016). In the past decade, China has experienced severe air pollution, especially in the North China Plain (NCP) (An et al., 2019). To improve air quality, the Chinese State Council has promulgated a series of regulations to reduce air pollutants. The most rigorous regulation of the “Action Plan for the Prevention and Control of Air Pollution (APPCAP)” released on 10 September 2013, aimed at reducing particulate matter by up to 10 % in 2017 relative to 2012 levels for all prefecture-level cities in China. Studies have demonstrated the effectiveness of China's clean air policies in the reduction of particulate matter (Zhang et al., 2019). Decreased BC and co-emitted pollutant levels affects the interactions between BC and secondary aerosols, which in turn results in changes in the physicochemical properties of the BC aerosol. To reduce emissions, the assessment of physicochemical characteristics of BC will enhance the understanding of anthropogenic climate impact in China. However, studies focused on this aspect are limited. Therefore, we performed intensive measurements during winter in the last year of the APPCAP at a regional site in the NCP region to determine the influences of different sources and regions to BC loading, identify the chemical composition of BC coatings, and evaluate the impact of BC on radiative effect.
2.1 Sampling site
The sampling site was the Xianghe Atmospheric Integrated Observatory (39∘45′ N, 116∘57′ E). It is located in a small county of Xianghe, north of the NCP (Fig. 1). The county has an area of 458 km2 and a total population of 0.36 million. It is bordered by Beijing in the northwest (∼45 km) and Tianjin in the southeast (∼79 km). This place is considered to be a regional observatory site that is exposed to frequent pollution plumes (e.g., urban, rural, or mixed origins) from surrounding areas (Wang et al., 2019a). Intensive measurements were performed in winter (1 December 2017 to 31 January 2018). During this period, atmospheric temperature was −1 ∘C, while the relative humidity was 35 %.

Figure 1Map showing the Xianghe sampling site and surrounding areas. The map was drawn using ArcGIS software. The base map is the World Topographic Map from © ESRI (Environmental Systems Research Institute, Inc.) (https://www.arcgis.com/home/item.html?id=30e5fe3149c34df1ba922e6f5bbf808f, last access: September 2019).
2.2 Field observations
2.2.1 Aethalometer measurement
A model AE33 aethalometer (Magee Scientific, Berkeley, CA, USA) was used to measure aerosol light absorption at multiple wavelengths (babs(λ), λ=370, 470, 520, 590, 660, 880, and 950 nm) with a PM2.5 cyclone (SCC 1.829, BGI Inc. USA). A schematic representation of the instrumental setup of the ambient aerosol measurements is shown in Fig. S1 in the Supplement. The operational principle of this instrument was described in detail by Drinovec et al. (2015). Briefly, seven different light sources are used to irradiate the filter deposition spot, and light attenuation is detected by optical sensors. The biases associated with the nonlinear loading effect were resolved by the AE33 aethalometer. However, the impact of filter matrix scatters interferes with the accuracy of measurements (Drinovec et al., 2015). To overcome this limitation, a photoacoustic extinctiometer (PAX) operating at a λ=532 nm was installed in parallel with the AE33 aethalometer. A detailed operating principle and the calibrating procedures of PAX were described in our previous publication (Wang et al., 2018). As shown in Fig. S2, a 520 nm wavelength of AE33 absorption was strongly correlated with the PAX absorption (R2=0.97, p<0.01). The slope of 2.57 was then used to correct the AE33 data. However, a single-wavelength-based correction method may result in underestimation at λ=370 and 470 nm and overestimation at λ=590, 660, and 880 nm (Kim et al., 2019).
Furthermore, based on the assumption that only BC is absorbed at the near-infrared region, the mass concentration of equivalent BC (eBC) was estimated using babs(880). The mass absorption cross section (MAC) of eBC at λ=880 nm (MACeBC(880)) was a conversion factor between babs(880) and eBC. It was retrieved from the correlation between babs(880) and filter-based elemental carbon (EC, see Sect. S1 in the Supplement). A good correlation of babs(880) and EC mass concentration (R2=0.86, p<0.01) was observed as shown in Fig. S3. Therefore, the MACeBC(880) was estimated by babs(880) dividing the EC mass concentration (.
2.2.2 Single-particle aerosol mass spectrometer (SPAMS)
A SPAMS (Hexin Analytical Instrument Co., Ltd., Guangzhou, China) was used to determine the real-time chemical composition of EC-containing particles. Ambient aerosol was drawn into the evacuated system through a critical orifice (100 µm) at a flow rate of 0.08 L min−1. After passing through an aerodynamic lens, the sampled particles were accelerated to certain speeds. Two diode Nd:YAG lasers (MLL-III-532, Changchun, China) operating at 532 nm were used to determine the aerodynamic diameters (0.2–2.0 µm) of the passing particles. A pulsed 266 nm Nd:YAG laser (UL728F11-F115, Quantel, France) was then used to ionize the particles. Finally, a dual-polar time-of-flight mass spectrometer was applied to detect the generated positive and negative fragment ions. A MATLAB-based YAADA toolkit (http://www.yaada.org/, last access: May 2019) was used to search and analyze the imported single-particle mass spectral data. An adaptive resonance theory-based neural network algorithm (ART-2a) was used to perform particle clustering, with a vigilance factor of 0.8, a learning rate of 0.05, and 20 iterations (Li et al., 2019).
2.3 Source emission experiments
A custom-made passivated aluminum chamber (∼8 m3) was used to characterize the emission of solid fuels (i.e., biomass and coal) (Fig. S4). Performance evaluation of this chamber was done by Tian et al. (2015). Several types of biomass residues (wheat straw, rice straw, corn stalk, cotton stalk, sesame stalk, soybean straw, and firewood) and coal (bituminous coal and honeycomb briquette) were used to represent biomass burning and coal combustion that occurs in the NCP. Each weighted sample was burned on a platform or a stove that was placed inside the combustion chamber. For biomass burning, the chamber background babs(λ) was measured by AE33 aethalometer before ignition. When the background babs(λ) was close to zero and stable, a propane torch was used to ignite the biomass on the platform. For coal combustion, a burned-out honeycomb coal in the stove was used as the igniter after the background babs(λ) was small and stable in the chamber. The emitted smokes of each burn test were first diluted by a Model 18 dilution sampler (Baldwin Environmental Inc., Reno, NV, USA) before AE33 aethalometer measurements (Fig. S4). The babs(λ) used to estimate the AAE was averaged over the entire period of each burn from ignition to babs(λ) back to the background.
The motor vehicle exhaust emissions were performed using a LDWJ6/135 detection system of loading and speed reduction on the light-duty diesel vehicle (Shenzhen Huiyin Industrial Development Co., Ltd, Shenzhen, China). This system contains two different sizes of expansion cylinders that are used to carry the driving wheels of the vehicles. Figure S5 shows the schematic presentation of the instrumental setup of motor vehicle exhaust emissions. Gasoline and diesel cars at idle and at different driving speeds (i.e., 20 and 40 km h−1) were tested. The automobile exhaust smoke particles were collected using a particle sampling probe in the exhaust pipe. The particles were dried by a silica gel dryer before AE33 aethalometer measurement. The measured babs(λ) used to estimate the AAE was averaged over the period that the driving speed was relatively stable.
2.4 Data analysis methods
2.4.1 Multi-wavelength optical method
A multi-wavelength optical method proposed by Sandradewi et al. (2008) was used to quantify the influence of liquid fossil fuels (i.e., gasoline and diesel for traffic emissions) and solid fuels (i.e., biomass and coal) to eBC mass at Xianghe. The measured babs(λ) at the wavelengths of 370 nm (babs(370)) and 880 nm (babs(880)) were used in this study. The babs(λ) value is determined by carbonaceous aerosols and mineral dust. The mass fraction of mineral dust in PM2.5 was small (11 %) during the campaign. Moreover, the MAC of mineral dust was 0.09 m2 g−1 at λ=370 nm and 0.001 m2 g−1 at λ=880 nm (Yang et al., 2009). Therefore, the light absorption capacity of mineral dust in this study is negligible. For carbonaceous absorption, it can be divided into light absorption attributed to primary emissions (i.e., BC and primary brown carbon (BrC)) and secondary formation (i.e., secondary BrC) (Laskin et al., 2015). Therefore, the babs(370) and babs(880) could be calculated from the perspective of emission sources as follows:
where babs(880)lff and babs(880)sf refer to the light absorptive capacity of BC at λ=880 nm from liquid fossil fuel and solid fuel sources, respectively; babs(370)lff and babs(370)sf are the light absorptive capacities of BC and primary BrC at λ=370 nm emitted from liquid fossil fuel and solid fuel sources, respectively; babs(370)sBrC is the absorption caused by secondary BrC, which was estimated by a BC tracer method combined with a minimum R-squared approach (Wang et al., 2019b); and AAElff and AAEsf describe the aerosol AAEs from sources of liquid fossil fuels and solid fuels, respectively.
After obtaining babs(880)lff and babs(880)sf, the mass concentrations of eBC contributed by liquid fossil fuel and solid fuel sources (eBClff and eBCsf, respectively) were calculated by dividing MACeBC(880) as follows:
The underlying assumption of Eqs. (5) and (6) was that the MACeBC(880) value was the same from liquid fossil fuel and solid fuel sources. The rationality of this assumption has been confirmed by Zotter et al. (2017).
2.4.2 Regional chemical dynamical model
In this study, local and regional contributions to BC mass at Xianghe were quantified by the Weather Research and Forecasting model coupled with Chemistry (WRF-Chem). The BC utilized as a tracer was added into the WRF-Chem to improve the model's operational efficiency (Zhao et al., 2015). Detailed descriptions regarding the model's configurations are shown in Sect. S2. The performance of WRF-Chem simulation was evaluated with a mathematical parameter of index of agreement (IOA). This index describes the relative differences between the simulated and observed values. The IOA values vary from 0 to 1. An index that is closer to 1 is associated with better performance of the simulation model. The IOA was calculated as follows (Li et al., 2011):
whereby Si and Oi were the simulated and observed mass concentrations of BC, respectively; Save and Oave represented the average value of simulated and observed BC loadings, respectively; and N denoted the number of simulations.
2.4.3 Radiative effect and heating rate
Aerosol direct radiative effect (DRE) (Heald et al., 2014) at the top of the atmosphere (TOA) or at the Earth's surface (ES) is the difference between the incoming (↓) and outgoing (↑) solar fluxes (F) with and without aerosols:
The aerosol DRE in the atmosphere was calculated by subtracting the DRE at the Earth's surface from the DRE at the top of the atmosphere.
In this study, the Santa Barbara DISORT Atmospheric Radiative Transfer (SBDART) model that was developed by Ricchiazzi et al. (1998) was used to perform the radiative transfer calculations in the shortwave spectral region of 0.25–4.0 µm. The SBDART model is a widely used tool for estimating aerosol DRE in the atmosphere (e.g., Zhang et al., 2017; Rajesh and Ramachandran, 2018; Boiyo et al., 2019). A detailed description of this model can be found in Ricchiazzi et al. (1998). The aerosols' optical depth, single scattering albedo, and asymmetric parameters are essential input factors in the SBDART model. These optical parameters were estimated using the Optical Properties of Aerosols and Clouds (OPAC) model (Hess et al., 1998). Detailed calculations are shown in Sect. S3. Moreover, the surface albedo, solar zenith angle, and atmospheric parameter profiles are also important input factors in the SBDART model. The surface albedo was derived from the Moderate Resolution Imaging Spectroradiometer (https://atmosphere-imager.gsfc.nasa.gov/ALBEDO/index.html, last access: November 2019). The solar zenith angle was estimated using the latitude, longitude, and sampling time of the location. The atmospheric vertical profiles (including vertical distributions of temperature, pressure, water vapor, and ozone density) of midlatitude winter embedded in the SBDART model were used.
After obtaining eBC DRE, the atmospheric heating rate (, in unit of K d−1) induced by eBC was further calculated using the first law of thermodynamics and hydrostatic equilibrium as follows (Liou, 2002):
where described the lapse rate, of which g was the acceleration due to gravity and Cp represented the specific heat capacity of air at a constant pressure (1006 J kg−1 K−1); ΔF was the atmospheric forcing induced by the eBC aerosol; and ΔP was representative of the atmospheric pressure difference, which was assumed to be 300 hPa.
3.1 BC source apportionment
3.1.1 Determination of source-specific AAEs
Table 1 summarizes the average AAEs obtained from the sources of liquid fossil fuels and solid fuels. These source-specific AAEs were calculated using babs(370) and babs(880) (Eqs. 3 and 4). The average AAElff was 1.3±0.2 with the gasoline car exhibiting higher values (1.4–1.5) compared to the diesel engine car (1.1–1.2). In comparison with AAElff, a higher average value was exhibited by AAEsf (2.8±1.0). The highest value was, however, obtained from honeycomb briquette emissions (4.0±0.9), followed by burning firewood (2.9±0.2), crop residue emissions (2.4±0.4), and bituminous coal emissions (1.1±0.2). The variance in AAEsf was attributed to the different types of solid fuels and their burning conditions. For example, the AAEsf exhibited a weak but significant inverse correlation with combustion efficiency at 95 % confidence interval, as shown in Fig. S6 (R2=0.14, p<0.05).
Table 1Summary of the aerosol absorption Ångström exponent (AAE) obtained from source experiment.

a The average value was calculated using the light absorption of the entire period of each burn. b SD is standard deviation. c Test number represents the number of performed experiments.
From Eqs. (1)–(4) of the multi-wavelength optical method, its limitation is attributed to the choice of source-specific AAE. Since AAE exhibited high variations (e.g., 1.1–4.0 in this study), different AAE selections may lead to uncertainties when estimating the contributions of solid fuels and liquid fuels to eBC mass. In this study, the obtained average AAElff (1.3) and AAEsf (2.8) were applied in the multi-wavelength optical method to obtain eBC source apportionment. A sensitivity test for each eBC source and organic aerosol (OA) subtype was further performed to verify the rationality of the used AAEs. The mass concentration of OA was measured using an aerosol chemical speciation monitor (ACSM). The primary OA was further resolved into hydrocarbon-like OA (HOA), biomass burning OA (BBOA), and coal combustion OA (CCOA). HOA is associated with liquid fuel sources, while the BBOA and CCOA are associated with solid fuel sources. Detailed descriptions of OA measurements and its source apportionment are shown in the supplementary material of Wang et al. (2019b).
In light of the range of source-based AAEs as shown in Table 1, a series of AAElff and AAEsf were used to obtain the mass concentrations of eBClff and eBCsf. Correlations for eBClff versus HOA and eBCsf versus (BBOA + CCOA) were then established as shown in Fig. 2. AAElff variations could not affect the correlations between eBClff and HOA at a fixed AAEsf. However, their R2 increased as AAEsf increased before 3. When the AAEsf was larger than 3, the R2 was constant regardless of the variability in AAEsf. In contrast, at a fixed AAElff, the R2 between eBCsf and (BBOA + CCOA) was independent of the AAEsf variation. For the AAElff (1.3) and AAEsf (2.8) used in this study, the coefficients of determining eBClff versus HOA (R2=0.60) and eBCsf versus (BBOA + CCOA) (R2=0.66) were determined from the upper limit of all the R2 values obtained from different ranges of AAElff and AAEsf (Fig. 2). Furthermore, the estimated ratios of HOA ∕ eBClff (1.7) and (BBOA + CCOA) ∕ eBCsf (8.4) were comparable to the values calculated with emission factors (Cheng et al., 2010; Sun et al., 2018). Therefore, the AAElff of 1.3 and AAEsf of 2.8 were reasonable selections for this study.

Figure 2Distributions of the coefficient of determination (R2) of (a) hydrocarbon-like organic aerosol (HOA) versus equivalent black carbon (eBC) from sources of liquid fossil fuels (eBClff) and (b) the sum of the mass concentrations of biomass burning and coal combustion organic aerosols (BBOA + CCOA) versus eBC from sources of solid fuels (eBCsf) at different absorption Ångström exponents of liquid fossil fuels (AAElff) and solid fuels (AAEsf).
3.1.2 Characteristics of eBClff and eBCsf
Figure 3a shows that the hourly eBC mass concentration varied from 0.1 to 24.4 µg m−3 with an average of 3.6±4.0 µg m−3. The estimated eBClff (2.5 µg m−3) comprised 69 % of the total eBC loading, which was over 2 times larger than the contribution of eBCsf (31 %, 1.1 µg m−3) (Fig. 3b). This indicated that at Xianghe, traffic emissions were the dominant contributors to eBC mass. As shown in Fig. 3c, the diurnal variation of eBClff exhibited peaks at 08:00 and 19:00 LT. These findings coincided with the rush-hour traffic of the morning and evenings. The peaks of eBCsf were also found to be in the same period as eBClff. However, they could be attributed to residential cooking in surrounding rural areas where solid fuels are a commonly used source of household energy (Liu et al., 2016). Due to the increased planetary boundary layer height and wind speed (for data sources, see Sect. S1), decreased eBClff and eBCsf values were observed in the afternoons (Fig. 3d). In contrast to the rapid decline in eBClff after 19:00 LT eBCsf persisted at a high level until midnight. Moreover, the eBCsf fraction in eBC was also elevated towards the night, indicating enhanced heating activities using solid fuels during cold nights.
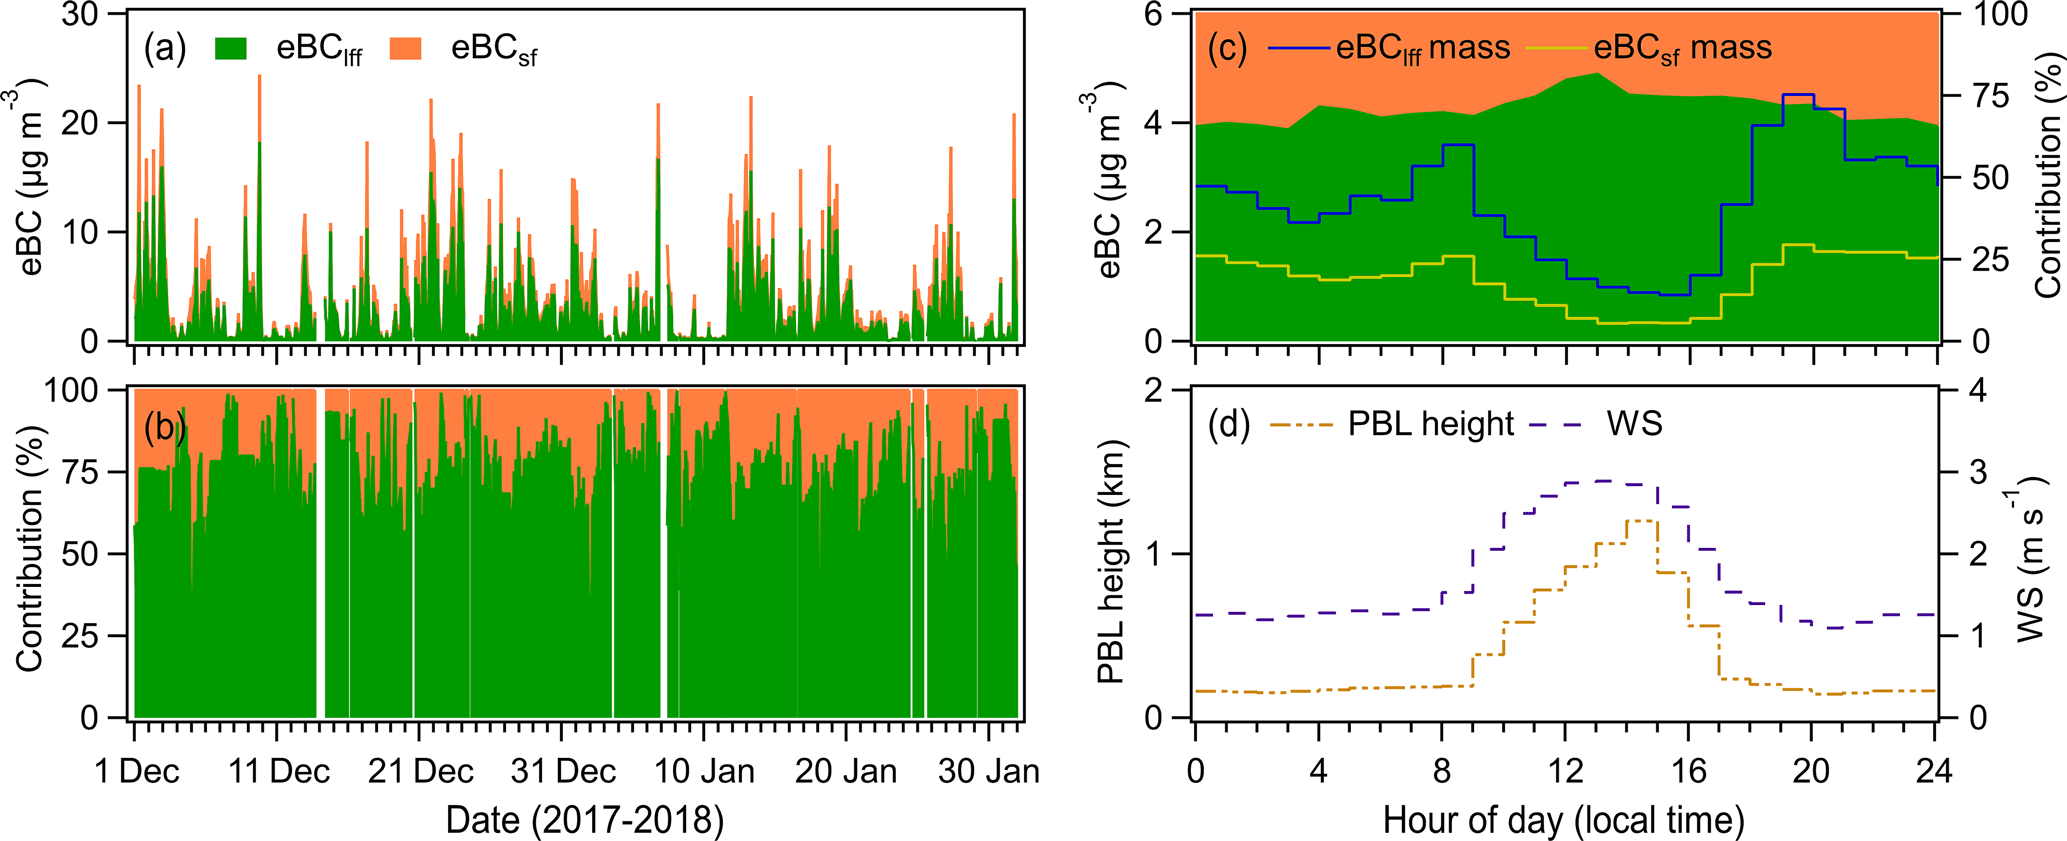
Figure 3(a) Time series of hourly averaged mass concentrations of equivalent black carbon (eBC) aerosol from liquid fossil fuel (eBClff) and solid fuel (eBCsf) sources, and (b) their contributions to total eBC loading during the campaign. Diurnal variations of (c) mass concentrations and mass fractions of eBClff and eBCsf, as well as (d) the height of the planetary boundary layer (PBL) and wind speed (WS), during the campaign.
Figure 4 compares findings from various studies regarding eBC sources, and their detailed information is summarized in Table S1. Because of the heavy traffic, liquid fossil fuel emissions are major contributors to eBC mass in urban areas. However, emissions from solid fuels contribute more to eBC mass compared to liquid fossil fuels in rural areas. This is attributed to wood burning used as an energy source in rural households. In addition, the dominant eBC source in winter NCP has changed from previously being solid fuels to currently being liquid fossil fuels. This change is probably attributed to the rigorous regulations that have been promulgated by the Chinese State Council in recent years. The large-scale project of coal-to-gas switching is considered an effective way of reducing atmospheric pollutants (Qin et al., 2017). Moreover, the total number of vehicles in the NCP region increased from 38.7 million in 2013 to 60.3 million in 2017 (NBS, 2018), although high-emission motor vehicles are banned. Therefore, emissions from liquid fossil fuels are more important to eBC compared to solid fuels.

Figure 4Comparisons of the different sources of black carbon (BC) in urban, suburban, and rural areas in China and Europe. BCsf and BCwb describe BC from solid fuel sources and wood burning, respectively. BClff and BCff represent BC from liquid fossil fuel and solid fossil fuel sources, respectively. Detailed information of the data is summarized in Table S1.
3.2 Contribution of regional transport to BC
The 2–23 January 2018 period was arbitrarily selected to explore the influence of regional transport on BC loading in Xianghe using the WRF-Chem model. The simulated mass concentration of BC was significantly correlated with the measured value (R2=0.61, p<0.01) as shown in Fig. S7. The estimated IOA was 0.72. This indicated that the formation process of BC was captured by WRF-Chem. As shown in Fig. S8, six source regions were identified in the WRF-Chem model to quantify the contributions of local emissions and regional transport to total BC mass. The information on each source region is summarized in Table S2, and their contributions to total BC mass are shown in Fig. 5.
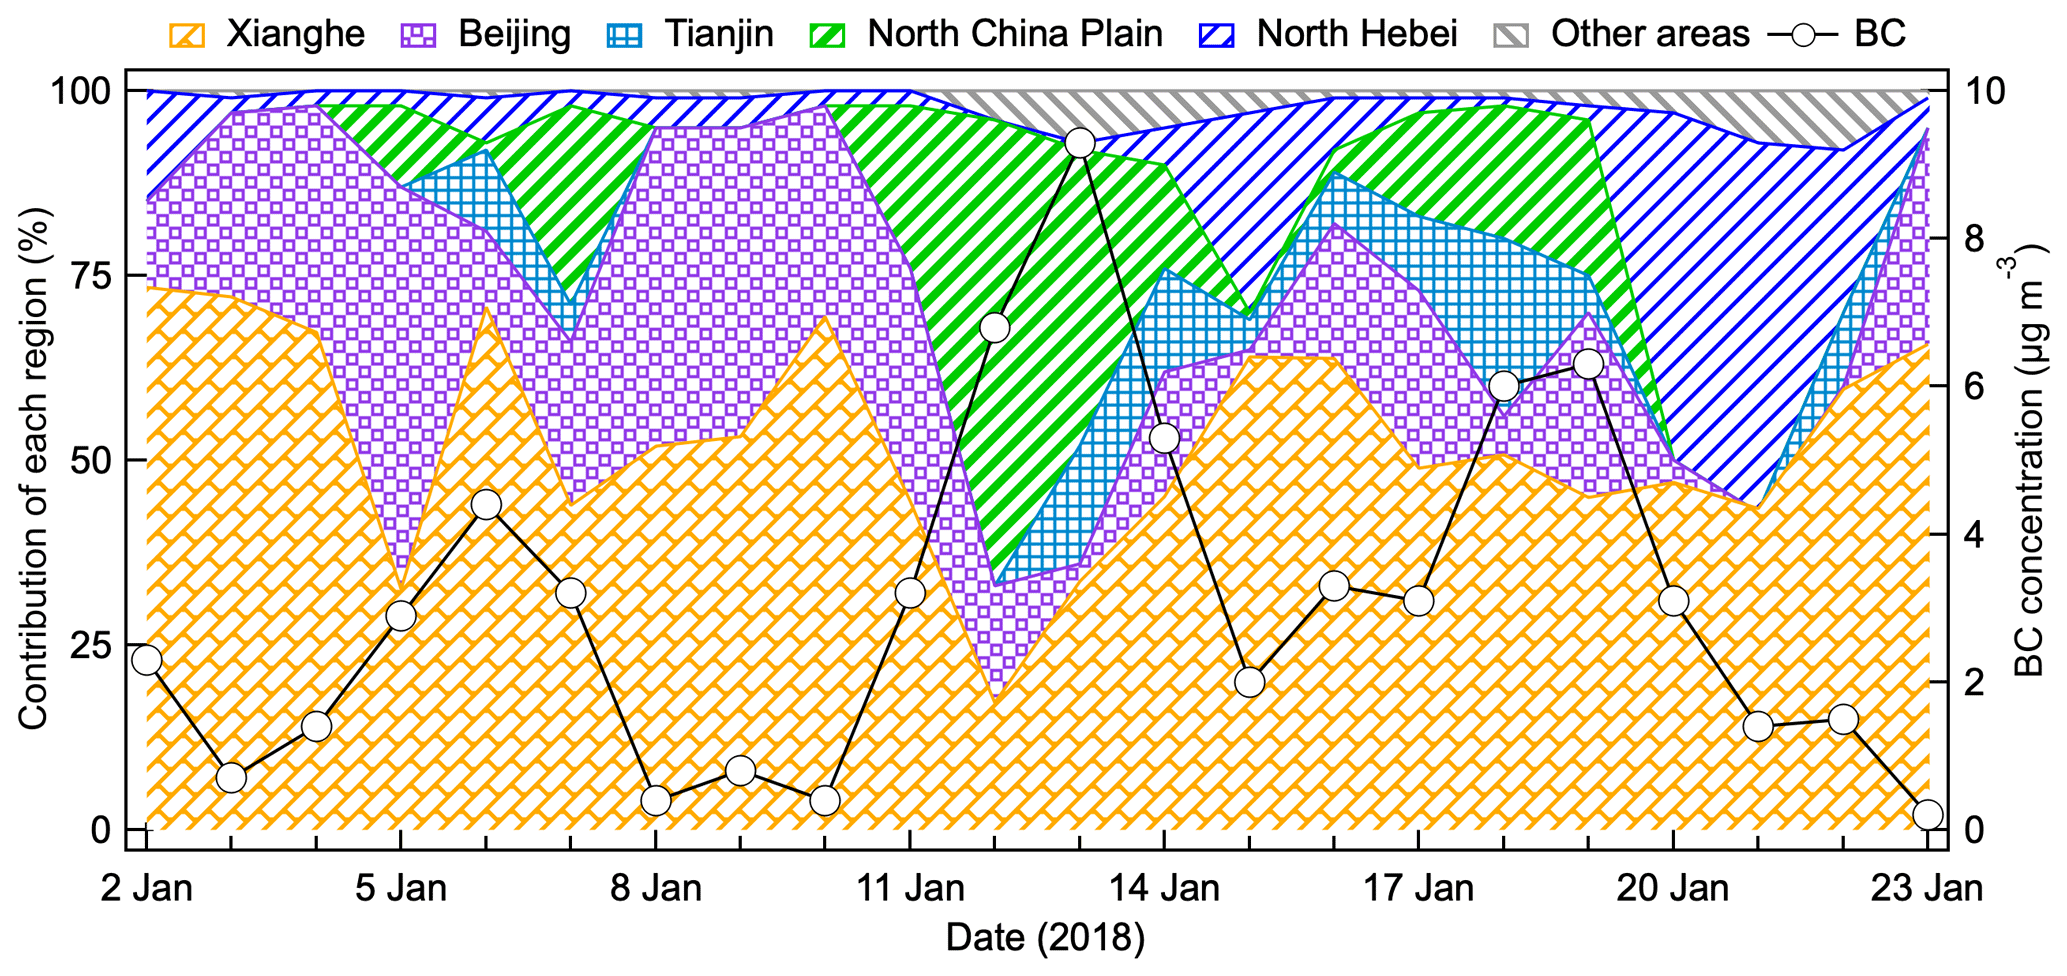
Figure 5Time series of the mass concentration of black carbon (BC) and the contribution of each source region to the total BC loading from 2 to 23 January, 2018.
Local emissions (53 %) contributed more to BC mass compared to regional transport (47 %). Furthermore, regional transport could be divided into 20 % from Beijing, 5 % from Tianjin, 11 % from the NCP, 9 % from northern Hebei, and 2 % from other regions. Figure 6 shows the correlations between total BC mass and the contributions of each source region. Local emission contributions were negatively correlated with total BC loading (Fig. 6a). This finding shows the increasing importance of regional transport at high BC episode. Among the regional transport areas, the contributions of Tianjin and NCP exhibited a positive correlation with total BC loading (Fig. 6c and d) suggesting their important roles in BC pollution at the sampling site.
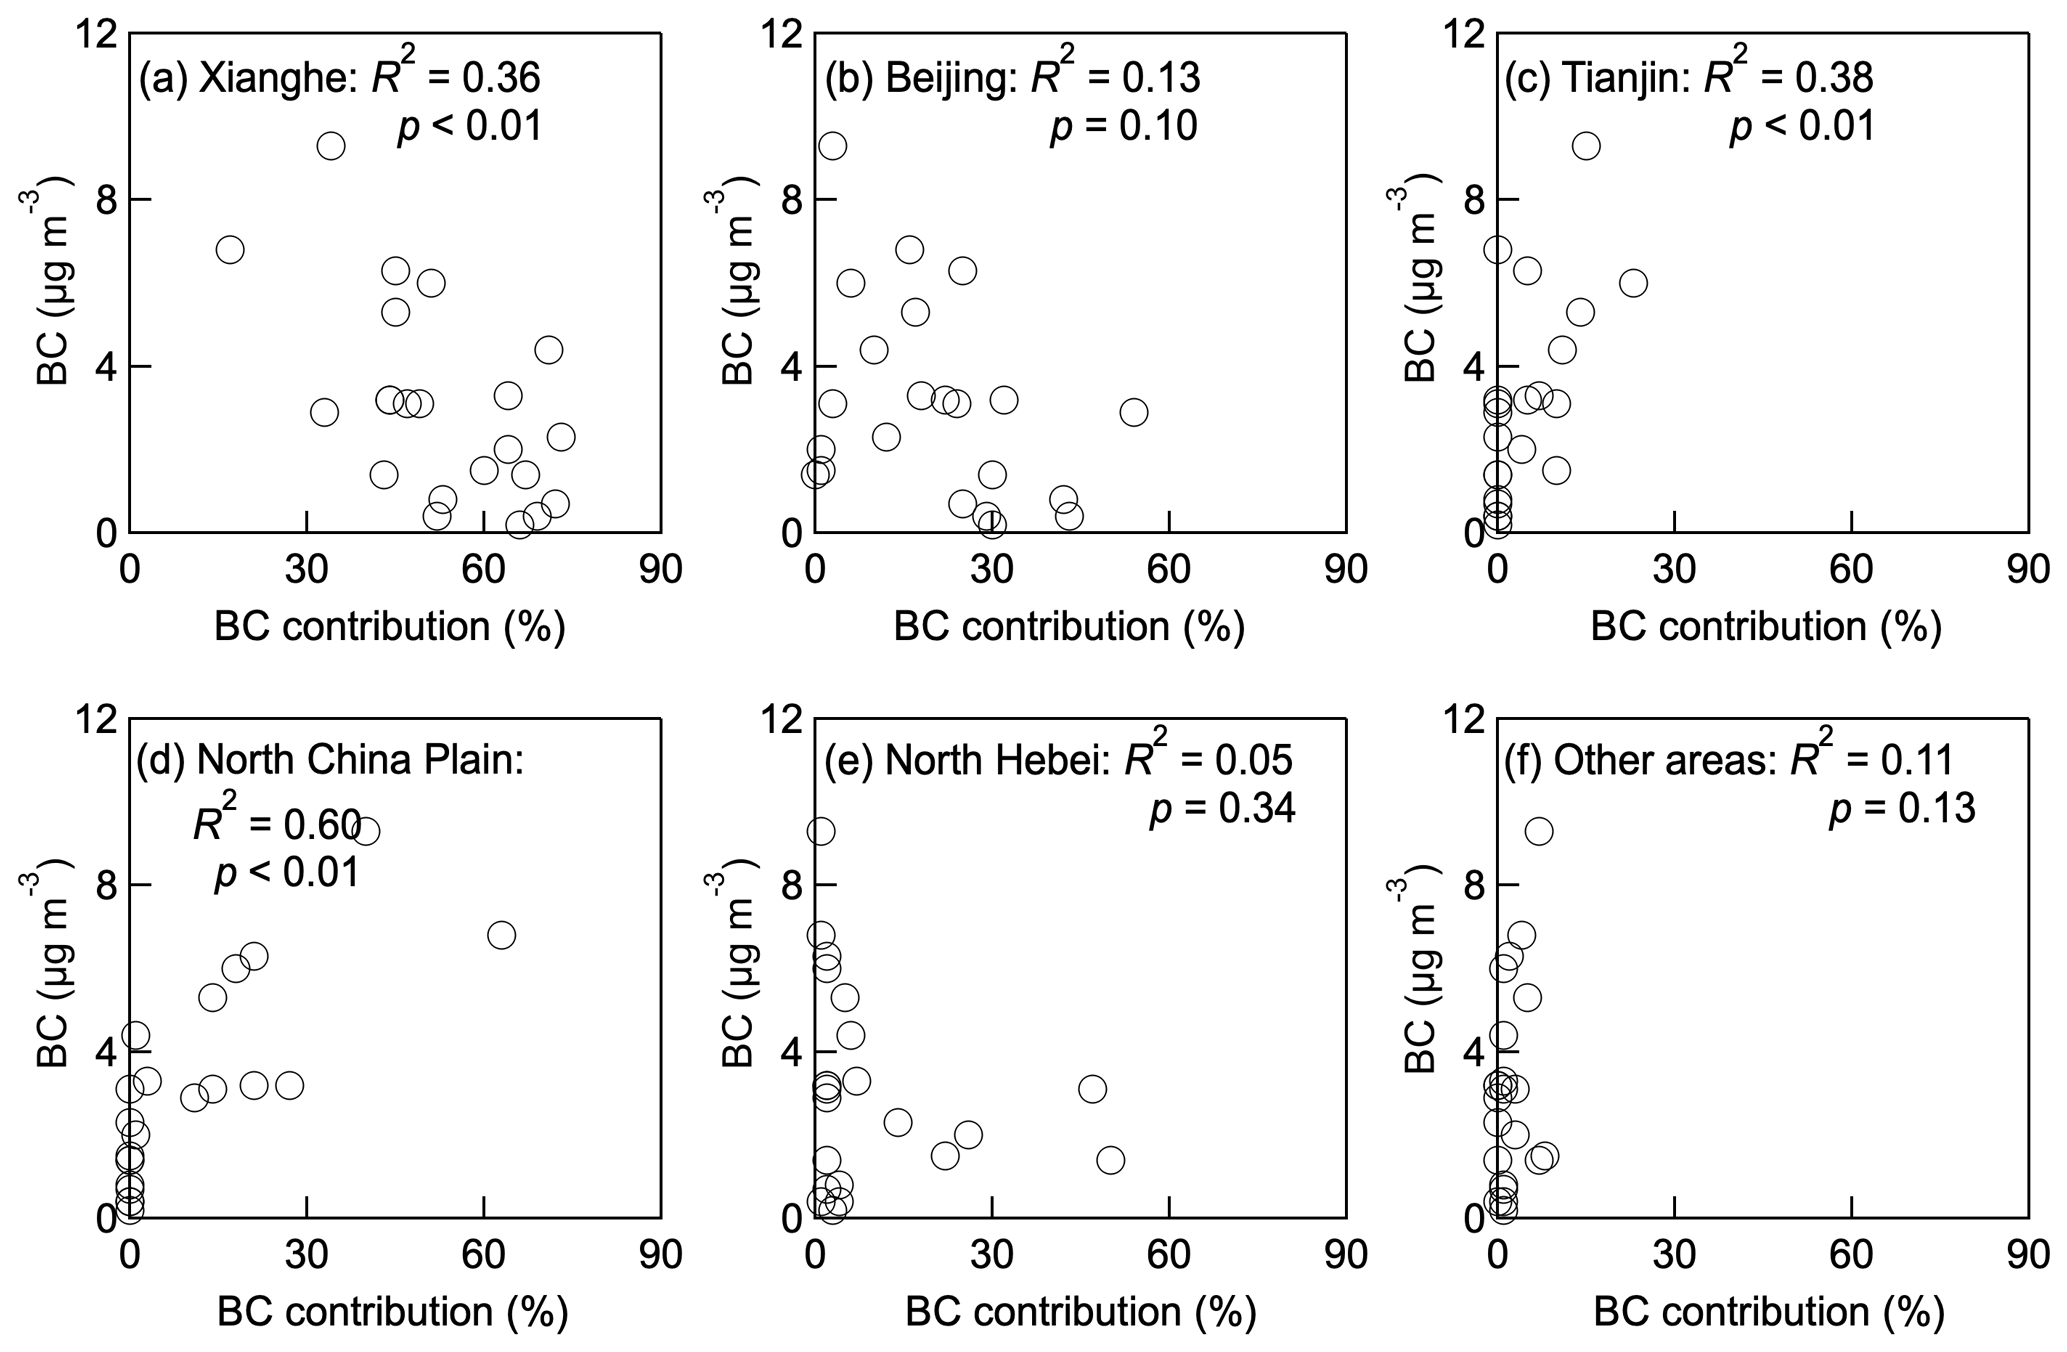
Figure 6Scatter plots of the mass concentrations of total black carbon (BC) versus the BC contributions of different source regions obtained by WRF-Chem model.
A high BC loading episode was recorded on 12–13 January and was taken as an example to explore the formation process of regional pollution (Fig. 7). On 11 January before BC pollution, strong northwesterly winds prevailed in the north of Xianghe. About 44 % and 32 % of the total BC mass was contributed by Region 1 (local emissions) and Region 2 (Beijing), respectively. Afterwards, the winds turned to the southwest and passed over the NCP region on 12 January. The mass concentration of BC increased sharply. Regional transport contributed to 83 % of the total BC mass, of which the NCP region accounted for 63 % (Fig. 5). On 13 January, the winds switched towards the south over the NCP region but decreased near the sampling site. Therefore, the contribution of regional transport reduced to 66 % of the total BC mass with 40 % from NCP region and 15 % from Tianjin (Fig. 5). On 14 January, the winds turned to the northwest, and the mass concentration of BC decreased gradually. Finally, the high BC pollution episode dissipated.
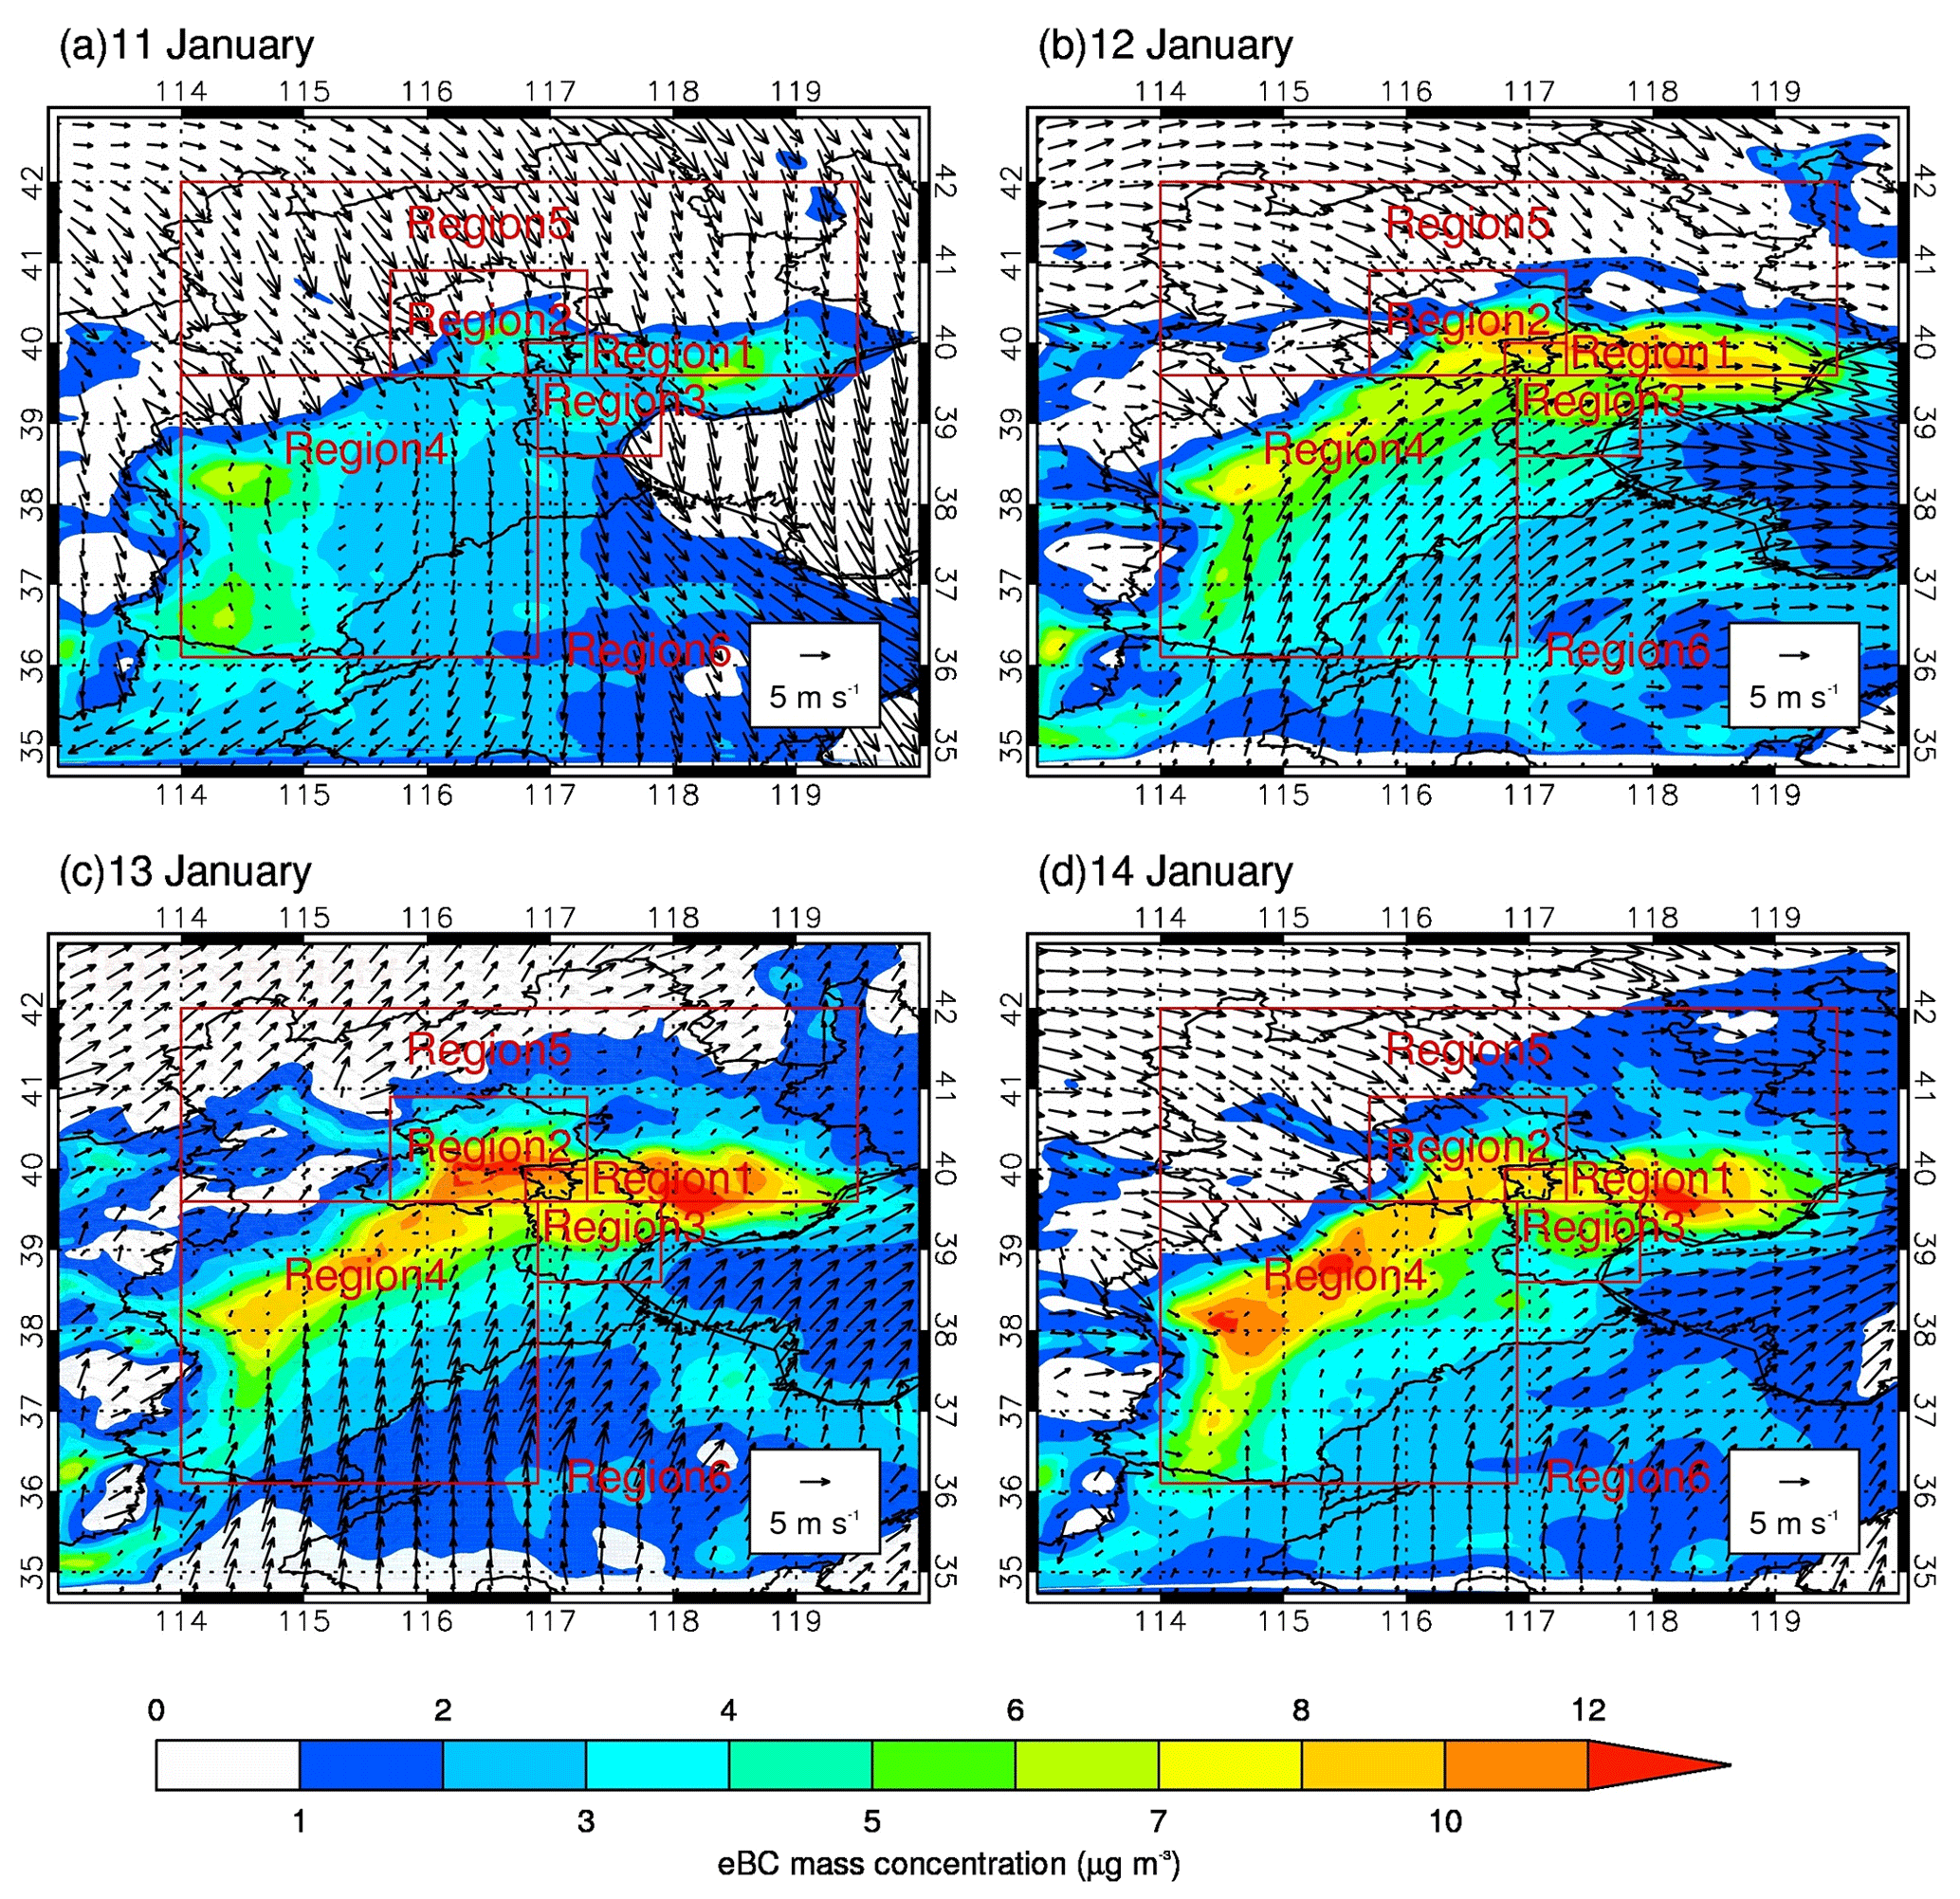
Figure 7Distributions of the daily average mass concentrations of black carbon (eBC) (µg m−3, represented by the color bar) at Xianghe and surrounding areas from 11 to 14 January 2018 simulated by WRF-Chem model. The arrow denotes the wind speed. The red rectangles represent different source regions, of which Region 1 is Xianghe, Region 2 is Beijing, Region 3 is Tianjin, Region 4 is the North China Plain, Region 5 is northern Hebei Province, and Region 6 is other areas outside of Regions 1–5.
3.3 Chemical composition of EC-containing particles
The chemical compositions of EC-containing particles were determined using a SPAMS. A total of 454 433 particles whose mass spectra had obvious carbon fragment ions (e.g., , ±24, ±36, ±48, ±60, and so on) were identified as EC-containing particles. Six particle categories, EC-OCSOx, EC-NaK, EC-KSOxNOx, EC-BB, pure-EC, and EC-others, were classified based on their mass spectral feature. The average mass spectral pattern of each class is shown in Fig. 8, and the contribution of each class to the total EC-containing particles is summarized in Table 2.
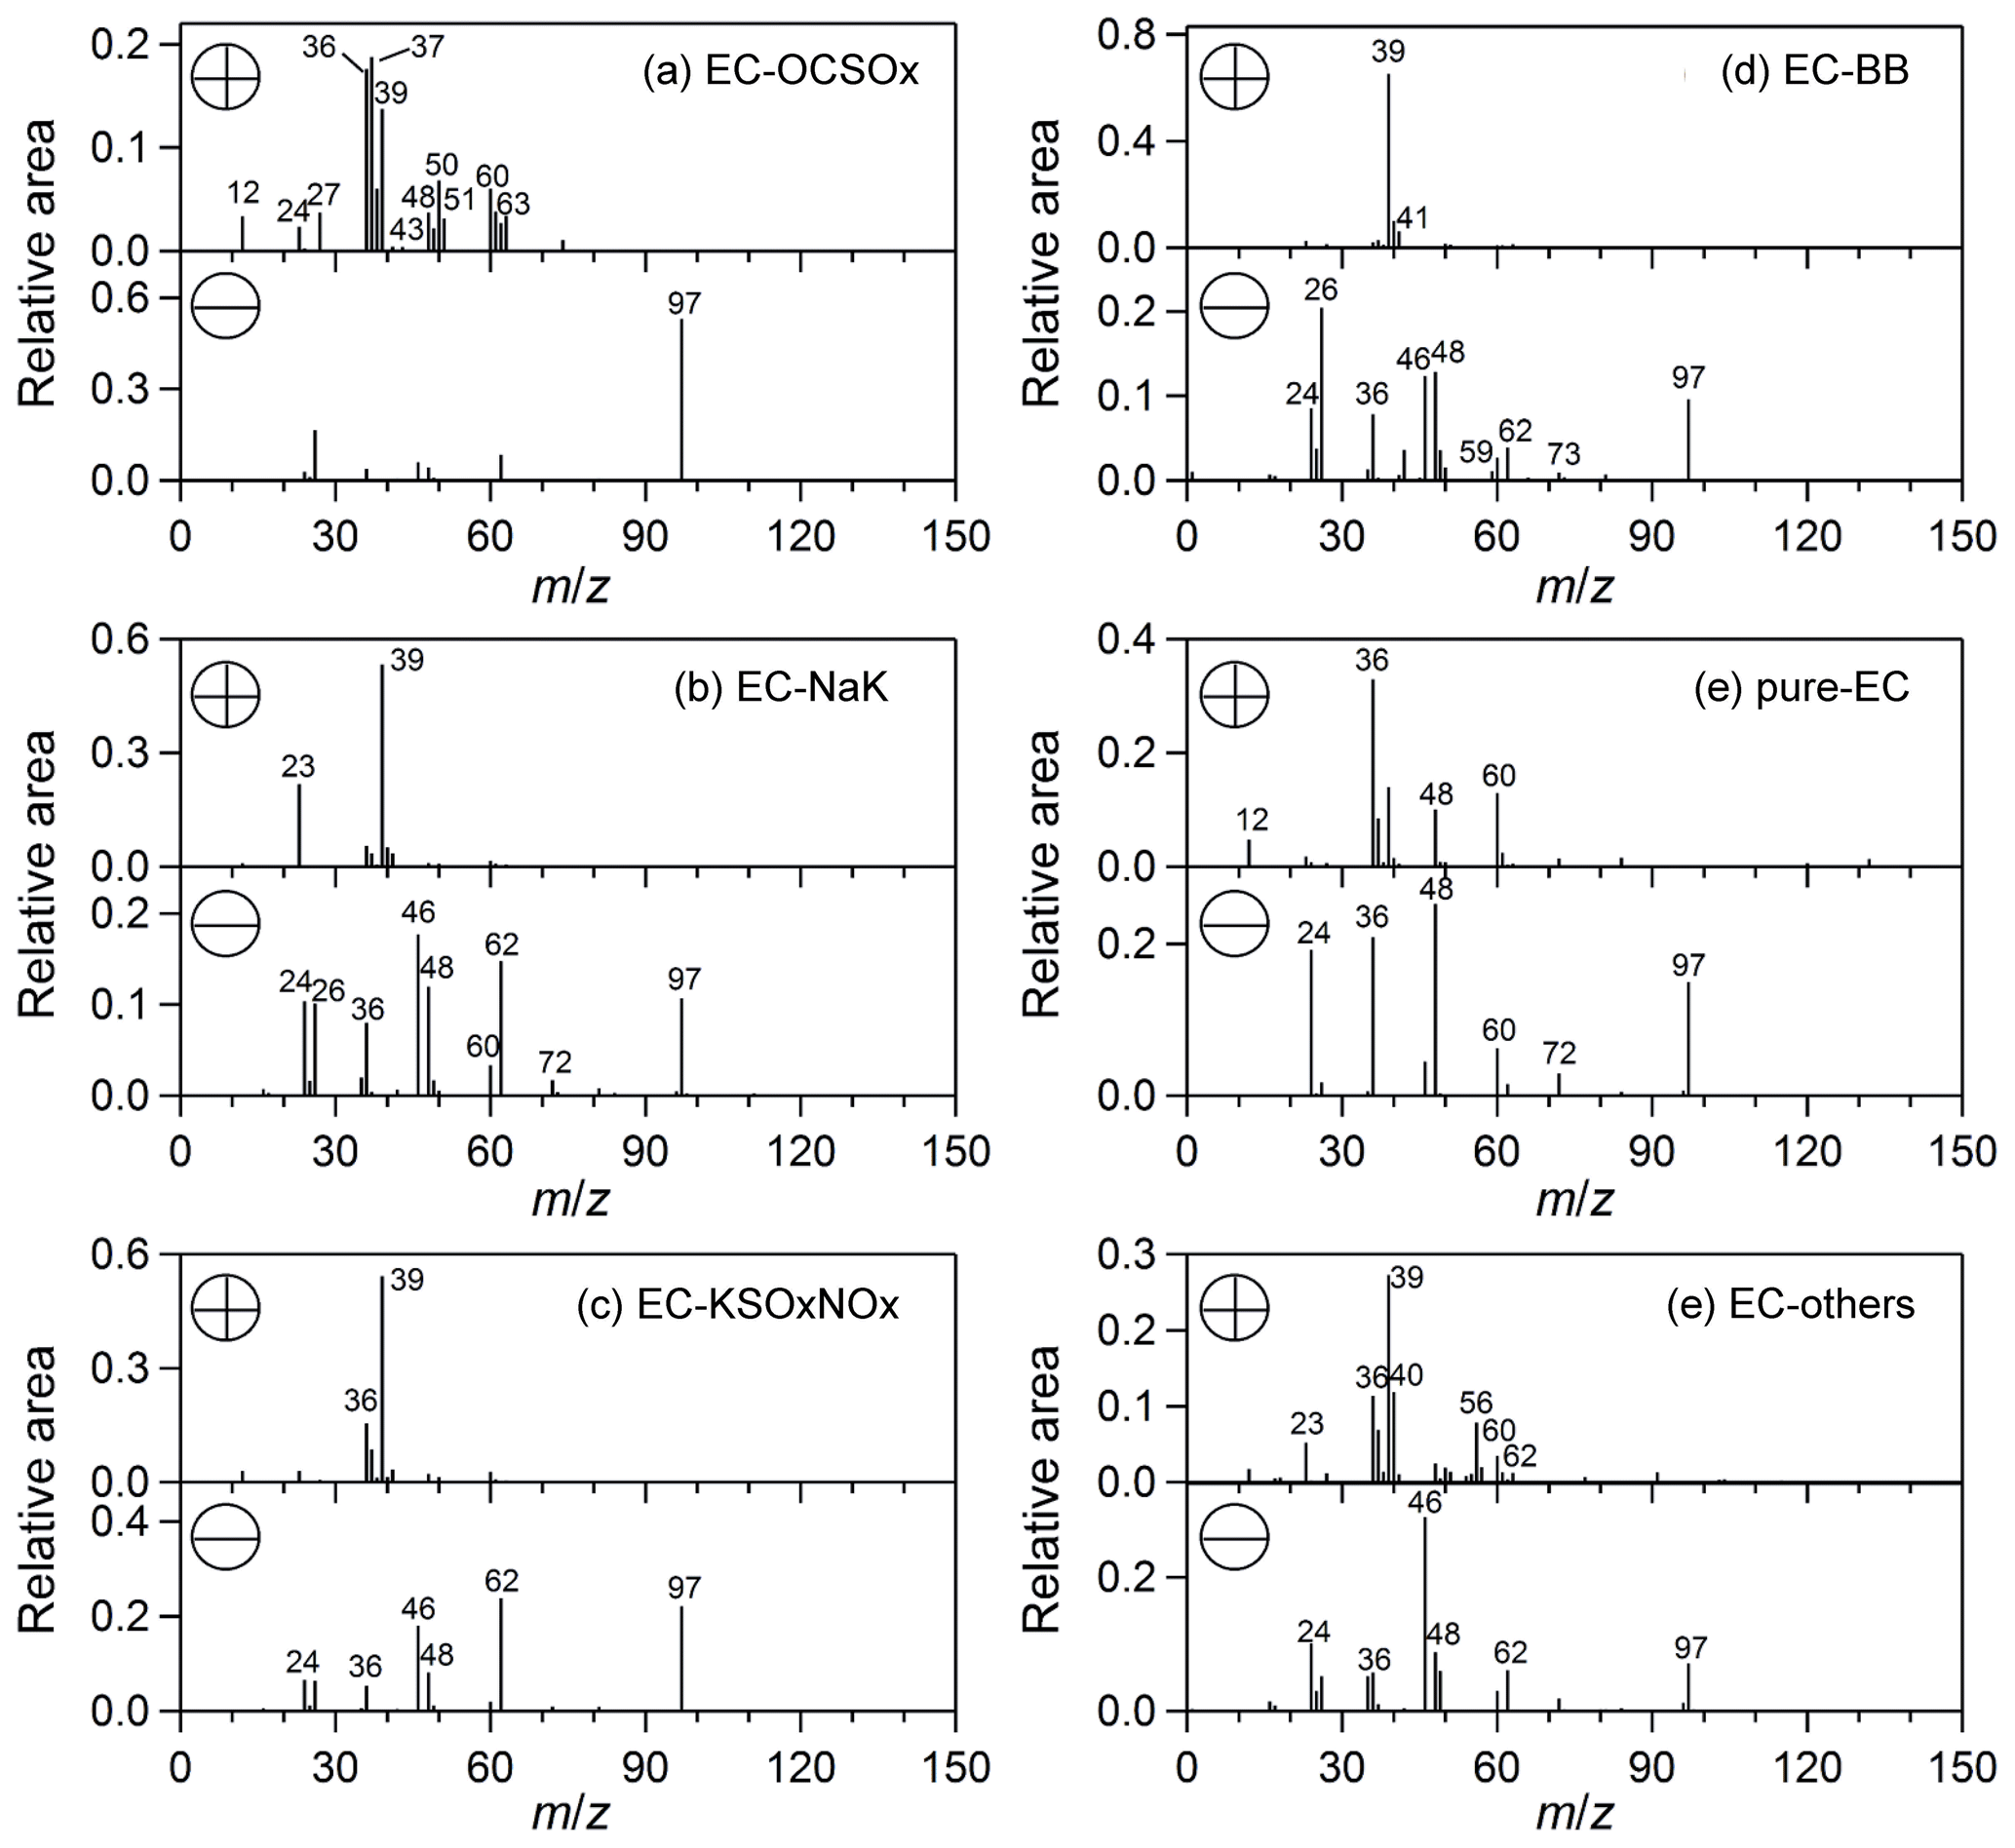
Figure 8Average mass spectral pattern of six types of elemental carbon (EC)-containing particles.
Table 2Summary of names, numbers, and fractions of six types of elemental carbon (EC)-containing particles determined by a single-particle aerosol mass spectrometer.
The EC-OCSOx particles were characterized by obvious signals of organic carbon (OC) (e.g., 37C3H+, , , , , and 63(CH3)2NH2OH+) in the positive mass spectrum and strong sulfate signal () in the negative mass spectrum. This group exhibited the highest contribution to the total EC-containing particles (52 %, Table 2), indicating that EC was mainly coated with OC and sulfate. The presence of 43C2H3O+, a marker denoting the oxidized organics (Gunsch et al., 2018), and implied that EC-OCSOx underwent a certain degree of atmospheric aging. Figure 9 shows the number of fractions of each class of EC-containing particles at different ranges of eBClff and eBCsf. The EC-OCSOx number fraction increased as eBCsf increased. In contrast, it dropped when eBClff was higher than the value of the 75th percentile of eBClff. This indicated a greater impact of solid fuel source on EC-OCSOx at a high eBC loading environment compared to the liquid fossil fuel source. The diurnal variations in EC-OCSOx number fraction exhibited an upward trend at night after 19:00 LT (Fig. 10). This may be attributed to intensive domestic heating activities in the surrounding rural areas.
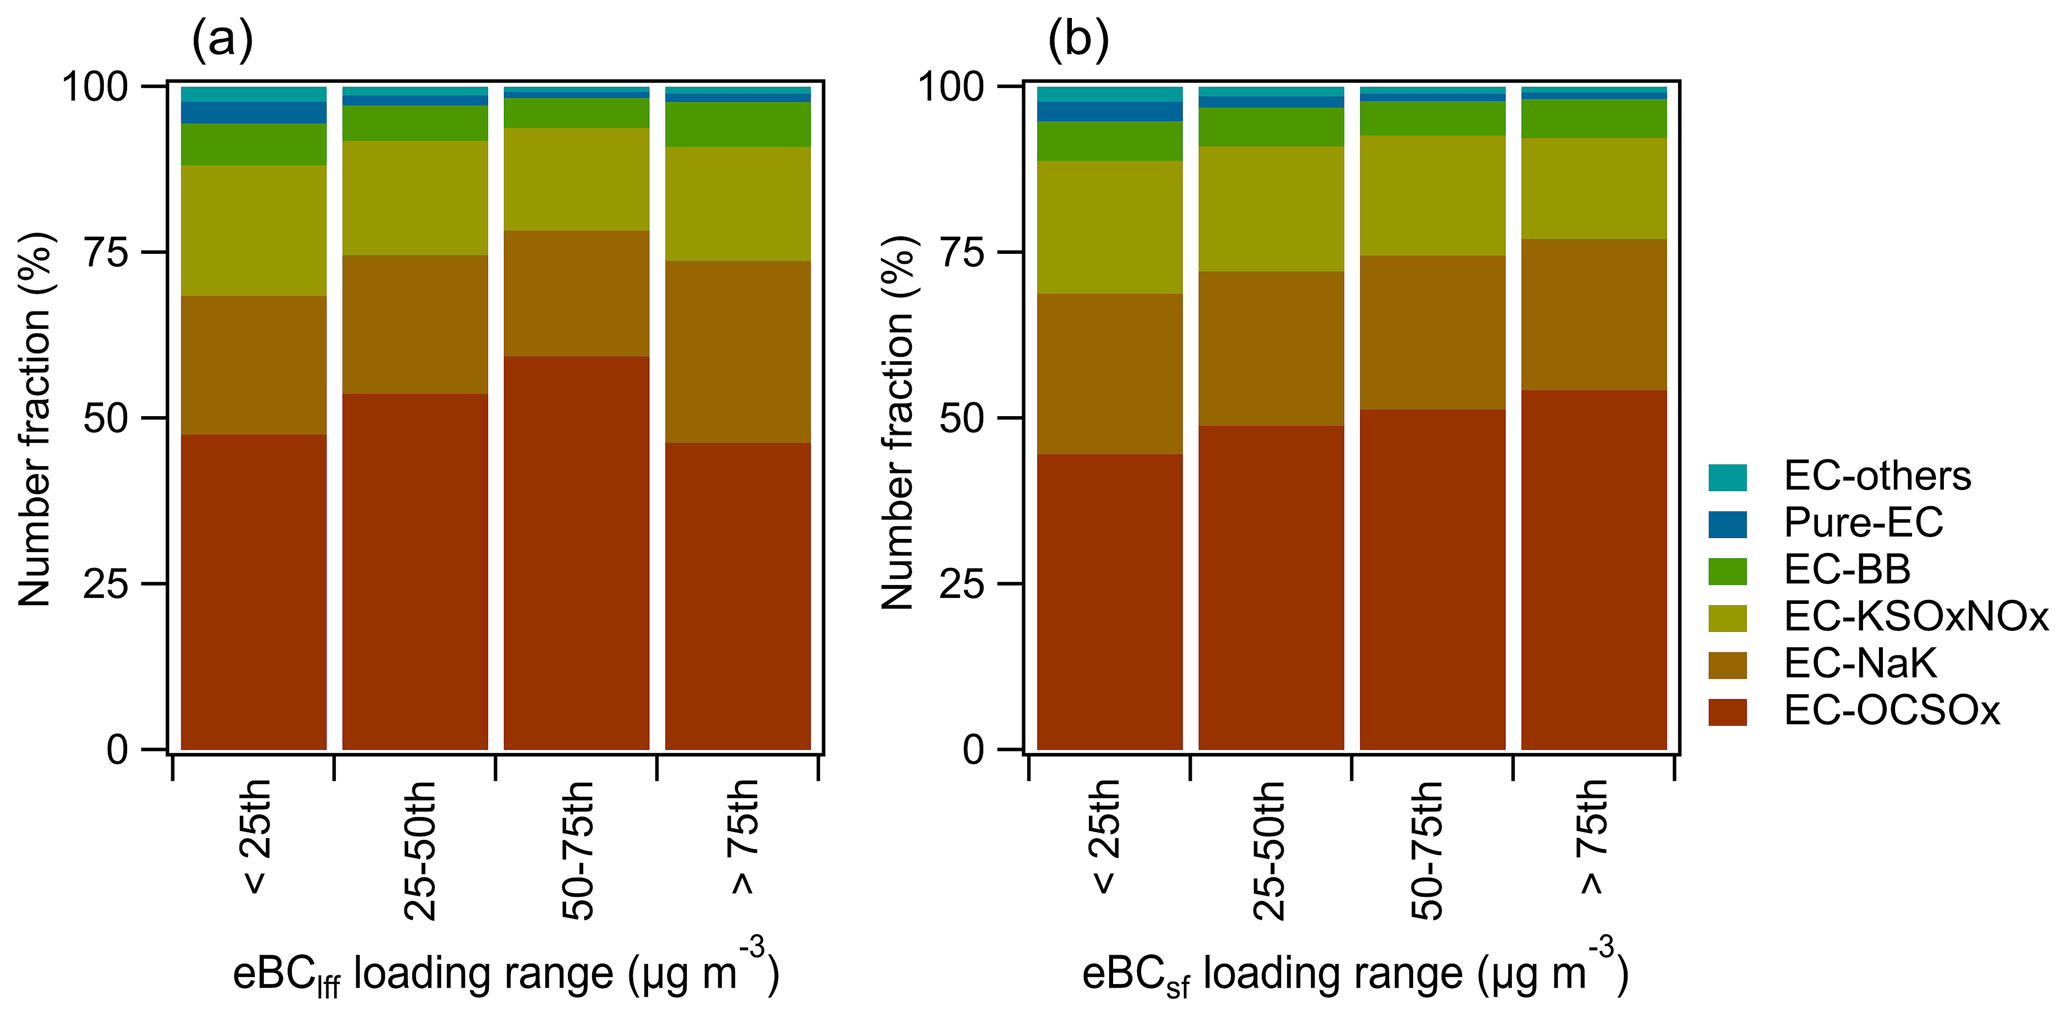
Figure 9Number fractions of elemental carbon (EC)-containing particle classes at different loading ranges of equivalent black carbon (eBC) from sources of (a) liquid fossil fuels (eBClff) and (b) solid fuels (eBCsf). The 25, 50, and 75 denote the 25 %, 50 %, and 75 % percentiles, respectively.
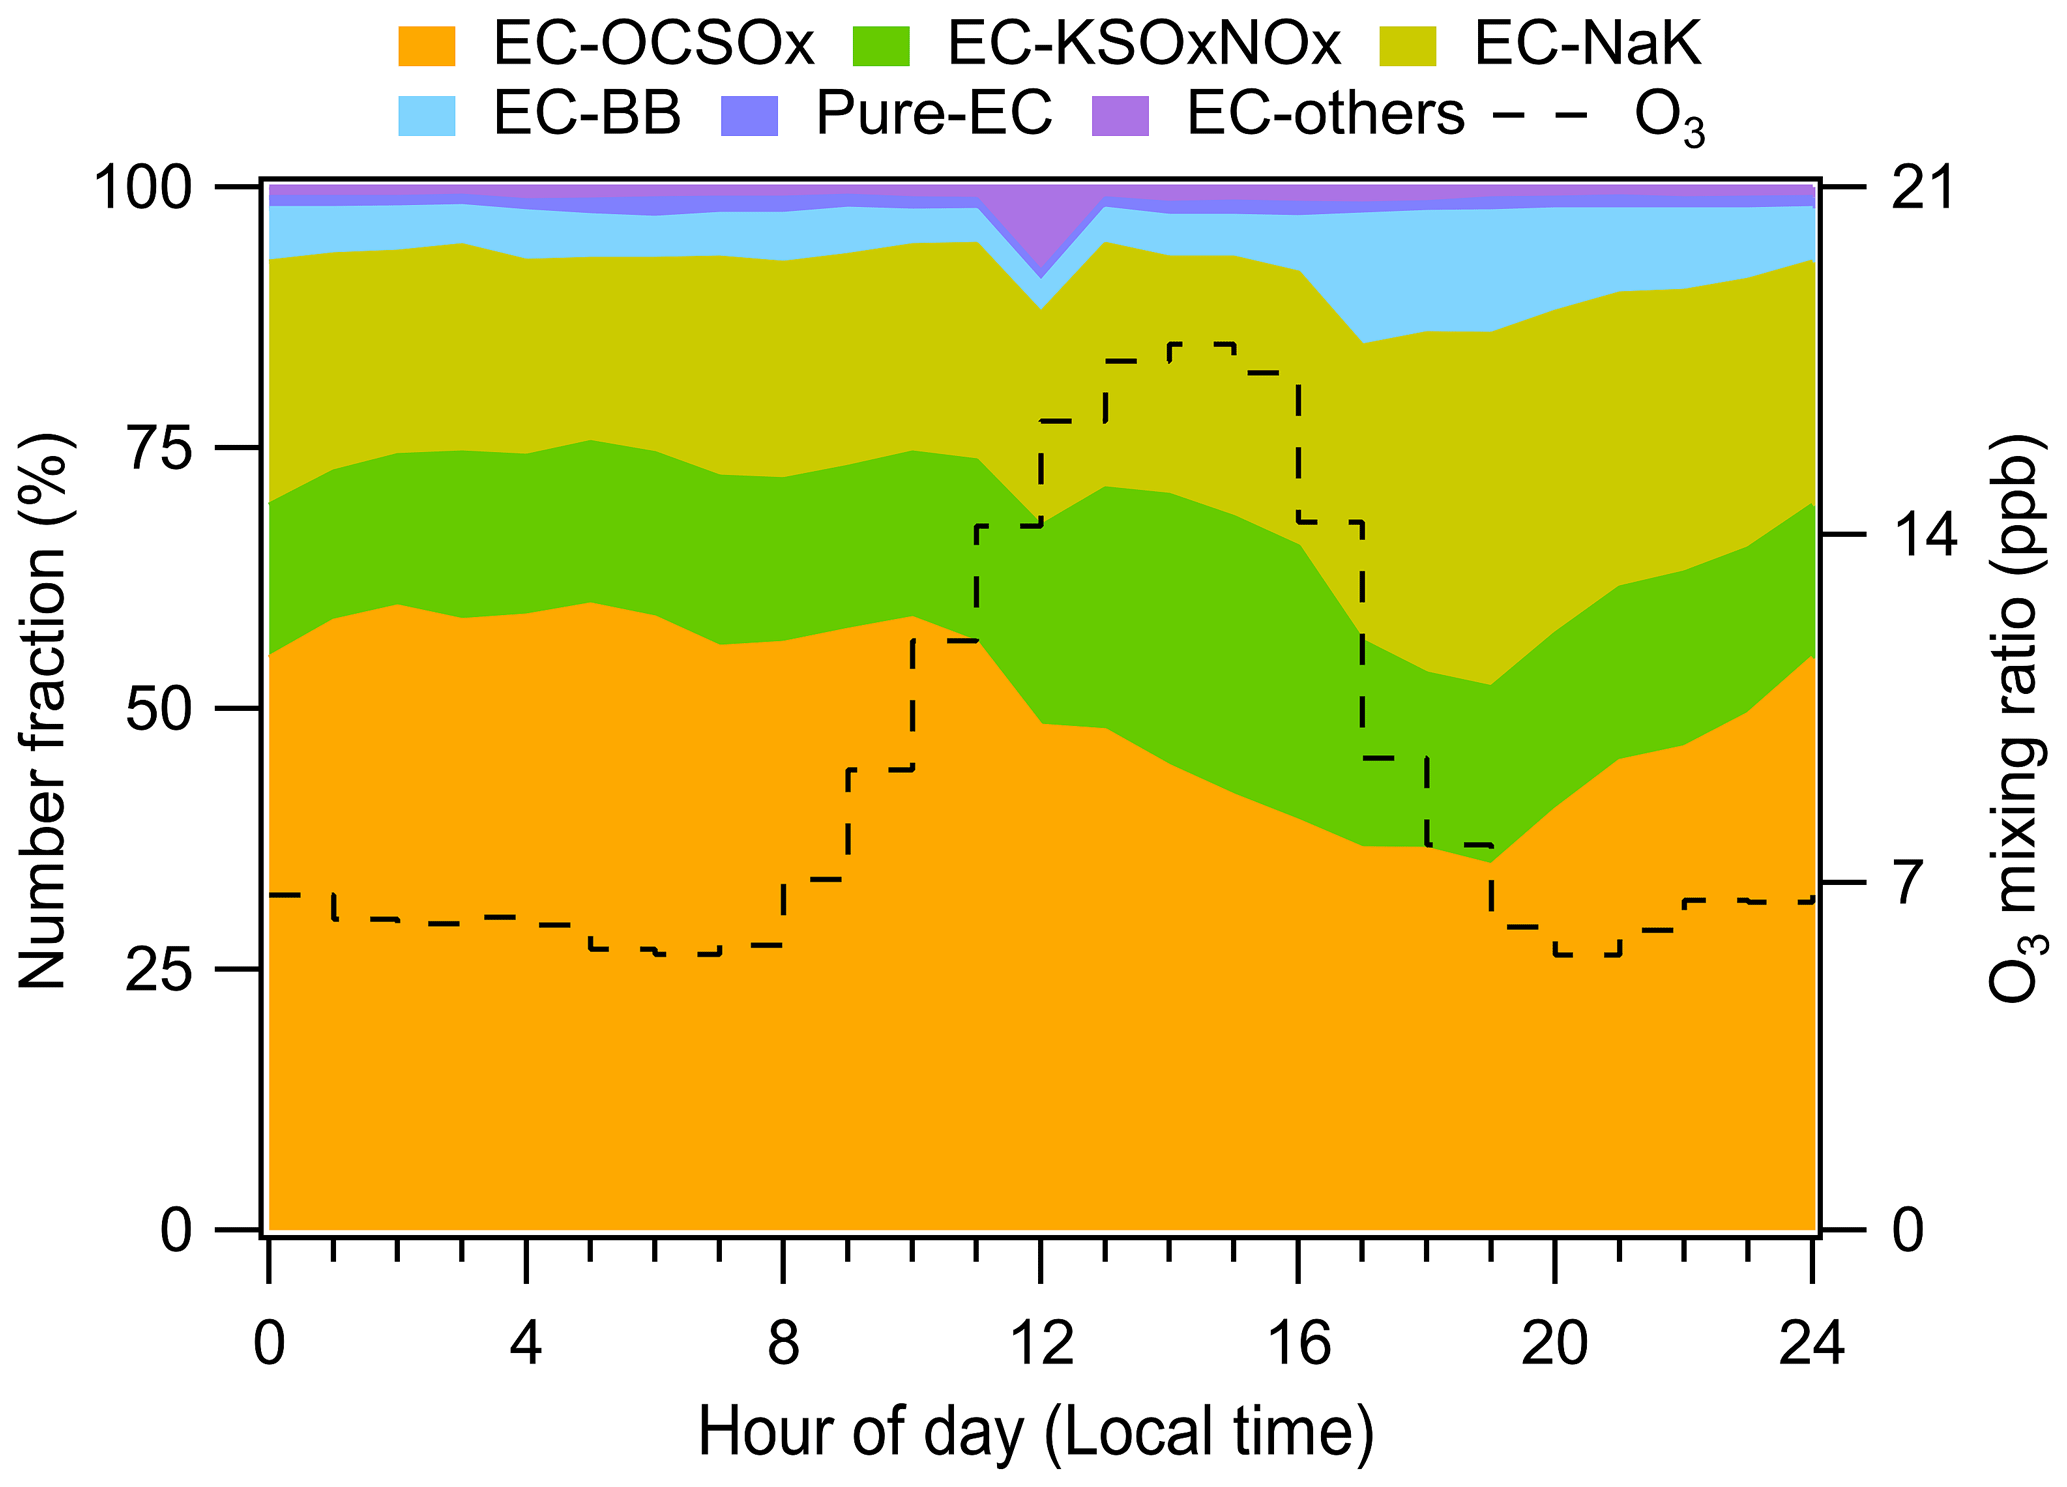
Figure 10Diurnal patterns of number fraction of six types of elemental carbon (EC)-containing particles and ozone (O3) mixing ratio.
The EC-NaK particles presented strong signals of 23Na+ and 39K+ in the positive mass spectrum and less intense signals of 26CN−, , , and in the negative mass spectrum. This group exhibited the second largest contribution to total EC-containing particles (24 %, Table 2). Intense signals of carbon fragment ions (m∕z 24, 36, 48, 60, and 72) were observed in the negative mass spectrum. This indicated that EC-NaK particles were freshly emitted. Additionally, larger signals were found for nitrate compared to sulfate in the negative mass spectrum. However, their signals were low. This finding was consistent with the motor vehicle emissions, which were shown to contain substantial nitrogen oxides (May et al., 2014). The number fraction of EC-NaK increased with an increase in eBClff but kept stable with eBCsf as shown in Fig. 9. These results demonstrate that EC-NaK was more likely associated with fresh traffic emissions than from solid fuels.
The EC-KSOxNOx particles exhibited strong 39K+ signal in the positive mass spectrum and intense , , and signals in the negative mass spectrum. This group accounted for 17 % of the total EC-containing particles (Table 2). The high signal intensities of nitrate and sulfate indicated that EC-KSOxNOx particles underwent substantive atmospheric aging processes. As shown in Fig. 10, the number fraction of the EC-KSOxNOx class was the only one that increased in the afternoon. This finding was consistent with the increase of ozone (O3) as measured by an ultraviolet photometric Model 49i O3 analyzer (Thermo Fisher Scientific, San Jose, CA, USA). This indicated that EC particles were more likely to be coated with sulfate and nitrate in high-oxidation environments. The strong 39K+ ion signal in EC-KSOxNOx particles implied a partial influence of emissions from biomass burning (Bi et al., 2011).
The EC-BB particles were characterized by signals in the positive mass spectrum and 26CN−, , and signals in the negative mass spectrum. It accounted for 6 % of the total EC-containing particles as shown in Table 2. Several levoglucosan , , and signals were also found in the negative mass spectrum. They suggested a typical biomass-burning feature. Intense signals of negative carbon ion spectrum (e.g., , −36, and −48) and low signals of nitrate and sulfate indicated that EC-BB particles underwent low aging atmospheric processes.
The pure-EC particles were characterized by EC fragment ions (e.g., , ±36, ±48, ±60, and ±72). The low nitrate and sulfate ion signals in pure-EC indicated that they were freshly emitted. This group exhibited minor contributions to the total EC-containing particles (1 %, Table 2). The particles of EC-others were characterized by some metallic signals (e.g., 40Ca+, , and 62FeO+) and aromatic signatures (e.g., , , , and ) in the positive mass spectrum and strong signal (m∕z 46) in the negative mass spectrum. This indicated that EC-others underwent a certain degree of atmospheric aging and internally mixed with metals and aromatic compounds. This class accounted for 1 % of the total EC-containing particles (Table 2).
3.4 Implications for radiative effect
Figure 11 shows the eBC DRE variations as estimated by the SBDART model. The variations in eBC DRE were highly correlated with eBC burden on each day. Due to the decrease in radiative energy reaching the surface, eBC exhibited a DRE range of −1.9 to −27.9 W m−2 with an average of W m−2 at the ES indicating a cooling effect. In contrast, eBC exhibited a DRE range of +0.6 to +20.8 W m−2 with an average of W m−2 at the TOA, indicating a net energy gain and warm effect. This was attributed to the strong BC light absorption property that can impede the backscattered radiation reaching the TOA. The eBC DRE at the TOA in this study was comparable to the value over the NCP region (+6 to +8 W m−2, Li et al., 2016).
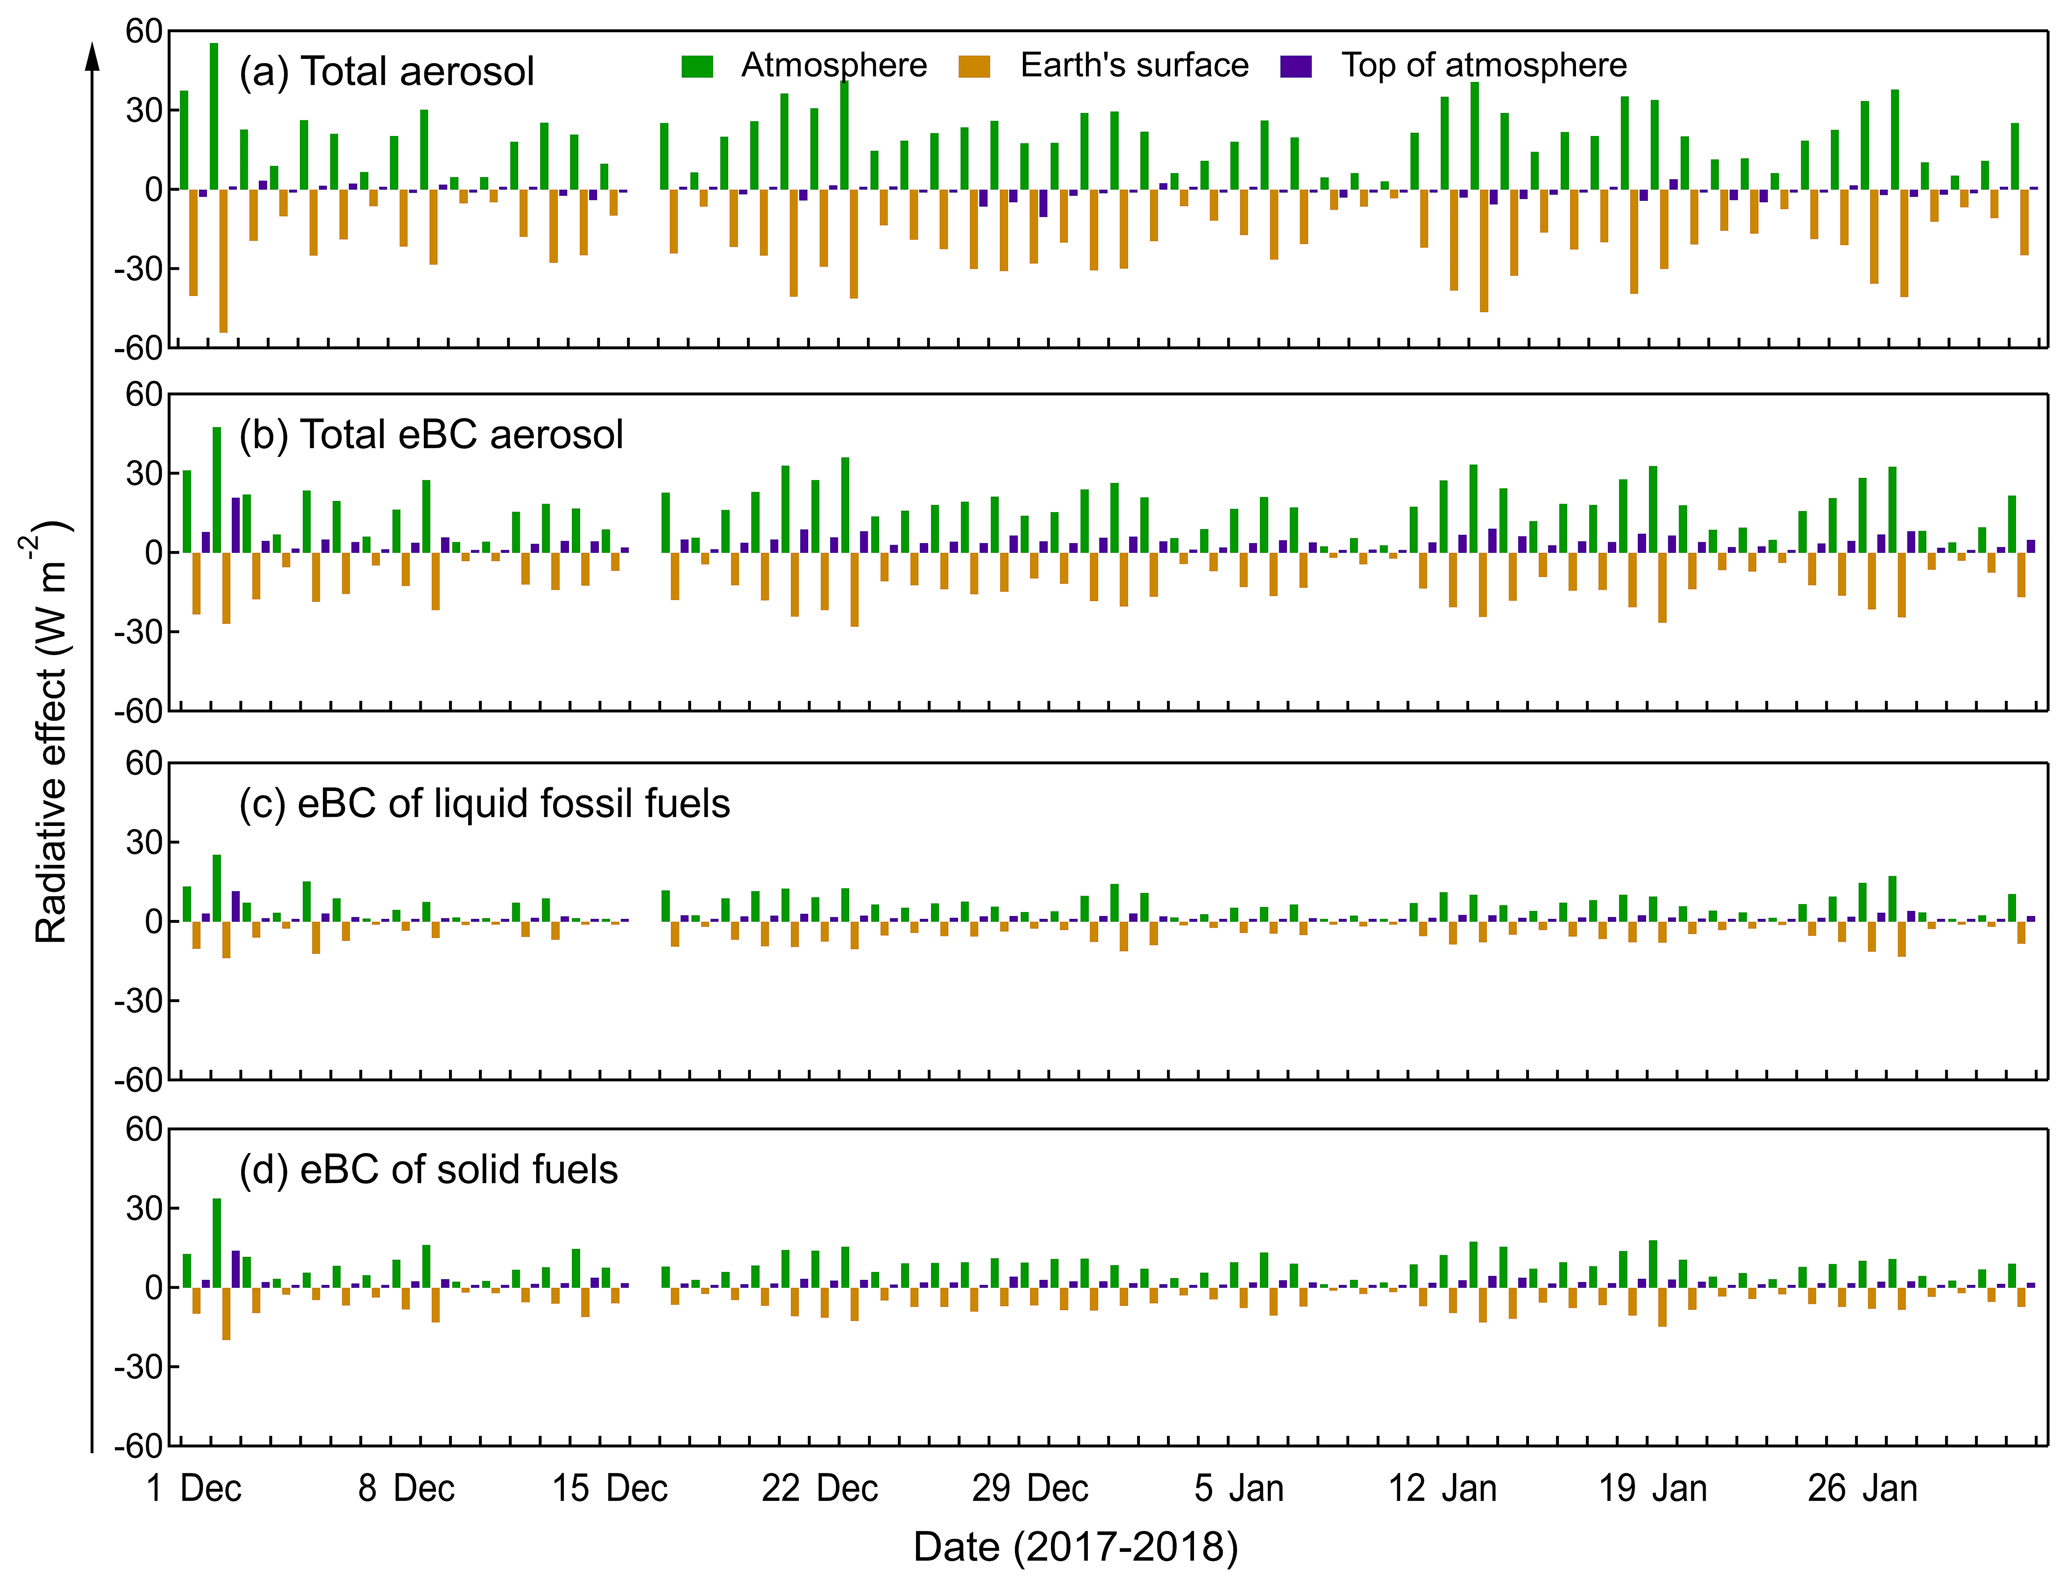
Figure 11Time series of hourly averaged direct radiative effect caused by (a) total aerosol and (b) equivalent black carbon (eBC), as well as eBC of (c) liquid fossil fuels and (d) solid fuels at the Earth's surface, the top of the atmosphere, and in the atmosphere.
The difference between eBC DRE at the TOA and ES gave an atmospheric DRE (a net atmospheric absorption) of W m−2. This corresponded to a heating rate of 0.5 K d−1. The eBC DRE in the atmosphere accounted for 86 % of the total aerosol DRE (+21.0 W m−2), suggesting that eBC exhibited a significant impact on perturbing the Earth–atmosphere radiative balance. The atmospheric heating in conjunction with the surface reduction in solar flux may aggravate the low-level inversion. This can lead to a slowdown of thermal convection and in turn reduce the cloud formation process (Chou et al., 2002). Compared to previous DRE obtained from the SBDART model, the atmospheric DRE derived by eBC values in this study ( W m−2) was comparable to that of southern China (+17.0 W m−2, Huang et al., 2011) but was lower than that of northwestern China (+16.6 to +108.8 W m−2, Zhao et al., 2019). In addition to the varying BC burden in different areas, the BC measurement techniques used in different studies may also contribute to the differences in BC DRE calculations.
As shown in Fig. 11c and d, the mean eBC DRE caused by the sources of liquid fossil fuels (solid fuels) was −7.0 W m−2 (−5.4 W m−2) at the ES and +2.1 W m−2 (+1.7 W m−2) at the TOA. It produced an atmospheric DRE of +9.1 W m−2 (+7.1 W m−2). Due to a stronger eBC DRE, the average heating rate (0.3 K d−1) of the atmosphere caused by liquid fossil fuel sources was 33 % more than that of solid fuels (0.2 K d−1). Although larger eBC DRE was found for liquid fossil fuel sources, its atmospheric DRE generated per unit eBC mass concentration (3.6 (W m−2) (µg m−3)−1) was 81 % smaller compared to that of solid fuels (6.5 (W m−2) (µg m−3)−1). This implies that reduction in eBC from solid fuel emissions may be a more effective way to mitigate regional warming in the NCP region and that eBC from motor vehicle emissions should also be controlled.
The sources, coating composition, and radiative effects of BC were investigated during winter in the last year of the APPCAP at a regional site in the NCP. Based on the source-specific AAEs (AAElff=1.3 and AAEsf=2.8), about 69 % of eBC was contributed by liquid fossil fuel sources while the rest (31 %) was contributed by solid fuel sources using a multi-wavelength optical method. Both eBClff and eBCsf exhibited peaks at 08:00 and 19:00 LT. Due to rigorous regulations, the dominant eBC source in winter NCP may be changed from past solid fuels to current liquid fossil fuels. The WRF-Chem model showed that local emissions (53 %) were the largest contributors to BC loading on average, followed by Beijing (20 %), Tianjin (5 %), the NCP (11 %), northern Hebei (9 %), and other regions (2 %).
Among the six classes of EC-containing particles, EC-OCSOx was the largest contributor (52 %). The presence of 43C2H3O+ and in this particle implied that it underwent a certain degree of atmospheric aging processes. Solid fuel sources exhibited a greater impact on EC-OCSOx at a high eBC loading environment compared to liquid fossil fuels. EC-NaK was the second largest contributor to total EC-containing particles (24 %). This class was more associated with fresh traffic emissions than with solid fuels. EC-KSOxNOx accounted for 17 % of the total EC-containing particles. This class was partially influenced by biomass-burning emissions and underwent substantive atmospheric aging processes. The classes of EC-BB, pure-EC, and EC-others exhibited minor contributions to the total EC-containing particles (1 %–6 %).
The SBDART model showed that eBC induced a cooling effect of −13.6 W m−2 at the ES and a warming effect of +4.4 W m−2 at the TOA. The difference between eBC DRE at the TOA and ES gave the atmospheric forcing of W m−2. This produced a heating rate of 0.5 K d−1 on average. The atmospheric DRE of eBC had a contribution of 86 % to the forcing caused by total aerosols in the atmosphere. This suggested that BC exhibited a significant impact on perturbing the Earth–atmosphere radiative balance. From the eBC source perspective, the atmospheric eBC DRE was higher for liquid fossil fuel sources than solid fuel sources. However, the atmospheric DRE generated per unit of eBC mass concentration was larger for solid fuel sources. This indicates that a reduction in solid fuel eBC may be an effective way of mitigating regional warming in the NCP.
The data presented in this study are available at the Zenodo data archive https://doi.org/10.5281/zenodo.3923612 (Wang et al., 2020).
The supplement related to this article is available online at: https://doi.org/10.5194/acp-20-15427-2020-supplement.
QW and JC designed the campaign. QW and WR carried out the field measurements. YZ and WR conducted the source experiments. QW, LL, JZ, and JY analyzed the data. QW drafted the paper. All the authors reviewed and commented on the paper.
The author declares that there is no conflict of interest.
The authors are grateful to the staff from Xianghe Atmospheric Integrated Observatory for their assistance with field sampling. The authors also are grateful to the helpful comments from the editor and two anonymous referees.
The authors are grateful to the staff from Xianghe Atmospheric Integrated Observatory for their assistance with field sampling.
This research has been supported by Strategic Priority Research Program of Chinese Academy of Sciences (grant no. XDB40000000), the Natural Science Foundation of China (grant no. 21661132005), the Key Research and Development Program of Shaanxi Province (grant no. 2018-ZDXM3-01), the West Light Foundation of the Chinese Academy of Sciences (grant no. XAB2018B03), and the Youth Innovation Promotion Association of the Chinese Academy of Sciences (grant no. 2019402).
This paper was edited by Radovan Krejci and reviewed by two anonymous referees.
An, Z., Huang, R.-J., Zhang, R., Tie, X., Li, G., Cao, J., Zhou, W., Shi, Z., Han, Y., Gu, Z., and Ji, Y.: Severe haze in northern China: A synergy of anthropogenic emissions and atmospheric processes, P. Natl. Acad. Sci. USA, 116, 8657–8666, https://doi.org/10.1073/pnas.1900125116, 2019.
Arndt, J., Sciare, J., Mallet, M., Roberts, G. C., Marchand, N., Sartelet, K., Sellegri, K., Dulac, F., Healy, R. M., and Wenger, J. C.: Sources and mixing state of summertime background aerosol in the north-western Mediterranean basin, Atmos. Chem. Phys., 17, 6975–7001, https://doi.org/10.5194/acp-17-6975-2017, 2017.
Bi, X., Zhang, G., Li, L., Wang, X., Li, M., Sheng, G., Fu, J., and Zhou, Z.: Mixing state of biomass burning particles by single particle aerosol mass spectrometer in the urban area of PRD, China, Atmos. Environ., 45, 3447–3453, https://doi.org/10.1016/j.atmosenv.2011.03.034, 2011.
Bond, T. C., Doherty, S. J., Fahey, D. W., Forster, P. M., Berntsen, T., DeAngelo, B. J., Flanner, M. G., Ghan, S., Kaercher, B., Koch, D., Kinne, S., Kondo, Y., Quinn, P. K., Sarofim, M. C., Schultz, M. G., Schulz, M., Venkataraman, C., Zhang, H., Zhang, S., Bellouin, N., Guttikunda, S. K., Hopke, P. K., Jacobson, M. Z., Kaiser, J. W., Klimont, Z., Lohmann, U., Schwarz, J. P., Shindell, D., Storelvmo, T., Warren, S. G., and Zender, C. S.: Bounding the role of black carbon in the climate system: A scientific assessment, J. Geophys. Res.-Atmos., 118, 5380–5552, https://doi.org/10.1002/jgrd.50171, 2013.
Boiyo, R., Kumar, K. R., Zhao, T., and Guo, J.: A 10-year record of aerosol optical properties and radiative forcing over three environmentally distinct AERONET sites in Kenya, East Africa, J. Geophys. Res.-Atmos., 124, 1596–1617, https://doi.org/10.1029/2018JD029461, 2019.
Briggs, N. L. and Long, C. M.: Critical review of black carbon and elemental carbon source apportionment in Europe and the United States, Atmos. Environ., 144, 409–427, https://doi.org/10.1016/j.atmosenv.2016.09.002, 2016.
Cheng, Y., Lee, S. C., Ho, K. F., Chow, J. C., Watson, J. G., Louie, P. K. K., Cao, J. J., and Hai, X.: Chemically-speciated on-road PM2.5 motor vehicle emission factors in Hong Kong, Sci. Total Environ., 408, 1621–1627, https://doi.org/10.1016/j.scitotenv.2009.11.061, 2010.
Chou, M. D., Chan, P. K., and Wang, M. H.: Aerosol radiative forcing derived from SeaWiFS-retrieved aerosol optical properties, J. Atmos. Sci., 59, 748–757, https://doi.org/10.1175/1520-0469(2002)059<0748:Arfdfs>2.0.Co;2, 2002.
Ding, A. J., Huang, X., Nie, W., Sun, J. N., Kerminen, V. M., Petäjä, T., Su, H., Cheng, Y. F., Yang, X. Q., Wang, M. H., Chi, X. G., Wang, J. P., Virkkula, A., Guo, W. D., Yuan, J., Wang, S. Y., Zhang, R. J., Wu, Y. F., Song, Y., Zhu, T., Zilitinkevich, S., Kulmala, M., and Fu, C. B.: Enhanced haze pollution by black carbon in megacities in China, Geophys. Res. Lett., 43, 2873–2879, https://doi.org/10.1002/2016GL067745, 2016.
Drinovec, L., Močnik, G., Zotter, P., Prévôt, A. S. H., Ruckstuhl, C., Coz, E., Rupakheti, M., Sciare, J., Müller, T., Wiedensohler, A., and Hansen, A. D. A.: The “dual-spot” Aethalometer: an improved measurement of aerosol black carbon with real-time loading compensation, Atmos. Meas. Tech., 8, 1965–1979, https://doi.org/10.5194/amt-8-1965-2015, 2015.
Eriksson, A. C., Wittbom, C., Roldin, P., Sporre, M., Öström, E., Nilsson, P., Martinsson, J., Rissler, J., Nordin, E. Z., Svenningsson, B., Pagels, J., and Swietlicki, E.: Diesel soot aging in urban plumes within hours under cold dark and humid conditions, Sci. Rep., 7, 12364, https://doi.org/10.1038/s41598-017-12433-0, 2017.
Fierce, L., Bond, T. C., Bauer, S. E., Mena, F., and Riemer, N.: Black carbon absorption at the global scale is affected by particle-scale diversity in composition, Nat. Commun., 7, 12361, https://doi.org/10.1038/ncomms12361, 2016.
Gunsch, M. J., May, N. W., Wen, M., Bottenus, C. L. H., Gardner, D. J., VanReken, T. M., Bertman, S. B., Hopke, P. K., Ault, A. P., and Pratt, K. A.: Ubiquitous influence of wildfire emissions and secondary organic aerosol on summertime atmospheric aerosol in the forested Great Lakes region, Atmos. Chem. Phys., 18, 3701–3715, https://doi.org/10.5194/acp-18-3701-2018, 2018.
Heald, C. L., Ridley, D. A., Kroll, J. H., Barrett, S. R. H., Cady-Pereira, K. E., Alvarado, M. J., and Holmes, C. D.: Contrasting the direct radiative effect and direct radiative forcing of aerosols, Atmos. Chem. Phys., 14, 5513–5527, https://doi.org/10.5194/acp-14-5513-2014, 2014.
Hess, M., Koepke, P., and Schult, I.: Optical Properties of Aerosols and Clouds: The Software Package OPAC, B. Am. Meteorol. Soc., 79, 831–844, https://doi.org/10.1175/1520-0477(1998)079<0831:OPOAAC>2.0.CO;2, 1998.
Huang, X. F., Gao, R. S., Schwarz, J. P., He, L. Y., Fahey, D. W., Watts, L. A., Mccomiskey, A., Cooper, O. R., Sun, T. L., Zeng, L. W., Hu, M., and Zhang, Y. H.: Black carbon measurements in the Pearl River Delta region of China, J. Geophys. Res., 116, D12208, https://doi.org/10.1029/2010JD014933, 2011.
Li, K., Liao, H., Mao, Y., and Ridley, D. A.: Source sector and region contributions to concentration and direct radiative forcing of black carbon in China, Atmos. Environ., 124, 351–366, https://doi.org/10.1016/j.atmosenv.2015.06.014, 2016.
Kalogridis, A.-C., Vratolis, S., Liakakou, E., Gerasopoulos, E., Mihalopoulos, N., and Eleftheriadis, K.: Assessment of wood burning versus fossil fuel contribution to wintertime black carbon and carbon monoxide concentrations in Athens, Greece, Atmos. Chem. Phys., 18, 10219–10236, https://doi.org/10.5194/acp-18-10219-2018, 2018.
Kim, J.-H., Kim, S.-W., Ogren, J. A., Sheridan, P. J., Yoon, S.-C., Sharma, S., and Lin, N.-H.: Multiple scattering correction factor estimation for aethalometer aerosol absorption coefficient measurement, Aerosol Sci. Technol., 53, 160–171, https://doi.org/10.1080/02786826.2018.1555368, 2019.
Kopp, R. E. and Mauzerall, D. L.: Assessing the climatic benefits of black carbon mitigation, P. Natl. Acad. Sci. USA, 107, 11703–11708, https://doi.org/10.1073/pnas.0909605107, 2010.
Laskin, A., Laskin, J., and Nizkorodov, S. A.: Chemistry of atmospheric brown carbon, Chem. Rev., 115, 4335–4382, https://doi.org/10.1021/cr5006167, 2015.
Li, B., Gasser, T., Ciais, P., Piao, S., Tao, S., Balkanski, Y., Hauglustaine, D., Boisier, J.-P., Chen, Z., Huang, M., Li, L. Z., Li, Y., Liu, H., Liu, J., Peng, S., Shen, Z., Sun, Z., Wang, R., Wang, T., Yin, G., Yin, Y., Zeng, H., Zeng, Z., and Zhou, F.: The contribution of China's emissions to global climate forcing, Nature, 531, 357–361, https://doi.org/10.1038/nature17165, 2016.
Li, G., Bei, N., Tie, X., and Molina, L. T.: Aerosol effects on the photochemistry in Mexico City during MCMA-2006/MILAGRO campaign, Atmos. Chem. Phys., 11, 5169–5182, https://doi.org/10.5194/acp-11-5169-2011, 2011.
Li, L., Wang, Q., Zhang, X., She, Y., Zhou, J., Chen, Y., Wang, P., Liu, S., Zhang, T., Dai, W., Han, Y., and Cao, J.: Characteristics of single atmospheric particles in a heavily polluted urban area of China: size distributions and mixing states, Environ. Sci. Pollut. Res., 26, 11730–11742, https://doi.org/10.1007/s11356-019-04579-3, 2019.
Liou, K. N.: An introduction to atmospheric radiation, 2nd edn., Elsevier Science, Academic press, New York, 583 pp., 2002.
Liu, D., Whitehead, J., Alfarra, M. R., Reyes-Villegas, E., Spracklen, D. V., Reddington, C. L., Kong, S., Williams, P. I., Ting, Y.-C., Haslett, S., Taylor, J. W., Flynn, M. J., Morgan, W. T., McFiggans, G., Coe, H., and Allan, J. D.: Black-carbon absorption enhancement in the atmosphere determined by particle mixing state, Nat. Geosci., 10, 184–188, https://doi.org/10.1038/ngeo2901, 2017
Liu, J., Mauzerall, D. L., Chen, Q., Zhang, Q., Song, Y., Peng, W., Klimont, Z., Qiu, X., Zhang, S., Hu, M., Lin, W., Smith, K. R., and Zhu, T.: Air pollutant emissions from Chinese households: A major and underappreciated ambient pollution source, P. Natl. Acad. Sci. USA, 113, 7756–7761, https://doi.org/10.1073/pnas.1604537113, 2016.
May, A. A., Nguyen, N. T., Presto, A. A., Gordon, T. D., Lipsky, E. M., Karve, M., Gutierrez, A., Robertson, W. H., Zhang, M., Brandow, C., Chang, O., Chen, S., Cicero-Fernandez, P., Dinkins, L., Fuentes, M., Huang, S.-M., Ling, R., Long, J., Maddox, C., Massetti, J., McCauley, E., Miguel, A., Na, K., Ong, R., Pang, Y., Rieger, P., Sax, T., Truong, T., Vo, T., Chattopadhyay, S., Maldonado, H., Maricq, M. M., and Robinson, A. L.: Gas- and particle-phase primary emissions from in-use, on-road gasoline and diesel vehicles, Atmos. Environ., 88, 247–260, https://doi.org/10.1016/j.atmosenv.2014.01.046, 2014.
NBS (National Bureau of Statistics): China Statistical Yearbook 2018, China Statistics Press, Beijing, available at: http://www.stats.gov.cn/tjsj/ndsj/ (last access: October 2019), 2018.
Qin, Y., Wagner, F., Scovronick, N., Peng, W., Yang, J., Zhu, T., Smith, K. R., and Mauzerall, D. L.: Air quality, health, and climate implications of China's synthetic natural gas development, P. Natl. Acad. Sci. USA, 114, 4887–4892, https://doi.org/10.1073/pnas.1703167114, 2017.
Rajesh, T. A. and Ramachandran, S.: Black carbon aerosols over urban and high altitude remote regions: Characteristics and radiative implications, Atmos. Environ., 194, 110–122, https://doi.org/10.1016/j.atmosenv.2018.09.023, 2018.
Ricchiazzi, P., Yang, S. R., Gautier, C., and Sowle, D.: SBDART: A research and teaching software tool for plane-parallell radiative transfer in the Earth's atmosphere, B. Am. Meteorol. Soc., 79, 2101–2114, https://doi.org/10.1175/1520-0477(1998)079<2101:Sarats>2.0.Co;2, 1998.
Sandradewi, J., Prévôt, A. S. H., Szidat, S., Perron, N., Alfarra, M. R., Lanz, V. A., Weingartner, E., and Baltensperger, U.: Using aerosol light absorption measurements for the quantitative determination of wood burning and traffic emission contributions to particulate matter, Environ. Sci. Technol., 42, 3316–3323, https://doi.org/10.1021/es702253m, 2008.
Sun, J. Z., Zhi, G. R., Jin, W. J., Chen, Y. J., Shen, G. F., Tian, C. G., Zhang, Y. Z., Zong, Z., Cheng, M. M., Zhang, X. M., Zhang, Y., Liu, C. Y., Lu, J. K., Wang, H. Z., Xiang, J. M., Tong, L. T., and Zhang, X.: Emission factors of organic carbon and elemental carbon for residential coal and biomass fuels in China – A new database for 39 fuel-stove combinations, Atmos. Environ., 190, 241–248, https://doi.org/10.1016/j.atmosenv.2018.07.032, 2018.
Tian, J., Chow, J. C., Cao, J., Han, Y., Ni, H., Chen, L. W. A., Wang, X., Huang, R., Moosmüller, H., and Watson, J. G.: A biomass combustion chamber: design, evaluation, and a case study of wheat straw combustion emission tests, Aerosol Air Qual. Res., 15, 2104–2114, https://doi.org/10.4209/aaqr.2015.03.0167, 2015.
Vignati, E., Karl, M., Krol, M., Wilson, J., Stier, P., and Cavalli, F.: Sources of uncertainties in modelling black carbon at the global scale, Atmos. Chem. Phys., 10, 2595–2611, https://doi.org/10.5194/acp-10-2595-2010, 2010.
Wang, Q., Huang, R. J., Cao, J., Han, Y., Wang, G., Li, G., Wang, Y., Dai, W., Zhang, R., and Zhou, Y.: Mixing state of black carbon aerosol in a heavily polluted urban area of China: implications for light absorption enhancement, Aerosol Sci. Technol., 48, 689–697, https://doi.org/10.1080/02786826.2014.917758, 2014.
Wang, Q., Cao, J., Han, Y., Tian, J., Zhu, C., Zhang, Y., Zhang, N., Shen, Z., Ni, H., Zhao, S., and Wu, J.: Sources and physicochemical characteristics of black carbon aerosol from the southeastern Tibetan Plateau: internal mixing enhances light absorption, Atmos. Chem. Phys., 18, 4639–4656, https://doi.org/10.5194/acp-18-4639-2018, 2018.
Wang, Q., Liu, S., Li, N., Dai, W., Wu, Y., Tian, J., Zhou, Y., Wang, M., Ho, S. S. H., Chen, Y., Zhang, R., Zhao, S., Zhu, C., Han, Y., Tie, X., and Cao, J.: Impacts of short-term mitigation measures on PM2.5 and radiative effects: a case study at a regional background site near Beijing, China, Atmos. Chem. Phys., 19, 1881–1899, https://doi.org/10.5194/acp-19-1881-2019, 2019a.
Wang, Q., Ye, J., Wang, Y., Zhang, T., Ran, W., Wu, Y., Tian, J., Li, L., Zhou, Y., Hang Ho, S. S., Dang, B., Zhang, Q., Zhang, R., Chen, Y., Zhu, C., and Cao, J.: Wintertime Optical Properties of Primary and Secondary Brown Carbon at a Regional Site in the North China Plain, Environ. Sci. Technol., 53, 12389–12397, https://doi.org/10.1021/acs.est.9b03406, 2019b.
Wang, Q., Li, L., Zhou, J., Ye, J., Dai, W., Liu, H., Zhang, Y., Zhang, R., Tian, J., Chen, Y., Wu, Y., Ran, W., and Cao, J.: Measurement report: Evaluation of sources and mixing state of black carbon aerosol under the background of emission reduction in the North China Plain: implications for radiative effect, Zenodo, https://doi.org/10.5281/zenodo.3923612, 2020.
Yang, M., Howell, S. G., Zhuang, J., and Huebert, B. J.: Attribution of aerosol light absorption to black carbon, brown carbon, and dust in China – interpretations of atmospheric measurements during EAST-AIRE, Atmos. Chem. Phys., 9, 2035–2050, https://doi.org/10.5194/acp-9-2035-2009, 2009.
Zhang, G., Bi, X., He, J., Chen, D., Chan, L. Y., Xie, G., Wang, X., Sheng, G., Fu, J., and Zhou, Z.: Variation of secondary coatings associated with elemental carbon by single particle analysis, Atmos. Environ., 92, 162–170, https://doi.org/10.1016/j.atmosenv.2014.04.018, 2014.
Zhang, Q., Zheng, Y., Tong, D., Shao, M., Wang, S., Zhang, Y., Xu, X., Wang, J., He, H., Liu, W., Ding, Y., Lei, Y., Li, J., Wang, Z., Zhang, X., Wang, Y., Cheng, J., Liu, Y., Shi, Q., Yan, L., Geng, G., Hong, C., Li, M., Liu, F., Zheng, B., Cao, J., Ding, A., Gao, J., Fu, Q., Huo, J., Liu, B., Liu, Z., Yang, F., He, K., and Hao, J.: Drivers of improved PM2.5 air quality in China from 2013 to 2017, P. Natl. Acad. Sci. USA, 116, 24463, https://doi.org/10.1073/pnas.1907956116, 2019.
Zhang, Y., Forrister, H., Liu, J., Dibb, J., Anderson, B., Schwarz, J. P., Perring, A. E., Jimenez, J. L., Campuzano-Jost, P., Wang, Y., Nenes, A., and Weber, R. J.: Top-of-atmosphere radiative forcing affected by brown carbon in the upper troposphere, Nat. Geosci., 10, 486–489, https://doi.org/10.1038/ngeo2960, 2017.
Zhang, Y.-L., Schnelle-Kreis, J., Abbaszade, G., Zimmermann, R., Zotter, P., Shen, R.-R., Schäfer, K., Shao, L., Prévôt, A. S. H., and Szidat, S.: Source apportionment of elemental carbon in Beijing, China: insights from radiocarbon and organic marker measurements, Environ. Sci. Technol., 49, 8408–8415, https://doi.org/10.1021/acs.est.5b01944, 2015.
Zhao, S., Tie, X., Cao, J., Li, N., Li, G., Zhang, Q., Zhu, C., Long, X., Li, J., Feng, T., and Su, X.: Seasonal variation and four-year trend of black carbon in the Mid-west China: The analysis of the ambient measurement and WRF-Chem modeling, Atmos. Environ., 123, 430–439, https://doi.org/10.1016/j.atmosenv.2015.05.008, 2015.
Zhao, S., Yu, Y., Yin, D., Yu, Z., Dong, L., Mao, Z., He, J., Yang, J., Li, P., and Qin, D.: Concentrations, optical and radiative properties of carbonaceous aerosols over urban Lanzhou, a typical valley city: Results from in-situ observations and numerical model, Atmos. Environ., 213, 470–484, https://doi.org/10.1016/j.atmosenv.2019.06.046, 2019.
Zheng, H., Kong, S., Wu, F., Cheng, Y., Niu, Z., Zheng, S., Yang, G., Yao, L., Yan, Q., Wu, J., Zheng, M., Chen, N., Xu, K., Yan, Y., Liu, D., Zhao, D., Zhao, T., Bai, Y., Li, S., and Qi, S.: Intra-regional transport of black carbon between the south edge of the North China Plain and central China during winter haze episodes, Atmos. Chem. Phys., 19, 4499–4516, https://doi.org/10.5194/acp-19-4499-2019, 2019.
Zotter, P., Herich, H., Gysel, M., El-Haddad, I., Zhang, Y., Močnik, G., Hüglin, C., Baltensperger, U., Szidat, S., and Prévôt, A. S. H.: Evaluation of the absorption Ångström exponents for traffic and wood burning in the Aethalometer-based source apportionment using radiocarbon measurements of ambient aerosol, Atmos. Chem. Phys., 17, 4229–4249, https://doi.org/10.5194/acp-17-4229-2017, 2017.
Action Plan for the Prevention and Control of Air Pollution.