the Creative Commons Attribution 4.0 License.
the Creative Commons Attribution 4.0 License.
 | 11 Dec 2020
Aerosol-enhanced high precipitation events near the Himalayan foothills
Naresh Krishna Vissa
Jyotsna Singh
Chandan Sarangi
Sachchida Nand Tripathi
Matthias Tesche
Particulate emissions can alter the physical and dynamical properties of cloud systems and, in turn, amplify rainfall events over orographic regions downwind of highly polluted urban areas. The Indo-Gangetic Plain, one of the most polluted regions of the world, is located upwind of the Himalayan foothills. The region, therefore, provides an opportunity for studying how aerosol effects, in connection with orographic forcing, affect extreme rainfall events. This study uses 17 years (2001–2017) of observed rain rate, aerosol optical depth (AOD), meteorological reanalysis fields and outgoing long-wave radiation to investigate high precipitation events on the foothills of the Himalayas. Composite analysis of all these co-located data sets for high precipitation events (daily rainfall > 95th percentile) is done to understand the inherent dynamics and linkages between the AOD and extreme events. Clear and robust associations are found between high precipitation events, high aerosol loading and high moist static energy values. Results show an average increase in AOD by 36 %, along with an average increase in low-level moist static energy (1000–850 hPa) by ≈ 1500 J kg−1 inside the selected domain for high precipitation events. The finding highlights the crucial role of the aerosol direct radiative effect on high precipitation events over the Himalayan region.
- Article
(1588 KB) - Full-text XML
-
Supplement
(640 KB) - BibTeX
- EndNote


Studies related to aerosols and their impact on weather and climate are crucial for understanding the anthropogenic effect on the Earth system (IPCC, 2013). Aerosols can affect the atmosphere directly by interacting with incoming and outgoing radiation, known as aerosol–radiation interactions (ARIs; Vinoj et al., 2014; Kant et al., 2017; Sarangi et al., 2018). Aerosols can modify cloud microphysical and macrophysical properties (Fan et al., 2016; Kant et al., 2019) by means of indirect effects, also known as aerosol–cloud interactions (ACIs), and ultimately influence precipitation and the water cycle.
Several studies have identified the role of aerosols in invigorating cloud systems that – under certain environmental conditions – result in extreme precipitation events (Tao et al., 2012; Yang and Li, 2014; Altaratz et al., 2014; Fan et al., 2016, 2018). The indirect effect of pollution aerosols on clouds formed over orographic regions has also been explored (Van den Heever and Cotton, 2007; Carrió et al., 2010; Han et al., 2012; Zubler et al., 2011; Fan et al., 2014, 2017; Xiao et al., 2015; Choudhury et al., 2019). These studies suggest that aerosols may increase the magnitude of orographic precipitation by modifying the cloud microphysics (due to ACIs). The modelling results of Fan et al. (2015) show that absorbing aerosols from the polluted Sichuan Basin by virtue of ARIs can increase the magnitude of high precipitation over mountainous regions downwind through aerosol-enhanced conditional instability (AECI). This process can lead to disastrous floods. The AECI mechanism occurs in two steps.
First, the presence of absorbing aerosols in the urban-polluted basin increases the lower level stability during the daytime, thereby limiting the moisture in the lower levels. As a result, the moist static energy (MSE) is accumulated at the low levels. Second, during nighttime, this accumulated MSE is transferred towards the mountains downwind where the now more humid air mass undergoes orographic lifting, which results in anomalously high precipitation over the mountains. This mechanism connects aerosol direct and indirect effects to high precipitation events over the mountainous regions. This mechanism is illustrated in Fig. 5 of Fan et al. (2015).
The Indian subcontinent receives most of its rainfall during the monsoon season when the branch of intertropical convergence zone (ITCZ), synonymously termed as the monsoon trough, carries large amounts of moisture from the ocean inland (Krishnamurti, 1985; Kumar et al., 1995; Benn and Owen, 1998; Gadgil, 2003; Gadgil et al., 2005). An increasing trend of extreme precipitation events has been reported over the Himalayas (Dimri et al., 2017; Bohlinger and Sorteberg, 2018; Shrestha et al., 2019). The occurrence of these extreme rainfall events over the steeper mountains can result in catastrophic floods and landslides, with devastating effects on the population. The majority of these rainfall events are embedded within large-scale synoptic weather systems such as monsoon depressions, low-pressure systems and occasional extratropical disturbances (Dhar and Nandargi, 1993; Rajeevan et al., 2010; Nandargi and Dhar, 2011; Bohlinger et al., 2017; Dimri et al., 2017). These synoptic features result in a strong cross-orographic flow, which favours the orographic lifting of moist air parcels.
The Indo-Gangetic Plain (IGP) lies to the south of the Himalayan foothills and is associated with high aerosol loading (Ramachandran et al., 2012; Dahutia et al., 2018; Reddy et al., 2018), with a substantial contribution from absorbing aerosols like black carbon (Rana et al., 2019; Brooks et al., 2019) and dust (Lau et al., 2010, 2017; Gautam et al., 2013). A recent modelling study by Lau et al. (2017) revealed the crucial role of ARIs in modifying the monsoon circulation, resulting in monsoon onset over the Himalayan foothills by 1 to 5 d for the year 2008. They also found that the aerosols with a semi-direct effect increase the stability of the lower troposphere in regions south of the Himalayas and weaken the convection (similar to the findings of Fan et al., 2015). This unprecipitated moisture, when it is advected by the monsoon southerlies, can increase the rainfall over the Himalayas. However, their study emphasised the whole monsoon season and did not focus on extreme precipitation events. Because of the computational limitations, modelling studies relating the aerosol and precipitation are restricted to case studies. However, with the availability of reanalysis data sets, e.g. the Modern Era Retrospective analysis for Research and Applications version 2 (MERRA-2; Bosilovich et al., 2015) and the European Centre for Medium-Range Weather Forecasts Reanalysis (ECMWF and ERA-Interim; Dee et al., 2011) data products, statistical analysis over a long period is possible in order to unveil the relations between aerosols and meteorology. With the defined relationship between aerosols and MSE for extreme precipitation events (Fan et al., 2015) in the Sichuan Basin, China, and the availability of reanalysis fields and satellite-derived aerosol optical depth (AOD) data, one unaddressed question is if the aerosols via ARIs have a role in the high precipitation events over the Himalayan region? The present study attempts to find this answer by analysing the AOD and meteorological fields for the high precipitation events occurring over the Himalayan foothills.
The paper is organised as follows: the study area description and data used for the study are described in Sect. 2, while Sect. 3 discusses the methodologies adopted in the present work. Section 4 presents the results obtained in the context of AECI and the discussion of its linkages with previous findings. Concluding remarks are given in Sect. 5.
The present study investigates the possible connection between aerosol load and high precipitation events over a selected Himalayan region for a period of 17 years from 2001 to 2017. The chosen domain, shown in Fig. 1, is close to the IGP and bounded by the coordinates (29∘ N, 78.5∘ E; 26.7∘ N, 83∘ E; 28.7∘ N, 84∘ E; 31∘ N, 79.5∘ E) with average, maximum and minimum elevations of 1649, 5581 and 84 m, respectively. The selection of the domain is inspired by the work of Bohlinger et al. (2017) in which 30 years of climatological rain gauge data were used to form a cluster of stations with similar rainfall patterns.
For information on aerosol load, this study utilises 1∘ × 1∘ daily gridded combined Dark Target Deep Blue (DT–DB) aerosol optical depth (AOD) measured at wavelength 550 nm, as provided in the Moderate Resolution Imaging Spectroradiometer (MODIS) level 3 collection 6.1 aerosol data product for Terra overpasses at about 10:30 Indian standard time (IST). This product combines AOD, as inferred from using the Dark Target (DT; Levy et al., 2007, 2013) and Deep Blue (DB; Hsu et al., 2013) algorithms, to provide improved data coverage over both dark and bright land surfaces (Bilal et al., 2018; Wei et al., 2019c). From here onwards, we will refer to MODIS AOD instead of the combined DT–DB MODIS AOD. Very intense precipitation is accompanied by optically thick clouds which inhibit AOD retrieval from MODIS observations. However, the extreme precipitation events in the study domain occurred mostly during nighttime while the considered Terra overpasses are fixed to approximately 10:30 IST. This time difference enabled us to find cases with valid AODs. Table S1 in the Supplement lists the considered dates of extreme events, the domain-averaged daily precipitation and the domain-averaged AOD derived from MODIS–TERRA and MERRA-2, together with the percentage of grid points with valid AODs within the study domain for each event. Figure S1 in the Supplement shows the percentage of data with valid AODs at every grid point that was used to compute the AOD composite as presented in this work.
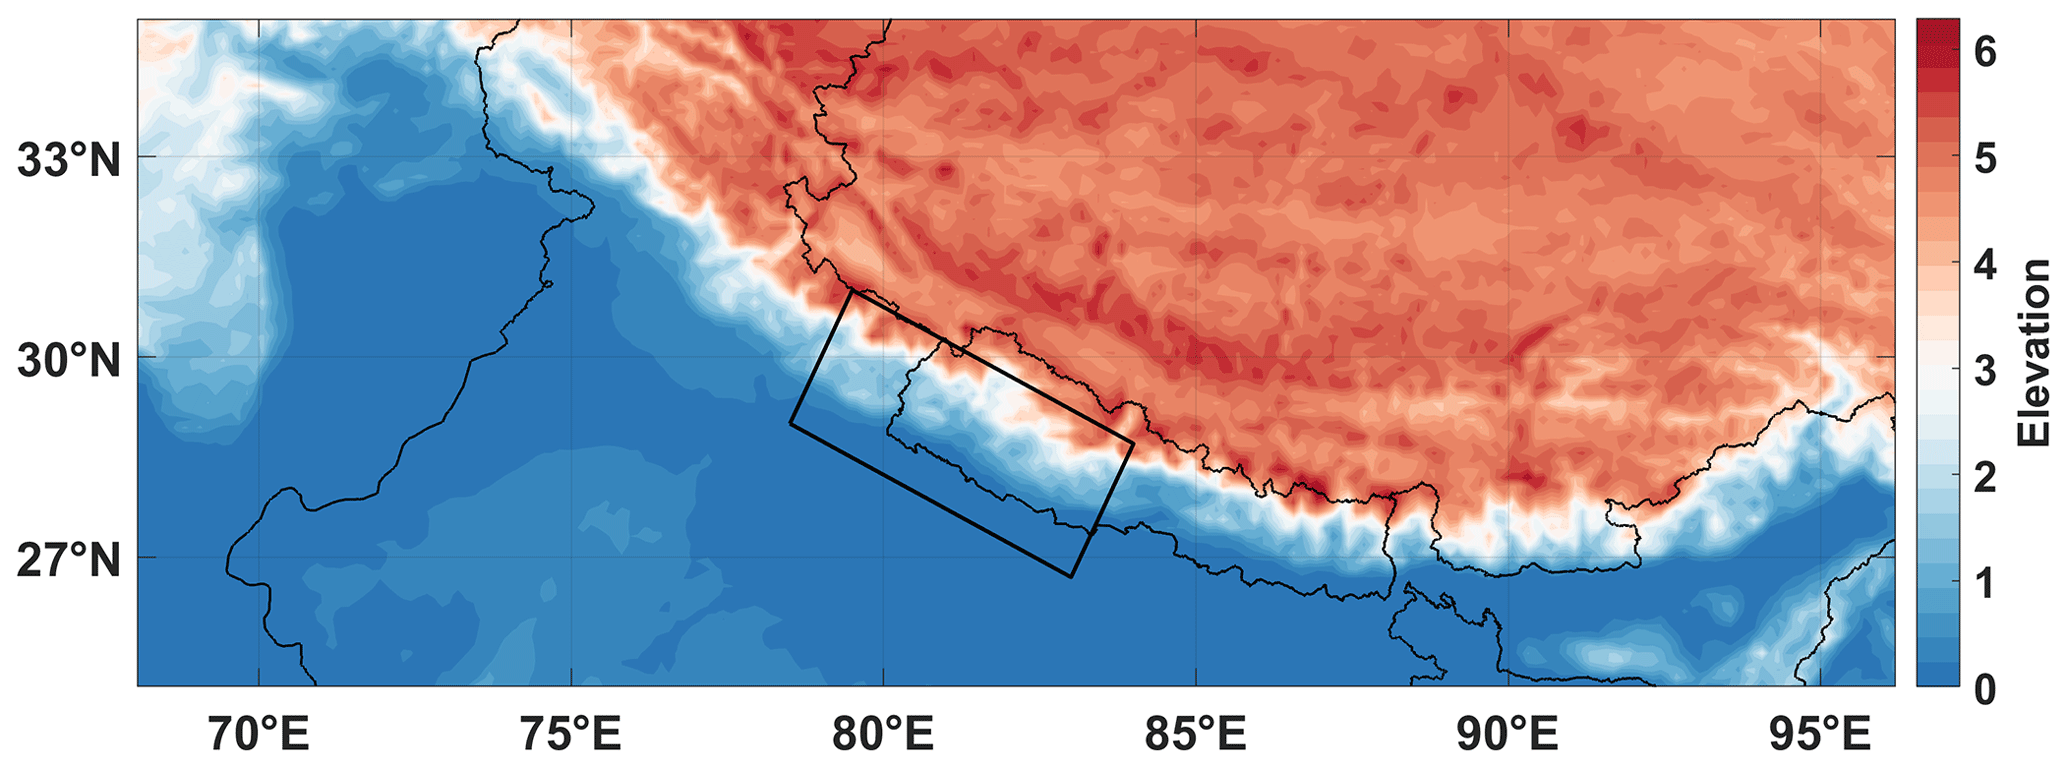
Figure 1Map of Global Multi-resolution Terrain Elevation Data 2010 (GMTED2010) in kilometres, provided by the US Geological Survey. Thin black lines mark country borders. The black rectangle marks the domain on the foothills of the Himalayas that was used in this study.
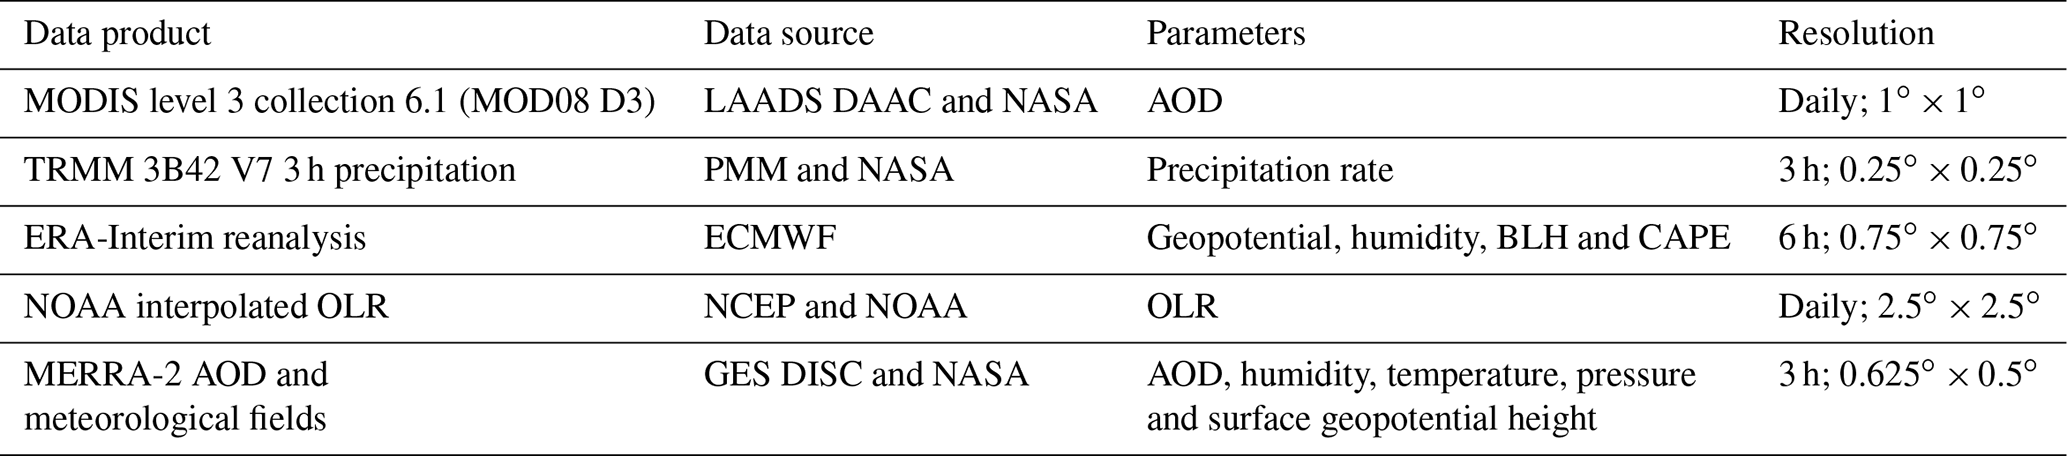
Precipitation data are derived from Tropical Rainfall Measuring Mission version 7 (TRMM 3B42) gridded data product with a spatial resolution of 0.25∘ × 0.25∘ and a temporal resolution of 3 h (Huffman et al., 2007). The rainfall rate derived from TRMM 3B42 data is comparable with the surface observation in terms of spatial variations but not in terms of magnitudes (Koo et al., 2009; Sapiano and Arkin, 2009; Ochoa et al., 2014; Iqbal and Athar, 2018). The meteorological variables such as temperature, geopotential height, relative humidity and specific humidity, boundary layer height (BLH) and convective available potential energy (CAPE) are derived from ERA-Interim and MERRA-2 reanalysis data. The AOD from MERRA-2 is also used to study the aerosol load. The National Oceanic and Atmospheric Administration (NOAA) daily outgoing long-wave radiation (OLR) data are used to identify the convection and cloud patterns over India (Liebmann and Smith, 1996). All data sets used in the present study are considered for the monsoon season (June–September) for 17 years (2001–2017). Table 1 summarises the data sets used in the present study, along with the source and resolution.
The domain-averaged daily accumulated precipitation is used to define the high precipitation (HP) events as those days that exceed the 95th percentile value of 32.84 mm. This criterion is used in many studies (Indrani and Al-Tabbaa, 2011; Varikoden and Revadekar, 2019) to categorise the heavy rainfall events over the Indian subcontinent. The threshold value is similar to that of Bookhagen (2014) but smaller than the measurements from in situ rain gauge stations (Nandargi and Dhar, 2011; Bohlinger and Sorteberg, 2018). The lower value may be due to the underestimation of the precipitation magnitude over areas of high surface elevation by TRMM (Scheel et al., 2011; Iqbal and Athar, 2018). Since an extreme weather system may stay active for more than 1 d, we further constrain the HP events such that a gap of at least 2 d exists between two consecutive events. The total number of 75 events, with mean and maximum precipitation of 45.05 and 90.2 mm, respectively, were found from this analysis.
Table 1Overview of the data sets used in this study. Note: LAADS – Level 1 Atmosphere Archive and Distribution System; DAAC – Distributed Active Archive Center; PMM – Precipitation Measurement Missions (of NASA); NCEP – National Centres for Environmental Prediction; GES DISC – Goddard Earth Sciences Data and Information Services Center.
MSE is a measure related to moist convection (Kiranmayi and Maloney, 2011; Mayer and Haimberger, 2012; Fan et al., 2015) and can be computed for each pressure level as follows:
where T is the temperature, Z is the geopotential, L=2260 kJ kg−1 is the latent heat of vaporisation, Cp ≈ 1 is the specific heat capacity at constant pressure, and q is the specific humidity.
The lower level MSE is calculated by averaging the MSE for pressure levels between 1000 and 850 hPa at 00:00 universal coordinated time (UTC) or 05:30 LT. The AOD, daily accumulated precipitation, OLR, boundary layer height (BLH) anomaly, convective available potential energy (CAPE) anomaly and the MSE composites are evaluated for the selected high precipitation events and up to 2 d prior to the event day. The composite of a parameter is calculated by averaging over all the selected high precipitation events. The anomaly of a parameter is calculated by first computing the anomaly for each event day and then averaging over all the events. The anomaly for an event day is calculated by subtracting the 17 year average value of the parameter from the value of the parameter for that day.
The composite analysis is widely used to study the meteorological features of different systems (Krishnan et al., 2000; Rajeevan et al., 2010; Pillai and Sahai, 2014; Bohlinger et al., 2017). This enables the identification of physical processes connected to the spatial variation of different atmospheric parameters. Figure 2 depicts the composites of AOD (derived from MODIS and MERRA-2) and low-level MSE (derived from ERA-Interim and MERRA-2) for event days and 1 d prior and 2 d prior to the events. It shows a gradual increase in lower level MSE within and near the domain, reaching the maximum value on the event day, with an average increase of about 1500 J kg−1. Coincidentally, AOD shows a similar pattern with an increase of 36 % (24 % ) from the previous day to the event day using MODIS (MERRA-2) data. The AOD and MSE variations are showing similar patterns with MERRA-2 data as well; however, the magnitudes are smaller compared to MODIS and ERA-Interim data. The lower values reported by MERRA-2 may be due to missing emission sources in the aerosol model (Buchard et al., 2017). The MERRA-2 data set can capture the dynamic changes in AOD variations (Shi et al., 2019) and for the present study also; the dynamic variations in AOD and MSE are captured by MERRA-2, similar to that of MODIS and ERA-Interim. This hints towards a connection between the accumulation of aerosols and the increase in lower level MSE within and around the domain. There is a statistically significant positive correlation between the domain-averaged AOD and MSE for both MERRA-2 (Pearson correlation coefficient of R=0.2649 and p=0.0235) and ERA-Interim (R=0.352 and p=0.0023) data sets. The presence of absorbing aerosols within the BLH may have warmed the lower atmosphere, increasing the low-level stability and suppressing the convection, thus preventing the consumption of MSE. This may have resulted in the accumulation of MSE in the lower levels, as seen in Fig. 2. We repeated this composite analysis for other parts of the Himalayan foothills and also for days with no or low precipitation (with the threshold of the 5th percentile) but were unable to find a feature, as observed in Fig. 2, for high precipitation events (shown in Fig. S2).
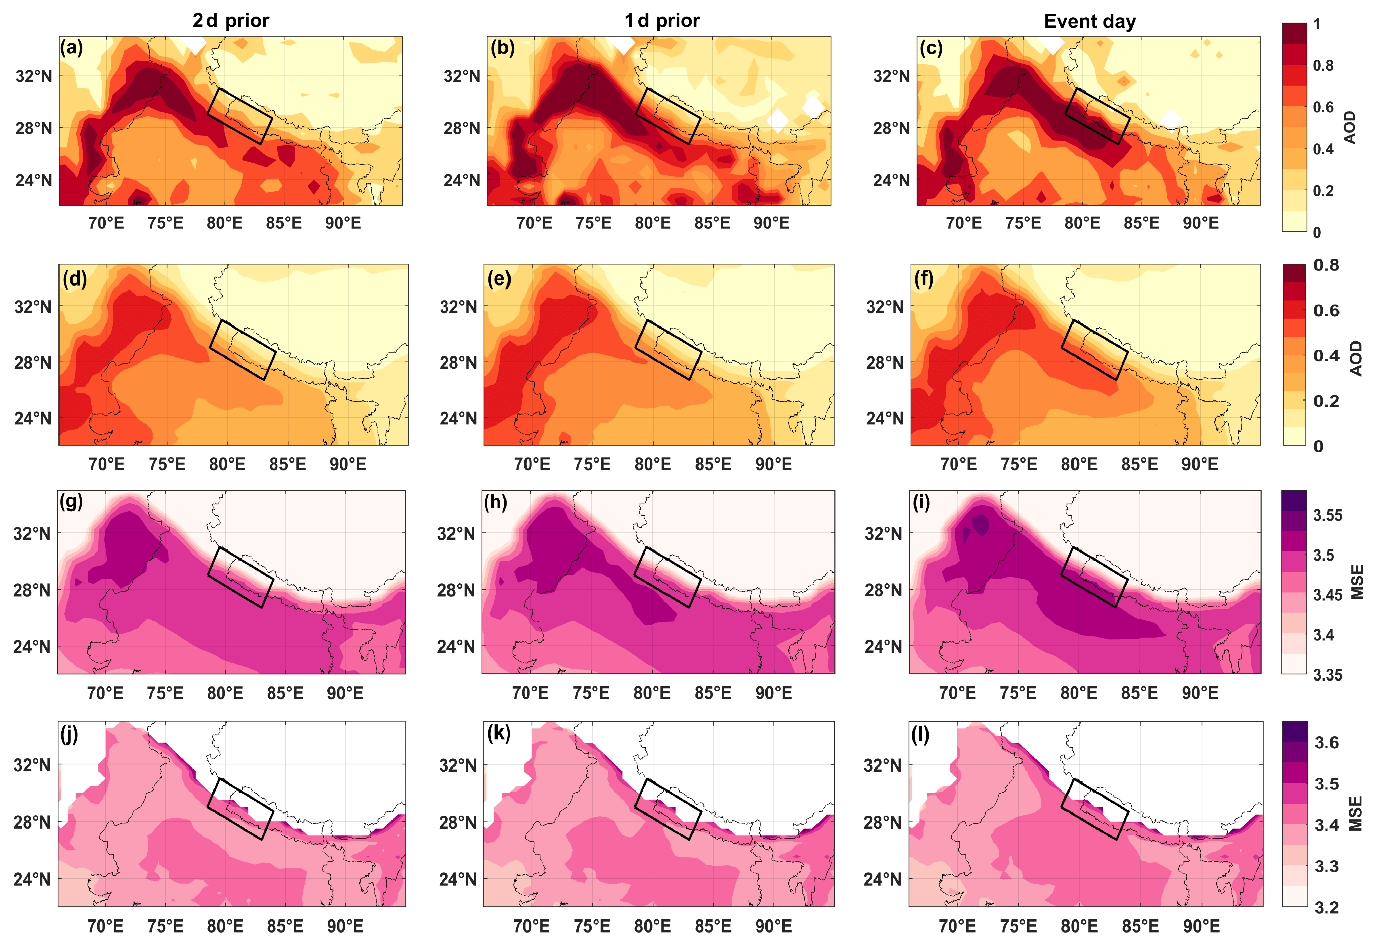
Figure 2Composites of MODIS AOD (a–c), MERRA-2 AOD (d–f), ERA-Interim lower level MSE (g–i), in units of 105 J kg−1, and MERRA-2 lower level MSE (j–l), in units of 105 J kg−1, for the event days (c, f, i, l) and 1 d prior (b, e, h, k) and 2 d prior (a, d, g, j) to the events.
The composites of BLH and CAPE anomalies at 12:00 UTC are shown in Fig. 3. The BLH is seasonally and temporally variable over any place, and in general, the convective days have higher values of BLH (Yang et al., 2014). The higher AOD values increase the reflection and absorption of solar radiation, and the amount of radiation reaching the surface decreases. This reduced radiation, in turn, reduces turbulence generation and, hence, the BLH. For the present study, a negative BLH anomaly is found within and close to the domain, especially on the event day (see Fig. 3). The negative BLH anomaly might be a signature of the accumulated aerosols stabilising the boundary layer by reducing the amount of solar radiation reaching the surface during the daytime (Wendisch et al., 2008; Li et al., 2011). The reduction in incoming solar radiation to the surface reduces the sensible and latent heat fluxes and may further enhance the accumulation of aerosols and moisture (Takemura et al., 2005) in the lower levels, thus acting as a cyclic process. The variation is similar to the modelling results by Fan et al. (2015), showing a decrease in BLH due to the radiative effects of the polluted urban aerosols of the Sichuan Basin, China. The MSE may then be accumulated in the lower levels during the daytime by the AECI mechanism because of the suppressed convection.
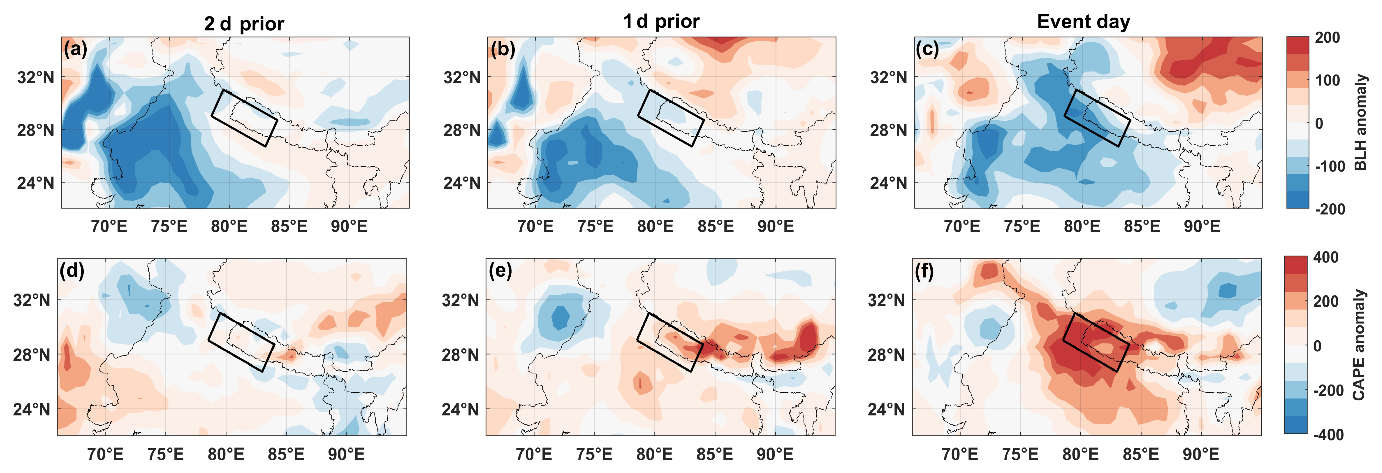
Figure 3Composites of BLH anomaly (a–c), in units of metres at 12:00 UTC, and CAPE anomaly, in units of J kg−1 (d–f) at 12:00 UTC, for the event days (c, f) and 1 d prior (b, e) and 2 d prior (a, d) to the events.
The increase in AOD is found to influence the lifetime of severe convective clouds with the availability of higher CAPE values (Chakraborty et al., 2016). CAPE signifies the potential of the convective event, with higher values representing the possibilities of severe events. The presence of absorbing aerosols within the planetary boundary layer may result in an increase in temperature in the lower atmosphere. This can result in higher CAPE values above the convection condensation level (Wang et al., 2013; Sarangi et al., 2015; Li et al., 2017). Please note that several studies have highlighted that the aerosol invigoration effect (Rosenfeld et al., 2008; Fan et al., 2018) is a relevant phenomenon over this region during the monsoon (Sarangi et al., 2017, 2018). Aerosol-induced microphysical changes (like smaller cloud droplets) cause the droplets to move higher up in the atmosphere instead of falling down as rain. As such, the ratio of ice to liquid water content in the clouds increases in such invigorated clouds. A higher CAPE (induced due to the aerosol radiative effect) can further add to the cloud invigoration and lead to more ice formation and, thus, a higher rain rate (eventually). Moreover, higher CAPE anomalies on the severe event days in the presence of higher AOD values represent the possibility of a severe event as the convection grows for a longer time with more accumulation of MSE, CAPE and AOD, leading to a positive feedback cycle. The composites of the CAPE anomaly supportively show a positive value in the domain, starting from 1 d prior to the event (about 400 % increase). The higher values of the CAPE anomaly during evening hours (17:30 LT) are similar to the variation reported by Fan et al. (2015). The association of higher CAPE with increased AOD values results in a high precipitation event over the domain as observed.

Figure 4Composites of daily accumulated precipitation (a–c) in mm d−1 and OLR (d–f) in W m−2 for the event day (c, f) and 1 d prior (b, e) and 2 d prior to the event (a, d).
On the other hand, OLR represents the thick cloud cover over any region, and the OLR variation is typically used to identify an area with severe convective clouds (Inoue et al., 2008). The daily accumulated precipitation and OLR anomaly composites show much lower precipitation rates over central India south of the selected domain compared to that at the Himalayas on and before the HP events (Fig. 4). However, this low precipitation rate in the vicinity of the domain may support the working of an AECI mechanism by reducing the scavenging of aerosols through wet deposition, which enables the initial accumulation of aerosols for initiating the AECI effect. The variation of 3 h domain-averaged precipitation for the selected events with time (Fig. 5) shows low precipitation during the daytime over the domain, with an anomalous increase during the nighttime after around 15:00 UTC (20:30 LT). This pattern of rainfall showing weaker (stronger) convection during the daytime (nighttime) over the domain further supports the theory of AECI (Fan et al., 2015).
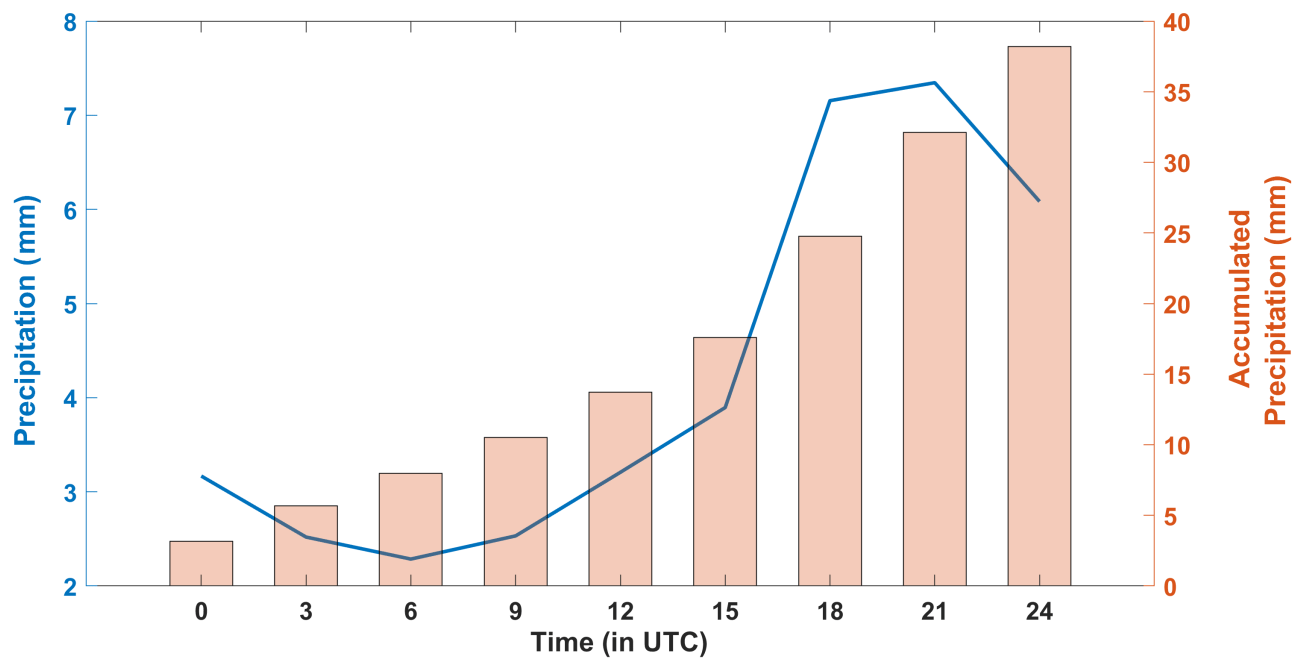
Figure 5Domain-averaged 3 h precipitation on the day of occurrence of a high precipitation event averaged for all events. The accumulated precipitation values are given in the background as bars.
The AOD averaged over the domain for monsoon months is found to be 0.574, while it is 0.8 for the high rainfall event cases. The aerosols generated from local and neighbouring sources (IGP) may be transported by the winds towards the domain during HP events, accumulating the aerosols blocked by the high-elevation mountains (Lau et al., 2017). Bohlinger et al. (2017) identified that 75 % of the moisture during an HP event is transported from the land sources, with an increase in moisture supply from the IGP. This increase in moisture supply may be because of the AECI effect, which prevents the consumption of moisture by suppressing the convection during the daytime. When accumulated moisture is transported towards the Himalayas during the night, it may undergo orographic lifting and may provide additional moisture and aerosols to already formed convective cells, resulting in HP events.
The presence of a high aerosol load (AOD ≈ 0.8) in a profoundly moist environment may also contribute to the excitation of HP events in orographic regions by the aerosol indirect effect (Fan et al., 2014, 2017; Xiao et al., 2015). Some studies suggest that, under high AOD values with high black carbon concentrations, the ARI effect dominates the ACI effect (Fan et al., 2015; Rosenfeld et al., 2008; Ding et al., 2019). Several studies exploring the indirect impact of anthropogenic aerosols on mixed-phase orographic clouds also found a minor impact on the net orographic precipitation (Saleeby et al., 2013; Fan et al., 2014; Letcher and Cotton, 2014). A negligible impact of the aerosol indirect effect on the orographic precipitation over the foothills of the Himalayas in Nepal was also noticed by Shrestha et al. (2017). However, the exact contribution of the direct and indirect effect of aerosols to the HP events is not within the scope of the present study and requires further work involving state-of-the-art numerical models.
To summarise, we selected HP events (defined based on domain-averaged daily accumulated precipitation) over the Himalayan foothills during monsoon months for a period of 17 years to investigate a possible connection with aerosols. The composites of AOD, lower level MSE, a BLH and CAPE anomaly, daily accumulated precipitation and an OLR anomaly are analysed to identify the dynamical progression of these parameters impacting HP events. The findings can be concluded as follows:
- 1.
The AOD within the domain for the event days increased by about 36 % compared to that of the previous day.
- 2.
The spatio-temporal pattern of low-level MSE coincides with that of the AOD for the selected events. It may be a result of the warming effect of aerosols in the lower atmosphere which increases (decreases) the stability in the lower (mid) levels. This mechanism is further supported by the occurrence of a negative BLH anomaly and high positive CAPE values within the selected domain. This indicates that the aerosols can have a substantial impact on increasing the magnitude of the orographic precipitation by the AECI effect.
- 3.
The variation in 3 h rainfall for the event day shows that the HP event over the domain happens mostly during the night.
- 4.
The spatial distribution of the daily accumulated precipitation composite shows low values close to the domain for 1 and 2 d prior to HP event. Thus, it may support the initial accumulation of aerosols before HP events within and in the vicinity (IGP) of the domain and may be an essential requirement for the working of the AECI mechanism.
The aerosols accumulate near and within the selected domain, starting from 2 d prior to the event. The low precipitation, as seen in Fig. 4, before the events may have allowed this build-up of aerosols. Through the AECI mechanism, the convection in the lower atmosphere is suppressed during the daytime, preventing the consumption of the moist static energy. This excess energy is then transported towards the orography during the night and leads to an increase in the magnitude of high precipitation events. We have schematically summarised the AECI mechanism for the Himalayan region in Fig. S3. The results show observational evidence of the aerosol-enhanced convective instability mechanism identified by Fan et al. (2015). However, the analysis incorporates uncertainty due to the humidity growth effect, where the higher values of AOD might be a result of the hygroscopic growth of aerosols and not because of the presence of more aerosol particles. This is why we incorporated AOD values using MERRA-2 data. In the presence of thick cloud cover during the high precipitation event, the MODIS data will not be available. Thus, we did not have the AOD observations from MODIS at every grid point inside our domain for the individual events (Fig. S1). The composite images have better data availability, as shown in the figures. To be certain, we cross-checked the pattern of variation for every case from the MERRA-2 AOD. The results indicate that aerosols can play a vital role in exciting HP events over the Himalayas during the monsoon season. Thus, aerosols including the chemistry are essential to consider when forecasting HP events over the Himalayan region in regional modelling studies.
All data sets used in this work are open source and publicly available. The MODIS level 3 daily gridded aerosol data are available at the NASA Goddard Space Flight Center (GSFC) and Level 1 Atmosphere Archive and Distribution System (LAADS; https://doi.org/10.5067/MODIS/MOD08_D3.061, Platnick et al., 2015).
The TRMM precipitation data are available from the NASA Goddard Space Flight Center and Precipitation Processing System (PPS) and are archived at the NASA Goddard Earth Sciences Data and Information Services Center (GES DISC; https://doi.org/10.5067/TRMM/TMPA/3H/7, TRMM, 2011).
The MERRA-2 aerosol optical depth (https://doi.org/10.5067/HNGA0EWW0R09, GMAO, 2015a) and meteorological fields (https://doi.org/10.5067/QBZ6MG944HW0, GMAO, 2015b) can be accessed from NASA GES DISC as well.
ERA-Interim reanalysis data can be accessed from European Centre for Medium-Range Weather Forecasts (ECMWF), ERA-Interim Project and the research data archive at the National Center for Atmospheric Research, Computational and Information Systems Laboratory (https://doi.org/10.5065/D6CR5RD9, ECMWF, 2009).
NOAA Interpolated OLR data were acquired from the National Oceanic and Atmospheric Administration, Office of Oceanic and Atmospheric Research, and Earth System Research Laboratory (NOAA/OAR/ESRL) Physical Science Division, Boulder, Colorado, USA (https://www.esrl.noaa.gov/psd, last access: 5 May 2020, NCAR/NOAA, 2016).
The supplement related to this article is available online at: https://doi.org/10.5194/acp-20-15389-2020-supplement.
GC and BT conceived the study. GC, BT and NKV did the data analysis, made the plots and wrote the initial paper. JS, CS, SNT and MT improved the idea from time to time and corrected draft versions of the paper. All authors contributed to the research and finalised the paper.
The authors declare that they have no conflict of interest.
The authors would like to acknowledge Department of Science and Technology, Government of India, for providing funding. The authors are grateful to the NASA Goddard Space Flight Center (GSFC) and Level 1 Atmosphere Archive and Distribution System (LAADS) for making the level 3 MODIS data sets available. The authors are thankful to the ECMWF for providing ERA reanalysis data sets, and the NASA Goddard Earth Sciences (GES) Data and Information Services Center (DISC) for the MERRA-2 reanalysis data. The authors acknowledge the NASA Goddard Space Flight Center and PPS for developing and computing the TRMM precipitation data archived at the NASA GES DISC, which contributes to the TRMM project. The interpolated OLR data are provided by the NOAA/OAR/ESRL PSL, Boulder, Colorado, USA, and are highly acknowledged.
This research has been supported by the Department of Science and Technology, Government of India (grant no. DST/CCP/Aerosol/90/2017(G) under the SPLICE Climate Change Programme and the National Network Programme on Aerosol), the Franco-German Fellowship Programme on Climate, Energy, and Earth System Research (Make Our Planet Great Again – German Research Initiative; MOPGA-GRI; grant no. 57429422) of the German Academic Exchange Service (DAAD), which is funded by the German Ministry of Education and Research.
This paper was edited by Yves Balkanski and reviewed by Kuvar Satya Singh and two anonymous referees.
Altaratz, O., Koren, I., Remer, L. A., and Hirsch, E.: Cloud invigoration by aerosols – Coupling between microphysics and dynamics, Atmos. Res., 140, 38–60, https://doi.org/10.1016/j.atmosres.2014.01.009, 2014. a
Benn, D. I. and Owen, L. A.: The role of the Indian summer monsoon and the mid-latitude westerlies in Himalayan glaciation: Review and speculative discussion, J. Geol. Soc. London, 155, 353–363, https://doi.org/10.1144/gsjgs.155.2.0353, 1998. a
Bilal, M., Qiu, Z., Campbell, J., Spak, S., Shen, X., and Nazeer, M.: A new MODIS C6 Dark Target and Deep Blue merged aerosol product on a 3 km spatial grid, Remote Sens.-Basel, 10, 463, https://doi.org/10.3390/rs10030463, 2018. a
Bohlinger, P. and Sorteberg, A.: A comprehensive view on trends in extreme precipitation in Nepal and their spatial distribution, Int. J. Climatol., 38, 1833–1845, https://doi.org/10.1002/joc.5299, 2018. a, b
Bohlinger, P., Sorteberg, A., and Sodemann, H.: Synoptic conditions and moisture sources actuating extreme precipitation in Nepal, J. Geophys. Res.-Atmos., 122, 12653–12671, https://doi.org/10.1002/2017JD027543, 2017. a, b, c, d
Bookhagen, B.: Appearance of extreme monsoonal rainfall events and their impact on erosion in the Himalaya, Geomat. Nat. Haz. Risk, 1, 37–50, https://doi.org/10.1080/19475701003625737, 2010. a
Bosilovich, M. G., Lucchesi, R., and Suarez, M.: MERRA-2: File specification, Global Modeling and Assimilation Office GMAO, Office Note No. 9, Version 1.1, 73 pp., available at: https://gmao.gsfc.nasa.gov/pubs/office_notes (last access: 5 May 2020), 2015. a
Brooks, J., Allan, J. D., Williams, P. I., Liu, D., Fox, C., Haywood, J., Langridge, J. M., Highwood, E. J., Kompalli, S. K., O'Sullivan, D., Babu, S. S., Satheesh, S. K., Turner, A. G., and Coe, H.: Vertical and horizontal distribution of submicron aerosol chemical composition and physical characteristics across northern India during pre-monsoon and monsoon seasons, Atmos. Chem. Phys., 19, 5615–5634, https://doi.org/10.5194/acp-19-5615-2019, 2019. a
Buchard, V., Randles, C. A., da Silva, A. M., Darmenov, A., Colarco, P. R., Govindaraju, R., Ferrare, R., Hair, J., Beyersdorf, A. J., Ziemba, L. D., and Yu, H.: The MERRA-2 aerosol reanalysis, 1980 onward. Part II: Evaluation and case studies, J. Climate, 30, 6851–6872, https://doi.org/10.1175/JCLI-D-16-0613.1, 2017. a
Carrió, G. G., Cotton, W. R., and Cheng, W. Y. Y.: Urban growth and aerosol effects on convection over Houston: Part 1. The August 2000 case, Atmos. Res., 96, 560–574, https://doi.org/10.1016/j.atmosres.2010.01.005, 2010. a
Chakraborty, S., Fu, R., Massie, S. T., and Stephens, G.: Relative influence of meteorological conditions and aerosols on the lifetime of mesoscale convective systems, P. Natl. Acad. Sci. USA, 113, 7426–7431, https://doi.org/10.1073/pnas.1601935113, 2016. a
Choudhury, G., Tyagi, B., Singh, J., Sarangi, C., and Tripathi, S. N.: Aerosol-orography-precipitation – A critical assessment, Atmos. Environ., 214, https://doi.org/10.1016/j.atmosenv.2019.116831, 2019. a
Dahutia, P., Pathak, B., and Bhuyan, P. K.: Aerosols characteristics, trends and their climatic implications over Northeast India and adjoining South Asia, Int. J. Climatol., 38, 1234–1256, https://doi.org/10.1002/joc.5240, 2018. a
Dee, D. P., Uppala, S. M., Simmons, A. J., Berrisford, P., Poli, P., Kobayashi, S., Andrae, U., Balmaseda, M. A., Balsamo, G., Bauer, D. P., and Bechtold, P.: The ERA Interim reanalysis: Configuration and performance of the data assimilation system, Q. J. Roy. Meteor. Soc., 137, 553–597, https://doi.org/10.1002/qj.828, 2011. a
Dhar, O. N. and Nandargi, S. S.: Spatial distribution of severe rainstorms over India and their associated areal raindepths, Mausam, 44, 373–380, 1993. a
Dimri, A. P., Chevuturi, A., Niyogi, D., Thayyen, R. J., Ray, K., Tripathi, S. N., Pandey, A. K., and Mohanty, U. C.: Cloudbursts in Indian Himalayas: A review, Earth-Sci. Rev., 168, 1–23, https://doi.org/10.1016/j.earscirev.2017.03.006, 2017. a, b
Ding, Q., Sun, J., Huang, X., Ding, A., Zou, J., Yang, X., and Fu, C.: Impacts of black carbon on the formation of advection–radiation fog during a haze pollution episode in eastern China, Atmos. Chem. Phys., 19, 7759–7774, https://doi.org/10.5194/acp-19-7759-2019, 2019. a
ECMWF (European Centre for Medium-Range Weather Forecasts): ERA-Interim Project, Research Data Archive at the National Center for Atmospheric Research, Computational and Information Systems Laboratory, updated monthly, https://doi.org/10.5065/D6CR5RD9, 2009. a
Fan, J., Leung, L. R., DeMott, P. J., Comstock, J. M., Singh, B., Rosenfeld, D., Tomlinson, J. M., White, A., Prather, K. A., Minnis, P., Ayers, J. K., and Min, Q.: Aerosol impacts on California winter clouds and precipitation during CalWater 2011: local pollution versus long-range transported dust, Atmos. Chem. Phys., 14, 81–101, https://doi.org/10.5194/acp-14-81-2014, 2014. a, b, c
Fan, J., Rosenfeld, D., Yang, Y., Zhao, C., Leung, L. R., and Li, Z.: Substantial contribution of anthropogenic air pollution to catastrophic floods in Southwest China, Geophys. Res. Lett., 42, 6066–6075, https://doi.org/10.1002/2015GL064479, 2015. a, b, c, d, e, f, g, h, i, j
Fan, J., Wang, Y., Rosenfeld, D., and Liu, X.: Review of aerosol–cloud interactions: Mechanisms, significance, and challenges, J. Atmos. Sci., 73, 4221–4252, https://doi.org/10.1175/JAS-D-16-0037.1, 2016. a, b
Fan, J., Leung, L. R., Rosenfeld, D., and DeMott, P. J.: Effects of cloud condensation nuclei and ice nucleating particles on precipitation processes and supercooled liquid in mixed-phase orographic clouds, Atmos. Chem. Phys., 17, 1017–1035, https://doi.org/10.5194/acp-17-1017-2017, 2017. a, b
Fan, J., Rosenfeld, D., Zhang, Y., Giangrande, S. E., Li, Z., Machado, L. A., Martin, S. T., Yang, Y., Wang, J., Artaxo, P., and Barbosa, H. M.: Substantial convection and precipitation enhancements by ultrafine aerosol particles, Science, 359, 411–418, https://doi.org/10.1126/science.aan8461, 2018. a, b
Gadgil, S.: The Indian monsoon and its variability, Annu. Rev. Earth Pl. Sc., 31, 429–467, https://doi.org/10.1146/annurev.earth.31.100901.141251, 2003. a
Gadgil, S., Rajeevan, M., and Nanjundiah, R.: Monsoon prediction – Why yet another failure, Curr. Sci. India, 88, 1389–1400, available at: http://www.jstor.org/stable/24110705 (last access: 5 May 2020), 2005. a
Gautam, R., Hsu, N. C., Lau, W. K. M., and Yasunari, T. J.: Satellite observations of desert dust-induced Himalayan snow darkening, Geophys. Res. Lett., 40, 988–993, https://doi.org/10.1002/grl.50226, 2013. a
GMAO (Global Modeling and Assimilation Office): MERRA-2 inst3_2d_gas_Nx: 2d,3-Hourly,Instantaneous,Single-Level,Assimilation,Aerosol Optical Depth Analysis V5.12.4, Greenbelt, MD, USA, Goddard Earth Sciences Data and Information Services Center (GES DISC), https://doi.org/10.5067/HNGA0EWW0R09, 2015a. a
GMAO (Global Modeling and Assimilation Office): MERRA-2 inst3_3d_asm_Np: 3d,3-Hourly,Instantaneous,Pressure-Level,Assimilation,Assimilated Meteorological Fields V5.12.4, Greenbelt, MD, USA, Goddard Earth Sciences Data and Information Services Center (GES DISC), https://doi.org/10.5067/QBZ6MG944HW0, 2015b. a
Han, J.-Y., Baik, J.-J., and Khain, A. P.: A numerical study of urban aerosol impacts on clouds and precipitation, J. Atmos. Sci., 69, 504–520, https://doi.org/10.1175/JAS-D-11-071.1, 2012. a
Hsu, N. C., Jeong, M. J., Bettenhausen, C., Sayer, A. M., Hansell, R., Seftor, C. S., Huang, J., and Tsay, S. C.: Enhanced Deep Blue aerosol retrieval algorithm: The second generation, J. Geophys. Res.-Atmos., 118, 9296–9315, https://doi.org/10.1002/jgrd.50712, 2013. a
Huffman, G. J., Bolvin, D. T., Nelkin, E. J., Wolff, D. B., Adler, R. F., Gu, G., Hong, Y., Bowman, K. P., and Stocker, E. F.: The TRMM multisatellite precipitation analysis (TMPA): Quasi-global, multiyear, combined-sensor precipitation estimates at fine scales, J. Hydrometeorol., 8, 38–55, https://doi.org/10.1175/JHM560.1, 2007. a
Indrani, P. and Al-Tabbaa, A.: Monsoon rainfall extreme indices and tendencies from 1954–2003 in Kerala, India, Climatic Change, 106, 407–419, https://doi.org/10.1007/s10584-011-0044-6, 2011. a
Inoue, T., Satoh, M., Miura, H., and Mapes, B.: Characteristics of cloud size of deep convection simulated by a global cloud resolving model over the western tropical Pacific, Journal of the Meteorological Society of Japan Ser. I, 86, 1–15, https://doi.org/10.2151/jmsj.86A.1, 2008. a
IPCC: Climate Change 2013: The Physical Science Basis. Contribution of Working Group I to the Fifth Assessment Report of the Intergovernmental Panel on Climate Change, edited by: Stocker, T. F., Qin, D., Plattner, G. K., Tignor, M., Allen, S. K., Boschung, J., Nauels, A., Xia, Y., Bex, V., and Midgley, P. M., Cambridge University Press, Cambridge, United Kingdom and New York, NY, USA, 1535 pp., https://doi.org/10.1017/CBO9781107415324, 2013. a
Iqbal, M. F. and Athar, H.: Validation of satellite based precipitation over diverse topography of Pakistan, Atmos. Res., 201, 247–260, https://doi.org/10.1016/j.atmosres.2017.10.026, 2018. a, b
Kant, S., Panda, J., Gautam, R., Wang, P. K., and Singh, S. P.: Significance of aerosols influencing weather and climate over Indian region, International Journal of Earth and Atmospheric Science, 4, 1–20, 2017. a
Kant, S., Panda, J., Pani, S. K., and Wang, P. K.: Long-term study of aerosol–cloud–precipitation interaction over the eastern part of India using satellite observations during pre-monsoon season, Theor. Appl. Climatol., 136, 605–626, https://doi.org/10.1007/s00704-018-2509-2, 2019. a
Kiranmayi, L. and Maloney, E. D.: Intraseasonal moist static energy budget in reanalysis data, J. Geophys. Res., 116, D21117, https://doi.org/10.1029/2011JD016031, 2011. a
Koo, M. S., Hong, S. Y., and Kim, J.: An evaluation of the tropical rainfall measuring mission (TRMM) multi-satellite precipitation analysis (TMPA) data over South Korea, Asia-Pacific J. Atmos. Sci., 45, 265–282, 2009. a
Krishnamurti, T. N.: Summer monsoon experiment – A review, Mon. Weather Rev., 113, 1590–1626, https://doi.org/10.1175/1520-0493(1985)113<1590:SMER>2.0.CO;2, 1985. a
Krishnan, R., Zhang, C., and Sugi, M.: Dynamics of breaks in the Indian summer monsoon, J. Atmos. Sci., 57, 1354–1372, https://doi.org/10.1175/1520-0469(2000)057<1354:DOBITI>2.0.CO;2, 2000. a
Kumar, K. K., Soman, M. K., and Kumar, K. R.: Seasonal forecasting of Indian summer monsoon rainfall: A review, Weather, 50, 449–467, https://doi.org/10.1002/j.1477-8696.1995.tb06071.x, 1995. a
Lau, W. K., Kim, M. K., Kim, K. M., and Lee, W. S.: Enhanced surface warming and accelerated snow melt in the Himalayas and Tibetan Plateau induced by absorbing aerosols, Environ. Res. Lett., 5, 025204, https://doi.org/10.1088/1748-9326/5/2/025204, 2010. a
Lau, W. K., Kim, K. M., Shi, J. J., Matsui, T., Chin, M., Tan, Q., Peters-Lidard, C., and Tao, W. K.: Impacts of aerosol–monsoon interaction on rainfall and circulation over Northern India and the Himalaya Foothills, Clim. Dynam., 49, 1945–1960, https://doi.org/10.1007/s00382-016-3430-y, 2017. a, b, c
Letcher, T. and Cotton, W. R.: The effect of pollution aerosol on wintertime orographic precipitation in the Colorado Rockies using a simplified emissions scheme to predict CCN concentrations, J. Appl. Meteorol. Clim., 53, 859–872, https://doi.org/10.1175/JAMC-D-13-0166.1, 2014. a
Levy, R. C., Remer, L. A., Mattoo, S., Vermote, E. F., and Kaufman, Y. J.: Second-generation operational algorithm: Retrieval of aerosol properties over land from inversion of Moderate Resolution Imaging Spectroradiometer spectral reflectance, J. Geophys. Res., 112, D13211, https://doi.org/10.1029/2006JD007811, 2007. a
Levy, R. C., Mattoo, S., Munchak, L. A., Remer, L. A., Sayer, A. M., Patadia, F., and Hsu, N. C.: The Collection 6 MODIS aerosol products over land and ocean, Atmos. Meas. Tech., 6, 2989–3034, https://doi.org/10.5194/amt-6-2989-2013, 2013. a
Li, Z., Niu, F., Fan, J., Liu, Y., Rosenfeld, D., and Ding, Y.: Long-term impacts of aerosols on the vertical development of clouds and precipitation, Nat. Geosci., 4, 888, https://doi.org/10.1038/ngeo1313, 2011. a
Li, Z., Rosenfeld, D., and Fan, J.: Aerosols and their impact on radiation, clouds, precipitation, and severe weather events, Oxford Research Encyclopedia of Environmental Science, https://doi.org/10.1093/acrefore/9780199389414.013.126, 2017. a
Liebmann, B. and Smith, C. A.: Description of a complete (interpolated) outgoing longwave radiation dataset, B. Am. Meteorol. Soc., 77, 1275–1277, available at: https://www.jstor.org/stable/26233278 (last access: 5 May 2020), 1996. a
Mayer, M. and Haimberger, L.: Poleward atmospheric energy transports and their variability as evaluated from ECMWF reanalysis data, J. Climate, 25, 734–752, https://doi.org/10.1175/JCLI-D-11-00202.1, 2012. a
Nandargi, S. and Dhar, O. N.: Extreme rainfall events over the Himalayas between 1871 and 2007, Hydrolog. Sci. J., 56, 930–945, https://doi.org/10.1080/02626667.2011.595373, 2011. a, b
NCAR/NOAA: NOAA Physical Sciences Laboratory (PSL), available at: https://www.esrl.noaa.gov/psd (last access: 5 May 2020), 1996. a
Ochoa, A., Pineda, L., Crespo, P., and Willems, P.: Evaluation of TRMM 3B42 precipitation estimates and WRF retrospective precipitation simulation over the Pacific–Andean region of Ecuador and Peru, Hydrol. Earth Syst. Sci., 18, 3179–3193, https://doi.org/10.5194/hess-18-3179-2014, 2014. a
Pillai, P. A. and Sahai, A. K.: Moist dynamics of active/break cycle of Indian summer monsoon rainfall from NCEPR2 and MERRA reanalysis, Int. J. Climatol., 34, 1429–1444, https://doi.org/10.1002/joc.3774, 2014. a
Platnick, S., Hubanks, P., Meyer, K., and King, M. D.: MODIS Atmosphere L3 Daily Product, NASA MODIS Adaptive Processing System, Goddard Space Flight Center, USA, https://doi.org/10.5067/MODIS/MOD08_D3.061, 2015. a
Rajeevan, M., Gadgil, S., and Bhate, J.: Active and break spells of the Indian summer monsoon, J. Earth Syst. Sci., 119, 229–247, https://doi.org/10.1007/s12040-010-0019-4, 2010. a, b
Ramachandran, S., Kedia, S., and Srivastava, R.: Aerosol optical depth trends over different regions of India, Atmos. Environ., 49, 338–347, https://doi.org/10.1016/j.atmosenv.2011.11.017, 2012. a
Rana, A., Jia, S., and Sarkar, S.: Black carbon aerosol in India: A comprehensive review of current status and future prospects, Atmos. Res., 218, 207–230, https://doi.org/10.1016/j.atmosres.2018.12.002, 2019. a
Reddy, M. D., Srivastava, A. K., Bisht, D. S., Singh, D., Soni, V. K., Singh, S., and Tiwari, S.: Columnar Aerosol Characteristics over a Highly Polluted Urban Station in North India Using Sun/Sky Radiometer Measurements, International Journal of Earth and Atmospheric Science, 5, 47–61, 2018. a
Rosenfeld, D., Lohmann, U., Raga, G. B., O'Dowd, C. D., Kulmala, M., Fuzzi, S., Reissell, A., and Andreae, M. O.: Flood or drought: how do aerosols affect precipitation?, Science, 321, 1309–1313, https://doi.org/10.1126/science.1160606, 2008. a, b
Saleeby, S. M., Cotton, W. R., Lowenthal, D., and Messina, J.: Aerosol impacts on the microphysical growth processes of orographic snowfall, J. Appl. Meteorol. Clim., 52, 834–852, https://doi.org/10.1175/JAMC-D-12-0193.1, 2013. a
Sapiano, M. R. P. and Arkin, P. A.: An intercomparison and validation of high-resolution satellite precipitation estimates with 3-hourly gauge data, J. Hydrometeorol., 10, 149–166, https://doi.org/10.1175/2008JHM1052.1, 2009. a
Sarangi, C., Tripathi, S. N., Tripathi, S., and Barth, M. C.: Aerosol-cloud associations over Gangetic Basin during a typical monsoon depression event using WRF-Chem simulation, J. Geophys. Res.-Atmos., 120, 10974–10995, https://doi.org/10.1002/2015JD023634, 2015. a
Sarangi, C., Tripathi, S. N., Kanawade, V. P., Koren, I., and Pai, D. S.: Investigation of the aerosol–cloud–rainfall association over the Indian summer monsoon region, Atmos. Chem. Phys., 17, 5185–5204, https://doi.org/10.5194/acp-17-5185-2017, 2017. a
Sarangi, C., Kanawade, V. P., Tripathi, S. N., Thomas, A., and Ganguly, D.: Aerosol-induced intensification of cooling effect of clouds during Indian summer monsoon, Nat. Commun., 9, 3754, https://doi.org/10.1038/s41467-018-06015-5, 2018. a, b
Scheel, M. L. M., Rohrer, M., Huggel, Ch., Santos Villar, D., Silvestre, E., and Huffman, G. J.: Evaluation of TRMM Multi-satellite Precipitation Analysis (TMPA) performance in the Central Andes region and its dependency on spatial and temporal resolution, Hydrol. Earth Syst. Sci., 15, 2649–2663, https://doi.org/10.5194/hess-15-2649-2011, 2011. a
Shi, H., Xiao, Z., Zhan, X., Ma, H., and Tian, X.: Evaluation of MODIS and two reanalysis aerosol optical depth products over AERONET sites, Atmos. Res., 220, 75–80, https://doi.org/10.1016/j.atmosres.2019.01.009, 2019. a
Shrestha, R. K., Connolly, P. J., and Gallagher, M. W.: Sensitivity of precipitation to aerosol and temperature perturbation over the foothills of the Nepal Himalayas, Proceedings, 1, 144, https://doi.org/10.3390/ecas2017-04146, 2017. a
Shrestha, S., Yao, T., and Adhikari, T. R.: Analysis of rainfall trends of two complex mountain river basins on the southern slopes of the Central Himalayas, Atmos. Res., 215, 99–115, https://doi.org/10.1007/s00704-019-02897-7, 2019. a
Takemura, T., Nozawa, T., Emori, S., Nakajima, T. Y., and Nakajima, T.: Simulation of climate response to aerosol direct and indirect effects with aerosol transport-radiation model, J. Geophys. Res., 110, D02202, https://doi.org/10.1029/2004JD005029, 2005. a
Tao, W. K., Chen, J. P., Li, Z., Wang, C., and Zhang, C.: Impact of aerosols on convective clouds and precipitation, Rev. Geophys., 50, RG2001, https://doi.org/10.1029/2011RG000369, 2012. a
TRMM (Tropical Rainfall Measuring Mission): TRMM (TMPA) Rainfall Estimate L3 3 hour 0.25 degree x 0.25 degree V7, Greenbelt, MD, Goddard Earth Sciences Data and Information Services Center (GES DISC), https://doi.org/10.5067/TRMM/TMPA/3H/7, 2011. a
Van den Heever, S. C. and Cotton, W. R.: Urban aerosol impacts on downwind convective storms, J. Appl. Meteorol. Clim., 46, 828–850, https://doi.org/10.1175/JAM2492.1, 2007. a
Varikoden, H. and Revadekar, J. V.: On the extreme rainfall events during the southwest monsoon season in northeast regions of the Indian subcontinent, Meteorol. Appl., 27, 1822, https://doi.org/10.1002/met.1822, 2019. a
Vinoj, V., Rasch, P. J., Wang, H., Yoon, J. H., Ma, P. L., Landu, K., and Singh, B.: Short-term modulation of Indian summer monsoon rainfall by West Asian dust, Nat. Geosci., 7, 308, https://doi.org/10.1038/ngeo2107, 2014. a
Wang, Y., Khalizov, A., Levy, M., and Zhang, R.: New Directions: Light absorbing aerosols and their atmospheric impacts, Atmos. Environ., 81, 713–715, https://doi.org/10.1016/j.atmosenv.2013.09.034, 2013. a
Wei, J., Li, Z., Peng, Y., and Sun, L.: MODIS Collection 6.1 aerosol optical depth products over land and ocean: validation and comparison, Atmos. Environ., 201, 428–440, https://doi.org/10.1016/j.atmosenv.2018.12.004, 2019a.
Wei, J., Li, Z., Sun, L., Peng, Y., and Wang, L.: Improved merge schemes for MODIS Collection 6.1 Dark Target and Deep Blue combined aerosol products, Atmos. Environ., 202, 315–327, https://doi.org/10.1016/j.atmosenv.2019.01.016, 2019b.
Wei, J., Peng, Y., Guo, J., and Sun, L.: Performance of MODIS Collection 6.1 Level 3 aerosol products in spatial-temporal variations over land, Atmos. Environ., 206, 30–44, https://doi.org/10.1016/j.atmosenv.2019.03.001, 2019c. a
Wendisch, M., Hellmuth, O., Ansmann, A., Heintzenberg, J., Engelmann, R., Althausen, D., Eichler, H., Müller, D., Hu, M., Zhang, Y., and Mao, J.: Radiative and dynamic effects of absorbing aerosol particles over the Pearl River Delta, China, Atmos. Environ., 42, 6405–6416, https://doi.org/10.1016/j.atmosenv.2008.02.033, 2008. a
Xiao, H., Yin, Y., Jin, L., Chen, Q., and Chen, J.: Simulation of the effects of aerosol on mixed phase orographic clouds using the WRF model with a detailed bin microphysics scheme, J. Geophys. Res.-Atmos., 120, 8345–8358, https://doi.org/10.1002/2014JD022988, 2015. a, b
Yang, K., Koike, T., Fujii, H., Tamura, T., Xu, X., Bian, L., and Zhou, M.: The daytime evolution of the atmospheric boundary layer and convection over the Tibetan Plateau: observations and simulations, J. Meteorol. Soc. Jpn., Ser. II, 82, 1777–1792, https://doi.org/10.2151/jmsj.82.1777, 2004. a
Yang, X. and Li, Z.: Increases in thunderstorm activity and relationships with air pollution in southeast China, J. Geophys. Res.-Atmos., 119, 1835–1844, https://doi.org/10.1002/2013JD021224, 2014. a
Zubler, E. M., Lohmann, U., Lüthi, D., Schär, C., and Muhlbauer, A.: Statistical analysis of aerosol effects on simulated mixed-phase clouds and precipitation in the Alps, J. Atmos. Sci., 68, 1474–1492, https://doi.org/10.1175/2011JAS3632.1, 2011. a