the Creative Commons Attribution 4.0 License.
the Creative Commons Attribution 4.0 License.
 | 10 Dec 2020
Measurement Report: Determination of aerosol vertical features on different timescales over East Asia based on CATS aerosol products
Yueming Cheng
Jiming Li
Guangyu Shi
The Cloud-Aerosol Transport System (CATS) lidar, on board the International Space Station (ISS), provides a new opportunity for studying aerosol vertical distributions, especially the diurnal variations, from space observations. In this study, we investigate the seasonal variations and diurnal cycles in the vertical aerosol extinction coefficients (AECs) over East Asia by taking advantage of 32 months of continuous and uniform aerosol measurements from the CATS lidar. Over the Tibetan Plateau, a belt of AECs at approximately 6 km between 30 and 38∘ N persistently exists in all seasons with an obvious seasonal variation. In summer, the aerosols at 6 km are identified as a mixture of both anthropogenic aerosols transported from India and coarse dust particles from Asian dust sources. In addition, the high AECs up to 8 km in summer over the Tibetan Plateau are caused by smoke aerosols from thermal dynamic processes. In fall and winter, the northern slope of the plateau is continuously influenced by both dust aerosols and polluted aerosols transported upslope from cities located at lower elevations in northwestern Asia. The diurnal variation in AECs in North China is mainly related to the diurnal variations in the transported dust and local polluted aerosols. Below 2 km, the AEC profiles in North China at 06:00 and 12:00 CST (China standard time) are significantly higher than those at 00:00 and 18:00 CST, reaching a maximum at midday. The aerosol vertical profiles over the Tarim Desert region in summer have obvious diurnal variations, and the AECs at 12:00 and 18:00 CST are significantly higher than those at 00:00 and 06:00 CST, which are induced by the strong diurnal variations in near-surface wind speeds. In addition, the peak in the AEC profiles has a significant seasonal variation, which is mainly determined by the boundary layer height.
- Article
(9615 KB) - Full-text XML
-
Supplement
(7923 KB) - BibTeX
- EndNote


Knowledge of aerosol optical properties, such as the aerosol optical thickness (AOT) and their vertical distributions, is critical for estimating the effects of aerosol particles on air quality, radiative forcing, and their related impacts on climate (Liu et al., 2011, 2014; Myhre et al., 2013; Ramanathan et al., 2001; Sato et al., 2018; Sato and Suzuki, 2019; Yan and Wang, 2020). Aerosol can significantly alter the vertical profile of solar heating, with great implications for atmospheric stability and dynamics within the lower troposphere (Huang et al., 2009). However, investigation of aerosol particle properties and their temporal–spatial variations, especially their vertical structure, is still poor. The lack of information on the aerosol vertical distributions is one of the main underlying factors producing considerable uncertainty in aerosol direct radiative forcing, as the predictions from atmospheric models typically suffer from great variability (Huneeus et al., 2011; Sekiyama et al., 2010; Yumimoto et al., 2008).
Lidar instruments are useful tools in research on aerosol vertical distributions (Sugimoto and Huang, 2014; Wang et al., 2020c) and can be implemented as aircraft-based lidar, ground-based lidar, or the space-based Cloud-Aerosol Lidar with Orthogonal Polarization (CALIOP) on board the Cloud-Aerosol Lidar and Infrared Pathfinder Satellite Observation (CALIPSO) satellite (Winker et al., 2007). Due to the geographic limitations of instruments, aircraft-based and ground-based observations are always carried out to explore the climatology aspects of aerosol vertical structures and their associated climatic impacts at the selected sites (Z. Huang et al., 2010). Although CALIOP can provide a better understanding of the effects of regional aerosols on radiative forcing (Jia et al., 2018; Oikawa et al., 2013, 2018), climate change (J. Huang et al., 2010), air quality (Huang et al., 2015; Yu et al., 2010), and cloud properties (Li et al., 2017), it is still difficult to investigate the full diurnal cycle of aerosol vertical structures using CALIOP because of its 16 d repeat cycle. As aerosols can exhibit strong diurnal behavior, observations of aerosol diurnal variations are needed to improve simulations of pollution processes, geochemical cycles, and, ultimately, climate trends. The measurement of diurnal variations in aerosol vertical properties is especially crucial for visibility and aerosol particle forecasts.
The Cloud-Aerosol Transport System (CATS) lidar is installed on board the International Space Station (ISS) and observes with a nearly 3 d repeat cycle (McGill et al., 2015). It can provide a new opportunity for studying diurnal variations in aerosol vertical distributions from space observations at the global scale. Compared with the lidar data from CALIOP, CATS can supply better temporal and spatial coverage of aerosols over the tropics and midlatitudes at different local times each overpass that are often hours apart from the CALIOP observations (York et al., 2016). Because CATS is a new lidar instrument, there have been relatively few studies conducted with CATS aerosol products to date. In a comparison with the European Aerosol Research Lidar Network (EARLINET), Proestakis et al. (2019) presented a quantitative assessment of the CATS Level 2 aerosol backscatter coefficient product and revealed that low negative biases may lead to the slight uncertainties in AOTs in climate studies. Lee et al. (2019) validated the CATS aerosol products using different multiplatform observations (i.e., the Aerosol Robotic Network, AERONET; the Moderate Resolution Imaging Spectroradiometer, MODIS; and CALIOP) and analyzed the diurnal variations in aerosol extinctions from a global perspective. The results show that the CATS aerosol extinction profiles are in accordance with those from CALIOP despite an apparent CALIOP underestimation in the lowest 2 km (height). Rajapakshe et al. (2017) also reported differences between CATS and CALIOP in that the bottom of the above-cloud aerosol layer identified by CATS is much lower than that from CALIOP. In addition, Christian et al. (2019) applied the CATS data to evaluate the hemispheric transport of pyrocumulonimbus smoke aerosols simulated by a chemical transport model. Callewaert et al. (2019) also used the lidar measurements from CATS to conduct a qualitative comparison of dust aerosol concentration profiles retrieved by the Mineral Aerosol Profiling from Infrared Radiances algorithm. The CATS products can not only catch the fast-moving volcanic SO2 and aerosol clouds, but they also constrain the trajectory-based estimates, thereby producing more accurate dispersion patterns (Hughes et al., 2016). However, comprehensive research is still lacking that focuses on the East Asian aerosol features with different timescales based on the long-term and continuous satellite-based CATS observations, which specialize in providing high-frequency aerosol observations.
East Asia, which has experienced increasing air pollution over the last several decades, currently attracts considerable attention. The subregions over East Asia have different topographies and climates, and the atmospheric aerosols in East Asia are a complex mixture of various constituents, including anthropogenic aerosols originating from complicated sources and natural windblown dusts from desert regions. Thus, it is imperative to provide insights into the seasonal variations and diurnal cycles of the aerosol vertical features across East Asia.
Therefore, in this paper, we present the results of the analysis of temporal–spatial distributions of AOTs and the aerosol extinction coefficients (AECs) observed by CATS collected from 2015 to 2017 over East Asia. Brief descriptions of the selected regions and observations used in the analyses are introduced in Sect. 2. Section 3 shows the seasonal variations in CATS AOTs and compares them with those from MODIS to prove the reasonability of CATS aerosol products. The meridional cross sections of AECs and aerosol depolarization ratios (ADRs) as well as the seasonal and diurnal variations in AEC profiles over three selected regions (North China, the Tibetan Plateau, and the Tarim Basin) are also presented in Sect. 3. Conclusions are given in Sect. 4.
2.1 Selected regions
The study domain was selected as a bounded region from 15 to 50∘ N and from 70 to 140∘ E, as shown in Fig. 1. By considering the differences in climate and terrain of each subregion of East Asia, we are not only studying East Asia as a whole but are also selecting typical regions based on the geographical location and dominant aerosol type for the comprehensive analysis of the aerosol optical properties over each region. Therefore, three regions (highlighted using red rectangles in Fig. 1) were selected: (1) the Tarim Basin, the largest dust source region in East Asia; (2) the Tibetan Plateau, the highest plateau in the world and an important moisture source affecting the global hydrological cycle; and (3) North China, the region of the great emissions of anthropogenic aerosol pollution.
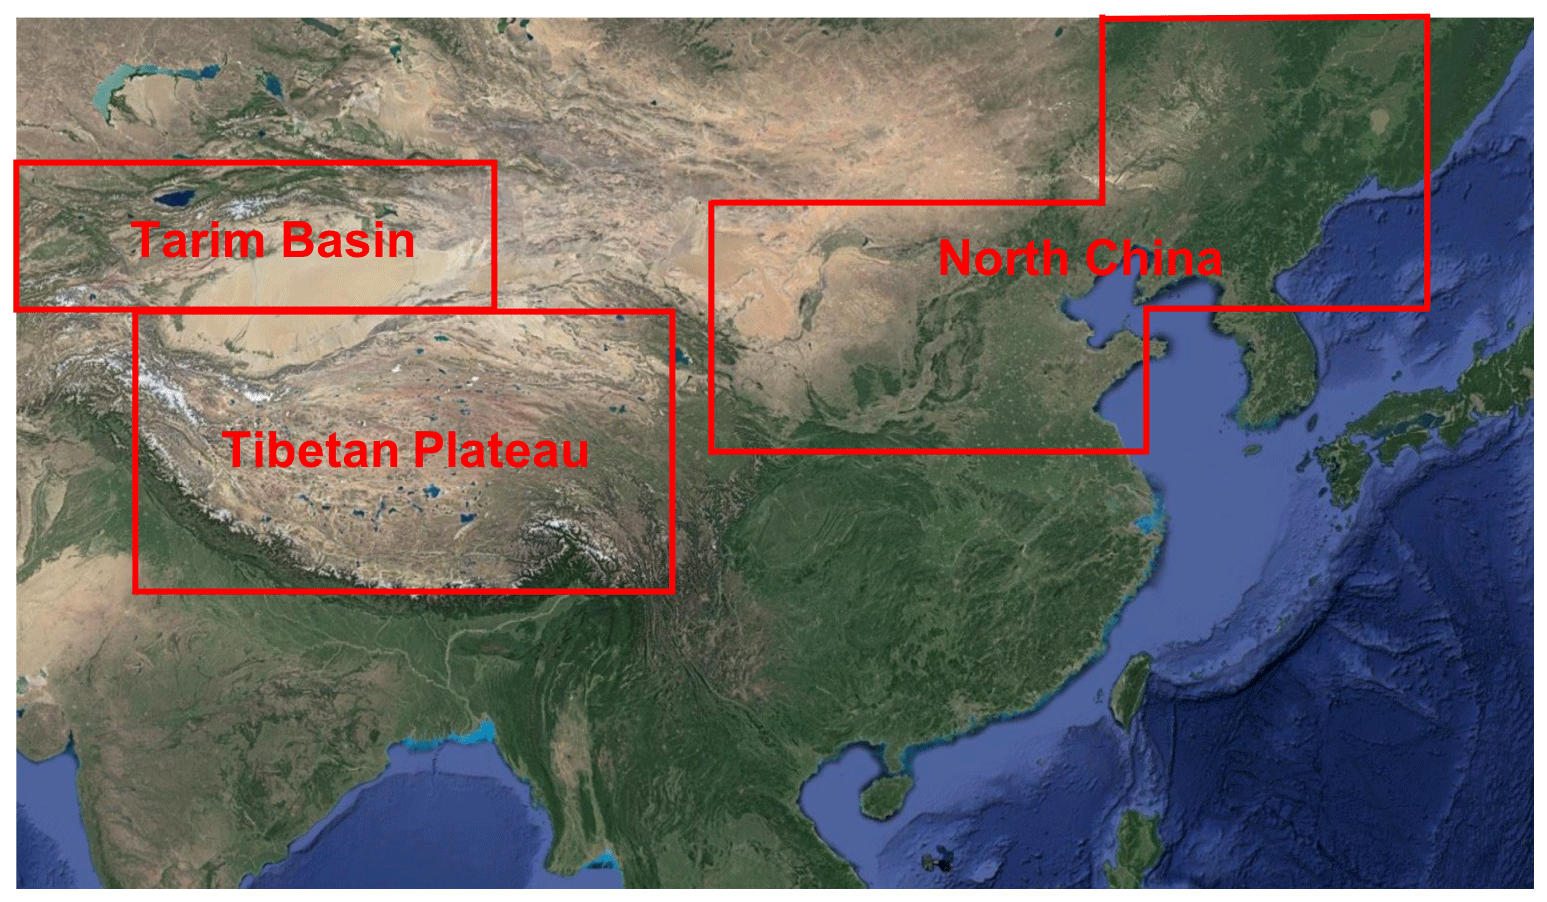
Figure 1The three regions used in this study. The map was created in © Google Maps 2020.
2.2 Datasets
2.2.1 CATS
The CATS (https://cats.gsfc.nasa.gov, last access: 15 June 2020), launched in January 2015, is a multiwavelength lidar remote sensing instrument that provides vertically resolved measurements of clouds and aerosols from the ISS. One benefit of CATS is the ISS orbital characteristic: a 3 d repeat cycle that enables better temporal and spatial coverage (with respect to measurements) over the tropics and midlatitudes than that of CALIOP (McGill et al., 2015; York et al., 2016).
In this study, CATS Level 2 Operational (L2O) version 3.00 5 km aerosol profile products for the entire period from March 2015 to October 2017 are used for analysis. CATS L2O aerosol profile products include day or night vertical profiles of geophysical parameters derived from Level 1 data, such as the vertical feature mask and profiles of aerosol properties (i.e., extinction, particle backscatter, and depolarization ratio). CATS L2O aerosol profile data are provided at 1064 nm, with a uniform spatial resolution of 60 m vertically and 5 km horizontally over an altitude range from −1.0 to 30 km. CATS also provides data at 532 nm; however due to a laser-stabilization issue, 532 nm data are not recommended for use. We only use 1064 nm products, referring to York et al. (2016) and Lee et al. (2019). In addition, owing to the limited contributions of aerosol above the troposphere, we only consider the data below an altitude of 10 km. The averaged vertical distributions of aerosols from CATS compare reasonably well with those from CALIOP (shown in Fig. S1 in the Supplement). The aerosol optical depths of CATS are obtained by integrating the 1064 nm aerosol extinction profile. If there are clouds in the column that are found have horizontally oriented ice (HOI) crystals, it is likely that the quality of the column optical depth is low. The anomalously high backscatter from HOI clouds generally makes the extinction retrieval more difficult. Because all of the data below the HOI cloud is rescaled by the retrieval optical depth, the extinction data below could be suspect. The CATS-derived aerosol subtype products are directly provided by CATS. The aerosol features for CATS are retrieved depending on the feature-integrated depolarization ratio at 1064 nm, the feature-integrated total attenuated backscatter at 1064 nm, the surface type (for maritime), and the feature altitude, which stem from the CALIOP aerosol typing algorithm (Omar et al., 2009). Moreover, the Modern-Era Retrospective analysis for Research and Applications, version 2 (MERRA-2) aerosol products are incorporated to help guide aerosol typing in instances where the observed quantities are characteristic of multiple aerosol types.
The linear volume total depolarization ratio is defined as the ratio of perpendicular total (Rayleigh and particle) backscatter to parallel total backscatter. The value of the depolarization ratio depends on the symmetry of the molecule and the normal vibrational mode. Total depolarization ratios are reported for each 5 km profile and 60 m range bin in which atmospheric particulates were detected. Dust aerosols have a large linear depolarization ratio due to the non-sphericity of dust particles, which is different from other types of aerosols. Therefore, the ADR is an effective parameter for the identification of dust aerosols (Murayama et al., 2001). In this study, 0.25 and 0.15 are chosen as the ADR thresholds for classifying dust and dust mixture aerosols.
To identify the aerosol signals and remove uncertain observations, we conduct quality control procedures for the aerosol extinction coefficients using several quality assurance thresholds (including an extinction quality control, QC, flag; a feature type score; and uncertainty of extinction coefficients) according to Lee et al. (2019). The quality control procedures include the following: (1) the extinction QC value should be equal to zero, indicating that the final lidar ratio is unchanged and nonopaque layer; (2) the feature type must be determined as aerosols only; (3) the score of feature type should be greater than −10 and lower than −2, indicating high confidence in discriminating aerosols; (4) the uncertainty of the extinction coefficient must be lower than 10 km−1, indicating a stable iteration. In addition, the total depolarization ratio is more constrained using a threshold to eliminate the missing value (Total_Depolarization_Ratio_1064_Fore_FOV >= 0.0). After subjecting the data to quality control, we aggregate the original CATS aerosol extinction coefficients and total depolarization ratios to a horizontal resolution and a 0.24 km vertical resolution for each hour within ±30 min. The horizontal pixel size is provided for further aerosol data assimilation (Cheng et al., 2019).
2.2.2 MODIS
The MODIS (https://modis.gsfc.nasa.gov, last access: 15 June 2020) instruments on board both the Terra and Aqua platforms provide nearly daily global coverage of key atmospheric and land surface parameters (Remer et al., 2005; https://modis.gsfc.nasa.gov). The MODIS Aqua and Terra Collection 6.1 Level 3 Dark Target (DT) and Deep Blue (DB) combined monthly AOTs at 550 nm from 2015 to 2017 are averaged as the climatological values for CATS AOTs validation.
3.1 Seasonal variations in AOTs in East Asia
Figure 2 shows the spatial distributions of CATS AOTs at 1064 nm and MODIS AOTs at 550 nm for the four seasons (spring – MAM; summer – JJA; fall – SON; winter – DJF), during the period from March 2015 to October 2017. To construct Fig. 2, quality-assured CATS aerosol extinction coefficients are first binned on a grid over the globe and then vertically integrated within 10 km altitude as CATS AOTs. Overall, although MODIS AOTs are systematically higher than CATS AOTs over East Asia, both CATS and MODIS AOTs yield similar spatial patterns of heavy aerosol loadings clustered in northwestern China, eastern China, and northern India. The biases between MODIS and CATS AOTs are probably not only due to the instrument capabilities in different channels but also the deficiency of lidar systems in detecting tenuous layers of signal below the minimum detection thresholds (Proestakis et al., 2019). Moreover, the MODIS aerosol products monitor the ambient aerosol properties under cloud-free conditions (Levy et al., 2013), whereas the aerosol optical properties in CATS are retrieved under all sky conditions. In northwestern China, the locations of hot spots with high AOTs remain unchanged throughout the whole year, but the strengths of AOT centers have significant seasonal variations. Both the CATS and MODIS AOTs caused by the natural dust aerosols mobilized around the Taklimakan Desert are higher than 0.5 in spring and summer, and decrease to 0.3 in fall and winter. The dust storms driving into Northwest China from the Taklimakan Desert combined with those from the Gobi Desert could also enhance the AOTs over the downwind regions in China, especially in springtime (Shao et al., 2011). The significant seasonal variations in the high-AOT regions over eastern China are found in MODIS AOTs depending on the seasonal changes in aerosol emissions and the influences of the East Asian monsoon (Li et al., 2016; Wu et al., 2016). The anthropogenic emissions of sulfate and carbonaceous aerosols in eastern China are related to the seasonal cycle of human activities including industry, agriculture, and transportation. Compared with those during the cold season (spring and winter), the MODIS AOTs in the Sichuan Basin are obviously reduced in the warm season (summer and autumn). This is probably due to the strong wet removal of aerosols by a sufficient warm and wet flow from the Pacific Ocean. Due to the intense biomass burning emissions in spring over Southeast Asia, biomass burning aerosols transported from source regions cause the significantly high MODIS AOTs over South China. Over eastern China, the continuous high MODIS AOTs are located in the Beijing–Tianjin–Hebei urban agglomeration throughout the year and peak in the summer season. In summer, convective turbulence may transport low-level aerosol upward to a high altitude, and high humidity and temperature conditions can increase the rate of gas–particle transformation and hygroscopic growth, which will increase aerosol backward scattering, and thus lead to the high AOT in the areas with relatively higher pollutant emissions (Henriksson et al., 2011). In fall and winter, the northern cold, dry, and clean winter monsoon accelerates the diffusion of aerosols, thereby decreasing the AOTs in eastern China. However, as 1064 nm measurements are less sensitive to fine-mode aerosols, such as smoke and pollutant aerosols, compared with coarse aerosols, such as dust aerosols, the CATS has some difficulty catching the seasonal variations in AOTs in eastern China, which are controlled by fine particles. For the entire year, the CATS AOTs in eastern China are generally approximately 0.3, whereas the MODIS AOTs are more than twice those of the CATS, particularly during spring and summer. The annual cycle of AOT in India consists of superimposed seasonal cycles of fine anthropogenic particles and coarse natural particles. Therefore, the seasonal cycles in India are strong, with the seasonal cycle for anthropogenic aerosols having its maximum in the winter and that of natural aerosols having its maximum in summer (Henriksson et al., 2011). The major natural aerosol over South Asia is the windblown mineral dust from the arid and semiarid regions of southwest Asia, such as the Thar Desert. Both CATS and MODIS can catch the maximums of AOTs around northwestern India in summer caused by dust aerosols due to the higher wind speeds during this season.
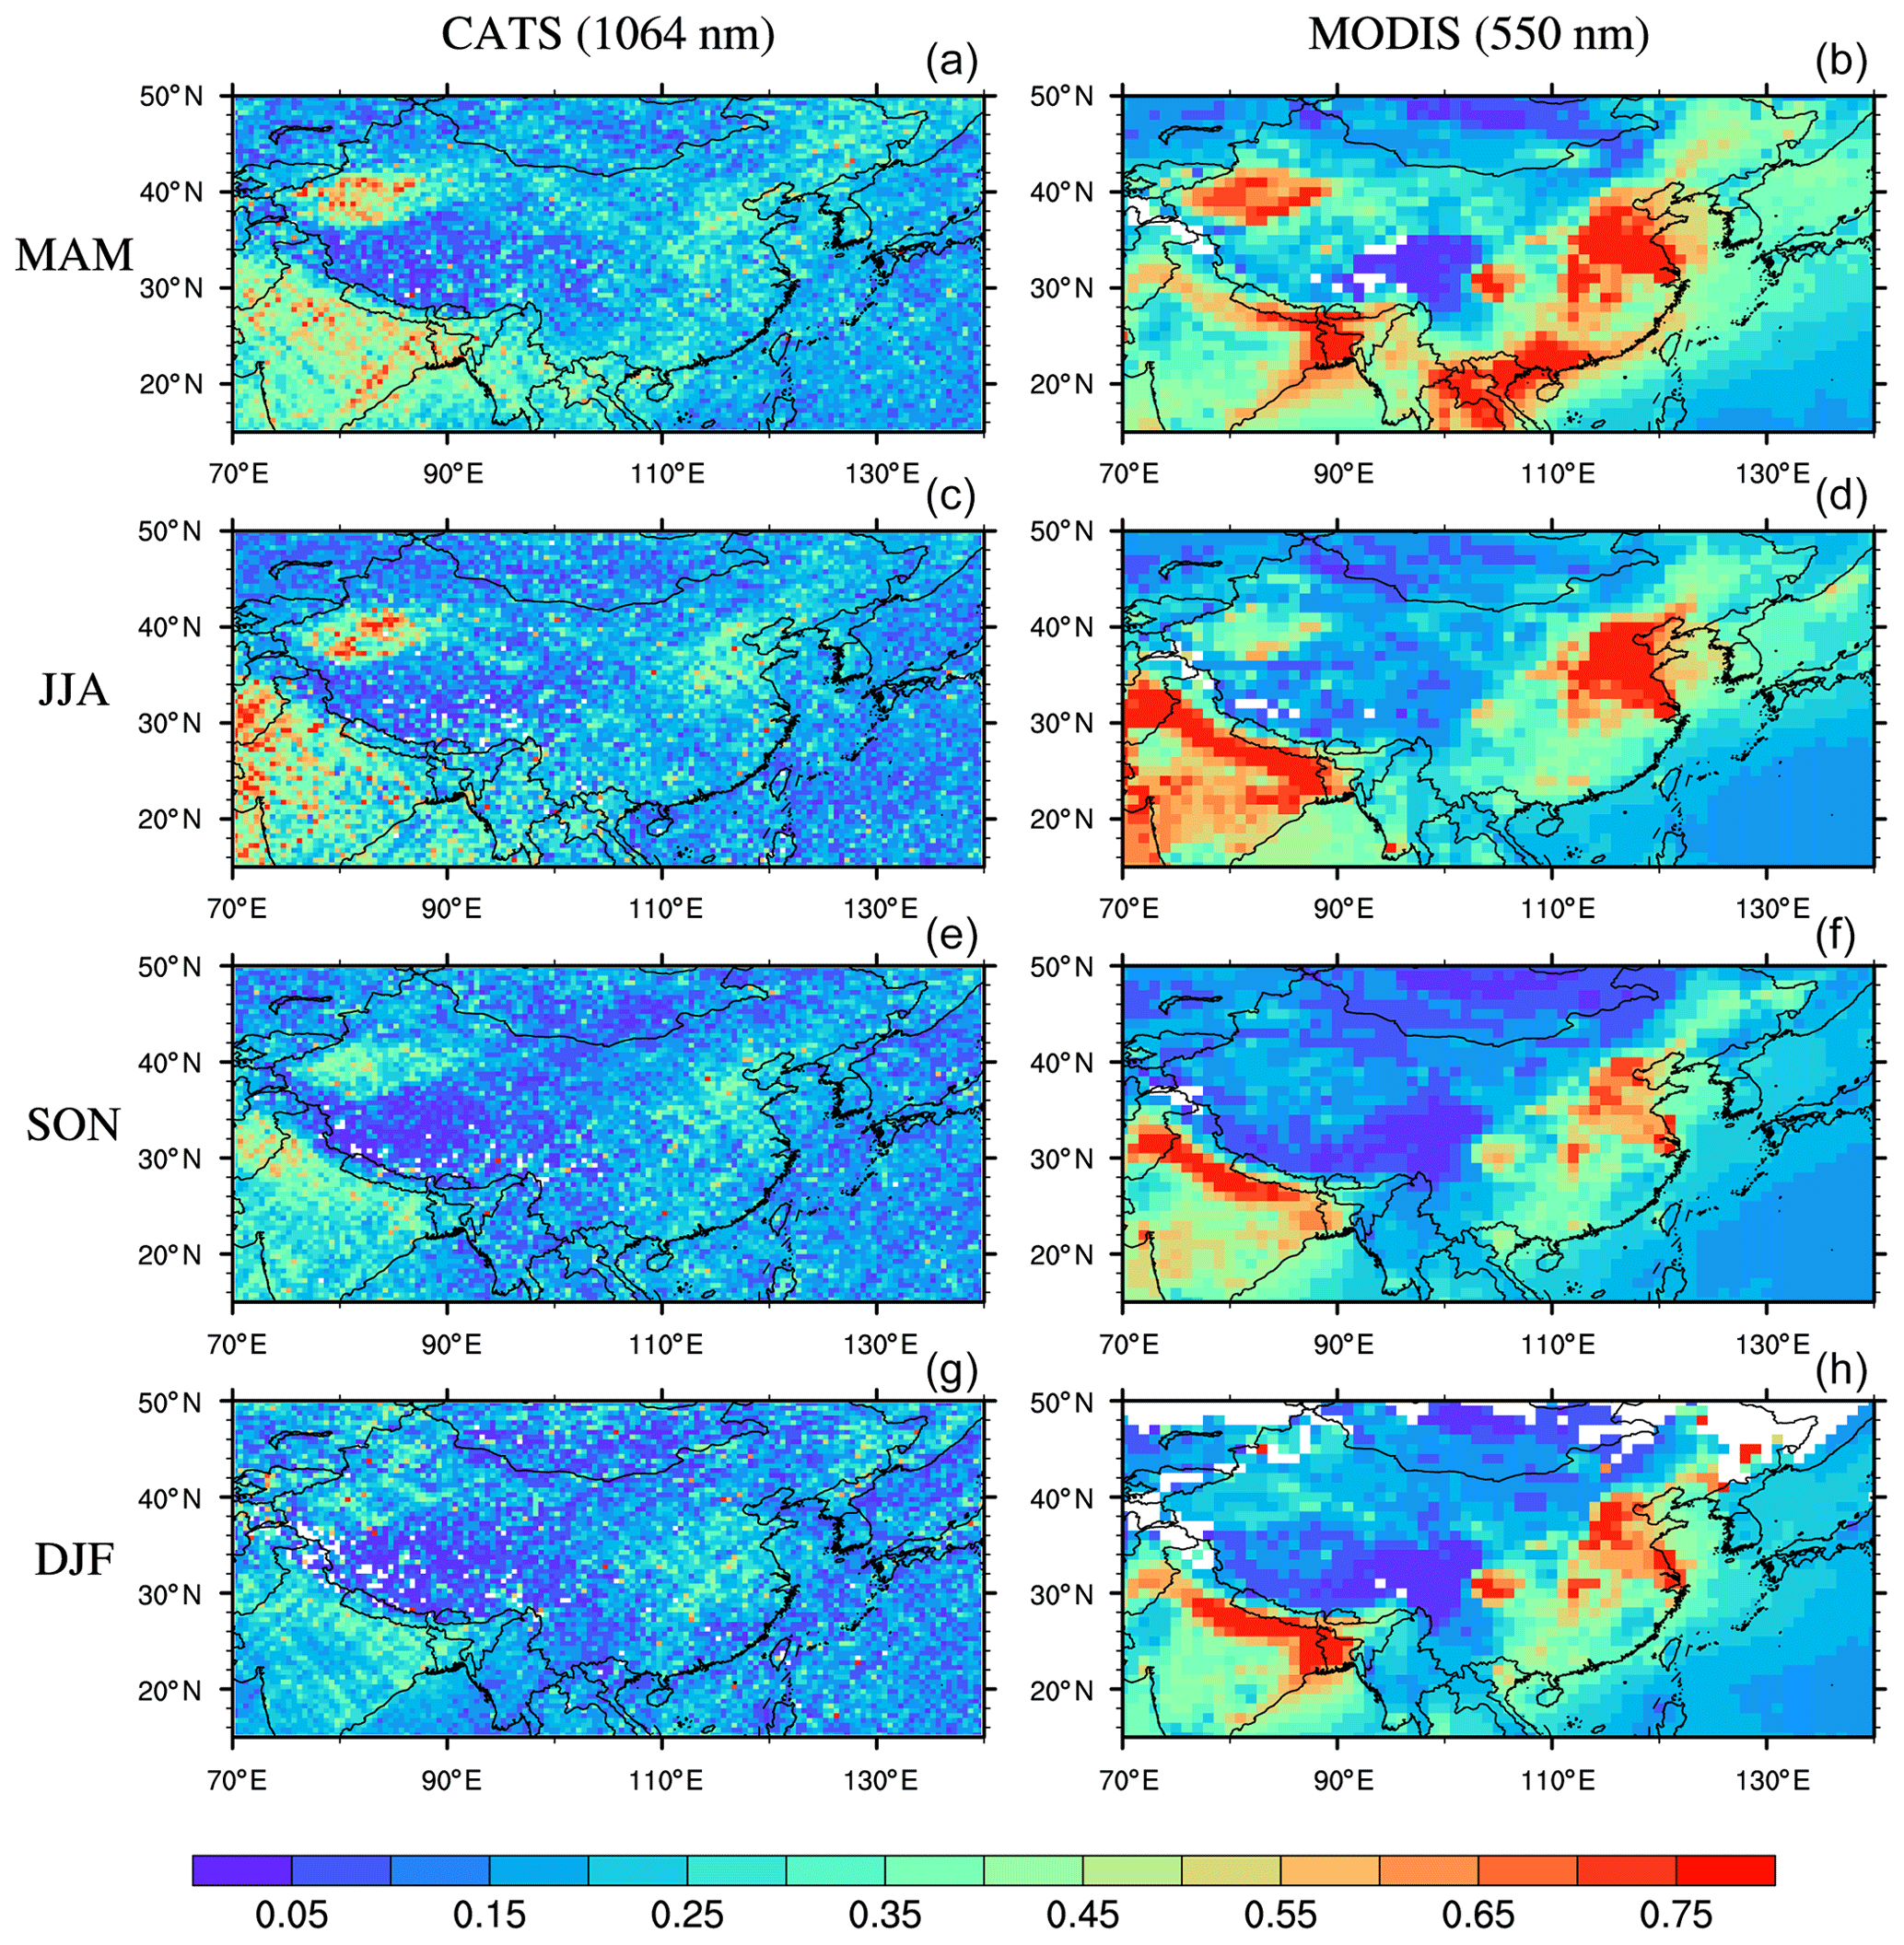
Figure 2Seasonally averaged AOT distributions from CATS at 1064 nm and MODIS at 550 nm for 2015–2017: (a, b) spring (MAM); (c, d) summer (JJA); (e, f) fall (SON); and (g, h) winter (DJF).
Similar to Fig. 2, Fig. S2 in the Supplement shows the spatial distribution of CATS AOTs that are aerosol extinction columns integrated below 1 km, from 1 to 2 km, and above 2 km from the ground for the four seasons. Figure S3 in the Supplement is similar to Fig. S2, but it shows the total depolarization ratios. The annual spatial patterns of AOTs below 1 km and between 1 and 2 km are generally in accordance with that of the column-integrated AOTs below 10 km. Above 2 km, it is difficult to find any characteristics in the spatial distributions, which is probably because of the scarce aerosols and the complicated transport pathways above the boundary layer. This indicates that the spatial distributions of column aerosols mainly rely on the near-surface aerosols rather than long-range transport. In contrast to the slight AOT variations in the horizontal orientation above 2 km, the annual total depolarization ratios above 2 km show an obvious decreasing tendency from Northwest to Southeast Asia, which is also revealed below 2 km. This means that a part of the dust aerosols with a relatively small size are lifted from the source regions by vertical convection and transported in the troposphere. In summer, the mean integrated AOTs above 1 km are significantly higher than those below 1 km in the Taklamakan Desert, which reports stronger heat convection in summer than in spring over this source region. Moreover, it is interesting to find that the AOTs in Northeast China in spring are obviously higher than in other seasons and most of the aerosols are gathered above 2 km, which was also found by Qiu et al. (2018). According to the frequency of occurrences of the CATS-derived vertical aerosol subtypes in Northeast China, the aerosols above 2 km in spring are controlled by dust and dust mixture aerosols, which are mainly transported by the westerlies from the Asian dust source regions.
3.2 Meridional cross sections of AECs and ADRs over selected regions
In this section, the aerosol vertical distributions are studied as the meridional cross sections for the three selected regions in the four seasons. The probability distributions of the CATS-derived vertical aerosol subtypes in Fig. 3 are shown as further analysis of the discrepancies in aerosol compositions in different regions. The height of the regional mean planetary boundary layer (PBLH) and the standard deviation of the seasonal average are also given in Fig. 3. The PBLH every 6 h is from the National Centers for Environmental Prediction (NCEP) Final (FNL) analysis (NOAA/NCEP, 2000; https://rda.ucar.edu/datasets/ds083.2/, last access: 15 June 2020). This PBLH represents the height of the atmospheric layer from the Earth's surface up to an altitude of about 1 km, in which the wind speed and direction are affected by frictional interaction with objects on the Earth's surface. The mean PBLH is simply averaged, and the standard deviation of the PBLH indicates the dispersion of the PBLH in each season for each region. Figures 4 and 5 give the vertical structure of AECs and ADRs observed from CATS by season over North China, the Tibetan Plateau, and the Tarim Basin in relation to the zonal mean regional surface elevation. In addition, to explore the diurnal variations in the AEC meridional cross sections, Figs. S4–S9 in the Supplement show the 6 h (00:00, 06:00, 12:00, and 18:00 CST; China standard time) vertical structure of AECs and ADRs observed from CATS by season over the three selected regions.
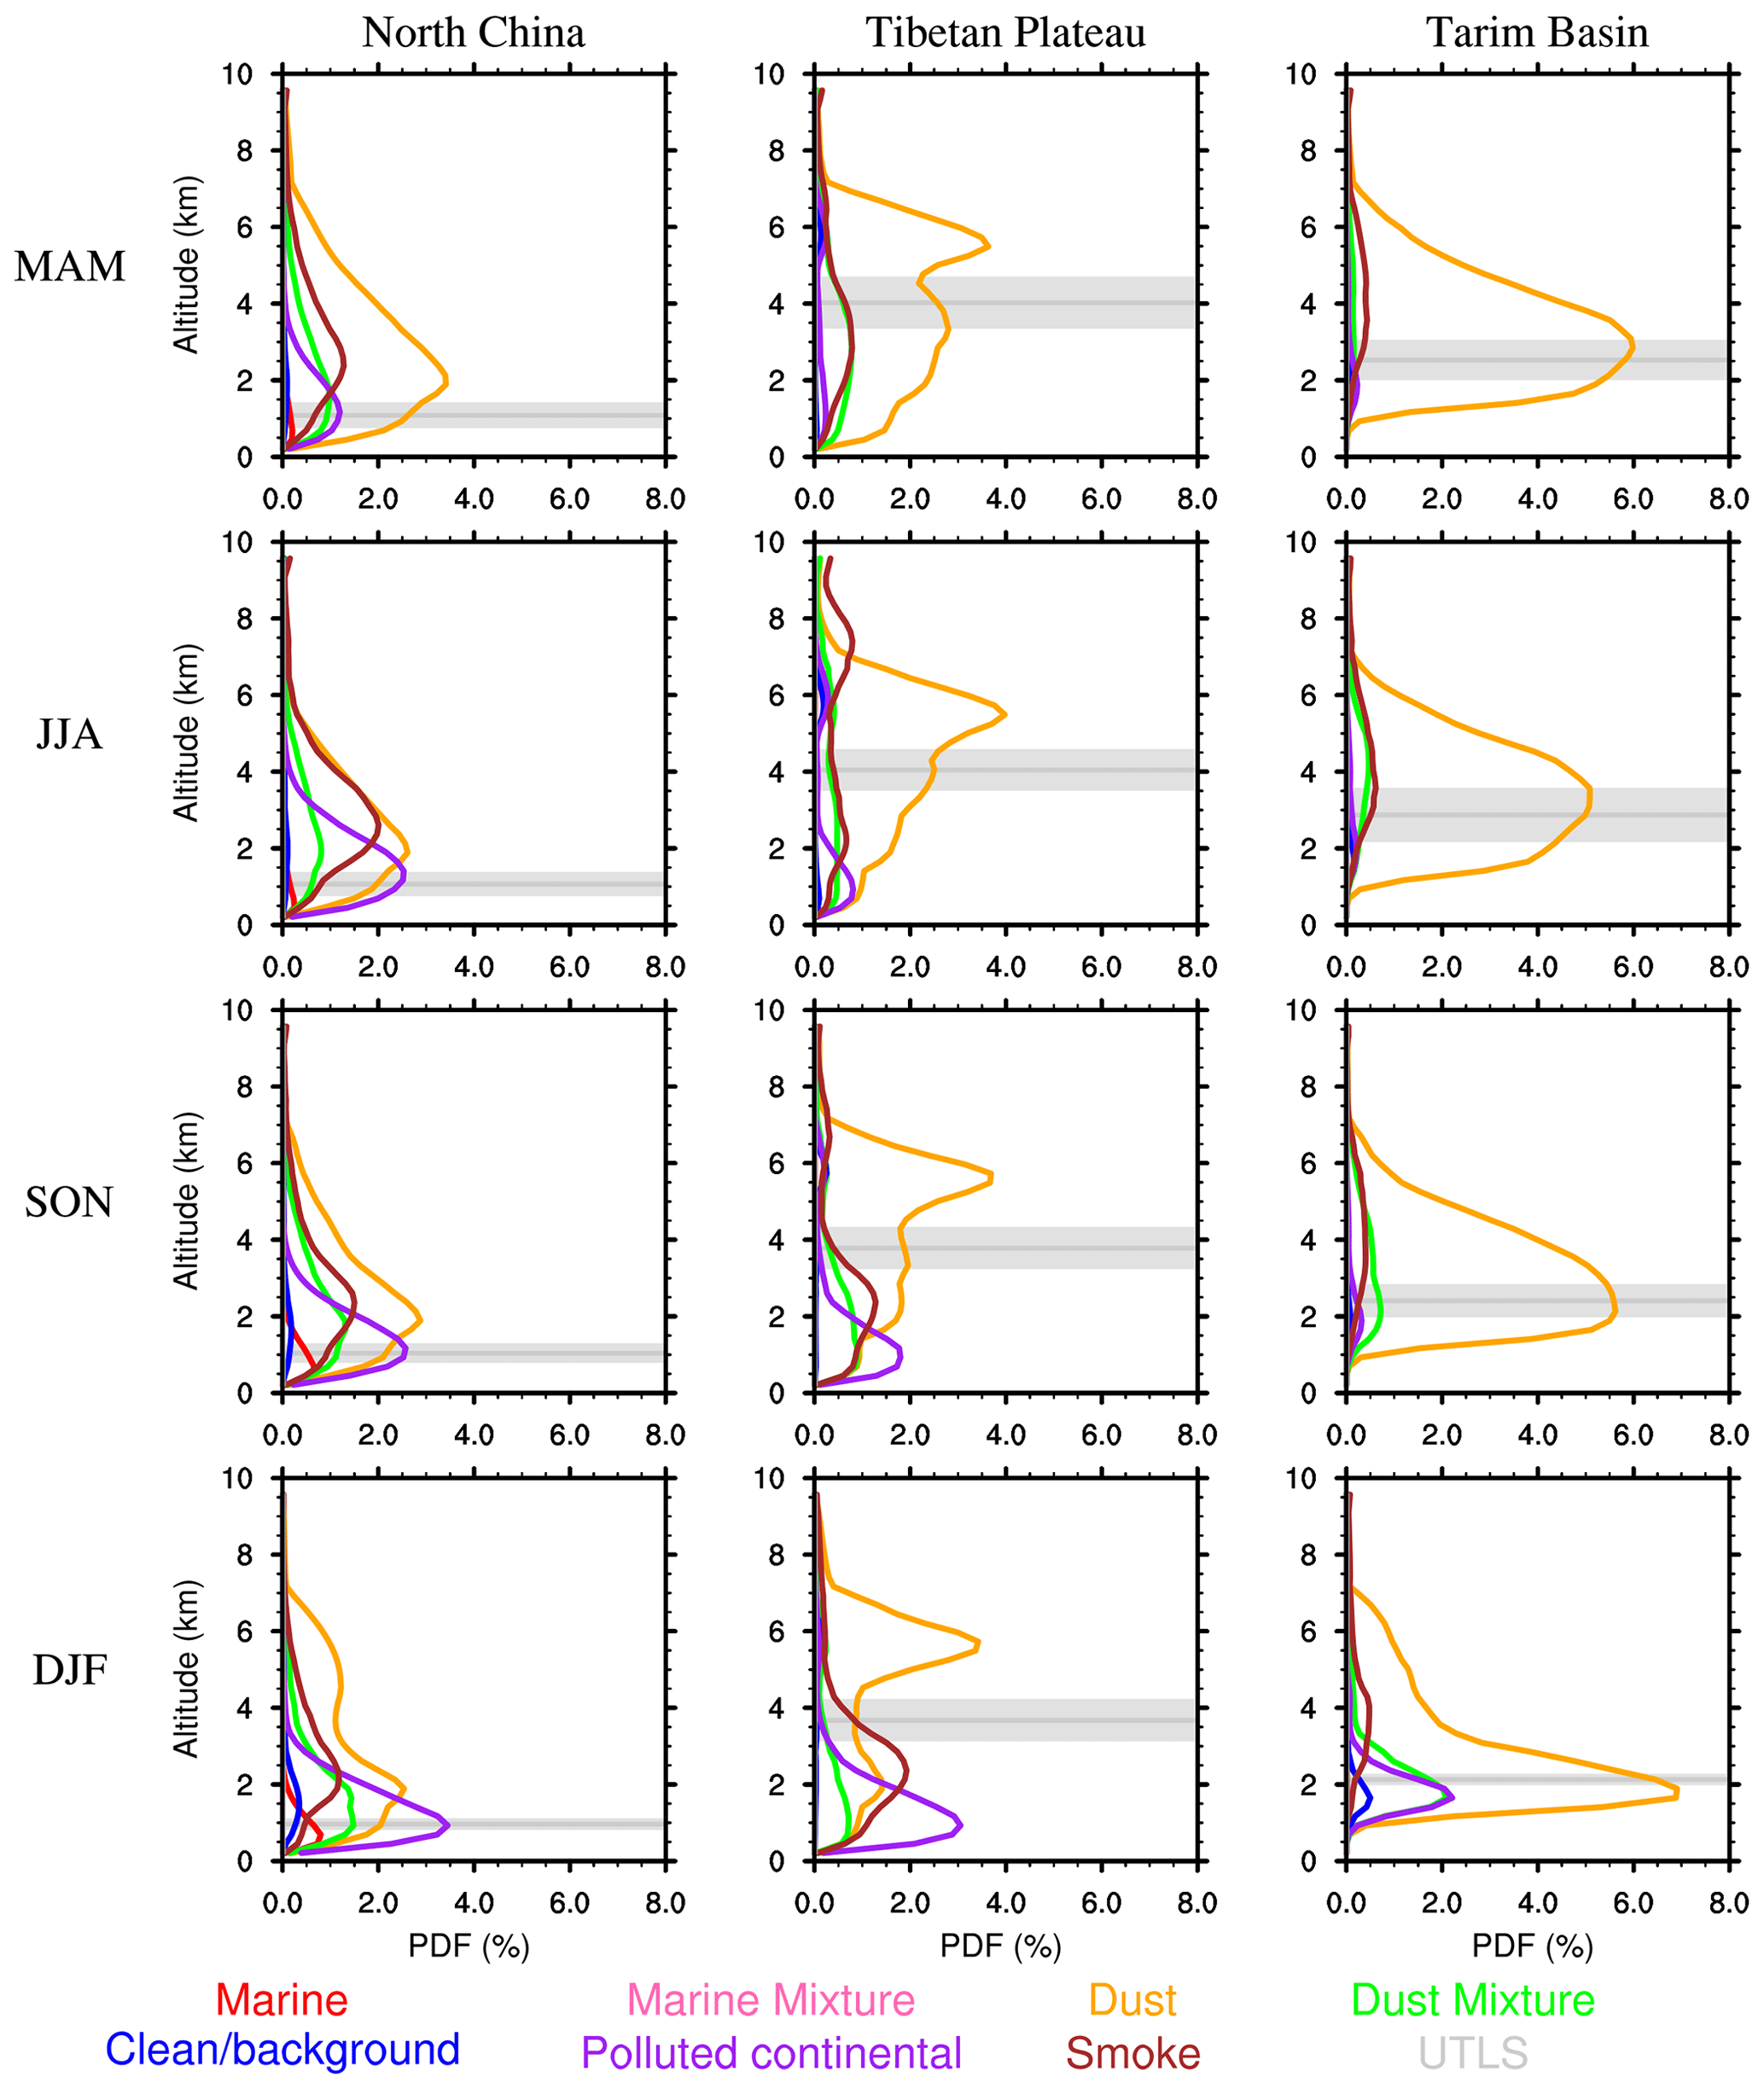
Figure 3Probability distributions (frequency of occurrence) of the CATS-derived vertical aerosol subtypes by season over the three regions. The gray lines and filled areas correspond to the height of the regional mean planetary boundary layer (km) from the NCEP FNL reanalysis data and 1 standard deviation of the seasonal average, respectively.
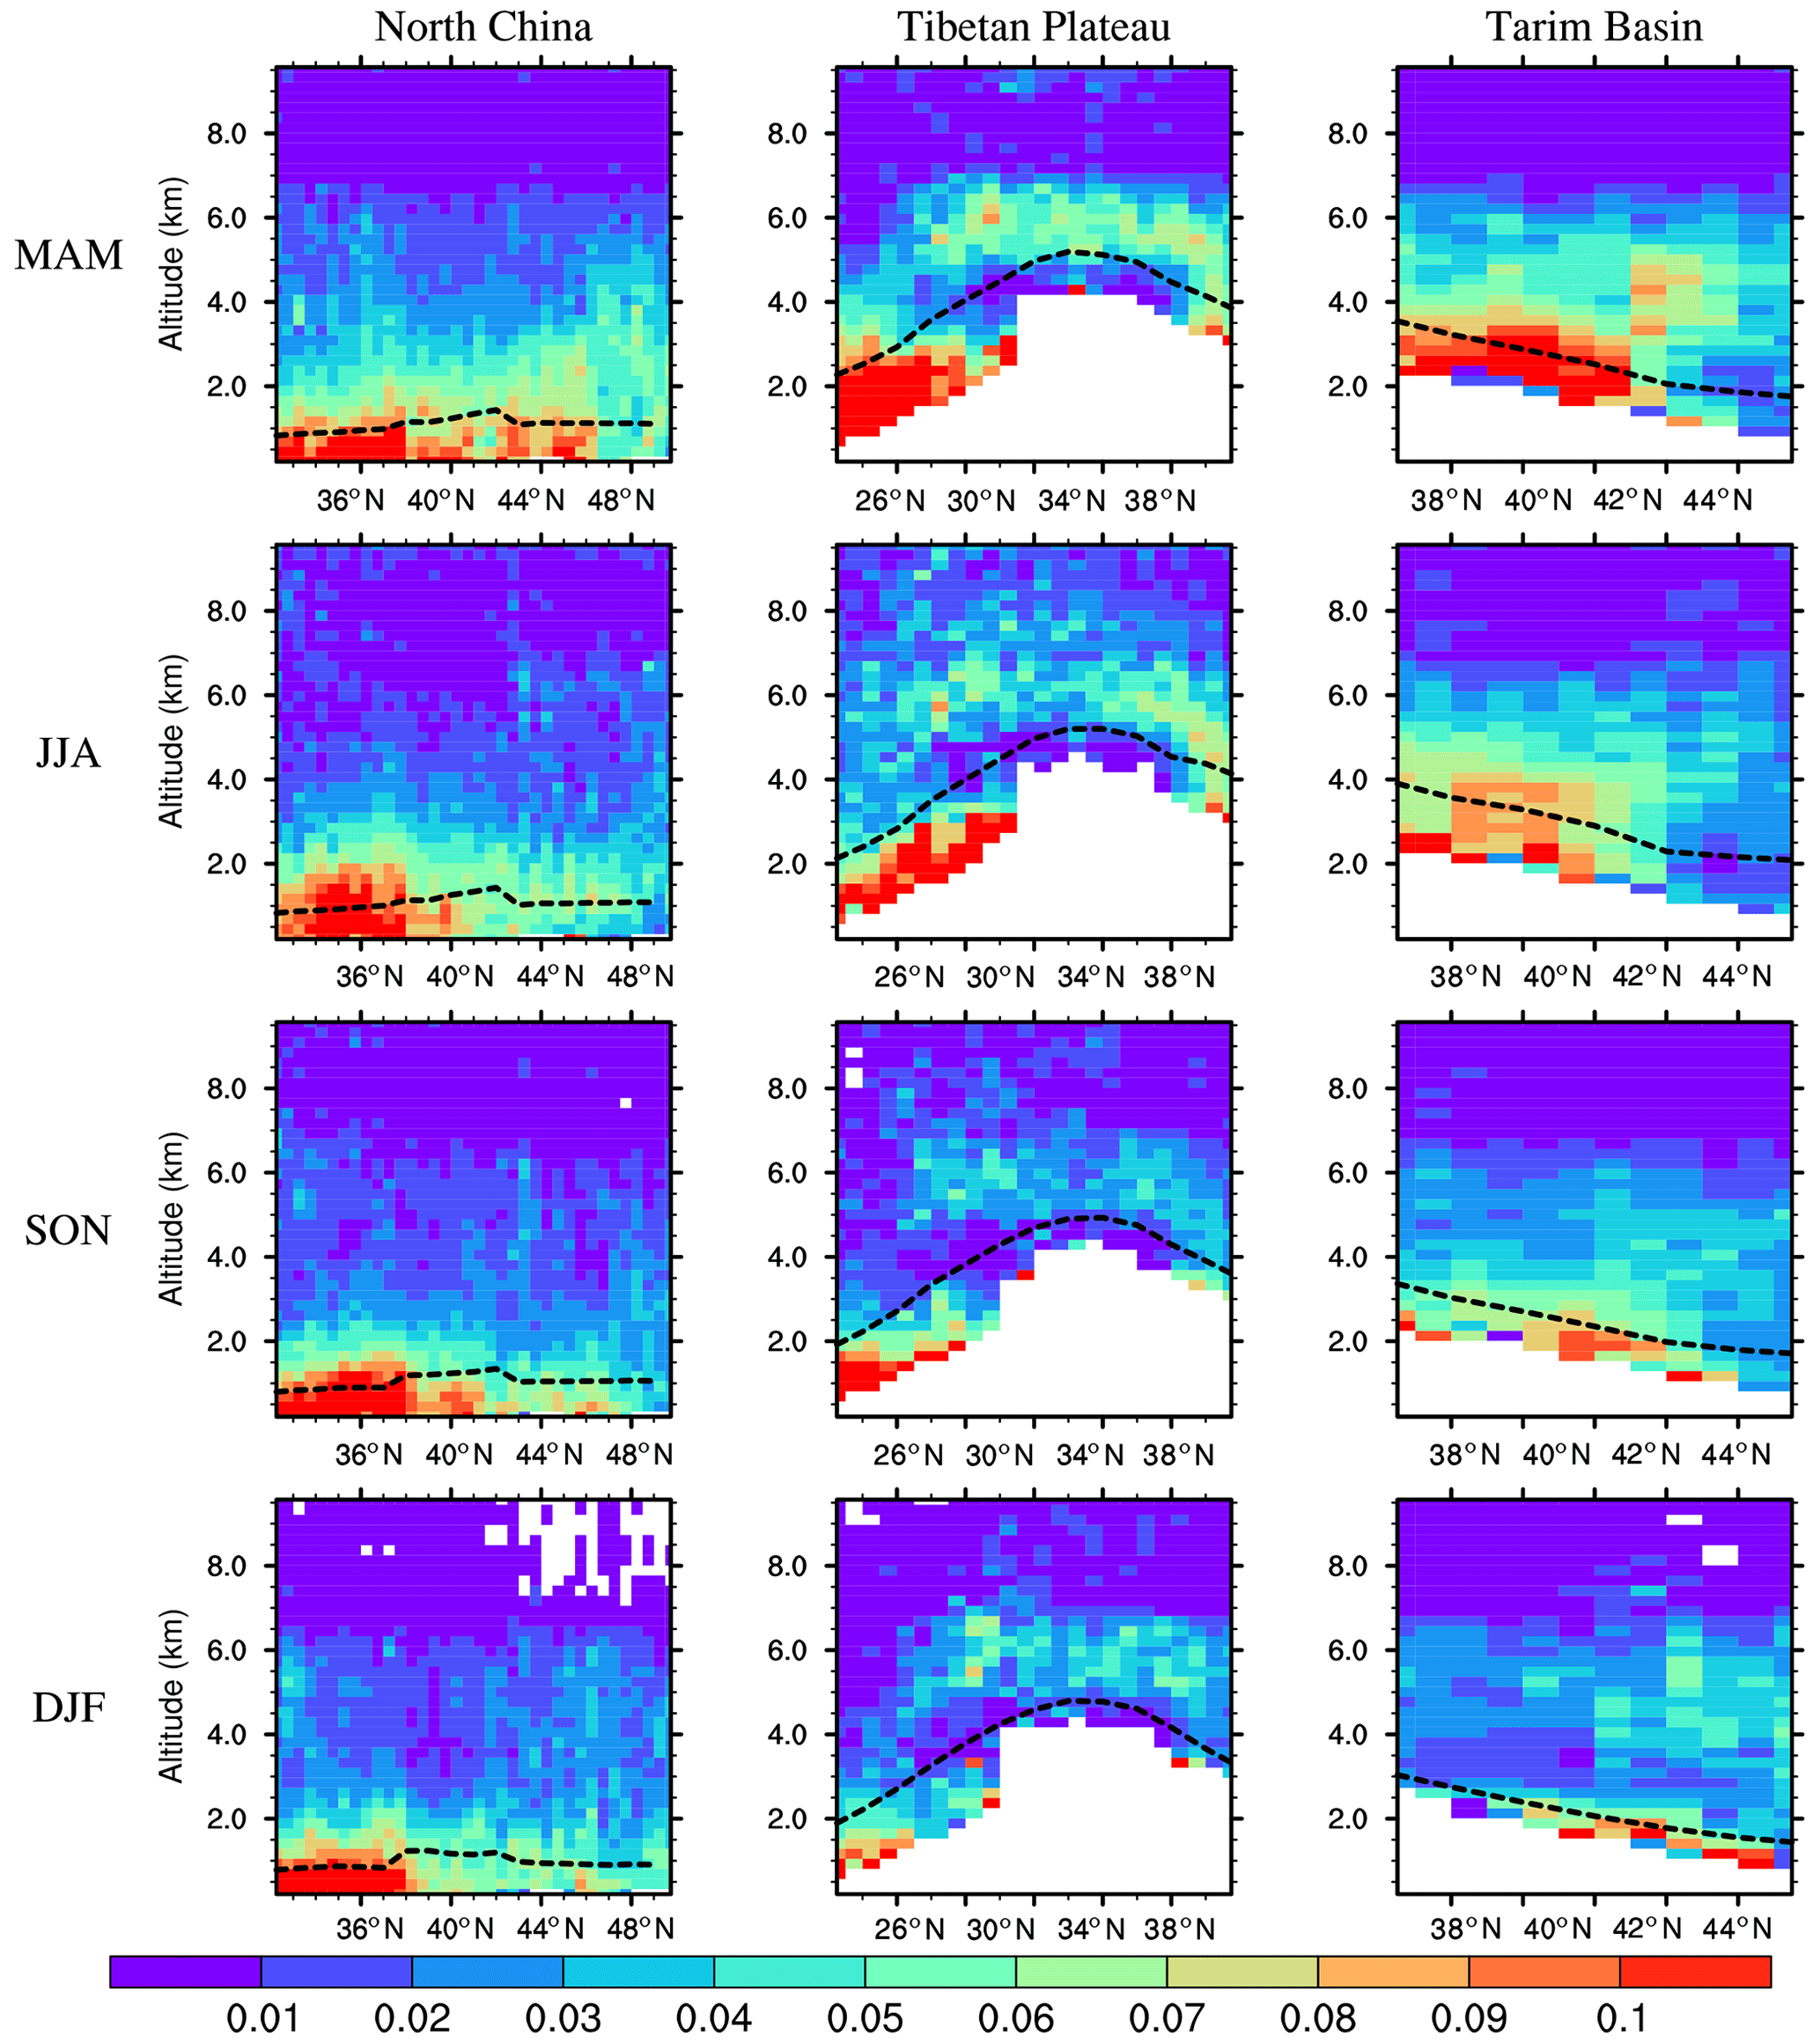
Figure 4Vertical structure of the 1064 nm aerosol extinction coefficients (km−1) observed from CATS by season over the three regions in relation to the zonal mean regional surface altitude. The dotted lines represent the height of the zonal mean regional planetary boundary layer (km) from the NCEP FNL reanalysis data.
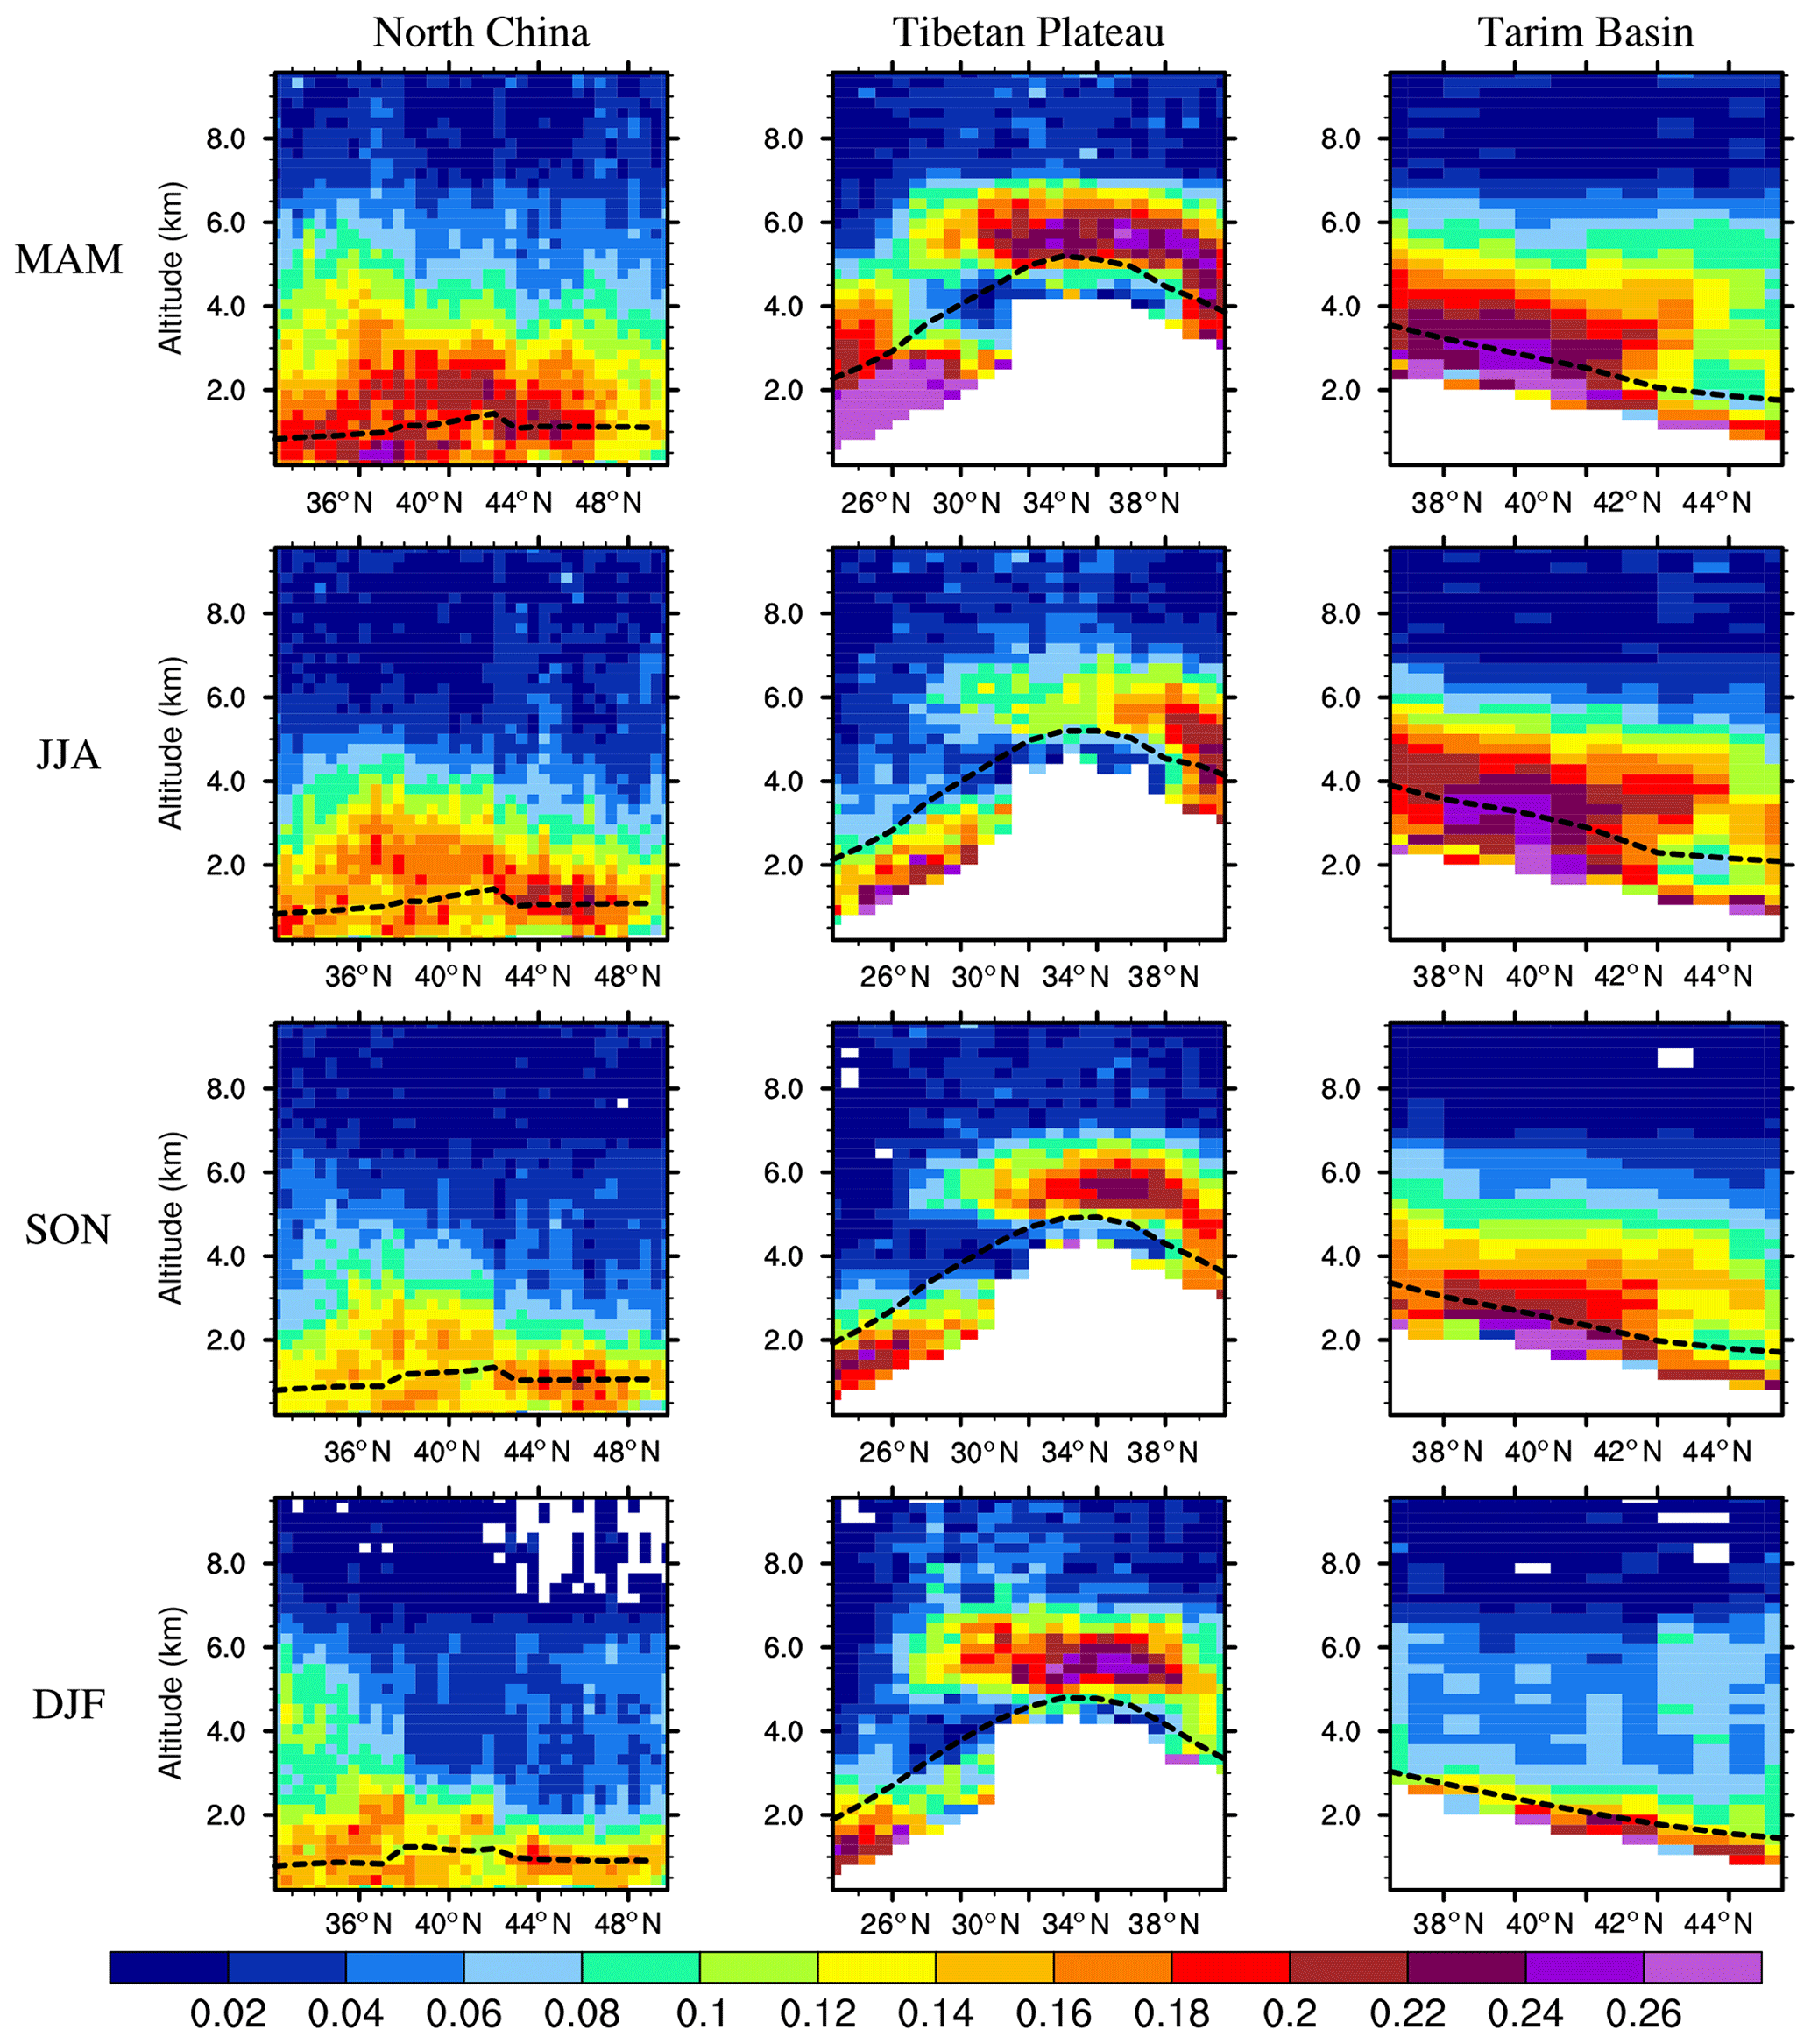
Figure 5The vertical structure of total depolarization ratios observed from CATS by season over the three regions in relation to the zonal mean regional surface altitude. The dotted lines represent the height of the zonal mean regional planetary boundary layer (km) from the NCEP FNL reanalysis data.
3.2.1 North China
Our statistics show that North China is a region with complicated aerosol compositions, and the dominant compositions vary with season and height. As shown in Fig. 3, the dominant aerosol type of column integrated aerosol in North China is pure dust aerosol in all seasons, and the subdominant aerosol types in spring, summer, fall, and winter are smoke (19.18 %), smoke (27.41 %), smoke (20.20 %), and polluted continental aerosols (15.91 %), respectively. Polluted continental aerosols strongly impact the aerosol vertical distribution below 2 km in all seasons except spring. Throughout the year, the intraseasonal variations in the planetary boundary layer in winter are significantly weaker than in other seasons. The probability distribution of polluted continental aerosols always peaks at approximately 1 km, and the height of the peak is slightly shifted following the variations in the boundary layer height. This is probably due to the thermal inversion layer near the surface preventing the upward diffusion of aerosols, and most of the aerosols emitted from surface can only be concentrated at the top of the boundary layer. The peak in pure dust occurrences is always slightly higher than that of mixed dust aerosols. This illustrates that the mixed dust in North China is mostly generated by mixing with the aerosol particles from near-surface emissions rather than by aerosol transport above the boundary layer. The smoke aerosols are generally concentrated within 2–4 km. This indicates that external input controls the smoke aerosols in this region, and their primary transport path is obviously higher than that of dust aerosols.
As the region has high AECs that are concentrated in the boundary layer, whereas the pattern of the ADRs is totally different from that of the AECs, it is obvious that fine particles control the aerosols near the surface. Although the AECs in spring are generally smaller than 0.1 km−1 above the boundary layer, the ADRs still peak at approximately 2 km with values higher than 0.16. This indicates that the dust aerosols with a relatively large size emitted from the Asian desert are suspended as the dominant aerosol type at this height in spring. Only in spring, the AECs between 42 and 46∘ N are greater than 0.09 km−1, which is probably related to elevated smoke and reflects harvest seasons in Northeast China. Moreover, due to the high ADRs in this region, dust aerosol is also one of the important aerosol types in Northeast China owing to its long-range transport from the Gobi Desert. Compared with the AEC and ADR over Northeast China in spring, the lower AEC and comparable ADR in summer indicate reduced agricultural activities and the continuous influences of dust storms. A region of high AEC values exists throughout the year between 32 and 38∘ N, which includes the Beijing–Tianjin–Hebei urban agglomeration that plays host to frequent human activities and heavy industrial production. The height of AECs greater than 0.1 km−1 in summer is obviously higher than those in other seasons, reflecting the combined effects of local aerosol emissions and stronger vertical diffusion. The patterns of the AEC and ADR cross sections in North China are generally similar in fall and winter, apart from the region with ADRs higher than 0.08 between 32 and 36∘ N above 2 km in winter. This is probably due to the limited dust aerosols transported from remote areas by strong northwesterly winds during this season.
The AECs and ADRs in North China have significant diurnal variations (Figs. S4–S7 in the Supplement). In all seasons, the AECs at 00:00 CST are lowest and peak at 12:00 CST with strong vertical transport – especially between 32 and 38∘ N. The lowest ADRs are also at 00:00 CST, which indicates that the dominant aerosols at 00:00 CST are fine particles. In spring, the ADRs with values greater than 0.2 reach as high as 4 km at 06:00 CST, and the ADRs at 12:00 and 18:00 CST are significantly higher than at 12:00 CST in the boundary layer between 32 and 38∘ N. This indicates that the dust aerosols being transported from sources in spring always arrive over this region at 06:00 CST and sink due to gravitational processes during the daytime. The ADRs at 06:00, 12:00, and 18:00 CST are significantly higher than that at 00:00 CST in spring and summer, whereas the ADRs at 00:00 and 06:00 CST are comparable in fall and winter. This further proves that human activities control the diurnal variations in aerosols in fall and winter rather than the dust storms that are the dominating factor in spring and summer.
3.2.2 Tibetan Plateau
The Tibetan Plateau is located at the junction of several dust sources, including the Taklimakan Desert, the Gurbantünggüt Desert, and the Thar Desert, and all of these sources have important effects on the plateau in different atmospheric layers. The boundary layer height in the Tibetan Plateau varies slightly by season, whereas the intraseasonal variations in the boundary layer are comparable in all seasons. As shown in Fig. 3, the dominant aerosol subtype in the Tibetan Plateau in the column is dust aerosol (Huang et al., 2007), followed by smoke aerosol. Pure dust (smoke) aerosols account for 66.22 % (14.14 %), 60.66 % (18.17 %), 53.50 % (18.21 %), and 42.20 % (25.02 %) in spring, summer, fall, and winter, respectively. In agreement with the CALIPSO results in Huang et al. (2007) and Wang et al. (2020a), the probability distributions of dust aerosol in all seasons peak at approximately 6 km, which are contributed by the transported dust aerosols from the nearby Taklamakan Desert surface. In fall and winter, almost 74.64 % and 78.54 % of polluted continental aerosols, which are the most dominant aerosol subtypes near the surface, are concentrated below 2 km.
As shown in Figs. 4 and 5, it is obvious that the dust emitted from the Taklimakan Desert could be transported southwards to the Tibetan Plateau. The belt region at approximately 6 km between 30 and 38∘ N in the Tibetan Plateau prevails in all seasons, and the AECs and ADRs in this region have significant seasonal variations. The belt region has the highest AECs and ADRs in spring, and there is a significant trajectory to show the transport of dust aerosols from the Taklimakan Desert through the northern slopes of the Tibetan Plateau after topographic lifting (Liu et al., 2019b). The transported dust stacking up against the slopes of the Tibetan Plateau can heat the elevated surface air over the slopes by absorbing solar radiation (Wang et al., 2020b), and it then causes a further large-scale circulation anomaly (Lau et al., 2006; Liu et al., 2008). Dust aerosols over the Tibetan Plateau may have the potential to exert more snowmelt, which is driven by the remarkable near-surface warming effect (Wang et al., 2020b). It also affects the convective clouds over the Tibetan Plateau and causes subsequent heavy rainfall in downstream regions (Liu et al., 2019b, 2020). Considering summer, the diffusion of aerosols is stronger than during other seasons; therefore, the AECs greater than 0.05 km−1 are as high as 8 km, which is caused by smoke aerosols through thermal dynamic processes (Fig. 3). It is noted that although the values of AECs at approximately 6 km in summer are comparable to those in spring, the aerosol sources are totally different between these two seasons. As shown in Figs. 4 and 5, due to the distinct demarcations at approximately 29∘ N in spring, we suppose that there is limited aerosol lifted from northern India and transported to the mountains. However, in summer, the AECs at 6 km in the Tibetan Plateau are homogeneous, and the ADRs south of 30∘ N and north of 30∘ N are generally smaller and greater than 0.1, respectively. This shows that the aerosols at 6 km in summer are a mixture of both fine particles, such as anthropogenic aerosols lifted and transported from northern India, and coarse dust particles from dust sources in Asia. In fall and winter, the ADR values north of 37∘ N are slightly lower than those above the mountains, which indicates that the northern slope of the plateau is continuously influenced by not only dust aerosol but also polluted aerosols that are transported upslope from the cities which are located at lower elevations in northwestern Asia. On the southern slope of the Tibetan Plateau, the aerosols are mainly from the desert in northwestern India and urban cites with frequent human activities. The proportion of smoke aerosols in fall and winter is higher than that in other latitudinal zones between 30 and 32∘ N, implying strong local emissions of smoke in this region.
Due to the inconsistent effects of the aerosol factor on cloud properties between daytime and nighttime (Liu et al., 2019a), the diurnal variations in aerosols have a dominant role in influencing the cloud microphysical processes over the Tibetan Plateau. The AECs and ADRs above the mountains have distinct diurnal variations in spring (Figs. S5–S8 in the Supplement). AECs at 12:00 and 18:00 CST are generally higher than those at 00:00 and 06:00 CST, whereas the ADRs at 12:00 and 18:00 CST above mountain are significantly lower than those at 00:00 and 06:00 CST. This indicates that the southwardly transported coarse dust aerosols from the Tarim Basin always arrive at the Himalayan mountains during nighttime, and the fine particles related to residential heating constitute the dominant aerosols in the daytime during spring. It is interesting that the mixture of aerosols from the southern and northern slopes at approximately 29∘ N are more intense during nighttime than daytime. In the warm season (summer and fall), AECs above the mountains are comparable throughout the day, although ADRs show a decreasing trend after sunrise.
3.2.3 Tarim Basin
As shown in Fig. 3, most of the layers in the Tarim Basin are dominated by pure dust aerosols. The column-integrated occurrences of pure dust aerosols are 86.77 %, 79.47 %, 78.95 %, and 65.31 % in spring, summer, fall, and winter, respectively. The peak in dust occurrence has a significant seasonal variation and reaches its highest altitude in summer, which is in accordance with the changes in the boundary layer height in the Tarim Basin. Strong convective activity resulted in the height of the pure dust aerosol probability peak being between 3 and 4 km in summer; however, the height of the peak is trapped below 1 to 2 km by subsidence in winter. It is interesting that the season with weaker intraseasonal variabilities in the boundary layer has more squeezed probability distributions of dust and polluted continental aerosols. This indicates that boundary layer height is an important factor determining the vertical distributions of aerosols from local emissions in the Tarim Basin. The frequency of smoke aerosols always peaks at approximately 4 km in all seasons, and the unimodal structure indicates that the smoke aerosols in this region have a great possibility of originating from a distance and generally being transported at an altitude of 4 km.
As expected, Fig. 4 shows that AECs in the Tarim Basin have significant seasonal variations. Because of the uniform aerosol component in the Tarim Basin, the temporal–spatial variation in AECs is generally in agreement with that of ADRs in Fig. 5. It should be noted that the dust activities over this area appear to be persistent almost all year long, reaching a maximum in spring and a minimum in winter. Although most of the aerosol layers are concentrated within the boundary layer and change with variations in the boundary layer height (peaking in summer), the dust layers can be found as high as 5 km (altitude) in all seasons except winter. Such separation leads to the creation of a well-defined aerosol vertical structure that can be transported over long distances. Throughout the year, the dust aerosols emitted from the dust source region below 2 km are generally transported to Central Asia by the east wind, and the dust aerosols lifting as high as 2 km are spread eastwards (Huang et al., 2008). The AECs in spring are significantly higher than those in summer, whereas the ADRs in summer are much higher and peak at 2 km above the surface. This indicates that a significant amount of relatively larger dust aerosols is lifted into the free troposphere and suspended for a longer time in summer compared with spring. The geographic setting of the basin, surrounded by high mountains, generates atmospheric circulations in the basin that are favorable for dust to remain suspended in the air for a long time (Tsunematsu et al., 2005). In Fig. 4, the zonal means indicate that intense dust events are generally confined between 38 and 42∘ N, which is in agreement with the CALIPSO results in Liu et al. (2008).
The AECs over Tarim Basin have slight diurnal variations in spring (Figs. S6–S9 in the Supplement), whereas the ADRs at 00:00 and 06:00 CST are significantly higher than those at 12:00 and 18:00 CST. This is because the near-surface atmosphere becomes stable during nighttime and blocks the diffusion of large particles. In summer, AECs reveal obvious diurnal variations, and the AECs at 12:00 and 18:00 CST are higher than those at 00:00 and 06:00 CST. In fall and winter, the high AECs are generally near the surface, especially at 19:00 CST, which is related to frequent residential activities.
3.3 Seasonal and diurnal variations in AEC profiles over selected regions
Using quality-assured CATS-derived aerosol vertical distributions, the annual mean CATS extinction vertical profiles at 1064 nm by season over North China, the Tibetan Plateau, and the Tarim Basin are shown in Fig. 6. The AECs in North China have the weakest seasonal variations among these three regions; moreover, the differences in intraseasonal AEC variations among the four seasons are also very limited and generally proportional to the values of the AECs. North China has AECs in spring and summer that are slightly higher than those in fall and winter. In all seasons, the AECs in North China decline rapidly with increasing altitude below 2 km and level out above 3 km. The differences in the AEC profiles over North China in the various seasons exist below 0.5 km and between 1.5 and 4 km, which is related to seasonal variations in local pollutant emissions and the long-range transport of aerosols above the boundary layer. The AEC profiles in the Tibetan Plateau are significantly discrepant among the four seasons. The AEC in the cold season (spring and winter) generally deceases monotonically following the increase in altitude below 4 km and peaks at approximately 5.5 km with AECs less than 0.1 km−1. In contrast, the AEC profile in the warm season (summer and fall) has a similar bimodal pattern: it first peaks at 1.17 and 0.93 km, and then once again at approximately 6 km. The intraseasonal variabilities in AECs over the Tibetan Plateau are more prominent in spring and summer than in fall and winter over most of the layers, which is probably caused by the frequent dust events from adjacent areas with different strengths. In the Tarim Basin, the AEC profiles in all seasons except winter are unimodal and generally peak at around the altitude of the dust sources. Between 2.5 and 4 km, the AEC in summer is homogeneously distributed at various altitudes, whereas the AEC in spring and fall is reduced significantly with the increase in altitude. The intraseasonal variabilities in AECs over the Tarim Basin below 2 km are more intense in winter than in other seasons. This is probably because the residential coal combustion in cities located at lower elevations has obvious diurnal variations and, thus, causes the significant changes in the AECs below 2 km.
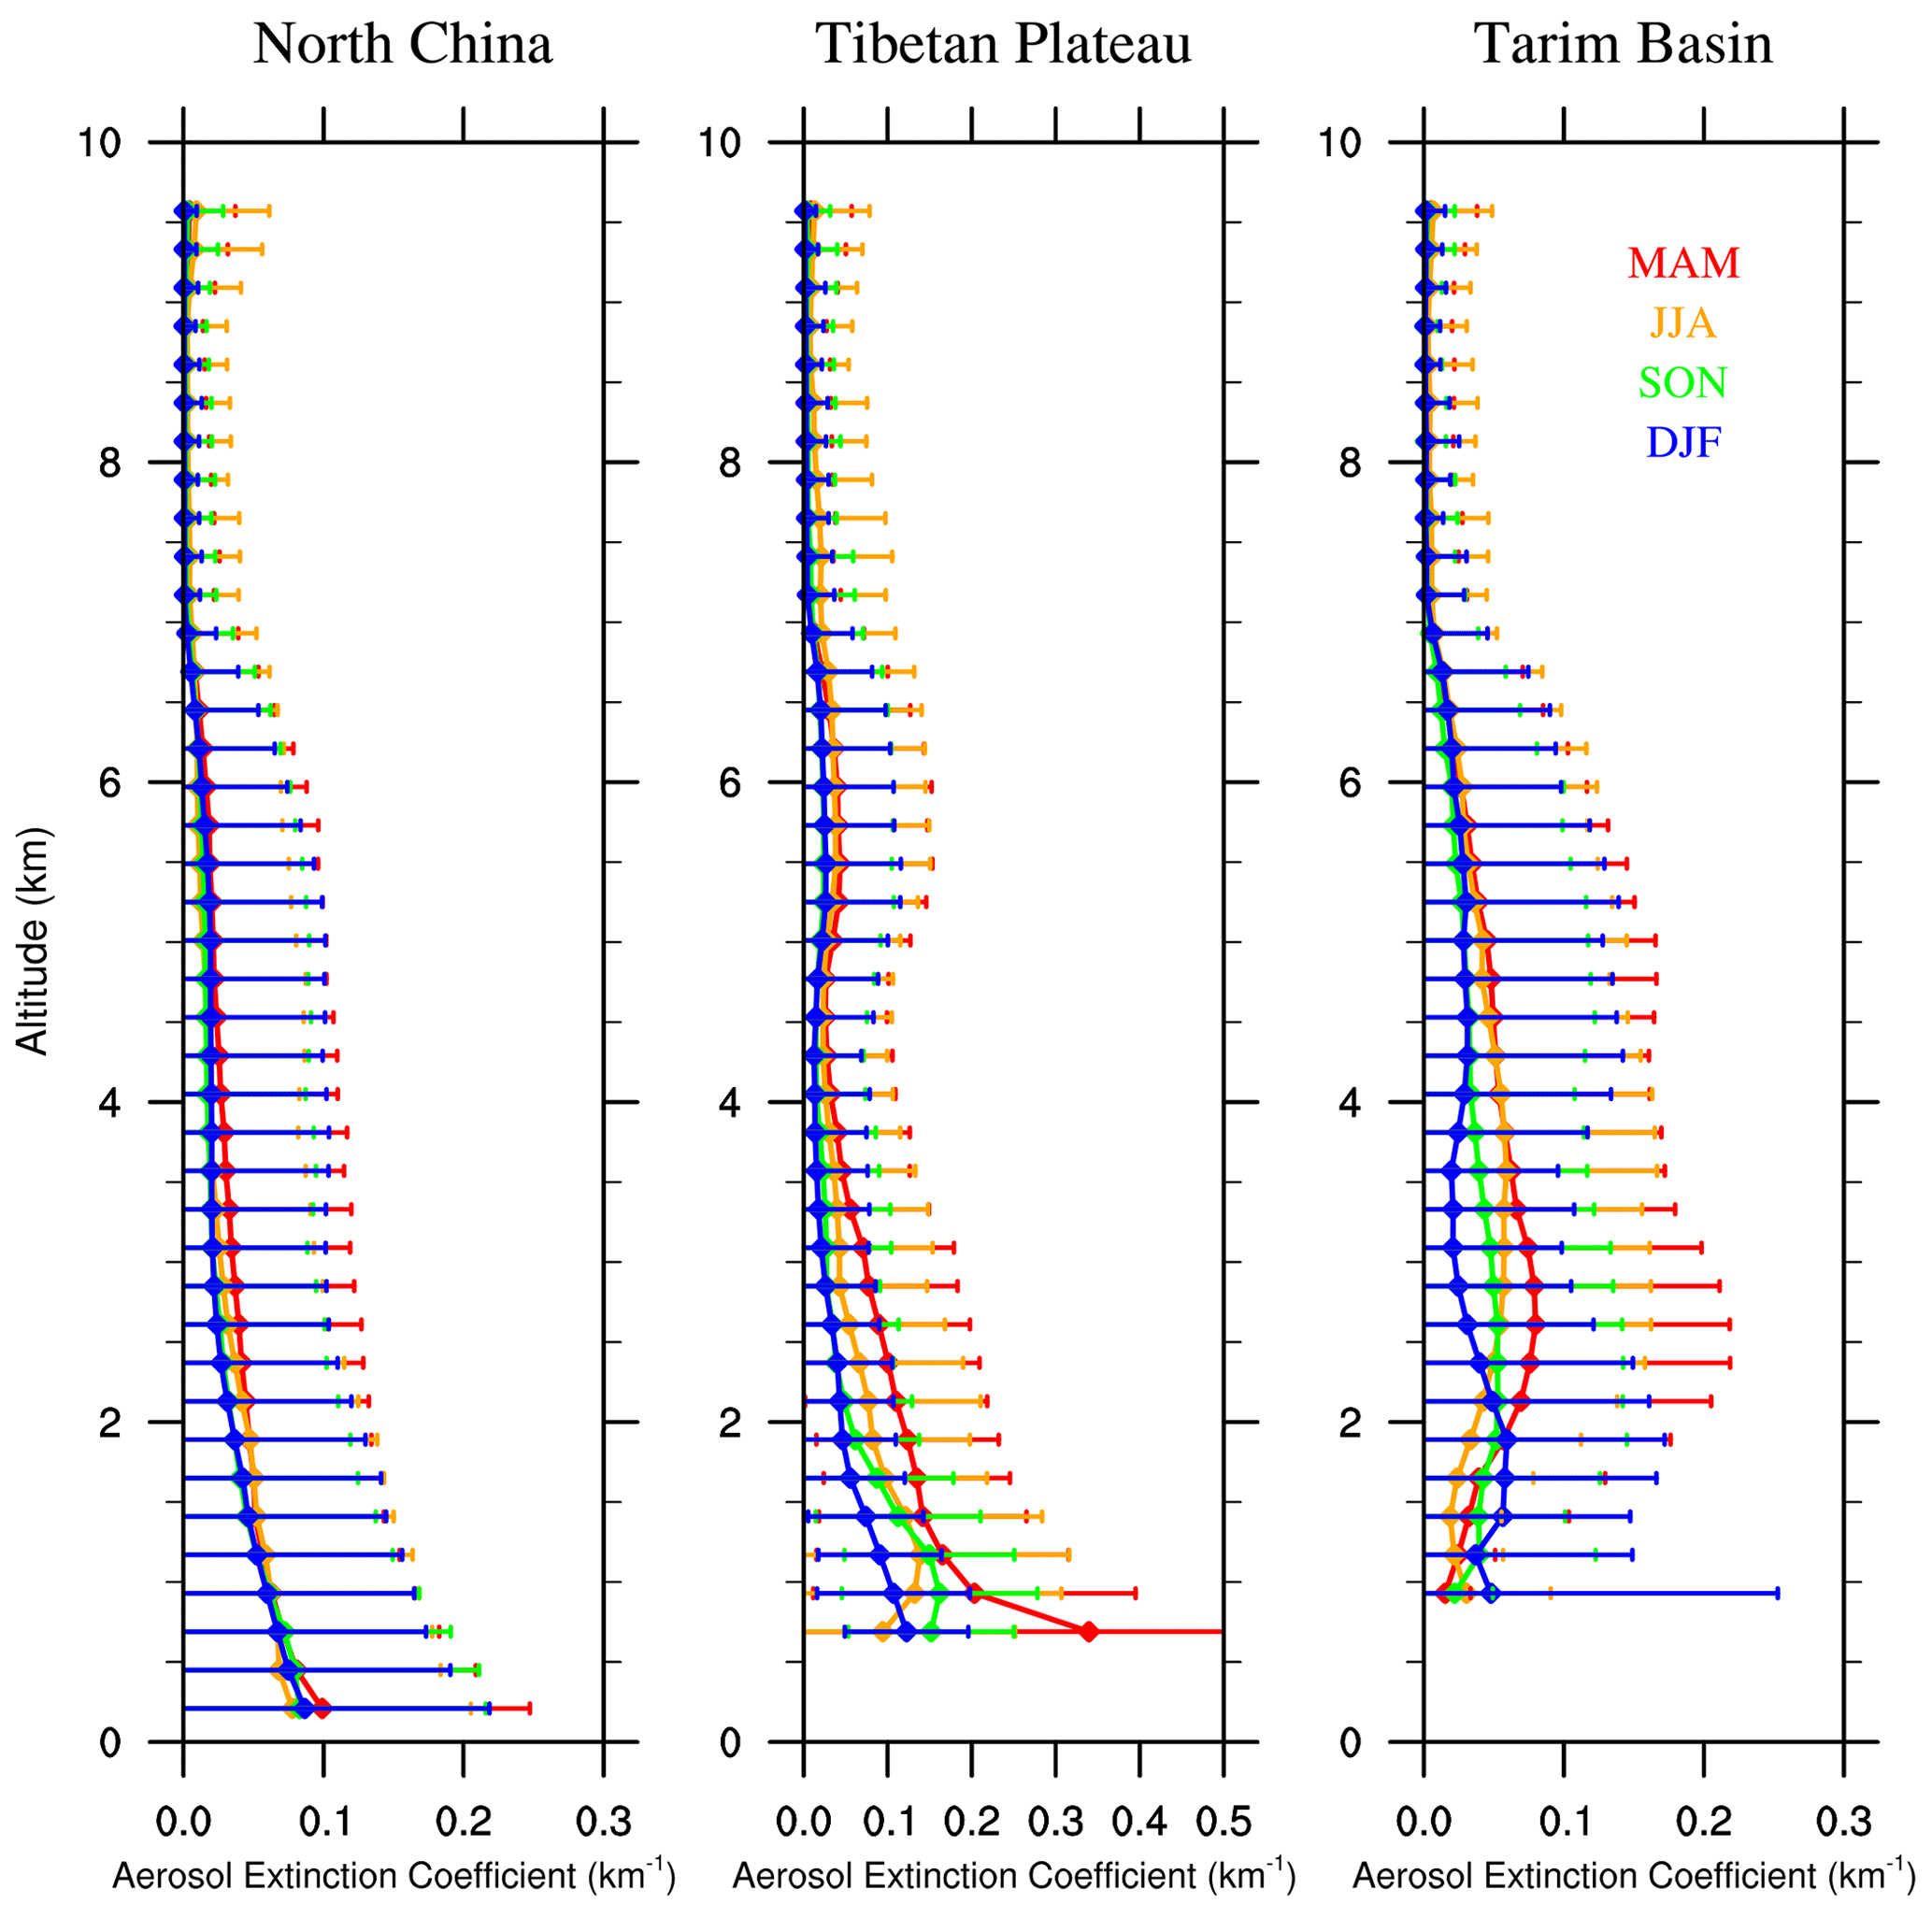
Figure 6Vertical profiles of the 1064 nm aerosol extinction coefficients (km−1) observed from CATS by season over the three regions. Horizontal lines correspond to the standard deviation of the intraseasonal aerosol extinctions.
Figure S10 in the Supplement shows the sample fractions of the available aerosol extinction coefficients observed from CATS at four local times (CST) for 1 whole day. Over North China, the fractions of the CATS observations among the four local times are equivalent at most altitudes except above 7 km, where the diurnal variations in the aerosol extinctions are limited. Over the Tibetan Plateau and Tarim Basin, the differences in the number of CATS observations between the four times are generally concentrated below 2 km and above 7 km. Due to the significant discrepancies in the numbers of observations among the four local times below 2 km in these two regions, the confidence in the diurnal variations near the surface is lower than that between 2 and 6 km. As shown in Fig. 7, the annual mean AEC vertical profiles at 1064 nm observed from CATS are binned into 00:00, 06:00, 12:00, and 18:00 CST based on the closest match in time in order to give the diurnal variations in AECs over North China, the Tibetan Plateau, and the Tarim Basin. The height of the regional mean planetary boundary layer every 6 h (00:00, 06:00, 12:00, and 18:00 UTC) is also given in Fig. 7. For the North China region, the AEC profiles in the four seasons all present a declining trend with height. Among the four seasons, the differences in the AEC profiles between the four local times are more remarkable in spring, summer, and fall than in winter. Except in winter, the AEC profiles below 2 km at 06:00 and 12:00 CST are significantly higher than those at 00:00 and 18:00 CST, and they reach their maximum at midday. This indicates that the aerosols in the boundary layer are mostly emitted during the daytime heating period, and the vertical mixing of aerosols is enhanced by the combined role of the boundary layer and the thermal wind circulation. Following the diurnal variations in the boundary layer, AEC profiles show the strongest aerosol diffusions with the highest boundary layer height at 06:00 UTC. For the Tibetan Plateau, the rate of decline in the AECs with altitude is higher than that in the other two regions. In spring, the AEC profiles at 06:00, 12:00, and 18:00 CST are monotonically decreasing, whereas the AEC profile at 00:00 CST first increases and then decreases with its maximum in the 1–2 km layer. In the warm season, due to the mixture of various aerosols originating from different regions above the mountains, the AEC profiles at approximately 6 km have minor diurnal variations. In winter, the AEC profile at 00:00 CST is the lowest of the four local times. Between 5 and 7 km, the AECs at 00:00 and 06:00 CST are lower than those at 12:00 and 18:00 CST, indicating that the input of aerosols and local sources in winter above the mountains are more frequent during the daytime. For the Tarim Basin, dust aerosol is prevalent throughout the year. To investigate the main reasons for the diurnal variations in the AEC profiles in the Tarim Basin, we give the annual mean 10 m wind fields for the four local times by season in Fig. 8. In both spring and summer, the AEC profiles for the four local times have a similar unimodal pattern. In spring, the AEC profiles are consistent for each local time with the maximum aerosol extinctions in the 1–4 km altitude range. This indicates that dust emissions over the Tarim Basin in spring have minor diurnal variations. Interestingly, the AEC profiles in summer have strong diurnal variations, and the AECs at 12:00 and 18:00 CST are significantly higher than those at 00:00 and 06:00 CST. As shown in Fig. 8, the regional annual mean wind speeds in the Tarim Basin are 1.94, 2.15, 2.64, and 2.09 m s−1 at 00:00, 06:00, 12:00, and 18:00 CST, respectively. Because the dust emissions are highly correlated with the surface wind field (Dai et al., 2018), the obvious diurnal variations in the AEC profile are mainly attributed to the diurnal variations in the surface wind speeds in summer. In fall and winter, the AEC profiles for the four local times all have a maximum below 2 km, and they peak at 12:00 CST (18:00 CST) in fall (winter).
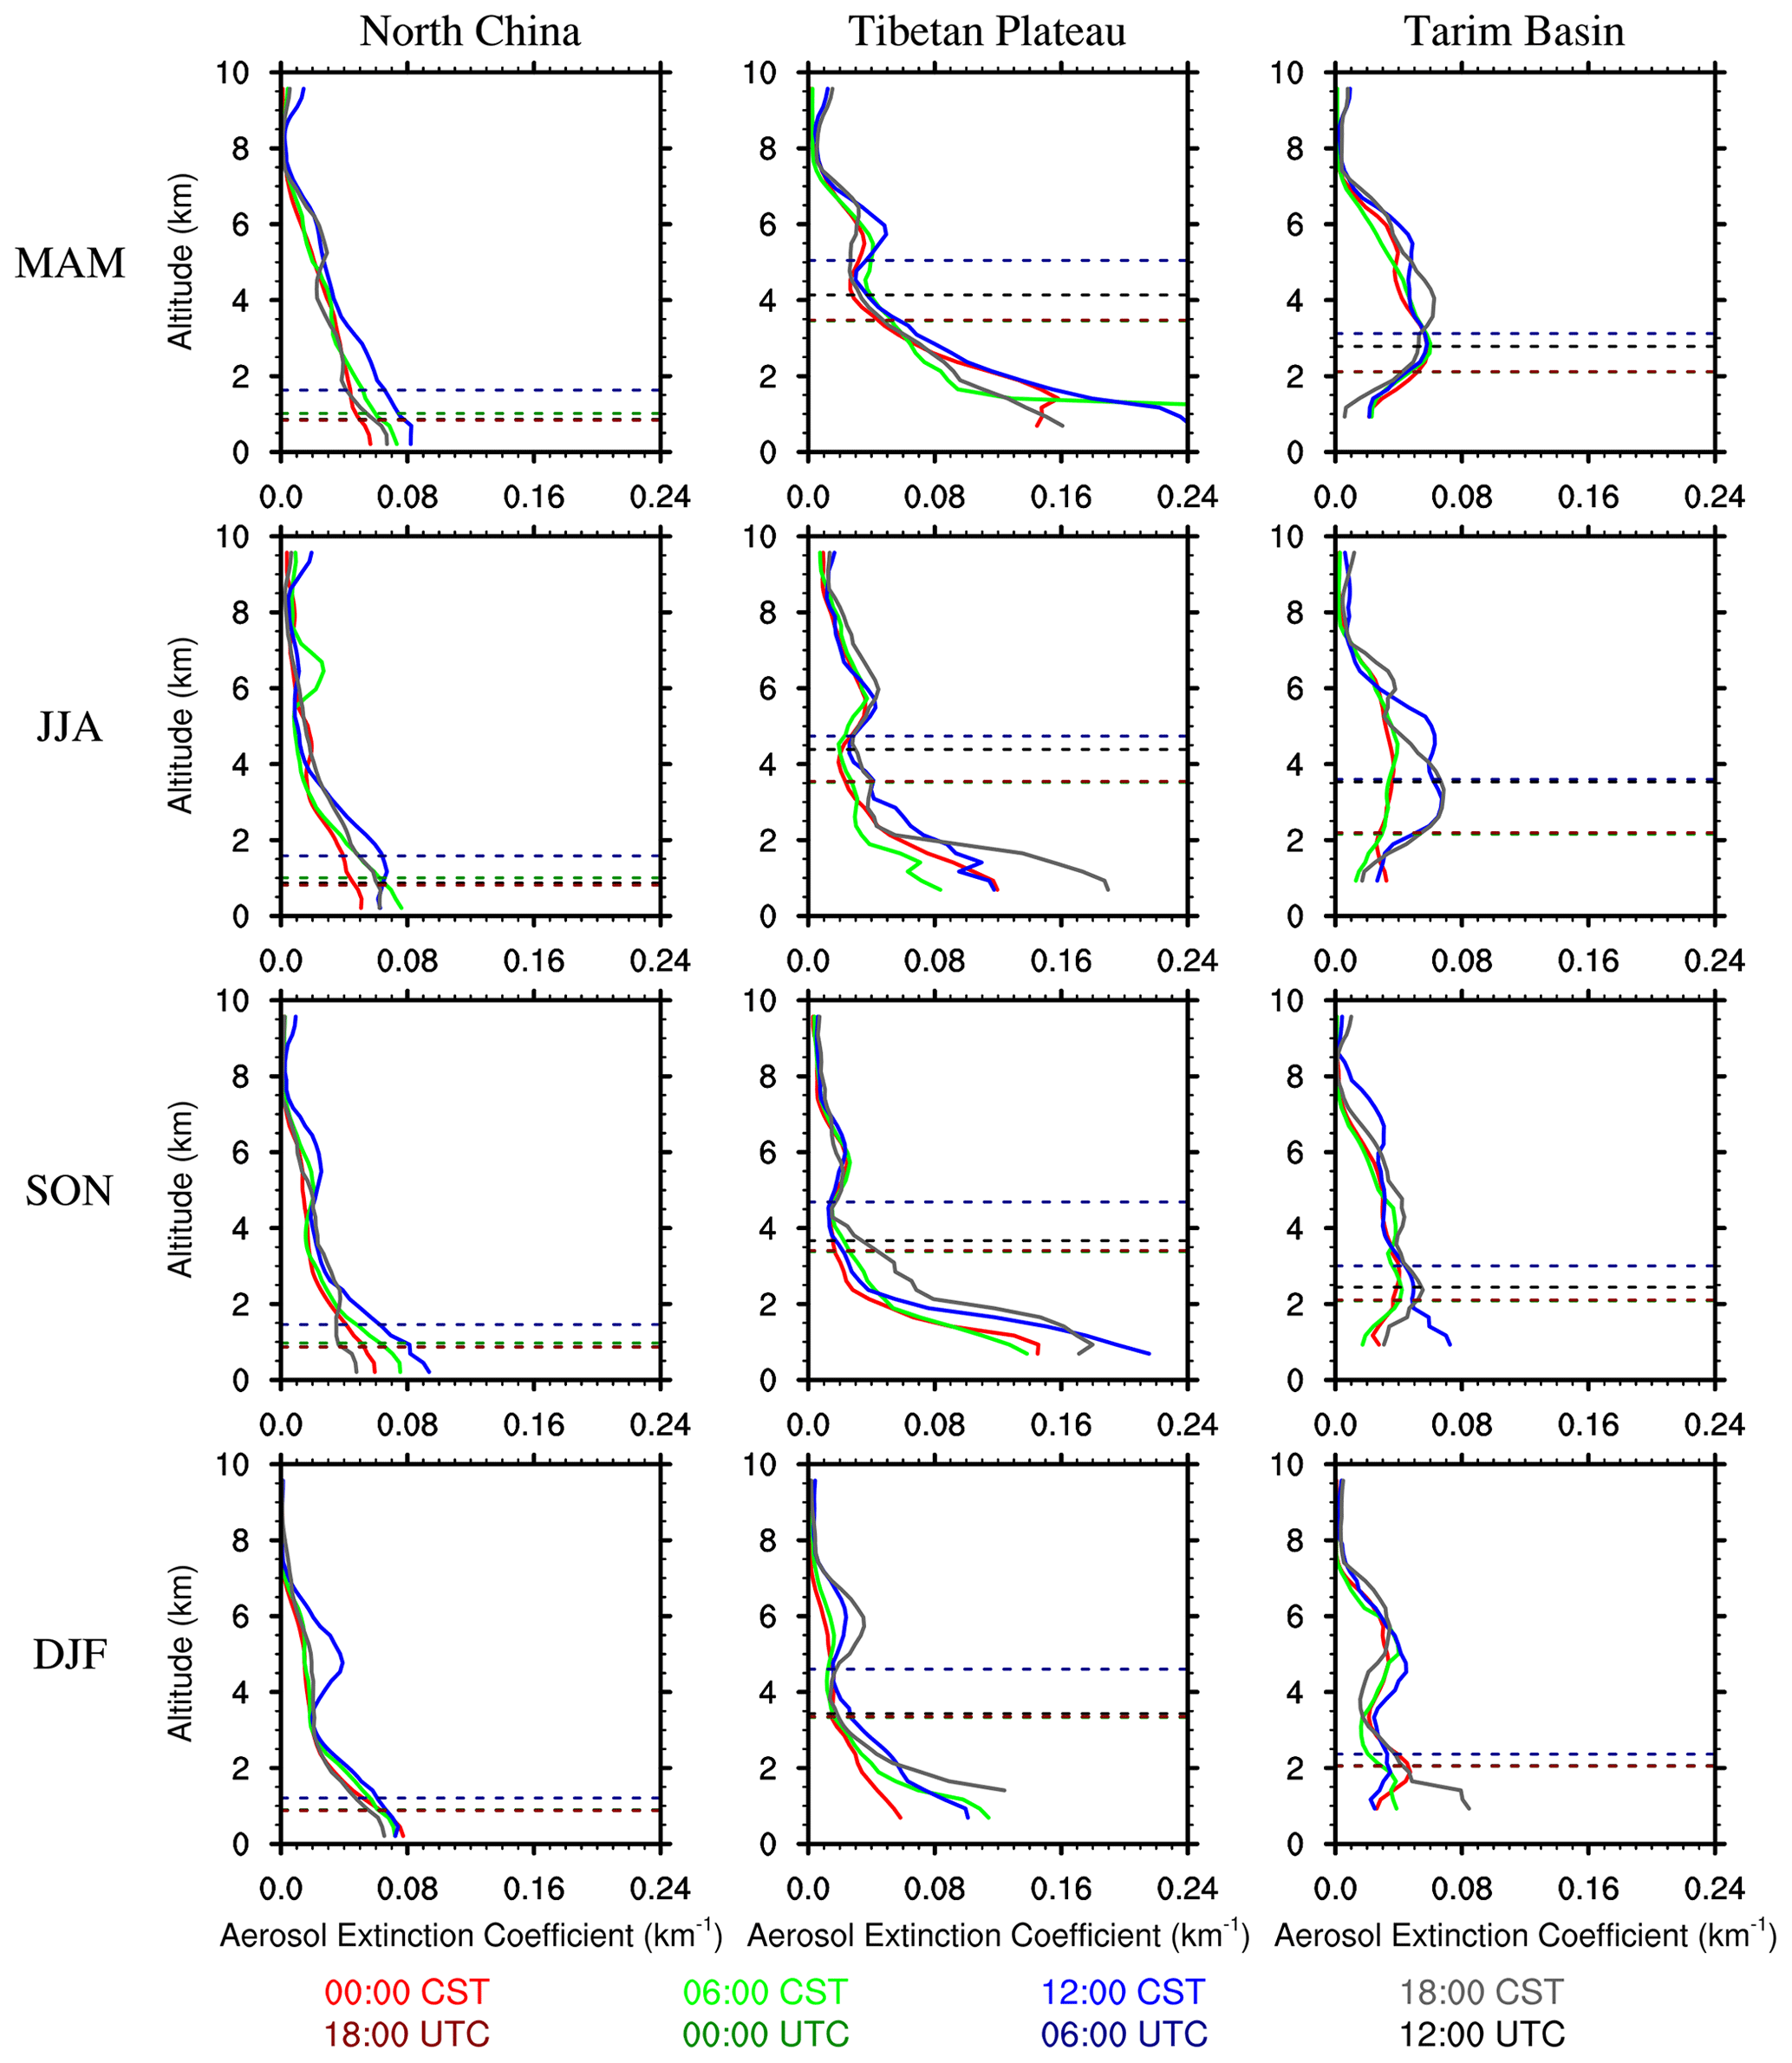
Figure 7The 6 h (00:00, 06:00, 12:00, and 18:00 CST) vertical profiles of the 1064 nm aerosol extinction coefficients (km−1) observed from CATS by season over the three regions. The dashed lines represent the height of the regional mean planetary boundary layer (km) from the NCEP FNL reanalysis data every 6 h (00:00, 06:00, 12:00, and 18:00 UTC).
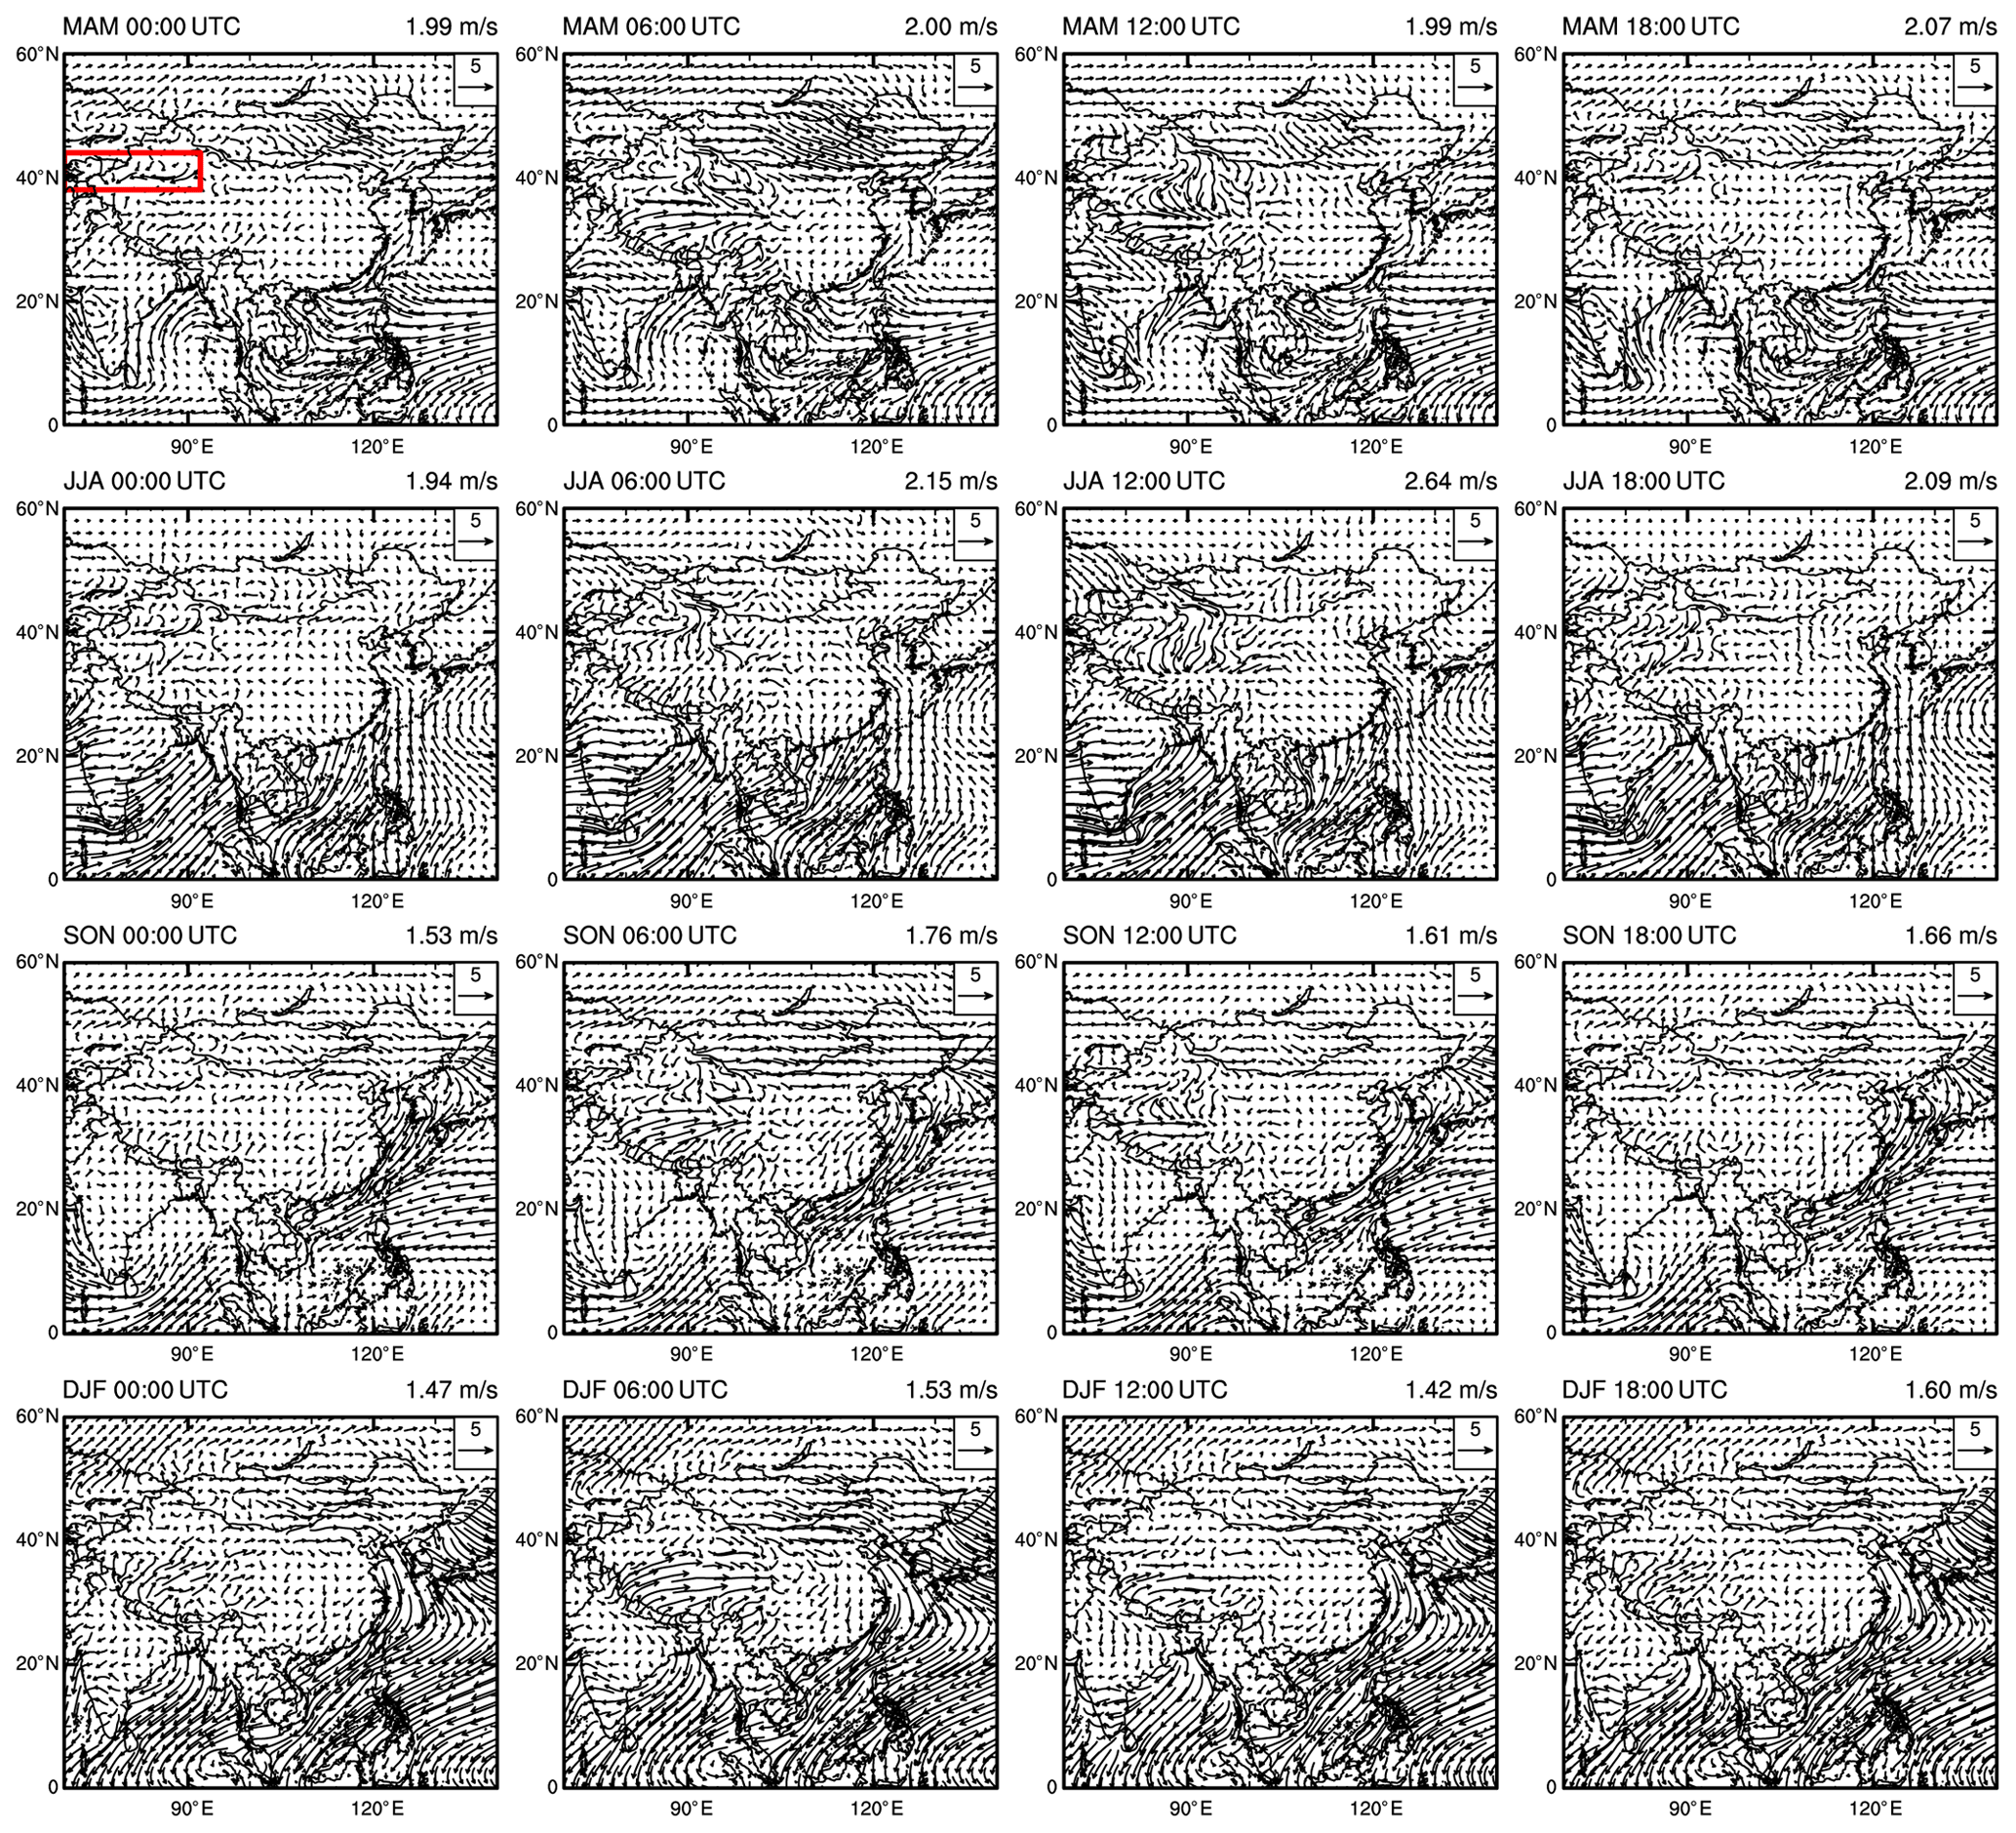
Figure 8Spatial distributions of the annual mean 10 m wind fields 6 h from the NCEP FNL reanalysis data. The value in the top right-hand corner represents the regional mean 10 m wind speed in the red rectangle.
In this paper, we took advantage of the variable local time of the International Space Station overpass to document the seasonal variation and diurnal cycle of the aerosol vertical profile as seen by the CATS lidar. Our results are based on 32 months of systematic observations collected from 2015 to 2017, which enable statistically significant results.
We first evaluated the seasonal variations in AOTs over East Asia from CATS against those from MODIS and found satisfactory agreement regarding the spatial patterns. The positive biases between MODIS and CATS AOTs are probably due to the differences in channels and the deficiency of lidar systems in detecting tenuous layers of signal below the minimum detection thresholds. Retrieving under different cloud conditions can also result in discrepancies between MODIS and CATS aerosol products. Moreover, CATS has some difficulty in catching the seasonal variations in AOTs in the regions controlled by anthropogenic aerosols.
Due to the differences in the aerosol compositions of each subregion over East Asia, we selected three typical regions (North China, the Tibetan Plateau, and the Tarim Basin) for further investigations into aerosol vertical features with different timescales. The dominant aerosol in North China is dust aerosol in all seasons, and the subdominant aerosol types in spring, summer, fall, and winter are smoke (19.18 %), smoke (27.41 %), smoke (20.20 %), and polluted continental aerosols (15.91 %), respectively. In North China, human activities control the diurnal variations in aerosols in fall and winter, whereas dust storms are the dominant factor in spring and summer. The most dominant aerosol subtype in the Tibetan Plateau is dust aerosol, followed by smoke aerosol. In addition, polluted continental aerosol controlled the aerosols below 2 km in fall and winter. The belt region at approximately 6 km between 30 and 38∘ N in the Tibetan Plateau exists in all seasons, and the AECs and ADRs in this region have significant seasonal variations. The belt region has the highest AECs and ADRs in spring, and there is a significant trajectory showing the transport of dust aerosols through the northern slopes of the Tibetan Plateau after topographic lifting. The aerosols at 6 km in summer are a mixture of both anthropogenic aerosols transported from northern India and coarse dust particles from Asian dust sources. The northern slope of the plateau in fall and winter is continuously influenced by both dust aerosols and polluted aerosols transported upslope from cities located at lower elevations in northwestern Asia. The high AECs in summer over the Tibetan Plateau up to 8 km are caused by smoke aerosols. The coarse aerosols transported southwards from the Tarim Basin always arrive in the Himalayan Mountains during nighttime, and the fine particles related to residential heating constitute the dominant aerosols during daytime in spring. The Tarim Basin is dominated by dust aerosols throughout the year, and the AECs have significant seasonal variations. Throughout the year, dust aerosols emitted from the dust source region below 2 km are generally transported to Central Asia by the east wind, and the dust aerosols lifting as high as 2 km are spread eastwards. Compared with spring, a significant amount of relatively larger dust aerosols is lifted into the free troposphere and suspended for a longer time in summer.
The AECs in North China have the weakest seasonal variations among these three regions. The intraseasonal variabilities in AECs over the Tibetan Plateau are more prominent in spring and summer than in fall and winter over most of the layers, which is probably caused by the frequent dust events from adjacent areas with different strengths. In the Tarim Basin, AEC profiles in all seasons except winter are unimodal and generally peak around the altitude of the dust sources. The intensely intraseasonal variabilities in AECs over the Tarim Basin below 2 km in winter is due to the obvious diurnal variations in residential coal combustion in the cities that are located at lower elevations.
The diurnal variations in AECs in North China are mainly related to the diurnal variations in the transported dust and local polluted aerosols. Below 2 km, the AEC profiles at 06:00 and 12:00 CST are significantly higher than those at 00:00 and 18:00 CST, and they reach their maximum at midday. The highest AECs at 12:00 CST at approximately 6 km in the Tibetan Plateau indicate that the aerosols emitted from different sources are more easily uplifted and spread southwards at midday. Due to the strong diurnal variations in the surface wind speed in summer, the AEC profiles over Tarim Basin have strong diurnal variations and the AECs at 12:00 and 18:00 CST are significantly higher than those at 00:00 and 06:00 CST.
The data and data analysis method are available upon request.
The supplement related to this article is available online at: https://doi.org/10.5194/acp-20-15307-2020-supplement.
TD and JL designed the study. YC conducted the data analysis with contributions from all coauthors. YC prepared the paper with help from TD, JL, and GS.
The authors declare that they have no conflict of interest.
We are grateful to the relevant researchers who provided the observation data from MODIS (https://modis-atmos.gsfc.nasa.gov/products/aerosol; last access: 15 June 2020). CATS data were obtained from the NASA Langley Research Center Atmospheric Science Data Center (https://cats.gsfc.nasa.gov; last access: 15 June 2020).
This research has been supported by the Strategic Priority Research Program of the Chinese Academy of Sciences (grant no. XDA2006010302), the National Key Research and Development Program of China (grant nos. 2016YFC0202001 and 2017YFC0209803), the National Natural Science Funds of China (grant nos. 41571130024, 41605083, 41590875, and 41475031), and the Youth Innovation Promotion Association of the Chinese Academy of Sciences (grant no. 2020078).
This paper was edited by Rob MacKenzie and reviewed by two anonymous referees.
Callewaert, S., Vandenbussche, S., Kumps, N., Kylling, A., Shang, X., Komppula, M., Goloub, P., and De Mazière, M.: The Mineral Aerosol Profiling from Infrared Radiances (MAPIR) algorithm: version 4.1 description and evaluation, Atmos. Meas. Tech., 12, 3673–3698, https://doi.org/10.5194/amt-12-3673-2019, 2019.
Cheng, Y., Dai, T., Goto, D., Schutgens, N. A. J., Shi, G., and Nakajima, T.: Investigating the assimilation of CALIPSO global aerosol vertical observations using a four-dimensional ensemble Kalman filter, Atmos. Chem. Phys., 19, 13445–13467, https://doi.org/10.5194/acp-19-13445-2019, 2019.
Christian, K., Wang, J., Ge, C., Peterson, D., Hyer, E., Yorks, J., and McGill, M.: Radiative Forcing and Stratospheric Warming of Pyrocumulonimbus Smoke Aerosols: First Modeling Results With Multisensor (EPIC, CALIPSO, and CATS) Views from Space, Geophys. Res. Lett., 46, 10061–10071, https://doi.org/10.1029/2019GL082360, 2019.
Dai, T., Cheng, Y., Zhang, P., Shi, G., Sekiguchi, M., Suzuki, K., Goto, D., and Nakajima, T.: Impacts of meteorological nudging on the global dust cycle simulated by NICAM coupled with an aerosol model, Atmos. Env., 190, 99–115, https://doi.org/10.1016/j.atmosenv.2018.07.016, 2018.
Henriksson, S. V., Laaksonen, A., Kerminen, V.-M., Räisänen, P., Järvinen, H., Sundström, A.-M., and de Leeuw, G.: Spatial distributions and seasonal cycles of aerosols in India and China seen in global climate-aerosol model, Atmos. Chem. Phys., 11, 7975–7990, https://doi.org/10.5194/acp-11-7975-2011, 2011.
Huang, J., Minnis, P., Yi, Y., Tang, Q., Wang, X., Hu, Y., Liu, Z., Ayers, K., Trepte, C., and Winker, D.: Summer dust aerosols detected from CALIPSO over the Tibetan Plateau, Geophys. Res. Lett., 34, L18805, https://doi.org/10.1029/2007GL029938, 2007.
Huang, J., Minnis, P., Chen, B., Huang, Z., Liu, Z., Zhao, Q., Yi, Y., and Ayers, J. K.: Long-range transport and vertical structure of Asian dust from CALIPSO and surface measurements during PACDEX, J. Geophys. Res., 113, D23212, https://doi.org/10.1029/2008JD010620, 2008.
Huang, J., Fu, Q., Su, J., Tang, Q., Minnis, P., Hu, Y., Yi, Y., and Zhao, Q.: Taklimakan dust aerosol radiative heating derived from CALIPSO observations using the Fu-Liou radiation model with CERES constraints, Atmos. Chem. Phys., 9, 4011–4021, https://doi.org/10.5194/acp-9-4011-2009, 2009.
Huang, J., Minnis, P., Yan, H., Yi, Y., Chen, B., Zhang, L., and Ayers, J. K.: Dust aerosol effect on semi-arid climate over Northwest China detected from A-Train satellite measurements, Atmos. Chem. Phys., 10, 6863–6872, https://doi.org/10.5194/acp-10-6863-2010, 2010.
Huang, J. P., Liu, J. J., Chen, B., and Nasiri, S. L.: Detection of anthropogenic dust using CALIPSO lidar measurements, Atmos. Chem. Phys., 15, 11653–11665, https://doi.org/10.5194/acp-15-11653-2015, 2015.
Huang, Z., Huang, J., Bi, J., Wang, G., Wang, W., Fu, Q., Li, Z., Tsay, S.-C., and Shi, J.: Dust aerosol vertical structure measurements using three MPL lidars during 2008 China-U.S. joint dust field experiment, J. Geophys. Res., 115, D00K15, https://doi.org/10.1029/2009JD013273, 2010.
Hughes, E. J., Yorks, J., Krotkov, N. A., da Silva, A. M., and McGill, M.: Using CATS near-real-time lidar observations to monitor and constrain volcanic sulfur dioxide (SO2) forecasts: CATS Observations of Volcanic SO2, Geophys. Res. Lett., 43, 11089–11097, https://doi.org/10.1002/2016GL070119, 2016.
Huneeus, N., Schulz, M., Balkanski, Y., Griesfeller, J., Prospero, J., Kinne, S., Bauer, S., Boucher, O., Chin, M., Dentener, F., Diehl, T., Easter, R., Fillmore, D., Ghan, S., Ginoux, P., Grini, A., Horowitz, L., Koch, D., Krol, M. C., Landing, W., Liu, X., Mahowald, N., Miller, R., Morcrette, J.-J., Myhre, G., Penner, J., Perlwitz, J., Stier, P., Takemura, T., and Zender, C. S.: Global dust model intercomparison in AeroCom phase I, Atmos. Chem. Phys., 11, 7781–7816, https://doi.org/10.5194/acp-11-7781-2011, 2011.
Jia, R., Liu, Y., Hua, S., Zhu, Q., and Shao, T.: Estimation of the Aerosol Radiative Effect over the Tibetan Plateau Based on the Latest CALIPSO Product, J. Meteorol. Res., 32, 707–722, https://doi.org/10.1007/s13351-018-8060-3, 2018.
Lau, K. M., Kim, M. K., and Kim, K. M.: Asian summer monsoon anomalies induced by aerosol direct forcing: the role of the Tibetan Plateau, Clim. Dynam., 26, 855–864, https://doi.org/10.1007/s00382-006-0114-z, 2006.
Lee, L., Zhang, J., Reid, J. S., and Yorks, J. E.: Investigation of CATS aerosol products and application toward global diurnal variation of aerosols, Atmos. Chem. Phys., 19, 12687–12707, https://doi.org/10.5194/acp-19-12687-2019, 2019.
Levy, R. C., Mattoo, S., Munchak, L. A., Remer, L. A., Sayer, A. M., Patadia, F., and Hsu, N. C.: The Collection 6 MODIS aerosol products over land and ocean, Atmos. Meas. Tech., 6, 2989–3034, https://doi.org/10.5194/amt-6-2989-2013, 2013.
Li, J., Lv, Q., Zhang, M., Wang, T., Kawamoto, K., Chen, S., and Zhang, B.: Effects of atmospheric dynamics and aerosols on the fraction of supercooled water clouds, Atmos. Chem. Phys., 17, 1847–1863, https://doi.org/10.5194/acp-17-1847-2017, 2017.
Li, Z., Lau, W. K. -M., Ramanathan, V., Wu, G., Ding, Y., Manoj, M. G., Liu, J., Qian, Y., Li, J., Zhou, T., Fan, J., Rosenfeld, D., Ming, Y., Wang, Y., Huang, J., Wang, B., Xu, X., Lee, S. -S., Cribb, M., Zhang, F., Yang, X., Zhao, C., Takemura, T., Wang, K., Xia, X., Yin, Y., Zhang, H., Guo, J., Zhai, P. M., Sugimoto, N., Babu, S. S., and Brasseur, G. P.: Aerosol and monsoon climate interactions over Asia, Rev. Geophys., 54, 866–929, https://doi.org/10.1002/2015RG000500, 2016.
Liu, D., Wang, Z., Liu, Z., Winker, D., and Trepte, C.: A height resolved global view of dust aerosols from the first year CALIPSO lidar measurements, J. Geophys. Res., 113, D16214, https://doi.org/10.1029/2007JD009776, 2008.
Liu, Y., Huang, J., Shi, G., Takamura, T., Khatri, P., Bi, J., Shi, J., Wang, T., Wang, X., and Zhang, B.: Aerosol optical properties and radiative effect determined from sky-radiometer over Loess Plateau of Northwest China, Atmos. Chem. Phys., 11, 11455–11463, https://doi.org/10.5194/acp-11-11455-2011, 2011.
Liu, Y., Jia, R., Dai, T., Xie, Y., and Shi, G.: A review of aerosol optical properties and radiative effects, J. Meteorol. Res., 28, 1003–1028, https://doi.org/10.1007/s13351-014-4045-z, 2014.
Liu, Y., Hua, S., Jia, R., and Huang, J.: Effect of Aerosols on the Ice Cloud Properties Over the Tibetan Plateau, J. Geophys. Res.-Atmos., 124, 2019JD030463, https://doi.org/10.1029/2019JD030463, 2019a.
Liu, Y., Zhu, Q., Huang, J., Hua, S., and Jia, R.: Impact of dust-polluted convective clouds over the Tibetan Plateau on downstream precipitation, Atmos. Env., 209, 67–77, https://doi.org/10.1016/j.atmosenv.2019.04.001, 2019b.
Liu, Y., Zhu, Q., Hua, S., Alam, K., Dai, T., and Cheng, Y.: Tibetan Plateau driven impact of Taklimakan dust on northern rainfall, Atmos. Env., 234, 117583, https://doi.org/10.1016/j.atmosenv.2020.117583, 2020.
McGill, M. J., Yorks, J. E., Scott, V. S., Kupchock, A. W., and Selmer, P. A.: The Cloud-Aerosol Transport System (CATS): a technology demonstration on the International Space Station, edited by: Singh, U. N., p. 96120A, San Diego, CA, 2015.
Murayama, T., Sugimoto, N., Uno, I., Kinoshita, K., Aoki, K., Hagiwara, N., Liu, Z., Matsui, I., Sakai, T., Shibata, T., Arao, K., Sohn, B.-J., Won, J.-G., Yoon, S.-C., Li, T., Zhou, J., Hu, H., Abo, M., Iokibe, K., Koga, R., and Iwasaka, Y.: Ground-based network observation of Asian dust events of April 1998 in east Asia, J. Geophys. Res., 106, 18345–18359, https://doi.org/10.1029/2000JD900554, 2001.
Myhre, G., Samset, B. H., Schulz, M., Balkanski, Y., Bauer, S., Berntsen, T. K., Bian, H., Bellouin, N., Chin, M., Diehl, T., Easter, R. C., Feichter, J., Ghan, S. J., Hauglustaine, D., Iversen, T., Kinne, S., Kirkevåg, A., Lamarque, J.-F., Lin, G., Liu, X., Lund, M. T., Luo, G., Ma, X., van Noije, T., Penner, J. E., Rasch, P. J., Ruiz, A., Seland, Ø., Skeie, R. B., Stier, P., Takemura, T., Tsigaridis, K., Wang, P., Wang, Z., Xu, L., Yu, H., Yu, F., Yoon, J.-H., Zhang, K., Zhang, H., and Zhou, C.: Radiative forcing of the direct aerosol effect from AeroCom Phase II simulations, Atmos. Chem. Phys., 13, 1853–1877, https://doi.org/10.5194/acp-13-1853-2013, 2013.
NOAA/NCEP: NCEP FNL Operational Model Global Tropospheric Analyses, Continuing from July 1999 (Updated Daily). National Center for Atmospheric Research Computational and Information Systems Laboratory Research Data Archive, available at: https://rda.ucar.edu/datasets/ds083.2/ (last access: 15 June 2020), 2000.
Oikawa, E., Nakajima, T., Inoue, T., and Winker, D.: A study of the shortwave direct aerosol forcing using ESSP/CALIPSO observation and GCM simulation, J. Geophys. Res.-Atmos., 118, 3687–3708, https://doi.org/10.1002/jgrd.50227, 2013.
Oikawa, E., Nakajima, T., and Winker, D.: An Evaluation of the Shortwave Direct Aerosol Radiative Forcing Using CALIOP and MODIS Observations, J. Geophys. Res.-Atmos., 123, 1211–1233, https://doi.org/10.1002/2017JD027247, 2018.
Omar, A. H., Winker, D. M., Kittaka, C., Vaughan, M. A., Liu, Z., Hu, Y., Trepte, C. R., Rogers, R. R., Ferrare, R. A., Lee, K.-P., Kuehn, R. E., and Hostetler, C. A.: The CALIPSO Automated Aerosol Classification and Lidar Ratio Selection Algorithm, J. Atmos. Oceanic Technol., 26, 1994–2014, 2009.
Proestakis, E., Amiridis, V., Marinou, E., Binietoglou, I., Ansmann, A., Wandinger, U., Hofer, J., Yorks, J., Nowottnick, E., Makhmudov, A., Papayannis, A., Pietruczuk, A., Gialitaki, A., Apituley, A., Szkop, A., Muñoz Porcar, C., Bortoli, D., Dionisi, D., Althausen, D., Mamali, D., Balis, D., Nicolae, D., Tetoni, E., Liberti, G. L., Baars, H., Mattis, I., Stachlewska, I. S., Voudouri, K. A., Mona, L., Mylonaki, M., Perrone, M. R., Costa, M. J., Sicard, M., Papagiannopoulos, N., Siomos, N., Burlizzi, P., Pauly, R., Engelmann, R., Abdullaev, S., and Pappalardo, G.: EARLINET evaluation of the CATS Level 2 aerosol backscatter coefficient product, Atmos. Chem. Phys., 19, 11743–11764, https://doi.org/10.5194/acp-19-11743-2019, 2019.
Qiu, Y., Zhang, L., and Chen, Y.: Statistical Comparison of Regional-Scale Tropospheric Aerosol Extinction Coefficient across China Based on CALIPSO Data, Aerosol Air Qual. Res., 18, 1351–1359, https://doi.org/10.4209/aaqr.2017.10.0385, 2018.
Rajapakshe, C., Zhang, Z., Yorks, J. E., Yu, H., Tan, Q., Meyer, K., Platnick, S., and Winker, D. M.: Seasonally transported aerosol layers over southeast Atlantic are closer to underlying clouds than previously reported: Smoke to Cloud Distance in SE Atlantic, Geophys. Res. Lett., 44, 5818–5825, https://doi.org/10.1002/2017GL073559, 2017.
Ramanathan, V., Crutzen, P. J., Kiehl, J. T., and Rosenfeld, D.: Aerosols, Climate, and the Hydrological Cycle, Science, 294, 2119–2124, https://doi.org/10.1126/science.1064034, 2001.
Remer, L. A., Kaufman, Y. J., Tanré, D., Mattoo, S., Chu, D. A., Martins, J. V., Li, R.-R., Ichoku, C., Levy, R. C., Kleidman, R. G., Eck, T. F., Vermote, E., and Holben, B. N.: The MODIS Aerosol Algorithm, Products, and Validation, J. Atmos. Sci, 62, 947–973, https://doi.org/10.1175/JAS3385.1, 2005.
Sato, Y. and Suzuki, K.: How do aerosols affect cloudiness?, Science, 363, 580–581, https://doi.org/10.1126/science.aaw3720, 2019.
Sato, Y., Goto, D., Michibata, T., Suzuki, K., Takemura, T., Tomita, H., and Nakajima, T.: Aerosol effects on cloud water amounts were successfully simulated by a global cloud-system resolving model, Nat. Commun., 9, 985, https://doi.org/10.1038/s41467-018-03379-6, 2018.
Sekiyama, T. T., Tanaka, T. Y., Shimizu, A., and Miyoshi, T.: Data assimilation of CALIPSO aerosol observations, Atmos. Chem. Phys., 10, 39–49, https://doi.org/10.5194/acp-10-39-2010, 2010.
Shao, Y., Wyrwoll, K.-H., Chappell, A., Huang, J., Lin, Z., McTainsh, G. H., Mikami, M., Tanaka, T. Y., Wang, X., and Yoon, S.: Dust cycle: An emerging core theme in Earth system science, Aeolian Res., 2, 181–204, https://doi.org/10.1016/j.aeolia.2011.02.001, 2011.
Sugimoto, N. and Huang, Z.: Lidar methods for observing mineral dust, J. Meteorol. Res., 28, 173–184, https://doi.org/10.1007/s13351-014-3068-9, 2014.
Tsunematsu, N., Sato, T., Kimura, F., Kai, K., Kurosaki, Y., Nagai, T., Zhou, H., and Mikami, M.: Extensive dust outbreaks following the morning inversion breakup in the Taklimakan Desert, J. Geophys. Res., 110, D21207, https://doi.org/10.1029/2005JD005994, 2005.
Wang, T., Chen, Y., Gan, Z., Han, Y., Li, J., and Huang, J.: Assessment of dominating aerosol properties and their long-term trend in the Pan-Third Pole region: A study with 10-year multi-sensor measurements, Atmos. Env., 239, 117738, https://doi.org/10.1016/j.atmosenv.2020.117738, 2020a.
Wang, T., Han, Y., Huang, J., Sun, M., Jian, B., Huang, Z., and Yan, H.: Climatology of dust-forced radiative heating over the Tibetan Plateau and its surroundings, J. Geophys. Res.-Atmos., 125, e2020JD032942, https://doi.org/10.1029/2020JD032942, 2020b.
Wang, T., Sun, M., and Huang, J.: Research review on dust and pollution using spaceborne lidar in China, Trans. Atmos. Sci., 43, 144–158, https://doi.org/10.13878/j.cnki.dqkxxb.20191120007, 2020c [in Chinese].
Winker, D. M., Hunt, W. H., and McGill, M. J.: Initial performance assessment of CALIOP, Geophys. Res. Lett., 34, L19803, https://doi.org/10.1029/2007GL030135, 2007.
Wu, G., Li, Z., Fu, C., Zhang, X., Zhang, R., Zhang, R., Zhou, T., Li, J., Li, J., Zhou, D., Wu, L., Zhou, L., He, B., and Huang, R.: Advances in studying interactions between aerosols and monsoon in China, Sci. China Earth Sci., 59, 1–16, https://doi.org/10.1007/s11430-015-5198-z, 2016.
Yan, H., and T. Wang.: Ten years of aerosol effects on single-layer overcast clouds over the US Southern Great Plains and the China Loess Plateau, Adv. Meteorol., 2020, 6719160, https://doi.org/10.1155/2020/6719160, 2020.
Yorks, J. E., McGill, M. J., Palm, S. P., Hlavka, D. L., Selmer, P. A., Nowottnick, E. P., Vaughan, M. A., Rodier, S. D., and Hart, W. D.: An overview of the CATS level 1 processing algorithms and data products: CATS Data Products and Algorithms, Geophys. Res. Lett., 43, 4632–4639, https://doi.org/10.1002/2016GL068006, 2016.
Yu, H., Chin, M., Winker, D. M., Omar, A. H., Liu, Z., Kittaka, C., and Diehl, T.: Global view of aerosol vertical distributions from CALIPSO lidar measurements and GOCART simulations: Regional and seasonal variations, J. Geophys. Res., 115, D00H30, https://doi.org/10.1029/2009JD013364, 2010.
Yumimoto, K., Uno, I., Sugimoto, N., Shimizu, A., Liu, Z., and Winker, D. M.: Adjoint inversion modeling of Asian dust emission using lidar observations, Atmos. Chem. Phys., 8, 2869–2884, https://doi.org/10.5194/acp-8-2869-2008, 2008.