the Creative Commons Attribution 4.0 License.
the Creative Commons Attribution 4.0 License.
 | 09 Dec 2020
Sensitivity of warm clouds to large particles in measured marine aerosol size distributions – a theoretical study
Orit Altaratz
Guy Dagan
Zev Levin
Assaf Vardi
Aerosol size distribution has major effects on warm cloud processes. Here, we use newly acquired marine aerosol size distributions (MSDs), measured in situ over the open ocean during the Tara Pacific expedition (2016–2018), to examine how the total aerosol concentration (Ntot) and the shape of the MSDs change warm clouds' properties. For this, we used a toy model with detailed bin microphysics initialized using three different atmospheric profiles, supporting the formation of shallow to intermediate and deeper warm clouds. The changes in the MSDs affected the clouds' total mass and surface precipitation. In general, the clouds showed higher sensitivity to changes in Ntot than to changes in the MSD's shape, except for the case where the MSD contained giant and ultragiant cloud condensation nuclei (GCCN, UGCCN). For increased Ntot (for the deep and intermediate profiles), most of the MSDs drove an expected non-monotonic trend of mass and precipitation (the shallow clouds showed only the decreasing part of the curves with mass and precipitation monotonically decreasing). The addition of GCCN and UGCCN drastically changed the non-monotonic trend, such that surface rain saturated and the mass monotonically increased with Ntot. GCCN and UGCCN changed the interplay between the microphysical processes by triggering an early initiation of collision–coalescence. The early fallout of drizzle in those cases enhanced the evaporation below the cloud base. Testing the sensitivity of rain yield to GCCN and UGCCN revealed an enhancement of surface rain upon the addition of larger particles to the MSD, up to a certain particle size, when the addition of larger particles resulted in rain suppression. This finding suggests a physical lower bound can be defined for the size ranges of GCCN and UGCCN.
- Article
(3374 KB) - Full-text XML
-
Supplement
(4504 KB) - BibTeX
- EndNote


Clouds play a key role in the Earth's climate system. By scattering and absorbing solar and terrestrial radiation, clouds influence the radiative balance. Aerosols influence cloud processes by serving as cloud condensation nuclei (CCN) on which cloud droplets can form (Köhler, 1936). The size of CCN determines the droplets' initial size distribution and hence impacts cloud processes and properties, such as size (Rosenfeld et al., 2008; Altaratz et al., 2014; Koren et al., 2014), lifetime (Albrecht, 1989), optical properties (Twomey and Squires, 1959; Twomey, 1977; Mülmenstädt and Feingold, 2018), and rain amounts and patterns (Yin et al., 2000b; Rosenfeld et al., 2006; Xue et al., 2008; Yuan, 2011; Altaratz et al., 2014; Koren et al., 2014; Seigel, 2014).
The study of giant CCN (GCCN) and ultragiant CCN (UGCCN) and their effects on warm clouds and precipitation has been the subject of various works (Beard and Ochs III, 1993; Feingold et al., 1999; Khain et al., 2000; Yin et al., 2000b; Dagan et al., 2015a). Their size definition is loose, as the lower threshold of GCCN has been defined within a wide range of mean particle diameter (Dp) of 2–10 µm (Feingold et al., 1999; Yin et al., 2000a), while particles with Dp>20 µm are usually defined as UGCCN (Feingold et al., 1999; Posselt et al., 2008). Although their observed concentration is low (<0.1 cm−3; Exton et al., 1986; Flores et al., 2020) in comparison to a typical marine CCN concentration (50–250 cm−3), they have been shown to affect cloud properties and might even transform non-precipitating clouds to a precipitating state (Feingold et al., 1999).
GCCN and UGCCN stem from a variety of sources but are considered to be mainly sea salt (Schulz et al., 2004) and mineral dust (Levin et al., 1996; Tegen et al., 2002). Despite their large size, these particles can be transported thousands of kilometers from their origin. Ultragiant mineral dust particles (Dp>75 µm) have been observed as far as 10 000 km from their origin (Betzer et al., 1988). Other studies have shown even bigger dust particles (Dp>200 µm) carried from Asia to the remote Pacific Ocean, and from the Sahara to Europe (Middleton et al., 2001). Recently, gigantic Saharan dust particles (Dp∼450 µm) were observed above the Atlantic Ocean ∼ 3500 km west of the African coast (van der Does et al., 2018).
Aerosols' ability to act as CCN is largely controlled by their size (Dusek et al., 2006); thus, even though mineral dust is less soluble than sea salt (Petters and Kreidenweis, 2007; Kumar et al., 2009), large mineral dust particles are still considered to act as effective GCCN (Johnson, 1982; Levin et al., 1996; Nenes et al., 2014).
The effect of GCCN and UGCCN on warm clouds' processes is highly important but not fully understood. Early work demonstrated that a few activated UGCCN and even GCCN (from ∼ 10−3 cm−3) can drive early initiation of precipitation, by producing a tail of large drops in the droplet distribution (Johnson, 1982). More recent studies have shown that the effect of GCCN and UGCCN on warm clouds and precipitation is more complex and greatly depends on aerosol concentration. For low aerosol concentration, the addition of GCCN was shown to have little or no effect on precipitation (Teller and Levin, 2006; Zhang et al., 2006; Cheng et al., 2009; Dagan et al., 2015a), due to the early initiation of collision–coalescence and lower supersaturation values (Zhang et al., 2006). In contrast, their effect under polluted conditions is still under debate. It is accepted that the addition of small CCN (for constant liquid water content) leads to the formation of a greater number of smaller droplets and results in delayed collision–coalescence and a less efficient collection process (Gunn and Phillips, 1957; Squires, 1958; Warner, 1968; Albrecht, 1989). However, addition of GCCN and UGCCN, on one side, has been shown to counteract this delay and act to precede and enhance the collection process, leading to earlier initiation of precipitation (Johnson, 1982; Teller and Levin, 2006; Feingold et al., 1999; Yin et al., 2000b; Rosenfeld et al., 2002; Zhang et al., 2006; Cheng et al., 2009; Dagan et al., 2015a). This was demonstrated for warm convective clouds (Cheng et al., 2009; Dagan et al., 2015a) and stratiform clouds (Feingold et al., 1999; Zhang et al., 2006). On the other side, Khain et al. (2000) reported that the role of GCCN and UGCCN, though it can be important, is unlikely to be the dominant mechanism of raindrop formation in warm clouds. On a global scale, by using the ECHAM5 general circulation model, Posselt et al. (2008) found that adding GCCN induces faster precipitation in warm clouds and shorter residence times and less accumulation of water in the atmosphere (i.e., accelerating the hydrological cycle).
Here we present a theoretical study, combining new in situ measurements of marine aerosol size distributions (MSDs), taken during the Tara Pacific expedition (Flores et al., 2020), and a “toy model” with a detailed description of cloud microphysical processes, to examine the link between MSDs and cloud processes and properties (like cloud mass and amount of precipitation), on a single-cloud scale. By using a simplified model, we gain the ability to distill the MSD effect on the interplay between the cloud microphysical processes. This study can be viewed as a basis for a future investigation of this effect on a cloud field scale.
2.1 MSDs measurements
MSDs were measured aboard the schooner Tara over the Atlantic Ocean, Caribbean Sea, and Pacific Ocean during the Tara Pacific Expedition (2016–2018). The Tara Pacific Expedition's primary focus was coral reef research (Planes et al., 2019) with the supporting measurements of discrete surface ocean measurements (Gorsky et al., 2019) and the innovative addition of marine aerosol measurements (Flores et al., 2020). Using a scanning mobility particle sizer (SMPS) in parallel with an optical particle counter (OPC), particles between 0.03–32 µm (dry diameter) were measured at ∼ 15 m above sea level (a.s.l.) in the Atlantic Ocean and at ∼ 27 m a.s.l. in the Caribbean Sea and western Pacific Ocean (Fig. 1). A Nafion dryer was installed before the SMPS-OPC, which reduced the sampled air relative humidity (RH) to below ∼ 35 %, below the efflorescence point for NaCl (Gupta et al., 2015); thus we considered Dp to be dry. The OPC size distributions were corrected and merged with the SMPS size distributions following the method described by Hand and Kreidenweis (2002). For a more detailed description of the aerosol measurements see Flores et al. (2020). Six MSDs were chosen for this study to initiate the cloud simulations (Fig. 1b): two from the Atlantic Ocean, one from the Caribbean Sea, and three from the Pacific Ocean.
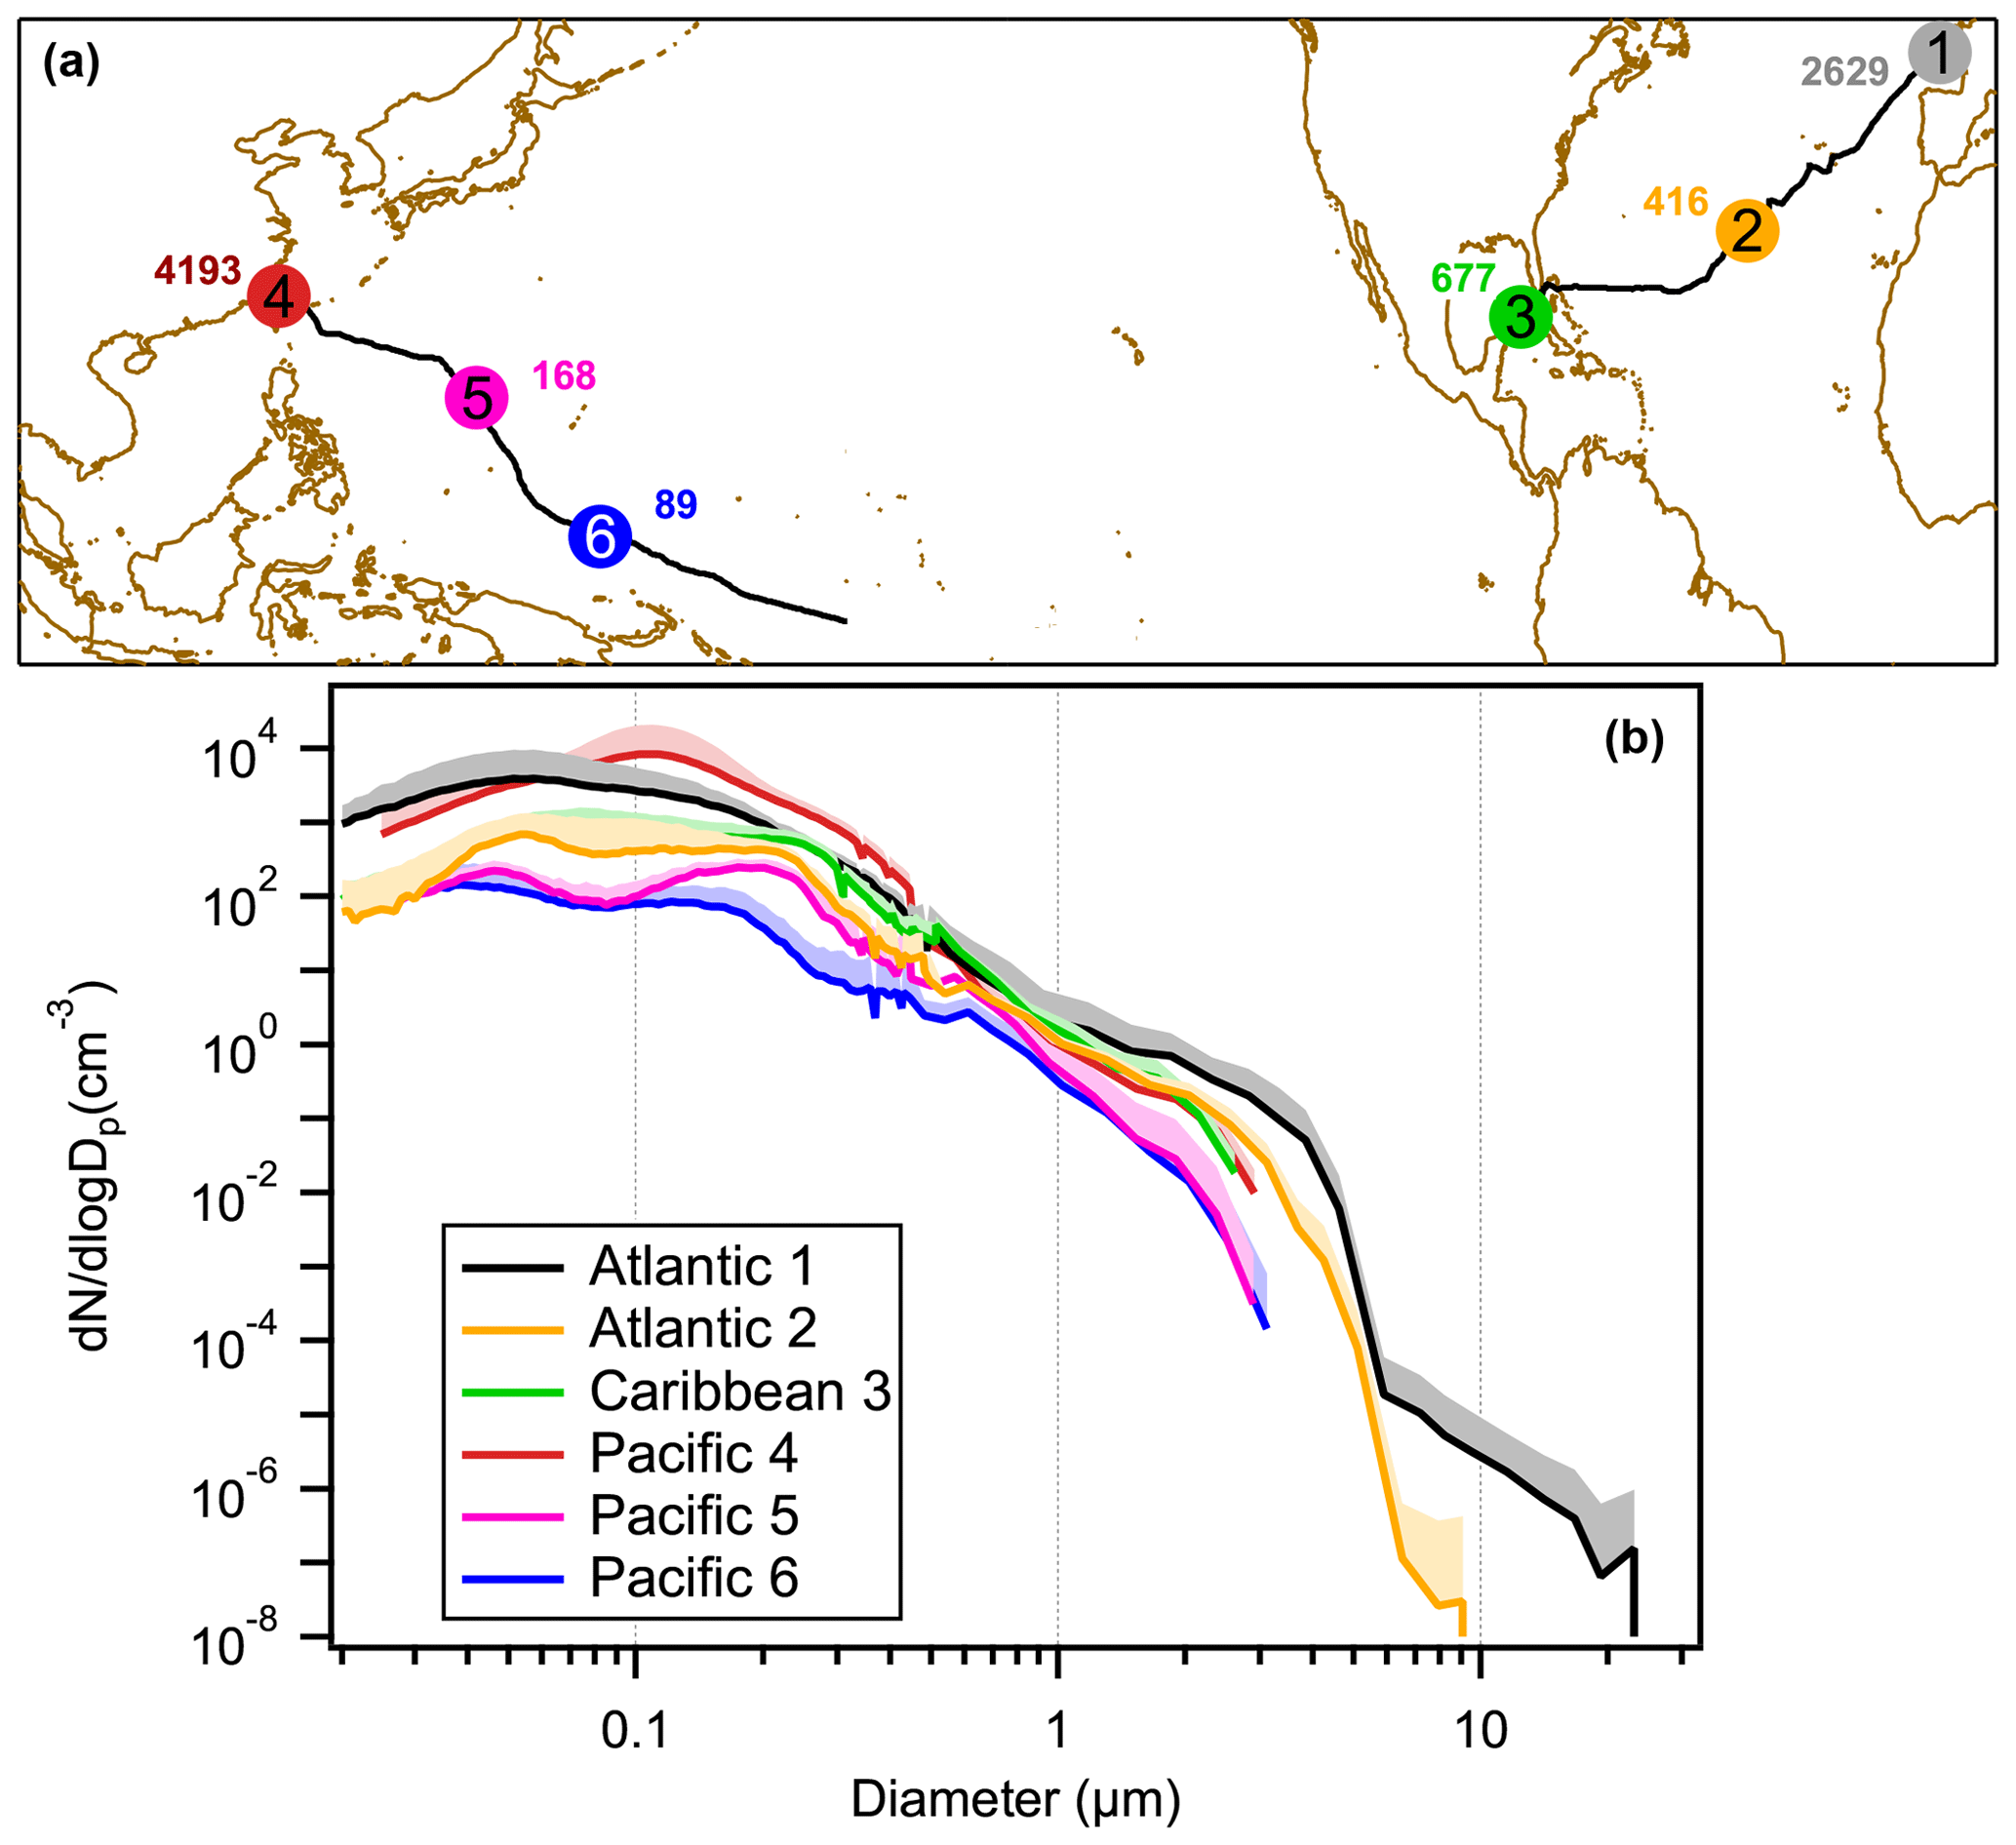
Figure 1(a) Tara's route across the Atlantic Ocean, Caribbean Sea, and Pacific Ocean. Circles indicate the locations of the MSDs used in this study, with total number concentrations (cm−3) written next to each circle. (b) All MSDs; shaded areas represent the upper standard deviation. Each colored curve in panel (b) is associated with a specific location and total concentration marked in the same color in panel (a). Each MSD is an average of at least 8 h of measurements.
The MSDs represent a variety of marine environments with different scenarios: Atlantic-1, anthropogenically influenced, with a single mode located between the Aitken and accumulation modes, highly pronounced coarse and giant modes, and total aerosol concentration (Ntot) of 2629 cm−3; Atlantic-2, with comparable Aitken and accumulation modes, pronounced coarse mode, and no giant mode (Ntot=416 cm−3); Caribbean-3, with comparable Aitken and accumulation modes, a less pronounced coarse mode, and no giant mode (Ntot=677 cm−3); Pacific-4, anthropogenically influenced single mode, a less pronounced coarse mode, and no giant mode (Ntot=4193 cm−3); Pacific-5, clean marine with a more pronounced accumulation mode, a diminished coarse mode, and no giant mode (Ntot=168 cm−3); and Pacific-6, super clean marine with a more pronounced Aitken mode, a diminished coarse mode, and no giant mode (Ntot=89 cm−3).
2.2 Model description and setup
The Tel Aviv University axi-symmetric (1.5 D; vertical and radial directions) non-hydrostatic cloud model (TAU-CM) with a detailed cloud microphysics scheme was used (Tzivion et al., 1994; Reisin et al., 1996). The TAU-CM includes warm microphysical processes such as nucleation of CCN, condensation and evaporation, collision–coalescence, breakup (McTaggart-Cowan and List, 1975; Low and List, 1982), and sedimentation (cold processes were excluded here). The microphysical processes are formulated and solved using a multi-moment bin method (Tzivion et al., 1987). CCN of a certain size are activated if the critical supersaturation is reached according to the Köhler equation (Pruppacher and Klett, 2010), taking into account both the curvature and chemical (i.e., solute) effects. All the MSDs were considered to be composed of sea-salt aerosols. To test the sensitivity of the results to different chemical composition, we ran extra simulations changing the aerosol's composition to ammonium sulfate, and we found no substantial differences.
The model was run at 50 m resolution in the vertical and horizontal directions and a temporal resolution of 1 s. The model was initialized using three idealized atmospheric profiles. We chose to use the idealized profiles since the MSDs were sampled throughout different places (see Fig. 1), and our focus is on the MSD effect. The profiles represent a relatively moist tropical environment (Garstang and Betts, 1974; Dagan et al., 2015b), but they differ in the inversion layer height and RH in the cloudy layer, resulting in shallow, intermediate, and deeper cloudy layers. The deepest profile included a well-mixed sub-cloud layer between 0–1000 m and a conditionally unstable cloudy layer between 1000 and 4000 m (3000, 2000 m for the other profiles) with an RH of 95 % (90 %, 80 %). The cloudy layers were bounded by an overlying inversion layer with a temperature gradient of 2 ∘C over 50 m and RH of 30 %. Here we focus on the deepest profile (highest inversion height and RH), and we present some of the results from the shallow and intermediate profiles in the Supplement. This choice was made because a larger aerosol concentration optimum is expected for larger clouds (Dagan et al., 2015b). This allowed us to examine the full effect of the different MSDs on cloud microphysical processes. Each of the six MSDs was normalized to the five other MSD concentrations, to preserve the original shape (see Fig. S1 in the Supplement; total of 36 MSDs and 108 simulations for three initialization profiles). As we normalized the MSDs to higher values of Ntot, the MSDs shifted such that they contained larger particles (Fig. S1). However, only the Atlantic-1 and Atlantic-2 MSDs contained GCCN, and the Atlantic-1 was the only MSD that contained UGCCN even in the case of the highest aerosol concentration.
First, we explored the link between the MSDs and the cloud's bulk properties (total mass and rain yield) as a function of the total aerosol concentration (Ntot).
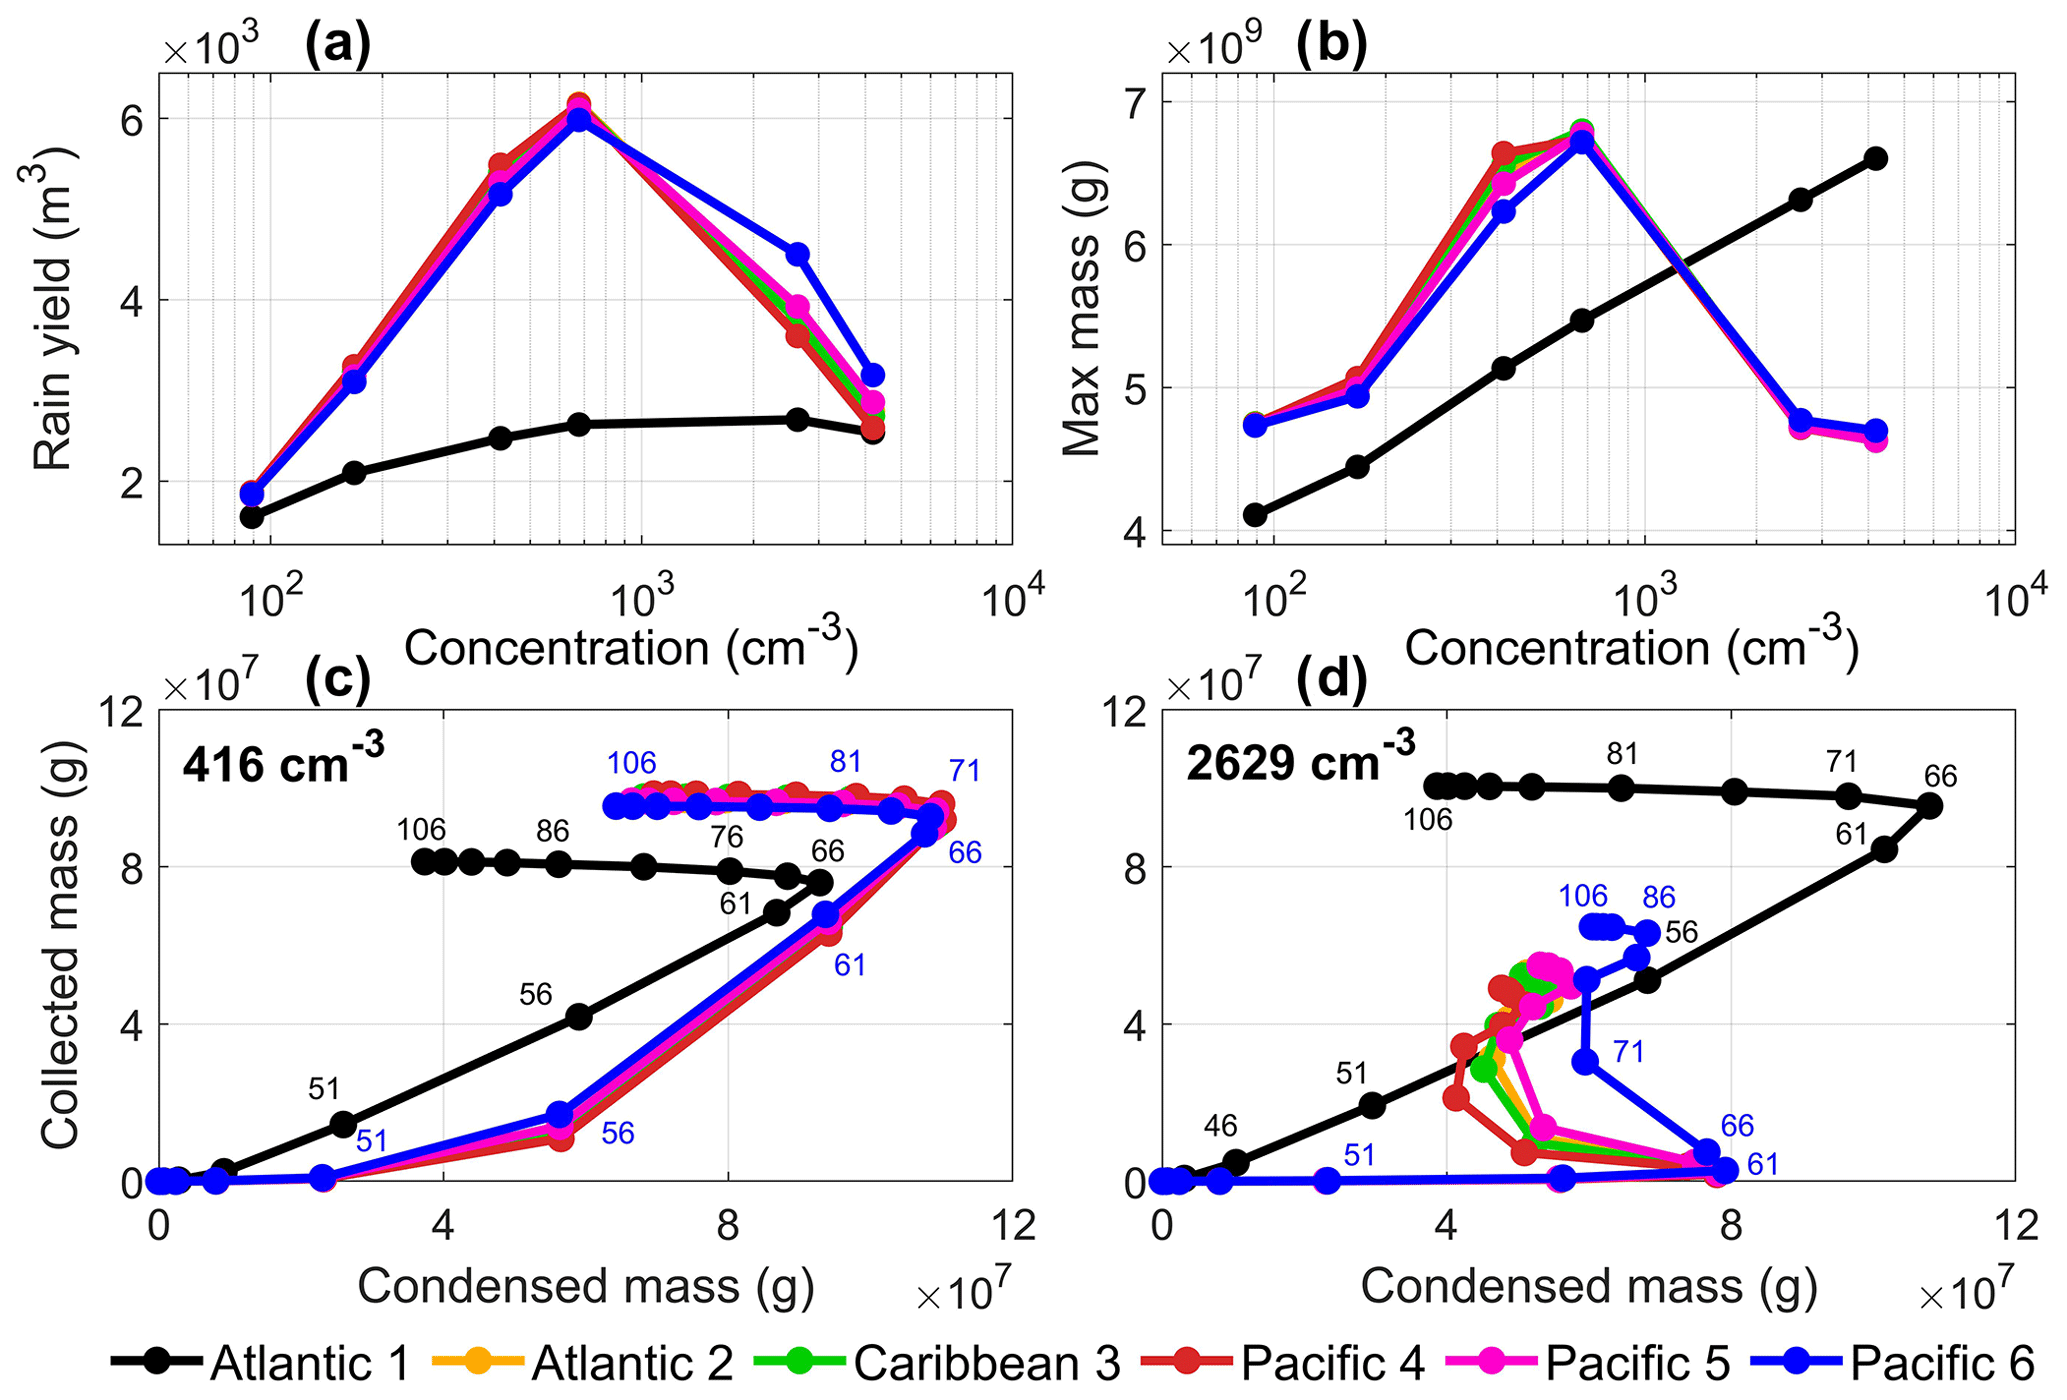
Figure 2(a) Surface rain yield and (b) cloud’s maximum mass as a function of Ntot used in the simulation, integrated over 150 min of simulations. Each curve represents six simulations, done with a specific shape of the MSD normalized to different aerosol concentrations. The lower panels (c, d) show the time evolution of accumulated condensed mass versus accumulated collected mass. The simulated time is noted along the black and blue curves for the Atlantic-1 and Pacific-6 MSDs, respectively. The panels represent an aerosol concentration of 416 and 2629 cm−3 (panels c and d, respectively).
Figure 2 shows the total accumulated rain yield at the surface (Fig. 2a) and the maximum cloud mass for each simulation (Fig. 2b) as a function of the Ntot used in that simulation. Each curve presents the results of six different simulations conducted using the same MSD shape but with different concentration (each MSD was normalized to the concentration of the other MSDs while maintaining its shape). As can be seen in Fig. 2 (and in Fig. S2 for the two other atmospheric profiles), the Atlantic-1 clouds have a distinct curve compared to the rest of the MSDs for all profiles. We will first describe the curves of the other five MSDs clouds, and later we focus on the exceptional Atlantic-1 curve and its driving mechanisms.
The general shape of the five curves is similar for the deep and intermediate profiles and exhibits a non-monotonic trend (see Figs. 2a–b and S2a–b, respectively): an increase in total rain yield and the cloud's maximum mass as a function of aerosol loading, up to a maximum optimal aerosol concentration (Nop), followed by a decrease. All five curves have a similar Nop of around Ntot=677 cm−3 (Ntot=416 cm−3 for the intermediate profile) for both surface rain yield and maximum cloud mass. For the shallow profile, the five MSD curves preset only the decreasing branch, with a minor decrease in rain yield and cloud mass with increasing aerosol loading. The non-monotonic trend can be explained by the interaction of competing processes (Dagan et al., 2015b). The ascending branch (moving from extremely clean to slightly polluted conditions) can be explained by the increased droplet surface area, which enhances condensation efficiency (Pinsky et al., 2013; Seiki and Nakajima, 2014) and delays the initiation of collision–coalescence (see Fig. S3a–b). The delayed initiation of collision–coalescence drives longer condensational growth (hence, latent heat release also increases), and the droplets reach higher in the atmosphere (larger droplet mobility; Koren et al., 2015). This chain of processes drives deeper clouds with more liquid mass (i.e., cloud invigoration). On the other hand, the descending branch (Ntot>Nop) is caused by enhanced periphery processes, entrainment, and evaporation, which take over and result in cloud suppression (see evaporation in Fig. S3c and Dagan et al., 2015b). The value of Nop depends on the atmospheric profile (Dagan et al., 2015b), such that it decreases as the profile becomes shallower (i.e., lower inversion base and RH; Fig. S2). For the cases of shallower cloudy layers, where the clouds are more subjected to entrainment effects, the ascending branch of the curves is less pronounced (intermediate profile, Fig. S2a–b) or non-existent (shallow profile, Fig. S2c–d). We, therefore, focus on the deepest atmospheric profile, which better demonstrates the full effect of the competition and interactions between the microphysical processes in the clouds, and we refer to Text S2 in the Supplement for the intermediate and shallow profiles.
The curve formed by the Atlantic-1 MSD clouds (black line in Fig. 2) is dramatically different from the other five curves. It shows not only significantly lower values for most of the simulations (except for the cloud mass for Ntot 1000 cm−3), but also different trends in both rain yield and cloud mass. For Ntot <1000 cm−3, the trends of both surface rain and the cloud's maximum mass show an increase with increasing aerosol loading, similar to the other five MSD curves. However, for higher values of aerosol concentration, the rain yield saturates, and the cloud's maximum mass continues to increase with no Nop (for higher aerosol concentration values, see Fig. S4).
The flattening of the rain yield curve is attributed to the presence of GCCN (Dagan et al., 2015a). The Atlantic-1 MSD has three distinct modes: one influenced by pollution, one of coarse particles, and one of GCCN. Next, we examined how the coarse and giant modes, which are by far more pronounced in the Atlantic-1 MSD than in the other five MSDs, account for the unique behavior of these clouds.
To explore the Atlantic-1 MSD monotonic increase in maximum cloud mass with Ntot, we examined the time evolution of the cloud's microphysical processes. Figure 2c–d shows the evolution of the six cloud trajectories on the phase space spanned by the accumulated condensed mass (representing droplet nucleation and condensational growth) and the accumulated collected mass (representing the collision–coalescence processes), for a medium aerosol concentration level (Ntot normalized to 416 cm−3, Fig. 2c) and a more polluted one (Ntot normalized to 2629 cm−3, Fig. 2d). Note that the collected mass represents an internal redistribution of the liquid water mass with no change in the total mass. For the cleaner cases, where the aerosol loading is a bit lower than Nop, in the first stage, all but the Atlantic-1 clouds accumulate mass by nucleation and condensation without any contribution from the collection process. At a later stage in the cloud's lifetime, the trajectories turn diagonally up (∼ 56 min into the simulation), showing that the collection process has begun. Finally, the clouds stop growing by condensation, reaching their maximum mass, and they begin to evaporate (∼ 71 min into the simulation; trajectories turn to the left). In the Atlantic-1 MSD case, the collection process kicks in earlier, within 10 min of the cloud's lifetime (∼ 51 min into the simulation), due to the presence of GCCN in the MSD which initially form bigger droplets. The bigger droplets formed by the nucleation of GCCN resulted in a lower droplet surface area for a given total water mass (compared to the one that would have formed from droplets nucleated on smaller CCN) for the Atlantic-1 MSD case compared with the other MSDs (Fig. S5). The lower total droplet surface area was then further reduced by the early initiation of the collection process. Moreover, these bigger droplets rapidly grow into drizzle-sized drops and sediment out of the cloud, accounting for the smaller maximum condensed mass in the Atlantic-1 case compared to the other five cases.
Under more polluted conditions, the trajectory of the Atlantic-1 MSD cloud (black curve in Fig. 2d) on this phase space is similar (in shape) to the one in the cleaner case (black curve in Fig. 2c), but this cloud accumulates more mass, due to the larger droplet surface area (Fig. S5b–c). However, the Atlantic-1’s total droplet surface area is lower in comparison to the rest of the clouds (Fig. S5c), and still, it condenses more mass, reaching g compared to g as the rest of the clouds. This can be explained by the nucleation of the GCCN and UGCCN that are present in the Atlantic-1 MSD under polluted conditions, which on the one hand accumulate more mass (Fig. 2d) and drive a significantly higher number of raindrops at the growing stage of the cloud (Fig. S8), and on the other hand, result in a lower droplet number concentration (Nd) compared to the other clouds (Fig. S7). Therefore, the vertical distribution of mass of the Atlantic-1 cloud is dominated by the precipitating particles, unlike the other clouds (Figs. S7 and S8). Note that while the total cloud mass of the Atlantic-1 is larger than the one obtained by the other clouds, it is of the same order of magnitude. However, the mass of precipitating particles in the Atlantic-1 cloud overwhelms the ones exhibited by the other MSDs. Contrastingly, the Nd of the other clouds is much higher than the one of the Atlantic-1 cloud, allowing for collision–coalescence to begin toward the end of the condensational growth stage, or after the evaporation process has begun (e.g., Pacific-4, the trajectories turn back to the left before acquiring a vertical component), and to increase in a slow pace. For the Atlantic-1 cloud, the accumulation of liquid water by nucleation and condensation occurs in parallel to the collection process that starts much earlier in this case (Fig. 2d). The timing of the initiation of collision–coalescence further explains the decreasing branch of the rain yield trend for all MSDs aside from Atlantic-1 (Fig. 2a), as it starts too late in the cloud's lifetime (after the cloud has already begun to lose mass).
This, however, does not explain the overall smaller surface rain yield of the Atlantic-1 MSD clouds for all aerosol concentrations, nor the saturation trend for high Ntot (Fig. 2a). To further inspect the lower surface rain yield, we examined the temporal evolution of evaporation below the cloud base and the surface rain rate for the different MSD clouds. Figure 3 shows the evaporation below the cloud base (left column) and the surface rain rate (right column) as a function of time for four different Ntot values (89, 416, 2629, 4193 cm−3 – from upper to lower panels).
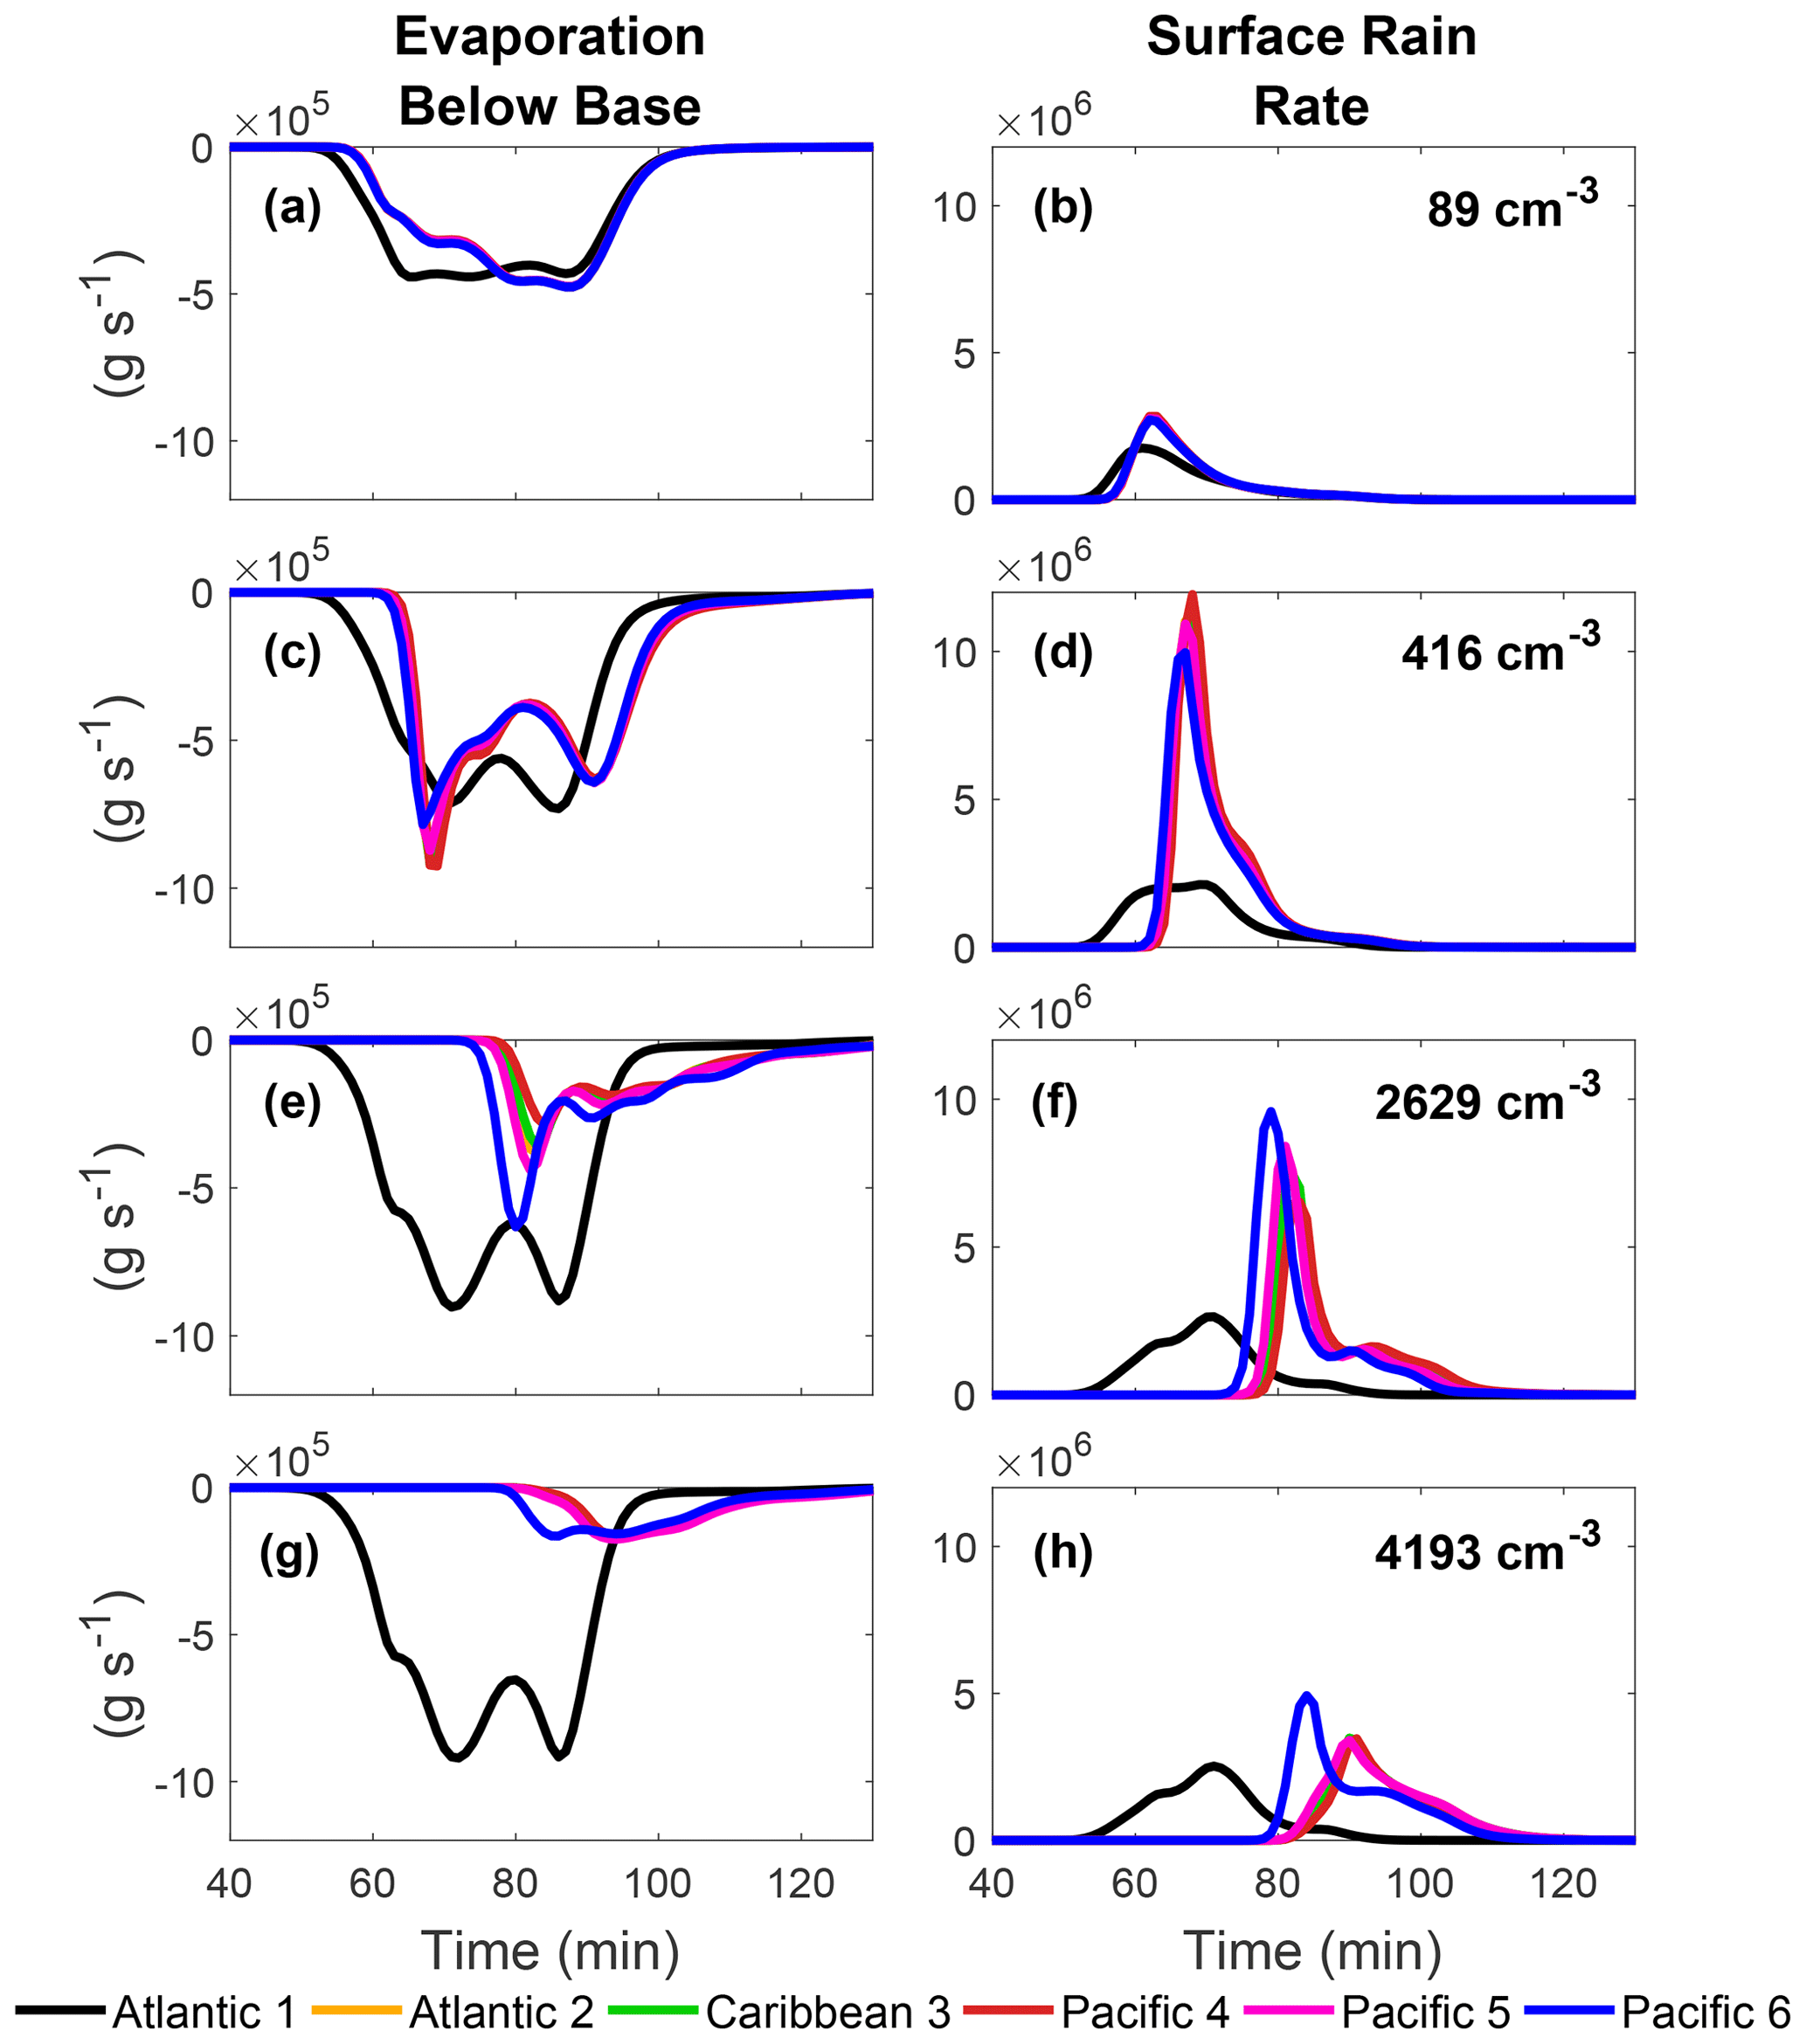
Figure 3Time evolution of the evaporated mass below the cloud base and surface rain mass per unit time (left and right columns, respectively). Each row represents a specific Ntot: 89 cm−3 (a, b), 416 cm−3 (c, d), 2629 cm−3 (e, f), and 4193 cm−3 (g, h), as shown in the upper right corner of each row. The different curves in each panel represent an MSD shape normalized to the specific Ntot. Note that there is an order of magnitude difference between the exponent in the right and left columns.
Two main features can be seen for the Atlantic-1 case regardless of Ntot: (i) both evaporation below the cloud base and surface rain start earlier than in the rest of the cases. This is due to the early onset of collision–coalescence (Fig. 2c–d), which converts the already big particles into drizzle-sized drops; (ii) evaporation below cloud base is always larger and, at the same time, the surface rain rate is lower. However, the magnitude of both evaporation below the cloud base and surface rain rate does depend on Ntot, ranging from 0.17–2.16×10⁷ and 0.42–4.76×10⁷ g s−1, respectively.
The smaller values of the surface rain yield for the Atlantic-1 MSD, and the non-monotonic trend for the rest of the MSDs (Fig. 2a), are also evident in the temporal evolution of surface rain rate (right column of Fig. 3). Part of this is explained above, by the interplay between different internal cloud processes, but it does not elucidate the complete mechanism. Figure 3 shows that evaporation below the cloud base plays a crucial role in determining the low values of the surface rain in the Atlantic-1 case. As Ntot increases, more GCCN are present (Fig. S1) and preferentially activated, growing rapidly into drizzle-sized drops (see Fig. S8), which immediately begin to precipitate. This reduces their time spent in the cloud, and they are thus large enough to fall but still too small to reach the surface before they fully evaporate. The Atlantic-1 raindrops are considerably smaller than those produced by the other clouds (Fig. S6), and their evaporation is therefore more efficient. Moreover, the rain falls below the cloud base earlier, compared to the other MSD cases, while the cloud is still in its developing stage, meaning that the cloud and the sub-cloud layers are dominated by updrafts, and the sub-cloud layer is consequently drier (Fig. S7). The combination of the small raindrops with their early fallout that lasts longer (due to the updrafts prevailing at this stage) results in greater rain evaporation below the cloud base for the Atlantic-1 MSD. A more substantial evaporation below the cloud base can lead to a larger descent of cold air to the surface and eventually to cold pool formation, which affects cloud field organization (Warner et al., 1979; Zuidema et al., 2012; Seifert and Heus, 2013; Dagan et al., 2018).
Finally, to ensure that this reported effect is indeed a direct result of the presence of GCCN and UGCCN, we investigated the impact of the different parts of the Atlantic-1 MSD on cloud processes. We performed additional sensitivity simulations using the Atlantic-1 MSD in which the largest aerosol size bins were gradually excluded from the distribution. This resulted in a very minor change in Ntot (< 0.001 %), due to the small number concentration of the excluded large particles.
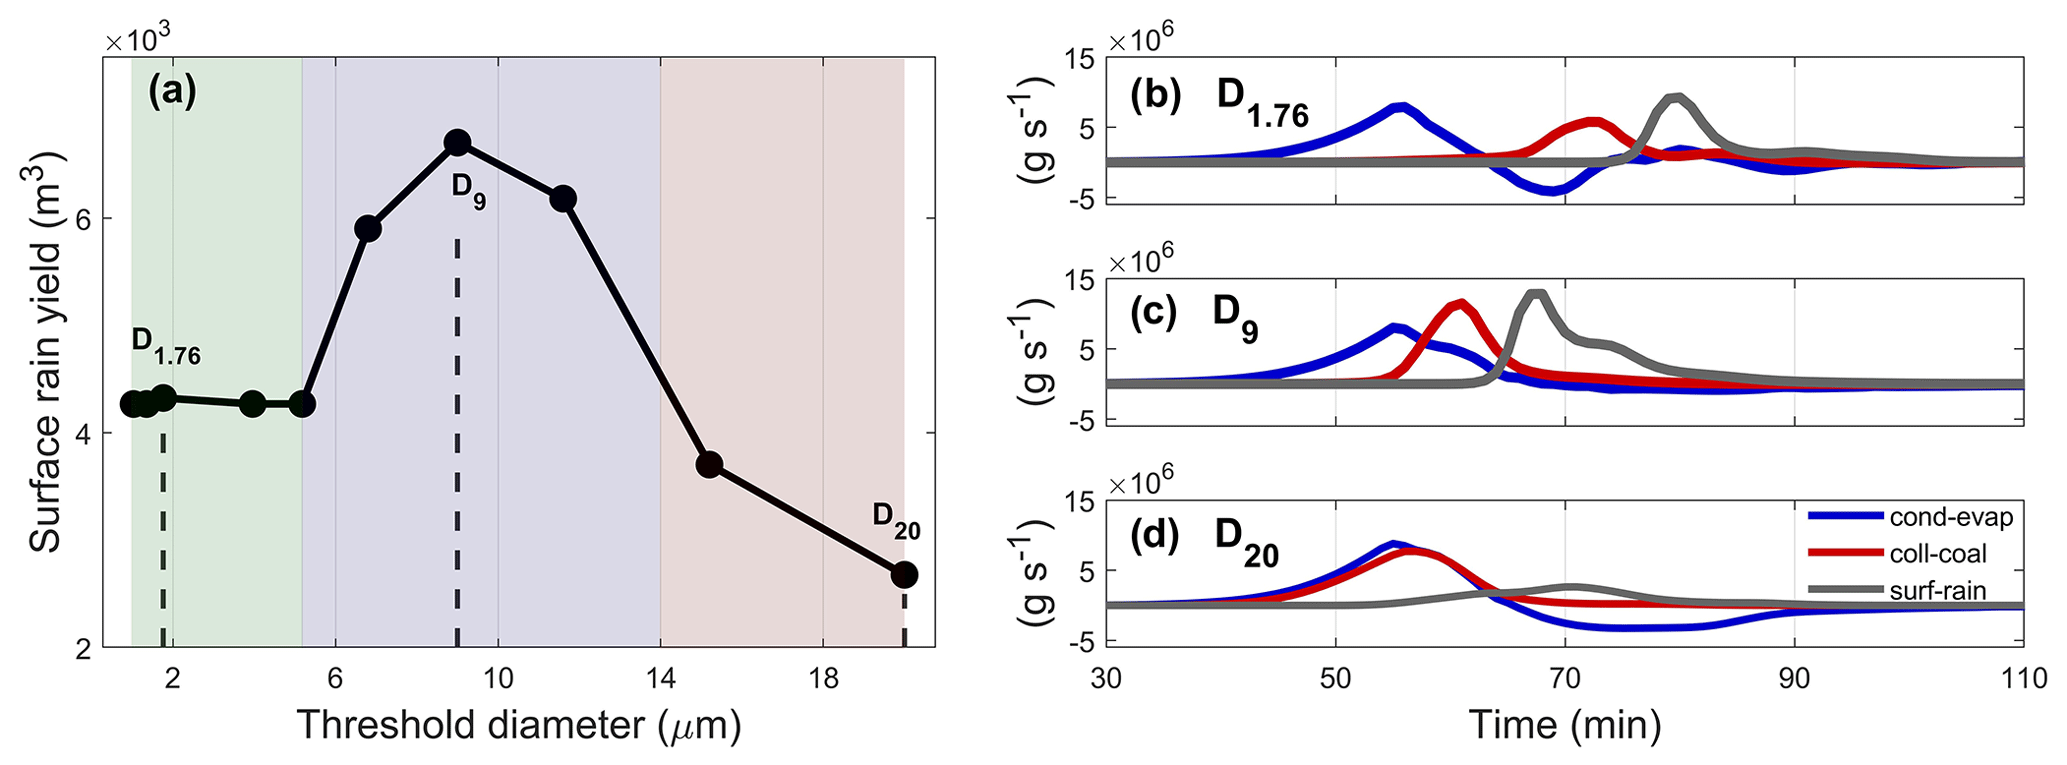
Figure 4(a) Surface rain yield (m3) as a function of a threshold diameter (no particles bigger than that diameter) for the Atlantic-1 MSD. Each circle in panel (a) represents a subtraction of specific bins from the MSD. The shaded areas indicate the different regimes of surface rain yield. (b–d) Condensed–evaporated mass (blue), collected mass (red), and surface rain rate (gray) per unit time, as a function of time for selected threshold diameters matching three simulations from panel (a). The specific threshold diameters are marked in the upper left corner of each panel (D1.76, D9, and D20 µm: b–d, respectively), and panel (d) represents the full Atlantic-1 MSD.
Figure 4a shows the total surface rain yield for a specific simulation as a function of the aerosol threshold diameter used in that simulation (above which the particle concentration was set to zero). For example, D9 represents a simulation in which the Atlantic-1 MSD was truncated at an aerosol diameter of 9 µm (i.e., all size bins with diameters larger than this threshold were set to zero). The behavior of the surface rain yield as a function of threshold diameter revealed that the amount of precipitation reaching the surface is highly dependent on the existence of GCCN and UGCCN, and more specifically on their sizes. The curve shows a non-monotonic trend that starts with a plateau, where the addition of larger particles (increase in threshold diameter) does not affect the surface precipitation (D1.03–D5.81, green shading). This stable behavior is followed by a range of sizes where the addition of particles results in an enhanced amount of surface rain (D5.81–∼D14, blue shading). The maximum surface rain yield (6.7×10³ m3) is obtained at an optimum threshold diameter (Dop) of ∼9 µm. As particles greater than ∼ 14 µm in diameter were included in the MSD, the rain yields decreased below the mean values of the plateau (D14–∼D20, red shading). The changing trends of the curve suggest that the thresholds used to define GCCN and UGCCN can be taken from a more physical source, rather than a loose definition. We propose that the threshold diameter for which the surface rain yield is enhanced be defined as the lower bound for GCCN, and the threshold diameter for which surface rain begins to be suppressed as the lower bound for UGCCN. For this study, using the Atlantic-1 MSD and the specific atmospheric conditions (described in Sect. 2.2), the lower bound of GCCN is Dp≅5 µm and for UGCCN Dp≅14 µm.
Figure 4b–d shows the evolution (timing and magnitude) of the condensation–evaporation processes (nucleation and diffusional growth), collision–coalescence, and surface rain rate for three selected threshold diameters (D1.76, D9, and D20). It sheds light on the different trends shown in Fig. 4a. The larger the particles in the MSD, the faster the critical size for the initiation of the collision–coalescence process is reached and the sooner it occurs. The initiation of collision–coalescence shortens from ∼ 65 min of simulation for the D1.76 case to ∼ 45 min of simulation for the D20 case, where it starts almost immediately after condensation begins (Fig. 4b and d, respectively).
For optimal rain production, collision–coalescence has to be correctly timed with the condensational growth of the cloud (Dagan et al., 2015a). For the D1.76 case, collision–coalescence starts only after condensational growth has ceased and peaks when evaporation is the dominant process (∼ 62 and ∼ 72 min into the simulation, respectively). Whereas for D9 it starts earlier (∼ 55 min into the simulation) while condensation peaks, and for the D20 case (i.e., the full Atlantic-1 MSD) the peaks of the collision–coalescence and condensation processes occur at nearly the same time (∼ 56 min into the simulation). The optimum threshold diameter dictates the correct timing for the microphysical processes, such that maximum liquid water mass is converted to surface rain. For the Atlantic-1 MSD (under the deepest atmospheric profile), the maximum surface rain is obtained for Dop∼9 µm (Fig. 4c).
In this study, we used six MSDs measured in situ in the Atlantic Ocean, Caribbean Sea, and Pacific Ocean to study the effect of aerosol concentration and size on warm clouds' properties. The MSDs differed in shape and ranged in total aerosol concentration from very clean (89 cm−3, Pacific-6) to polluted (4193 cm−3, Pacific-4) conditions. By equating the Ntot of the different MSDs (i.e., normalizing them to match the six specific Ntot values), we altered their total aerosol concentration, while keeping the amount of small versus big aerosols constant. This affected the initial droplet size distributions in terms of the total number of droplets and the droplets' sizes.
Using an axisymmetric cloud model with detailed bin microphysics, we examined the sensitivity of key properties of warm clouds (cloud maximum mass and surface rain) to the measured MSDs on a single cloud scale, under a range of environmental conditions (going from shallow to intermediate and deeper conditions, using three atmospheric profiles). We focused on the deepest profile, since it best captured the effect of competing microphysical cloud processes, and showed that surface rain yield and cloud's maximum mass are affected in a non-monotonic way by changes in Ntot and the shape of the MSDs for most of the cases. This was also the case for the intermediate profile results, while the shallow one only showed the decreasing branch of this non-monotonic trend, due to more dominant entrainment effects.
All MSD shapes, except for Atlantic-1, shared a similar trend as a function of Ntot, starting with an increase in cloud mass and surface rain yield up to an Nop of ∼ 700 cm−3, followed by a decrease for higher aerosol loading. This consistent behavior was altered by the increased concentration of giant particles in the Atlantic-1 MSD. Namely, the maximum cloud mass monotonically increased as a function of Ntot, while the surface rain yield also increased but then saturated at high aerosol concentrations (with no Nop). The surface rain yield also had lower values in all cases, dropping by a factor of up to 2.3. The former can be explained by efficient nucleation of the big aerosols, and the latter can be explained by the initiation time of collision–coalescence with respect to the optimal timing for accumulation of enough water by condensation, enabling more water to become available for rain production.
In addition, the immediate sedimentation post-nucleation produced small raindrops that fall early, but evaporate below the cloud base before they reach the surface. Although the MSDs differed throughout the entire spectrum of aerosol sizes, this study shows that it is the existence of the giant mode that dramatically changes cloud properties, especially with respect to surface precipitation.
A deeper investigation of the effect of GCCN and UGCCN was preformed by gradually eliminating the largest particles from the Atlantic-1 MSD. We found that above a threshold diameter of ∼5 µm, collision–coalescence begins earlier, such that the surface rain is enhanced. This behavior is disrupted when the threshold diameter reaches ∼14 µm, with a further increase in threshold diameter resulting in lower surface rain yield. The rain suppression observed from this threshold diameter on is explained by the dramatically reduced droplet surface area and the initiation of collision–coalescence at a much earlier stage. This results in the fast formation of large drops and the early fallout of drizzle while the cloud is still in its developing stage, such that updrafts prevail and the sub-cloud layer is drier. The combination of a sub-cloud layer that is dominated by updrafts and features lower RH values further promotes longer fall time for the small raindrops and an efficient evaporation below the Atlantic-1 cloud base. These two values of threshold diameter are suggested to define the lower bounds of GCCN and UGCCN. They depend on specific conditions, such as the atmospheric profile, Ntot, and the shape of the aerosol size distribution.
The Atlantic-1 MSD was measured off the coast of France (see Fig. 1a). Scanning electron microscope images of the aerosols collected during the same time period highlight the differences between the particles, from a giant mode comprised of ∼1 µm brochosome-like particles (Fig. 5a) to an ultragiant mode comprised of ∼20 µm mineral dust particles (Fig. 5b).
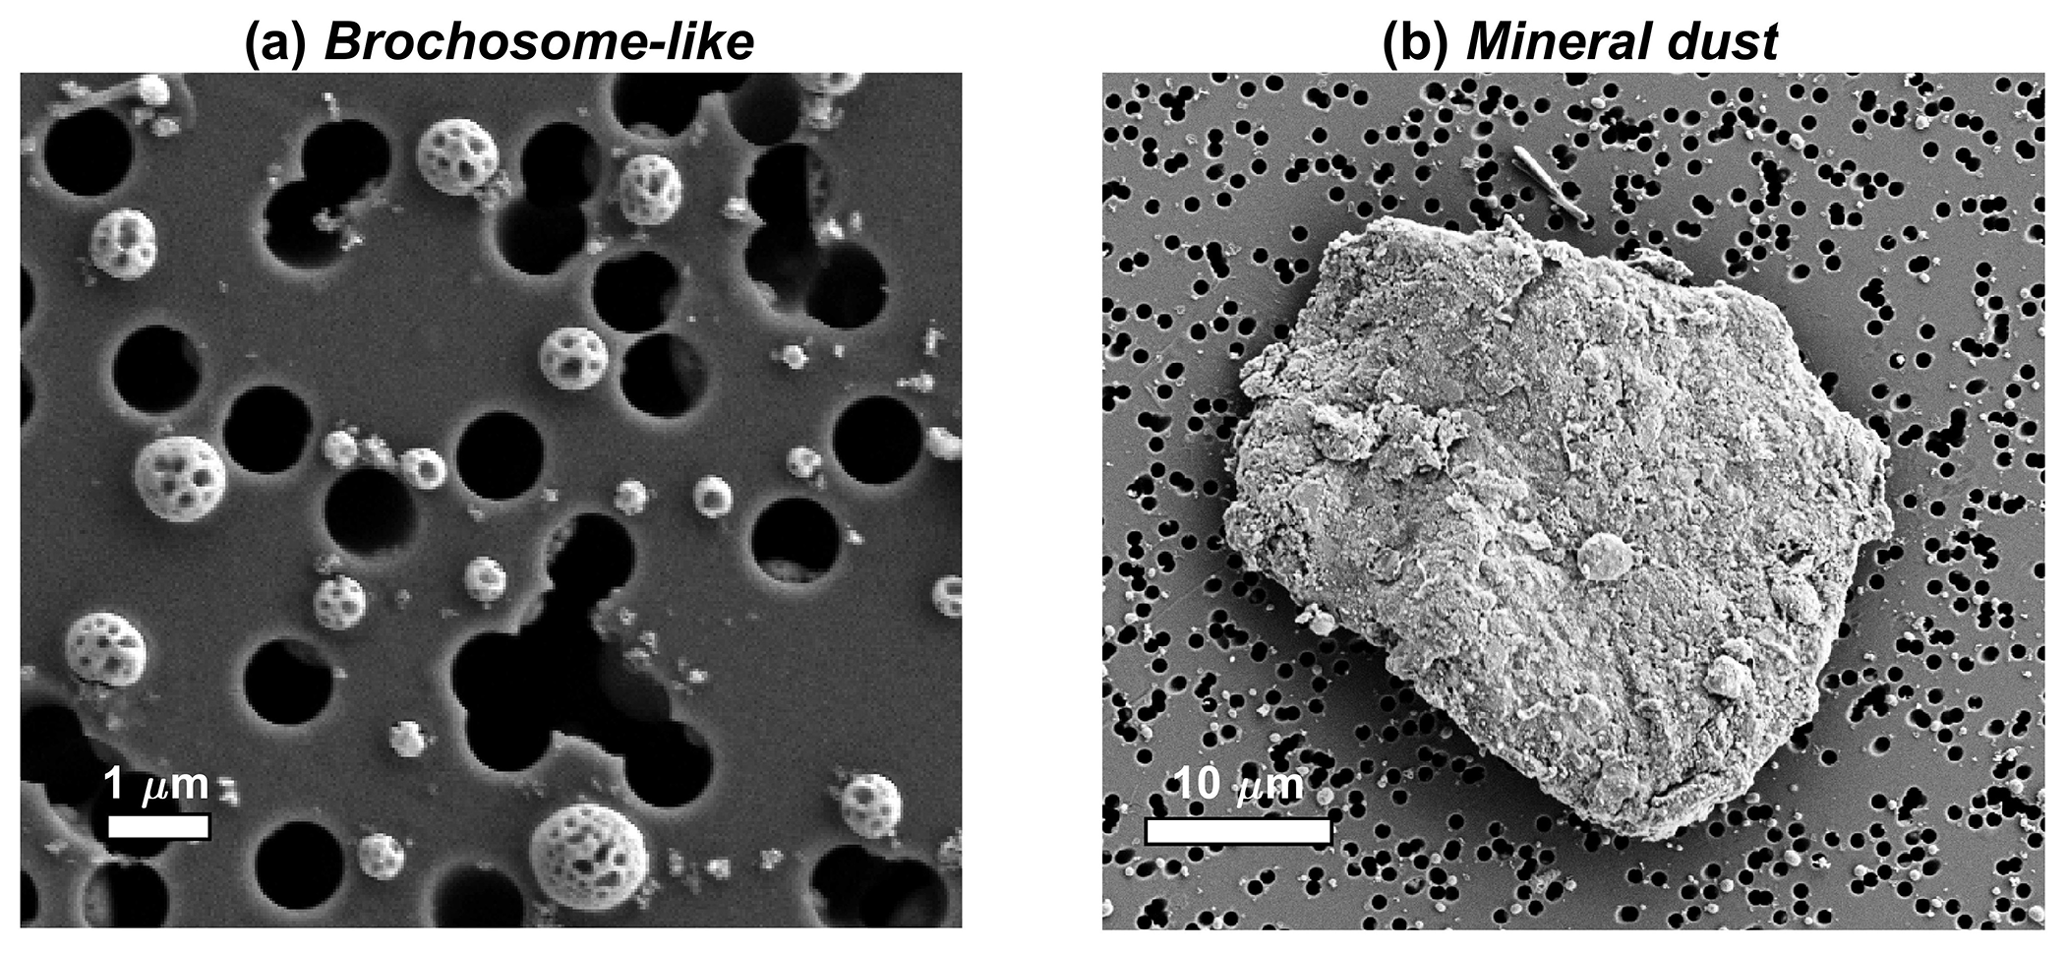
Figure 5Scanning electron microscope images of brochosome-like particles (a) and mineral dust (b) collected during the same period as the Atlantic-1 MSD measurement.
Here, we considered only changes in Ntot and the MSD shape. In addition, we also examined the sensitivity of the results to different chemical composition, which in the TAU-CM model affected the Köhler activation. Future work is needed to further explore how the chemical composition of the particles affects warm cloud's properties.
This study demonstrates the importance of the aerosol size distribution in terms of both total number concentration and the aerosol distribution shape, which can impact cloud properties. Currently, most aerosol measurements restrict the upper limit of particle sizes to Dp=10 µm (i.e., PM10). Consequently, most of the cloud-resolving models, even those using bin microphysics, do not allow for ultragiant or even giant particles. Many of these models use a “typical”, “wide-marine”, or “narrow-continental” size distribution that does not account for the natural variability in aerosol size distributions or reflect their complexity. Additionally, with the mounting evidence of microplastic particles, with sizes between 4–188 µm, present in the atmosphere and in rain (Allen et al., 2020; Brahney et al., 2020), it is of greater importance to include and further study the impact of particles with Dp>10 µm on cloud and precipitation.
Key parameters from this study are available at https://doi.org/10.34933/wis.000005 (Dror et al., 2020).
The supplement related to this article is available online at: https://doi.org/10.5194/acp-20-15297-2020-supplement.
JMF and GD conceived the presented idea. TD led the simulations and GD provided support. JMF performed the measurements. OA, ZL, AV, and IK provided critical feedback and helped shape the research, analysis, and manuscript. TD and JMF took the lead in writing the manuscript and contributed equally to this paper. All coauthors revised the content of the original manuscript and approved the final version of the paper.
The authors declare that they have no conflict of interest.
We are keen to thank the following institutions for their financial and scientific support that made the unique Tara Pacific expedition possible: CNRS, PSL, CSM, EPHE, Genoscope/CEA, ANR, agnes b., the Veolia Foundation, Region Bretagne, Billerudkorsnas, Amerisource Bergen Company, Altran, Lorient Agglomeration, Prince Albert II de Monaco Foundation, L’Oreal, Biotherm, France Collectivites, FFEM, the Tara Foundation teams, crew, and board members. Tara Pacific would not exist without the continuous support of the participating institutes. The authors also particularly thank Serge Planes, Denis Allemand and the Tara Pacific consortium. This is publication number 14 of the Tara Pacific Consortium.
This research has been supported by a research grant from Scott Jordan and Gina Valdez, the de Botton Center for Marine Science, the Yeda-Sela Center for Basic Research, and a research grant from the Yotam project.
This paper was edited by Xiaohong Liu and reviewed by three anonymous referees.
Albrecht, B. A.: Aerosols, cloud microphysics, and fractional cloudiness, Science, 245, 1227–1230, 1989. a, b
Allen, S., Allen, D., Moss, K., Le Roux, G., Phoenix, V. R., and Sonke, J. E.: Examination of the ocean as a source for atmospheric microplastics, PloS one, 15, e0232746, https://doi.org/10.1371/journal.pone.0232746, 2020. a
Altaratz, O., Koren, I., Remer, L., and Hirsch, E.: Cloud invigoration by aerosols – Coupling between microphysics and dynamics, Atmos. Res., 140, 38–60, 2014. a, b
Beard, K. V. and Ochs III, H. T.: Warm-rain initiation: An overview of microphysical mechanisms, J. Appl. Meteorol., 32, 608–625, 1993. a
Betzer, P. R., Carder, K. L., Duce, R. A., Merrill, J. T., Tindale, N. W., Uematsu, M., Costello, D. K., Young, R. W., Feely, R. A., Breland, J. A., Bernstein, R. E., and Greco, A. M.: Long-range transport of giant mineral aerosol particles, Nature, 336, 568–571, https://doi.org/10.1038/336568a0, 1988. a
Brahney, J., Hallerud, M., Heim, E., Hahnenberger, M., and Sukumaran, S.: Plastic rain in protected areas of the United States, Science, 368, 1257–1260, 2020. a
Cheng, W. Y., Carrió, G. G., Cotton, W. R., and Saleeby, S. M.: Influence of cloud condensation and giant cloud condensation nuclei on the development of precipitating trade wind cumuli in a large eddy simulation, J. Geophys. Res.-Atmos., 114, D08201, https://doi.org/10.1029/2008JD011011, 2009. a, b, c
Dagan, G., Koren, I., and Altaratz, O.: Aerosol effects on the timing of warm rain processes, Geophys. Res. Lett., 42, 4590–4598, 2015a. a, b, c, d, e, f
Dagan, G., Koren, I., and Altaratz, O.: Competition between core and periphery-based processes in warm convective clouds – from invigoration to suppression, Atmos. Chem. Phys., 15, 2749–2760, https://doi.org/10.5194/acp-15-2749-2015, 2015b. a, b, c, d, e
Dagan, G., Koren, I., Altaratz, O., and Feingold, G.: Feedback mechanisms of shallow convective clouds in a warmer climate as demonstrated by changes in buoyancy, Environ. Res. Lett., 13, 054033, https://doi.org/10.1088/1748-9326/aac178, 2018. a
Dror, T., Flores, J. M., Altaratz Stollar, O., Dagan, G., Levin, Z., Vardi, A., and Koren, I.: Data from: Sensitivity of warm clouds to large particles in measured marine aerosol size distributions – a theoretical study, Weizmann Institute of Science Library, https://doi.org/10.34933/wis.000005, 2020. a
Dusek, U., Frank, G., Hildebrandt, L., Curtius, J., Schneider, J., Walter, S., Chand, D., Drewnick, F., Hings, S., Jung, D., Borrmann, S., and Andreae, M. O.: Size matters more than chemistry for cloud-nucleating ability of aerosol particles, Science, 312, 1375–1378, 2006. a
Exton, H. J., Latham, J., Park, P. M., Smith, M. H., and Allan, R. R.: The Production and Dispersal of Maritime Aerosol, in: Oceanic Whitecaps, edited by: Monahan, E. C. and Niocaill, G. M., Oceanographic Sciences Library, vol. 2, Springer, Dordrecht, the Netherlands, https://doi.org/10.1007/978-94-009-4668-2_17, 1986. a
Feingold, G., Cotton, W. R., Kreidenweis, S. M., and Davis, J. T.: The impact of giant cloud condensation nuclei on drizzle formation in stratocumulus: Implications for cloud radiative properties, J. Atmos. Sci., 56, 4100–4117, 1999. a, b, c, d, e, f
Flores, J., Bourdin, G., Altaratz, O., Trainic, M., Lang-Yona, N., Dzimban, E., Steinau, S., Tettich, F., Planes, S., Allemand, D., Agostini, S., Banaigs, B., Boissin, E., Boss, E., Douville, E., Forcioli, D., Furla, P., Galand, P. E., Sullivan, M. B., Gilson, É., Lombard, F., Moulin, C., Pesant, S., Poulain, J., Reynaud, S., Romac, S., Sunagawa, S., Thomas, O. P., Troublé, R., de Vargas, C., Vega Thurber, R., Voolstra, C. R., Wincker, P., Zoccola, D., Bowler, C., Gorsky, G., Rudich, Y., Vardi, A., and Koren, I.: Tara Pacific Expedition’s Atmospheric Measurements of Marine Aerosols across the Atlantic and Pacific Oceans: Overview and Preliminary Results, B. Am. Meteorol. Soc., 101, 536–554, 2020. a, b, c, d
Garstang, M. and Betts, A. K.: A review of the tropical boundary layer and cumulus convection: Structure, parameterization, and modeling, B. Am. Meteorol. Soc., 55, 1195–1205, 1974. a
Gorsky, G., Bourdin, G., Lombard, F., Pedrotti, M. L., Audrain, S., Bin, N., Boss, E., Bowler, C., Cassar, N., Caudan, L., Chabot, G., Cohen, N. R., Cron, D., De Vargas, C., Dolan, J. R., Douville, E., Elineau, A., Flores, J. M., Ghiglione, J. F., Haëntjens, N., Hertau, M., John, S. G., Kelly, R. L., Koren, I., Lin, Y., Marie, D., Moulin, C., Moucherie, Y., Pesant, S., Picheral, M., Poulain, J., Pujo-Pay, M., Reverdin, G., Romac, S., Sullivan, M. B., Trainic, M., Tressol, M., Troublé, R., Vardi, A., Voolstra, C. R., Wincker, P., Agostini, S., Banaigs, B., Boissin, E., Forcioli, D., Furla, P., Galand, P. E., Gilson, E., Reynaud, S., Sunagawa, S., Thomas, O. P., Thurber, R. L. V., Zoccola, D., Planes, S., Allemand, D., and Karsenti, E.: Expanding Tara Oceans protocols for underway, ecosystemic sampling of the ocean-atmosphere interface during Tara Pacific expedition (2016–18), Front. Mar. Sci., 6, 750, https://doi.org/10.3389/fmars.2019.00750, 2019. a
Gunn, R. and Phillips, B.: An experimental investigation of the effect of air pollution on the initiation of rain, J. Meteorol., 14, 272–280, 1957. a
Gupta, D., Kim, H., Park, G., Li, X., Eom, H.-J., and Ro, C.-U.: Hygroscopic properties of NaCl and NaNO3 mixture particles as reacted inorganic sea-salt aerosol surrogates, Atmos. Chem. Phys., 15, 3379–3393, https://doi.org/10.5194/acp-15-3379-2015, 2015. a
Hand, J. L. and Kreidenweis, S. M.: A new method for retrieving particle refractive index and effective density from aerosol size distribution data, Aerosol Sci. Tech., 36, 1012–1026, 2002. a
Johnson, D. B.: The role of giant and ultragiant aerosol particles in warm rain initiation, J. Atmos. Sci., 39, 448–460, 1982. a, b, c
Khain, A., Ovtchinnikov, M., Pinsky, M., Pokrovsky, A., and Krugliak, H.: Notes on the state-of-the-art numerical modeling of cloud microphysics, Atmos. Res., 55, 159–224, 2000. a, b
Köhler, H.: The nucleus in and the growth of hygroscopic droplets, T. Faraday Soc., 32, 1152–1161, 1936. a
Koren, I., Dagan, G., and Altaratz, O.: From aerosol-limited to invigoration of warm convective clouds, Science, 344, 1143–1146, 2014. a, b
Koren, I., Altaratz, O., and Dagan, G.: Aerosol effect on the mobility of cloud droplets, Environ. Res. Lett., 10, 104011, https://doi.org/10.1088/1748-9326/10/10/104011, 2015. a
Kumar, P., Nenes, A., and Sokolik, I. N.: Importance of adsorption for CCN activity and hygroscopic properties of mineral dust aerosol, Geophys. Res. Lett., 36, L24804, https://doi.org/10.1029/2009GL040827, 2009. a
Levin, Z., Ganor, E., and Gladstein, V.: The effects of desert particles coated with sulfate on rain formation in the eastern Mediterranean, J. Appl. Meteorol., 35, 1511–1523, 1996. a, b
Low, T. and List, R.: Collision, coalescence and breakup of raindrops. Part II: Parameterization of fragment size distributions, J. Atmos. Sci., 39, 1607–1619, 1982. a
McTaggart-Cowan, J. D. and List, R.: Collision and breakup of water drops at terminal velocity, J. Atmos. Sci., 32, 1401–1411, 1975. a
Middleton, N., Betzer, P., and Bull, P.: Long-range transport of “giant” aeolian quartz grains: linkage with discrete sedimentary sources and implications for protective particle transfer, Mar. Geol., 177, 411–417, 2001. a
Mülmenstädt, J. and Feingold, G.: The radiative forcing of aerosol-cloud interactions in liquid clouds: wrestling and embracing uncertainty, Curr. Clim. Change Rep., 4, 23–40, 2018. a
Nenes, A., Murray, B., and Bougiatioti, A.: Mineral dust and its microphysical interactions with clouds, in: Mineral Dust, edited by: Knippertz, P. and Stuut, J.-B. W., Springer Netherlands, Dordrecht, the Netherlands, 287–325, 2014. a
Petters, M. D. and Kreidenweis, S. M.: A single parameter representation of hygroscopic growth and cloud condensation nucleus activity, Atmos. Chem. Phys., 7, 1961–1971, https://doi.org/10.5194/acp-7-1961-2007, 2007. a
Pinsky, M., Mazin, I., Korolev, A., and Khain, A.: Supersaturation and diffusional droplet growth in liquid clouds, J. Atmos. Sci., 70, 2778–2793, 2013. a
Planes, S., Allemand, D., Agostini, S., Banaigs, B., Boissin, E., Boss, E., Bourdin, G., Bowler, C., Douville, E., Flores, J. M., Forcioli, D., Furla, P., Galand, P. E., Ghiglione, J.-F., Gilson, E., Lombard, F., Moulin, C., Pesant, S., Poulain, J., Reynaud, S., Romac, S., Sullivan, M. B., Sunagawa, S., Thomas, O. P., Troublé, R., de Vargas, C., Vega Thurber, R., Voolstra, C. R., Wincker, P., Zoccola, D., and Tara Pacific Consortium: The Tara Pacific expedition – A pan-ecosystemic approach of the “-omics” complexity of coral reef holobionts across the Pacific Ocean, PLoS biology, 17, e3000483, https://doi.org/10.1371/journal.pbio.3000483, 2019. a
Posselt, D., Van Den Heever, S., and Stephens, G.: Trimodal cloudiness and tropical stable layers in simulations of radiative convective equilibrium, Geophys. Res. Lett., 35, L08802, https://doi.org/10.1029/2007GL033029, 2008. a, b
Pruppacher, H. and Klett, J.: Cloud Chemistry, in: Microphysics of Clouds and Precipitation, Atmospheric and Oceanographic Sciences Library, vol. 18, Springer, Dordrecht, the Netherlands, https://doi.org/10.1007/978-0-306-48100-0_17, 2010. a
Reisin, T., Levin, Z., and Tzivion, S.: Rain production in convective clouds as simulated in an axisymmetric model with detailed microphysics. Part I: Description of the model, J. Atmos. Sci., 53, 497–519, 1996. a
Rosenfeld, D., Lahav, R., Khain, A., and Pinsky, M.: The role of sea spray in cleansing air pollution over ocean via cloud processes, Science, 297, 1667–1670, 2002. a
Rosenfeld, D., Kaufman, Y. J., and Koren, I.: Switching cloud cover and dynamical regimes from open to closed Benard cells in response to the suppression of precipitation by aerosols, Atmos. Chem. Phys., 6, 2503–2511, https://doi.org/10.5194/acp-6-2503-2006, 2006. a
Rosenfeld, D., Lohmann, U., Raga, G. B., O'Dowd, C. D., Kulmala, M., Fuzzi, S., Reissell, A., and Andreae, M. O.: Flood or drought: how do aerosols affect precipitation?, Science, 321, 1309–1313, 2008. a
Schulz, M., de Leeuw, G., and Balkanski, Y.: Sea-salt aerosol source functions and emissions, in: Emissions of Atmospheric Trace Compounds, edited by: Granier, C., Artaxo, P., and Reeves, C. E., Springer Netherlands, Dordrecht, the Netherlands, 333–359, 2004. a
Seifert, A. and Heus, T.: Large-eddy simulation of organized precipitating trade wind cumulus clouds, Atmos. Chem. Phys., 13, 5631–5645, https://doi.org/10.5194/acp-13-5631-2013, 2013. a
Seigel, R. B.: Shallow cumulus mixing and subcloud-layer responses to variations in aerosol loading, J. Atmos. Sci., 71, 2581–2603, 2014. a
Seiki, T. and Nakajima, T.: Aerosol effects of the condensation process on a convective cloud simulation, J. Atmos. Sci., 71, 833–853, 2014. a
Squires, P.: The microstructure and colloidal stability of warm clouds, Tellus A, 10, 262–271, 1958. a
Tegen, I., Harrison, S. P., Kohfeld, K., Prentice, I. C., Coe, M., and Heimann, M.: Impact of vegetation and preferential source areas on global dust aerosol: Results from a model study, J. Geophys. Res.-Atmos., 107, 4576, https://doi.org/10.1029/2001JD000963, 2002. a
Teller, A. and Levin, Z.: The effects of aerosols on precipitation and dimensions of subtropical clouds: a sensitivity study using a numerical cloud model, Atmos. Chem. Phys., 6, 67–80, https://doi.org/10.5194/acp-6-67-2006, 2006. a, b
Twomey, S.: The influence of pollution on the shortwave albedo of clouds, J. Atmos. Sci., 34, 1149–1152, 1977. a
Twomey, S. and Squires, P.: The influence of cloud nucleus population on the microstructure and stability of convective clouds, Tellus A, 11, 408–411, 1959. a
Tzivion, S., Feingold, G., and Levin, Z.: An efficient numerical solution to the stochastic collection equation, J.Atmos. Sci., 44, 3139–3149, 1987. a
Tzivion, S., Reisin, T., and Levin, Z.: Numerical simulation of hygroscopic seeding in a convective cloud, J. Appl. Meteorol., 33, 252–267, 1994. a
van der Does, M., Knippertz, P., Zschenderlein, P., Harrison, R. G., and Stuut, J.-B. W.: The mysterious long-range transport of giant mineral dust particles, Sci. Adv., 4, eaau2768, https://doi.org/10.1126/sciadv.aau2768, 2018. a
Warner, C., Simpson, J., Martin, D., Suchman, D., Mosher, F., and Reinking, R.: Shallow convection on day 261 of GATE/mesoscale arcs, Mon. Weather Rev., 107, 1617–1635, 1979. a
Warner, J.: A reduction in rainfall associated with smoke from sugar-cane fires – An inadvertent weather modification?, J. Appl. Meteorol., 7, 247–251, 1968. a
Xue, H., Feingold, G., and Stevens, B.: Aerosol effects on clouds, precipitation, and the organization of shallow cumulus convection, J. Atmos. Sci., 65, 392–406, 2008. a
Yin, Y., Levin, Z., Reisin, T., and Tzivion, S.: Seeding convective clouds with hygroscopic flares: Numerical simulations using a cloud model with detailed microphysics, J. Appl. Meteorol., 39, 1460–1472, 2000a. a
Yin, Y., Levin, Z., Reisin, T. G., and Tzivion, S.: The effects of giant cloud condensation nuclei on the development of precipitation in convective clouds – A numerical study, Atmos. Res., 53, 91–116, 2000b. a, b, c
Yuan, T.: Cloud macroscopic organization: order emerging from randomness, Atmos. Chem. Phys., 11, 7483–7490, https://doi.org/10.5194/acp-11-7483-2011, 2011. a
Zhang, L., Michelangeli, D. V., and Taylor, P. A.: Influence of aerosol concentration on precipitation formation in low-level, warm stratiform clouds, J. Aerosol Sci., 37, 203–217, 2006. a, b, c, d
Zuidema, P., Li, Z., Hill, R. J., Bariteau, L., Rilling, B., Fairall, C., Brewer, W. A., Albrecht, B., and Hare, J.: On trade wind cumulus cold pools, J. Atmos. Sci., 69, 258–280, 2012. a