the Creative Commons Attribution 4.0 License.
the Creative Commons Attribution 4.0 License.
 | 07 Dec 2020
EARLINET observations of Saharan dust intrusions over the northern Mediterranean region (2014–2017): properties and impact on radiative forcing
Alexandros Papayannis
Panagiotis Kokkalis
Romanos Foskinis
Guadalupe Sánchez Hernández
Pablo Ortiz-Amezcua
Maria Mylonaki
Christina-Anna Papanikolaou
Nikolaos Papagiannopoulos
Stefanos Samaras
Silke Groß
Rodanthi-Elisavet Mamouri
Lucas Alados-Arboledas
Aldo Amodeo
Basil Psiloglou
Remote sensing measurements of aerosols using depolarization Raman lidar systems from four EARLINET (European Aerosol Research Lidar Network) stations are used for a comprehensive analysis of Saharan dust events over the Mediterranean basin in the period 2014–2017. In this period, 51 dust events regarding the geometrical, optical and microphysical properties of dust were selected, classified and assessed according to their radiative forcing effect on the atmosphere. From west to east, the stations of Granada, Potenza, Athens and Limassol were selected as representative Mediterranean cities regularly affected by Saharan dust intrusions. Emphasis was given on lidar measurements in the visible (532 nm) and specifically on the consistency of the particle linear depolarization ratio (δp532), the extinction-to-backscatter lidar ratio (LR532) and the aerosol optical thickness (AOT532) within the observed dust layers. We found mean δp532 values of 0.24±0.05, 0.26±0.06, 0.28±0.05 and 0.28±0.04, mean LR532 values of 52±8, 51±9, 52±9 and 49±6 sr and mean AOT532 values of 0.40±0.31, 0.11±0.07, 0.12±0.10 and 0.32±0.17, for Granada, Potenza, Athens and Limassol, respectively. The mean layer thickness values were found to range from ∼ 1700 to ∼ 3400 m a.s.l. Additionally, based also on a previous aerosol type classification scheme provided by airborne High Spectral Resolution Lidar (HSRL) observations and on air mass backward trajectory analysis, a clustering analysis was performed in order to identify the mixing state of the dusty layers over the studied area. Furthermore, a synergy of lidar measurements and modeling was used to analyze the solar and thermal radiative forcing of airborne dust in detail. In total, a cooling behavior in the solar range and a significantly lower heating behavior in the thermal range was estimated. Depending on the dust optical and geometrical properties, the load intensity and the solar zenith angle (SZA), the estimated solar radiative forcing values range from −59 to −22 W m−2 at the surface and from −24 to −1 W m−2 at the top of the atmosphere (TOA). Similarly, in the thermal spectral range these values range from +2 to +4 W m−2 for the surface and from +1 to +3 W m−2 for the TOA. Finally, the radiative forcing seems to be inversely proportional to the dust mixing ratio, since higher absolute values are estimated for less mixed dust layers.
- Article
(3108 KB) - Full-text XML
- BibTeX
- EndNote


The Saharan desert is one of the major dust sources globally, with dust advection to the Mediterranean countries being modulated by meteorology along rather regular seasonal patterns (Mona et al., 2012). For instance, in the western Mediterranean region, the African dust occurrence is higher in summer (Salvador et al., 2014), even though some extreme events might also occur in winter (e.g., Cazorla et al., 2017; Fernández et al., 2019), while in the central Mediterranean region, spring and summer are, usually, associated with dust aerosol loads extending up to altitudes of 3–4 km (Barnaba and Gobbi, 2004). In the eastern Mediterranean, the main dust transport occurs from spring to autumn (Papayannis et al., 2009; Nisantzi et al., 2015; Soupiona et al., 2018) as a result of the high cyclonic activity over northern Africa during these periods (Flaounas et al., 2015). Considering also that the Mediterranean basin is a region of high evaporation, low precipitation and remarkable solar activity, the transportation of aerosols accompanied by aging and mixing processes make this area a study of interest for present and future climate change effects (Michaelides et al., 2018).
It is well documented that mineral dust highly influences the atmospheric radiative balance through scattering and absorption processes (direct effects), as well as cloud nucleation, formation and lifetime (indirect effects), as summarized in IPCC (2014). Considerable uncertainties in quantifying the global direct radiative effects of aerosols arise from the variability of their spatiotemporal distribution and the aging and mixing processes that can affect their optical, chemical and microphysical properties and influence many processes that modulate regional climate. Therefore, the magnitude and even the sign of the dust aerosol solar radiative forcing are highly uncertain as they strongly depend on their optical properties, their size distribution and their complex refractive index (CRI) values. Papadimas et al. (2012) reported that the aerosol optical depth seems to be the main parameter for modifying the regional aerosol radiative effects (under cloud-free conditions) and that on an annual basis, aerosols can induce a significant “planetary” cooling over the broader Mediterranean basin. Other studies (Quijano et al., 2000; Tegen et al., 2010) have shown that the presence of clouds and the surface albedo are also unquestionable parameters affecting the net solar radiative transfer at the top of the atmosphere. However, a comprehensive analysis from ground-based aerosol optical properties to vertical profiles of short- and longwave (SW and LW) radiation estimations in the Mediterranean region has been reported so far only in a few papers (Sicard et al., 2014; Meloni et al., 2003, 2015; Valenzuela et al., 2017; Gkikas et al., 2018).
Although there have been a lot of studies about Saharan dust optical properties based on the lidar technique (Landulfo et al., 2003; Ansmann et al., 2009; Papayannis et al., 2009; Córdoba-Jabonero et al., 2011; Tesche et al., 2011; Mona et al., 2012; Groß et al., 2013; Navas-Guzmán et al., 2013; Granados-Muñoz et al., 2016; Mandija et al., 2016, 2017; Rittmeister et al., 2017; Soupiona et al., 2018), systematic long-term statistical studies are quite scarce since few aerosol depolarization data are available covering long periods. Saidou Chaibou et al. (2020) address the importance of dust effects in climate studies in order to improve the accuracy of climate predictions. As they mention, even if improved assessment of dust impact on climate requires continuous observations from both satellites and ground-based instrument networks, the use of climate models is also crucial to improve our understanding of dust distribution, its properties and its impact on the radiation budget. In an earlier study, Pérez et al. (2006) proposed that a regional atmospheric dust model, with integrated dust and atmospheric radiation modules, represents a promising approach for further improvements in numerical weather prediction practice and radiative impact assessment over dust-affected areas, especially in the Mediterranean. Hence, an in-depth study of the role of aerosols in radiative forcing over different regions in the Mediterranean basin is still needed. While a synergy of ground-based lidar measurements and modeling seems very promising for obtaining radiative forcing estimations of dust aerosols, the use of inputs from regional models could also contribute to such estimations in areas where measurements are unavailable.
This paper aims to fill some of the aforementioned gaps by combining statistical lidar data of aerosol optical and microphysical properties with radiative transfer estimations and is organized as follows. A brief summary of the four selected EARLINET (European Aerosol Research Lidar Network) Mediterranean stations is given in Sect. 2, along with the data selection of the dust cases. Section 3 includes the description of the methodologies applied and the tools and models used for retrieving the aerosol optical and microphysical properties and their radiative forcing. The evaluation of the retrieved aerosol mass concentration profiles and of the ground-level radiation are also presented. The results of the aerosol optical, geometrical and microphysical properties of the individual dust layers and the clusters, as well as the relevant radiative forcing calculations over the studied areas, are discussed in Sect. 4. Finally, concluding remarks are given in Sect. 5.
Table 1Station name, location, lidar setup and relevant references of the four selected EARLINET stations.
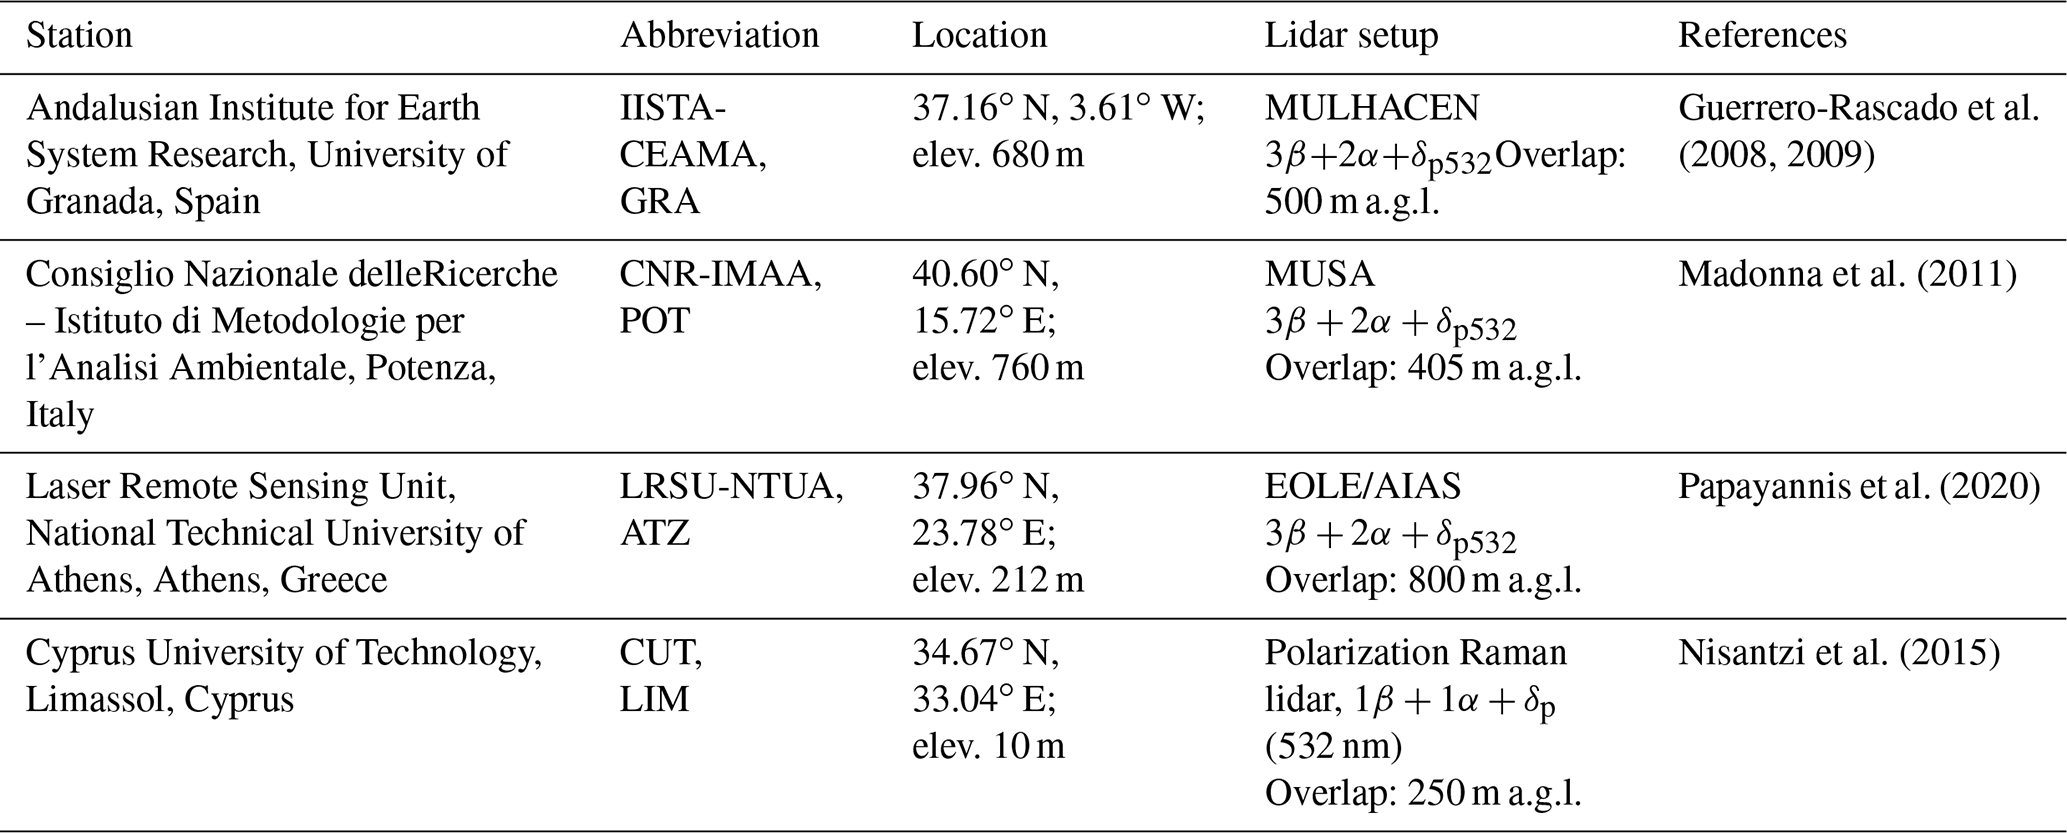
The European Aerosol Research Lidar Network (EARLINET; https://www.earlinet.org/, last access: 7 October 2020, Pappalardo et al., 2014), established in 2000, provides an excellent opportunity to offer a large collection of quality-assured ground-based data of the vertical distribution of the aerosol optical properties over Europe. These measurements meet absolute accuracy standards (Pappalardo et al., 2014) to achieve the desired confidence in aerosol radiative forcing calculations. Currently, the network includes 31 active lidar stations distributed over Europe, providing information of aerosol vertical distributions on a continental scale. In this paper, level 2 data of four stations from the EARLINET database (https://data.earlinet.org/, last access: 7 October 2020), including aerosol backscatter (βaer) and extinction (αaer) coefficient and depolarization ratio (δaer) profiles as a function of height above mean sea level (a.s.l.), were collected and further analyzed, as described below, to estimate their role in radiative transfer calculations in the Mediterranean region.
2.1 EARLINET stations
Four EARLINET stations affected by typical Saharan dust intrusions in the Mediterranean were selected (listed from west to east): Granada (Spain), Potenza (Italy), Athens (Greece) and Limassol (Cyprus). A 4-year (2014–2017) common period of aerosol depolarization Raman lidar data obtained at 532 nm was selected for this analysis. Table 1 summarizes the basic information about these lidar systems for each location. Except the Limassol station that provides data only at 532 nm, the other three stations are equipped with a multiwavelength lidar system able to provide extensive aerosol properties at multiple wavelengths, namely three βaer (355, 532, 1064 nm) and two αaer (355, 532 nm), as well as aerosol intensive properties, namely the backscatter and extinction-related Ångström exponents (AEα355∕532, AEβ355∕532, AEβ532∕1064 nm), the lidar ratio (LR) and additionally the linear volume (δv532) and particle depolarization ratio (δp532) at 532 nm. By using the Raman technique, as proposed by Ansmann et al., (1992), the βaer and αaer vertical profiles can be retrieved with uncertainties of ∼ 5 %–15 % and ∼ 10 %–25 %, respectively (Ansmann et al., 1992; Mattis et al., 2002). Therefore, the corresponding uncertainty of the retrieved lidar ratio values is of the order of 11 %–30 %, while the uncertainty for AEβ and AEα ranges between 0.02–0.04 and 0.03–0.08, respectively, as estimated by propagation error calculations.
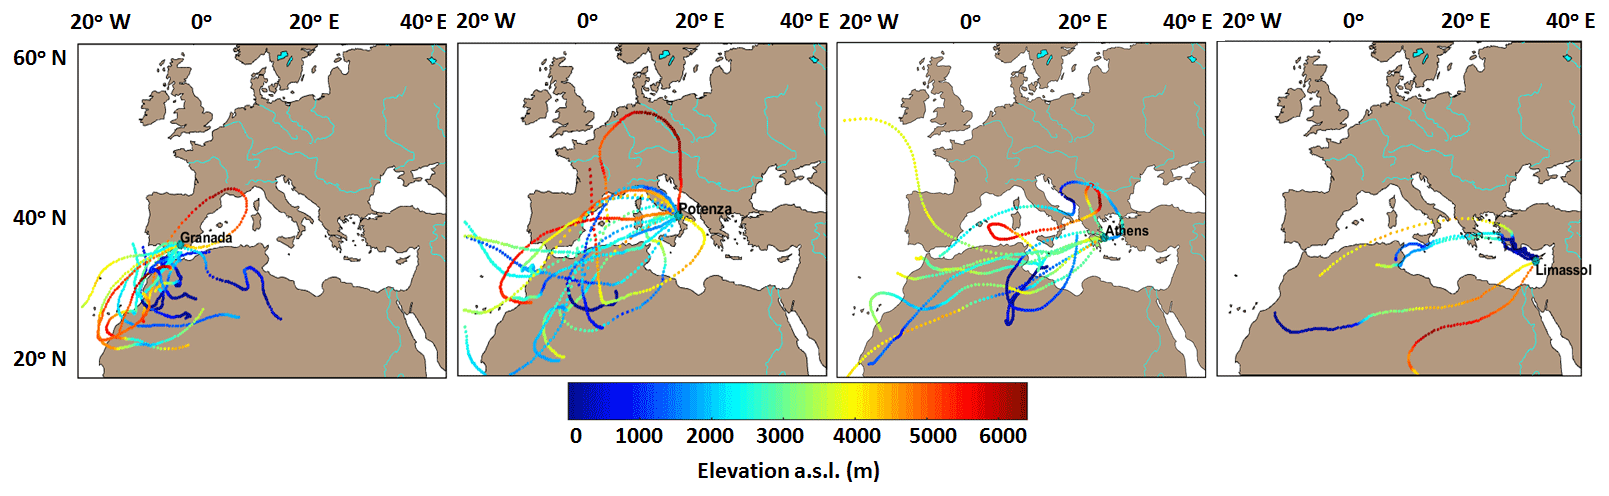
Figure 196–120 h backward trajectories for air masses arriving over (a) Granada, (b) Potenza, (c) Athens and (d) Limassol, for arrival heights of approximately the center of each observed dust layer (51 cases in the period 2014–2017).
2.2 Selection of dust events
Dusty cases analyzed in this study were selected based on the values of the aerosol optical properties δp532 and LR532 measured by lidar (Groß et al., 2013). Since pure dust layers are rare over the Mediterranean cities due to continental contamination by urban pollution or even biomass burning (BB) aerosols, a sufficiently lower δp532 value with respect to the pure dust values (e.g., Freudenthaler et al., 2009) should be considered to characterize an aerosol layer as a dusty one. Based on previous studies, the respective LR532 values for long-range-transported mixtures over the Mediterranean area are expected to range between 35 and −75 sr (Mona et al., 2006; Papayannis et al., 2009; Tesche et al., 2009; Groß et al., 2011; Ansmann et al., 2012; Nisantzi et al., 2015; Soupiona et al., 2018). Consequently, from the total set of Saharan dust events per station listed in the EARLINET database for the period 2014–2017, we considered for further analysis only the data meeting three basic criteria: (a) δp532≥0.16 in the free troposphere, (b) 35 sr ≤ LR532≤75 sr in the free troposphere and (c) the thickness of the detected layer to be 500 m at least. The critical height (in m a.s.l.) in which the first criterion was met was considered to be the base of the dust layer. This assumption was deemed necessary to be made since, usually, the lofted dust layers cannot be distinguished from the top of the planetary boundary layer (PBL), while the presence of urban haze and pollution decreases the δp values drastically down to 0.03–0.10 (Gobbi et al., 2000; Groß et al., 2013). The top of the dust layer was estimated as the height where the signals were similar to the molecular scattering (both δp532 and β532 tending to zero) in the free troposphere. For some cases of the Athens station, where depolarization measurements were unavailable, the values of the base and top were calculated from the Raman lidar signals, following the procedure proposed by Mona et al. (2006).
Moreover, a careful investigation of the air mass origin and dust transport path was performed by means of backward trajectory analysis. This analysis was carried out using the HYbrid Single-Particle Lagrangian Integrated Trajectory (HYSPLIT) model (https://ready.arl.noaa.gov/HYSPLIT_traj.php, last access: 7 October 2020; Stein et al., 2015) together with the GDAS (Global Data Analysis System) meteorological files (spatial resolution of , every 3 h) as data input. The kinematic back-trajectories were calculated using the vertical velocity component given by the meteorological model with a 96–120 h pathway (4–5 d back). MODIS/Terra information (https://firms.modaps.eosdis.nasa.gov/map, last access: 7 October 2020) was also taken into account for the corresponding hotspots of possible fires and thermal anomalies along the trajectories (https://firms.modaps.eosdis.nasa.gov/map, last access: 7 October 2020, not shown here).
Thus, we ended up with 51 individual cases in total, of 30 min to 1 h averaged lidar profiles each (15 for Granada, 18 for Potenza, 12 for Athens and 6 for Limassol). For the region of Cyprus, the situation is more complex since Middle East dust outbreaks also occur frequently in addition to the Saharan dust events (Nisantzi et al., 2015; Kokkalis et al., 2018; Solomos et al., 2019). On top of that, dust particles originating from the Middle East proved to have different lidar ratio values than the corresponding observations over the Saharan desert (Mamouri et al., 2013; Kim et al., 2020). Taking this into account, dust cases over the Limassol station originating from Middle East regions were excluded from our study.
The air mass trajectory analysis based on HYSPLIT for each station reveals the origin of each observed layer (Fig. 1). In the majority of cases, air masses originate from western and northwestern Africa (Morocco, Mauritania, Algeria and Tunisia). At first glance, two occurrences seem to dominate: (i) trajectories that travel directly from the source to the observation stations and (ii) trajectories that circulate over the Mediterranean or the Atlantic Ocean (for the Granada and Potenza cases), Europe and the Balkans or even Turkey (for the Limassol and Athens cases) before reaching the observation stations.
In order to perform simulations for further investigating the behavior of the transported dust aerosols and their impacts, we used different methods with a variety of tools and models. In this section, we present our efforts for retrieving vertical dust mass concentration profiles, aerosol microphysical properties and radiative forcing results. The simulations were also partly validated with ground-based radiation measurements.
3.1 Dust mass concentration lidar retrievals
To retrieve the aerosol dust mass concentration profiles, we used the β532 and the δp532 coefficients. Furthermore, by assuming that we have two aerosol types (dust and non-dust) inside the calculated β532 values, we separated the backscatter profiles into two components: the first arising from the contribution of the weakly depolarizing particles (δnd=0.05 for non-dust particles) and the second from the contribution of strongly depolarizing particles (δd=0.31 for dust particles). Then, the dust-related backscatter coefficient βd at 532 nm was obtained, following the procedure described by Tesche et al. (2009). The estimation of the height-resolved mass concentration (in kg m−3) of dust particles was based on the procedure described by Ansmann et al. (2012), using the following equation:
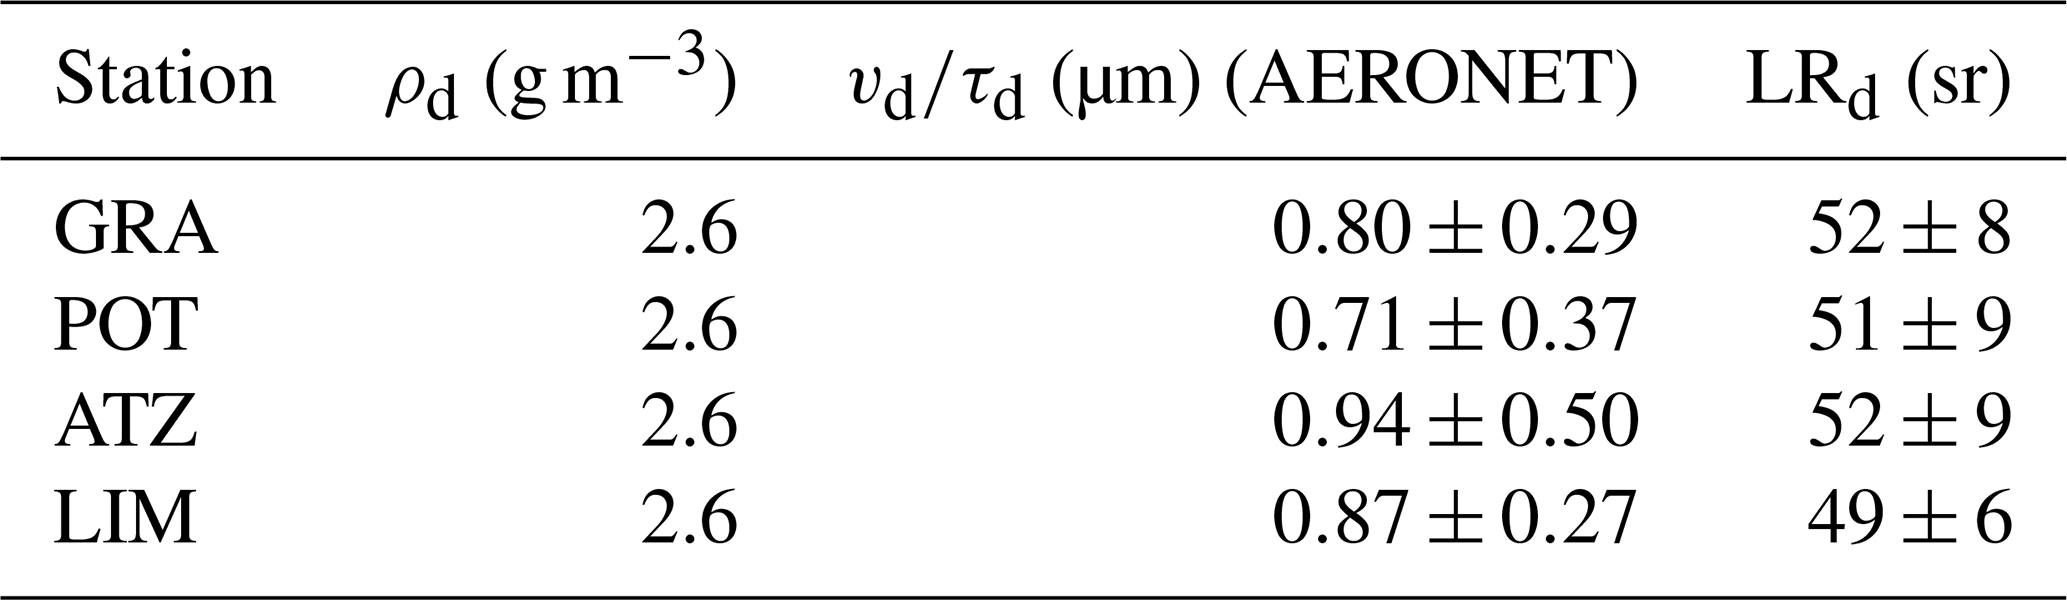
where in our study the coarse-particle mass density (ρd) was assumed equal to 2.6 g m−3, and a mean-volume-to-AOT ratio for coarse-mode particles, vd∕τd, was calculated from AERONET measurements (https://aeronet.gsfc.nasa.gov/, last access: 7 October 2020) for each station during the period 2014–2017. Table 2 summarizes these values for the entire studied period, since only few cases were common in EARLINET and AERONET database. Regarding the LRd parameter, the mean LR values per station, as calculated from the lidar measurements, were used (see Table 2; Fig. 4c). These values are in good agreement with findings in the literature for long-range-transported Saharan dust events (Tesche et al., 2009; Guerrero-Rascado et al., 2009; Ansmann et al., 2012; Groß et al., 2011; 2013; Bravo-Aranda et al., 2015).
Table 2Assumed (ρd) and computed parameters (vd∕τd, LRd) used for the estimation of the height-resolved mass concentration (in kg m−3) of dust particles. The ratio vd∕τd is derived from AERONET sun–sky photometer measurements within the period 2014–2017 at Granada, Potenza, Athens and Limassol. The LRd is calculated from the available corresponding lidar measurements per station.
3.2 The Spheroidal Inversion eXperiments (SphInX) software tool
The SphInX software tool provides an automated process to carry out calculations from lidar data to obtain the aerosol microphysical properties and further to statistically evaluate the inversion outcomes. It has been developed at the University of Potsdam (Samaras, 2016) within the Initial Training for atmospheric Remote Sensing (ITaRS) project (2012–2016). SphInX operates with expendable precalculated discretization databases based on spline collocation and on lookup tables of scattering efficiencies using T-matrix theory (Rother and Kahnert, 2009). This is to avoid the computational cost which would otherwise limit the microphysical retrieval to an impractical point. The complex refractive index (CRI) is fed to the software separately for the real and imaginary parts, which then constitutes a grid combining the following default values: real part (RRI) and imaginary part (IRI) . A range of values for the effective radius (Reff), which occurs from the ratio of the total volume concentration (ut) and the total surface-area concentration (at), , is also needed to be predefined. The methodology applied here for spheroid-particle approximation is the same as presented in Soupiona et al. (2019). More specifically, the Raman lidar profiles were used as inputs for specific heights within the observed dusty layers and were averaged to produce the six-point dataset of the so-called setup. All cases fulfilling this setup were treated in parallel for retrieving their microphysical properties. Here, the Reff ranged between 0.01 and 2.2 µm, and the CRI grid was narrowed down to include only the values 1.4 and 1.5 for the real part (RRI), and the values 0, 0.001, 0.005 and 0.01 for the imaginary part (IRI), providing a total of eight possible combinations for the CRI grid (instead of the initial total of 42 for the CRI grid). These ranges were used after a careful investigation of the values of the aerosol optical and microphysical properties found in the literature concerning transported Saharan dust events (Dubovik et al., 2006; Weinzierl et al., 2011; Mishra et al., 2014; Veselovskii et al., 2016, 2020; Benavent-Oltra et al., 2017) in order to avoid retrieving less realistic dust-related size distributions and CRI values and to minimize the computational time. The outputs presented here are the RRI and IRI, the single scattering albedo (SSA) and the Reff.
3.3 Atmospheric dust cycle model (BSC-DREAM8b)
The BSC-DREAM8b model (Basart et al., 2012), operated by the Barcelona Supercomputer Center (BSC-CNS; https://www.bsc.es/, last access: 7 October 2020) has provided operational forecasts since May 2009. The BSC-DREAM8b is a regional model designed to simulate and predict the atmospheric cycle of mineral dust aerosols. It is one of the most widely used and evaluated models for dust studies over northern Africa and Europe (see Jiménez-Guerrero et al., 2008; Papayannis et al., 2009; Basart et al., 2012; Amiridis et al., 2013; Tsekeri et al., 2017). The presented analysis includes vertical profiles of dust mass concentration simulations ( horizontal resolution) and 24 vertical levels (from ground level to approximately 15 km in the vertical), corresponding to the studied cases and for time periods close to the measurement times, usually at 18:00 and 00:00 UTC, since the meteorological fields are initialized every 24 h (at 12:00 UTC) with the National Centers for Environmental Prediction (NCEP) global analysis (), and the boundary conditions are updated every 6 h with the NCEP Global Forecast System (GFS) ().
3.4 Radiative forcing simulations
The aerosol effects on solar and terrestrial radiation are usually quantified through the so-called aerosol radiative forcing (ARF). The ARF defined here as the perturbation in flux in the atmosphere caused by the presence of the dusty layers in relation to that calculated under clear-sky conditions can be expressed as (Quijano et al., 2000; Sicard et al., 2014; Mishra et al., 2014)
where the net flux, ΔF, at a level z is the difference between the downwelling and upwelling flux, F↓ and F↑, respectively:
These fluxes (in W m−2) are calculated separately for SW and LW radiation sources and assuming that the amount of the incoming solar radiation at the top of the atmosphere (TOA) is equal for both cases with and without the presence of dust aerosols. Therefore, the net ARF, ARFNET(z), is expressed as
Based on this definition, the ARF at a given altitude will be positive when the aerosols cause a heating effect and negative when they cause a cooling effect. Finally, the ARF within the atmosphere (ARFAtm) can be defined as the net difference between ARF at the top of the atmosphere (TOA) and the bottom of the atmosphere (BOA), denoted here as ARFTOA and ARFBOA, respectively:
Our analysis was based on these equations for estimating the radiative forcing by means of direct and diffuse irradiances of an accurate radiative transfer model combining lidar measurements and dust concentration simulations.
3.4.1 The radiative transfer model (libRadtran)
In this study, the downwelling and upwelling shortwave (280–2500 nm) and longwave (2.5–40 µm) irradiances at TOA and BOA levels have been simulated with the libRadtran radiative transfer model version 2.0.2. (Emde et al., 2016). This software package contains numerous tools to perform various aspects of atmospheric radiative transfer calculations. In our study, the uvspec program that calculates the radiation field in the Earth's atmosphere was implemented for the disort radiative transfer equation (1-D geometry). Midlatitude conditions for a typical Air Force Geophysics Laboratory (AFGL Atmospheric Constituent Profiles, 0–120 km (Anderson et al., 1986)) and a typical surface albedo value (0.16) for urban areas (Dhakal, 2002) in the SW range were taken into account, also based on visual observations. The OPAC library 4.0 (Koepke et al., 2015) was used for desert spheroids (T-matrix calculations) to determine aerosols' radiative properties in the aforementioned wavelength ranges. The nonspherical approximation is given by typical particle size dependent aspect ratio distributions of spheroids, derived from measurements at observation campaigns. In our study, the mineral particles of each case were treated by the model as spheroids for the mineral accumulation mode (MIAM), with in µm.
A set of four simulations was carried out per case of the studied dust events. The first two simulations refer to clear-sky atmospheres with background/baseline aerosol conditions (default properties: rural type aerosol in the boundary layer, background aerosol above 2 km, spring–summer conditions and a visibility of 50 km; index “clear” in Eq. 2), the first for the SW and the second for the LW range, since these ranges are treated separately by libRadtran. The remaining two simulations correspond to the dust-loaded atmosphere, again, the one for the SW range and the other for the LW range, respectively, for which the vertical profiles of the dusty layers were used as additional inputs (index “dusty” in Eq. 2). These inputs have been obtained by three different schemes: (a) vertical mass concentration profiles simulated by the BSC-DREAM8b model, (b) vertical mass concentration profiles of only the dust component as calculated from Eq. (1) (massd) utilizing the β532 coefficient and (c) vertical profiles of α532 along with the respective mean AOT532 value. In the final step, we calculated the parameters ΔF, ARF, ARFNET and ARFATM, applying Eqs. (2)–(5).
The flowchart in Fig. 2 depicts these three schemes applied to create the input files for the dust-loaded atmospheric conditions used in the libRadtran software package (Emde et al., 2016). Scheme A refers to the dust mass concentration as estimated by BSC-DREAM8b over the studied sites. In Scheme B, only the dust vertical distribution is used as input (based on the separation of the β532 into dust and non-dust components that led to the calculation of the vertical distribution of the dust-only mass concentration; Eq. 1), in order to determine the dust radiative forcing (DRF). On the other hand, in Scheme C contributions of both dust and non-dust aerosols (total αaer) are taken into account. Additionally, for Scheme C conversion factors from OPAC were used in order to convert the αaer and the corresponding AOT from 532 nm to 10 µm (peak, within the atmospheric window). The conversion was based on an adaptive inversion algorithm of Shang et al. (2018) who presented a way to convert extinction coefficients at different wavelengths by using Ångström exponent values derived from AOTs. It should be mentioned here that Scheme B, even though it also includes some assumptions and uncertainties in its calculations, is the only one, compared to the other two (Schemes A and C), that gives us the opportunity to calculate only the dust contribution in the radiative effect.
For all these schemes in this study, 30 vertical levels have been used between the ground and 120 km height, with a spatial vertical resolution of 0.5 km starting from ground level (BOA) to 2 km and from 5 to 10 km and a resolution of 0.2 km from 2 to 5 km, due to the presence of the dust layers within this height range and additionally at the heights of 20 and 120 km (TOA). All simulations were performed for three different solar zenith angles (SZAs), 25, 45 and 65∘, covering a typical diurnal spring–summer cycle for radiative forcing estimates at midlatitudes. For the very few available wintertime measurements that SZA does not reach 25∘, a theoretical approach on the ARF is estimated. All cases were treated for cloud-free conditions. Except the altitude in km (zout), the additional outputs that have been implemented in our schemes are as follows: the direct irradiance (edir), the global irradiance (eglo), the diffuse downward irradiance (edn), the diffuse upward irradiance (eup) and the heating rates (heat) in K d−1, as described by Mayer et al. (2017).
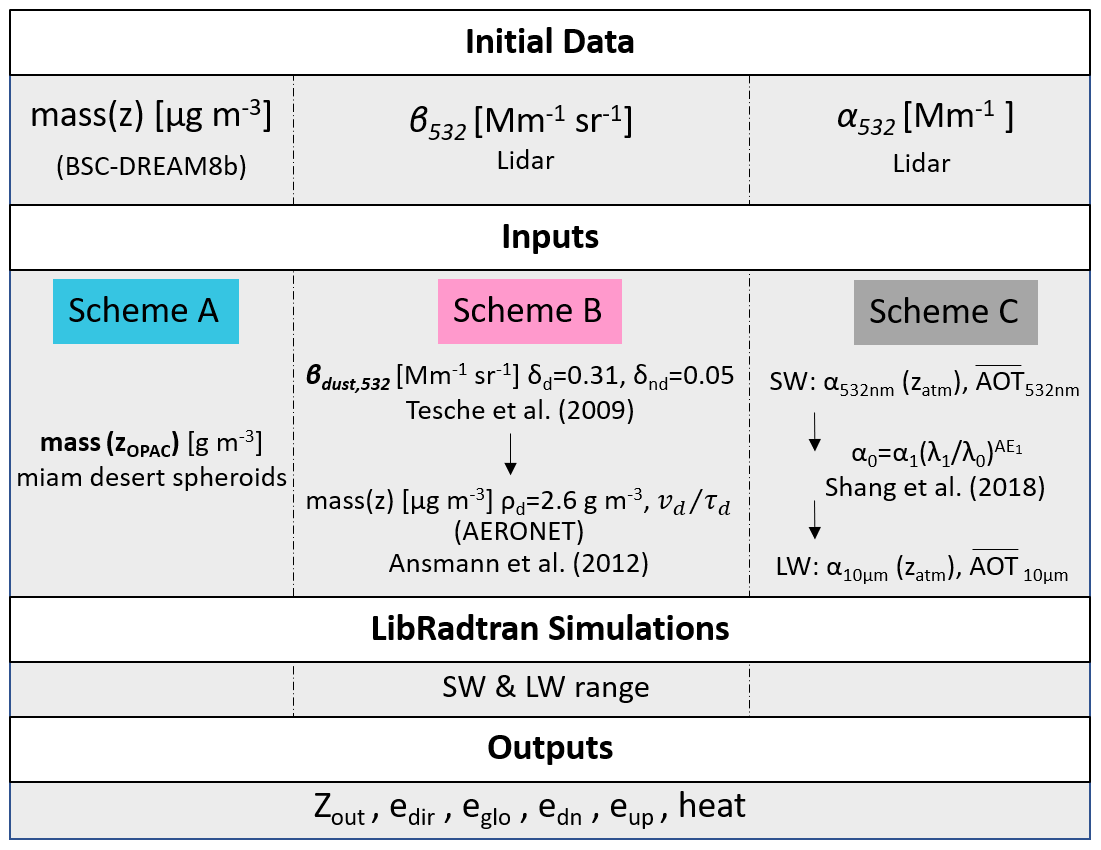
Figure 2Flowchart of the three schemes used to retrieve simulations of irradiances using the libRadtran software package.
3.4.2 Radiation dataset
The libRadtran irradiance outputs have been validated against reference solar irradiance pyranometer measurements at the Earth's surface (Kosmopoulos et al., 2018). For this study, solar radiation data measured by pyranometers were available only for the Granada and Athens stations. The evaluation was performed using cloudless time periods only. The reference solar radiation dataset consists of 1 min simultaneous measurements of horizontal global and diffuse irradiance measured with two CMP11 pyranometers in Granada and two CMP21 pyranometers in Athens (located at National Observatory of Athens actinometric station in the Penteli area, 10 km from NTUA). These pyranometer models, both manufactured by Kipp & Zonen, have a black-coated thermopile acting as a sensor which is protected against meteorological conditions by two concentric hemispherical domes. They both comply with the International Organization for Standardization (ISO) 9060 (1990) criteria for an ISO secondary standard pyranometer, being classified as “high quality” according to the World Meteorological Organization (WMO) nomenclature (WMO, 2018). Additionally, the corresponding pyranometer measuring the diffuse component was mounted on a shading device to block the direct irradiance and prevent it from reaching the sensor. In this study, the shading devices employed were a Solys2 sun tracker and a CM121 shadow ring, at Granada and Athens, respectively. For those diffuse irradiance measurements taken using a shadow ring, the model proposed by Drummond (1956) has been applied in order to correct for the diffuse radiation intercepted by the ring, as suggested by the manufacturer (Kipp & Zonen, 2004).
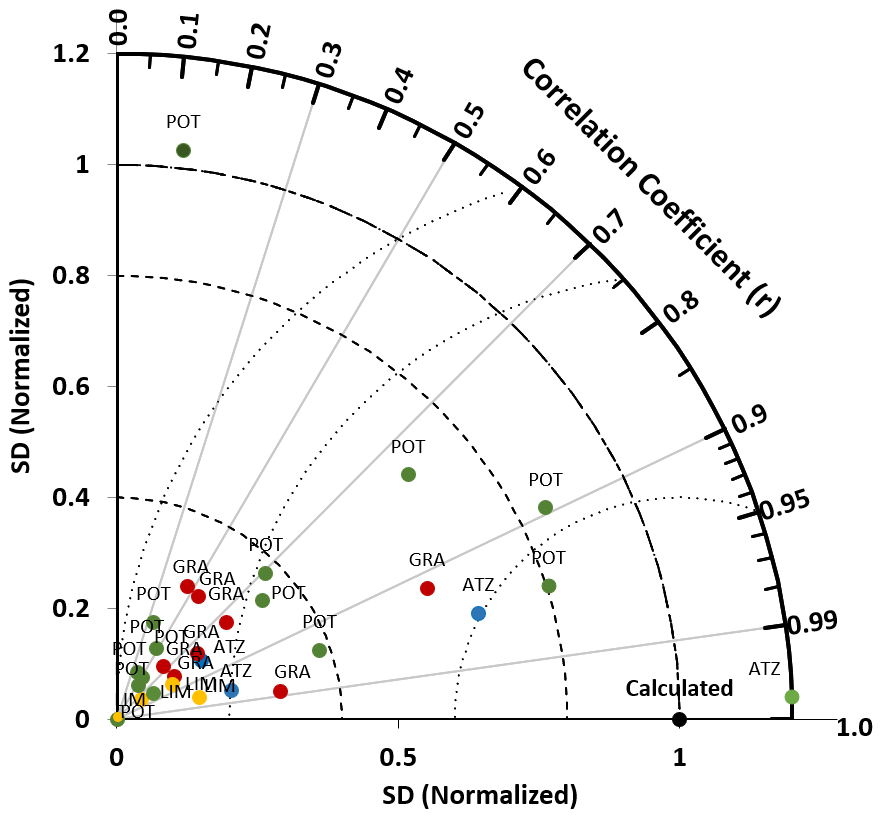
Figure 3Taylor diagram of the case-by-case vertical mass concentration simulated by BSC-DREAM8b model against the lidar-retrieved ones. The black point (1,0) represents the calculated lidar data. The azimuthal angle presents the correlation coefficient (r), and the radial distance of any point from the origin (0,0) indicates the normalized SD of the dataset. The normalization of the SD is performed with respect to the calculated values. The colored dots represent each one of the four EARLINET stations, namely GRA (red), POT (green), ATZ (blue) and LIM (orange).
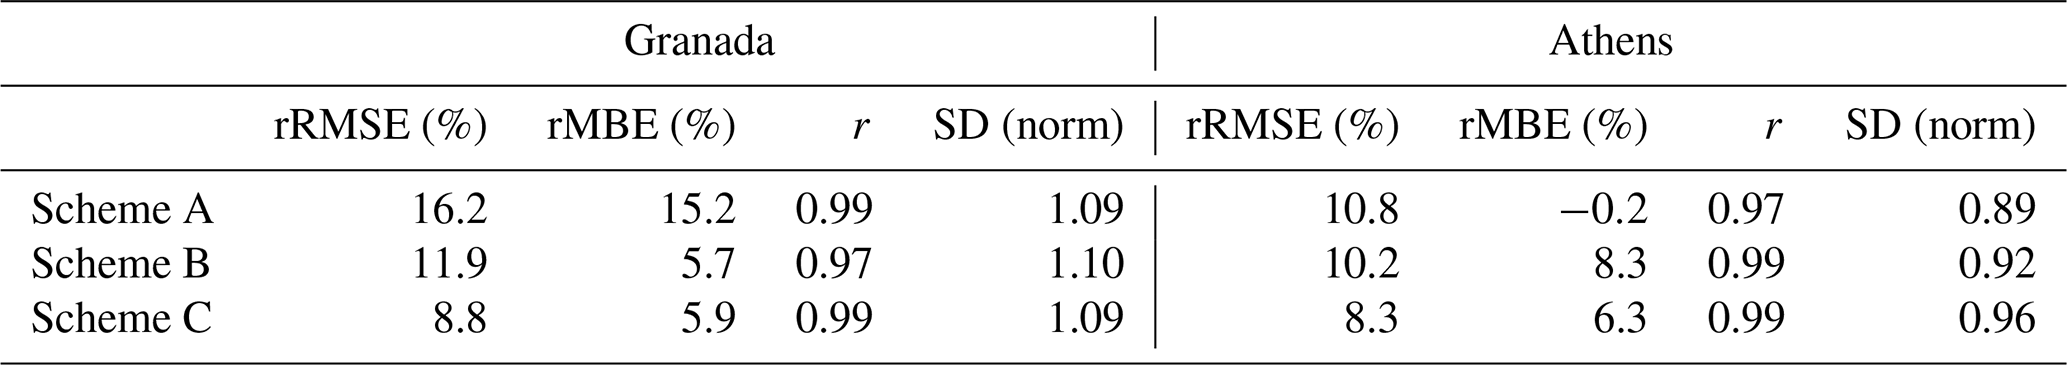
Table 3Statistical metrics for the modeled global irradiance values versus the reference pyranometer measurements for Granada and Athens and the three schemes applied.
3.5 Evaluation of aerosol mass concentration vertical profiles
Before using the vertical dust mass concentrations profiles retrieved from (i) BSC-DREAM8b model simulations (Scheme A) and (ii) lidar measurements as calculated from Eq. (1) (massd), (Scheme B) as inputs to the libRadtran model, we performed a day-by-day comparison between them. Due to the different spatial and vertical resolution between the modeled and the lidar profiles, both profiles were degraded to the fixed height levels of the OPAC dataset (0, 1, 2, 3, 4, 5, 6, 7, 8, 9, 10, 11, 12, 35 km).
Figure 3 shows a Taylor diagram of the mass concentrations simulated by the BSC-DREAM8b model against the lidar-retrieved ones. The azimuthal angle presents the correlation coefficient, the radial distance presents the normalized standard deviation (SD) of each point and the root mean square error (RMSE) is proportional to the distance from the point on the x axis identified as “calculated”, which, depicted by a black point at the (1,0) cross section, indicates the lidar-retrieved aerosol mass values representing the reference point. The normalization of the SD is performed with respect to the calculated values. In 66 % of the cases there is a good correlation (r>0.6), and, consequently, a good prediction of the shape of the vertical distribution is achieved, while in 96 % of the cases the model gives lower concentration values (normalized SD < 1), revealing an underestimation in the intensity and the mass concentration of the events. Therefore, we report a mean underestimation of the mean mass concentration values of the BSC-DREAM8b of the order of 31 %. However, we should take the following into consideration: (i) the spatial resolution, where the lidar observations are considered as point measurements, while the simulations represent uniform pixels of 0.3∘ resolution; and (ii) the temporal resolution, where the lidar-retrieved profiles are hourly averaged, while the model-derived profiles are instantaneous results, saved every 6 h.
By further comparing the modeled mass vertical profiles to the ones calculated by lidar, we report that the mean center of mass (in km) estimated from BSC-DREAM8b profiles is 0.6 km lower than the one calculated from the lidar measurements (2.6±1.0 km and 3.2±1.1 km respectively). The maximum concentration (peak) is usually found in the region 2–3 km, both in the modeled and the observed data. The BSC-DREAM8b, having a significantly lower vertical resolution compared to the lidar, predicts smoother profiles of dust layers by spreading the layer's base to lower altitudes (∼ 1 km, in 100 % of the cases) and the top at higher altitudes (in 86 % of the cases) compared to the observed ones. These remarks are in line with the previous studies of Mona et al. (2014) and Binietoglou et al. (2015), who reported discrepancies concerning the base, the top layer height and extinction profiles and good agreement in terms of profile shape between the BSC-DREAM8b and observations. However, since fixed height levels of the OPAC dataset were finally used in libRadtran for the ARF simulations of the three schemes, having significantly lower vertical resolution compared to the initial lidar profiles, these discrepancies in height were smoothed out.
3.6 Evaluation of ground-level libRadtran outputs
The evaluation of the performance of the model was undertaken by statistical means. The relative root mean square error (rRMSE), the relative mean bias error (rMBE), the correlation coefficient (r) and the normalized SD were calculated in order to numerically quantify the performance of the global irradiance recorded by pyranometers and simulated from the three schemes. Table 3 shows the statistical results for the modeled global irradiance values versus the reference 1 min pyranometer measurements for both locations (Granada, Athens) and the three schemes at 25∘, 45∘ and 65∘ SZA. All scheme simulations perform remarkably well, with rRMSE values ranging from 8.3 % to 16.2 % and rMBE values between 0 % and 15.2 %. In general, the rRMSE is slightly higher at Granada, mainly for Scheme A. According to this statistic, the libRadtran outputs with the best performance are those obtained by Scheme C as input followed by Schemes B and A, respectively. This order is the same for the rMBE values with the exception of Scheme A at Athens. The correlation coefficient r depicts the good performance of the radiative transfer model for the three schemes and the two locations. All simulations present a value of r>0.95, with minor differences (below a 10 %) in the normalized SD values with respect to the pyranometer global irradiance values. A slight overestimation is observed for all scheme outputs at Granada (norm SD>1). Conversely, this overestimation is no longer evident in the modeled global irradiance for Athens. However, it is important to note the good performance of the Scheme B despite the high number of various parameters involved in it.
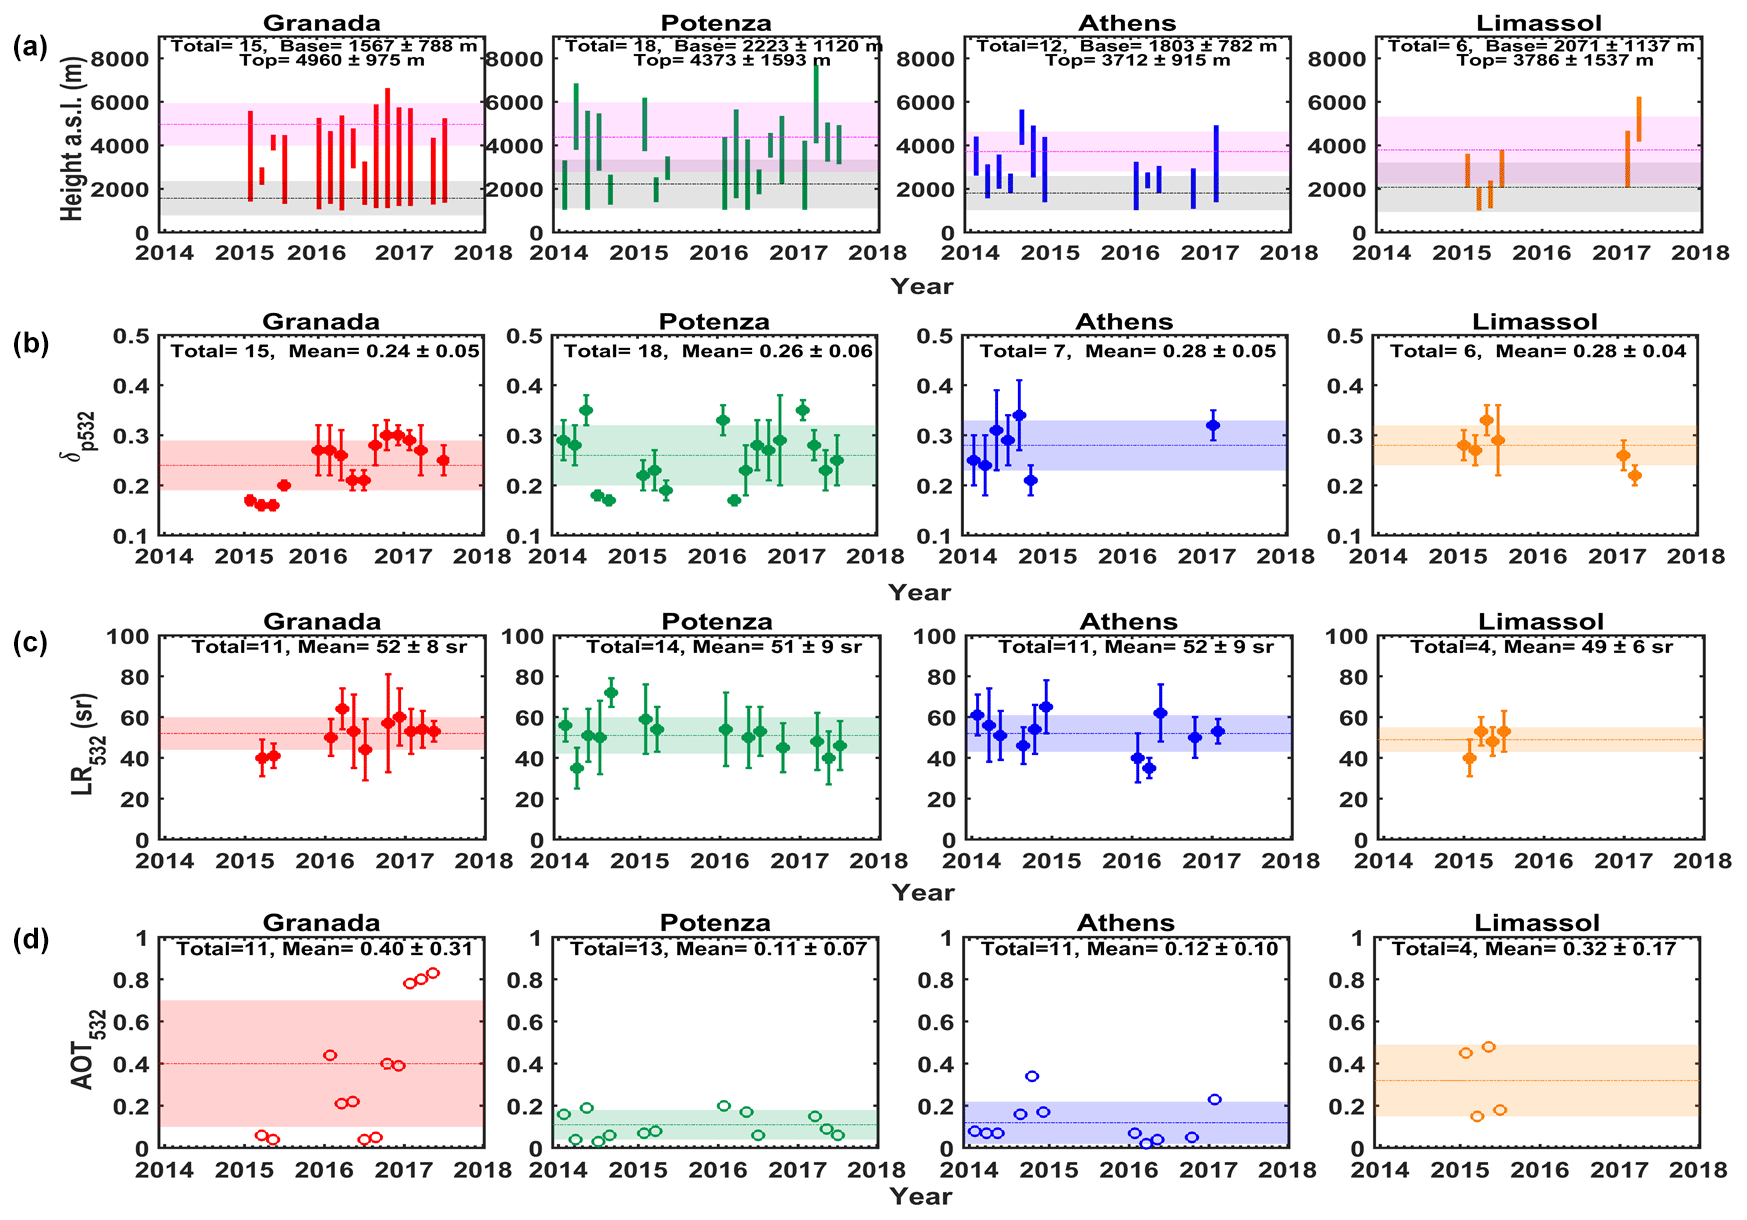
Figure 4Mean values along with the standard deviation of (a) the base and the top, (b) δp532, (c) LR532 and (d) AOT532, per station (text and banded lines) and per case (symbols and error bars) within the observed dust layers.
4.1 Aerosol geometrical and optical properties per site
For each case studied, the mean δp532, mean LR532 and AOT532 values were calculated inside the dust layers (see Sect. 2.2) as shown in Fig. 4a–d. The corresponding SD values give an indication of the variability of these parameters from the base to the top of the dust layer. Figure 4a shows the aerosol geometrical properties for the detected layers one by one, per station and per year. The mean values of the base and top height of the dust layers per station, along with their SD, are marked with horizontal bounded lines. At the four sites (Granada, Potenza, Athens and Limassol) mean layer thicknesses of 3392±1458, 2150±1082, 1872±816 and 1716±567 m were calculated, respectively. We also found mean δp532 values of 0.24±0.05, 0.26±0.06, 0.28±0.05 and 0.28±0.04 (Fig. 4b) and indicative mean AOT532 values of 0.40±0.31, 0.11±0.07, 0.12±0.10 and 0.32±0.17 (Fig. 4d), respectively. Similar mean LR532 values of around 51 sr (Fig. 4c) were found for all stations. The Granada station has the minimum mean value for layers' base height (1567±788 m a.s.l.) and the maximum for top height (4960±975 m) and layers' thickness. Concerning the LR values, no remarkable deviations were observed among the four stations, having mean values around 51 sr, which are in very good agreement with findings in the literature (Tesche et al., 2009; Ansmann et al., 2012; Groß et al., 2011; 2013). The largest indicative mean AOT value, equal to 0.40±0.31, observed over Granada station for the total studied period is in accordance with the geometrical properties (Fig. 4a) that depict thick dust layers in the majority of the cases.
Considering Granada's station as representative of the western Mediterranean region, Potenza of the central Mediterranean region and Athens and Limassol stations of the eastern Mediterranean region, a dust aerosol mode classification per region can be made. For this purpose, the mean AOT532 versus the AEβ532∕1064, giving an indication of the aerosol particle size in the atmospheric column for each region, is shown in Fig. 5. A wide spread of the AOT values at moderate to low AEβ532∕1064 values (between 0 and 0.6) observed in the western Mediterranean region demonstrates that the dust size distribution in this area is dominated by coarse-mode particles during events of different intensities. On the other hand, the presence of dusty layers in the central and eastern Mediterranean regions can be associated with higher AEβ532∕1064 values (even up to 1.5) and, consequently, with the presence of fine-mode particles and lower dust loads. Our findings verify that the longer the time and distance of dust transport is, the more likely it is for the dust aerosols to be mixed with background ones in the eastern Mediterranean (Groß et al., 2019; Soupiona et al., 2019).
In terms of the aerosol size distribution, the scatter plot of Fig. 5 allowed k-means clustering to be performed (Arthur and Vassilvitskii, 2007) in order to define three physically interpretable aerosol size distributions: (a) fine mode, with ; (b) coarse mode, with and AOT532 between 0 and 0.2; and (c) AEβ532∕1064 values smaller than 0.6 attributed to large AOTs (between 0.2 and 0.8), representative of extreme dust events. It seems that the majority of these extreme dust outbreaks occur over the western Mediterranean region, more likely due to its location close to the African continent. For example, Fernández et al. (2019) recently reported an unprecedented extreme wintertime Saharan dust event during February 2017 over the whole Iberian Peninsula, with AOTs > 0.2 (675 nm) and AE values around zero. More studies referring to the occurrence of extreme dust events over the aforementioned area can be found in literature (Cachorro et al., 2008; Guerrero-Rascado et al., 2009).
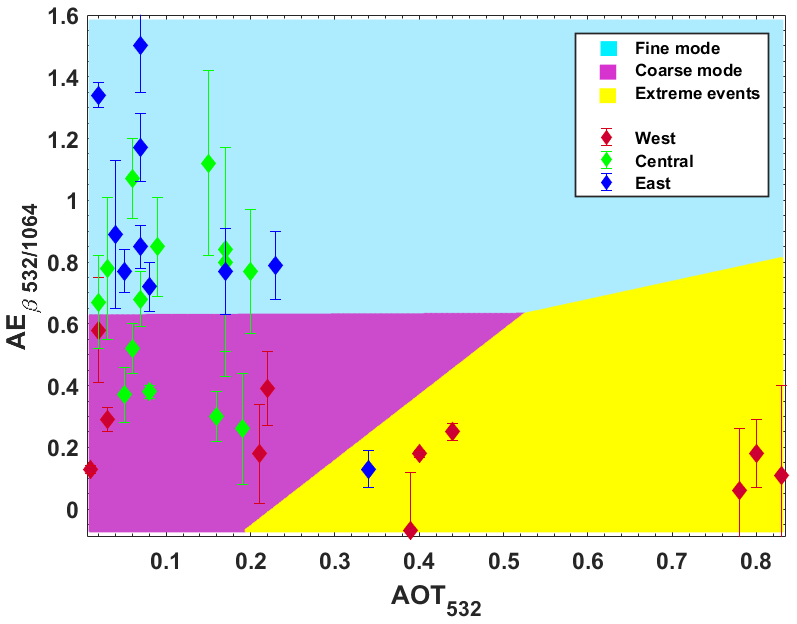
Figure 5AEβ532∕1064 versus AOT532 per region: western (red marks and error bars), central (green marks and error bars) and eastern (blue marks and error bars) Mediterranean region. K-means clustering revealed three clusters: fine mode (light blue background), coarse mode (magenta background) and extreme dust events (yellow background).
4.2 Clustering per mixing state
Based on the High Spectral Resolution Lidar (HSRL) classification presented by Groß et al. (2013), the intensive aerosol quantities LR532 versus δp532 were plotted, identifying three of the six existing clusters in our data (Fig. 6). The first cluster (green marks and error bars) represents a mixing state of Saharan dust and BB aerosols, with a large spread in mean LR values and low mean δp532 values (40 sr ≤ LR532≤75 sr, ). The second one (red marks and error bars) is attributed to mixed Saharan dust, where dust aerosols are dominant, but urban/continental, marine or even pollen aerosols are also possibly present (40 sr 65 sr, ). The third cluster (orange marks and error bars) is attributed to pure Saharan dust aerosols (45 sr ≤ LR532≤60 sr, ). The most populated and, consequently, the most common among those three clusters is the red one, as expected, due to the frequent mixing of dust aerosols with continental ones (Papayannis et al., 2009). The range of our measured δp532 values as indicated by the horizontal error bars in Fig. 6 shows an overlap between the three identified aerosol clusters, evidencing a more realistic transition from one cluster to the other and bridging the gap especially between green and red clusters from the HSRL classification.
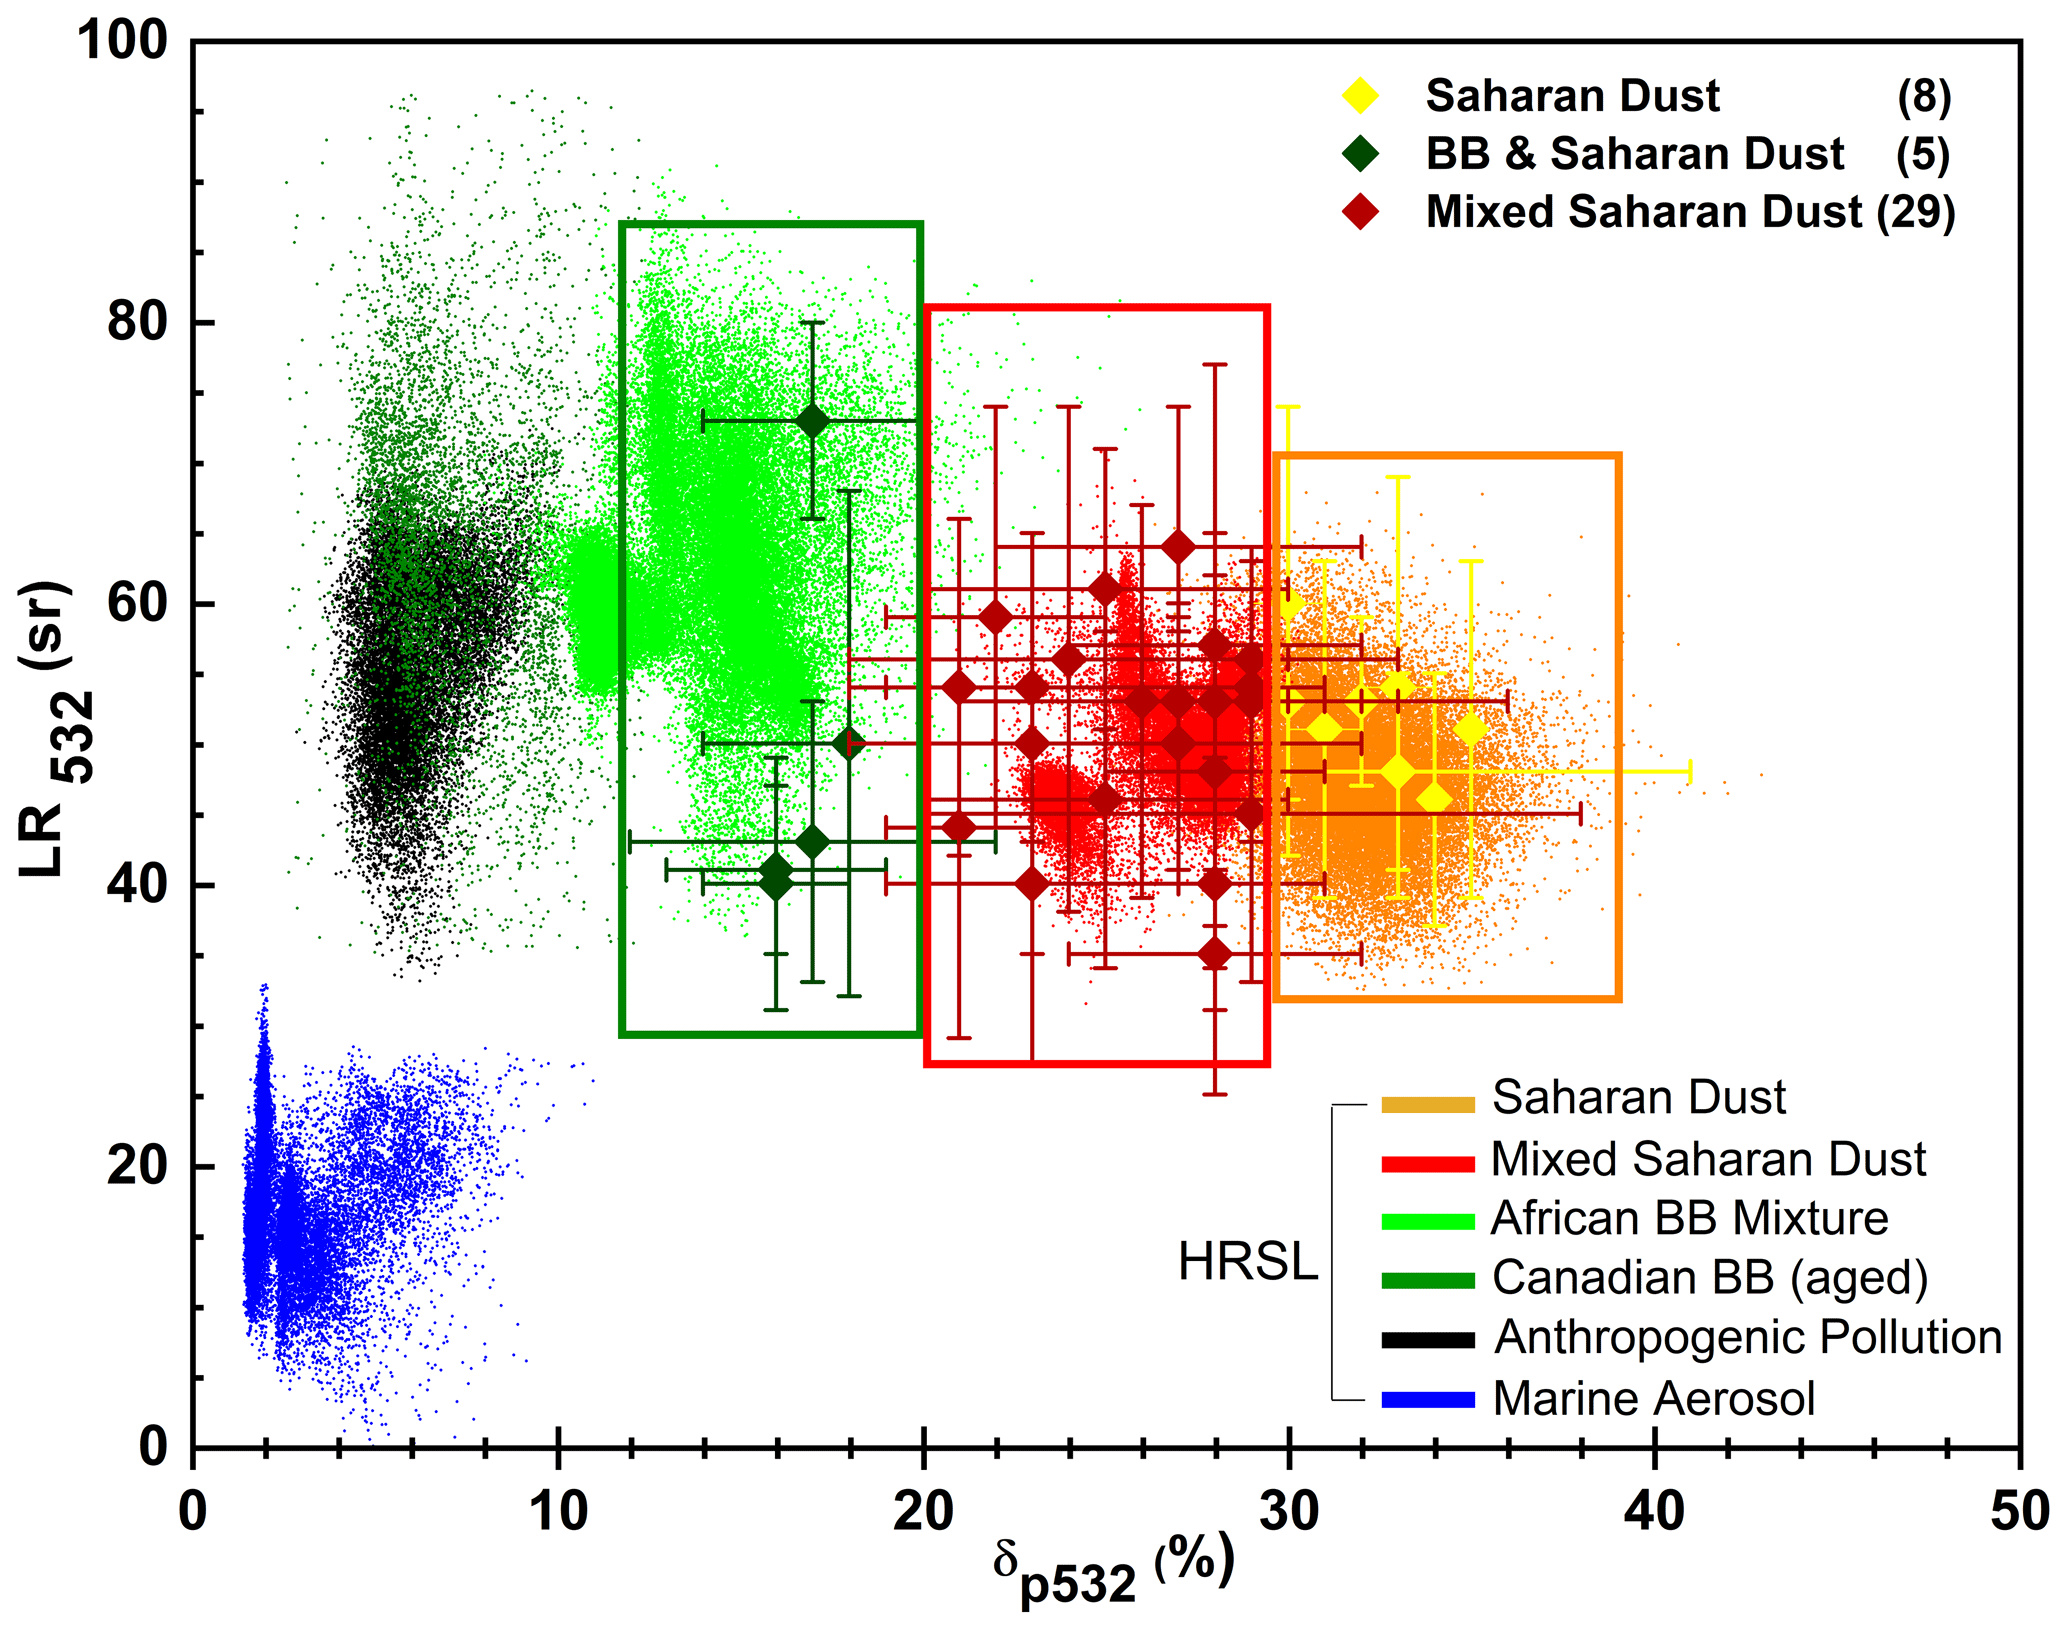
Figure 6LR532 versus δp532 values from HSRL observations presented by Groß et al. (2013) (colored dots), along with the selected datasets from the four EARLINET stations (symbols and error bars).
Table 4 summarizes the mean values of the aerosol geometrical, optical and microphysical properties of the three identified clusters along with their SD (5 cases for BB and Saharan dust, 8 cases for Saharan dust, 29 cases for mixed Saharan dust). A synergistic approach of HYSPLIT (trajectories of 120 h backward for each case) and Google Earth (distance calculator) tools allowed us to estimate the distance traveled (in km) to the respective sites and the mixing hours per cluster. Specifically, the term of mixing refers to the hours the air masses traveled after leaving the African continent. We can see that the Saharan dust cluster presents the lowest mixing with other air masses (26±13 h), compared to the other clusters (41±26 h for the BB and mixtures and 66±41 h for the mixed Saharan dust cluster). Moreover, the air masses of the Saharan dust cluster seem to travel faster than those of the other two clusters, although covering a greater distance (4845±2825 km) at the same time (within 120 h). Now, the main difference between the two remaining clusters (BB and mixtures and mixed Saharan dust) is attributed to the mixing hours. The air masses of the latter cluster remain 15 h longer and circulate over the Mediterranean and Europe, so they are probably enriched with other types of aerosols.
Table 4Mean values of optical, geometrical and microphysical properties of the three identified clusters, along with their standard deviation (SD). Zero SD indicates no variability in the corresponding retrieved parameter. The term “mixing” refers to the hours the air masses traveled after leaving the African continent.

Concerning the aerosol optical properties, the β532 and α532 show lower values for BB and dust and for mixed Saharan dust cases ( km−1 sr−1, 0.47±0.28 km−1 and km−1 sr−1, 0.74±0.48 km−1, respectively) and higher values ( km−1 sr−1, 0.80±0.27 km−1) for the Saharan dust cluster. Therefore, higher AOT532 values (0.32±0.25) were found for the latter cluster compared to the others, due to the higher dust burden of these events over the affected sites. The highest δp532 values (0.32±0.02) indicate the arid origin and the coarse mode of pure Saharan dust layers (Freudenthaler et al., 2009) of the corresponding cluster. No direct information can be extracted from the similar LR532 values about the mixing state of the aerosol layer, except that the range of the SD narrows as the mixing decreases. However, for the cases for which observations at 355 nm were available, it seems that the color ratio (namely the LR35∕LR532) converges to unity for the Saharan dust cluster, indicating the absence of spectral dependence for the case of pure dust (Müller et al., 2007; Veselovskii et al., 2020). For these cases also, the AEβ355∕532 becomes closer to zero, having a mean value of 0.35±0.45.
We also summarize the changes in mean microphysical properties estimated with the SphInX tool for all the cases of each of the three identified clusters. The BB and Saharan dust cluster has a lower mean Reff value (0.293±0.074 µm) due to the fine structure of BB aerosols included in the layer, while a mean Reff of 0.360±0.081 µm corresponds to the cluster of mixed Saharan dust and a slightly larger value (0.387±0.070 µm) corresponds to the Saharan dust cluster. The values for RRI, IRI and SSA at 532 nm were similar for the two clusters that do not include BB aerosols, whilst the presence of BB aerosols of the first cluster leads to higher RRI and IRI values and lower SSA, results that are in good agreement with the ones reported in Petzold et al. (2011) over Dakar, for mineral dust and dust mixed with anthropogenic pollution.
4.3 Regional aerosol radiative forcing (ARF)
As mentioned previously, there is a shortage of papers in the literature about the role of dust in the Earth's radiation budget. Since very few in situ measurements of ARF effects and heat fluxes are available, especially in the Mediterranean (Bauer et al., 2011; Meloni et al., 2018), we are restricted to performing simulations to quantify the role of dust aerosols in radiative forcing in the studied regions. The mean ARF is calculated during this simulation, running the libRadtran radiation code twice: with (index “dusty” in Eq. 2) and without (index “clear” in Eq. 2) the presence of free tropospheric dusty aerosol layers. For all cases, the vertical profiles of ARF starting from ground level/bottom of atmosphere (BOA) up to the top of atmosphere (TOA) in the SW and LW ranges were simulated using the three aforementioned schemes.
A negative forcing of aerosols both at the BOA and TOA is noted in the SW range, as presented in Fig. 7a, which depicts the mean ARF of all cases per scheme, over the Mediterranean Basin. Our results indicate a presence of less absorbing aerosols, thus having a cooling behavior. Depending on the dust optical properties and load intensity, ARF values at the BOA range from −40 to −13 W m−2 at SZA 25∘, from −43 to −14 W m−2 at SZA 45∘ and from −44 to −15 W m−2 at 65∘. At the TOA, the corresponding ranges per SZA are −9.5 to −1.4 W m−2 (25∘), −16 to −3.3 W m−2 (45∘) and −24.3 to −6.9 W m−2 (65∘). Similarly, in the SZA independent LW range (thermal spectral range), the ARF values range from +1.6 to +4.6 W m−2 for the BOA and from +0.8 to +3.6 W m−2 for the TOA. Our estimations are consistent with results obtained by other findings in the literature for Saharan dust aerosols over the Mediterranean region. Specifically, Sicard et al. (2014) found that the SW radiative forcing (RF) at the BOA always has a cooling effect, varying from −93.1 to −0.5 W m−2 while the corresponding LW RF always has a heating effect, varying from +2.8 to +10.2 W m−2. They also concluded that dust aerosols have a cooling effect in the SW spectral range at the TOA, with a RF ranging from −24.6 to −1.3 W m−2, while at the TOA the LW RF varies between +0.6 and +5.8 W m−2. Meloni et al. (2003) found at the island of Lampedusa instantaneous RF of −70.8 W m−2 at the BOA and −7.5 W m−2 at the TOA within the range 300–800 nm for an event with an AOT of 0.51 at 415 nm. For the same location and for another strong Saharan dust outbreak (AOT500=0.59), Meloni et al. (2015) reported a total (SW + LW) radiative forcing of −48.9 W m−2 at the BOA, −40.5 W m−2 at TOA and +8.4 W m−2 within the atmosphere for SZA = 55.1∘. A negative radiative effect reaching down to −34.8 W m−2 at the BOA in the Mediterranean area was also recently reported by Gkikas et al. (2018) for the studied period March 2000–February 2013.
Variations among these values are expected since they strongly depend on the different AOTs, mass estimations and extinction profiles. Estimations retrieved from Scheme B are expected to give higher values compared to those given from Scheme A, as also revealed by Fig. 3. The ARF in the LW spectral region is opposite in sign and significantly lower in absolute values than in the SW region. The difference between the TOA and BOA ARF, with the former only weakly perturbed and the latter much stronger, can be attributed to the heating within the troposphere, since the presence of the dust aerosols mainly leads to a displacement of the surface's radiative heating into the dusty layer. We also noticed that the low values of the reflected solar flux are partially offset by the absorption of upwelling LW radiation. Finally, in the LW spectral region, the mean ARF values at the BOA (Scheme A: W m−2, Scheme B: W m−2 and Scheme C: W m−2) are close to those at the TOA (Scheme A: W m−2, Scheme B: W m−2 and Scheme C: W m−2) but moved a little to more positive values. As a result, the ARFAtm (Eq. 5) is positive during the diurnal circle, yielding net radiative heating of the dust layers.
The mean net heating rate within the atmosphere, calculated by adding algebraically both rates in the SW and LW spectral ranges, is presented in Fig. 7b. Here, the net heating rate is clearly dependent on the available solar radiation and increases with SZA due to the low incoming solar radiation reaching the BOA during afternoon hours (SZA 65∘). Our estimations are in accordance with the fact that as the SZA increases, the optical path of the SW radiation grows significantly, increasing the attenuation of the direct radiation while generating a higher fraction of the diffuse radiation. This effect is more pronounced at the BOA, where the intensity of the heating rate is reduced with increasing SZA, since fewer photons are available to heat the dust layers. The net heating rate values for Scheme A are as follows: K d−1 (25∘), K d−1 (45∘) and 0.00±0.02 K d−1 (65∘). Similar to slightly higher values are observed for Scheme B as follows: K d−1 (25∘), K d−1 (45∘) and K d−1 (65∘). For Scheme C, we report higher values of this parameter during the diurnal circle. More precisely, the net heating rate is almost 1.5 times higher at 25∘, 2 times higher at 45∘ and around 0.8 times higher at 65∘, compared to the aforementioned schemes. Greater sensitivity in the SZA appears in Scheme B as it results from the line slope.

Figure 7Mean values of (a) SW and LW ARF at BOA and TOA and (b) the net heating rate within the atmosphere, along with the SD for the three schemes applied in the total set of the studied cases. The box in the top right of (b) depicts the line slope.
In order to further explain the difference of sign in the net heating rate of Scheme C, compared to the two others presented in Fig. 7b, we plotted the aforementioned parameter along with the base layer height, the AOT532 and the layer thickness of each case as presented in Fig. 8. Taking into account that the effect of net heating rate occurred by the dusty cases, from negative to positive values, is more pronounced close to the surface at small SZA values, the estimations of the net heating rate at the BOA at 25∘ SZA were selected to be presented in this graph. It becomes clear that the sign of the net heating rate at BOA depends on the dust vertical structure and the AOT. More precisely, the majority of the cases with low AOT532 values (≤0.2) and low layer thickness (≤2 km) give negative net heating rate values. Additionally, the higher the AOT is, the higher the absolute value of the net heating rate is. Concerning the base layer height, it plays a key role in the absolute net heating rate of each case, since dust layers close to the ground have higher absolute net heating rate values. For example, let us examine two dust events that occurred during the same month (August). The first one with a base of 2.8 km, 0.73 km thickness and AOT532 equal to 0.01 has a heating rate of −0.17 K d−1, while the second with a base of 3.8 km, 0.66 km thickness and AOT532 equal to 0.02 has a net heating rate of almost zero (−0.03 K d−1). In another comparison, net heating rate values of −0.02 K d−1 versus +0.09 K d−1 are reported for two layers during summertime that almost have the same base (2.6 and 2.5 km) and thickness (2.3 and 2.4 km) but different AOT532 values (0.08 and 0.34, respectively). Finally, a combination of high AOT532 (0.21–0.83) and high thickness (2.1–5.5 km), along with low base height (1.0–1.5 km), gives high net heating rate values with a positive sign, ranging from +0.06 to +0.26 K d−1.
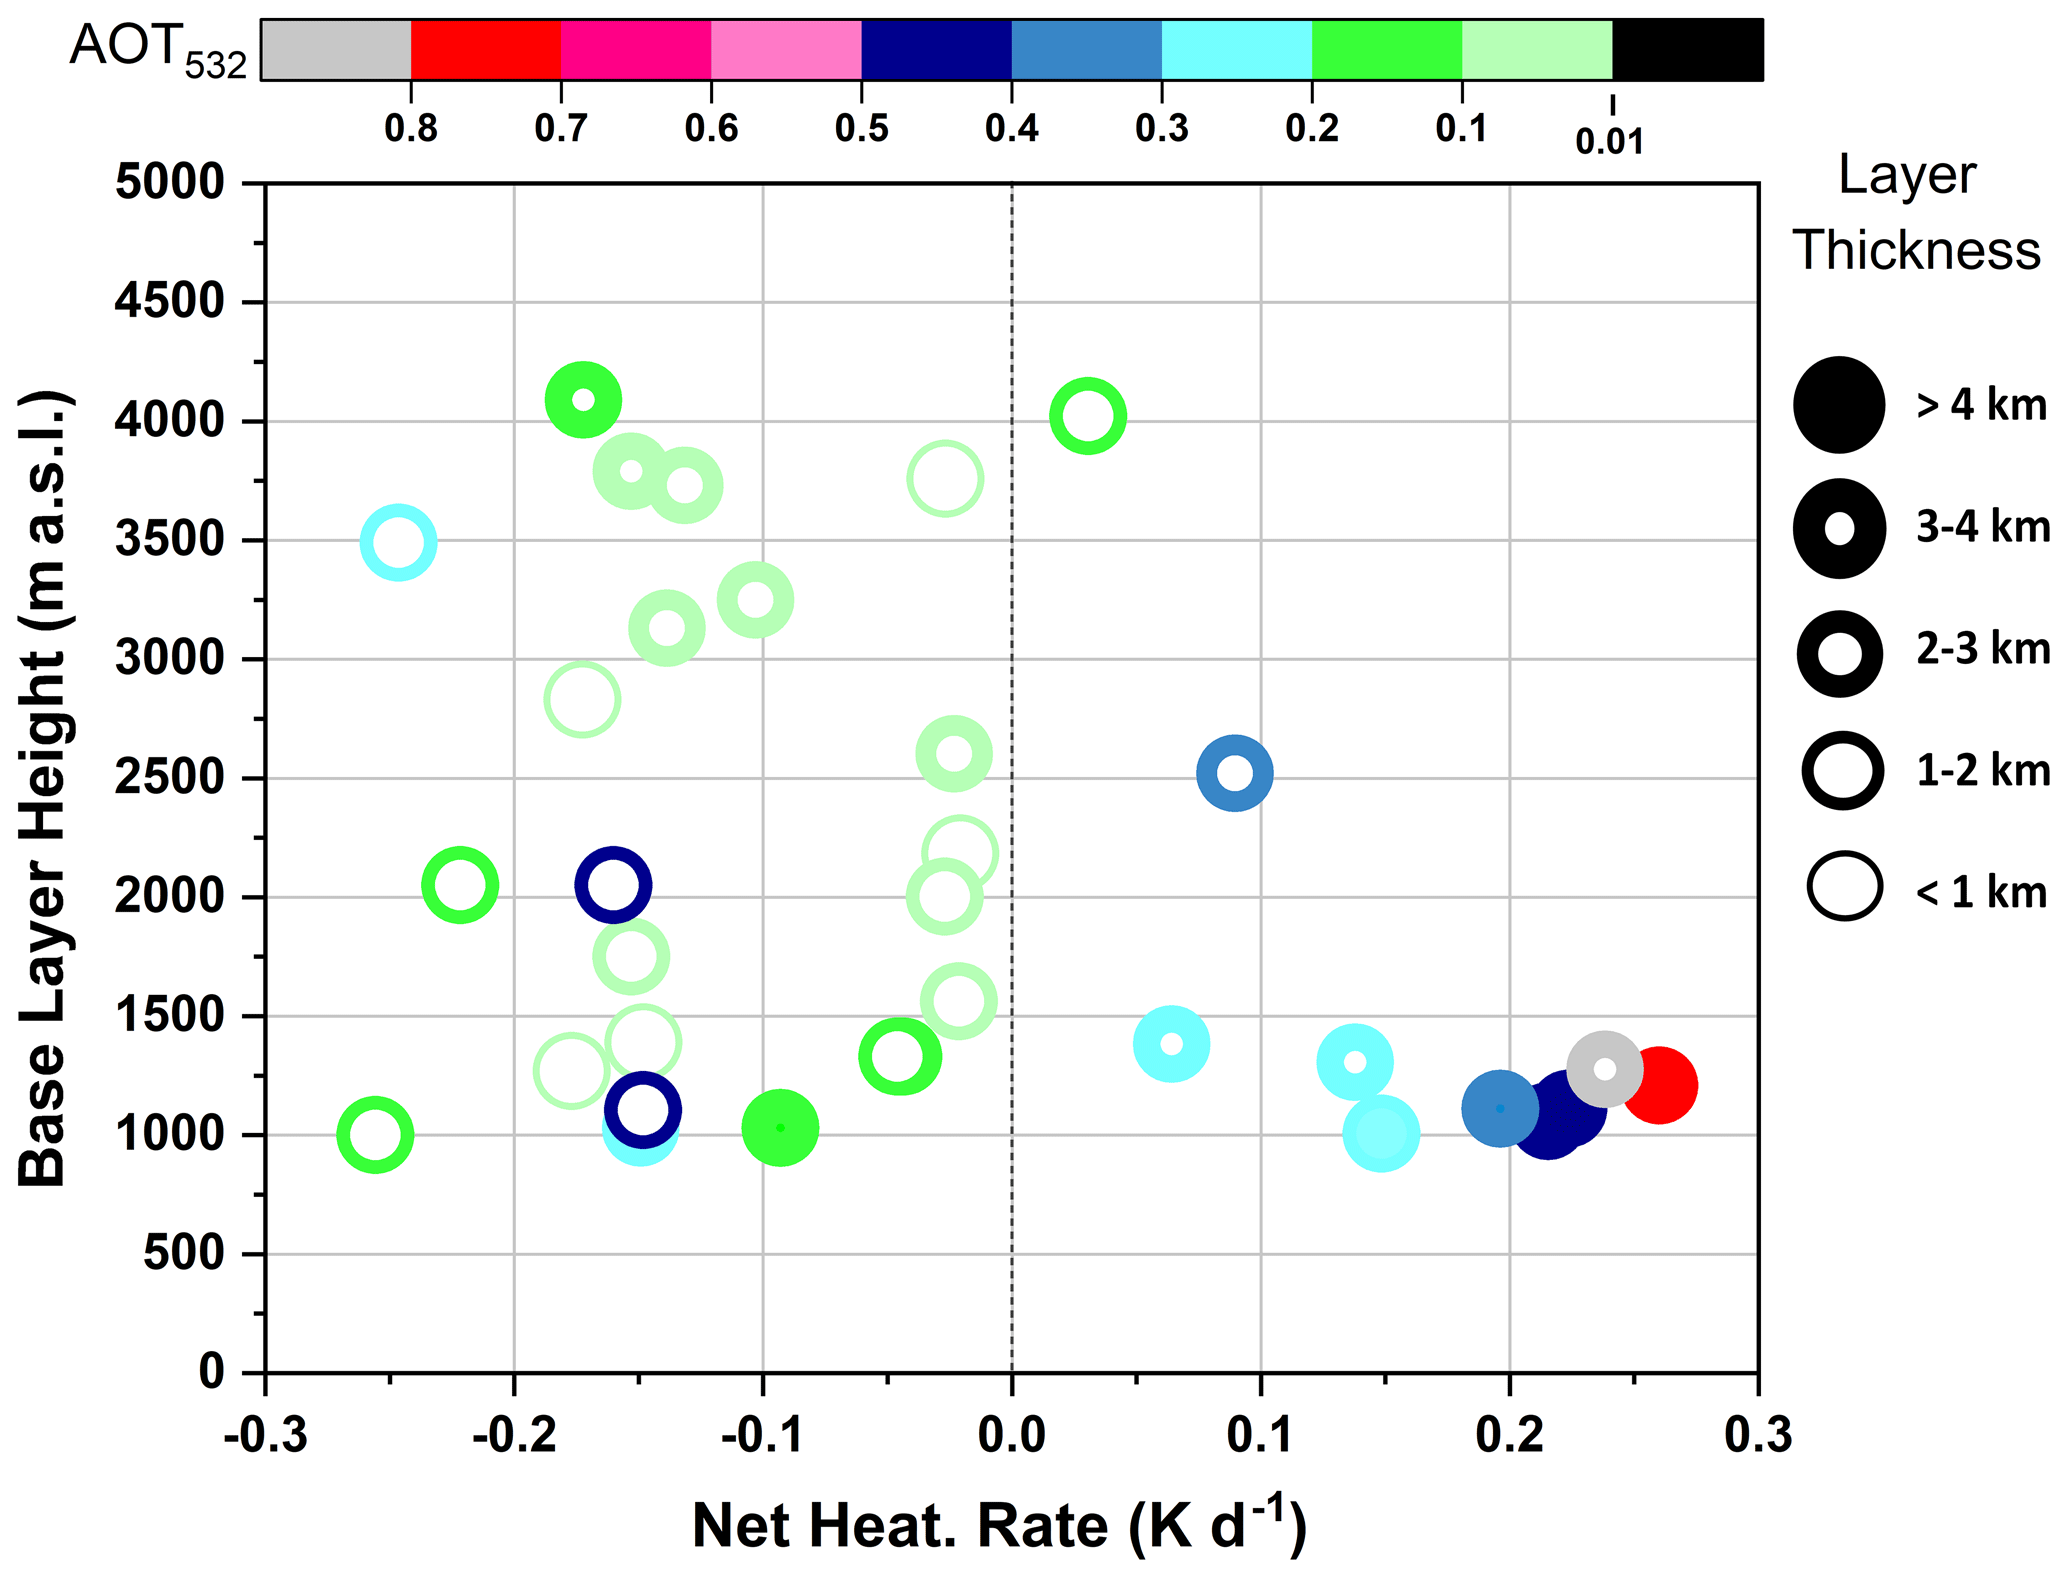
Figure 8Net heating rate values per case of Scheme C estimated at BOA, 25∘ SZA versus base layer height. The horizontal color bar indicates the AOT532 values, and the vertical symbol thickness indicates the layer thickness.
Figure 9a–c depict the same results as in Fig. 7a but for each of the three identified clusters: BB and dust, mixed Saharan dust and Saharan dust. The ARF in the SW range is negative both in the BOA and TOA for all clusters and is dominated by large dust particles for the cluster of the Saharan dust episodes (see Table 4; Fig. 9c), (Scheme A: W m−2, Scheme B: W m−2 and Scheme C: m−2 for BOA and Scheme A: W m−2, Scheme B: W m−2 and Scheme C: m−2 for TOA; SZA 25∘), whereas dust layers mixed with biomass burning aerosols have a significantly lower cooling effect (Fig. 9a; Scheme A: W m−2, Scheme B: W m−2 and Scheme C: W m−2 for BOA and Scheme A: W m−2, Scheme B: W m−2 and Scheme C: m−2 for TOA; SZA 25∘) for each of the three applied schemes. ARF seems to be inversely proportional to the mixing ratio, since higher absolute values are estimated for less mixed dust layers. This can directly be linked to the fact that ARF values strongly depend on αpar, βpar and AOT that have much higher values for the Saharan dust cluster, as already reported (Table 4). Focusing on the SW range, the cooling effect for Scheme A of the Saharan dust cluster is up to 3 times higher compared to the BB and Saharan dust one, whilst the cooling effect for Scheme C of the former cluster is up to 10 times higher compared to the latter. The cooling effect of Scheme B also becomes stronger with the decreasing mixing state but at a lower magnitude (the former cluster is almost 2 times higher compared to the latter).
Hence, even though the studied cases included in the Saharan dust cluster usually have higher mass concentration values than the other cases, as predicted by BSC-DREAM8b (Scheme A), the model still seemingly underestimates the intensity of strong transported dust episodes over the observation stations. In contrast, Scheme C is the most sensitive to the mixing state of the aerosol layers. To explain this result one should consider that on the one hand, spheroidal particles such as dust have larger dimensions than spherical ones such as BB aerosols and thus lead to larger AOTs (Haapanala et al., 2012) and consequently to increased negative ARF, and on the other hand, Schemes A and B involve greater assumptions concerning dust particles than Scheme C.
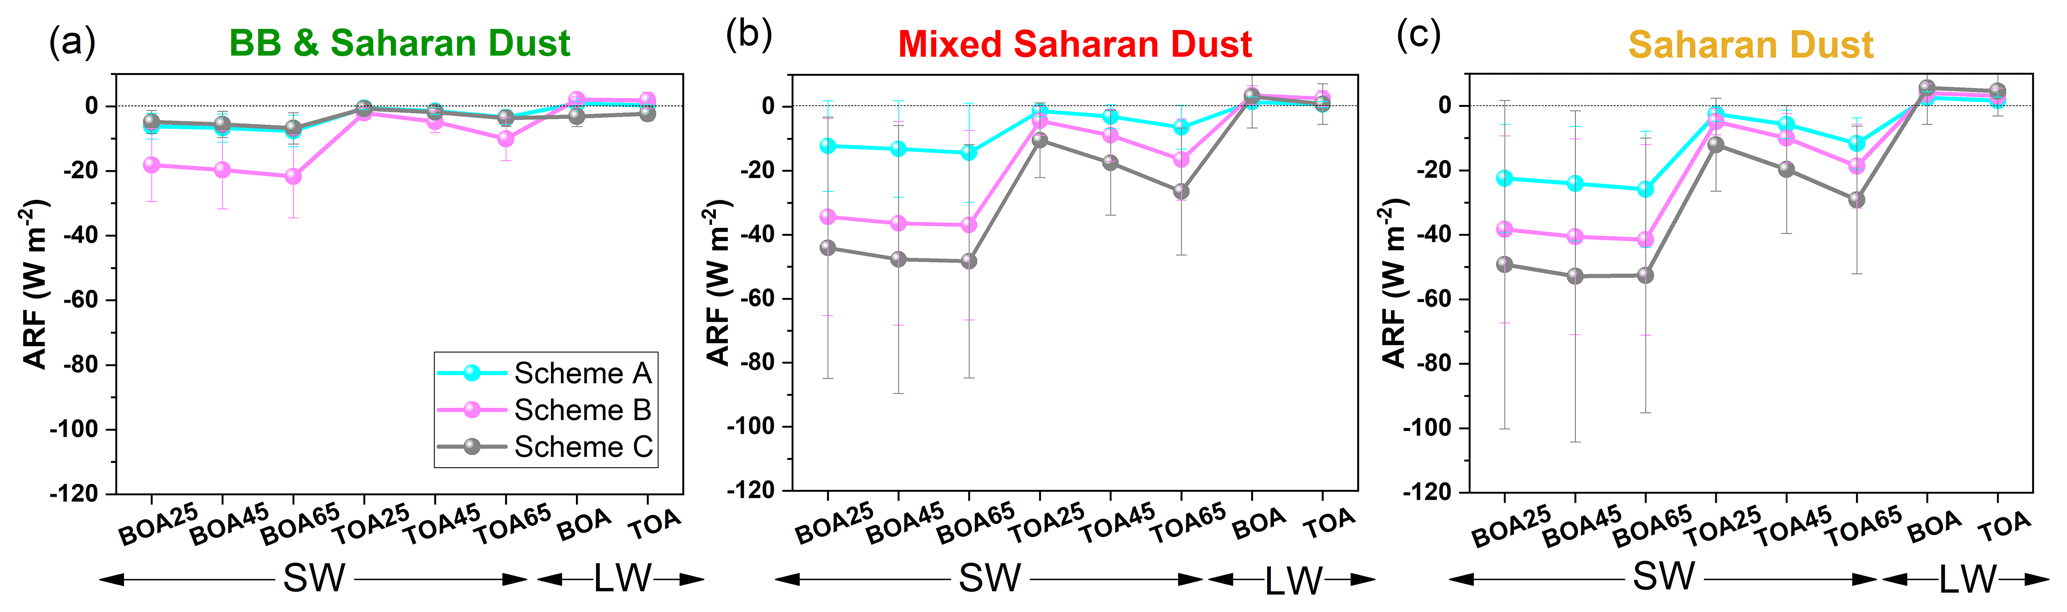
Figure 9Mean values of SW and LW ARF at BOA and TOA, along with the SD for the three schemes applied regarding the mixing state, namely (a) BB and Saharan dust, (b) mixed Saharan dust and (c) Saharan dust. The dotted line represents the ARF zero value.

Figure 10Vertical profiles of α532 (dotted lines) calculated from Raman lidar measurements along with the SW ARF (dashed lines) estimated from libRadtran simulations for the sites of (a) Granada, (b) Potenza, (c) Athens and (d) Limassol, at 45∘ SZA.
Finally, our interest is focused on the vertical ARF profiles from the surface (a.s.l.) up to 10 km height in the free troposphere, where airborne dust is usually found, as estimated by Scheme C at 45∘ SZA per station. The ARF profiles in the SW region, presented in Fig. 10a–d, follow the aerosol extinction vertical structure. The ARF values at the BOA are high in absolute values with a cooling behavior and decrease with increasing height, while the magnitude is proportional to the aerosol load in the whole atmospheric column. Specifically, the ARF ranges from −150.0 to −1.9 W m−2 for Granada, from −38.1 to −3.7 W m−2 for Potenza, from −64.8 to −13.2 W m−2 for Athens and from −90.3 to −28.4 W m−2 for Limassol. The corresponding ranges of α532 are 0.286–0.029, 0.268–0.088, 0.135–0.078 and 0.547–0.214 km−1, respectively. Peaks in α532 are observed usually between 2 and 6 km a.s.l., indicating the intrusion of dust that corresponds to a decrease in the solar radiation reaching the surface.
The characteristics of aerosol layers dominated by dust optical, geometrical and radiative properties over the Mediterranean region were presented in this study. A total of 51 independent aerosol lidar measurements of Saharan dust events, studied over four southern European cities, were carefully selected and analyzed. The dust layers were usually observed between ∼ 1.6 and ∼ 5 km, with δp532 and LR532 values ranging from 0.16 to 0.35 and from 35 to 75 sr, respectively, depending on the air mass mixing state. Significantly high AOT532 values (0.40±0.31) were found for Granada, indicating that the dust outbreaks occurring over this area were more intense during the studied period. Results of LR532 versus δp532 are presented in order to elucidate the difference between pure dust and dust mixtures' cases. Layers with lower δp532 (0.17±0.01), AOT532 (0.03±0.02) and thickness (786±212 m) values have shown a high dust mixing ratio, while the properties of the least mixed or non-mixed dust layers (, and thickness m) are in a good agreement with findings in the literature for pure Saharan dust cases (Tesche et al., 2009; Papayannis et al., 2009; Ansmann et al., 2012; Mona et al., 2012; Groß et al., 2011; 2013). Lidar stand-alone retrieved aerosol microphysical properties like the Reff, RRI and IRI are also differentiated by the level of mixing.
Despite the numerous individual studies, the uncertainty in estimating the aerosols' effect on climate change remains high. Therefore, coordinated and simultaneous studies using data from observation sites operating continuously, such as the EARLINET database, are necessary for investigating the climatic effect of aerosols on a larger scale. Three schemes have been implemented in our study to evaluate the ARF during the selected dust outbreaks: the model mass concentrations by BSC-DREAM8b (Scheme A), the vertical mass concentrations calculated from the dust-only component of the β532 (Scheme B) and the α532 vertical profiles along with the mean AOT532 values (Scheme C).
Lidar-derived Schemes B and C are used here as input methods in libRadtran simulations, since not many techniques have been widely used for retrieving the ARF using lidar vertical measurements as input. Their outputs are compared to the ones retrieved from Scheme A (based on BSC-DREAM8b model). On the one hand, Scheme B gives the opportunity to calculate only the DRF, even though many assumptions and constants are included in the calculation of the dust mass concentration values. On the other hand, Scheme C is more direct, since the α532 profiles are primarily used for retrieving the ARF in the SW range but without providing a separation of dust and non-dust components. Consequently, the ARF values of Scheme C seem to be overestimated compared to those of Scheme B. These two implemented schemes can contribute to the characterization of the aerosols' radiative forcing effects over the Mediterranean region, being one of the most sensitive regions to climate forcing (Kim et al., 2019). Scheme A is only recommended for cases for which no lidar measurements are available but an estimation of the ARF is required, while one should take into account all the possible underestimations that a model such as BSC-DREAM8b includes.
The ARF variations are strong (of the order of 75 %) and result from significant changes in the lidar-retrieved optical properties due to the different intensities of the studied cases (α532, β532, AOT532) or the model mass estimations from the BSC-DREAM8b. Additional variations (of the order of 40 %) in the SW range are introduced due to the variations in the available solar radiation during the day (SZA). The vertical structure of a layer that provides information about the base, the thickness and the intensity (AOT) of a dust layer is critically important, while additional information of its mixing state can be also significant in ARF and net heating rate estimations. Our findings show a much more pronounced ARF at the BOA (ranging from −40 to −13 W m−2 at SZA 25∘, from −43 to −14 W m−2 at SZA 45∘ and from −44 to −15 W m−2 at 65∘) compared to the one at the TOA (ranging from −9.5 to −1.4 W m−2 at 25∘, −16 to −3.3 W m−2 at 45∘ and −24.3 to −6.9 W m−2 at 65∘) due to the low altitude of the studied layers (usually 2–4 km).
The systematic use of remote sensing vertical profiling measurements as input to radiative transfer models is stressed in this study, creating an essential tool allowing the estimation of the radiative effects produced by different aerosol types such as dust and its mixtures on a regional and a global scale. A further investigation of aerosols' mixing state is needed since not only their optical but also their microphysical properties and radiative forcing can strongly vary, depending on the mixing types. Furthermore, we recommend that the use of remote and in situ measurements in next-generation state-of-the-art dust cycle models for the ARF should be intensified.
The aerosol lidar profiles used in this study are available upon registration from the EARLINET web page at https://data.earlinet.org/earlinet/login.zul (last access: 7 October 2020).
OS conducted the research process and performed the analysis. GSH, POA, MM, CAP, NP, SG, REM and BP contributed to the data curation and preprocessing. SS provided the SphInX software tool. OS and RF performed the libRadtran simulations. AP and PK supervised the project and helped with paper preparation. All authors contributed to the writing of the manuscript.
The authors declare that they have no conflict of interest.
This article is part of the special issue “Dust aerosol measurements, modeling and multidisciplinary effects (AMT/ACP inter-journal SI)”. It is not associated with a conference.
The authors also acknowledge the BSC-DREAM8b model, operated by the Barcelona Supercomputing Center, the NOAA Air Resources Laboratory (ARL) for the provision of the HYSPLIT model, and Google Earth and the AERONET for high-quality sun and sky photometer measurements. The Biomedical Research Foundation of the Academy of Athens (BRFAA) is acknowledged for the provision of its mobile platform to host the NTUA AIAS lidar system.
This research was funded by the COST Action “InDust” under grant agreement CA16202, supported by COST (European Cooperation in Science and Technology). Ourania Soupiona's research has been financed through a scholarship for PhD Candidates from the General Secretariat for Research and Technology (GSRT) and the Hellenic Foundation for Research and Innovation (HFRI). Alexandros Papayannis, Romanos Foskinis and Christina-Anna Papanikolaou received support from the project “PANhellenic infrastructure for Atmospheric Composition and climatE change” (MIS 5021516), which is implemented under the Action “Reinforcement of the Research and Innovation Infrastructure”, funded by the Operational Programme “Competitiveness, Entrepreneurship and Innovation” (NSRF 2014–2020) and co-financed by Greece and the European Union (European Regional Development Fund). Rodanthi-Elisavet Mamouri acknowledges the ERATOSTHENES Centre of Excellence and the “EXCELSIOR” H2020 Widespread Teaming project that has received funding from the European Union's Horizon 2020 Research and Innovation programme under grant agreement no. 857510 and from the Government of the Republic of Cyprus through the Directorate General for the European Programmes, Coordination and Development. The EARLINET lidar data were made available through the financial support by the ACTRIS Research Infrastructure Project funded by the European Union's Horizon 2020 Research and Innovation programme under grant agreement no. 654169.
This paper was edited by Matthias Tesche and reviewed by two anonymous referees.
Amiridis, V., Wandinger, U., Marinou, E., Giannakaki, E., Tsekeri, A., Basart, S., Kazadzis, S., Gkikas, A., Taylor, M., Baldasano, J., and Ansmann, A.: Optimizing CALIPSO Saharan dust retrievals, Atmos. Chem. Phys., 13, 12089–12106, https://doi.org/10.5194/acp-13-12089-2013, 2013.
Anderson, G., Clough, S., and Kneizys, F.: AFGL atmospheric constituent profiles, Tech. Rep. AFGL-TR-86- 0110, 46 pp., available at: https://apps.dtic.mil/dtic/tr/fulltext/u2/a175173.pdf (last access: 30 November 2020), 1986.
Ansmann, A., Riebesell, M., Wandinger, U., Weitkamp, C., Voss, E., Lahmann, W., and Michaelis, W.: Combined Raman Elastic-Backscatter LIDAR for Vertical Profiling of Moisture, Aerosol Extinction, Backscatter, and LIDAR Ratio, Appl. Phys. B, 55, 18–28, https://doi.org/10.1007/BF00348608, 1992.
Ansmann, A., Baars, H., Tesche, M., Müller, D., Althausen, D., Engelmann, R., Pauliquevis, T., and Artaxo, P.: Dust and smoke transport from Africa to South America: Lidar profiling over Cape Verde and the Amazon rainforest, Geophys. Res. Lett., 36, 2–6, https://doi.org/10.1029/2009GL037923, 2009.
Ansmann, A., Seifert, P., Tesche, M., and Wandinger, U.: Profiling of fine and coarse particle mass: case studies of Saharan dust and Eyjafjallajökull/Grimsvötn volcanic plumes, Atmos. Chem. Phys., 12, 9399–9415, https://doi.org/10.5194/acp-12-9399-2012, 2012.
Arthur, D. and Vassilvitskii, S.: K-means: The advantages of careful seeding, in: SODA '07: Proceedings of the eighteenth annual ACM-SIAM symposium on Discrete algorithms, 1027–1035, available at: https://theory.stanford.edu/~sergei/papers/kMeansPP-soda.pdf (last access: 30 November 2020), 2007.
Barnaba, F. and Gobbi, G. P.: Aerosol seasonal variability over the Mediterranean region and relative impact of maritime, continental and Saharan dust particles over the basin from MODIS data in the year 2001, Atmos. Chem. Phys., 4, 2367–2391, https://doi.org/10.5194/acp-4-2367-2004, 2004.
Basart, S., Pérez, C., Nickovic, S., Cuevas, E., and Baldasano, J.: Development and evaluation of the BSC-DREAM8b dust regional model over Northern Africa, the Mediterranean and the Middle East, Tellus B, 64, 18539, https://doi.org/10.3402/tellusb.v64i0.18539, 2012.
Bauer, S., Bierwirth, E., Esselborn, M., Petzold, A., Macke, A., Trautmann, T., and Wendisch, M.: Airborne spectral radiation measurements to derive solar radiative forcing of Saharan dust mixed with biomass burning smoke particles, Tellus B, 63, 742–750, https://doi.org/10.1111/j.1600-0889.2011.00567.x, 2011.
Benavent-Oltra, J. A., Román, R., Granados-Muñoz, M. J., Pérez-Ramírez, D., Ortiz-Amezcua, P., Denjean, C., Lopatin, A., Lyamani, H., Torres, B., Guerrero-Rascado, J. L., Fuertes, D., Dubovik, O., Chaikovsky, A., Olmo, F. J., Mallet, M., and Alados-Arboledas, L.: Comparative assessment of GRASP algorithm for a dust event over Granada (Spain) during ChArMEx-ADRIMED 2013 campaign, Atmos. Meas. Tech., 10, 4439–4457, https://doi.org/10.5194/amt-10-4439-2017, 2017.
Binietoglou, I., Basart, S., Alados-Arboledas, L., Amiridis, V., Argyrouli, A., Baars, H., Baldasano, J. M., Balis, D., Belegante, L., Bravo-Aranda, J. A., Burlizzi, P., Carrasco, V., Chaikovsky, A., Comerón, A., D'Amico, G., Filioglou, M., Granados-Muñoz, M. J., Guerrero-Rascado, J. L., Ilic, L., Kokkalis, P., Maurizi, A., Mona, L., Monti, F., Muñoz-Porcar, C., Nicolae, D., Papayannis, A., Pappalardo, G., Pejanovic, G., Pereira, S. N., Perrone, M. R., Pietruczuk, A., Posyniak, M., Rocadenbosch, F., Rodríguez-Gómez, A., Sicard, M., Siomos, N., Szkop, A., Terradellas, E., Tsekeri, A., Vukovic, A., Wandinger, U., and Wagner, J.: A methodology for investigating dust model performance using synergistic EARLINET/AERONET dust concentration retrievals, Atmos. Meas. Tech., 8, 3577–3600, https://doi.org/10.5194/amt-8-3577-2015, 2015.
Bravo-Aranda, J. A., Titos, G., Granados-Muñoz, M. J., Guerrero-Rascado, J. L., Navas-Guzmán, F., Valenzuela, A., Lyamani, H., Olmo, F. J., Andrey, J., and Alados-Arboledas, L.: Study of mineral dust entrainment in the planetary boundary layer by lidar depolarisation technique, Tellus B, 67, 26180, https://doi.org/10.3402/tellusb.v67.26180, 2015.
Cachorro, V. E., Toledano, C., Prats, N., Sorribas, M., Mogo, S., Berjón, A., Torres, B., Rodrigo, R., De La Rosa, J., and De Frutos, A. M.: The strongest desert dust intrusion mixed with smoke over the Iberian Peninsula registered with Sun photometry, J. Geophys. Res.-Atmos., 113, 1–19, https://doi.org/10.1029/2007JD009582, 2008.
Cazorla, A., Casquero-Vera, J. A., Román, R., Guerrero-Rascado, J. L., Toledano, C., Cachorro, V. E., Orza, J. A. G., Cancillo, M. L., Serrano, A., Titos, G., Pandolfi, M., Alastuey, A., Hanrieder, N., and Alados-Arboledas, L.: Near-real-time processing of a ceilometer network assisted with sun-photometer data: monitoring a dust outbreak over the Iberian Peninsula, Atmos. Chem. Phys., 17, 11861–11876, https://doi.org/10.5194/acp-17-11861-2017, 2017.
Córdoba-Jabonero, C., Sorribas, M., Guerrero-Rascado, J. L., Adame, J. A., Hernández, Y., Lyamani, H., Cachorro, V., Gil, M., Alados-Arboledas, L., Cuevas, E., and de la Morena, B.: Synergetic monitoring of Saharan dust plumes and potential impact on surface: a case study of dust transport from Canary Islands to Iberian Peninsula, Atmos. Chem. Phys., 11, 3067–3091, https://doi.org/10.5194/acp-11-3067-2011, 2011.
Dhakal, S.: Urban heat environment and urban sustainability, in Future Cities: Dynamics and Sustainability, edited by: Moavenzadeh, P., Hanaki, F., Baccini, K., Springer, Dordrecht, 149–172, 2002.
Drummond, A. J.: On the measurement of sky radiation, Arch. Meteorol. Geophys. Bioklimatol., 7, 413–436, 1956.
Dubovik, O., Sinyuk, A., Lapyonok, T., Holben, B. N., Mishchenko, M., Yang, P., Eck, T. F., Volten, H., Muñoz, O., Veihelmann, B., van der Zande, W. J., Leon, J. F., Sorokin, M., and Slutsker, I.: Application of spheroid models to account for aerosol particle nonsphericity in remote sensing of desert dust, J. Geophys. Res.-Atmos., 111, 1–34, https://doi.org/10.1029/2005JD006619, 2006.
Emde, C., Buras-Schnell, R., Kylling, A., Mayer, B., Gasteiger, J., Hamann, U., Kylling, J., Richter, B., Pause, C., Dowling, T., and Bugliaro, L.: The libRadtran software package for radiative transfer calculations (version 2.0.1), Geosci. Model Dev., 9, 1647–1672, https://doi.org/10.5194/gmd-9-1647-2016, 2016.
Fernández, A. J., Sicard, M., Costa, M. J., Guerrero-Rascado, J. L., Gómez-Amo, J. L., Molero, F., Barragán, R., Basart, S., Bortoli, D., Bedoya-Velásquez, A. E., Utrillas, M. P., Salvador, P., Granados-Muñoz, M. J., Potes, M., Ortiz-Amezcua, P., Martínez-Lozano, J. A., Artíñano, B., Muñoz-Porcar, C., Salgado, R., Román, R., Rocadenbosch, F., Salgueiro, V., Benavent-Oltra, J. A., Rodríguez-Gómez, A., Alados-Arboledas, L., Comerón, A., and Pujadas, M.: Extreme, wintertime Saharan dust intrusion in the Iberian Peninsula: Lidar monitoring and evaluation of dust forecast models during the February 2017 event, Atmos. Res., 228, 223–241, https://doi.org/10.1016/j.atmosres.2019.06.007, 2019.
Flaounas, E., Kotroni, V., Lagouvardos, K., Kazadzis, S., Gkikas, A., and Hatzianastassiou, N.: Cyclone contribution to dust transport over the Mediterranean region, Atmos. Sci. Lett., 16, 473–478, https://doi.org/10.1002/asl.584, 2015.
Freudenthaler, V., Esselborn, M., Wiegner, M., Heese, B., Tesche, M., Ansmann, A., Müller, D., Althausen, D., Wirth, M., Fix, A., Ehret, G., Knippertz, P., Toledano, C., Gasteiger, J., Garhammer, M., and Seefeldner, M.: Depolarization ratio profiling at several wavelengths in pure Saharan dust during SAMUM 2006, Tellus B, 61, 165–179, https://doi.org/10.1111/j.1600-0889.2008.00396.x, 2009.
Gkikas, A., Obiso, V., Pérez García-Pando, C., Jorba, O., Hatzianastassiou, N., Vendrell, L., Basart, S., Solomos, S., Gassó, S., and Baldasano, J. M.: Direct radiative effects during intense Mediterranean desert dust outbreaks, Atmos. Chem. Phys., 18, 8757–8787, https://doi.org/10.5194/acp-18-8757-2018, 2018.
Gobbi, G. P., Barnaba, F., Giorgi, R., and Santacasa, A.: Altitude-resolved properties of a Saharan dust event over the Mediterranean, Atmos. Environ., 34, 5119–5127, https://doi.org/10.1016/S1352-2310(00)00194-1, 2000.
Granados-Muñoz, M. J., Bravo-Aranda, J. A., Baumgardner, D., Guerrero-Rascado, J. L., Pérez-Ramírez, D., Navas-Guzmán, F., Veselovskii, I., Lyamani, H., Valenzuela, A., Olmo, F. J., Titos, G., Andrey, J., Chaikovsky, A., Dubovik, O., Gil-Ojeda, M., and Alados-Arboledas, L.: A comparative study of aerosol microphysical properties retrieved from ground-based remote sensing and aircraft in situ measurements during a Saharan dust event, Atmos. Meas. Tech., 9, 1113–1133, https://doi.org/10.5194/amt-9-1113-2016, 2016.
Groß, S., Freudenthaler, V., Ansmann, A., Baars, H., Haarig, M., Philipp, A., Seibert, P., Toledano, C., and Weinzierl, B.: Ground-based polarization sensitive Raman lidar measurements of dust and pollution in the Eastern Mediterranean during the A-LIFE field experiment, in Geophysical Research Abstracts, Vol. 21, EGU2019-7270,, available at: https://meetingorganizer.copernicus.org/EGU2019/EGU2019-7270.pdf (last access: 30 November 2020), 2019.
Groß, S., Esselborn, M., Weinzierl, B., Wirth, M., Fix, A., and Petzold, A.: Aerosol classification by airborne high spectral resolution lidar observations, Atmos. Chem. Phys., 13, 2487–2505, https://doi.org/10.5194/acp-13-2487-2013, 2013.
Groß, S., Tesche, M., Freudenthaler, V., Toledano, C., Wiegner, M., Ansmann, A., Althausen, D., and Seefeldner, M.: Characterization of Saharan dust, marine aerosols and mixtures of biomass-burning aerosols and dust by means of multi-wavelength depolarization and Raman lidar measurements during SAMUM 2, Tellus B, 63, 706–724, https://doi.org/10.1111/j.1600-0889.2011.00556.x, 2011.
Guerrero-Rascado, J. L., Ruiz, B., and Alados-Arboledas, L.: Multi-spectral Lidar characterization of the vertical structure of Saharan dust aerosol over southern Spain, Atmos. Environ., 42, 2668–2681, https://doi.org/10.1016/j.atmosenv.2007.12.062, 2008.
Guerrero-Rascado, J. L., Olmo, F. J., Avilés-Rodríguez, I., Navas-Guzmán, F., Pérez-Ramírez, D., Lyamani, H., and Alados Arboledas, L.: Extreme Saharan dust event over the southern Iberian Peninsula in september 2007: active and passive remote sensing from surface and satellite, Atmos. Chem. Phys., 9, 8453–8469, https://doi.org/10.5194/acp-9-8453-2009, 2009.
Haapanala, P., Räisänen, P., Kahnert, M., and Nousiainen, T.: Sensitivity of the shortwave radiative effect of dust on particle shape: Comparison of spheres and spheroids, J. Geophys. Res.-Atmos., 117, 1–12, https://doi.org/10.1029/2011JD017216, 2012.
Intergovernmental Panel on Climate Change: Climate Change 2014: Synthesis Report, IPCC, Geneva, Switzerland, available at: https://www.ipcc.ch/site/assets/uploads/2018/05/SYR_AR5_FINAL_full_wcover.pdf (last access: 30 November 2020), 2014.
ISO: Solar energy-Specification and classification of instruments for measuring hemispherical solar and direct solar radiation, Int. Organ. Stand., 9060, 11 pp., available at: https://www.iso.org/standard/16629.html (last access: 30 November 2020), 1990.
Jiménez-Guerrero, P., Pérez, C., Jorba, O., and Baldasano, J. M.: Contribution of Saharan dust in an integrated air quality system and its on-line assessment, Geophys. Res. Lett., 35, 1–6, https://doi.org/10.1029/2007GL031580, 2008.
Kim, G.-U., Seo, K.-H., and Chen, D.: Climate change over the Mediterranean and current destruction of marine ecosystem, Sci. Rep., 9, 1–9, https://doi.org/10.1038/s41598-019-55303-7, 2019.
Kim, M. H., Kim, S. W., and Omar, A. H.: Dust lidar ratios retrieved from the CALIOP measurements using the MODIS AOD as a constraint, Remote Sens., 12, 251, https://doi.org/10.3390/rs12020251, 2020.
Kipp & Zonen: Instruction Manual CM121 Shadow ring, available at: https://www.kippzonen.com/Download/46/CM121-B-C-Shadow-Ring-Manual (last access: 30 November 2020), 2004.
Koepke, P., Gasteiger, J., and Hess, M.: Technical Note: Optical properties of desert aerosol with non-spherical mineral particles: data incorporated to OPAC, Atmos. Chem. Phys., 15, 5947–5956, https://doi.org/10.5194/acp-15-5947-2015, 2015.
Kokkalis, P., Jassar, H. K. Al, Solomos, S., Raptis, P., Hendi, H. Al, Amiridis, V., Papayannis, A., Al Sarraf, H., and Dimashki, M. Al: Long-Term Ground-Based Measurements of Aerosol Optical Depth over Kuwait City, Remote Sens., 10, 1807, https://doi.org/10.3390/rs10111807, 2018.
Kosmopoulos, P. G., Kazadzis, S., Taylor, M., Raptis, P. I., Keramitsoglou, I., Kiranoudis, C., and Bais, A. F.: Assessment of surface solar irradiance derived from real-time modelling techniques and verification with ground-based measurements, Atmos. Meas. Tech., 11, 907–924, https://doi.org/10.5194/amt-11-907-2018, 2018.
Landulfo, E., Papayannis, A., Artaxo, P., Castanho, A. D. A., de Freitas, A. Z., Souza, R. F., Vieira Junior, N. D., Jorge, M. P. M. P., Sánchez-Ccoyllo, O. R., and Moreira, D. S.: Synergetic measurements of aerosols over São Paulo, Brazil using LIDAR, sunphotometer and satellite data during the dry season, Atmos. Chem. Phys., 3, 1523–1539, https://doi.org/10.5194/acp-3-1523-2003, 2003.
Madonna, F., Amodeo, A., Boselli, A., Cornacchia, C., Cuomo, V., D'Amico, G., Giunta, A., Mona, L., and Pappalardo, G.: CIAO: the CNR-IMAA advanced observatory for atmospheric research, Atmos. Meas. Tech., 4, 1191–1208, https://doi.org/10.5194/amt-4-1191-2011, 2011.
Mamouri, R. E., Ansmann, A., Nisantzi, A., Kokkalis, P., Schwarz, A., and Hadjimitsis, D.: Low Arabian dust extinction-to-backscatter ratio, Geophys. Res. Lett., 40, 4762–4766, https://doi.org/10.1002/grl.50898, 2013.
Mandija, F., Guerrero-Rascado, J. L., Lyamani, H., Granados-Muñoz, M. J., and Alados-Arboledas, L.: Synergic estimation of columnar integrated aerosol properties and their vertical resolved profiles in respect to the scenarios of dust intrusions over Granada, Atmos. Environ., 145, 439–454, https://doi.org/10.1016/j.atmosenv.2016.09.045, 2016.
Mandija, F., Sicard, M., Comerón, A., Alados-Arboledas, L., Guerrero-Rascado, J. L., Bravo-Aranda, J. A., Bravo-Aranda, J. A., Granados-Muñoz, M. J., Lyamani, H., Muñoz Porcar, C., Rocadenbosch, F., Rodríguez, A., Valenzuela, A., and García Vizcaíno, D.: Origin and pathways of the mineral dust transport to two Spanish EARLINET sites: Effect on the observed columnar and range-resolved dust optical properties, Atmos. Res., 187, 69–83, https://doi.org/10.1016/j.atmosres.2016.12.002, 2017.
Mattis, I., Ansmann, A., Müller, D., Wandinger, U., and Althausen, D.: Dual-wavelength Raman lidar observations of the extinction-to-backscatter ratio of Saharan dust, Geophys. Res. Lett., 29, 1306, https://doi.org/10.1029/2002gl014721, 2002.
Mayer, B., Kylling, A., Emde, C., Buras, R., Hamann, U., Gasteiger, J., and Richter, B.: libRadtran User's Guide, Ed. Libr. version 2.0.2, 155 pp., available at: http://www.libradtran.org/doc/libRadtran.pdf (last access: 30 November 2020), 2017.
Meloni, D., Junkermann, W., di Sarra, A., Cacciani, M. De Silvestri, L., Di Iorio, T. Estellés, V., Gómez-Amo, J. L., Pace, G., and Sferlazzo, D. M.: Altitude-resolved shortwave and longwave radiative effects of desert dust in the Mediterranean during the GAMARF campaign: Indications of a net daily cooling in the dust layer, J. Geophys. Res.-Atmos., 120, 3386–3407, https://doi.org/10.1002/2014JD022312, 2015.
Meloni, D., di Sarra, A., DeLuisi, J., Di Iorio, T., Fiocco, G., Junkermann, W., and Pace, G.: Tropospheric aerosols in the Mediterranean: 2. Radiative effects through model simulations and measurements, J. Geophys. Res., 108, 4317, https://doi.org/10.1029/2002jd002807, 2003.
Meloni, D., di Sarra, A., Brogniez, G., Denjean, C., De Silvestri, L., Di Iorio, T., Formenti, P., Gómez-Amo, J. L., Gröbner, J., Kouremeti, N., Liuzzi, G., Mallet, M., Pace, G., and Sferlazzo, D. M.: Determining the infrared radiative effects of Saharan dust: a radiative transfer modelling study based on vertically resolved measurements at Lampedusa, Atmos. Chem. Phys., 18, 4377–4401, https://doi.org/10.5194/acp-18-4377-2018, 2018.
Michaelides, S., Karacostas, T., Sánchez, J. L., Retalis, A., Pytharoulis, I., Homar, V., Romero, R., Zanis, P., Giannakopoulos, C., Bühl, J., Ansmann, A., Merino, A., Melcón, P., Lagouvardos, K., Kotroni, V., Bruggeman, A., López-Moreno, J. I., Berthet, C., Katragkou, E., Tymvios, F., Hadjimitsis, D. G., Mamouri, R. E., and Nisantzi, A.: Reviews and perspectives of high impact atmospheric processes in the Mediterranean, Atmos. Res., 208, 4–44, https://doi.org/10.1016/j.atmosres.2017.11.022, 2018.
Mishra, A. K., Klingmueller, K., Fredj, E., Lelieveld, J., Rudich, Y., and Koren, I.: Radiative signature of absorbing aerosol over the eastern Mediterranean basin, Atmos. Chem. Phys., 14, 7213–7231, https://doi.org/10.5194/acp-14-7213-2014, 2014.
Mona, L., Papagiannopoulos, N., Basart, S., Baldasano, J., Binietoglou, I., Cornacchia, C., and Pappalardo, G.: EARLINET dust observations vs. BSC-DREAM8b modeled profiles: 12-year-long systematic comparison at Potenza, Italy, Atmos. Chem. Phys., 14, 8781–8793, https://doi.org/10.5194/acp-14-8781-2014, 2014.
Mona, L., Amodeo, A., Pandolfi, M., and Pappalardo, G.: Saharan dust intrusions in the Mediterranean area: Three years of Raman lidar measurements, J. Geophys. Res.-Atmos., 111, 1–13, https://doi.org/10.1029/2005JD006569, 2006.
Mona, L., Liu, Z., Müller, D., Omar, A., Papayannis, A., Pappalardo, G., Sugimoto, N., and Vaughan, M.: Lidar measurements for desert dust characterization: An overview, Adv. Meteorol., 2012, 356265 , https://doi.org/10.1155/2012/356265, 2012.
Müller, D., Ansmann, A., Mattis, I., Tesche, M., Wandinger, U., Althausen, D., and Pisani, G.: Aerosol-type-dependent lidar ratios observed with Raman lidar, J. Geophys. Res.-Atmos., 112, D16202, https://doi.org/10.1029/2006JD008292, 2007.
Navas-Guzmán, F., Bravo-Aranda, J. A., Guerrero-Rascado, J. L., Granados-Muñoz, M. J., and Alados-Arboledas, L.: Statistical analysis of aerosol optical properties retrieved by Raman lidar over Southeastern Spain, Tellus B, 65, 21234, https://doi.org/10.3402/tellusb.v65i0.21234, 2013.
Nisantzi, A., Mamouri, R. E., Ansmann, A., Schuster, G. L., and Hadjimitsis, D. G.: Middle East versus Saharan dust extinction-to-backscatter ratios, Atmos. Chem. Phys., 15, 7071–7084, https://doi.org/10.5194/acp-15-7071-2015, 2015.
Papadimas, C. D., Hatzianastassiou, N., Matsoukas, C., Kanakidou, M., Mihalopoulos, N., and Vardavas, I.: The direct effect of aerosols on solar radiation over the broader Mediterranean basin, Atmos. Chem. Phys., 12, 7165–7185, https://doi.org/10.5194/acp-12-7165-2012, 2012.
Papayannis, A., Mamouri, R. E., Amiridis, V., Kazadzis, S., Pérez, C., Tsaknakis, G., Kokkalis, P., and Baldasano, J. M.: Systematic lidar observations of Saharan dust layers over Athens, Greece in the frame of EARLINET project (2004–2006), Ann. Geophys., 27, 3611–3620, https://doi.org/10.5194/angeo-27-3611-2009, 2009.
Papayannis, A., Kokkalis, P., Mylonaki, M., Soupiona, R., Papanikolaou, C. A., and Foskinis, R.: Recent upgrades of the EOLE and AIAS lidar systems of the National Technical University of Athens operating since 2000 in Athens, Greece, Eur. Phys. j. Conf., 237, 4–7, 2020.
Pappalardo, G., Amodeo, A., Apituley, A., Comeron, A., Freudenthaler, V., Linné, H., Ansmann, A., Bösenberg, J., D'Amico, G., Mattis, I., Mona, L., Wandinger, U., Amiridis, V., Alados-Arboledas, L., Nicolae, D., and Wiegner, M.: EARLINET: towards an advanced sustainable European aerosol lidar network, Atmos. Meas. Tech., 7, 2389–2409, https://doi.org/10.5194/amt-7-2389-2014, 2014.
Pérez, C., Nickovic, S., Pejanovic, G., Baldasano, J. M., and Özsoy, E.: Interactive dust-radiation modeling: A step to improve weather forecasts, J. Geophys. Res.-Atmos., 111, D16206, https://doi.org/10.1029/2005JD006717, 2006.
Petzold, A., Veira, A., Mund, S., Esselborn, M., Kiemle, C., Weinzierl, B., Hamburger, T., Ehret, G., Lieke, K., and Kandler, K.: Mixing of mineral dust with urban pollution aerosol over Dakar (Senegal): Impact on dust physico-chemical and radiative properties, Tellus B, 63, 619–634, https://doi.org/10.1111/j.1600-0889.2011.00547.x, 2011.
Quijano, A. L., Sokolik, I. N., and Toon, O. B.: Radiative heating rates and direct radiative forcing by mineral dust in cloudy atmospheric conditions, J. Geophys. Res.-Atmos., 105, 12207–12219, https://doi.org/10.1029/2000JD900047, 2000.
Rittmeister, F., Ansmann, A., Engelmann, R., Skupin, A., Baars, H., Kanitz, T., and Kinne, S.: Profiling of Saharan dust from the Caribbean to western Africa – Part 1: Layering structures and optical properties from shipborne polarization/Raman lidar observations, Atmos. Chem. Phys., 17, 12963–12983, https://doi.org/10.5194/acp-17-12963-2017, 2017.
Rother, T. and Kahnert, M.: Electromagnetic Wave Scattering on Nonspherical Particles, Springer Series in Optical Sciences, Springer Verlag, Berlin, Heidelberg, 2009.
Saidou Chaibou, A. A., Ma, X., and Sha, T.: Dust radiative forcing and its impact on surface energy budget over West Africa, Sci. Rep., 10, 1–18, https://doi.org/10.1038/s41598-020-69223-4, 2020.
Salvador, P., Alonso-Pérez, S., Pey, J., Artíñano, B., de Bustos, J. J., Alastuey, A., and Querol, X.: African dust outbreaks over the western Mediterranean Basin: 11-year characterization of atmospheric circulation patterns and dust source areas, Atmos. Chem. Phys., 14, 6759–6775, https://doi.org/10.5194/acp-14-6759-2014, 2014.
Samaras, S.: Microphysical retrieval of non-spherical aerosol particles using regularized inversion of multi-wavelength lidar data, PhD Thesis, Mathematik, Institut für Probleme, Numerische Mathematik – Inverse, University of Potsdam, Germany, 2016.
Shang, X., Xia, H., Dou, X., Shangguan, M., Li, M., and Wang, C.: Adaptive inversion algorithm for 1.5µm visibility lidar incorporating in situ Angstrom wavelength exponent, Opt. Commun., 418, 129–134, https://doi.org/10.1016/j.optcom.2018.03.009, 2018.
Sicard, M., Bertolín, S., Mallet, M., Dubuisson, P., and Comerón, A.: Estimation of mineral dust long-wave radiative forcing: sensitivity study to particle properties and application to real cases in the region of Barcelona, Atmos. Chem. Phys., 14, 9213–9231, https://doi.org/10.5194/acp-14-9213-2014, 2014.
Solomos, S., Bougiatioti, A., Soupiona, O., Papayannis, A., Mylonaki, M., and Papanikolaou, C.: Effects of regional and local atmospheric dynamics on the aerosol and CCN load over Athens, Atmos. Environ., 197, 53–65, https://doi.org/10.1016/j.atmosenv.2018.10.025, 2019.
Soupiona, O., Papayannis, A., Kokkalis, P., Mylonaki, M., Tsaknakis, G., Argyrouli, A., and Vratolis, S.: Long-term systematic profiling of dust aerosol optical properties using the EOLE NTUA lidar system over Athens, Greece (2000–2016), Atmos. Environ., 183, 165–174, https://doi.org/10.1016/j.atmosenv.2018.04.011, 2018.
Soupiona, O., Samaras, S., Ortiz-Amezcua, P., Böckmann, C., Papayannis, A., Moreira, G. A., Benavent-Oltra, J. A., Guerrero-Rascado, J. L., Bedoya-Velásquez, A. E., Olmo, F. J., Román, R., Kokkalis, P., Mylonaki, M., Alados-Arboledas, L., Papanikolaou, C. A., and Foskinis, R.: Retrieval of optical and microphysical properties of transported Saharan dust over Athens and Granada based on multi-wavelength Raman lidar measurements: Study of the mixing processes, Atmos. Environ., 214, 116824, https://doi.org/10.1016/j.atmosenv.2019.116824, 2019.
Stein, A. F., Draxler, R. R., Rolph, G. D., Stunder, B. J. B., Cohen, M. D., and Ngan, F.: NOAA's hysplit atmospheric transport and dispersion modeling system, B. Am. Meteorol. Soc., 96, 2059–2077, https://doi.org/10.1175/BAMS-D-14-00110.1, 2015.
Tegen, I., Bierwirth, E., Heinold, B., Helmert, J., and Wendisch, M.: Effect of measured surface albedo on modeled Saharan dust solar radiative forcing, J. Geophys. Res.-Atmos., 115, 1–15, https://doi.org/10.1029/2009JD013764, 2010.
Tesche, M., Ansmann, A., Müller, D., Althausen, D., Engelmann, R., Freudenthaler, V., and Groß, S.: Vertically resolved separation of dust and smoke over Cape Verde using multiwavelength Raman and polarization lidars during Saharan Mineral Dust Experiment 2008, J. Geophys. Res.-Atmos., 114, D13202, https://doi.org/10.1029/2009JD011862, 2009.
Tesche, M., Gross, S., Ansmann, A., Müller, D., Althausen, D., Freudenthaler, V., and Esselborn, M.: Profiling of Saharan dust and biomass-burning smoke with multiwavelength polarization Raman lidar at Cape Verde, Tellus B, 63, 649–676, https://doi.org/10.1111/j.1600-0889.2011.00548.x, 2011.
Tsekeri, A., Lopatin, A., Amiridis, V., Marinou, E., Igloffstein, J., Siomos, N., Solomos, S., Kokkalis, P., Engelmann, R., Baars, H., Gratsea, M., Raptis, P. I., Binietoglou, I., Mihalopoulos, N., Kalivitis, N., Kouvarakis, G., Bartsotas, N., Kallos, G., Basart, S., Schuettemeyer, D., Wandinger, U., Ansmann, A., Chaikovsky, A. P., and Dubovik, O.: GARRLiC and LIRIC: strengths and limitations for the characterization of dust and marine particles along with their mixtures, Atmos. Meas. Tech., 10, 4995–5016, https://doi.org/10.5194/amt-10-4995-2017, 2017.
Valenzuela, A., Costa, M. J., Guerrero-Rascado, J. L., Bortoli, D., and Olmo, F. J.: Solar and thermal radiative effects during the 2011 extreme desert dust episode over Portugal, Atmos. Environ., 148, 16–29, https://doi.org/10.1016/j.atmosenv.2016.10.037, 2017.
Veselovskii, I., Goloub, P., Podvin, T., Bovchaliuk, V., Derimian, Y., Augustin, P., Fourmentin, M., Tanre, D., Korenskiy, M., Whiteman, D. N., Diallo, A., Ndiaye, T., Kolgotin, A., and Dubovik, O.: Retrieval of optical and physical properties of African dust from multiwavelength Raman lidar measurements during the SHADOW campaign in Senegal, Atmos. Chem. Phys., 16, 7013–7028, https://doi.org/10.5194/acp-16-7013-2016, 2016.
Veselovskii, I., Hu, Q., Goloub, P., Podvin, T., Korenskiy, M., Derimian, Y., Legrand, M., and Castellanos, P.: Variability in lidar-derived particle properties over West Africa due to changes in absorption: towards an understanding, Atmos. Chem. Phys., 20, 6563–6581, https://doi.org/10.5194/acp-20-6563-2020, 2020.
Weinzierl, B., Sauer, D., Esselborn, M., Petzold, A., Veira, A., Rose, M., Mund, S., Wirth, M., Ansmann, A., Tesche, M., Gross, S., and Freudenthaler, V.: Microphysical and optical properties of dust and tropical biomass burning aerosol layers in the Cape Verde region-an overview of the airborne in situ and lidar measurements during SAMUM-2, Tellus B, 63, 589–618, https://doi.org/10.1111/j.1600-0889.2011.00566.x, 2011.
World Meteorological Organization: Guide to meteorological instruments and methods of observation, WMO-No. 8, available at: https://library.wmo.int/doc_num.php?explnum_id=10179 (last access: 30 November 2020), 2018.