the Creative Commons Attribution 4.0 License.
the Creative Commons Attribution 4.0 License.
 | 07 Dec 2020
North African mineral dust sources: new insights from a combined analysis based on 3D dust aerosol distributions, surface winds and ancillary soil parameters
Sophie Vandenbussche
Sieglinde Callewaert
Kerstin Schepanski
Martine De Mazière
Mineral dust aerosol is a key player in the climate system. Determining dust sources and the spatio-temporal variability of dust emission fluxes is essential for estimating the impact of dust on the atmospheric radiation budget, cloud and precipitation formation processes, the bio-productivity and, ultimately, the carbon cycle. Although much effort has been put into determining dust sources from satellite observations, geo-locating active dust sources is still challenging and uncertainties in space and time are evident. One major source of uncertainty is the lack of clear differentiation between near-source dust aerosol and transported dust aerosol. In order to reduce this uncertainty, we use 3D information on the distribution of dust aerosol suspended in the atmosphere calculated from spectral measurements obtained by the Infrared Atmospheric Sounding Interferometer (IASI) by using the Mineral Aerosols Profiling from Infrared Radiance (MAPIR) algorithm. In addition to standard dust products from satellite observations, which provide 2D information on the horizontal distribution of dust, MAPIR allows for the retrieval of additional information on the vertical distribution of dust plumes. This ultimately enables us to separate between near-source and transported dust plumes. Combined with information on near-surface wind speed and surface properties, low-altitude dust plumes can be assigned to dust emission events and low-altitude transport regimes can be excluded. Consequently, this technique will reduce the uncertainty in automatically geo-locating active dust sources. The findings of our study illustrate the spatio-temporal distribution of North African dust sources based on 9 years of data, allowing for the observation of a full seasonal cycle of dust emissions, differentiating morning and afternoon/evening emissions and providing a first glance at long-term changes. In addition, we compare the results of this new method to the results from Schepanski et al. (2012), who manually identified dust sources from Spinning Enhanced Visible and InfraRed Imager (SEVIRI) red–green–blue (RGB) images. The comparison illustrates that each method has its strengths and weaknesses that must be taken into account when using the results. This study is of particular importance for understanding future environmental changes due to a changing climate.
- Article
(21840 KB) - Full-text XML
- BibTeX
- EndNote


Mineral dust aerosols are one of the most prominent types of tropospheric aerosols accounting for about 35 % of the total aerosol mass with a diameter smaller than 10 µm (Boucher et al., 2013). Dust aerosols are mainly observed in the so-called “dust belt”, a band of Northern hemispheric, subtropical deserts stretching from the Saharan desert, over the Middle East and Arabia to the Asian deserts. They are mineral particles uplifted from bare soils by sufficiently strong winds. They may stay in suspension for a few days up to even weeks, allowing for transport over thousands of kilometres – for example, from the Sahara across the Atlantic Ocean all the way to the Americas. Dust aerosols are most often found at altitudes below 7 km (Tsamalis et al., 2013) due to their wind-driven emission mechanism and particle size, contrary to mineral ash particles that may be found at altitudes of up to 20 km (Maes et al., 2016).
Mineral dust emission results from the wind erosion of bare surfaces and generally refers to the eventual entrainment of soil particles into the atmosphere. Three different mechanisms have been highlighted for these emissions, depending on the particle size and soil composition (e.g. Gherboudj et al., 2016; Marticoréna, 2014): creeping for the largest particles, saltation for the middle size particles (diameter between 70 and 500 µm) and aerodynamic direct entrainment for the smallest particles. Creeping occurs for particles that cannot be uplifted, as they are either too large and/or the wind speeds are too low; they are rolled over the surface and may induce the injection of smaller particles upon inelastic impact. Saltation is considered the most efficient emission mechanism (50 % to 90 %; Gherboudj et al., 2016) and consists of subsequent short jumps along the surface that induce disaggregation in smaller particles or the emission of other particles. This process is also called sand blasting. The third emission mechanism, aerodynamic direct entrainment, occurs when fine particles are directly uplifted by turbulent eddies or strong winds; it is reported to account for only about 1 % of the total dust emissions (Gherboudj et al., 2016).
Dust emission can be considered as a threshold problem: a certain amount of momentum is required to be transferred from the atmosphere onto the soil surface in order to mobilize soil particles and eventually initiate the dust emission process. The momentum required is provided by processes such as horizontal wind, shear stress or turbulence. The amount of momentum needed to initiate particle mobilization depends on the soil surface properties, including aerodynamic roughness, particle size distribution, soil type and soil moisture. Below the so-called threshold for wind erosion (Marticoréna, 2014) or the threshold wind friction velocity (Gherboudj et al., 2016), particles cannot be entrained. This threshold is reported to be in the range of some 5 to 6 m s−1 (Marsham et al., 2013; Marticoréna, 2014). As the vertical dust emission flux scales non-linearly with near-surface wind speed, the most intense emissions occur when the surface wind exceeds 8 to 10 m s−1 (Kocha et al., 2013; Marticoréna, 2014).
Two major mechanisms are known to be responsible for intense surface winds: the turbulence-induced breakdown of the nocturnal low-level jets (LLJ) and convective events (e.g. Schepanski et al., 2009; Knippertz and Todd, 2012; Heinold et al., 2013; Allen et al., 2013). LLJs are strong horizontal winds that form in the lower troposphere, usually at the top of the nocturnal boundary layer within the residual layer if they form during the night, or at the top of the turbulent and mixed boundary layer if they form during the day. After sunrise, the onset of solar heating causes turbulent mixing resulting in intermittent high surface wind speeds during the mid-morning. This mechanism has been shown to be a significant player in Saharan dust emission and to have a significant seasonal cycle (e.g. Schepanski et al., 2009; Fiedler et al., 2013). LLJs are frequently present during the winter over the Bodélé Depression and other source areas in the central and eastern Sahara as well as during the summer over the western Sahara, the Sahel and northern Libya (Fiedler et al., 2013). Convective events driving dust emission have many different origins and occur at different scales, from the microscale to the synoptic scale (Knippertz and Todd, 2012; Knippertz, 2014). For example, at the synoptic scale, cyclones form south of the Atlas Mountains during spring eventually moving eastward along the Mediterranean coast (Schepanski et al., 2009; Knippertz and Todd, 2012). A prominent example of meteorological drivers at the mesoscale (up to 500 km) are the so-called “haboobs”: dust fronts forming due to the down-burst of cold, humid and, thus, dense air related to deep moist convection that grows during the summer late afternoons and nights (Schepanski et al., 2009; Knippertz and Todd, 2012; Heinold et al., 2013). They occur frequently in the Sahel and southern Sahara (Knippertz, 2014) and can raise substantial walls of dust (Allen et al., 2013). At the very small microscale, there are the “dust devils” (compact rotating dry dust plumes of about 10 m diameter) and larger non-rotating dusty plumes (100 m diameter) occurring at the timescale of some 10 min to 1 h (Knippertz and Todd, 2012; Knippertz, 2014). They occur under dry conditions and intense surface heating, and they may reach an altitude of 1 to 2 km (Allen et al., 2013). They are extremely difficult to detect from satellite data due to their small scale in both time and space.
Dust emissions are known to follow a diurnal cycle rather than being equally distributed over the day (e.g. Schepanski et al., 2009; Heinold et al., 2013; Kocha et al., 2013; Banks et al., 2014) with two maxima: a sharp and temporally rather distinct maximum during the local morning hours, usually attributed to the turbulence-induced breakdown of the LLJ, and a temporally extended maximum during the late afternoon and night, mostly due to convective events (Heinold et al., 2013). Each source area is susceptible to experience either one or both of these mechanisms, with possible seasonal variations regarding predominance linked to wind seasonality (Schepanski et al., 2017).
Although mineral aerosols are in essence natural particles emitted through natural mechanisms, part of their emissions and, therefore, part of the atmospheric dust burden is induced by human activities. Indeed, these activities disturb the soil and modify the vegetation cover, often leading to increasing surface erodibility potentials. Besides human-induced changes, dust emissions are also indirectly impacted by environmental changes due to climate change in general, which impact the soil temperature and soil moisture, and ultimately the wind patterns (Choobari et al., 2014). Ginoux et al. (2012) used MODIS (Moderate Resolution Imaging Spectroradiometer) data to extract information on mineral dust sources and distinguished between the natural and anthropogenic origin of the emissions. They showed that most of the dust sources in the Sahel can be linked to human activities, whereas most of the sources in the Sahara are purely natural.
African dust sources can be studied using in situ measurements, satellite measurements or models. There is a significant variation in the results of different studies found in the literature, which is linked to the strengths and weaknesses of each measurement system and of each analysis method as well as to the local time of the measurements. Schepanski et al. (2012) compared two different approaches to identifying dust sources: (1) manual plume backtracking to their point of first appearance by examining 15 min Meteosat Second Generation (MSG) SEVIRI infrared dust imagery (MSG-SEVIRI) and (2) relating the frequency of occurrence of increased dust aerosol optical depths (AOD) to dust source activity using daily (noontime) MODIS Deep Blue AOD and the Ozone Monitoring Instrument (OMI) aerosol index (AI). The comparison illustrates significant differences among the two dust source identification techniques, largely due to the temporal offset between dust source activation (morning) and the satellite overpass (noon). Ginoux et al. (2012) used MODIS Deep Blue data to retrieve dust sources and attributed them to anthropogenic or natural origins with the help of land use and hydrology data. Ashpole and Washington (2013) developed a way of automatically tracking dust plumes observed by SEVIRI to identify their source region and applied it to the summertime western Sahara. Recently, Caton Harrison et al. (2019) improved that method and extended the time period analysed, still focusing on the summertime western Sahara. Todd and Cavazos-Guerra (2016) used Cloud-Aerosol Lidar with Orthogonal Polarization (CALIOP) aerosol vertical profiles to calculate a dust emission index for the Sahara during summer. Parajuli and Yang (2017) jointly analysed MODIS Deep Blue AOD with wind and surface fields for the Bodélé area. Parajuli and Zender (2017) further connected the dust emission to local geomorphologic features. This is only a subsample of the existing dust source analyses based on satellite measurements, showing a growing interest in the scientific community, especially with respect to new analyses combining different data sets.
Here, we propose a novel approach to automatically identify dust sources from a twice daily 3D dust aerosol concentration data set retrieved from measurements obtained by the Infrared Atmospheric Sounding Interferometer (IASI) flying aboard the sun-synchronous Metop satellites by using the Mineral Aerosol Profiling from Infrared Radiances (MAPIR) retrieval algorithm (Callewaert et al., 2019) to identify low-altitude (< 1 km above ground level) dust events. These measurements are acquired at 09:30 and 21:00 LST (local solar time), relatively soon after the expected dust emission peaks. In a series of analysis steps, we use additional surface wind speed data and surface characteristics to distinguish between transported dust aerosols (at any altitude, also including those at low altitude) and dust aerosols over sources. At the end of the process, we obtain a selection of low-altitude dust plumes whose geolocation can be considered as an active dust source. We discuss these results for North Africa in terms of dust emission hot spots, seasonal variability, diurnal cycle and long-term evolution. A special emphasis is given to the Sahel, which is located at the desert margin – a location that, first, experiences an alternation between dry and wet season and, second, is sensitive to environmental changes due to a changing climate. Finally, we compare the obtained dust source data set to source locations obtained from the manual backtracking of plumes observed with the 15 min SEVIRI infrared dust index (Schepanski et al., 2007, 2009, 2012).
The Infrared Atmospheric Sounding Interferometer (IASI) was developed by the Centre National d'Etudes Spatiales (CNES) and is operated by the European Organisation for the Exploitation of Meteorological Satellites (EUMETSAT). IASI is flying on board the Metop satellite series on a mid-morning sun-synchronous polar orbit (respective Equator-crossing times of 09:30 and 21:30 LST ). IASI is a Fourier transform Michelson interferometer measuring, at nadir, Earth and atmospheric emissions and solar backscatter between 645 and 2760 cm−1. IASI has a swath width of 2200 km that corresponds to a maximum viewing angle of 48.3∘ on both sides off nadir. Each across-track scan is composed of 30 elementary fields of view, each composed of 4 instantaneous fields of view of 12 km diameter at the sub-satellite point, growing to an ellipse with axes of 39 km by 20 km at the edge of the scan line (Clerbaux et al., 2009). IASI provides continuous and consistent data time series developed to match the needs of climate studies. Measurements are available from 2007 to the present and are planned until at least 2022 using three successive identical instruments flying on board Metop-A, B and C. The long-term future is also ensured by the second-generation instruments currently in preparation, which have a higher spectral resolution and a better signal-to-noise ratio.
The twice daily overpass, one overpass during the mid-morning and one during the late afternoon, makes IASI measurements particularly suited for studying African dust emission. As outlined above, northern African dust emission shows a diurnal cycle with two distinct peaks, one dominating during the morning and a second one during the afternoon/evening (Schepanski et al., 2009, 2017; Heinold et al., 2013). As IASI passes over at 09:30 LST (local solar time), the mid-morning measurements coincide with the mid-morning dust emission peak driven by the breakdown of the nocturnal LLJs. This process is responsible for a significant part of the dust uplift (Schepanski et al., 2009). The evening measurements at 21:30 LST occur around the time of the second dust emission peak in the afternoon/evening (Heinold et al., 2013). Thus, using IASI provides information at times right after the two diurnal dust emission peaks. IASI, therefore, has the potential to capture atmospheric dust concentrations close to the actual dust emission event, allowing for a more accurate estimate of the amount of dust emitted than instruments measuring in the mid-afternoon (13:30 LST) such as MODIS on board Aqua, CALIOP or OMI, which mainly observe dust downwind from sources (Schepanski et al., 2012).
Almost all studies aimed at investigating dust sources that have been undertaken to date have used satellite total column products and have not distinguished between different aerosol species nor included any vertical information such as the aerosol layer altitude. In order to distinguish between dust plumes originating from local emissions and those being advected from distant sources, criteria based on the Ångström exponent are applied. The Ångström exponent is a proxy for the particle size, and the particle size distribution changes with residence time and transport distance: large particles drop out more quickly (Allen et al., 2013). However, the Ångström exponent criterion is not applicable for night-time measurements, as the retrieval of the Ångström exponent is defined based on solar wavelengths.
By contrast, IASI measurements at thermal infrared (TIR) wavelengths offer the advantage that the TIR atmospheric window is sensitive only to coarse-mode aerosols, including mineral aerosols (desert dust and volcanic ash) and sea spray aerosols. The latter do not have absorption bands in the TIR; therefore, only their scattering effect could be seen, which is found to remain rather low. In addition, sea spray aerosols are also not expected above dust source areas and can therefore be neglected in this study. Mineral aerosols have significant absorption bands in the TIR. Thus, IASI measurements allow for the derivation of a mineral aerosol product with no influence from other aerosol types that are possibly present over source areas; therefore, these measurements provide a good basis for assessing dust sources.
In a nutshell, the strengths of IASI data for dust source studies are as follows: (1) IASI already provides 10 years of data with more to come; (2) the entire globe is covered twice per day at very interesting times with respect to the monitoring of dust emissions; and (3) the data set can be used to continuously and consistently retrieve the vertical distribution of mineral aerosols (see Sect. 2.1).
2.1 IASI/MAPIR 3D dust concentration data
A global data set of vertical profiles of dust concentrations was obtained from IASI cloud-free measurements using the Mineral Aerosol Profiling from Infrared Radiances (MAPIR) algorithm. MAPIR version 4.1, which was used in this work, is fully described in Callewaert et al. (2019); therefore, we only provide a short summary of the main scientific features of the algorithm here. MAPIR operates in three retrieval windows in the TIR spectral window: 905 to 927 cm−1, 1098 to 1123 cm−1 and 1202 to 1204 cm−1. All radiative transfer calculations are done with the Radiative Transfer for TOVS (RTTOV; version 12) and are performed in-line for each retrieval. Dust aerosols are parameterized as spheres with a log-normal size distribution with a median radius of 0.6 µm and a geometric standard deviation of 2, corresponding to an effective radius of 2 µm. The dust aerosol refractive index (RI) is taken from the Gestion et Etudes des Informations Spectroscopiques Atmosphériques (GEISA; Jacquinet-Husson et al., 2011) and the HIgh-resolution TRANsmission database (HITRAN; Massie, 1994; Massie and Goldman, 2003) dust-like RI based on measurements by Volz (1972, 1973) and Shettle and Fenn (1979).
The MAPIR retrieval is based on the optimal estimation method (OEM; Rodgers, 2000) and iteratively adjusts a state vector, composed of eight variables: the surface temperature (∘) and the dust aerosol concentration at the centre of seven 1 km thick layers from an altitude of 0.5 to 6.5 km. The a priori dust aerosol vertical profiles are derived from the LIdar climatology of Vertical Aerosol Structure (LIVAS) monthly climatology, obtained from CALIOP data (Amiridis et al., 2015) from 2007 to 2014.
After the retrieval of mineral dust, a general quality control on the retrieval results tests the goodness of the fit: the root mean square of the spectral residuals (between the measured spectrum and the modelled spectrum after the retrieval) must be lower than 1 K. In addition, the total AOD at 10 µm should be 5 at most, and the retrieved surface temperature must be between 200 and 350 K. The two latter tests are designed to reject cloudy spectra that were not detected by the EUMETSAT IASI cloud product.
2.2 Dust source activation frequency inferred from MSG-SEVIRI observations
Meteosat Second Generation (MSG) Spinning Enhanced Visible and InfraRed Imager (SEVIRI) measurements at infrared wavelengths centred around 8.7, 10.8 and 12.0 µm were used to infer multi-annual information on dust source activity (Schepanski et al., 2007, 2009, 2012). As described by Schepanski et al. (2007), 15 min dust red–green–blue (RGB) images were analysed manually for identification and individual backtracking of dust plumes to their point of origin, which then was recorded as the initial dust source. By applying this visual backtracking method, an hourly (2006: 3-hourly) data set on dust source activation frequencies (DSAFs) was compiled (Schepanski et al., 2012) covering the 4-year period from March 2006 to February 2010.
2.3 ECMWF ERA5 surface winds
The 10 m wind speed fields used to test whether local atmospheric conditions fostering dust emission were fulfilled were obtained from the European Centre for Medium-Range Weather Forecasts (ECMWF) ERA5 reanalysis data, through the Climate Data Store (https://cds.climate.copernicus.eu/, last access: 3 December 2019). The data are available at an hourly time resolution.
2.4 ESA CCI land cover and NDVI data
The land cover and vegetation (normalized difference vegetation index – NDVI) data were obtained from the corresponding European Space Agency Climate Change Initiative (ESA CCI) land cover project (http://www.esa-landcover-cci.org, last access: 22 June 2016). The land cover data are available globally at a 300 m spatial resolution and as 5-year averages for three epochs centred on the years 2000, 2005 and 2010. We used the last one as it best covers the time period of the IASI data. The NDVI climatology describes the natural variability of vegetation cover, snow cover and fire scars (burned areas) at a weekly time resolution and, thus, provides further constraints on the soil erodibility potential.
2.5 ESA CCI soil moisture data
The surface (upper few centimetres) soil moisture data were obtained from the ESA CCI soil moisture project (http://www.esa-soilmoisture-cci.org, last access: 22 October 2018), version 4.2 (Dorigo et al., 2017; Gruber et al., 2017; Liu et al., 2012). This data set was generated using active and/or passive microwave space-borne instruments and covers the 36-year period from 1979 to 2016. For this work, we use the data set from the active instruments (on board ERS-1, ERS-2 and Metop-A) because (1) this ensures that the soil moisture was retrieved from measurements at about the same time as the IASI (Metop-A) overpass time, and (2) among the three data sets, the one from active measurements is the only one expressed in percentage saturation, which is easier to use in this framework. The other two are expressed in volumetric units (m3m−3). Here, information on soil moisture is used to exclude humid areas as potential dust sources.
Figure 1 shows a schematic of the structure of the combined dust source analysis in the present study. Each individual step of this analysis will be described in the following paragraphs. The figure numbers illustrating some steps are also given within the schematics. The data at the top of this flow chart (step 1) are the standard MAPIR product with its standard quality control, as described in Sect. 2.1.
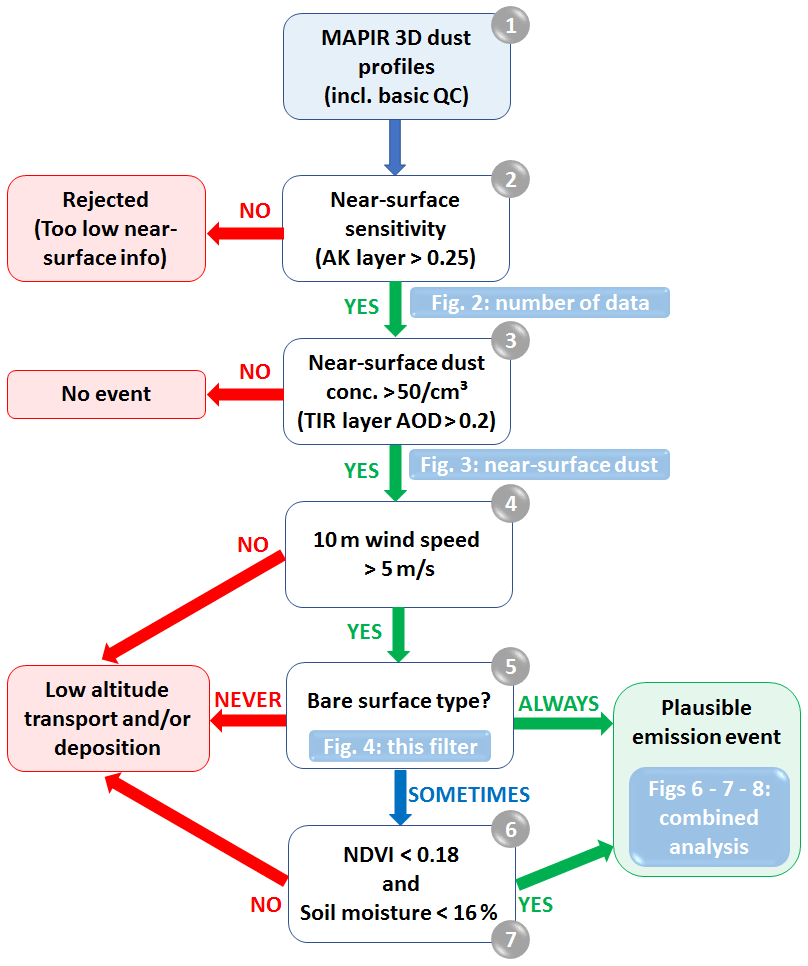
Figure 1Schematic of the combined dust source analysis. Grey numbers indicate the corresponding analysis step numbers, in order to ease the reference to each step described in the corresponding text paragraphs. Blue boxes refer to the figures which illustrate some steps or show the final results of the combined analysis.
3.1 Specific filtering of MAPIR data for dust sources studies
For the use of the MAPIR data in dust sources studies, two additional selection criteria are applied in addition to the standard retrieval quality check: (1) only the data above land surfaces are considered, and (2) only data with sensitivity to the near-surface layer are considered. The term “near-surface layer” in this paper refers to the MAPIR 1 km retrieval layer closest to the surface. This additional filtering on near-surface sensitivity is the second step in the schematic shown in Fig. 1.
The sensitivity of the retrieval to any layer can be obtained from the averaging kernel (AK) calculated during the OEM retrieval. The AK is a square matrix of the size of the state vector, describing the sensitivity of the retrieval to each parameter of that state vector (diagonal elements) and the cross-sensitivity between the different state vector parameters (non-diagonal elements). In this study, the need for sensitivity of the retrieval to the near-surface layer is assessed by using the diagonal value of the AK corresponding to that layer (further referred to as AKsurface). The ideal situation would be AKsurface = 1, meaning that the retrieved concentration in that layer is fully independent of the a priori value. However, in reality, this is very rare, and the retrieved concentration depends partly on the a priori and the other layers.
The trace of the AK related to the concentrations, here the sum of seven values, represents the number of independent pieces of information one can obtain from the retrieval. It is about 2 at best for IASI TIR retrievals (Vandenbussche et al., 2013; Cuesta et al., 2015; Callewaert et al., 2019). Therefore, we have set a minimum threshold at 0.25 for AKsurface. Below this threshold, the sensitivity of the TIR retrieval to the presence of dust aerosols in the near-surface layer is too low, and the retrieval, although generally good, does not contain information about that specific layer. These data are excluded from the source analysis.
Figure 2 shows the monthly average fraction of IASI retrievals per day passing both the basic quality control (step 1) and specific sensitivity check (step 2) for the entire 9-year period considered, from 2008 to 2016. In these averages, each day is given the same weight. White spaces in Fig. 2 indicate that no retrieval passes the two filters during the month, showing, for example, no retrieval sensitivity to the near-surface layer in the central Sahel and south of the Sahel during the summer. This is due to the very low dust AOD in the area in question during that period, with an especially low dust concentration in the near-surface layer, leading to lower sensitivity in that layer of the retrieval performed in the logarithmic space, as explained in Callewaert et al. (2019).
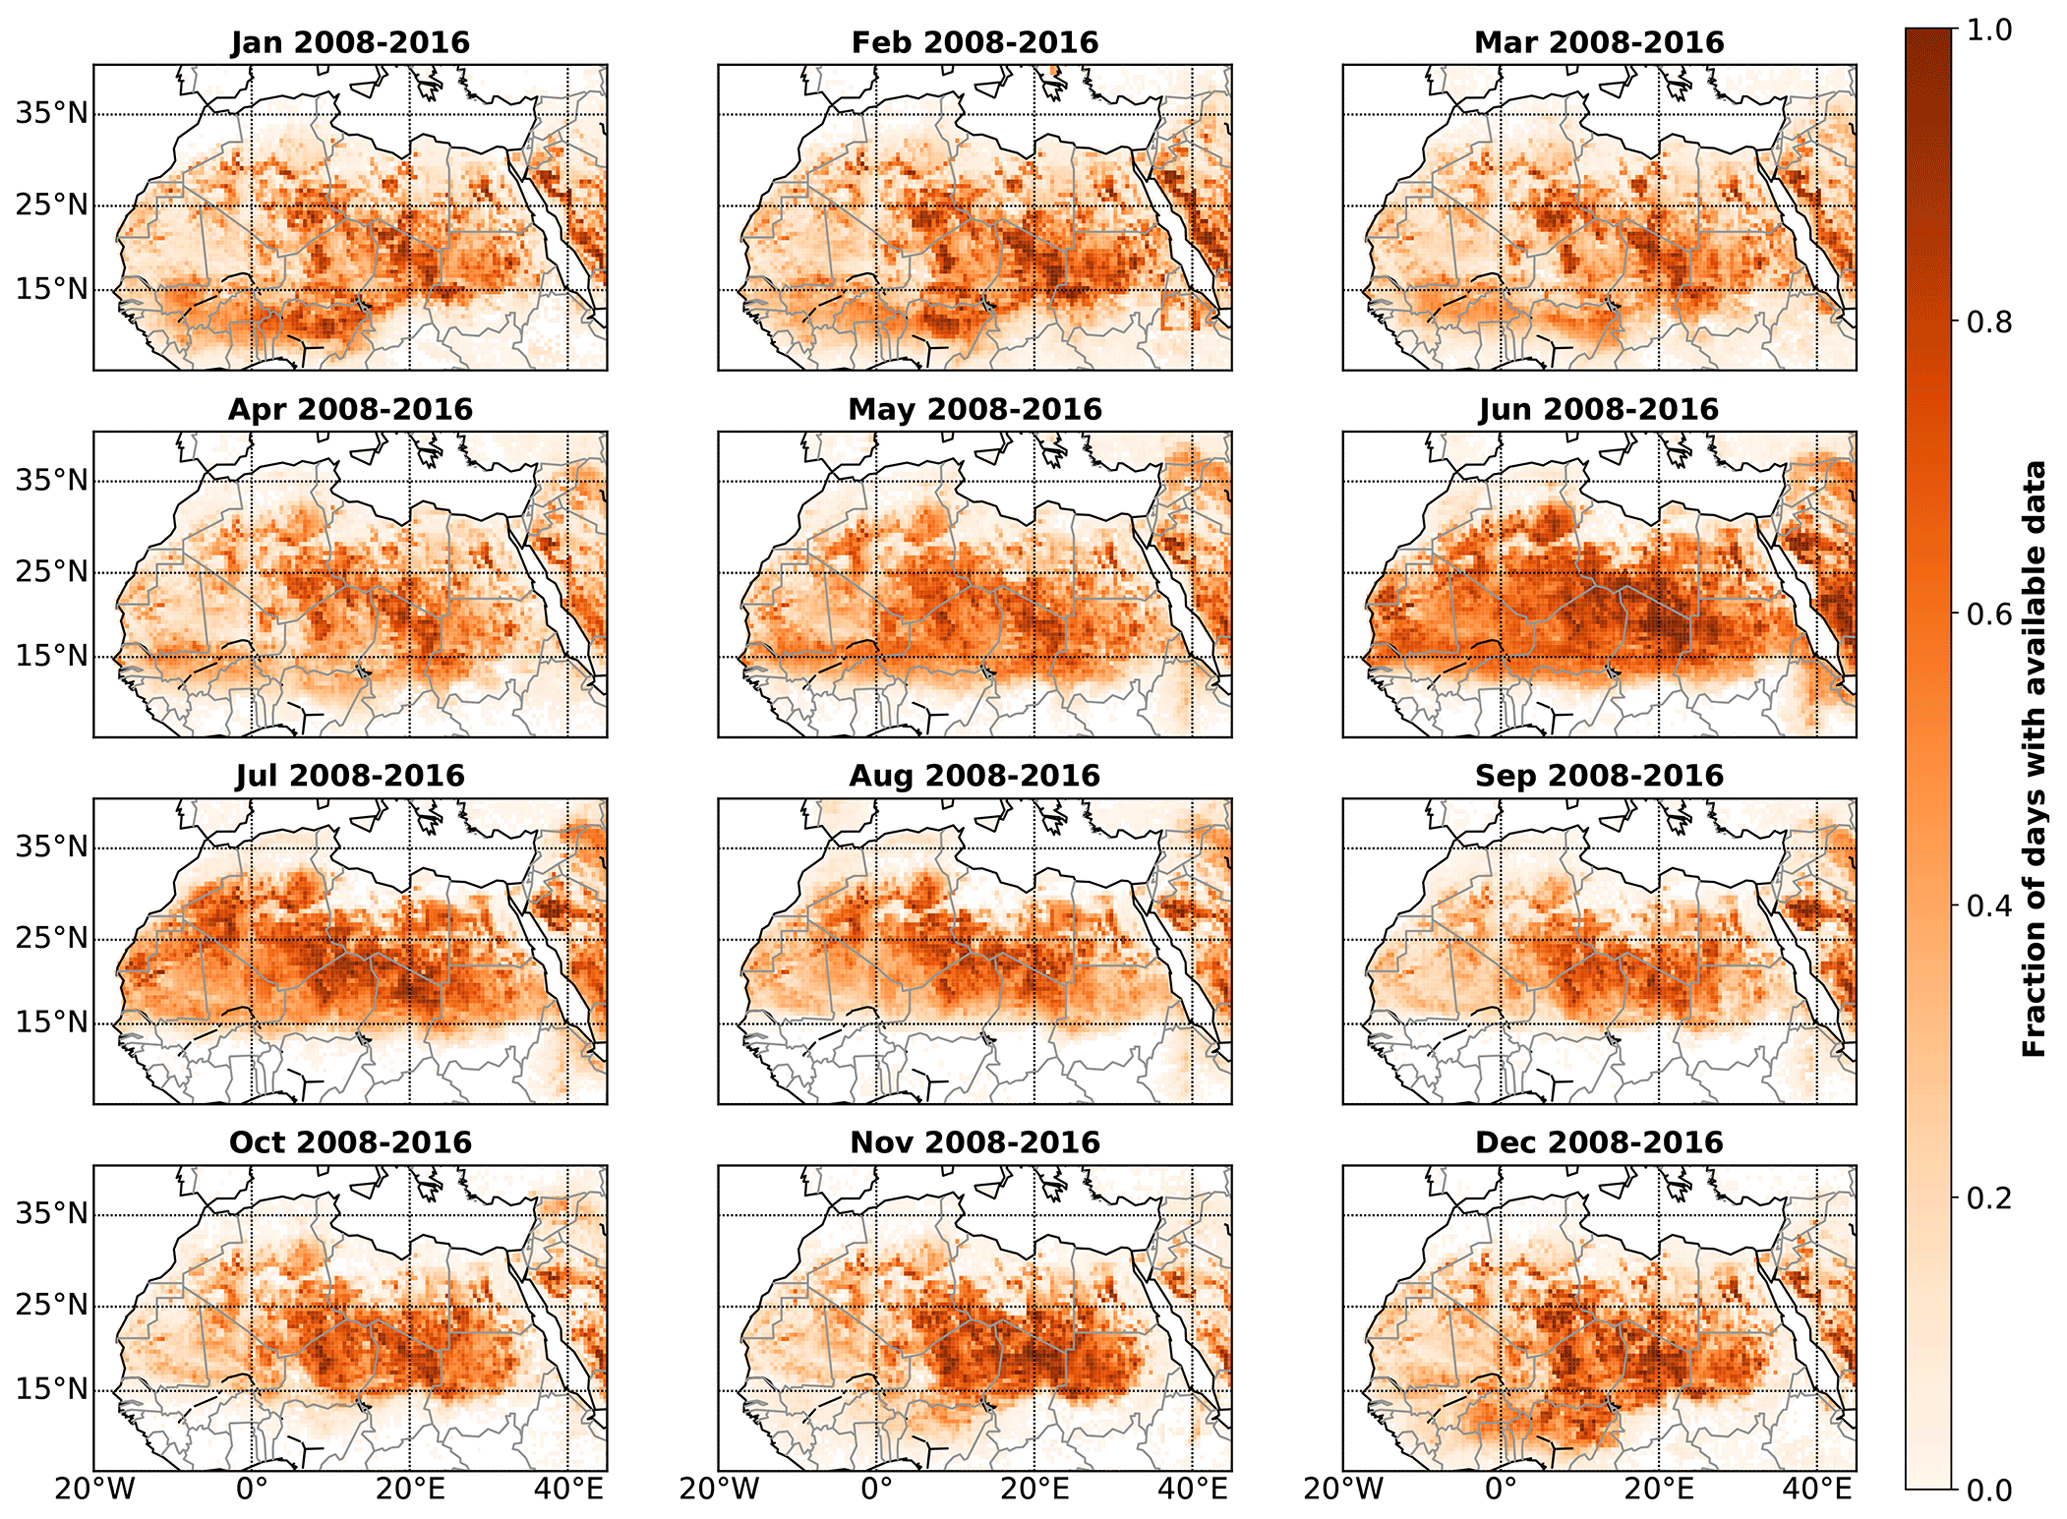
Figure 2Fraction of days with MAPIR retrievals passing all of the selection criteria for the dust source analysis (step 2 of the schematic in Fig. 1), shortened to “available data” in the figure legend: monthly aggregation of morning and evening data for the years from 2008 to 2016.
3.2 Filtering based on MAPIR lowermost layer dust concentration
As explained in Sect. 3.1, the MAPIR retrieved dust concentration in the near-surface layer depends on the real concentration in that layer but also partly on the a priori assumption. Therefore, the retrieved concentration in a single layer should not be used quantitatively but still gives evidence for the presence of dust in that layer. To assure robustness, a threshold for the MAPIR near-surface layer dust concentration can be defined, above which it is considered reliable. This is step 3 in the method schematic in Fig. 1. Here, this threshold was set to a concentration of 50 particles cm−3, or a 10 µm AOD of 0.2 (equivalent visible 550 nm AOD of 0.35) in the near-surface layer. For comparison, Schepanski et al. (2012) used a visible total column AOD threshold of 0.5 and Ginoux et al. (2012) used a visible total column dust AOD threshold of 0.2 to identify dust sources from MODIS AOD estimates. Our selected near-surface layer concentration threshold is a stronger constraint than the above-mentioned total column thresholds, but it ensures that these are real events.
Considering that the availability of data for this analysis (steps 1 and 2) is not homogeneously distributed in space and time (as shown in Fig. 2), the number of days with near-surface dust detection is divided by the number of days with available data. The result for the years 2008 to 2016 is shown in Fig. 3. White areas refer to data unavailability due to low near-surface sensitivity, as in Fig. 2.
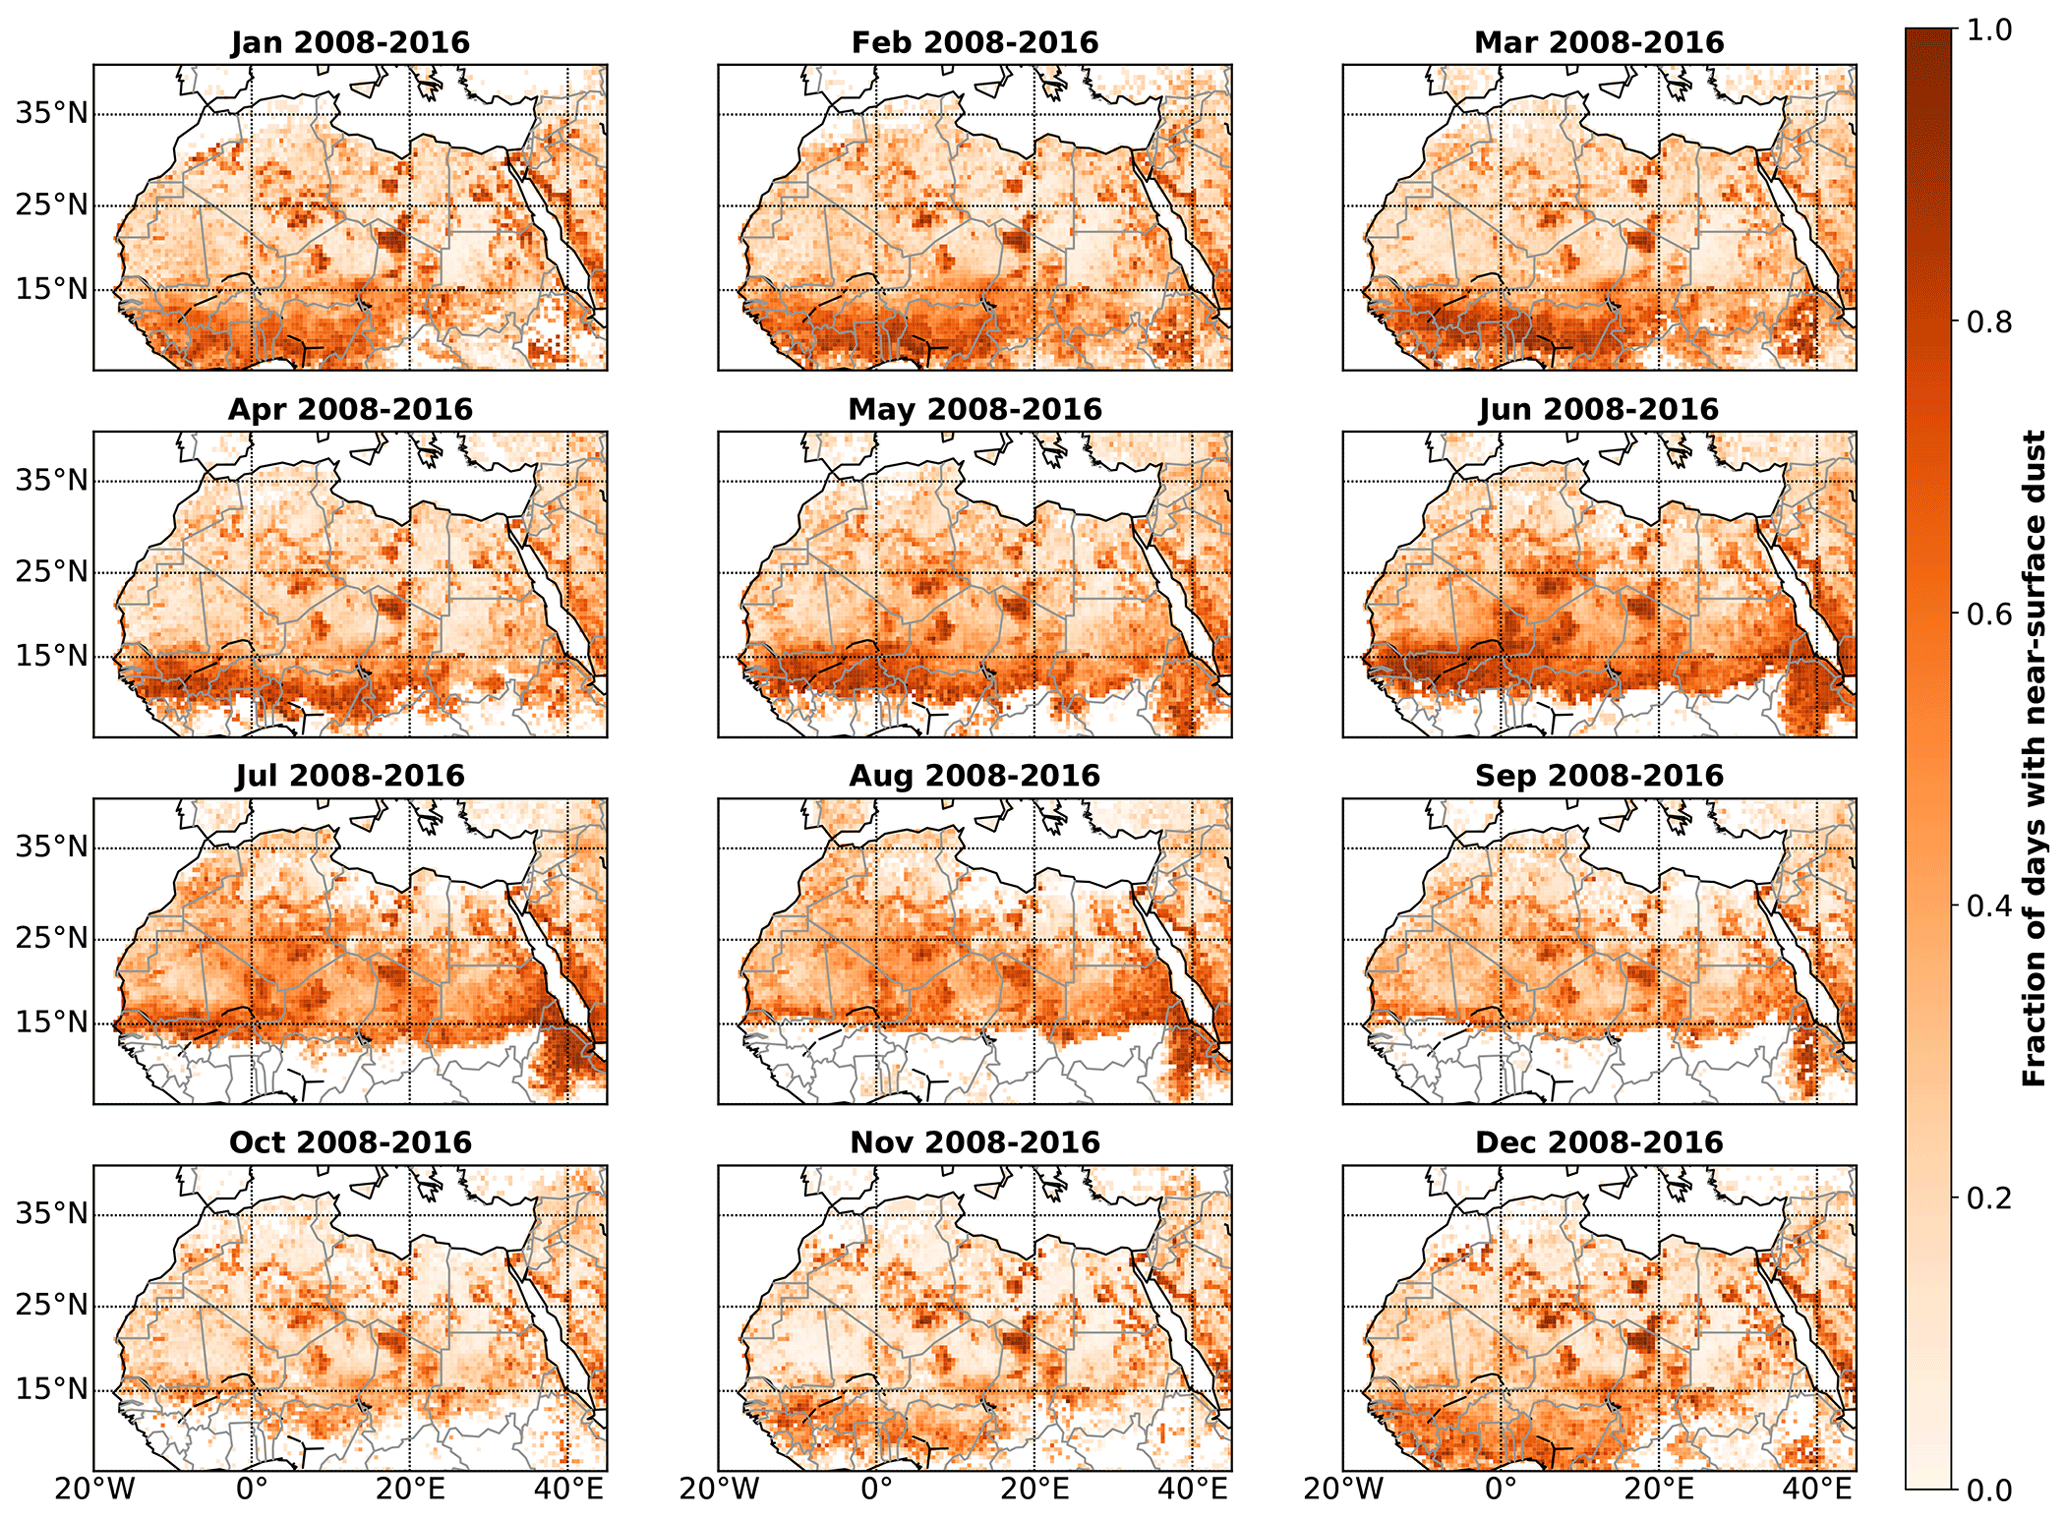
Figure 3Fraction of days with near-surface dust in the MAPIR data set (step 3 of the schematic in Fig. 1): monthly aggregation of morning and evening data for the years from 2008 to 2016.
3.3 Combined analysis
The MAPIR 3D dust data obtained after steps 2 and 3 allow for the inference of near-surface dust presence. However, there can be several reasons for the presence of dust near the surface : (1) it was just emitted there (or in the vicinity), (2) it was advected at low altitudes, or (3) it belongs to a descending dust layer due to either gravitational settling or turbulent down mixing. In order to filter for dust emission events, we apply further criteria: we use ancillary data to evaluate if local conditions foster plausible dust emission and, thus, support the link between near-surface layer dust and dust emission events. In particular, we consider surface wind speed, land cover, soil moisture and the vegetation index. All of these parameters help to determine if the observed near-surface layer dust events can plausibly be local emission events, although, obviously, none of the parameters render the analysis completely certain.
3.3.1 Surface winds
We selected a lower threshold wind velocity of 5 m s−1 to possibly foster dust emission. This threshold is on the lower side (Marticoréna, 2014; Marsham et al., 2013; Kocha et al., 2013) in order to cope with the well-known underestimation of high wind speed in models (e.g. Largeron et al., 2015). Such high wind speeds must occur within the 12 h prior to the detection of a MAPIR near-surface dust event in order to have this event classified as plausible local emission. This is based on the hypothesis that when an intense emission event occurs, it will likely still be observed by IASI up to a few hours after the emission, as dust remains suspended at low altitude for some time. For example, the afternoon and early-evening dust emissions are still observed as low-level dust by IASI at 21:30 LT (local time), although the wind at that time has slowed down. The wind filtering represents step 4 in the method schematic in Fig. 1.
3.3.2 Surface state
In the framework of this study, we consider all types of bare soil areas, rain-fed or irrigated croplands, grassland, all types of sparse vegetation (<15 %) or shrubland as erodible land type and, thus, as potential dust sources. As the land cover data (Sect. 2.4) are multi-annual means, they does not reflect seasonal vegetation changes. Nevertheless, in order to account for seasonal changes in vegetation, we apply additional constraints on vegetation and soil moisture for all land cover types except bare soil. A land cover “filter map” containing the following information was built: (1) non-plausible dust source, (2) plausible dust source and (3) plausible dust source with additional constraints (see Fig. 4). This represents step 5 in the method schematic. A grid cell is considered to be a plausible dust source if at least 25 % of its surface is any bare area type. A grid cell is considered to be a plausible dust source with additional constraints if at least 25 % of its surface is made up of any of the accepted types. In all other cases, the grid cell is rejected.
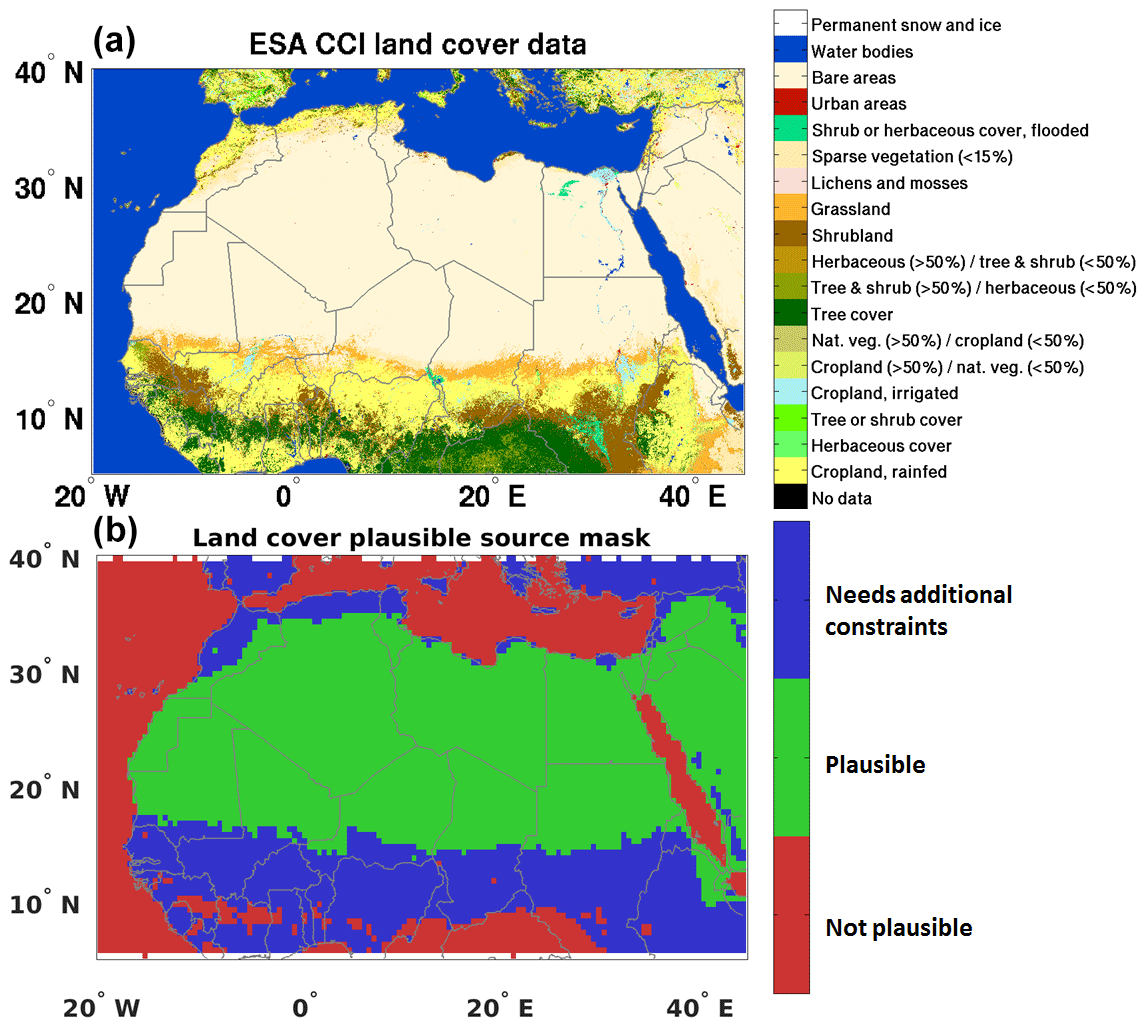
Figure 4(a) ESA CCI land cover data, centred on the 2010 epoch, and (b) the corresponding land cover filter for plausible dust sources.
Dense vegetation cover is known to absorb the wind momentum and prevent soil erosion and, in turn, dust emissions. The typical NDVI for bare soil areas is about 0.1, whereas it is about 0.15 for grassland in Sahel from November to July (dry season) and up to 0.4 during the summer wet season. Parajuli and Yang (2017) studied the link between dust emissions and the NDVI in the Bodélé Depression and concluded that dust mobilization is fully suppressed when the NDVI exceeds 0.18; therefore, this value is used here as the threshold for plausible dust emission. This is step 6 in the method schematic.
Soil moisture increases the inter-particle cohesive forces in the soil and, thus, the amount of energy that is needed to mobilize soil particles and eventually uplift them into the air. Consequently, the threshold wind speed for dust mobilization increases with increasing soil moisture. Here, we consider an upper soil moisture threshold of 16 % (Kim and Choi, 2015). This is step 7 in the method schematic.
The resulting retrieved data set on plausible dust source areas covering a 9-year period from 2008 to 2016 will be examined regarding its ability to identify dust source areas, their diurnal activity distribution and their seasonal cycle. Figure 5 summarizes the geographical locations mentioned throughout the discussion. The numbers and colours in Fig. 5 are used to reference the geographical areas within the text.

Figure 5Geographical features discussed in the paper. The Bodélé Depression is shown using a white star in a red circle. The main mountains are shown using numbered brown discs: (1) the Adrar Plateau, (2) the Saharan Atlas Mountains, (3) the Tademaït Plateau, (4) Adrar des Ifhogas, (5) the Hoggar Mountains, (6) the Aïr Mountains, (7) the Tibesti Mountains, (8) the Ennedi Massif, (9) Jabal Akhdar and (10) the Red Sea Mountains. Ground-based stations discussed in the paper are shown with numbered blue discs: (1) M'Bour, (2) Cinzana and (3) Banizoumbou. The approximate Sahel boundaries are shown as a green box.
4.1 Saharan dust emission hot spots
Figure 6 shows the monthly all-day results of the combined analysis (corresponding to the final green box in the schematic in Fig. 1), highlighting dust source areas for the years from 2008 to 2016. The figure clearly emphasizes the seasonal cycles of dust emissions with the most frequent emissions occurring during the summer (June, July and August) except for in the Bodélé Depression area (red star in Fig. 5), where the dust emission frequency peaks during the winter period (November to March).
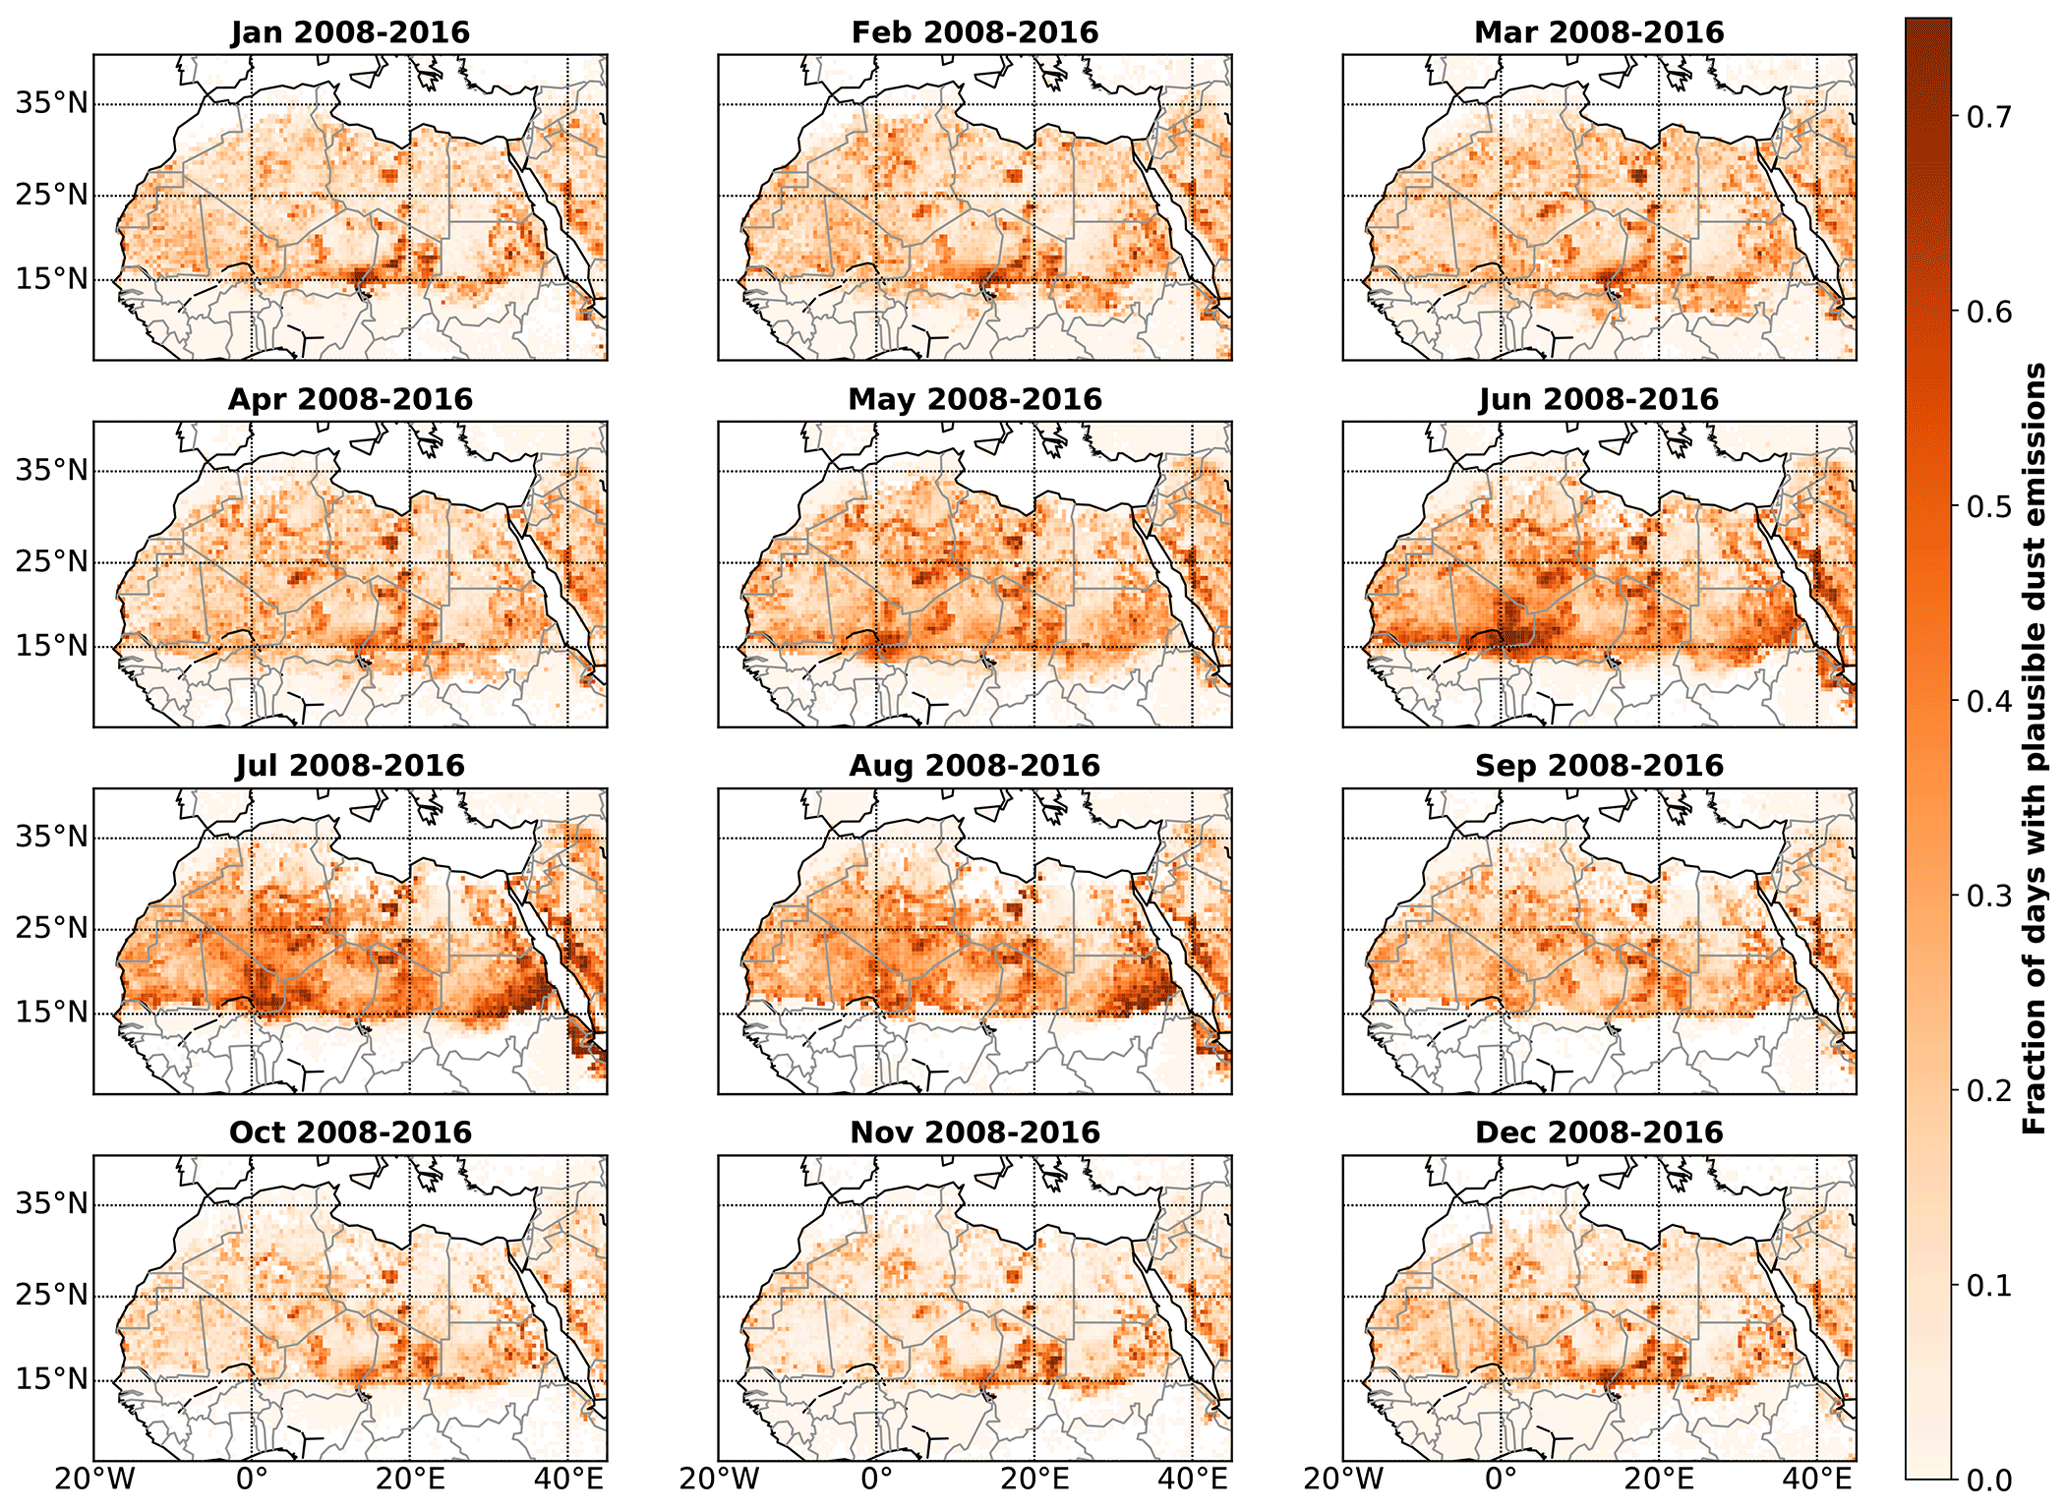
Figure 6Monthly all-day result of the combined analysis (corresponding to the final green box in the schematic in Fig. 1) for the years from 2008 to 2016.
The most striking and predominant hot spot for dust emission is the Bodélé Depression area in central Chad (red star in Fig. 5), south of the Tibesti Mountains (brown 7 in Fig. 5). It is active throughout the year with a maximum during the winter and a minimum during the summer, which agrees well with the seasonal cycle reported in the literature (Schepanski et al., 2007, 2009, 2012, 2017; Crouvi et al., 2012; Allen et al., 2013). Our analysis further highlights a high fraction of days with plausible dust emission during the winter located west of the Bodélé Depression (red star in Fig. 5) towards the Aïr Mountains in eastern Niger (brown 6 in Fig. 5).
A second major dust emission hot spot illustrated by our combined analysis is situated in the central Sahara, in the area of the Adrar des Ifhogas (brown 4 in Fig. 5) and the Aïr Mountains (brown 6 in Fig. 5). This area is very active during late spring and summer, especially from June to August, while it is quiet during the rest of the year, which is consistent with information from recent literature (e.g. Schepanski et al., 2007, 2012; Crouvi et al., 2012; Ashpole and Washington, 2013; Evan et al., 2015; Todd and Cavazos-Guerra, 2016; Schepanski et al., 2017), even though the precise emission locations vary from one study to another.
Regarding the third dust source, a high fraction of days with plausible dust emission is identified during the summer in central Algeria, illustrating a dust source region located north of the Hoggar Mountains (brown 5 in Fig. 5) and south-east towards the Libya–Niger–Chad border. It can be characterized as a series of individual small hot spots. Ginoux et al. (2012) reported central Algeria to be a low-occurrence natural dust source (based on MODIS data). The area close to the Libya–Niger–Chad border has also been reported to undergo moderate dust source activation by Schepanski et al. (2007, 2009, 2017).
A fourth dust source area observed is the central region of eastern Sudan, in the Nile River basin, with a maximum in July and August, which is again in agreement with recent literature (Prospero et al., 2002; Schepanski et al., 2007, 2009; Ginoux et al., 2012; Schepanski et al., 2017). Besides individual hot spot areas, a significant fraction of days with plausible dust emission is observed almost everywhere in the Sahara during late spring and summer. Smaller, less pronounced hot spots occur in north-west Algeria (south of the Atlas Mountains – brown 2 in Fig. 5), in Mauritania and north-west Mali. These areas are also described as dust sources in the literature (Schepanski et al., 2007, 2012; Ashpole and Washington, 2013; Todd and Cavazos-Guerra, 2016; Schepanski et al., 2017).
All area highlighted here potentially also include a downwind dust transport component. This component is either linked to the transport between sunrise at about 06:00 LST and the measurement time at about 09:30 LST or to the fact that late-afternoon convection events are detected a bit later (at 21:30 LST). The implicitly included downwind transport component results into a shift between the actual source and the detected plume and, thus, in a downwind offset of the assigned source location.
4.2 Sahel dust emission hot spots
The Sahel (green box in Fig. 5) is a known dust source region, mostly discussed with regard to human activities in a sensitive desert margin region (Ginoux et al., 2012; Huang et al., 2015). Klose et al. (2010) showed that dust is mostly present over the Sahel during the winter (December to April) but that it is mainly suspended dust transported from Saharan sources, which accumulates and remains in suspension due to wind convergence over the Sahel on the northern side of the monsoon trough. The whole northern Sahel is highlighted as a dust source in Schepanski et al. (2017), although with a low DSAF (less than 5 %).
Our method sheds new light on the study of Sahel sources. Indeed, the method presented here intends to isolate local dust emissions from transported dust. In the Sahel, the additional criteria linked to surface conditions are extremely meaningful, allowing one to account for the seasonal cycles of vegetation and humidity in addition to the significant changes in winds. What appears in Fig. 6 as a hard cut-off between plausible and implausible source areas is mostly the result of the NDVI and soil moisture filters applied.
The three most dominant Sahel dust hot spots identified with our method are located in the northern part of the Sahel in the desert margin region: (1) the Mali–Niger border area, with a maximum in June–July; (2) southern Mauritania, with a maximum in June and July; and (3) Mali east of the Mauritanian border, also peaking in June and July.
Three ground-based stations were deployed in 2006 in the framework of the African Monsoon Multidisciplinary Analysis (AMMA). This set of stations is called the “Sahelian Dust Transect”. The stations are found in Banizoumbou (south-west Niger, blue 3 in Fig. 5), Cinzana (south Mali, blue 2 in Fig. 5) and M'Bour (west Senegal, blue 1 in Fig. 5). Using surface PM10 and wind measurements at these stations, Marticoréna et al. (2010) and Kaly et al. (2015) concluded that the enhanced levels of near-surface dust concentrations at these locations during the dry season is mostly due to dust transport from other sources, although some local emissions may contribute towards the end of the dry season (May to July). Bergametti et al. (2017) showed that emission events are rare at Cinzana and Banizoumbou (on less than 2 % of days) and very short in time (maximum 3 h), with a maximum during April to July. Two of our identified Sahelian dust hot spots are around two of the Sahelian Dust Transect stations: Cinzana in south Mali (blue 2 in Fig. 5) and Banizoumbou in south-west Niger (blue 3 in Fig. 5), where our analysis also highlights possible local emissions in spring and early summer. Quantitatively, our estimated fraction of days with plausible dust emission is much larger than the few percent of dust source activation days reported by the stations.
4.3 Diurnal variations
As mentioned in Sect. 1, dust emissions have a known diurnal cycle and, fortuitously, IASI measurements are obtained at interesting times, close to both emission maxima (morning and late afternoon to night). The difference between the morning and evening fraction of days with plausible dust emission may provide information about the main activation mechanism of each emission area and/or period. Figures 7 and 8 show the monthly fraction of days with plausible dust emission for morning (09:30 LST) and evening (21:30 LST) IASI measurements respectively, over the years from 2008 to 2016. We remind the reader that the selection based on the presence of sufficiently high wind speed is done on the 12 h preceding the IASI measurement in this combined analysis. The comparison of Figs. 7 and 8 leads to three main conclusions. First, the Bodélé Depression (red star in Fig. 5) appears almost exclusively as a morning source, linking it to the LLJ breakup emission mechanism as reported in Fiedler et al. (2013). Secondly, the area to the south-west of the Bodélé Depression is almost exclusively observed as an afternoon/evening plausible source and might be low-altitude transport from the Bodélé emissions. Thirdly, most of the other major source areas detected are observed both as morning and afternoon/evening hot spots, although the afternoon/evening occurrences are lower. Schepanski et al. (2009) also showed significantly less dust source activation during the afternoon and evening than during morning.
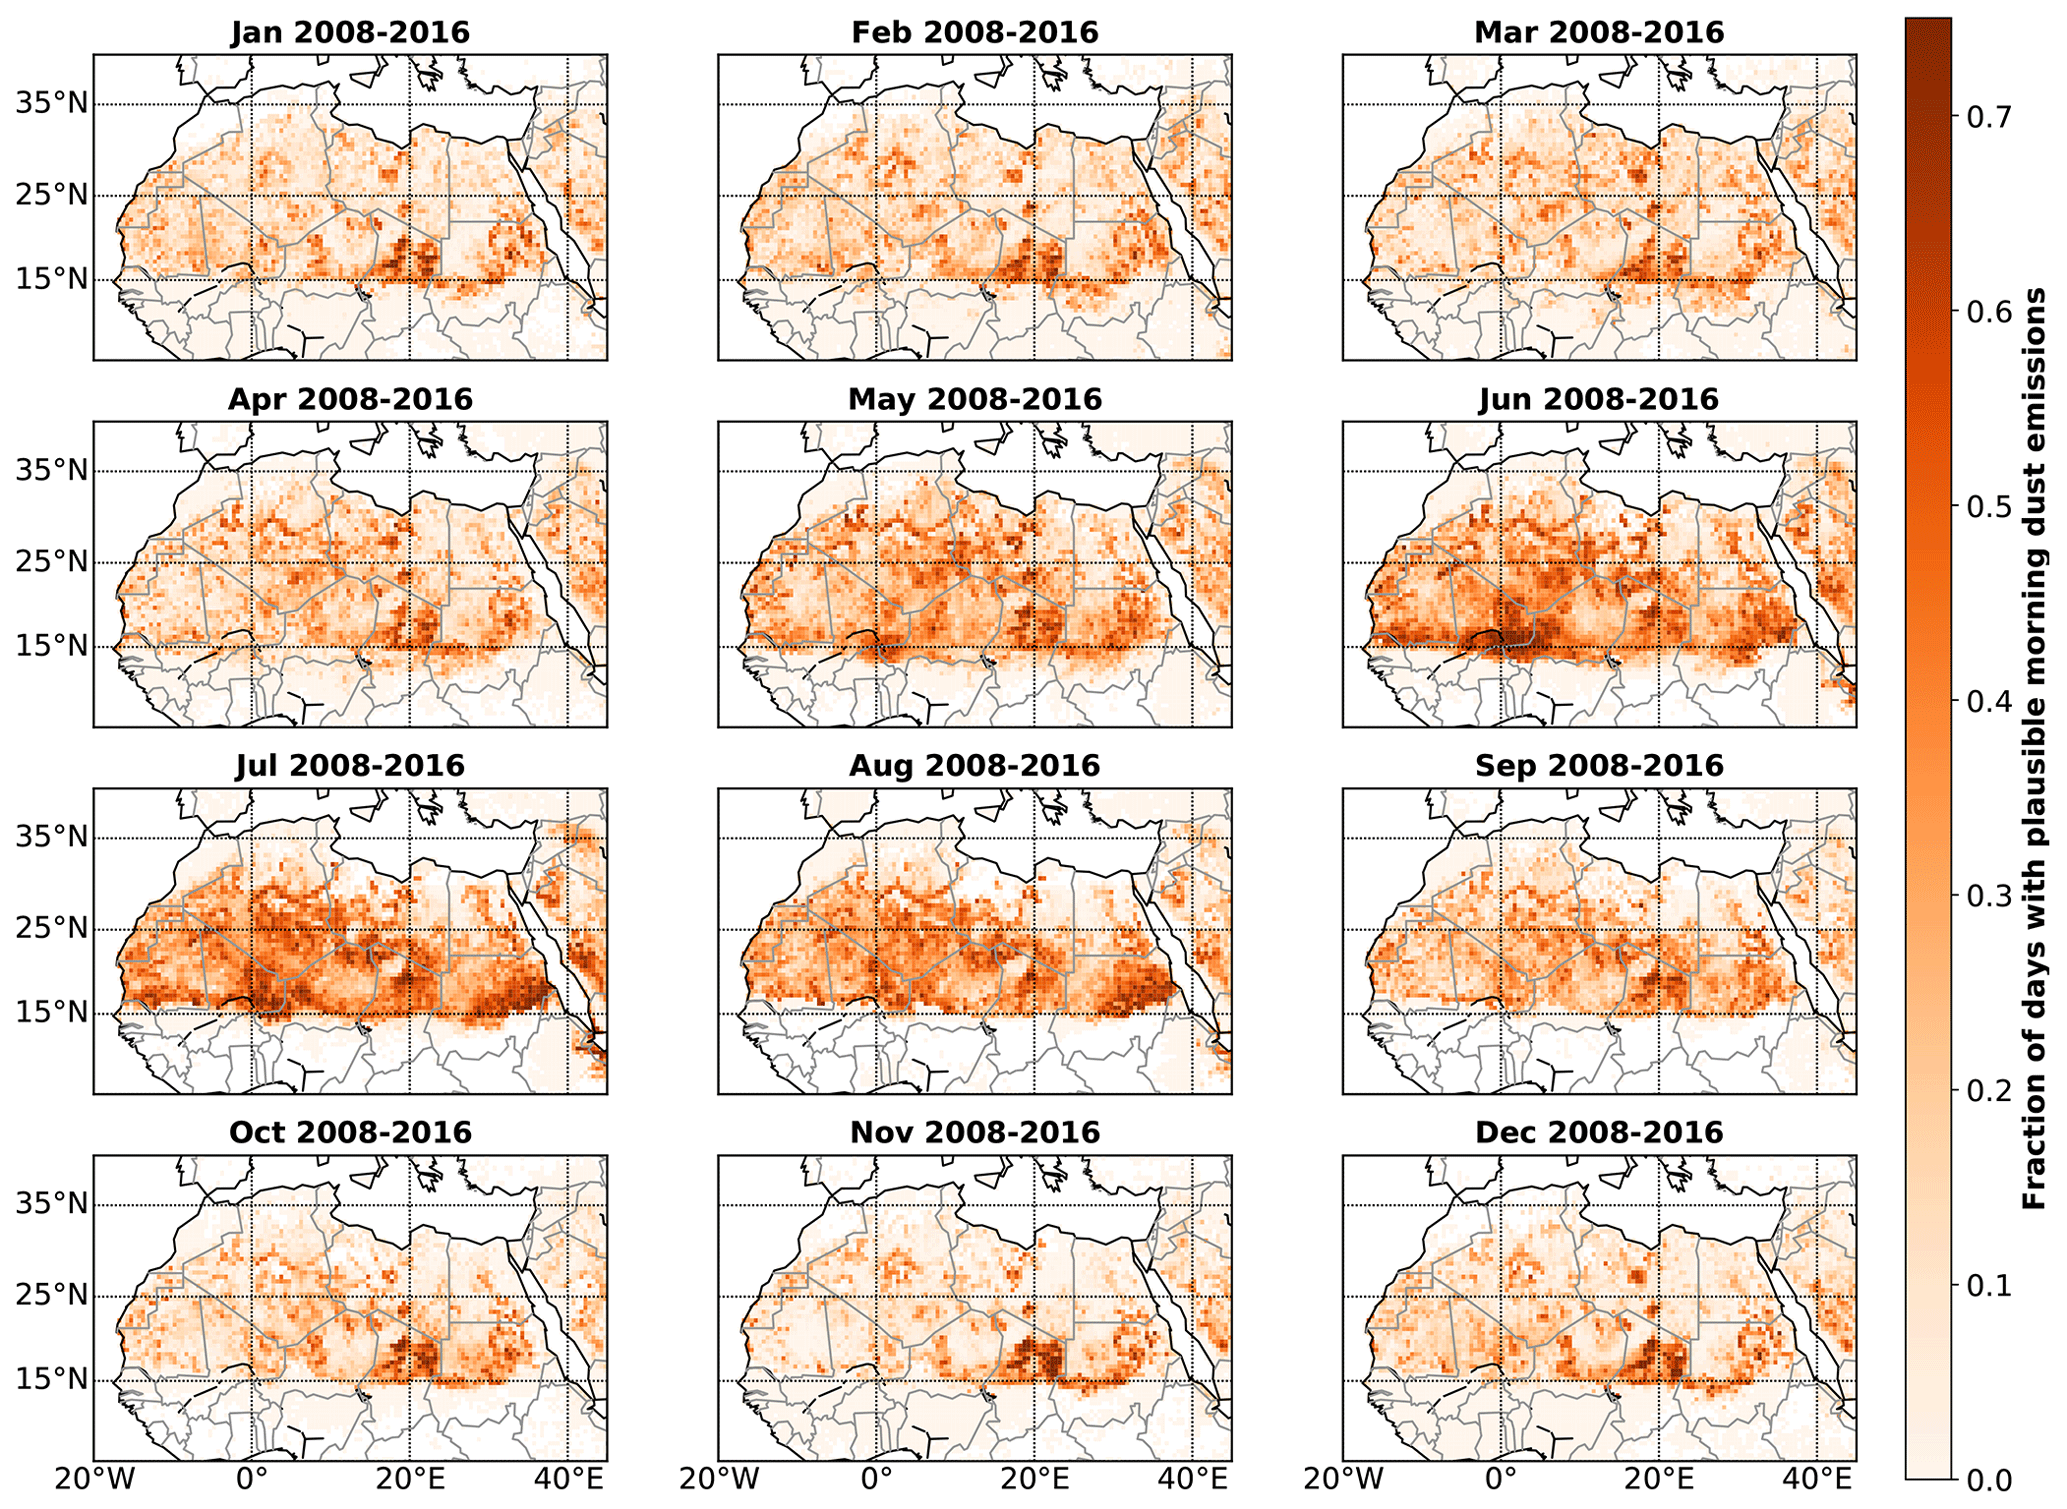
Figure 7Monthly morning result of the combined analysis (corresponding to the final green box in the schematic in Fig. 1) for the years from 2008 to 2016.
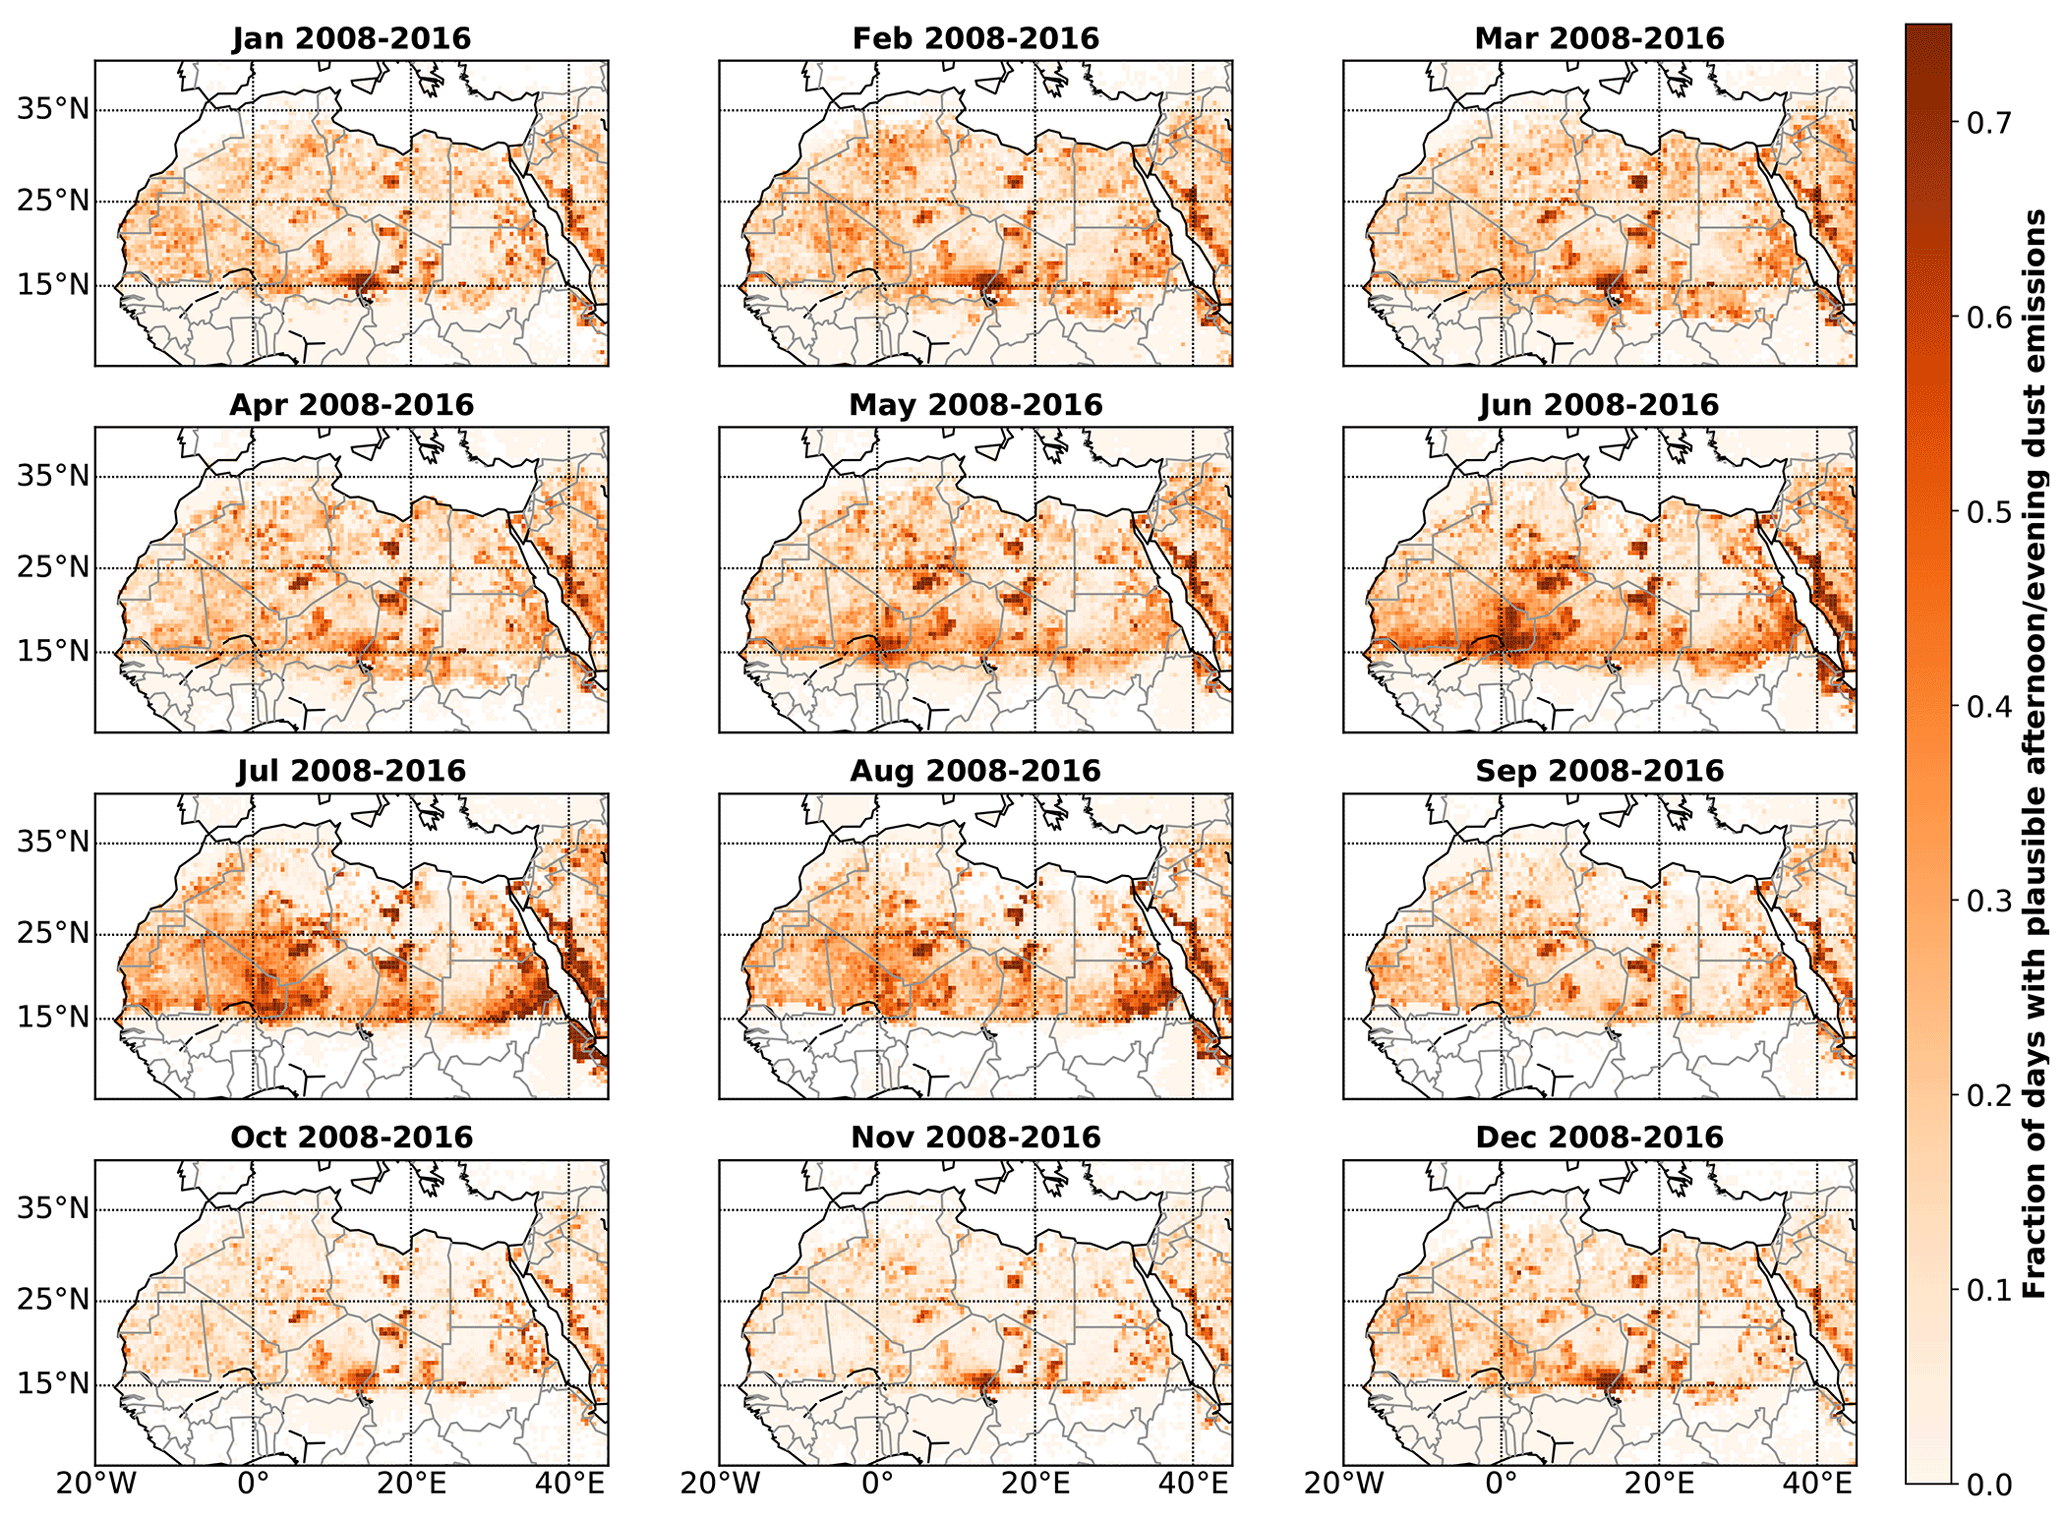
Figure 8Monthly evening result of the combined analysis (corresponding to the final green box in the schematic in Fig. 1) for the years from 2008 to 2016.
4.4 Long-term evolution
When analysing the monthly fraction of plausible emission days for each year individually (figures not shown), large inter-annual variability becomes obvious. A robust long-term trend analysis would therefore require time series longer than 9 years. This kind of study will be possible in the future, as the IASI mission is currently planned until the mid 2020s, with a scheduled continuation beyond with the successor IASI-New Generation (IASI-NG). A first glance at the temporal evolution of dust source activity is given in Fig. 9, which shows 3-year aggregations of our full 9-year analysis: 2008 to 2010, 2011 to 2013 and 2014 to 2016. The three epochs show similar patterns of dust emission hot spots, although there is a significant variability in the number of plausible emission days. A clear decrease in the frequency of occurrence of dust emission is observed for the central Sahara and Sudan during summer. The activity in the Bodélé Depression seems generally stable in the winter and increases slightly during autumn. Additional differences are observed between the different time aggregations, clearly showing that comparison between different dust sources studies should also consider underlying differences linked to the time period that was analysed. Therefore, robust long-term trends would require longer time series given the high inter-annual variability.
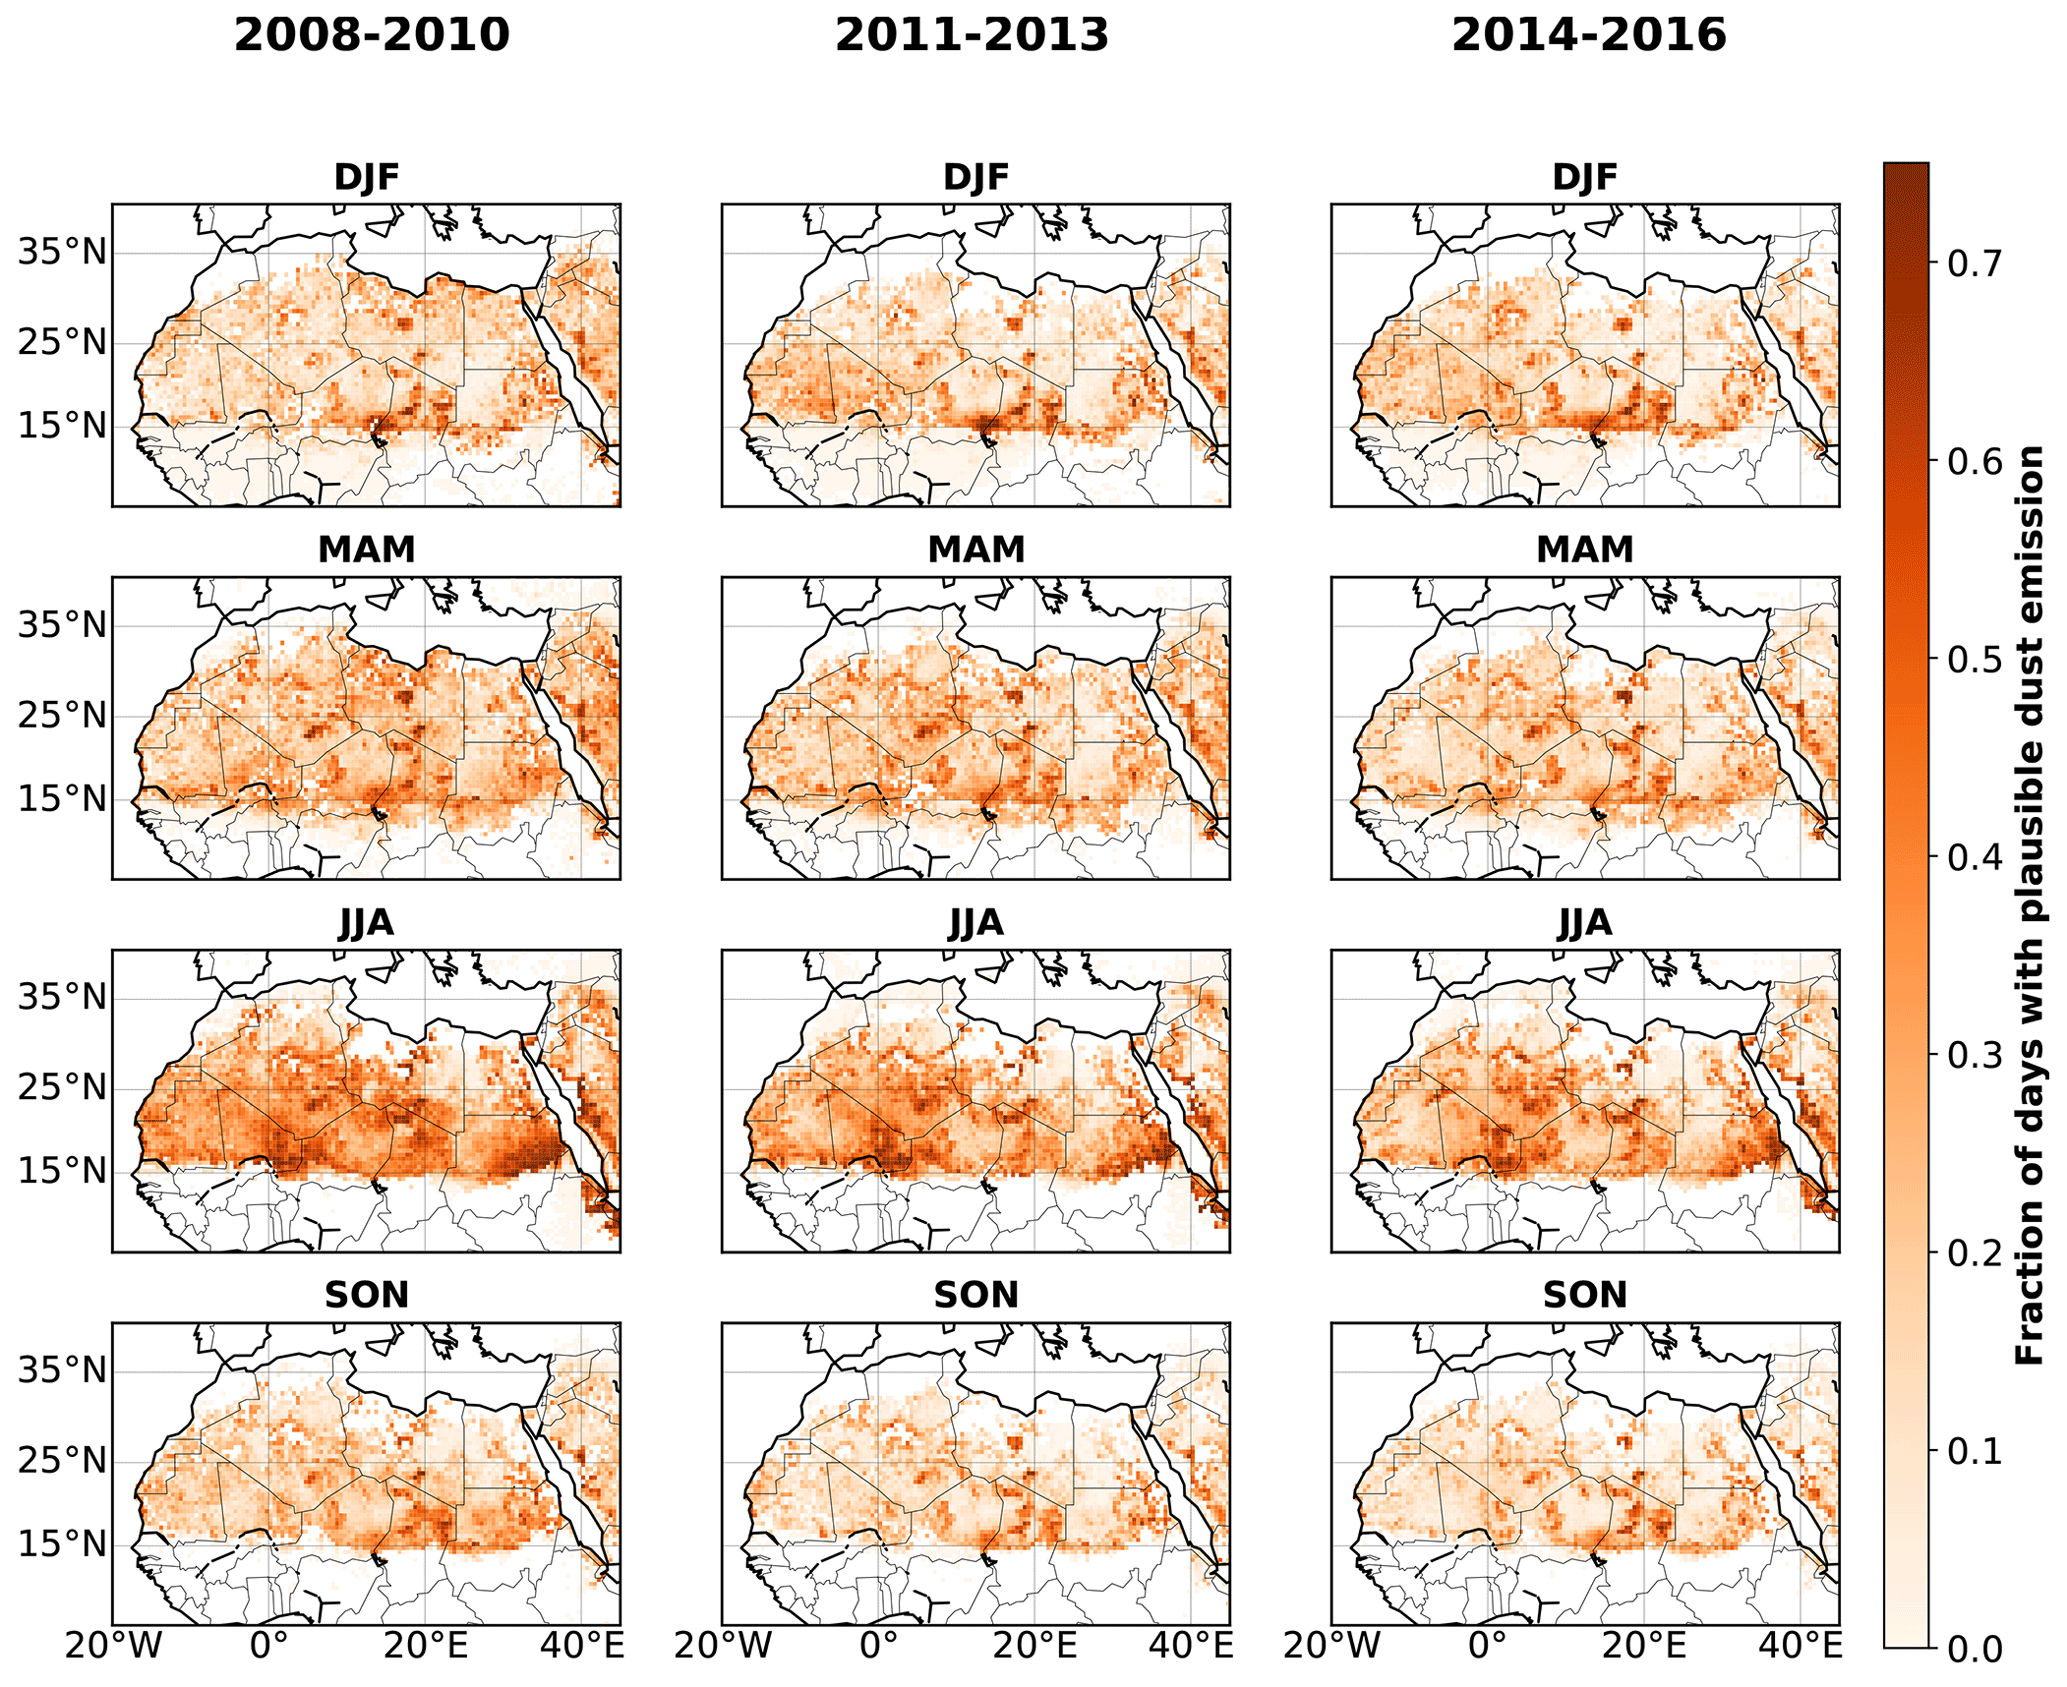
Figure 9Result of the combined analysis (corresponding to the final green box in the schematic in Fig. 1): seasonal aggregation of all-day data for the years from 2008 to 2010 (left column), from 2011 to 2013 (central column) and from 2014 to 2016 (right column).
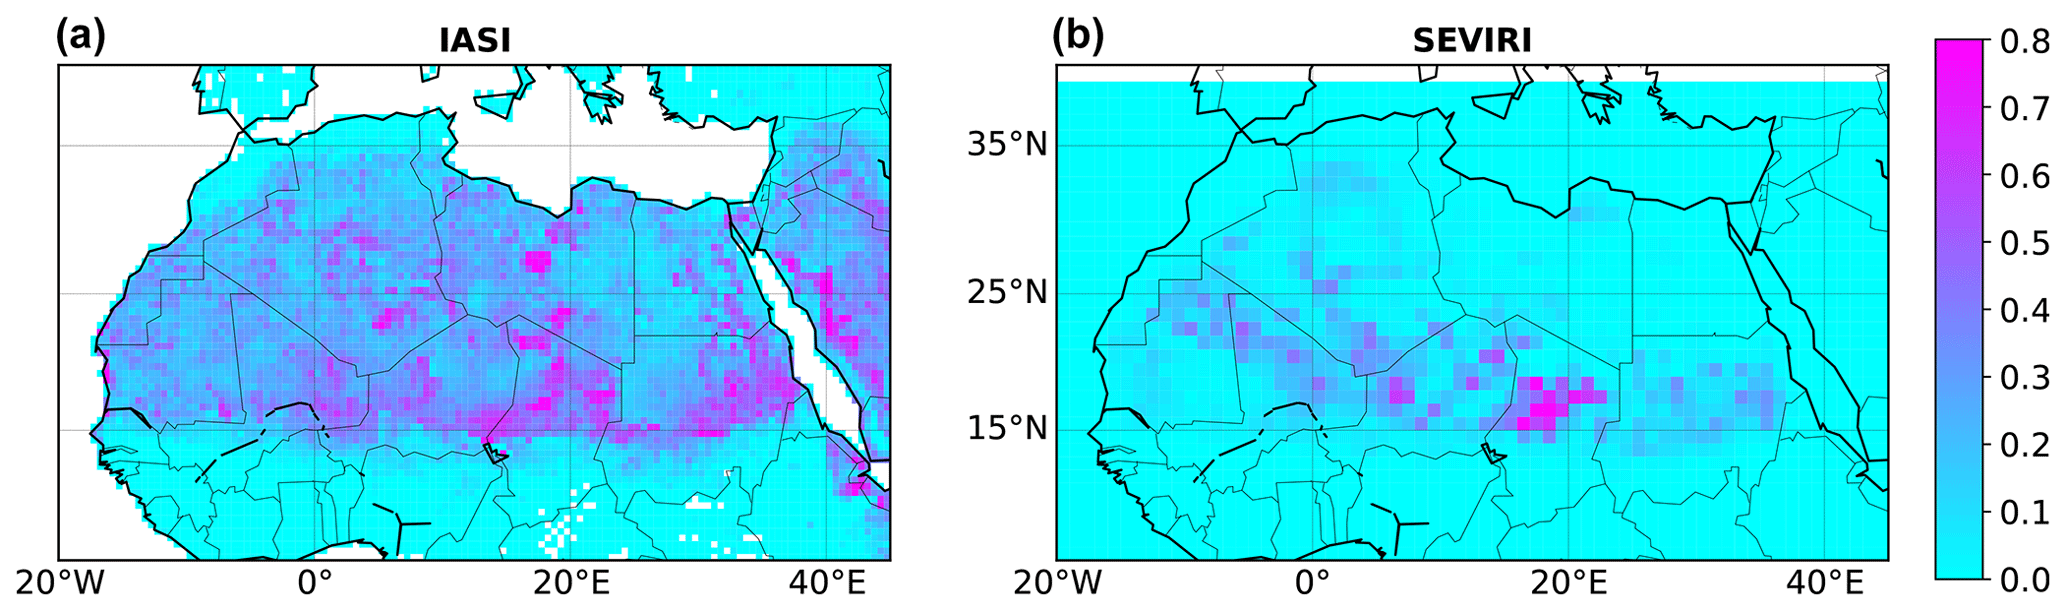
Figure 10Normalized fraction of plausible emission days from the IASI automated combined analysis (a) and normalized dust source activation frequency from SEVIRI manual dust plume tracking (b): annual aggregation of all-day data for the years from 2008 to 2009.
The results from the new combined dust source detection presented in this paper have been compared with those from the SEVIRI manual plume tracking method detailed in Sect. 2.2. These two source studies were undertaken using very different data (dust concentration vertical profiles from IASI versus IR difference composite images from SEVIRI) and source identification methods (automatic event selection based on additional data and criteria versus manual tracking of each plume to its source area). We will refer to the two methods as the “IASI automated combined analysis” and the “SEVIRI manual tracking” respectively. Neither method can be considered to be the “reference truth”, with the truth probably being somewhere in between the results of both analyses. The aim of this comparison is to illustrate the strengths and weaknesses of both approaches. Only the dust source patterns obtained with both methods will be compared because a quantitative comparison is meaningless: in the case of the IASI automated combined analysis, an event can be observed multiple times (in different grid cells and/or at consecutive IASI time stamps), whereas in the case of the SEVIRI manual tracking, each event is attributed to a single grid cell and time stamp. Therefore, the results from each analysis were normalized (divided by their respective maximum value) before being compared. These comparisons are shown using a different colour scheme to avoid any possible confusion with the other figures.
5.1 Spatial pattern comparison
There are common source patterns in both analyses: the Bodélé Depression (red star in Fig. 5), the area between the Hoggar (brown 5 in Fig. 5) and Tibesti mountains (brown 7 in Fig. 5), west of the Aïr Mountains (brown 6 in Fig. 5), east of the Adrar des Ifhogas (brown 4 in Fig. 5), around the Tademaït Plateau (brown 3 in Fig. 5), Jabal Akhdar (brown 9 in Fig. 5) and Sudan. Differences are also observed: the northern Mali and Mauritania area and the Saharan Atlas Mountains (brown 2 in Fig. 5) do not stand out from the IASI automated combined analysis. On the other hand, central Libya and the West African coastal sources do not stand out from the SEVIRI manual tracking analysis. Overall, the IASI automated combined analysis identifies several large areas as “diffuse semi-hot spots”.
5.2 Diurnal and seasonal cycles
Both analyses agree regarding the most obvious features of the diurnal and seasonal cycles (see Figs. 11 and 12): large intense hot spots during the summer (comprising all highlighted areas in the previous section), the Bodélé Depression (red star in Fig. 5) being active throughout the year but only in the morning, and an intense summer afternoon/evening source area west of the Aïr (brown 6 in Fig. 5) and east of the Adrar des Ifhogas (brown 4 in Fig. 5). In this seasonal analysis, the sources in northern Mali and Mauritania stand out in the IASI automated combined analysis during the summer as well as in the SEVIRI manual tracking analysis (in contrast to the results from the all-year analysis in the previous section). The other differences mentioned in the previous section also appear here. Additionally, Sudan really stands out from the IASI automated combined analysis during the summer afternoons/evenings, whereas it is mostly inactive in the SEVIRI manual tracking analysis.
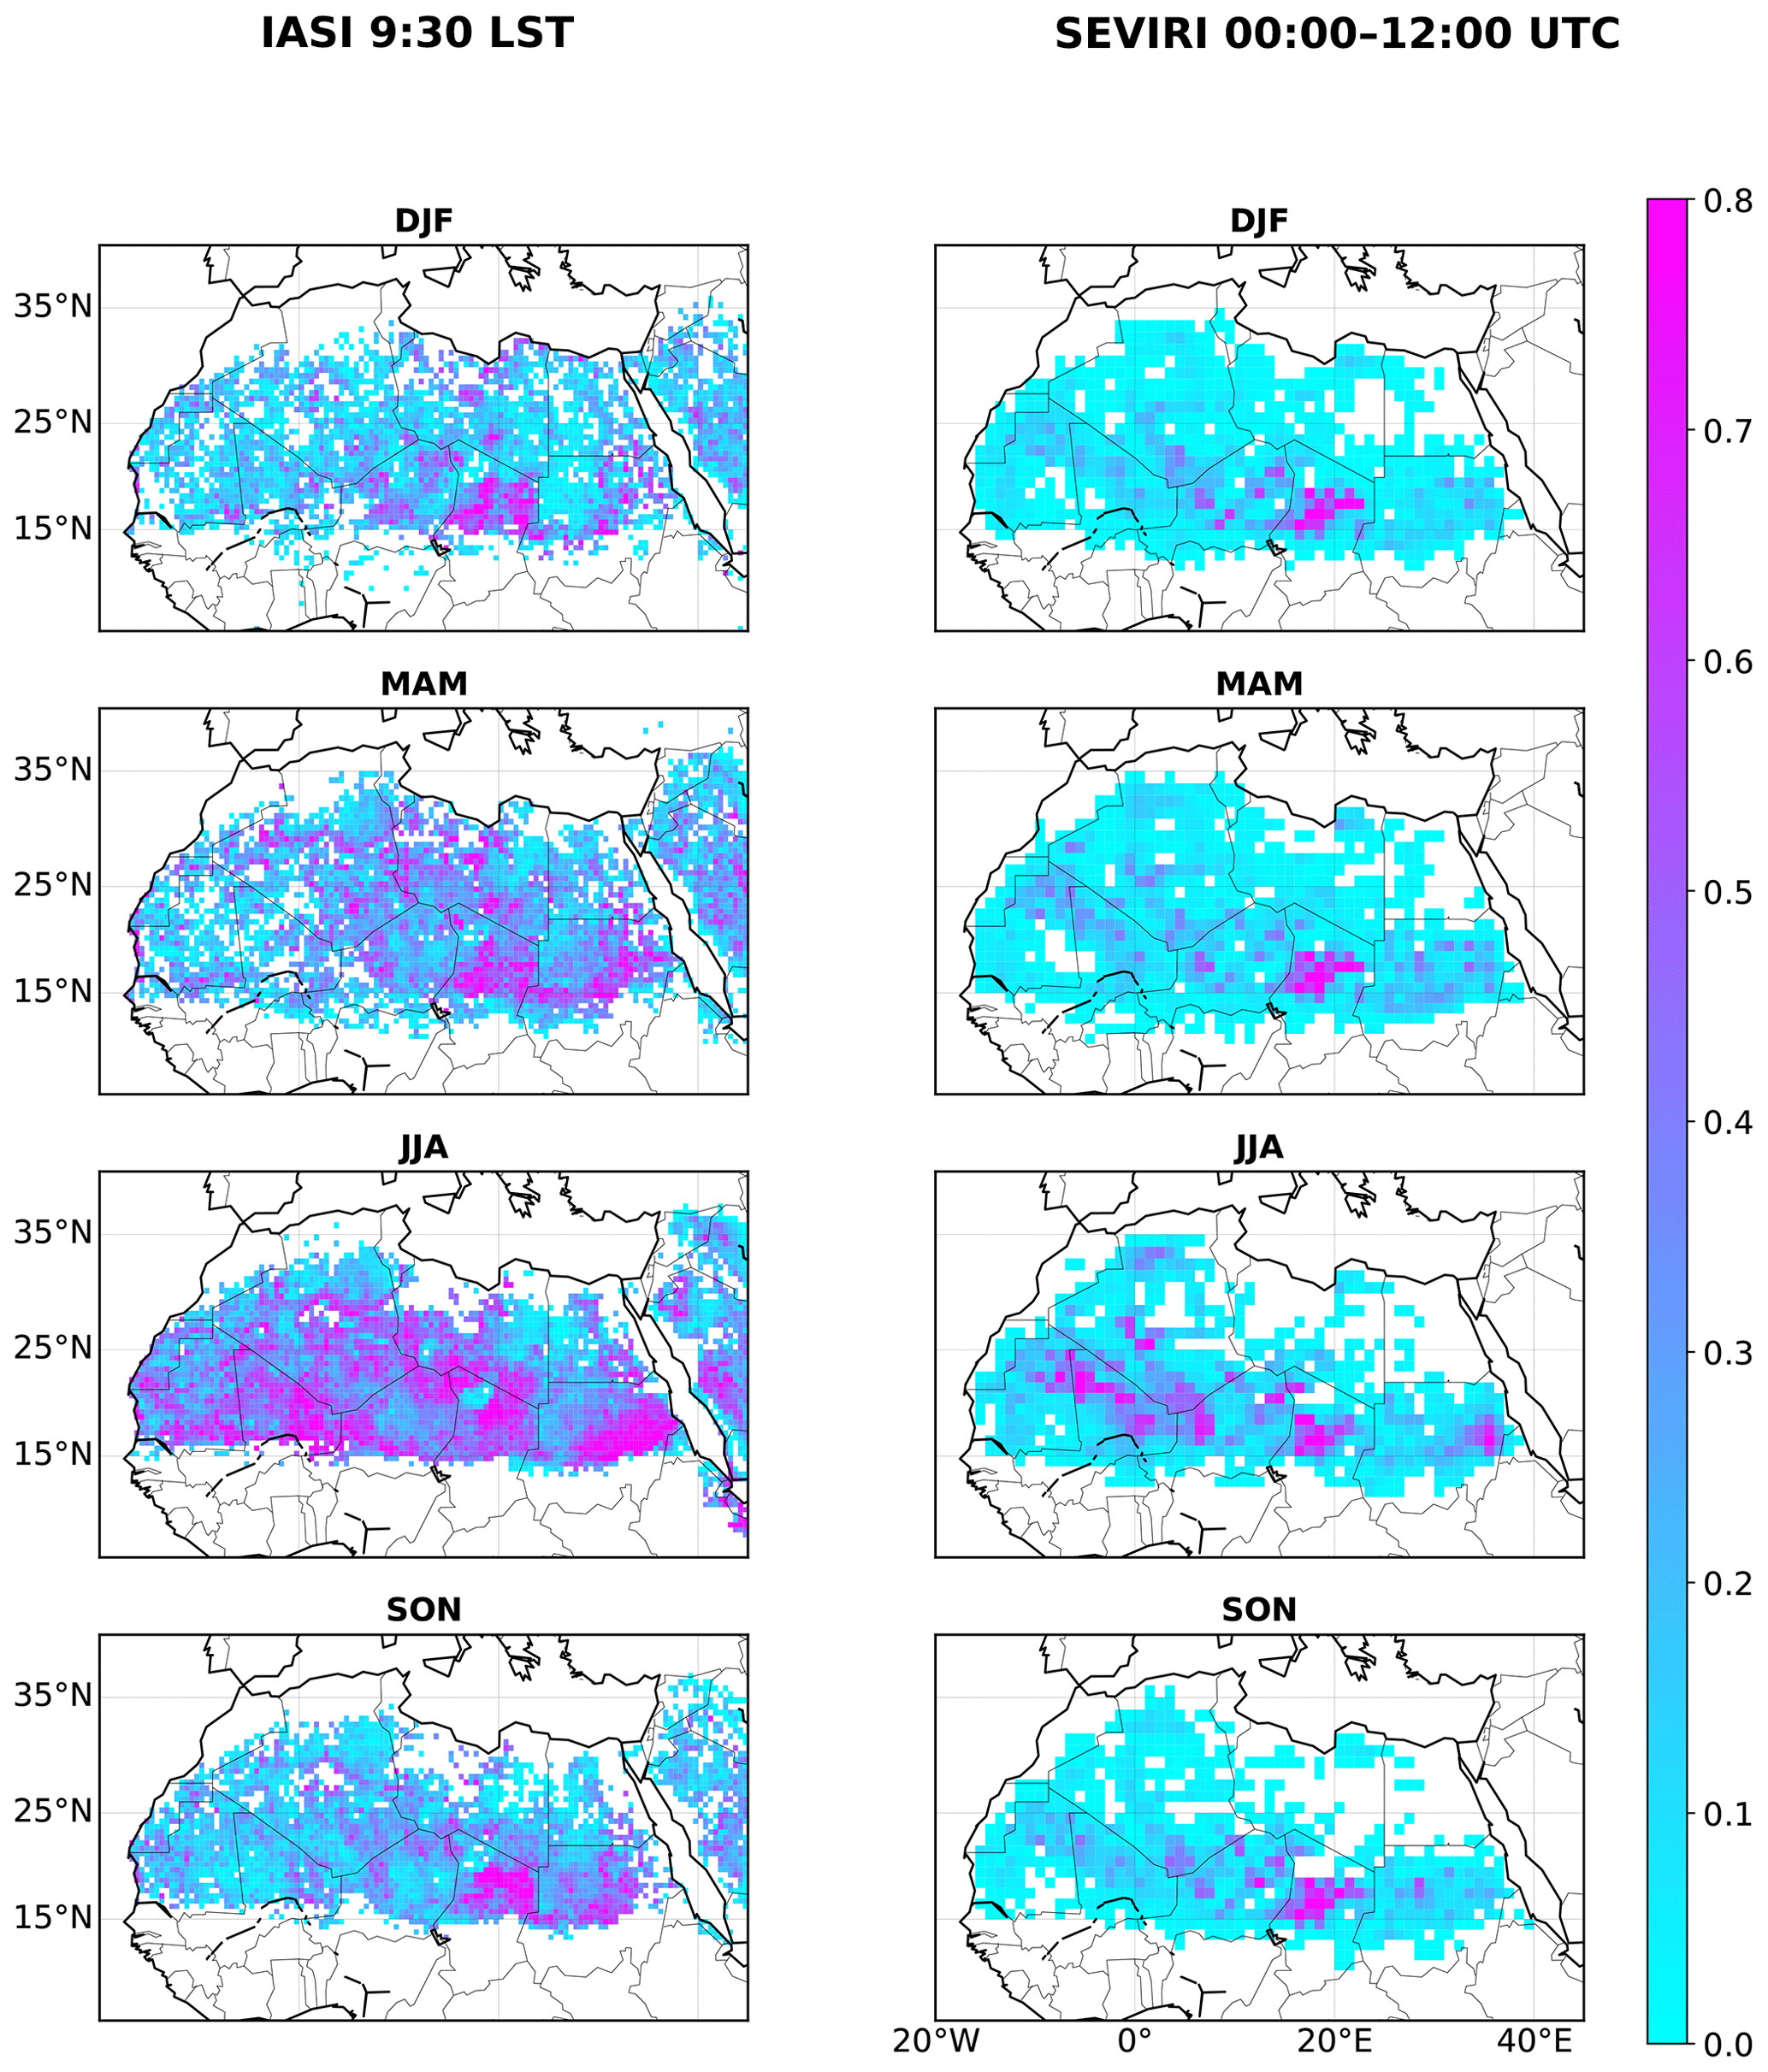
Figure 11Normalized fraction of plausible emission days from the IASI automated combined analysis (left) and normalized dust source activation frequency from SEVIRI manual dust plume tracking (right): seasonal aggregation of day data for the years from 2008 to 2009.
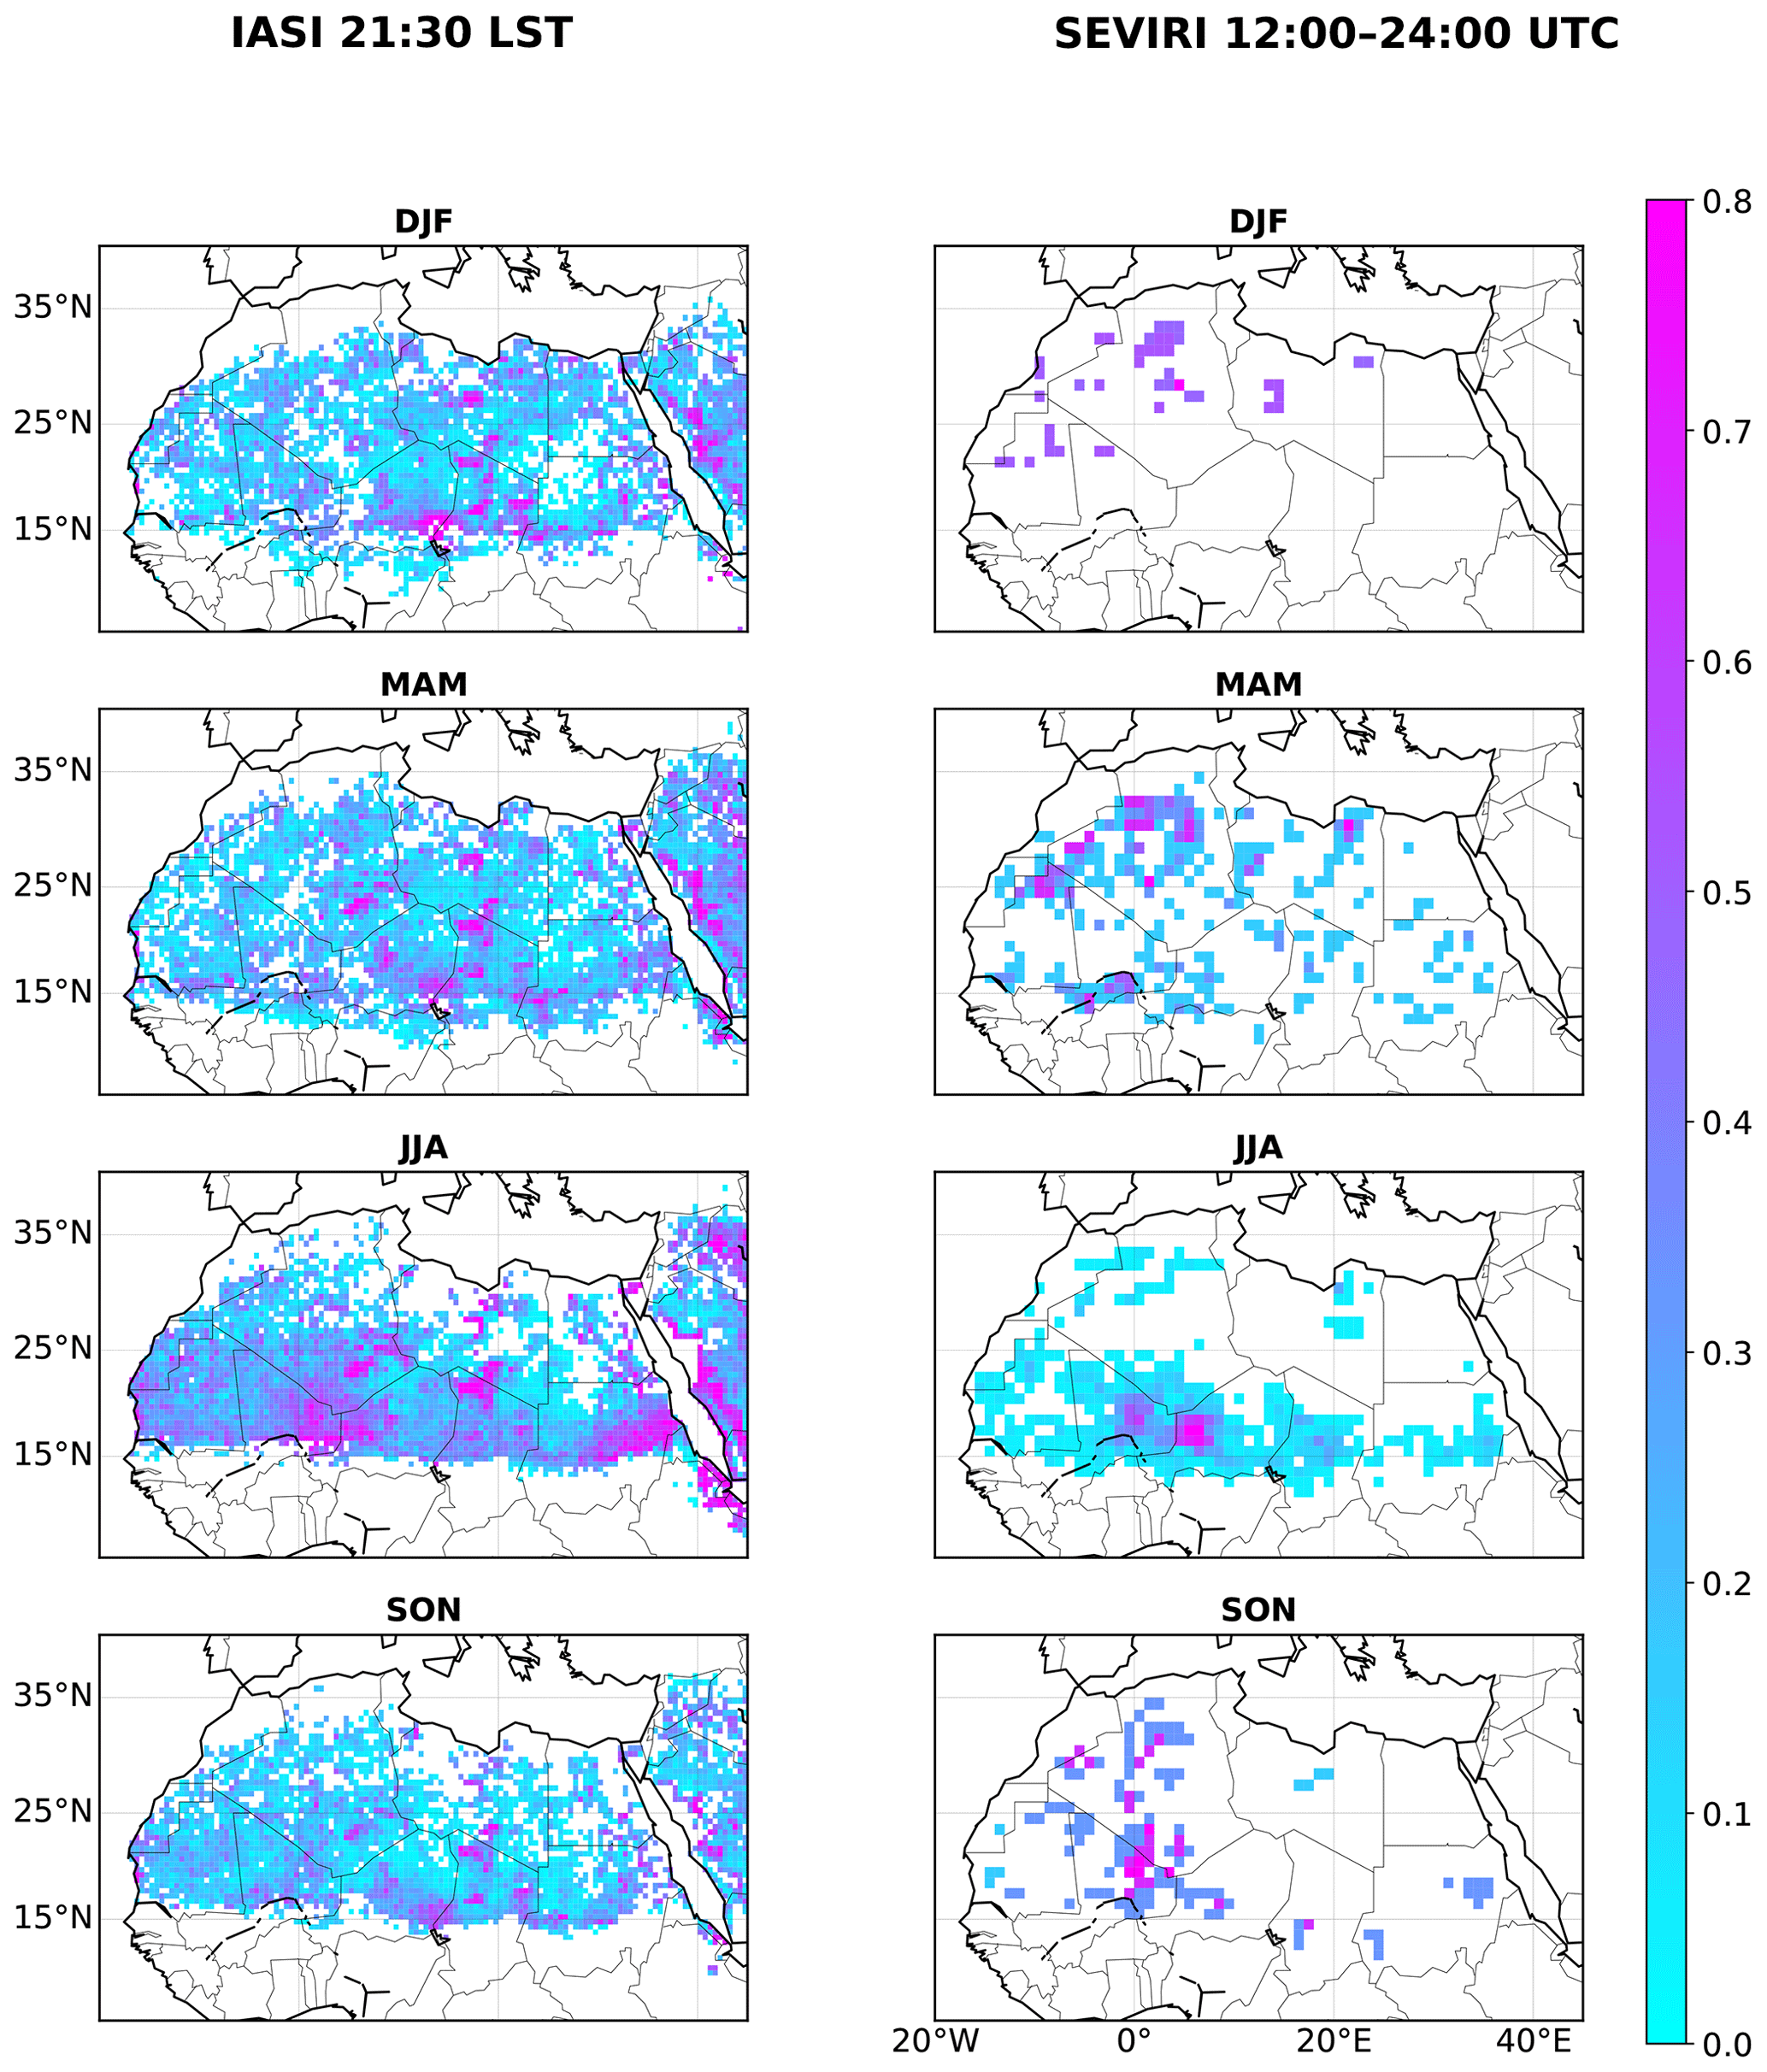
Figure 12Normalized fraction of plausible emission days from the IASI automated combined analysis (left) and normalized dust source activation frequency from SEVIRI manual dust plume tracking (right): seasonal aggregation of night data for the years from 2008 to 2009.
5.3 Discussion
Most of the differences observed in the two previous subsections can be explained as a consequence of the differences between the source identification methods.
A non-negligible part of the differences, where larger source areas are identified from the IASI automated combined analysis (the most striking example is the Sahel area during the summer), originate from the fact that this method counts big events more than once, identifying each pixel matching plausible emission conditions as a potential source. This most probably leads to an overestimation of the emission occurrences, as the low-altitude transport after emission is also recorded as a distinct plausible emission event if the local conditions are met. On the other hand, the SEVIRI manual tracking identifies only one pixel and time stamp as the source for each event and probably underestimates the continued emissions along the low-altitude plume transport if the wind remains strong enough. The fact that the Sudan source area stands out in the evening IASI automated combined analysis is the result of late morning strong winds (after the IASI morning overpass); as a consequence, these events are recorded as evening events even thought they occur between 09:30 and 12:00 LST. This is supported by two pieces of evidence. First, if the time limit for the existence of high wind speeds is set to 6 h prior to the overpass time instead of 12 h in the IASI automated combined analysis, these events are no longer observed; therefore, they are linked to late morning strong winds. Second, local emissions are observed in Sudan between 09:00 and 12:00 LST in the SEVIRI manual tracking.
The more scattered appearance of the IASI automated combined analysis results is probably linked to the fact that more small plumes are identified in an automated analysis.
The absence of the West African coastal sources from the SEVIRI manual tracking analysis can be linked to the cooler and humid inflow from the ocean, rendering the SEVIRI RGB images much less sensitive to the presence of dust (Banks et al., 2019).
The Saharan Atlas is a place where IASI has very little sensitivity to the near-surface layer; therefore, most retrieval results are rejected from the source analysis.
Finally, we do not have an explanation for the central Libyan area only being highlighted in the IASI automated combined analysis; this specific spot is not a well-known source area. As the area is identified constantly over time (see Fig. 9), it is either an artefact linked to the local surface properties (infrared emissivity) being misrepresented in the ancillary data used in the MAPIR retrieval, or it is a newly identified dust emission source.
We describe a new method for the analysis of mineral dust sources based, for the first time, on the combined use of a novel 3D dust data set retrieved from IASI measurements, near-surface wind speed data and surface characteristics. In order to identify dust source regions, monthly gridded maps of the fraction of near-surface dusty days are compiled using the quality-controlled MAPIR 3D data set. A complex filter based on the land cover type, the vegetation index, the soil moisture and wind speed is applied to best separate plausible emission regions from regions with low-altitude transported dust (including deposition and vertical down-mixing of elevated dust layers).
Our analysis highlights and illustrates the added value of using near-surface dust detection instead of total column dust loading. Indeed, based on column dust loading, areas downwind of dust sources may easily appear as hot spots. Our analysis also shows the benefit of using additional information linked to vegetation cover, soil moisture and wind speed to indicate plausible dust sources. Indeed, the southern Sahel region shows very high occurrences of near-surface dust during the winter, but the surface and wind conditions exclude those places from being plausible dust sources at the regional scale. The dust observed there predominantly originates from the Bodélé and the Sahara, which is then transported into the Sahel zone by north-easterly harmattan winds (e.g. Marticoréna et al., 2010; Kaly et al., 2015).
Our data provide, for the first time, a monthly aggregation over 9 years, allowing for the extension of the source analysis to a long period with a full seasonal pattern. This analysis has highlighted the plausibility of significant large-scale dust emissions in central Sahara (with a spring and summer maximum), in the Bodélé Depression (with a winter maximum), and in central Algeria and Sudan (with respective summer maximums). Small-scale dust emission sources are also detected all around the western and central Sahara during late spring and summer. In the Sahel, three major plausible dust emission regions are highlighted during the summer: the Mali–Niger border region, southern Mauritania and Mali east of the Mauritanian border.
The dust source analysis over north Africa shows a generally good agreement with the literature, demonstrating that our method is indeed suitable for such an analysis. We further compare the results of this new method to the results from Schepanski et al. (2012), who identified active dust sources from SEVIRI images using manual plume tracking. The two analyses, which are based on very different methods and data, generally agree regarding the hot spots and seasonality of dust emissions, although some discrepancies remain, mainly due to the different strengths and weaknesses of each method. This comparison also shows an example of how a dust source analysis depends on the method used to identify those sources. Therefore, the use of dust source analyses results must be done with caution and with sufficient knowledge of the method specifics.
Regarding the method proposed here, the main strengths are (1) dust-only observations twice per day at interesting times, (2) the combination of different data in an effort to separate local emissions from transport and (3) the automated processing that allows for a quick analysis of large areas for multiple years. The main weaknesses of the method are (1) the lack of sensitivity of the IASI measurements in some areas for some periods (excluding those from the analysis), (2) the uncertainties linked to all of the data sets and thresholds used, and (3) the rather limited time resolution of 12 h. In addition, a specificity of the method is the multiple count of long-lasting emission events if the wind and surface conditions for emission remain along with low-altitude dust transport. In such cases, this new method probably overestimates the number of events, although it may be argued that if conditions remain stable, emissions that persist in time and over a significant distance should be counted multiple times.
Building on the interesting capacity of thermal infrared sensors to also provide measurements after sunset, we present a separate analysis of the morning and afternoon/evening fractions of plausible dust emission days. This shows reduced occurrences of plausible emissions during the evening, which is consistent with the known less frequent dust source activation in the afternoon/evening. Our data also show that the Bodélé is only an active source during the morning, which is consistent with the well-known LLJ emission mechanism in that area.
Future work based on this new automated method will be the characterization of dust sources in the Middle East and in Asia, which have been less studied than African dust sources to date. In the long term, such an analysis will be possible with longer time series, allowing for the study of possible trends in dust emissions. The method will be easily adapted to use data from the IASI-NG as well as (most probably) data from the InfraRed Sounder on board Meteosat Third Generation (MTG-IRS). The latter will allow for a better time resolution with a maximum revisit time of 2 h.
The MAPIR vertical profile data are available upon request from the corresponding author. All ancillary data used in the combined analysis are freely available as mentioned in Sects. 2.3–2.5. The numerical results of the IASI automated combined analysis are available upon request from the corresponding author. The SEVIRI dust source activation frequencies are available upon request from Kerstin Schepanski.
SV developed the initial MAPIR algorithm and supervised the recent improvements, performed the analysis presented in this paper and was the primary author of the paper. SC carried out the recent improvements to the MAPIR algorithm, in particular its version 4.1, which was used in this work. KS provided the SEVIRI-based source activation data and participated in the comparison analysis and in the interpretation of all results. MDM supervised the complete study.
The authors declare that they have no conflict of interest.
This article is part of the special issue “Dust aerosol measurements, modeling and multidisciplinary effects (AMT/ACP inter-journal SI)”. It is not associated with a conference.
This work would not have been possible without the necessary data sets. Therefore, we wish to acknowledge the EUMETSAT and EUMETCast service for the IASI data used in the MAPIR retrievals, the ESA CCI land cover and soil moisture projects, and ECMWF for producing and Copernicus for distributing the ERA5 wind fields used in this study. We also acknowledge Ann Carine Vandaele, Nicolas Kumps, Evelyn De Wachter, Vincent Letocart, Olivier Rasson and the BIRA-IASB ICT team for their involvement in the MAPIR scientific developments, the IASI data analysis and the establishment of the MAPIR processing chain. We are grateful to the European COST inDust network (CA16202) for fruitful discussions. Sophie Vandenbussche personally acknowledges Stephen Plummer for relevant suggestions regarding the successful execution of this analysis.
This research has been supported by the Belgian Science Policy (grant nos. WE/35/Q07, R07 and S07), the European Space Agency (grant no. 4000109874/14/I-NB), the European Space Agency and Belgian Science Policy (grant no. 4000111402), and the European Space Agency (grant no. 4000116252/16/I-NB).
This paper was edited by Michael Pitts and reviewed by three anonymous referees.
Allen, C. J. T., Washington, R., and Engelstaedter, S.: Dust emission and transport mechanisms in the central Sahara: Fennec ground-based observations from Bordj Badji Mokhtar, June 2011, J. Geophys. Res.-Atmos., 118, 1–21, https://doi.org/10.1002/jgrd.50534, 2013. a, b, c, d, e
Amiridis, V., Marinou, E., Tsekeri, A., Wandinger, U., Schwarz, A., Giannakaki, E., Mamouri, R., Kokkalis, P., Binietoglou, I., Solomos, S., Herekakis, T., Kazadzis, S., Gerasopoulos, E., Proestakis, E., Kottas, M., Balis, D., Papayannis, A., Kontoes, C., Kourtidis, K., Papagiannopoulos, N., Mona, L., Pappalardo, G., Le Rille, O., and Ansmann, A.: LIVAS: a 3-D multi-wavelength aerosol/cloud database based on CALIPSO and EARLINET, Atmos. Chem. Phys., 15, 7127–7153, https://doi.org/10.5194/acp-15-7127-2015, 2015. a
Ashpole, I. and Washington, R.: A new high-resolution central and western Saharan summertime dust source map from automated satellite dust plume tracking, J. Geophys. Res.-Atmos., 118, 1–15, https://doi.org/10.1002/jgrd.50554, 2013. a, b, c
Banks, J. R., Brindley, H. E., Hobby, M., and Marsham, J. H.: The daytime cycle in dust aerosol direct radiative effects observed in the central Sahara during the Fennec campaign in June 2011, J. Geophys. Res.-Atmos., 119, 13861–13876, https://doi.org/10.1002/2014JD022077, 2014. a
Banks, J. R., Hünerbein, A., Heinold, B., Brindley, H. E., Deneke, H., and Schepanski, K.: The sensitivity of the colour of dust in MSG-SEVIRI Desert Dust infrared composite imagery to surface and atmospheric conditions, Atmos. Chem. Phys., 19, 6893–6911, https://doi.org/10.5194/acp-19-6893-2019, 2019. a
Bergametti, G., Marticoréna, B., Rajot, J. L., Chatenet, B., Féron, A., Gaimoz, C., Siour, G., Coulibaly, M., Koné, I., Maman, A., and Zakou, A.: Dust uplift potential in the Central Sahel: an analysis based on 10 years of meteorological measurements at high temporal resolution, J. Geophys. Res.-Atmos., 112, 1–16, https://doi.org/10.1002/2017JD027471, 2017. a
Boucher, O., Randall, D., Artaxo, P., Bretherton, C., Feingold, G. andForster, P., Kerminen, V.-M., Kondo, Y., Liao, H., Lohmann, U., Rasch, P., Satheesh, S., Sherwood, S., Stevens, B., and Zhang, X.: Climate Change 2013: The Physical Science Basis. Contribution of Working Group I to the Fifth Assessment Report of the Intergovernmental Panel on Climate Change, chap. Clouds and Aerosols, Cambridge University Press, Cambridge, United Kingdom and New York, NY, USA, 2013. a
Callewaert, S., Vandenbussche, S., Kumps, N., Kylling, A., Shang, X., Komppula, M., Goloub, P., and De Mazière, M.: The Mineral Aerosol Profiling from Infrared Radiances (MAPIR) algorithm: version 4.1 description and evaluation, Atmos. Meas. Tech., 12, 3673–3698, https://doi.org/10.5194/amt-12-3673-2019, 2019. a, b, c, d
Caton Harrison, T., Washington, R., and Engelstaedter, S.: A 14-Year Climatology of Saharan Dust Emission Mechanisms Inferred From Automatically Tracked Plumes, J. Geophys. Res.-Atmos., 124, 9665–9690, https://doi.org/10.1029/2019JD030291, 2019. a
Choobari, O. A., Zawar-Reza, P., and Sturman, A.: The global distribution of mineral dust and its impacts on the climate system: A review, Atmos. Res., 138, 152–165, https://doi.org/10.1016/j.atmosres.2013.11.007, 2014. a
Clerbaux, C., Boynard, A., Clarisse, L., George, M., Hadji-Lazaro, J., Herbin, H., Hurtmans, D., Pommier, M., Razavi, A., Turquety, S., Wespes, C., and Coheur, P.-F.: Monitoring of atmospheric composition using the thermal infrared IASI/MetOp sounder, Atmos. Chem. Phys., 9, 6041–6054, https://doi.org/10.5194/acp-9-6041-2009, 2009. a
Crouvi, O., Schepanski, K., Amit, R., Gillespie, A. R., and Enzel, Y.: Multiple dust sources in the Sahara Desert: The importance of sand dunes, Geophys. Res. Lett., 39, L13401, https://doi.org/10.1029/2012GL052145, 2012. a, b
Cuesta, J., Eremenko, M., Flamant, C., Dufour, G., Laurent, B., Bergametti, G., Höpfner, M., Orphal, J., and Zhou, D.: Three-dimensional distribution of a major desert dust outbreak over East Asia in March 2008 derived from IASI satellite observations, J. Geophys. Res.-Atmos., 120, 7099–7127, https://doi.org/10.1002/2014JD022406, 2015. a
Dorigo, W., Wagner, W., Albergel, C., Albrecht, F., Balsamo, G., Brocca, L., Chung, D., Ertl, M., Forkel, M., Gruber, A., Haas, E., Hamer, P. D., Hirschi, M., Ikonen, J., de Jeu, R., Kidd, R., Lahoz, W., Liu, Y. Y., Miralles, D., Mistelbauer, T., Nicolai-Shaw, N., Parinussa, R., Pratola, C., Reimer, C., van der Schalie, R., Seneviratne, S. I., Smolander, T., and Lecomte, P.: ESA CCI Soil Moisture for improved Earth system understanding: State-of-the art and future directions, Remote Sens. Environ., https://doi.org/10.1016/j.rse.2017.07.001, 2017. a
Evan, A. T., Fiedler, S., Zhao, C., Menut, L., Schepanski, K., Flamant, C., and Doherty, O.: Derivation of an observation-based map of North African dust emission, Aeolian Res., 16, 153–162, https://doi.org/10.1016/j.aeolia.2015.01.001, 2015. a
Fiedler, S., Schepanski, K., Heinold, B., Knippertz, P., and Tegen, I.: Climatology of nocturnal low-level jets over North Africa and implications for modeling mineral dust emission, J. Geophys. Res.-Atmos., 118, 6100–6121, https://doi.org/10.1002/jgrd.50394, 2013. a, b, c
Gherboudj, I., Beegum, S. N., and Ghedira, H.: Identifying natural dust source regions over the Middle-East and North-Africa: Estimation of dust emission potential, Earth-Sci. Rev., 165, 342–355, https://doi.org/10.1016/j.earscirev.2016.12.010, 2016. a, b, c, d
Ginoux, P., Prospero, J. M., Gill, T. E., Hsu, N. C., and Zhao, M.: Global-scale attribution of anthropogenic and natural dust sources and their emission rates based on MODIS Deep Blue aerosol products, Rev. Geophys., 50, RG3005, https://doi.org/10.1029/2012RG000388, 2012. a, b, c, d, e, f
Gruber, A., Dorigo, W. A., Crow, W., and Wagner, W.: Triple Collocation-Based Merging of Satellite Soil Moisture Retrievals, IEEE T. Geosci. Remote, 55, 1–13, https://doi.org/10.1109/TGRS.2017.2734070, 2017. a
Heinold, B., Knippertz, P., Marsham, J. H., Fiedler, S., Dixon, N. S., Schepanski, K., Laurent, B., and Tegen, I.: The role of deep convection and nocturnal low-level jets for dust emission in summertime West Africa: Estimates from convection-permitting simulations, J. Geophys. Res.-Atmos., 118, 1–16, https://doi.org/10.1002/jgrd.50402, 2013. a, b, c, d, e, f
Huang, J. P., Liu, J. J., Chen, B., and Nasiri, S. L.: Detection of anthropogenic dust using CALIPSO lidar measurements, Atmos. Chem. Phys., 15, 11653–11665, https://doi.org/10.5194/acp-15-11653-2015, 2015. a
Jacquinet-Husson, N., Crepeau, L., Armante, R., Boutammine, C., Chédin, A., Scott, N., Crevoisier, C., Capelle, V., Boone, C., Poulet-Crovisier, N., Barbe, A., Campargue, A., Chris Benner, D., Benilan, Y., Bézard, B., Boudon, V., Brown, L., Coudert, L., Coustenis, A., Dana, V., Devi, V., Fally, S., Fayt, A., Flaud, J.-M., Goldman, A., Herman, M., Harris, G., Jacquemart, D., Jolly, A., Kleiner, I., Kleinböhl, A., Kwabia-Tchana, F., Lavrentieva, N., Lacome, N., Xu, L.-H., Lyulin, O., Mandin, J.-Y., Maki, A., Mikhailenko, S., Miller, C., Mishina, T., Moazzen-Ahmadi, N., Müller, H., Nikitin, A., Orphal, J., Perevalov, V., Perrin, A., Petkie, D., Predoi-Cross, A., Rinsland, C., Remedios, J., Rotger, M., Smith, M., Sung, K., Tashkun, S., Tennyson, J., Toth, R., Vandaele, A.-C., and Vander Auwera, J.: The 2009 edition of the GEISA spectroscopic database, J. Quant. Spectrosc. Ra., 112, 2395–2445, 2011. a
Kaly, F., Marticoréna, B., Chatenet, B., Rajot, J., Janicot, S., Niang, A., Yahi, H., Thiria, S., Maman, A., Zakou, A., Coulibaly, B., Coulibaly, M., Koné, I., Traoré, S., Diallo, A., and Ndiaye, T.: Variability of mineral dust concentrations over West Africa monitored by the Sahelian Dust Transect, Atmos. Res., 164–165, 226–241, https://doi.org/10.1016/j.atmosres.2015.05.011, 2015. a, b
Kim, H. and Choi, M.: Impact of soil moisture on dust outbreaks in East Asia: Using satellite and assimilation data, Geophys. Res. Lett., 42, 2789–2796, https://doi.org/10.1002/2015GL063325, 2015. a
Klose, M., Shao, Y., Karremann, M. K., and Fink, A. H.: Sahel dust zone and synoptic background, Geophys. Res. Lett., 37, L09802, https://doi.org/10.1029/2010GL042816, 2010. a
Knippertz, P.: Mineral Dust – A key player in the Earth system, chap. 6: Meteorological aspects of dust storms, ISBN 978-94-017-8977-6, 121–147, Springer Netherlands, 2014. a, b, c
Knippertz, P. and Todd, M. C.: Mineral dust aerosols over the Sahara: Meteorological controls on emission and transport and implications for modeling, Rev. Geophys., 50, RG1007, https://doi.org/10.1029/2011RG000362, 2012. a, b, c, d, e
Kocha, C., Tulet, P., Lafore, J.-P., and Flamant, C.: The importance of the diurnal cycle of Aerosol Optical Depth in West Africa, Geophys. Res. Lett., 40, 785–790, https://doi.org/10.1002/grl.50143, 2013. a, b, c
Largeron, Y., Guichard, F., Bouniol, D., Couvreux, F., Kergoat, L., and Marticoréna, B.: Can we use surface wind fields from meteorological reanalyses for Sahelian dust emission simulations?, Geophys. Res. Lett., 42, 2490–2499, https://doi.org/10.1002/2014GL062938, 2015. a
Liu, Y., Dorigo, W., Parinussa, R., de Jeu, R., Wagner, W., McCabe, M., Evans, J., and van Dijk, A.: Trend-preserving blending of passive and active microwave soil moisture retrievals, Remote Sens, Environ., 123, 280–297, https://doi.org/10.1016/j.rse.2012.03.014, 2012. a
Maes, K., Vandenbussche, S., Klüser, L., Kumps, N., and de Mazière, M.: Vertical Profiling of Volcanic Ash from the 2011 Puyehue Cordón Caulle Eruption Using IASI, Remote Sens.-Basel, 8, 103, https://doi.org/10.3390/rs8020103, 2016. a
Marsham, J. H., Hobby, M., Allen, C. J. T., Banks, J. R., Bart, M., Brooks, B. J., Cavazos-Guerra, C., Engelstaedter, S., Gascoyne, M., Lima, A. R., Martins, J. V., McQuaid, J. B., O'Leary, A., Ouchene, B., Ouladichir, A., Parker, D. J., Saci, A., Salah-Ferroudj, M., Todd, M. C., and Washington, R.: Meteorology and dust in the central Sahara: Observations from Fennec supersite-1 during the June 2011 Intensive Observation Period, J. Geophys. Res.-Atmos., 118, 4069–4089, https://doi.org/10.1002/jgrd.50211, 2013. a, b
Marticoréna, B.: Mineral Dust – A key player in the Earth system, chap. 5: Dust production mechanisms, ISBN 978-94-017-8977-6, 93–120, Springer Netherlands, 2014. a, b, c, d, e
Marticorena, B., Chatenet, B., Rajot, J. L., Traoré, S., Coulibaly, M., Diallo, A., Koné, I., Maman, A., NDiaye, T., and Zakou, A.: Temporal variability of mineral dust concentrations over West Africa: analyses of a pluriannual monitoring from the AMMA Sahelian Dust Transect, Atmos. Chem. Phys., 10, 8899–8915, https://doi.org/10.5194/acp-10-8899-2010, 2010. a, b
Massie, S.: Indices of refraction for the Hitran compilation, J. Quant. Spectrosc. Ra., 52, 501–513, 1994. a
Massie, S. and Goldman, A.: The infrared absorption cross-section and refractive-index data in HITRAN, J. Quant. Spectrosc. Ra., 82, 413–428, 2003. a
Parajuli, S. P. and Yang, Z.-L.: Understanding dust emission in the Bodélé region by extracting locally mobilized dust aerosols from satellite Aerosol Optical Depth data using principal component analysis, Aeolian Res., 24, 105–113, https://doi.org/10.1016/j.aeolia.2017.01.001, 2017. a, b
Parajuli, S.P. and Zender, C.S.: Connecting geomorphology to dust emission through high-resolution mapping of global land cover and sediment supply, Aeolian Research, 27, 47–65, https://doi.org/10.1016/j.aeolia.2017.06.002, 2017. a
Prospero, J. M., Ginoux, P., Torres, O., Nicholson, S. E., and Gill, T. E.: Environmental characterization of global sources of atmospheric soil dust identified with the NIMBUS 7 Total Ozone Mapping Spectrometer (TOMS) absorbing aerosol product., Rev. Geophys., 40, 2-1–2-31, https://doi.org/10.1029/2000RG000095, 2002. a
Rodgers, C. D.: Inverse Methods for Atmospheric Sounding – Theory and Practice, vol. 2 of Series on Atmospheric, Oceanic and Planetary Physics, World Scientific, Singapore, 2000. a
Schepanski, K., Tegen, I., Laurent, B., Heinold, B., and Macke, A.: A new Saharan dust source activation frequency map derived from MSG-SEVIRI IR-channels, Geophys. Res. Lett., 34, L18803, https://doi.org/10.1029/2007GL030168, 2007. a, b, c, d, e, f, g, h
Schepanski, K., Tegen, I., Todd, M. C., Heinold, B., Bönisch, G., Laurent, B., and Macke, A.: Meteorological processes forcing Saharan dust emission inferred from MSG-SEVIRI observations of subdaily dust source activation and numerical models, J. Geophys. Res., 114, D10201, https://doi.org/10.1029/2008JD010325, 2009. a, b, c, d, e, f, g, h, i, j, k, l, m
Schepanski, K., Tegen, I., and Macke, A.: Comparison of satellite based observations of Saharan dust source areas, Remote Sens. Environ., 123, 90–97, 2012. a, b, c, d, e, f, g, h, i, j, k
Schepanski, K., Heinold, B., and Tegen, I.: Harmattan, Saharan heat low, and West African monsoon circulation: modulations on the Saharan dust outflow towards the North Atlantic, Atmos. Chem. Phys., 17, 10223–10243, https://doi.org/10.5194/acp-17-10223-2017, 2017. a, b, c, d, e, f, g, h
Shettle, E. P. and Fenn, R. W.: Models for the Aerosols of the Lower Atmosphere and the Effects of Humidity Variations on Their Optical Properties, AFGL-TR-79-0214, 1979. a
Todd, M. C. and Cavazos-Guerra, C.: Dust aerosol emission over the Sahara during summertime from Cloud-Aerosol Lidar with Orthogonal Polarization (CALIOP) observations, Atmos. Environ., 128, 147–157, https://doi.org/10.1016/j.atmosenv.2015.12.037, 2016. a, b, c
Tsamalis, C., Chédin, A., Pelon, J., and Capelle, V.: The seasonal vertical distribution of the Saharan Air Layer and its modulation by the wind, Atmos. Chem. Phys., 13, 11235–11257, https://doi.org/10.5194/acp-13-11235-2013, 2013. a
Vandenbussche, S., Kochenova, S., Vandaele, A. C., Kumps, N., and De Mazière, M.: Retrieval of desert dust aerosol vertical profiles from IASI measurements in the TIR atmospheric window, Atmos. Meas. Tech., 6, 2577–2591, https://doi.org/10.5194/amt-6-2577-2013, 2013. a
Volz, F.: Infrared refractive index of atmospheric aerosol substances, Appl. Optics, 11, 755–759, 1972. a
Volz, F. E.: Infrared Optical Constants of Ammonium Sulfate, Sahara Dust, Volcanic Pumice, and Flyash, Appl. Optics, 12, 564–568, https://doi.org/10.1364/AO.12.000564, 1973. a