the Creative Commons Attribution 4.0 License.
the Creative Commons Attribution 4.0 License.
Study on the impact of three Asian industrial regions on PM2.5 in Taiwan and the process analysis during transport
Ming-Tung Chuang
Maggie Chel Gee Ooi
Neng-Huei Lin
Joshua S. Fu
Chung-Te Lee
Sheng-Hsiang Wang
Ming-Cheng Yen
Steven Soon-Kai Kong
Wei-Syun Huang
The outflow of the East Asian haze (EAH) has attracted much attention in recent years. For downstream areas, it is meaningful to understand the impact of crucial upstream sources and the process analysis during transport. This study evaluated the impact of PM2.5 from the three largest industrial regions on the Asian continent, namely the Bohai Rim industrial region (BRIR), Yangtze River Delta industrial region (YRDIR), and Pearl River Delta industrial region (PRDIR), in Taiwan and discussed the processes during transport with the help of air quality modeling. The simulation results revealed that the contributions of monthly average PM2.5 from BRIR and YRDIR were 0.7–1.1 and 1.2–1.9 µg m−3 (∼ 5 % and 7.5 % of the total concentration) in Taiwan, respectively, in January 2017. When the Asian anticyclone moved from the Asian continent to the western Pacific, e.g., on 9 January 2017, the contributions from BRIR and YRDIR to northern Taiwan could reach daily averages of 8 and 11 µg m−3. The transport of EAH from BRIR and YRDIR to low-latitude regions was horizontal advection (HADV), vertical advection (ZADV), and vertical diffusion (VDIF) over the Bohai Sea and East China Sea. Over the Taiwan Strait and the northern South China Sea, cloud processes (CLDS) were the major contribution to PM2.5 due to a high relative humidity environment. Along the transport from high-latitude regions to low-latitude regions, aerosol chemistry (AERO) and dry deposition (DDEP) were the major removal processes. When the EAH intruded into northern Taiwan, the major processes for the gains of PM2.5 in northern Taiwan were HADV and AERO. The stronger the EAH, the more the EAH could influence central and southern Taiwan. Although PRDIR is located downstream of Taiwan under northeasterly wind, the PM2.5 from PRDIR could be lifted upward above the boundary layer, allowing it to move eastwards. When the PM2.5 plume moved over Taiwan and was blocked by mountains, PM2.5 could be transported downward, via boundary layer mixing (VDIF), as it was further enhanced by the passing cold surge. In contrast, for the simulation of July 2017, the influence from the three industrial regions was almost negligible unless there was a special weather system, such as thermal lows which may have carried pollutants from PRDIR to Taiwan, but this occurrence was rare.
- Article
(18459 KB) - Full-text XML
-
Supplement
(10251 KB) - BibTeX
- EndNote
The damage of PM2.5 (aerodynamic diameter is equal or less than 2.5 µm) to the respiratory system has been proven (Kagawa, 1985; Schwartz et al., 1996; Zhu et al., 2011). Short-term human exposure to PM2.5 can inflict cardiovascular and respiratory diseases, reduce lung function, and increase respiratory symptoms such as rapid breathing, coughing, and asthma. The long-term influences include mortality from heart or lung disease, cardiovascular illness (Pope et al., 2004; Brook et al., 2004; Ohura et al., 2005), and the overuse of medical resources (Atkinson et al., 2001). Environmentally, PM2.5 not only absorbs and scatters solar radiation but also impairs visibility (Na et al., 2004), influences the balance of radiation and the global climate (Hu et al., 2017), and the heterogeneous reactions of oxidants in the troposphere (Tie et al., 2005).
Chang et al. (2011) described the East Asian winter monsoon as being characterized by the cold-core Siberian–Mongolian high at the surface. The observations of meteorology from the Taiwan Central Weather Bureau showed that the winter monsoon usually extends from September to May (Chuang et al., 2018). During the winter monsoon period, northeasterly wind prevails over East Asia and transports the East Asian haze (EAH) to downwind regions, including the Korean peninsula, Japan, and Taiwan (Zhang et al., 2015). The EAH has started to spread from the Asian continent to East Asia in spring and winter due to the movement of anticyclones (Fu et al., 2014). Most literature discussing the transport of EAH in recent years generally applied two methods, namely trajectories statistics (TS) and chemical transport modeling (CTM). The TS method calculates the frequency of the backward trajectories passing through specific surrounding regions. The frequency of the trajectories passing through a specific region implied the impact level of PM2.5 contributed by this region. The trajectories could be calculated from, for example, the archived meteorological data of the National Oceanic and Atmospheric Administration Air Resources Laboratory (NOAA ARL; https://www.ready.noaa.gov/archives.php, last access: 27 November 2020) or Weather Research and Forecasting (WRF; Skamarock and Klemp, 2008) simulation results. Pawar et al. (2015) utilized the TS method to assess the impacts of short-range and long-range transport (LRT) of PM2.5 on Mohali in the northwestern Indo-Gangetic Plain. A similar method was applied to evaluate the contribution of LRT of PM2.5 to southwestern Germany (Garg and Sinha, 2017) and eastern Germany (van Pinxteren et al., 2019). Although the TS method has been widely used, the passing frequency over some specific regions can only approximate statistics of the contributions from those regions. The plume transport from an upstream region to the receptor mixes and reacts with air and pollutants along the path of transport. This suggests that the plume arriving at the receptor is no longer the plume emitted from the initial upstream region. The farther the upstream place is from the receptor, the more uncertainty there will be in the TS method. Therefore, the TS method contains substantial uncertainty.
The application of CTM on the study of transport usually comprises two methods, namely the brute force method (BFM) and the apportionment method (AM). The principle of BFM is to run two simulations, including one control run (base case) and another one without a specific source (zero-out case). The difference between the base case and the zero-out case is the reduction of the zero-out source. The reduction is approximately the contribution of that zero-out source under the assumption that the contributions of each source are additive. However, there is an indirect contribution not considered in the BFM method, i.e., the chemical reactions between the specific zero-out source and surrounding sources are neglected. The indirect contribution could be large if the zero-out sources and surrounding sources are both huge and have sufficient time to react. The BFM method has been widely used for estimating the contribution of a specific source or the effect of a control strategy (Burr and Zhang, 2011; Chen et al., 2014; X. Li et al., 2017) because this method is easy and straightforward. Nevertheless, this method is not perfect because it potentially ignores chemical reactions between the specific sources with the remaining sources. Therefore, the BFM method is more reliable if the effect of the chemical reaction is minor.
The AM method is more complicated and applies the idea of the apportionment technique to the CTM model. The simulation consumes many computing resources, but it could estimate the contributions of different emission sources in a single run. Skyllakou et al. (2014) applied the particulate matter source apportionment technique (PSAT; Wagstrom et al., 2008) in the 3D chemical transport model (PMCAMx; Fountoukis et al., 2011) to assess the impact of local pollution (LP), short-distance transport, and LRT on Paris, France. Kwok et al. (2013) also developed a similar technique called the integrated source apportionment method (ISAM) in the Community Multiscale Air Quality Modeling System (CMAQ) model (Byun and Schere, 2006). The AM method can be used to evaluate the contributions of different emission sources simultaneously; however, it does not comprehensively account for the nonlinear chemical reactions between sources. The BFM and AM methods both have their advantages. The CTM, especially the AM method, is able to give clearer contributions from a specific source compared to the TS method or the BFM method. However, the AM method requires large computer resources and complicated preparation of individual emission files. Therefore, the AM method was not used in this study, and we selected BFM instead. Despite this, the AM method should be widely used when computer resources are not a problem. It should be noted that the CTM also contains many uncertainties such as emissions, meteorology, chemical mechanisms, and numerical methods.
The LRT of EAH has a tremendous impact on the air quality in Taiwan. The following is a brief review of such modeling studies. Chang et al. (2000) applied the CTM to simulate the influence of LRT acid pollutants from East Asian to Taiwan. In the six events of 1993, the average contribution accounted for 9 %–45 % and 6 %–33 % of total sulfur and nitrogen deposition in Taiwan; those were the highest when the northeastern monsoon prevailed. Chuang et al. (2008b) utilized CMAQ to simulate the chemical evolution of PM2.5 compositions in the moving plume from Shanghai to Taipei. They found that the proportion of nitrate in PM2.5 would decrease but that of sulfate would increase along the transport path. Chen et al. (2013, 2014) also applied the CMAQ to assess the PM2.5 distribution in East Asia and subsequently estimated the impact of PM2.5 from the Asian continent on Taiwan. They suggested that the direct and indirect LRT accounted for 27 % and 10 %, respectively, of PM2.5 in Taiwan in 2007. For the autumn and winter of 2007, the LRT contributed 39 % and 41 % to the total PM2.5 in Taiwan. Chuang et al. (2017) simulated three types of PM2.5 episodes in the LRT, namely the LP and the LRT and LP mix. Both the simulation and observation showed that the proportion of NO in PM2.5 was very small in the EAH and a strong north-to-northeasterly wind increased the proportion of sea salt at the northern tip of Taiwan. Chuang et al. (2018) developed an efficient method which makes use of 5-month simulation results to estimate the LRT PM2.5 and LP PM2.5 at any place in Taiwan. They classified the daily PM2.5 into LRT events (high-concentration events caused by pure LRT), LRT ordinary (nonevents caused by pure LRT), and LRT and LP and pure LP (other days influenced by a mixture of LRT and LP and pure LP), which were 31–39, 12–16, and 4–13 µg m−3 at the northern tip of Taiwan from 2006 to 2015 for the northeastern monsoon period.
If we can identify the sources contributing the most to the LRT PM2.5 and the transport pathway, then we can enhance the ability to predict the LRT PM2.5, i.e., the EAH; however, if we want to discuss the transport pathway from one place to another, we need to assign some specific sources at the upstream and Taiwan at the downstream. From the emissions map of Asia (M. Li et al., 2017; Kurokawa and Ohara, 2020), the largest emission sources were the power and industry sectors. The three largest industrial regions in mainland China are the Bohai Rim industrial region (BRIR), the Yangtze River Delta industrial region (YRDIR), and the Pearl River Delta industrial region (PRDIR), as illustrated in Fig. 1. The present study attempted to assess the impact of these three industrial regions on the PM2.5 in Taiwan. It applied the CTM with the BFM method to simulate four scenarios, namely base (control case with all emissions), BRIR (all emissions except BRIR), YRDIR (all emissions except YRDIR), and PRDIR (all emissions except PRDIR) scenarios and, thus, resulted in the determining the contributions of each industrial region. As mentioned above, the difference between the base and zero-out scenario is the reduction in the specific source. The reduction can only approximate the contribution of that specific source when the chemical reactions are unimportant. This study shows that the pollutants from those three industrial regions are transported to Taiwan along with the northeastern monsoon. Therefore, we can roughly estimate the contributions of BRIR, YRDIR, and PRDIR to PM2.5 with the difference between the base case and the BRIR, YRDIR, and PRDIR cases. In addition, this study applied the integrated process rate (IPR) technique (Byun and Schere, 2006; Liu and Zhang, 2013) in CMAQ to discuss the process analysis during transport from the industrial regions to Taiwan. The bottom 20 layers (below 1.7 km) were selected for IPR analysis since they have covered the boundary layer where the main physical and chemical processes take place. The climate in East Asia is divided into the northeastern monsoon season in winter and the southwestern monsoon season in summer. To understand the LRT in different seasons, the simulation periods for this study were January and July 2017. We also selected representative events to discuss in detail.
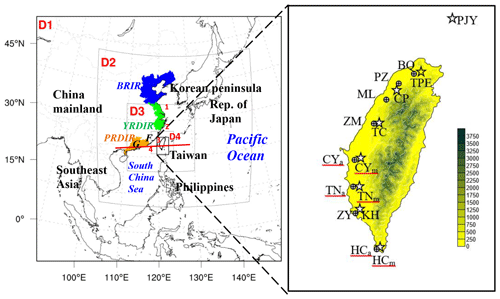
Figure 1Geographic location of three major industrial regions (BRIR – enclosed region with the blue line; YRDIR – green; PRDIR – orange) in East Asia and meteorological and air quality stations in Taiwan. The meteorological stations include Peng Jiayu (PJY), Taipei (TPE), Chupei (CP), Taichung (TC), Chiayi (CYm), Tainan (TNm), Kaohsiung (KH), and Hengchun (HCm). The air quality stations include Banqiao (BQ), Pingzhen (PZ), Miaoli (ML), Zhongming (ZM), CYa, TNa, Zuoying (ZY), and HCa. The numbers from 1 to 4 in red along the coast of eastern China represent the locations of the Bohai Sea, East China Sea, Taiwan Strait, and northern South China Sea, respectively. The red line is the cross-section plot of Fig. 4. F and G indicate the locations of Fujian and Guangdong provinces, respectively.
The EAH events mainly occur in winter (Chuang et al., 2008a; Wang et al., 2016). Although the high PM2.5 events in Taiwan caused by the EAH during the spring period were sometimes enhanced by the Southeast Asian biomass burning aerosol (Yen et al., 2013; Chuang et al., 2016; Lin et al., 2017), the latter would implicitly complicate the transport of EAH, and their co-occurrence has to be left to a study in the near future. In previous studies (Zheng et al., 2018; Chuang et al., 2018), the anthropogenic emissions in China have obviously decreased since 2013; therefore, a year after 2013 was chosen. Moreover, in order to show the difference in transport between winter and summer, this study chose January and July 2017 to represent the LRT in the winter and summer period and their contrast, with more discussion on the winter transport due to greater impact of the EAH.
2.1 Geographical location of the meteorological and air quality observation sites
Taiwan is an island located in the western Pacific, separated from mainland China on the west by the Taiwan Strait. To the north is the East China Sea and to the south sits the Philippines across the Bashi Strait. For a meteorological evaluation, we chose the following eight representative stations (all shown in Fig. 1) operated and maintained by the Taiwan Central Weather Bureau (CWB): Peng Jiayu (PJY), Taipei (TPE), Chupei (CP), Taichung (TC), Chiayi (CYm), Tainan (TNm), Kaohsiung (KH), and Hengchun (HCm) to evaluate the modeling performance of temperature, relative humidity, wind speed, and wind direction. The propeller wind direction anemometer (Komatsu Ltd.), quartz precision thermohygrograph (model no. 3-3122; Isuzu Seisakusho Co., Ltd.), and Pt electrical resistance thermometer (model no. 05103; R.M. Young Company) were used to monitor the wind speed and direction, relative humidity and air temperature, respectively. The measurement equipment was under routine calibration by the Taiwan CWB (https://www.cwb.gov.tw/Data/knowledge/announce/MIC.pdf, last access: 27 November 2020).
Since most residents live in the relatively flat western Taiwan region, the observations of air quality monitoring stations (see Fig. 1 for the locations) operated and maintained by the Taiwan Environmental Protection Administration (TEPA) at the Banqiao (BQ), Pingzhen (PZ), Miaoli (ML), Zhongming (ZM), Chiayi (CYa), Tainan (TNa), Zuoying (ZY), and Hengchun (HCa) stations were chosen for PM2.5 evaluation. The BAM-1020 particulate monitor (Met One Instruments Inc.) was used to monitor PM2.5. The automatic meteorological and air quality data are provided in hourly recordings to the public.
In this study, we also compared the modeling results with the PM2.5 composition analyzed by Lee et al. (2017) at BQ, ZM, and CYa for 13 January and 18 July 2017. They used the SASS PM2.5 samplers (Met One Instruments Inc.) to collect the 24 h (00:00 to 00:00 local time – LT) PM2.5 composition samples every 6 d. The quality assurance of the PM2.5 monitoring and analysis is referred to in Lee et al. (2017; see chapter 4).
2.2 Models and modeling configuration
This study applied the WRF v3.9.1 (Skamarock and Klemp, 2008) and CMAQ v5.2.1 (Byun and Schere, 2006) for scenario simulations. The WRF and CMAQ modeling used two-way and one-way nesting methods, respectively, in this study. The initial meteorological condition was from ds083.3 NCEP GDAS and FNL 0.25 Degree Global Tropospheric Analyses and Forecast Grids (https://rda.ucar.edu/datasets/ds083.3/, last access: 27 November 2020). The horizontal resolutions of the four domains, from outer to inner, were 81, 27, 9, and 3 km, respectively. The first domain covered East Asia and Southeast Asia, and the fourth domain contained only the Taiwan island. The vertical layers were 46, approximately 20 layers below 1.7 km, in which the boundary layer was well resolved. The model's top is set to 50 hPa. In order to obtain a better meteorological field, the WRF modeling applied 4D data assimilation with grid nudging for domains 1, 2, and 3, and with observation nudging for domain 4. The anthropogenic emissions for East Asia and the Taiwan island were obtained from MIX (see M. Li et al., 2017) and the Taiwan Emission Data System (TEDS) 10.0 (TEPA, 2017), which are based on the years 2010 and 2016, respectively. The MIX emissions of SO2, NOx, NMHC, NH3, CO, PM10, and PM2.5 covering Chinese mainland were adjusted with changes of −62 %, −17 %, 11 %, 1 %, −27 %, −38 %, and −35 %, respectively, according to the change in annual emissions between 2010 and 2017 (Zheng et al., 2018). This study assumes the emissions of 2017 in Taiwan are the same as those of 2016. The biogenic emissions were prepared by the Biogenic Emission Inventory System version 3.09 (BEIS3; Vukovich and Pierce, 2002) for the Taiwan island and Model of Emissions of Gases and Aerosols from Nature v2.1 (MEGAN; Guenther et al., 2012) for regions outside Taiwan. The biomass burning emissions imported the data of the Fire INventory from National Center for Atmospheric Research (NCAR; collectively FINN) v1.5 inventory (Wiedinmyer et al., 2011). The model configurations of physics and chemistry for this study are listed in Sect. S1 of the Supplement, and the emission maps of, for example, NO for four domains are referred to in Sect. S2. In addition, in order to clearly reveal the origin of the EAH arriving at Taiwan, the NOAA's Hybrid Single-Particle Lagrangian Integrated Trajectory model (HYSPLIT; Stein et al., 2015; https://www.ready.noaa.gov/HYSPLIT.php, last access: 27 November 2020) was applied in which the ensemble trajectory method and the reanalysis database were chosen.
2.3 Model evaluation
This study used statistical indexes such as mean bias (MB), mean average gross error (MAGE), and index of agreement (IOA) to evaluate temperature, wind speed, and relative humidity and used wind normalized mean bias (WNMB) and wind normalized mean error (WNME) for wind direction in the fourth domain. For PM2.5 performance in the same domain, we applied the MB, mean fractional bias (MFB), and mean fractional error (MFE), R (correlation coefficient), and IOA indexes. All of the formulas for the above indexes are from Emery (2001) and TEPA (2016), as illustrated in Sect. S3.
2.3.1 Evaluation of WRF meteorological modeling
The MB performance for the base case shows that the temperature was slightly overestimated for PJY (Table 1), which is located in the outer sea of northern Taiwan. The MAGE of the simulated temperatures at all stations are reasonable for both months. However, the IOA indicates that the simulated temperature at PJY and KH in July was less correct. The deviation in the simulated temperature for PJY and KH could be influenced by the sea surface temperature since these stations are nearer the sea than the other stations. The performance of MB indicates the simulated wind speed was underestimated at TN, which led to the low IOA. In contrast, the simulated wind speed was overestimated at HC, which could be due to the smoother terrain in the simulation than the actual situation. The performance of the wind direction at most stations is within the range of acceptance but not so for TC and CY. This deviation could potentially be due to the influences of nearby buildings. In summary, the simulated temperature, wind speed, and wind direction performed reasonably well since most indexes at many stations complied with the benchmarks. Although there is no benchmark for relative humidity in Taiwan, the performance of simulated relative humidity is good. The relative humidity in KH was slightly overestimated compared with the other stations but still acceptable. The comparisons of the observed and simulated temperature, wind speed, relative humidity, and wind direction are illustrated in Figs. S4.1, S4.2, S4.3, and S4.4.
Table 1The performance of meteorological modeling results for the present study.
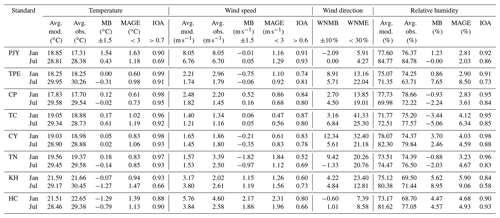
Note: (1) The standard of the statistical evaluation is based on Emery (2001) and TEPA (2016). (2) The above evaluation was for the base scenario. (3) The observation and simulation data for above evaluation were given in an hourly resolution.
2.3.2 Evaluation of CMAQ chemical modeling
For the base case, the simulated PM2.5 was overestimated at all stations except CY and HC in January 2017 (Table 2). The performance of the trend (correlation coefficient – R) is acceptable or good for all stations except HC. It is rather difficult to simulate the wind speed well at HC, where the overestimated wind speed led to a poor underestimation of PM2.5 (Chuang et al., 2016). The comparison of observed and simulated PM2.5 is illustrated in Fig. S4.5.
Table 2Simulated PM2.5 at eight air quality stations in western Taiwan.
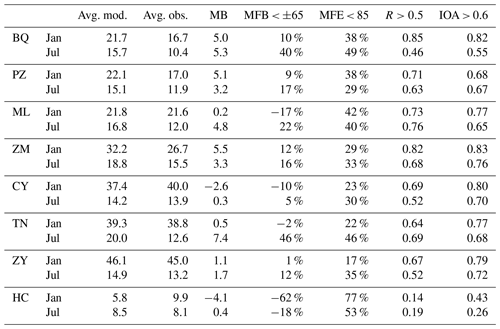
Note: (1) the standard of the statistical evaluation is based on Emery (2001) and TEPA (2016). (2) The above evaluation was for the base scenario. (3) The observation and simulation data for the above evaluation were given in an hourly resolution.
The difference between observed PM2.5 in January and in July is between 1.8 and 31.8 µg m−3, which is the largest in southern Taiwan (CY, TN, and ZY) followed by central (ZM and ML) and northern Taiwan (BQ and PZ), and the smallest at HC. Since the LRT in the prevailing northeasterly wind should have more impact on upstream northern Taiwan than downstream southern Taiwan (Chuang et al., 2018), this reveals that the LP has more impact on southern Taiwan than northern Taiwan. Chuang et al. (2018) used to estimate the contribution of LRT and LP under the prevailing northeasterly wind from 2006 to 2015. The contributions of LP to northern, central, and southern Taiwan were 40 %, 60 %, and 70 % for ordinary events.
The PM2.5 at HC is lower compared to the other stations because it is located in a small town, which is unlike the other stations that were in large cities. This suggests that HC is influenced by the local mobile and area emissions and background atmosphere. Even if we ignore the LP and simply assume that the measured PM2.5 at HC represents the background air quality for all sites (see Table 2), it is estimated that the contributions of local pollution were the difference between measured PM2.5 at each site, and the background PM2.5 levels for northern (BQ and PZ), central (ML and ZM), and southern Taiwan (CY, TN, and ZY) were 41 %–42 %, 54 %–63 %, and 75 %–78 % of measured PM2.5 levels in January and 22 %–32 %, 33 %–48 %, and 36 %–39 % in July, respectively. Although the proportion of the contribution from LRT was higher in July than in January, the PM2.5 levels in January were much higher than those in July due to the impact of the EAH.
3.1 The impact of PM2.5 in January 2017 from the three major Chinese industrial regions
As mentioned, the impact was considered as being the reduction in a specific source or roughly the contribution of that specific source for the BFM method, i.e., the difference between the base and zero-out scenarios, is applied in this study. For the impact of the three industrial regions on PM2.5 in Taiwan in January 2017, the monthly mean impact from BRIR (the difference between base and BRIR scenarios) was approximately 0.7–1.1 µg m−3, as illustrated in Fig. 2a. The relative impact was higher in northern Taiwan, with approximately 5 % of total PM2.5. The proportion of influence gradually decreased from north to south (Fig. 2b).
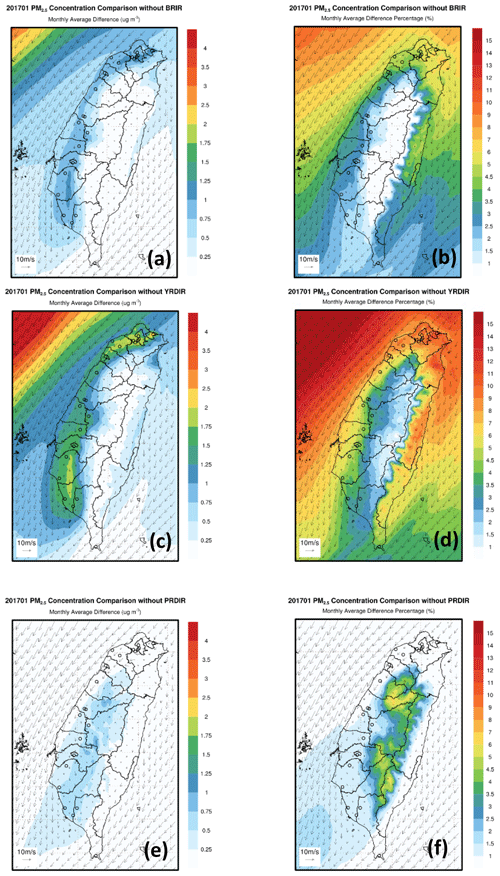
Figure 2The monthly average wind field and impact of PM2.5 from the three industrial regions on Taiwan in January 2017. BRIR (the difference between base and zero-out scenarios) – concentration (a) and percentage (b). YRDIR – concentration (c) and percentage (d). PRDIR –concentration (e) and percentage (f).
Comparing Fig. 2a and b with Fig. 2c and d, it is apparent that the monthly mean influence from YRDIR was higher than from BRIR. The reason is that YRDIR is closer to Taiwan than BRIR. The monthly mean impact from YRDIR was approximately 1.2–1.9 µg m−3, the highest in northern Taiwan, with a proportion of approximately 7.5 % of the total monthly average PM2.5 concentration. The spatial influence from BRIR was similar to YRDIR since these two industrial regions are both located off the north of Taiwan, i.e., upstream of Taiwan under the prevailing northeasterly wind. For the daily mean influence, the impact of YRDIR was also higher than BRIR, and the influencing period was almost the same for both regions because the EAH originated from YRDIR and BRIR arrived in Taiwan one after another under the prevailing northeasterly wind (Fig. 3a1–a3, b1–b3). In particular, the contributions from BRIR and YRDIR to northern Taiwan could reach daily averages of 8 and 11 µg m−3 on 9 January 2017. In January 2017, the proportion of influence was higher than on 8–9, 14–15, and 20–23 January. The influence of the EAH was closely related to the intrusion of Asian anticyclones (Chuang et al., 2008a, b).
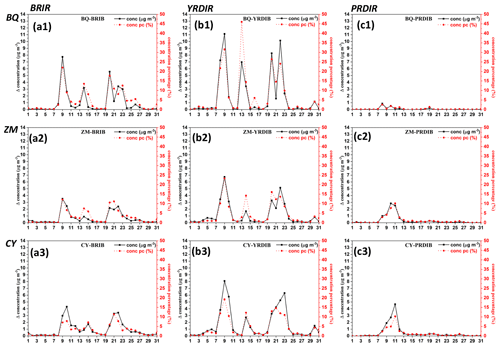
Figure 3The daily average impact of PM2.5 from BRIR, YRDIR, and PRDIR on air quality stations in Taiwan in January 2017. Panels (1), (2), and (3) denote the impact on BQ, ZM, and CY from BRIR (a), YRDIR (b), and PRDIR (c), respectively. The impact was calculated with the BFM method, i.e., the difference between the base and zero-out scenarios.
The spatial distribution of the influence from PRDIR was totally different from BRIR and YRDIR, as shown in Fig. 2e and f. Interestingly, the impact from PRDIR was higher on the mountains than on the flat plain. For the stations on flat western Taiwan, there was slight influence on 8 to 12 January 2017 (Fig. 3c1–c3). It was found that there was a stationary front from the sea north of Taiwan that extended southwest to the Fujian and Guangdong provinces (F and G in Fig. 1) on 7 January (Fig. S4.6a). The front passed Taiwan on 8 January (Fig. S4.6b). Figure 3c1–c3 show that the influence on southern Taiwan was higher than that on northern Taiwan. Similar fronts passed Taiwan on 10 January (Fig. S4.6c) and 12 January (Fig. S4.6d). From Fig. 4, it can be seen that the air mass from PRDIR would transport pollutants upward, above the top of the boundary, and then move them eastwards (Fig. 4a1, b1). When the pollutants ran into the mountains in Taiwan, they were blocked and transported to the ground through vertical mixing (Fig. 4a2–a3, b2–b3). This transport mechanism is quite similar to the biomass burning aerosols from Southeast Asia to Taiwan (Yen et al., 2013; Chuang et al., 2016). The boundary layer mixing was enhanced by the passing of a cold surge and increased PM2.5 on the ground.
3.2 The physical and chemical processes of LRT from the three major Chinese industrial regions to Taiwan in January 2017
This study applied the process analysis technique in the CMAQ model, in which the terms of horizontal advection (HADV), vertical advection (ZADV), horizontal diffusion (HDIF), vertical diffusion (VDIF), emissions (EMIS), dry deposition (DDEP), cloud process and aqueous chemistry (CLDS), gas chemistry (CHEM), and aerosol chemistry (AERO) in the diffusion equation can be resolved (Byun and Schere, 2006). Each term contributes to the rate of change in the PM2.5 level at the following locations (see Fig. 1) chosen in this study: position 1, located between the Bohai Sea and East China Sea; position 2, located between the East China Sea and Taiwan; position 3, located in the middle of the Taiwan Strait; position 4, located in the northern South China Sea; BQ in northern Taiwan; ZM in central Taiwan; and CY in southwestern Taiwan. Although CY and ZM are closer to each other than BQ, CY was selected due to PM2.5 being sampled at this station, and it is representative among many stations in southern Taiwan. Those positions were chosen because they are on the path of the northeasterly wind. Through the value of each term in the process analysis, we can understand which term can produce or remove PM2.5 at these positions and, therefore, realize the physical and chemical processes during LRT. It should be noted that each term resolved by the process analysis is based on modeling results, and no evaluation of such processes was available.
Similar to Fig. 2, we deduced the differences in base and zero-out scenarios for the IPR analysis. This study considered the reduction as the approximate contribution by each industrial region. Therefore, the following discussion is satisfied when the chemical reaction between each industrial region and the surrounding area was ignored. The physical or chemical terms in Fig. 5a1 and a2 did not always appear synchronously, and their proportions in total were not equal. This implies that position 1 was influenced by both BRIR and other nearby sources. The increase in PM2.5 was caused mainly by the process of HADV, followed by ZADV and VDIF, and the removal process was mainly AERO. The removal process is likely caused by the evaporation of ammonium nitrate in the PM2.5 plume moving from high-latitude regions to low-latitude regions through increasing ambient temperature (Stelson and Seinfeld, 1982; Chuang et al., 2008b). In contrast, there was occasionally less PM2.5 from YRDIR (Fig. 5a3) and nearly none from PRDIR (Fig. 5a4). This is expected because the northeasterly wind prevails in winter, and the BRIR and YRDIR and PRDIR are located upstream and downstream of position 1, respectively. From Fig. 5b1–b4, among the three industrial regions, it is apparent that position 2 was influenced by both the BRIR and YRDIR as it was mainly produced through inconsistent HADV, VDIF, ZADV, and CLDS, removed through AERO and occasional HADV and DDEP processes, and almost unaffected by PRDIR. For position 3, PM2.5 was influenced mainly by YRDIR (Fig. 5c3) and occasionally by BRIR (Fig. 5c2) and was also influenced by PRDIR from 8 to 12 January (Fig. 5c4), with a positive contribution of CLDS, which could be attributed to the high relative humidity environment over the Taiwan Strait. The production from BRIR and YRDIR were mainly attributed to CLDS, and the removal process was mainly AERO and, second, DDEP. The positive and negative contributions of PM2.5 for position 4 were very similar to position 3 but slightly lower (Fig. 5d1–d4) because it is further from BRIR and YRDIR than position 3. Although position 4 is very near PRDIR, it was influenced more by YRDIR (Fig. 5d3) and other sources in eastern and northern China rather than three industrial regions since the prevailing wind was mainly the northeasterly wind in January. From the above, it was found that the PM2.5 plume was transported southwards from BRIR or YRDIR on a 3D path, i.e., horizontal and vertical advection, and via vertical diffusion over the Bohai Sea and the East China Sea. During the southward transport, AERO was always the major removal process, i.e., evaporation of volatile species. When the plume was transported to subtropical regions, cloud processes became the major production process of PM2.5. The reason for this was the condensation in the mix of a cold PM2.5 plume from high-latitude regions to warm air and sea at low-latitude regions.
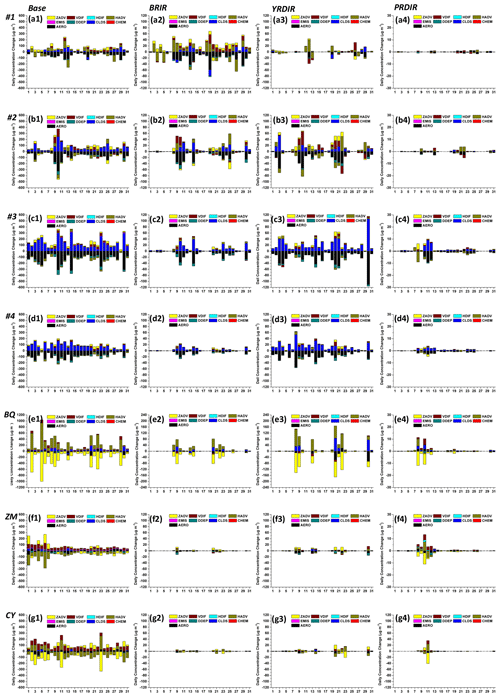
Figure 5The daily contributions of individual processes averaged over the lower 20 layers to the concentrations of PM2.5 in January 2017. Panels (a) to (g) represent positions 1 to 4 and BQ, ZM, and CY in Fig. 1, respectively. The influence of total emissions (base case), BRIR, YRDIR, and PRDIR are shown by (1), (2), (3), and (4), respectively.
The build-up of PM2.5 at BQ was mainly HADV with minor CLDS, and the removal processes were mainly ZADV with minor AERO (Fig. 5e1). This suggests that the PM2.5 plume was mainly transported horizontally when it was close to or when it reached northern Taiwan. Moreover, each industrial region contributed PM2.5 to BQ in very similar processes (Fig. 5e2–e4). In addition, certain PM2.5 was formed in northern Taiwan, probably due to the high relative humidity, which was probably induced by the clouds or fog produced by terrain uplifting. The removal process of PM2.5 at BQ was mainly ZADV, which can be explained by BQ being located in the Taipei basin, and the PM2.5 is transported up to leave the basin. Comparing Fig. 5f1 with Fig. 5f2–f3, it is obvious that the PM2.5 of ZM was produced by local pollution, i.e., the downward diffusion of VDIF, which probably came from northern Taiwan and was removed further through HADV to southern Taiwan under the prevailing northerly wind. In other words, the PM2.5 in upstream northern Taiwan was vertically advected and diffused southwards to central Taiwan and then horizontally advected to downwind areas. On the other hand, the influence from PRDIR was much less when the prevailing wind was the northeasterly monsoon (Fig. 5f4). However, when the cold surge passed Taiwan (8 and 10 January), the influence from PRDIR could not be ignored, which is illustrated in Figs. 2f, 4, and 5f4. On 8 to 10 January, the negative ZADV indicated the concentration was decreasing in the lower 20 averaged layers, where the daily process occur, but the concentration gradient was positive (; the concentration of PM2.5 from PRDIR was higher at a high altitude than that at a low altitude over Taiwan), which implies the vertical velocity had to be negative, i.e., a downward motion. Therefore, the boundary layer mixing of the aloft PM2.5 plume was enhanced by the passing of the cold surge (Yen et al., 2013; Chuang et al., 2016). For CY, located in southwestern Taiwan, VDIF and HADV mainly contributed to the gains of PM2.5, and the removal processes were mainly ZADV and AERO; however, occasionally, when the positive contributions to PM2.5 were ZADV and VDIF, the removal processes were HADV and AERO (Fig. 5f1). Comparing Fig. 5f2–f4 with Fig. 5g2–g4, it is obvious that the positive and negative contributions to PM2.5 for CY were very similar to those for ZM. The impact from BRIR and YRDIR was less than from local sources. When the cold surge passed Taiwan, PRDIR influenced PM2.5 at CY as well.
3.3 Analysis of the moderate episodes occurring on 13 January 2017
On most days in the winter period, northeasterly winds prevailed over East Asia. In this section, we chose 13 January 2017 to discuss the physical and chemical processes in detail because it is a classical moderate EAH episode in which PM2.5 sampling was implemented, and it will be discussed in Sect. 3.6. On this day, the Asian anticyclone transported pollutants from the Asian continent to Taiwan and caused high PM2.5 episodes. The 72 h backward trajectory ensemble, starting from BQ, ZM, and CY, obviously traced back to East Asia, where BRIR and YRDIR are located (Fig. S4.7a1–a3).
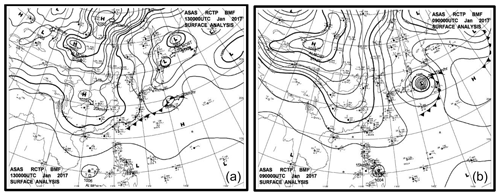
Although the impact of LRT on 13 January was less than on 8, 9, 20, or 22 January (Fig. 3), the physical and chemical processes during transport were similar for these days since the weather patterns were quite analogous to each other. Such LRT events occurred in a weather pattern, as illustrated in Fig. 6a. The Asian anticyclone was moving from East Asia to the western Pacific. The peripheral circulation of the Asian anticyclone was the strong northeasterly wind on the coastal areas and the sea. It was found the northeasterly wind formed a lee calm wind region in southern Taiwan, where PM2.5 accumulated (Fig. 7a–b). When the leading edge of the Asian anticyclone arrived, the wind speed increased and therefore enhanced the dispersion of PM2.5 in southern Taiwan (Fig. 7c–e). Subsequently, the LRT haze arrived (Fig. 7f) and split to the eastern and western side of Taiwan due to the blocking of mountains, with more hazing moving west (Fig. 7g–i).
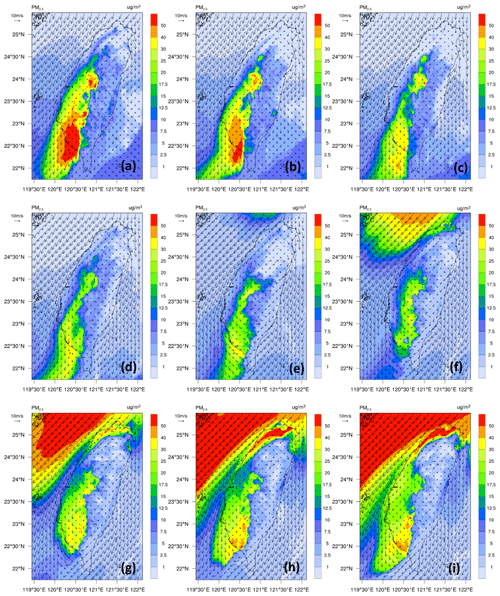
Figure 7The 3 h simulated wind vector and PM2.5 distribution of the event at (a) 00:00 LT, (b) 03:00 LT, (c) 06:00 LT, (d) 09:00 LT, (e) 12:00 LT, (f) 15:00 LT, (g) 18:00 LT, and (h) 21:00 LT on 13 January and (i) 00:00 LT on 14 January 2017.
Figure 8a1–a4 shows that the influence of BRIR was more than that of YRDIR and PRDIR at position 1 on 13 January, since BRIR is located upstream of position 1 under the northeasterly wind. The major production process was VDIF below 760 m (layer 14) and AERO with less CLDS above 760 m. This implies that the transport path from BRIR to position 1 could be horizontal between BRIR and position 1 and then vertical at the location of position 1. The removal process was AERO below 760 m and VDIF above. This suggests that the ascent and subsidence of air parcels might enhance the formation and removal of aerosols below and above 760 m, respectively. It is possible that the ascent motion of the air parcel near the warm surface moved to a cold environment at a higher altitude, up to 760 m. This may cause condensation and trigger heterogeneous reactions of aerosols. In contrast, the descent motion of the air parcel above 760 m may cause the evaporation of aerosols due to a warmer environment at lower altitudes than aloft. Although position 1 was slightly influenced by YRDIR, the contribution of different processes from YRDIR on position 1 was less and inconsistent (Fig. 8a3). The contribution of different processes from PRDIR to position 1 was also inconsistent and even less (Fig. 8a4). From Fig. 8b1–b4, it was found that position 2 was mainly influenced by YRDIR on 13 January. The major processes below layer 9 (∼ 310 m) that contributed to the increase in PM2.5 were HADV, VDIF, and ZADV, and the removal processes were DDEP and AERO (Fig. 8b3). Position 2 was slightly influenced by BRIR, with the major production processes being VDIF and ZADV, and the removal process was AERO (Fig. 8b2). On 13 January, position 3 and position 4 were less influenced by all industrial regions (Fig. 8c2–c4, d2–d4). This implied that position 3 was possibly influenced by the nearby Fujian province on the northern and western side of the Taiwan Strait. On 13 January, position 4 was also less influenced by the three industrial regions, probably due to BRIR and YRDIR being distant and PRDIR being located downstream of position 4. Comparing Fig. 8e1 with Fig. 8e2–e4, it was found the BQ was influenced more by YRDIR. The major contribution processes at BQ below 200 m (layer 7) were HADV, followed by AERO, and above 200 m they were either VDIF, ZADV, or CLDS or mixture of them. The plume moved horizontally, close to BQ, and formed a certain amount of PM2.5 when reaching BQ. The major removal process was ZADV followed by VDIF below 200 m but HADV and AERO above. BQ was less influenced by BRIR due to the long distance, deviation in the wind direction and PRDIR, since BQ is located upstream of PRDIR. In this event, ZM and CY were less influenced not only by BRIR and PRDIR but also by YRDIR (Fig. 8f1–g4). This explains the haze plume that passed BQ and was then transported for a limited distance in front of southern ZM and CY on 13 January.
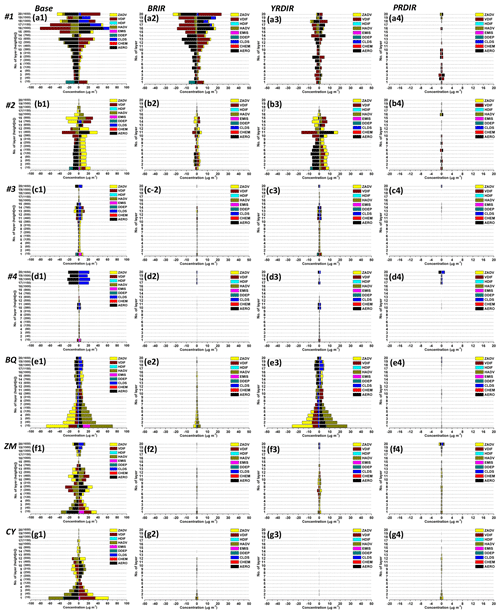
Figure 8The hourly average contribution of the physical process at each layer on 13 January 2017. Panels (a) to (g) represent positions 1 to 4, BQ, ZM, and CY in Fig. 1, respectively. The influence of total emissions, BRIR, YRDIR, and PRDIR is represented by (1), (2), (3), and (4), respectively. The values in the brackets on the y axes are the model heights of the lower 20 layers.
3.4 Analysis of the strong episodes occurring on 9 January 2017
The severe EAH episodes always accompany the arrival of strong anticyclones (Fig. 6b). This study chose 9 January to discuss because of its largest impact on January 2017. The 72 h backward trajectory ensemble starting from BQ, ZM, and CY on 9 January is similar to that on 13 January (Fig. S4.7b1–b3). The PM2.5 event occurring in western Taiwan on 9 January was similar to that on 13 January, and both were LRT of EAH. However, there were still differences between these two events. First, the impact of the three industrial regions on PM2.5 in western Taiwan was much higher on 9 January than 13 January. Second, for the haze from BRIR and YRDIR, the positive and negative contribution processes on BQ were mainly HADV and AERO and ZADV and VDIF below 200 m (layer 7; Fig. 8e3), and there were fewer different processes at different layers above 200 m on 13 January. On 9 January, the major processes leading to the increase in PM2.5 at BQ were mainly HADV below 380 m (layer 10), AERO between 120 and 900 m (layer 5 to 15), and ZADV and CLDS between 650 and 1500 m (layer 13 to 19), as illustrated in Fig. 9e2–e3. The removal process was mainly ZADV below 460 m (layer 11), HADV between 550 and 900 m (layer 12 to 15), and HADV and AERO between 1000 and 1300 m (layer 16 to 18). Third, the stronger event occurring on 9 January had a more obvious impact on ZM and CY than that of 13 January. The higher production of HADV without AERO near the surface on 9 January explains the massive accumulation of EAH over the Asian continent and the rapid movement of the anticyclone. The strong and fast plume passing BQ led to insufficient time for the formation of PM2.5 at BQ, but it could transport the EAH further to southern ZM and CY. In contrast, the higher production of AERO near the surface occurring on 13 January explains how the slow-moving EAH had time to react with the local pollutants, e.g., HNO3 in the Asian plume reacted with local NH3 to form NH4NO3, which has been discussed in Chen et al. (2014).
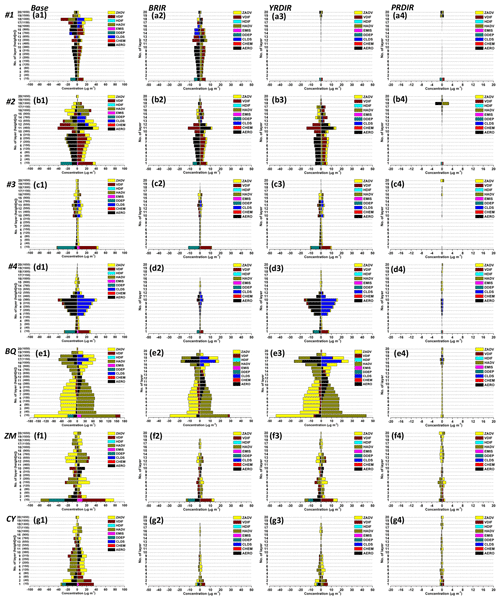
Figure 9The hourly average contribution of the physical process at each layer on 9 January 2017. Panels (a) to (g) represent positions 1 to 4, BQ, ZM, and CY in Fig. 1, respectively. The influence of total emissions, BRIR, YRDIR, and PRDIR is represented in (1), (2), (3), and (4), respectively. The values in the brackets on y axes are the model heights of the lower 20 layers.
3.5 The impact of PM2.5 from the three Chinese major industrial regions in July 2017
Figure 10a and b reveal that the impact of BRIR on PM2.5 in Taiwan was negligible in July compared to January. The monthly contribution was less than 0.01 µg m−3 or less than 0.04 % of total PM2.5 in western Taiwan. The influence from YRDIR and PRDIR on Taiwan was equally small with BRIR (Fig. 10c–f). As illustrated in Fig. S4.8, the daily contribution from the three industrial regions to western Taiwan was similar for all cities. The contribution from BRIR was only less than 0.1 µg m−3 from 25 to 28 July (Fig. S4.8a1–a7), and from YRDIR it was approximately 0.1–0.3 µg m−3 from 27 to 29 July (Fig. S4.8b1–b7) and detectable on 28 July but increased to 0.2–0.5 µg m−3 on 30 to 31 July (Fig. S4.8c1–c7). Owing to the small impact from the three industrial regions on western Taiwan, the physical and chemical processes were small for all days in July 2017 except for the last few days in that month, as illustrated in Fig. S4.9. The weather map revealed that there was a thermal low near Taiwan at the end of July (Fig. S4.10). In short, during the period of a prevailing southwesterly to southeasterly wind, the influence of BRIR, YRDIR, or PRDIR could be ignored unless there was a special weather system, such as the aforementioned thermal low, which could transport less PM2.5 from distant sources. We can consider that the Asian continent has almost no impact on Taiwan in July. In other words, the origin of PM2.5 in Taiwan in July is local pollution and the background atmosphere.
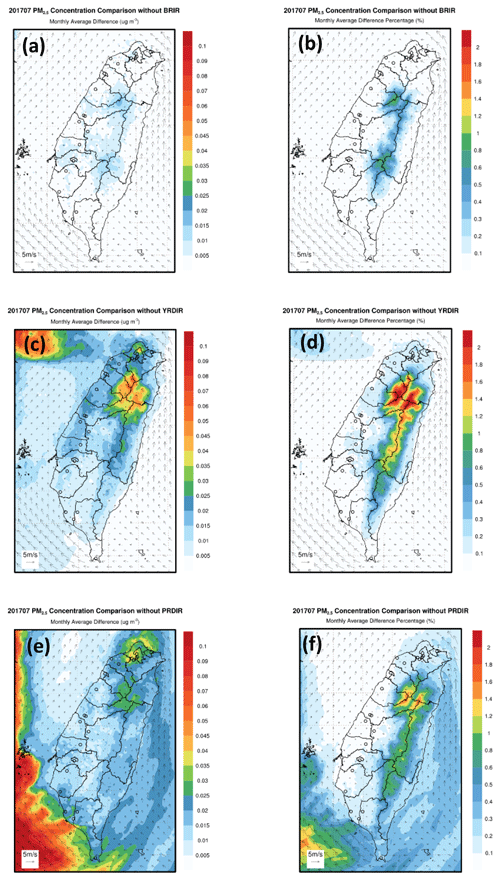
Figure 10The monthly average wind field and the impact of PM2.5 on Taiwan in July 2017. BRIR – (a) concentration and (b) percentage. YRDIR – (c) concentration and (d) percentage. PRDIR – (e) concentration and (f) percentage.
Take, as an example, 18 July 2017 on which the PM2.5 sampling was implemented. It was found that position 1 was influenced more by YRDIR than BRIR among three industrial regions (Fig. S4.11a1–a4). The positive and negative contribution processes were inconsistent below 80 m (layer 4). However, from 120 to 460 m (layer 5 to 11), the major processes in the build-up of PM2.5 were AERO and ZADV, and the removal process was mainly HADV. Figure S4.11 shows that the influence of the three industrial regions on position 2, position 3, position 4, BQ, ZM, or CY was almost negligible. Furthermore, the 72 h backward trajectory ensemble starting from BQ, ZM, and CY on this day was traced back to the clean southwestern Pacific, which implied that the airflow was controlled by the Pacific high (Fig. S4.7c1–c3). This suggested that the PM2.5 was mainly from local pollution and background atmosphere on 18 July. On the other hand, on 30 July, the 72 h backward trajectory ensemble starting from the end at BQ, ZM, and CY went through a cyclone near Taiwan and then on to the South China Sea and Philippines (Fig. S4.7d1–d3). As mentioned earlier, the thermal low over the Taiwan Strait (Fig. S4.10) caused an unstable wind field and transported pollutants from the southeastern coastal areas of the Asian continent to the northern South China Sea, the Taiwan strait, and Taiwan (Fig. S4.12). In July 2017, there was hardly any PM2.5 transported from the three industrial regions to those specific locations, except from PRDIR to position 4, as illustrated in Fig. S4.13d4.
3.6 Discussion of the chemical compositions and emissions
Lee et al. (2017) conducted PM2.5 sampling at BQ, ZM, and CY every 6 d in 2017. Only the sampling days are suitable for analysis in this study. The sampling from 13 January was compared with the simulated PM2.5 compositions, as indicated in Fig. 11. Previous studies (Wang et al., 2016) suggested that it took approximately 28 h for the PM2.5 haze to be transported from the Yangtze River estuary to the northern tip of Taiwan island. Therefore, the simulated PM2.5 compositions at position 1 and position 2 on 12 January were also illustrated. As illustrated in Fig. 11, on both 12 and 13 January the major simulated compositions were sulfate and organic carbon (OC) for position 1–4. However, the proportion of nitrate in PM2.5 at position 1 on 12 January was slightly higher than that at position 2 but much higher than that at position 3 and position 4. This can be explained by the nitrate evaporating from the aerosol phase to the gas phase for the PM2.5 plume transported from high- to low-latitude regions (Chuang et al., 2008b). The simulated proportions of Na+ and Cl− in PM2.5 at position 3 and position 4 were higher than those at position 1 and position 2. The higher sea salt due to a stronger wind speed is expected because the Taiwan Strait was a wind tunnel between the Central Mountain Range in Taiwan and the Wuyi Mountains in the Fujian province (Lin et al., 2012). In addition, the simulated proportions of nitrate in PM2.5 at BQ, ZM, and CY were higher than those over position 1–4, which should be caused by the local pollution. The comparison between the simulation and observation indicated that the performance of the simulation was not bad. The simulated proportions of nitrate and ammonium in PM2.5 were slightly lower than the observations. While the simulated proportions of K+, Ca2+, Mg2+, and Na+ were slightly overestimated. This suggested that the emissions of biomass burning and windblown dust over Taiwan island and the influence of sea salt still have room for improvement.
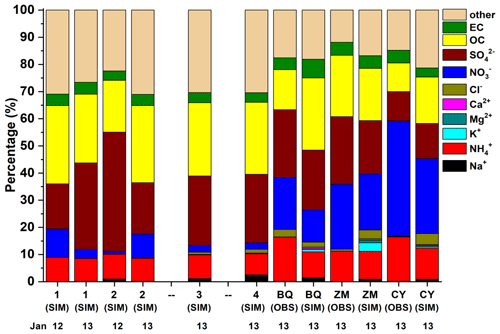
Figure 11The comparison of the simulation (SIM) and observation (OBS) of PM2.5 compositions at position 1–4 and BQ, ZM, and CY in Fig. 1 on 12 and 13 January 2017.
We also compared the simulated PM2.5 compositions with observations on 18 July 2017 (Fig. S4.14). As mentioned earlier, position 1 was influenced by upstream YRDIR, and the simulated proportion of nitrate in PM2.5 at position 1 was higher than further upstream position 2, position 3, and position 4. The simulated proportion of nitrate in PM2.5 at position 3 and position 4 was higher than position 2, which implies that position 3 and position 4 were influenced more by PRDIR than position 2. For BQ, ZM, and CY, the proportion of simulated OC in PM2.5 was slightly overestimated compared with observations, but nitrate, sulfate, and others were underestimated. Since BQ, ZM, and CY were less influenced by PRDIR on 18 July, the overestimation of OC and the underestimation of nitrate should be related to the bias of the local emissions inventory. In addition to the local emissions inventory, the underestimation of sulfate could possibly be related to the underestimation of emissions from uncertain sources, e.g., ships around Taiwan or local point sources, since the local line and area sources of SO2 are both low. Moreover, the uncertainty of emissions in the Southeast Asia Peninsula and Philippines is also another issue that needs to be improved.
This study evaluated the impact of the three largest industrial regions of the Asian continent on PM2.5 in Taiwan and discussed the process analysis during transport. It applied the CMAQ model with the BFM method and the process analysis technique. The simulation period was January and July 2017.
In January 2017, the LRT from the Asian continent to Taiwan was substantial over northern Taiwan and gradually less in central and southern Taiwan. The impact of monthly PM2.5 from BRIR and YRDIR on Taiwan was 0.7–1.1 and 1.2–1.9 µg m−3, approximately 5 % and 7.5 % of the total concentration, respectively. The daily impact was the highest on 9 January. On that day, the contribution from BRIR and YRDIR on northern Taiwan could reach daily averages of 8 and 11 µg m−3, respectively. The influence of PRDIR on Taiwan was much less than BRIR and YRDIR. However, the PM2.5 from PRDIR can influence Taiwan via transboundary transport and boundary layer mixing (VDIF), and this is enhanced when a cold surge passes Taiwan. When the cold-surge-induced events occurred, the impact from BRIR and YRDIR was substantial on BQ. The transport mechanism of the EAH from BRIR and YRDIR was horizontal (HADV) and vertical (ZADV and VDIF) at the Bohai Sea and East China Sea. When the EAH moved to the Taiwan Strait and the northern South China Sea, CLDS led to the major production of PM2.5 under a high relative humidity environment. Along the transport, AERO and DDEP were always the removal process for the EAH transported from high-latitude regions to low-latitude regions. When the EAH moved to northern Taiwan, HADV and AERO were the major contribution processes of PM2.5 at BQ. The occurrence of AERO depended on the intensity and speed of the moving plume. If the EAH plume moved quickly and passed BQ, AERO would not be obvious due to insufficient time for chemical reactions. The transport mechanism from northern Taiwan to central Taiwan and southern Taiwan was changeable due to the intensity of EAH, which caused different production and removal processes at different heights. The stronger the intensity of EAH, the more obvious the impact on central and southern Taiwan was, and the proportion of HADV that contributed to the PM2.5 budget was more obvious near the surface.
In July 2017, the influence from the three industrial regions on the PM2.5 was negligible in Taiwan, i.e., PM2.5 mainly came from local or upwind adjacent sources and the background atmosphere unless there was special weather system, e.g., a thermal low nearby that could carry small amounts of pollutants from PRDIR to Taiwan.
In regard to the performance of the MIX emissions inventory, this study compared the simulated and observed PM2.5 compositions on 13 January and 18 July. The simulated proportion of nitrate and ammonium in PM2.5 during the winter was slightly underestimated, but the simulated K+, Ca2+, Mg2+, and Na+ were overestimated at BQ, ZM, and CY. This suggested that the bias in the local emission inventory has lacked the correct information about local biomass burning. During the summertime, the simulated proportion of OC in PM2.5 was overestimated but underestimated for nitrate, sulfate, and others. In addition to the bias of local emissions inventory, the LRT emission of sulfate is another reason for the difference.
All the observational data sets used in this study and the simulation data generated by this study can be accessed from the corresponding author, Ming-Tung Chuang (mtchuang100@gmail.com).
The supplement related to this article is available online at: https://doi.org/10.5194/acp-20-14947-2020-supplement.
MTC designed the experiment, carried out most parts of the study, and wrote the original draft. MCGO helped produce half of the figures and revised the paper. NHL is the project leader and provided consultations and acquired the financial support for this study. JSF submitted valuable questions and helped enhance the writing. CTL provided the PM2.5 composition data and provided related consultations. SHW and MCY provided beneficial consultations according to their previous publications. SSKK helped with part of the postprocessing of the simulation results. WSH helped with maintenance of the computing machine.
The authors declare that they have no conflict of interest.
This article is part of the special issue “Regional assessment of air pollution and climate change over East and Southeast Asia: results from MICS-Asia Phase III”. It is not associated with a conference.
The researchers acknowledge contributions from the U.S. National Centers for Environmental Prediction and the databank for atmospheric and hydrologic research (managed by the Department of Atmospheric Science of the Chinese Culture University and sponsored by the Ministry of Science and Technology) for the input data used in the meteorological modeling and for the monitoring data in the evaluation of meteorological modeling.
This research has been supported by the Taiwan Environmental Protection Administration (grant nos. EPA-105-FA18-03-A298 and EPA-106-FA18-03-A215).
This paper was edited by Gregory R. Carmichael and reviewed by two anonymous referees.
Atkinson, R. W., Anderson, H. R., Sunyer, J., Ayres, J., Baccini, M., Vonk, J. M., Boumghar, A., Forastiere, F., Forsberg, B., Touloumi, G., Schwartz, J., and Katsouyanni, K.: Acute effects of particulate air pollution on respiratory admissions – Results from APHEA 2 project, Am. J. Resp. Crit. Care., 164, 1860–1866, https://doi.org/10.1164/ajrccm.164.10.2010138, 2001.
Brook, R. D., Franklin, B., Cascio, W., Hong, Y., Howard, G., Lipsett, M., Luepker, R., Mittleman, M., Samet, J., and Smith, S. C.: Air pollution and cardiovascular disease A statement for healthcare professionals from the expert panel on population and prevention science of the American Heart Association, Circulation, 109, 2655–2671, https://doi.org/10.1161/01.CIR.0000128587.30041.C8, 2004.
Burr, M. J. and Zhang, Y.: Source apportionment of fine particulate matter over the Eastern U.S. Part I: source sensitivity simulations using CMAQ with the Brute Force method, Atmos. Res., 2, 300–317, https://doi.org/10.5094/APR.2011.036, 2011.
Byun, D. and Schere, K. L.: Review of the governing equations, computational algorithms, and other components of the Models-3 Community Multiscale Air Quality (CMAQ) modeling system, Appl. Mech. Rev., 59, 51–77, https://doi.org/10.1115/1.2128636, 2006.
Chang, C. P., Ding Y., Lau, N. C., Johnson, R. H., Wang, B., and Yasunari, T.: World Scientific Series on Asia-Pacific Weather and Climate: Volume 5 The Global Monsoon System, Reserch and Forecast 2nd Edition, World Scientific Publishing Co. Pte. Ltd, Singapore, 2011.
Chang, K. H., Jeng, F. T., Tsai, Y. L., and Lin, P. L.: Modeling of long-range transport on Taiwan's acid deposition under different weather conditions, Atmos. Environ., 34, 3281–3295, https://doi.org/10.1016/S1352-2310(00)00072-8, 2000.
Chen, T. F., Tsai, C. Y., and Chang, K. H.: Performance evaluation of atmospheric particulate matter modeling for East Asia, Atmos. Environ., 77, 365–375, https://doi.org/10.1016/j.atmosenv.2013.05.025, 2013.
Chen, T. F., Chang, K. H., and Tsai, C. Y.: Modeling direct and indirect effect of long range transport on atmospheric PM2.5 levels, Atmos. Environ., 89, 1–9, https://doi.org/10.1016/j.atmosenv.2013.05.025, 2014.
Chuang, M. T., Chiang, P. C., Chan, C. C., Wang, C. F., Chang, E., and Lee, C. T.: The effects of synoptical weather pattern and complex terrain on the formation of aerosol events in the Greater Taipei area, Sci. Total. Environ., 399, 128–146, https://doi.org/10.1016/j.scitotenv.2008.01.051, 2008a.
Chuang, M. T., Fu, J. S., Jang, C. J., Chan, C. C., Ni, P. C., and Lee, C. T.: Simulation of long-range transport aerosols from the Asian Continent to Taiwan by a Southward Asian high-pressure system, Sci. Total. Environ., 406, 168–179, https://doi.org/10.1016/j.scitotenv.2008.07.003, 2008b.
Chuang, M. T., Fu, J. S., Lee, C. T., Lin, N. H., Gao, Y., Wang, S. H., Sheu, G. R., Hsiao, T. C., Wang, J. L., Yen, M. C., Lin, T. H., and Thongboonchoo, N.: The Simulation of Long-Range Transport of Biomass Burning Plume and Short-Range Transport of Anthropogenic Pollutants to a Mountain Observatory in East Asia during the 7-SEAS/2010 Dongsha Experiment, Aerosol. Air. Qual. Res., 16, 2933–2949, https://doi.org/10.4209/aaqr.2015.07.0440, 2016.
Chuang, M. T., Chou, C. C. K., Lin, N. H., Takami, A., Hsiao, T. C., Lin, T. H., Fu, J. S., Pani, S. K., Lu, Y. R., and Yang, T. Y.: A Simulation Study on PM2.5 Sources and Meteorological Characteristics at the Northern Tip of Taiwan in the Early Stage of the Asian Haze Period, Aerosol. Air. Qual. Res., 17, 3166–3178, https://doi.org/10.4209/aaqr.2017.05.0185, 2017.
Chuang, M. T., Lee, C. T., and Hsu, H. C.: Quantifying PM2.5 from long-range transport and local pollution in Taiwan during winter monsoon: An efficient estimation method, J. Environ. Manage., 227, 10–22, https://doi.org/10.1016/j.jenvman.2018.08.066, 2018.
Emery, C., Tai, E., and Yarwood, G.: Enhanced meteorological modeling and performance evaluation for two Texas ozone episodes. prepared for the Texas Natural Resource Conservation Commission, prepared by ENVIRON International Corp, Novato, CA, 2001.
Fountoukis, C., Racherla, P. N., Denier van der Gon, H. A. C., Polymeneas, P., Charalampidis, P. E., Pilinis, C., Wiedensohler, A., Dall'Osto, M., O'Dowd, C., and Pandis, S. N.: Evaluation of a three-dimensional chemical transport model (PMCAMx) in the European domain during the EUCAARI May 2008 campaign, Atmos. Chem. Phys., 11, 10331–10347, https://doi.org/10.5194/acp-11-10331-2011, 2011.
Fu, G. Q., Xu, W. Y., Yang, R. F., Li, J. B., and Zhao, C. S.: The distribution and trends of fog and haze in the North China Plain over the past 30 years, Atmos. Chem. Phys., 14, 11949–11958, https://doi.org/10.5194/acp-14-11949-2014, 2014.
Garg, S. and Sinha, B.: Determining the contribution of long-range transport, regional and local sources areas, to PM10 mass loading in Hessen, Germany using a novel multi-receptor based statistical approach, Atmos. Environ., 167, 566–575, https://doi.org/10.1016/j.atmosenv.2017.08.029, 2017.
Guenther, A. B., Jiang, X., Heald, C. L., Sakulyanontvittaya, T., Duhl, T., Emmons, L. K., and Wang, X.: The Model of Emissions of Gases and Aerosols from Nature version 2.1 (MEGAN2.1): an extended and updated framework for modeling biogenic emissions, Geosci. Model Dev., 5, 1471–1492, https://doi.org/10.5194/gmd-5-1471-2012, 2012.
Hu, B., Zhao, X., Liu, H., Liu, Z., Song, T., Wang, Y., Tang, L., Xia, X., Tang, G., Ji, D., Wen, T., Wang, L., Sun, Y., and Xin, J.: Quantification of the impact of aerosol on broadband solar radiation in North China, Sci. Rep., 7, 44851, https://doi.org/10.1038/srep44851, 2017.
Kagawa, J.: Evaluation of biological significance of nitrogen oxides exposure. Tokai, J. Exp. Clin. Med., 10, 348–353, 1985.
Kurokawa, J. and Ohara, T.: Long-term historical trends in air pollutant emissions in Asia: Regional Emission inventory in ASia (REAS) version 3, Atmos. Chem. Phys., 20, 12761–12793, https://doi.org/10.5194/acp-20-12761-2020, 2020.
Kwok, R. H. F., Napelenok, S. L., and Baker, K. R.: Implementation and evaluation of PM 2.5 source contribution analysis in a photochemical model, Atmos. Environ., 80, 398–407, https://doi.org/10.1016/j.atmosenv.2013.08.017, 2013.
Lee, C. T., Wang, J. L., Chou, C. C. K., Chang, S. Y., Hsiao, T. C., and Hsu, W. C.: Fine suspended particles (PM2.5) compositions observations and analysis project for 2016 and 2017, EPA-105-U102-03-A284, available at: https://epq.epa.gov.tw/EPQ_resultDetail.aspx?proj_id=1051435574&recno=&document_id=19986#tab3 (last access: 27 November 2020), 2017 (in Chinese).
Li, M., Zhang, Q., Kurokawa, J.-I., Woo, J.-H., He, K., Lu, Z., Ohara, T., Song, Y., Streets, D. G., Carmichael, G. R., Cheng, Y., Hong, C., Huo, H., Jiang, X., Kang, S., Liu, F., Su, H., and Zheng, B.: MIX: a mosaic Asian anthropogenic emission inventory under the international collaboration framework of the MICS-Asia and HTAP, Atmos. Chem. Phys., 17, 935–963, https://doi.org/10.5194/acp-17-935-2017, 2017.
Li, X., Qiao, Y., Zhu, J., Shi, L., and Wang, Y.: The “APEC blue” endeavor: Causal effects of air pollution regulation on air quality in China, J. Clean. Prod., 168, 1381–1388, https://doi.org/10.1016/j.jclepro.2017.08.164, 2017.
Lin, C. C., Chen, W. N., Loftus, A. M., Lin, C. Y., Fu, Y. T., Peng, C. M., and Yen, M. C.: Influences of the long-range transport of biomass-burning pollutants on surface air quality during 7-SEAS field campaigns, Aerosol. Air. Qual. Res., 17, 2595–2607, https://doi.org/10.4209/aaqr.2017.08.0273, 2017.
Lin, C.-Y., Sheng, Y.-F., Chen, W.-N., Wang, Z., Kuo, C.-H., Chen, W.-C., and Yang, T.: The impact of channel effect on Asian dust transport dynamics: a case in southeastern Asia, Atmos. Chem. Phys., 12, 271–285, https://doi.org/10.5194/acp-12-271-2012, 2012.
Liu, X. and Zhang, Y.: Understanding of the formation mechanisms of ozone and particulate matter at a fine scale over the southeastern U.S.: Process analyses and responses to future-year emissions, Atmos. Environ., 74, 259–276, https://doi.org/10.1016/j.atmosenv.2013.03.057, 2013.
Na, K., Sawant, A. A., Song, C., and Cocker, D. R.: Primary and secondary carbonaceous species in the atmosphere of Western Riverside County, California, Atmos. Environ., 38, 1345–1355, https://doi.org/10.1016/j.atmosenv.2003.11.023, 2004.
Ohura, T., Noda, T., Amagai, T., and Fusaya, M.: Prediction of personal exposure to PM2.5 and carcinogenic polycyclic aromatic hydrocarbons by their concentrations in residential microenvironments, Environ. Sci. Technol., 39, 5592–5599, https://https://doi.org/10.1021/es050571x, 2005.
Pawar, H., Garg, S., Kumar, V., Sachan, H., Arya, R., Sarkar, C., Chandra, B. P., and Sinha, B.: Quantifying the contribution of long-range transport to particulate matter (PM) mass loadings at a suburban site in the north-western Indo-Gangetic Plain (NW-IGP), Atmos. Chem. Phys., 15, 9501–9520, https://doi.org/10.5194/acp-15-9501-2015, 2015.
Pope, C. A., Burnett, R. T., Thurston, G. D., Thun, M. J., Calle, E. E., Krewski, D., and Godleski, J. J.: Cardiovascular mortality and long-term exposure to particulate air pollution epidemiological evidence of general pathophysiological pathways of disease, Circulation, 109, 71–77, https://doi.org/10.1161/01.CIR.0000108927.80044.7F, 2004.
Schwartz, J., Dockery, D. W., and Neas, L. M.: Is daily mortality associated specifically with fine particles?, J. Air. Was. Manage., 46, 927–939, https://doi.org/10.1080/10473289.1996.10467528, 1996.
Skamarock, W. C. and Klemp, J. B.: A time-split nonhydrostatic atmospheric model for weather research and forecasting applications, J. Comput. Phys., 227, 3465–3485, https://doi.org/10.1016/j.jcp.2007.01.037, 2008.
Skyllakou, K., Murphy, B. N., Megaritis, A. G., Fountoukis, C., and Pandis, S. N.: Contributions of local and regional sources to fine PM in the megacity of Paris, Atmos. Chem. Phys., 14, 2343–2352, https://doi.org/10.5194/acp-14-2343-2014, 2014.
Stein, A. F., Draxler, R. R, Rolph, G. D., Stunder, B. J. B., Cohen, M. D., and Ngan, F: NOAA's HYSPLIT atmospheric transport and dispersion modeling system, Bull. Amer. Meteor. Soc., 96, 2059–2077, 2015.
Stelson, A. W. and Seinfeld, J. H.: Relative humidity and temperature dependence of the ammonium nitrate dissociation constant, Atmos. Environ., 16, 983–992, https://doi.org/10.1016/0004-6981(82)90184-6, 1982.
TEPA: New air quality modeling and simulation standards. Effective on 1st January 2016, availabe at: https://oaout.epa.gov.tw/law/LawContent.aspx?id=GL005316 (last access: 27 November 2020), 2016 (in Chinese).
TEPA: Building of the Taiwan emission data system, Taiwan EPA report, EPA-106-FA18-03-A263, available at: https://epq.epa.gov.tw/EPQ_resultDetail.aspx?proj_id=1060678237&document_id=9999&KeyWord=%e6%99%af%e4%b8%b0#tab1 (last access: 27 November 2020), 2017 (in Chinese).
Tie, X., Madronich, S., Walters, S., Edwards, D. P., Ginoux, P., Mahowald, N., Zhang, R., Lou, C., and Brasseur, G.: Assessment of the global impact of aerosols on tropospheric oxidants, J. Geophys. Res., 110, D03204, https://doi.org/10.1029/2004JD005359, 2005.
Van Pinxteren, D., Mothes, F., Spindler, G., Fomba, K. W., and Herrmann, H.: Trans-boundary PM10: Quantifying impact and sources during winter 2016/17 in eastern Germany, Atmos. Environ., 200, 119–130, https://doi.org/10.1016/j.atmosenv.2018.11.061, 2019.
Vukovich, J. and Pierce, T.: The Implementation of BEIS3 within the SMOKE modeling framework, Proc. 11th International Emission Inventory Conference: Emission Inventories – Partnering for the Future, Atlanta, GA, US EPA, CD-ROM, 10.7, 2002.
Wagstrom, K. M., Pandis, S. N., Yarwood, G., Wilson, G. M., and Morris, R. E.: Development and application of a computationally efficient particulate matter apportionment algorithm in a three-dimensional chemical transport model, Atmos. Environ., 42, 5650–5659, https://doi.org/10.1016/j.atmosenv.2008.03.012, 2008.
Wang, S. H., Hung, W. T., Chang, S. C., and Yen, M. C.: Transport characteristics of Chinese haze over Northern Taiwan in winter, 2005–2014, Atmos. Environ., 126, 76–86, https://doi.org/10.1016/j.atmosenv.2015.11.043, 2016.
Wiedinmyer, C., Akagi, S. K., Yokelson, R. J., Emmons, L. K., Al-Saadi, J. A., Orlando, J. J., and Soja, A. J.: The Fire INventory from NCAR (FINN): a high resolution global model to estimate the emissions from open burning, Geosci. Model Dev., 4, 625–641, https://doi.org/10.5194/gmd-4-625-2011, 2011.
Yen, M. C., Peng, C. M., Chen, T. C., Chen, C. S., Lin, N. H., Tzeng, R. W., Lee, Y. A., and Lin, C. C.: Climate and weather characteristics in association with the active fires in northern Southeast Asia and spring air pollution in Taiwan during 2010 7-SEAS/Dongsha Experiment, Atmos. Envoron., 78, 35–50, https://doi.org/10.1016/j.atmosenv.2012.11.015, 2013.
Zhang, Q., Quan, J., Tie, X., Li, X., Liu, Q., Gao, Y., and Zhao, D.: Effects of meteorology and secondary particle formation on visibility during heavy haze events in Beijing, China, Sci. Total. Environ., 502, 578–584, https://doi.org/10.1016/j.scitotenv.2014.09.079, 2015.
Zheng, B., Tong, D., Li, M., Liu, F., Hong, C., Geng, G., Li, H., Li, X., Peng, L., Qi, J., Yan, L., Zhang, Y., Zhao, H., Zheng, Y., He, K., and Zhang, Q.: Trends in China's anthropogenic emissions since 2010 as the consequence of clean air actions, Atmos. Chem. Phys., 18, 14095–14111, https://doi.org/10.5194/acp-18-14095-2018, 2018.
Zhu, Y. G., Ioannidis, J. P., Li, H., Jones, K. C., and Martin, F. L.: Understanding and harnessing the health effects of rapid urbanization in China, Environ. Sci. Tech., 45, 5099–5104, https://doi.org/10.1021/es2004254, 2011.


