the Creative Commons Attribution 4.0 License.
the Creative Commons Attribution 4.0 License.
 | 03 Dec 2020
Elevated dust layers inhibit dissipation of heavy anthropogenic surface air pollution
Zhuang Wang
Zhouqing Xie
Qihou Hu
Meinrat O. Andreae
Yunsheng Dong
Chun Zhao
Ting Liu
Yizhi Zhu
Haoran Liu
Chengzhi Xing
Wei Tan
Xiangguang Ji
Jinan Lin
Jianguo Liu
Persistent wintertime heavy haze incidents caused by anthropogenic aerosols have repeatedly shrouded North China in recent years, while natural dust from the west and northwest of China also frequently affects air quality in this region. Through continuous observation by a multi-wavelength Raman lidar, here we found that wintertime aerosols in North China are typically characterized by a pronounced vertical stratification, where scattering nonspherical particles (dust or mixtures of dust and anthropogenic aerosols) dominated above the planetary boundary layer (PBL), and absorbing spherical particles (anthropogenic aerosols) prevailed within the PBL. This stratification is governed by meteorological conditions that strong northwesterly winds usually prevailed in the lower free troposphere, and southerly winds dominated in the PBL, producing persistent and intense haze pollution. With the increased contribution of elevated dust to the upper aerosols, the proportion of aerosol and trace gas at the surface in the whole column increased. Model results show that, besides directly deteriorating air quality, the key role of the elevated dust is to depress the development of PBL and weaken the turbulent exchange, mostly by lower level cooling and upper level heating, and it is more obvious during the dissipation stage, thus inhibiting the dissipation of heavy surface anthropogenic aerosols. The interactions of natural dust and anthropogenic aerosols under the unique topography of North China increase the surface anthropogenic aerosols and precursor gases, which may be one of the reasons why haze pollution in North China is heavier than that in other heavily polluted areas in China.
- Article
(6101 KB) - Full-text XML
-
Supplement
(1702 KB) - BibTeX
- EndNote


Booming industrialization and urbanization in China are releasing large amounts of atmospheric anthropogenic pollutants, especially in the Beijing–Tianjin–Hebei (BTH) and surrounding regions, where the air pollution is the highest in the country (Zhang et al., 2019a, b). Accumulation of air pollutants from stationary and transportation sources and an explosive increase in new particles under stagnant weather conditions (Guo et al., 2014; Huang et al., 2014; Zheng et al., 2015) through chemical reactions, such as multiphase chemical formation (Cheng et al., 2016), as well as regional transport (Li et al., 2017) cause PM2.5 (particle mass less than 2.5 µm in diameter) mass concentrations to increase severalfold within a few hours. Recent studies have shown that the radiative effect of aerosols reduces solar shortwave radiation, increases the strength of the capping inversion, and enhances the stability of the planetary boundary layer (PBL) (Zhong et al., 2018). Such unfavorable meteorological conditions will enhance the explosive growth of surface air pollutants. Simulation results from atmospheric chemical transport models have also led to similar conclusions (Ding et al., 2016; Huang et al., 2018), i.e., that absorbing aerosols, particularly black carbon (BC), will increase the temperature at the top of the PBL and induce a cooling effect near the surface, thereby inhibiting the dispersion of air pollutants.
In addition to BC, dust is also an important source of air pollution. Besides directly acting as an important component of PM10 (particle mass less than 10 µm in diameter) and PM2.5, it scatters solar shortwave radiation and absorbs longwave radiation and thus leads to a cooling at the earth surface (Xia and Zong, 2009). Compared with the impact of other aerosol types, such as nitrates and sulfates, the effect of dust on decreasing radiation is more serious (Sokolik and Toon, 1996). Recent studies have also shown that dust can function as a reactant or a catalyst affecting atmospheric chemical reactions (Cwiertny et al., 2008). However, the current understanding of the effects of dust on meteorology and air pollution in North China remains insufficient.
To elucidate the role of dust during heavy air pollution, multi-wavelength Raman lidar (RL) was deployed to monitor the vertical structure of atmospheric aerosols with high spatial and temporal resolution. RL can provide several optical parameters of aerosols to distinguish anthropogenic aerosols, dust, and other aerosol types (de Foy et al., 2011; Freudenthaler et al., 2009; Groß et al., 2013; Müller et al., 2007; Tesche et al., 2009), including the aerosol extinction coefficient (EXT), particle linear depolarization ratio (PLDR), and lidar ratio (LR). The RL measurements have been performed at the Central Weather Bureau Farm (CWBF) since 17 December 2016 (Fig. S1 in the Supplement). The CWBF (39.15∘ N, 115.73∘ E) is located 120 km southwest of Beijing and approximately 40 km away from the Baoding urban district. It is surrounded by wheat fields, and there are no nearby stationary pollution sources. Combined with Weather Research and Forecasting (WRF) model coupled with Chemistry (WRF-Chem) simulations and multi-axis differential optical absorption spectroscopy (MAX-DOAS) observations, the mechanism of dust's impact on meteorology and air pollution was explored.
2.1 Raman lidar system
Ground-based RL measurements were performed at CWBF during January to March 2017. The RL was placed in an air-conditioned room to monitor air pollution through the roof skylight in a continuous mode (7 min for data collection with 15 min intervals). A schematic of the multi-wavelength RL system is shown in Fig. S2 in the Supplement. The light source of the RL system uses an Nd:YAG laser (QSmart850) with a pulse repetition rate of 10 Hz, producing two wavelengths: second harmonic generation 532 nm and third harmonic generation 355 nm, with an output energy of 300 and 230 mJ, respectively. The backscatter signals of the Raman, Rayleigh, and Mie scattering were received by a Cassegrain telescope with a diameter of 400 mm and field of view of 0.2 mrad. In addition, the 532 nm return signal was divided into parallel (532p) and vertical (532s) polarization components. Thus, the receiver had five channels: 532p, 355 nm Mie scattering channel, nitrogen (387 nm), water vapor (408 nm) Raman scattering channel, and polarization channel 532s. The data collector was a transient recorder (LICEL, TR20–160) with five acquisition channels. For each channel, the signal was acquired in both analog and photon counting modes with a spatial resolution of 7.5 m. Signals from 4000 laser shots were accumulated to produce a single sampled signal profile (approximately 7 min). More details on the RL system can be found in Table 1.
Table 1Characteristics of the RL system.
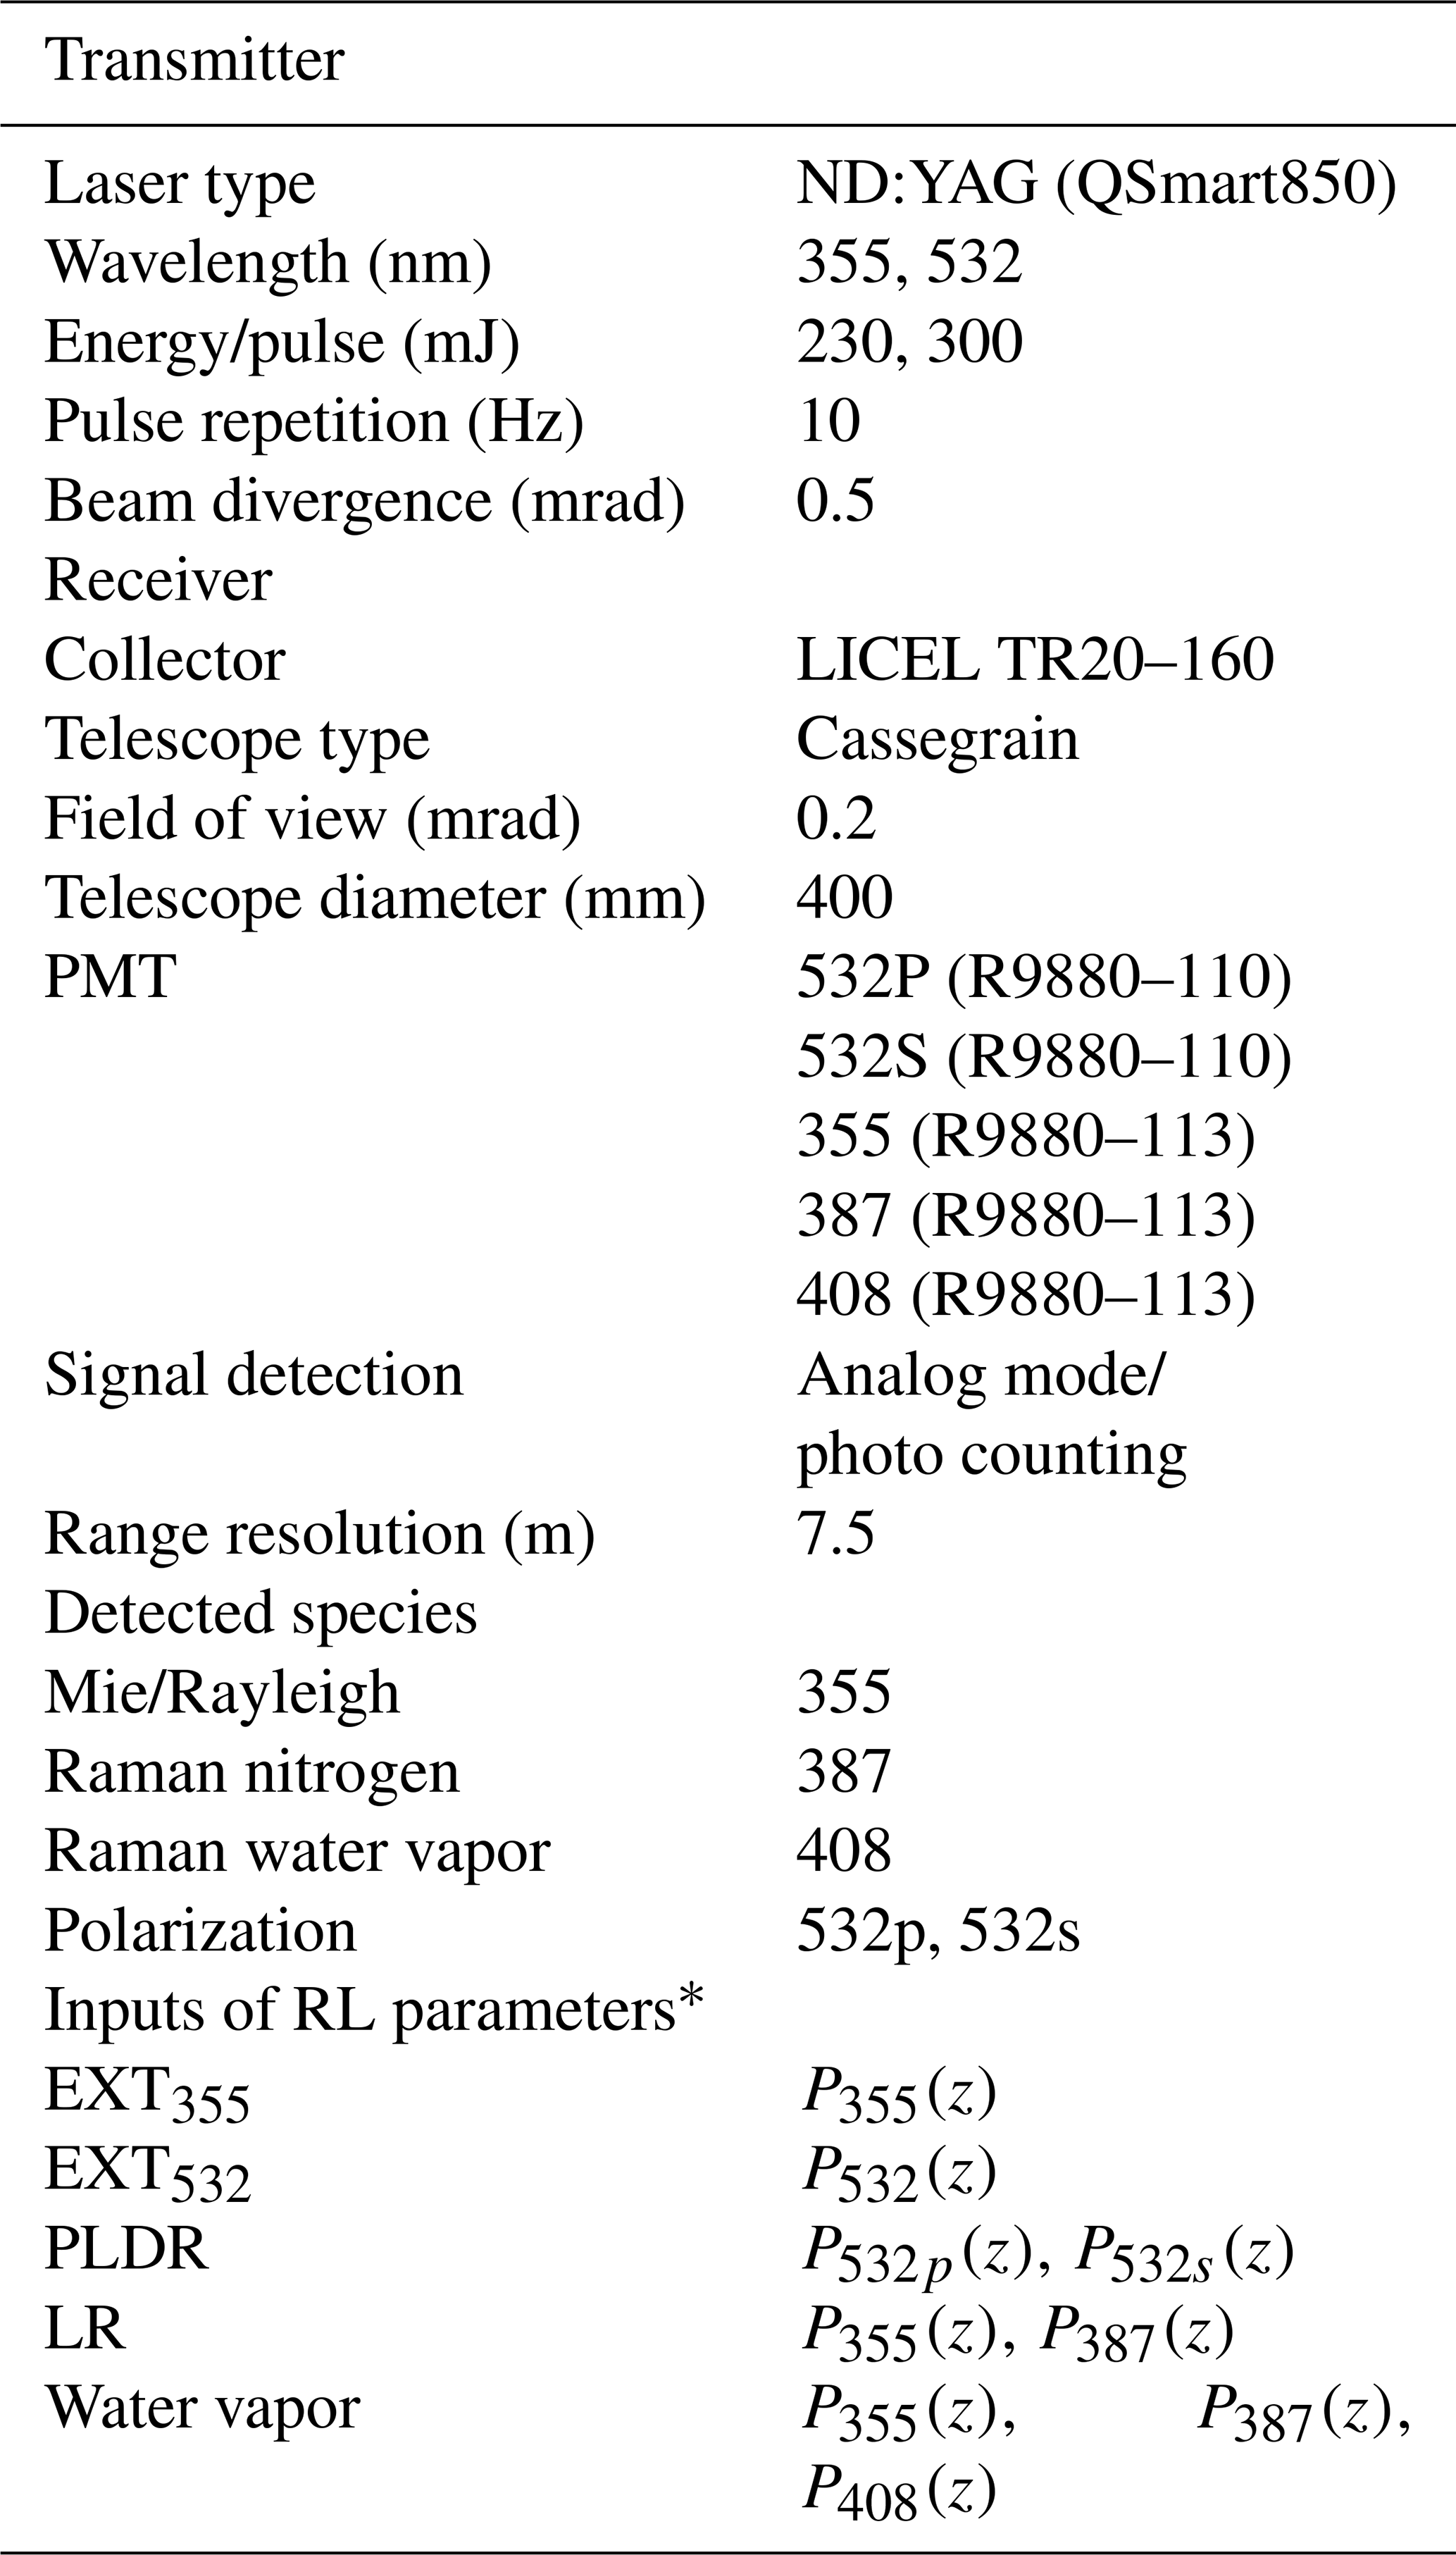
* Inputs are the elastic or inelastic backscatter signal profiles of RL. The subscript indicates the wavelength. The total elastic backscatter signal (Freudenthaler et al., 2009) profiles at 532 nm are defined as .
The RL used in this study can provide various aerosol optical parameters, including EXT, PLDR, LR, and relative humidity (RH). The PLDR distinguishes between nonspherical and spherical particles (Freudenthaler et al., 2009; Tesche et al., 2009), and nonspherical particles are identified by a high PLDR (over 15 %). The LR is related to the absorption (> 70 sr,) and scattering (< 40 sr) of particles (Müller et al., 2007). The input signals of aerosol optical parameters are provided in Table 1. The relative error was calculated in accordance with the law of error propagation and primarily depends on the signal-to-noise ratio (Heese et al., 2010) of the input signal given in Table 1. Data with a signal-to-noise ratio of the input signal less than 1 were discarded. Given that the uncertainty of the overlap correction (Wandinger and Ansmann, 2002) was too high below 400 m, data below 400 m were not used for subsequent analysis. The water vapor sounding experiment was conducted on 16 August 2017 at the Beijing Observatory near Beijing's South Fifth Ring ( N, E). The RH comparison of the RL and radiosonde is provided in Fig. 1, which shows that the RL and radiosonde were consistent in measuring RH at noon and night. The details of data inversion and data validation can be found in the Supplement Sect. S1 and our previous studies (Ji et al., 2019).
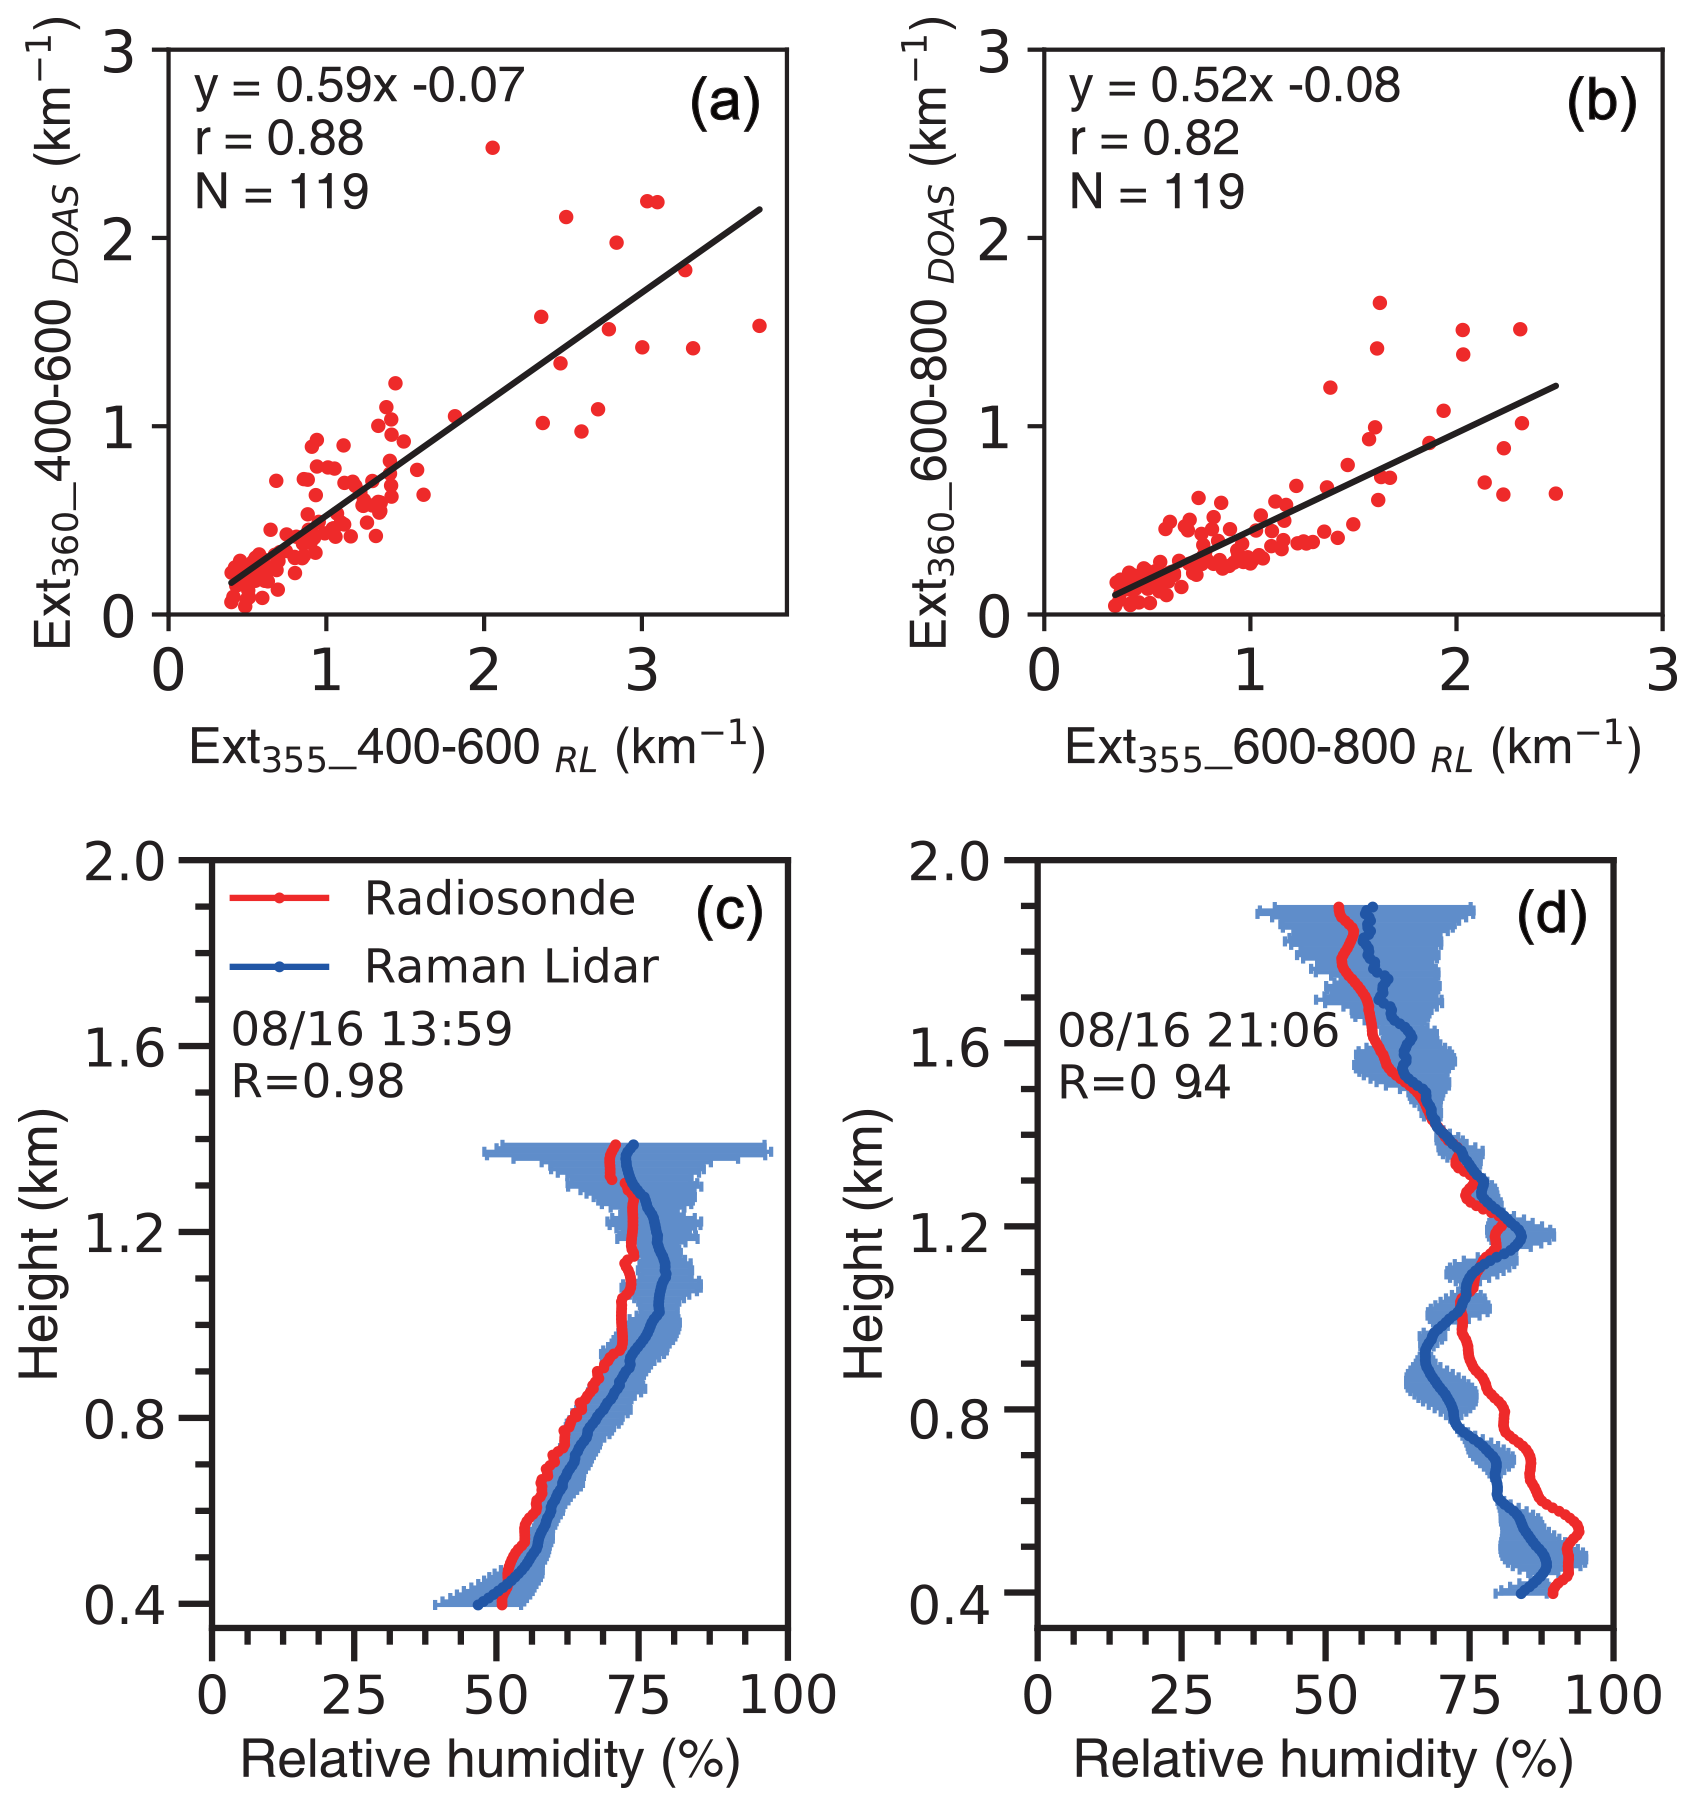
Figure 1Data comparison of RL and MAX-DOAS. Correlations between EXT from MAX-DOAS and RL for layers of (a) 400–600 m and (b) 600–800 m. RH comparison between radiosonde and RL at (c) noon and (d) night. The envelopes in (c) and (d) represent the errors at each altitude. The error is calculated from the law of error propagation, which primarily depends on the signal-to-noise ratio (Heese et al., 2010) of the input signal given in Table 1.
2.2 Multi-axis differential optical absorption spectroscopy
MAX-DOAS has been performed at CWBF since Jan 2017. The instruments used for MAX-DOAS include a telescope, two spectrometers (ultraviolet, 303–370 nm, and visible, 390–550 nm) with the temperature stabilized at 20 ∘C, and a computer that acts as a control and data acquisition unit. The elevation angle (1–6, 8, 10, 15, 30, and 90∘) of the telescope is controlled by a stepping motor. The scattered sunlight collected by the telescope is redirected by a prism reflector and a quartz filter to the spectrometer for data analysis. MAX-DOAS can retrieve aerosol profiles with the corresponding aerosol properties and trace gas profiles using the measured spectrum information. Further data screening was conducted using the root mean squares of the residuals of the trace gas (NO2) slant column densities. The system is only operational during the day (from 08:00 to 16:00 local time), with a temporal resolution of 15 min and a spatial resolution of 100 m, respectively. The complete description of the MAX-DOAS system and retrieval algorithm can be found in our previous studies (Xing et al., 2017; Xing et al., 2019).
To explore the effects of upper level dust on low-level anthropogenic aerosols, the percentage of bottom EXT360 in total EXT360 and percentage of bottom NO2 volume mixing ratio (VMR) in total NO2 VMR measured via MAX-DOAS were used to represent the low-level air pollution. The percentage of bottom EXT360 in total EXT360 is defined as
The percentage of bottom NO2 VMR in total NO2 VMR is defined as
where z is the height, and EXT360_per and NO2_per are the percentages of bottom EXT360 and bottom NO2 VMR, respectively.
The EXT comparison of RL and MAX-DOAS during our observation period is shown in Fig. 1. The hourly and spatially averaged EXTs from 400 to 600 and 600 to 800 m were selected due to the blind zone of RL and different spatial resolution between RL (7.5 m) and MAX-DOAS (100 m). The comparison of average EXT profiles during HPI 1 and HPI 2 between RL and MAX-DOAS is shown in Fig. S3. In general, the EXT comparisons of RL and MAX-DOAS show a reasonably good agreement (R > 0.8), while the slope of linear regression between RL- and MAX-DOAS-measured EXT is considerably less than 1 because the sensitivity of the MAX-DOAS measurements decreases with increasing altitude in the troposphere (Frieß et al., 2006). In addition, MAX-DOAS and lidar measurements were made with different geometries (a combination of zenith-sky and off-axis versus zenith-sky only, respectively) and different integration times for completing a set of measurements (15 versus 22 min, respectively), which may also explain part of the differences (Irie et al., 2008).
2.3 WRF-Chem simulations
The air pollution and meteorology parameters from 20 January to 5 February 2017 were simulated by WRF-Chem version 3.6.1. The model domain was centered at 110.68∘ E, 39.34∘ N with a 20 km × 20 km grid resolution, encompassing North China, the Mongolia region, and its surrounding areas. There are 44 vertical layers from the ground level to the top pressure of 50 hPa, in which 17 layers were located below 2 km to describe the vertical structure of the air pollutants below the PBL well. The simulation was conducted from 15 January to 5 February 2017. Each run covered 48 h, and the last 24 h results were used for the analysis. The initial and boundary conditions of meteorological fields for simulation were adopted from the 6 h final operational global analysis (FNL) data generated by the National Environmental Prediction Center (NCEP) with a spatial resolution of 1∘ × 1∘. The Multi-resolution Emission Inventory for China (MEIC; http://www.meicmodel.org/, last access: 6 January 2020) (Liu et al., 2015; Li et al., 2014) was used to obtain anthropogenic emissions. The biogenic emissions were calculated online using the Model of Emissions of Gases and Aerosols from Nature (MEGAN) embedded in the WRF-Chem model. The chemical outputs from previous runs were used as the initial conditions for the following run. The first 5 d were simulated and considered as the model spin-up period to minimize the influence of the initial conditions. NCEP's ADP global upper air observations (NCAR archive ds351.0 and ds461.0) were assimilated every 6 h to reproduce the meteorological field more effectively. Details of model configuration options can be found in Table 2 and our previous studies (Liu et al., 2016a).
In addition, to explore the role of dust in aerosol–meteorology interactions and its impact on surface air pollution during the dissipation stage, the simulation period of each heavy pollution incident dissipation stage was performed with five different initial times. i.e., the simulation period was from 00:00 to 23:00 on 26 January 2017, and the five initial times were set to 22:00 on 24 January 2017, 23:00 on 24 January 2017, 00:00 on 25 January 2017, 01:00 on 25 January 2017, and 02:00 on 25 January 2017. Particularly, four-dimensional data assimilation (FDDA) for wind, temperature, and water vapor mixing ratio was not adopted in the five simulations. The average of five simulations of each simulation period was used for the final analysis.
In this study, we selected the MOSAIC aerosol scheme (Zaveri and Peters, 1999; Zaveri et al., 2008), and the analysis variables here were the 3-D mass mixing ratios of the 32 MOSAIC aerosol variables at each grid point. The model includes organic compounds, black carbon, sulfate, nitrate, ammonium, and other air pollutants with four bin size ranges: (1) 3 to 156 nm, (2) 156 to 625 nm, (3) 625 nm to 2.5 µm, and (4) 2.5 to 10 µm. Thus, model-simulated PM10 concentrations were given as
where i denotes the bin numbers in the MOSAIC aerosol scheme, and NO3, SO4, NH4, OC, BC, CL, NA, and OIN are 3-D mass mixing ratios of nitrate, sulfate, ammonium, organic compounds, black carbon, chloride, sodium, and other inorganic compounds, respectively. The ρd is dry air density, which is used to convert the units of 32 MOSAIC aerosol mixing ratios from micrograms per kilogram (µg/kg) to micrograms per cubic meter (µg/m3).
We conducted two parallel experiments using WRF-Chem to investigate the mechanism of the elevated dust layer enhancing the pollution near the ground: (1) without considering the dust (dust_off) and (2) with consideration of the dust (dust_on). The dust concentrations are calculated as
where OINidust_on and OINidust_off represent the other inorganic compounds in each bin when the influence of dust was considered and ignored, respectively. The non-dust particles concentration is defined as
The concentrations of upper level suspended dust are calculated as
where Dustup is the suspended dust concentration above the PBL, lpbl is the number of the model layer closest to the PBL, and Dusti is the dust concentration in each model layer. The height of the 18th model layer is approximately 2888 m. The turbulent change within the PBL is calculated as
where Tur_exch is the average turbulent exchange coefficient within the PBL, and exchi is the turbulent exchange coefficient of each model layer. Tur_exchon and Tur_exchoff are the average turbulent exchange coefficients for the two experiments dust_on and dust_off, respectively.
To ensure the accuracy of the WRF-Chem model, the key meteorology parameters, including temperature, relative humidity, and wind speed/direction, were compared with radiosonde data (http://weather.uwyo.edu/, last access: 6 January 2020) at Beijing (39.93∘ N, 116.28∘ E; WMO station number 54511). The radiosondes were launched twice a day (08:00 and 20:00 LT) and measured profiles of atmospheric variables such as air temperature, water mixing ratio, and wind speed. As shown in Fig. S4, the WRF-Chem model can effectively reproduce the meteorology parameters. Observed hourly surface-layer PM2.5 concentrations from 21 January to 6 February 2017 at Chengde (40.97∘ N, 117.82∘ E; station number 1065A), Zhangjiakou (40.81∘ N, 114.88∘ E; station number 1059A), Beijing (40.14∘ N, 116.72∘ E; station number 1008A), Tianjing (39.03∘ N, 117.71∘ E; station number 1023A), Baoding (38.88∘ N, 115.44∘ E; station number 1055A), Cangzhou (38.30∘ N, 116.89∘ E; station number 1071A), Shijiazhuang (38.14∘ N, 114.50∘ E; station number 1031A), and Hengshui (37.73∘ N, 115.69∘ E; station number 1076A) were compared with the model results from the dust_on case (Fig. S5). The observed PM2.5 values were downloaded from the environmental monitoring station (http://beijingair.sinaapp.com/, last access: 5 January 2020). Generally, the WRF-Chem model can reasonably reproduce the evolutional characteristics of the observed PM2.5 concentrations in the eight cities (Li et al., 2016; Wang et al., 2019; Gao et al., 2016) (R: 0.52–0.81). Both the observed and simulated PM2.5 concentrations exhibit a heavy pollution period from 22 to 26 January 2017 and 1 to 5 February 2017.
2.4 Characteristics of dust, ice clouds, and anthropogenic aerosols
Based on RL measurements, the PLDR at 532 nm and LR at 355 nm were derived to represent the characteristics of different aerosol types. The PLDR can distinguish between nonspherical and spherical particles (Tesche et al., 2009), which is useful to identify ice clouds (Sassen, 1991) and dust layers (Murayama et al., 1999) (the value is typically greater than 20 %). Many researchers have reported the PLDR of dust and ice clouds (see Table 3). The typical PLDR of Asian dust is between 20 % and 33 %, which can be distributed at different heights. In addition, the different height distributions of Asian dust may be related to the different origins. The dust from Mongolia generally accumulates between 0 and 3000 m (Sun et al., 2001), and the dust from the Taklimakan desert is distributed above 5000 m (Liu et al., 2008; Sun et al., 2001). Unlike dust, ice clouds have a wider PLDR distribution between 20 % and 60 % and are usually located above 4000 m. Therefore, distinguishing Asian dust via a high PLDR is difficult due to the wide height distribution of dust and a PLDR comparable to ice clouds (Sakai et al., 2003).
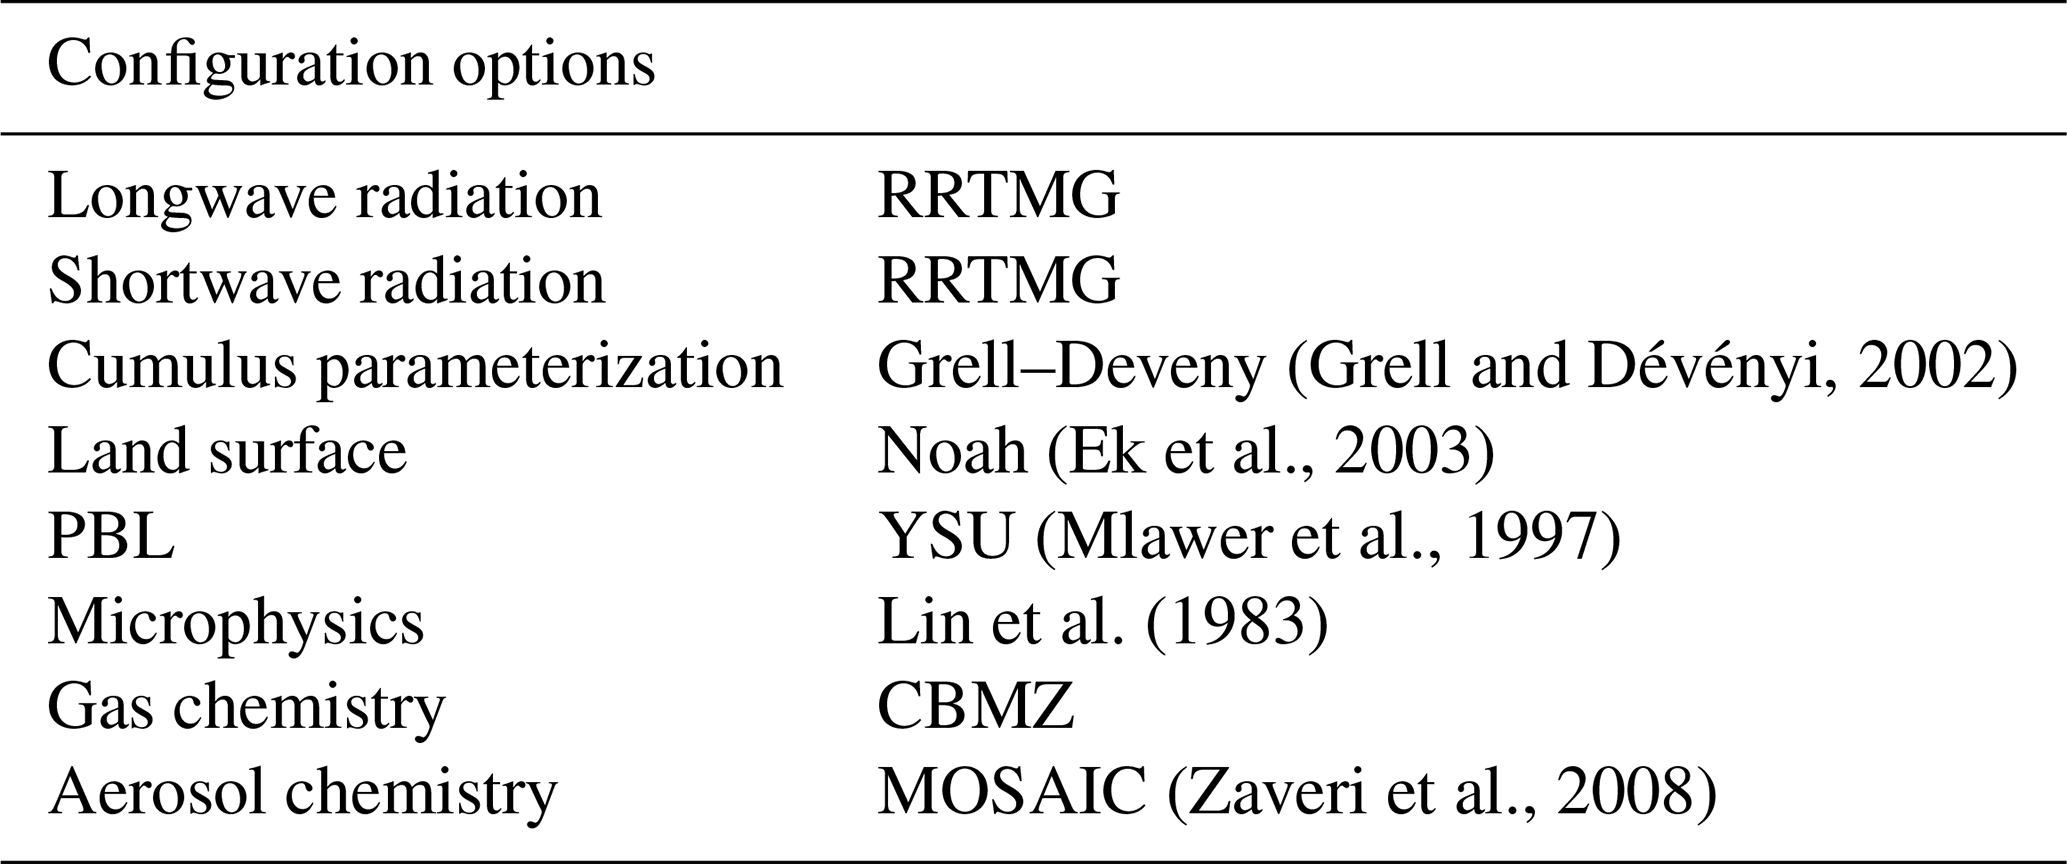
Table 3RL parameters for Asian dust, ice clouds, and anthropogenic aerosols.
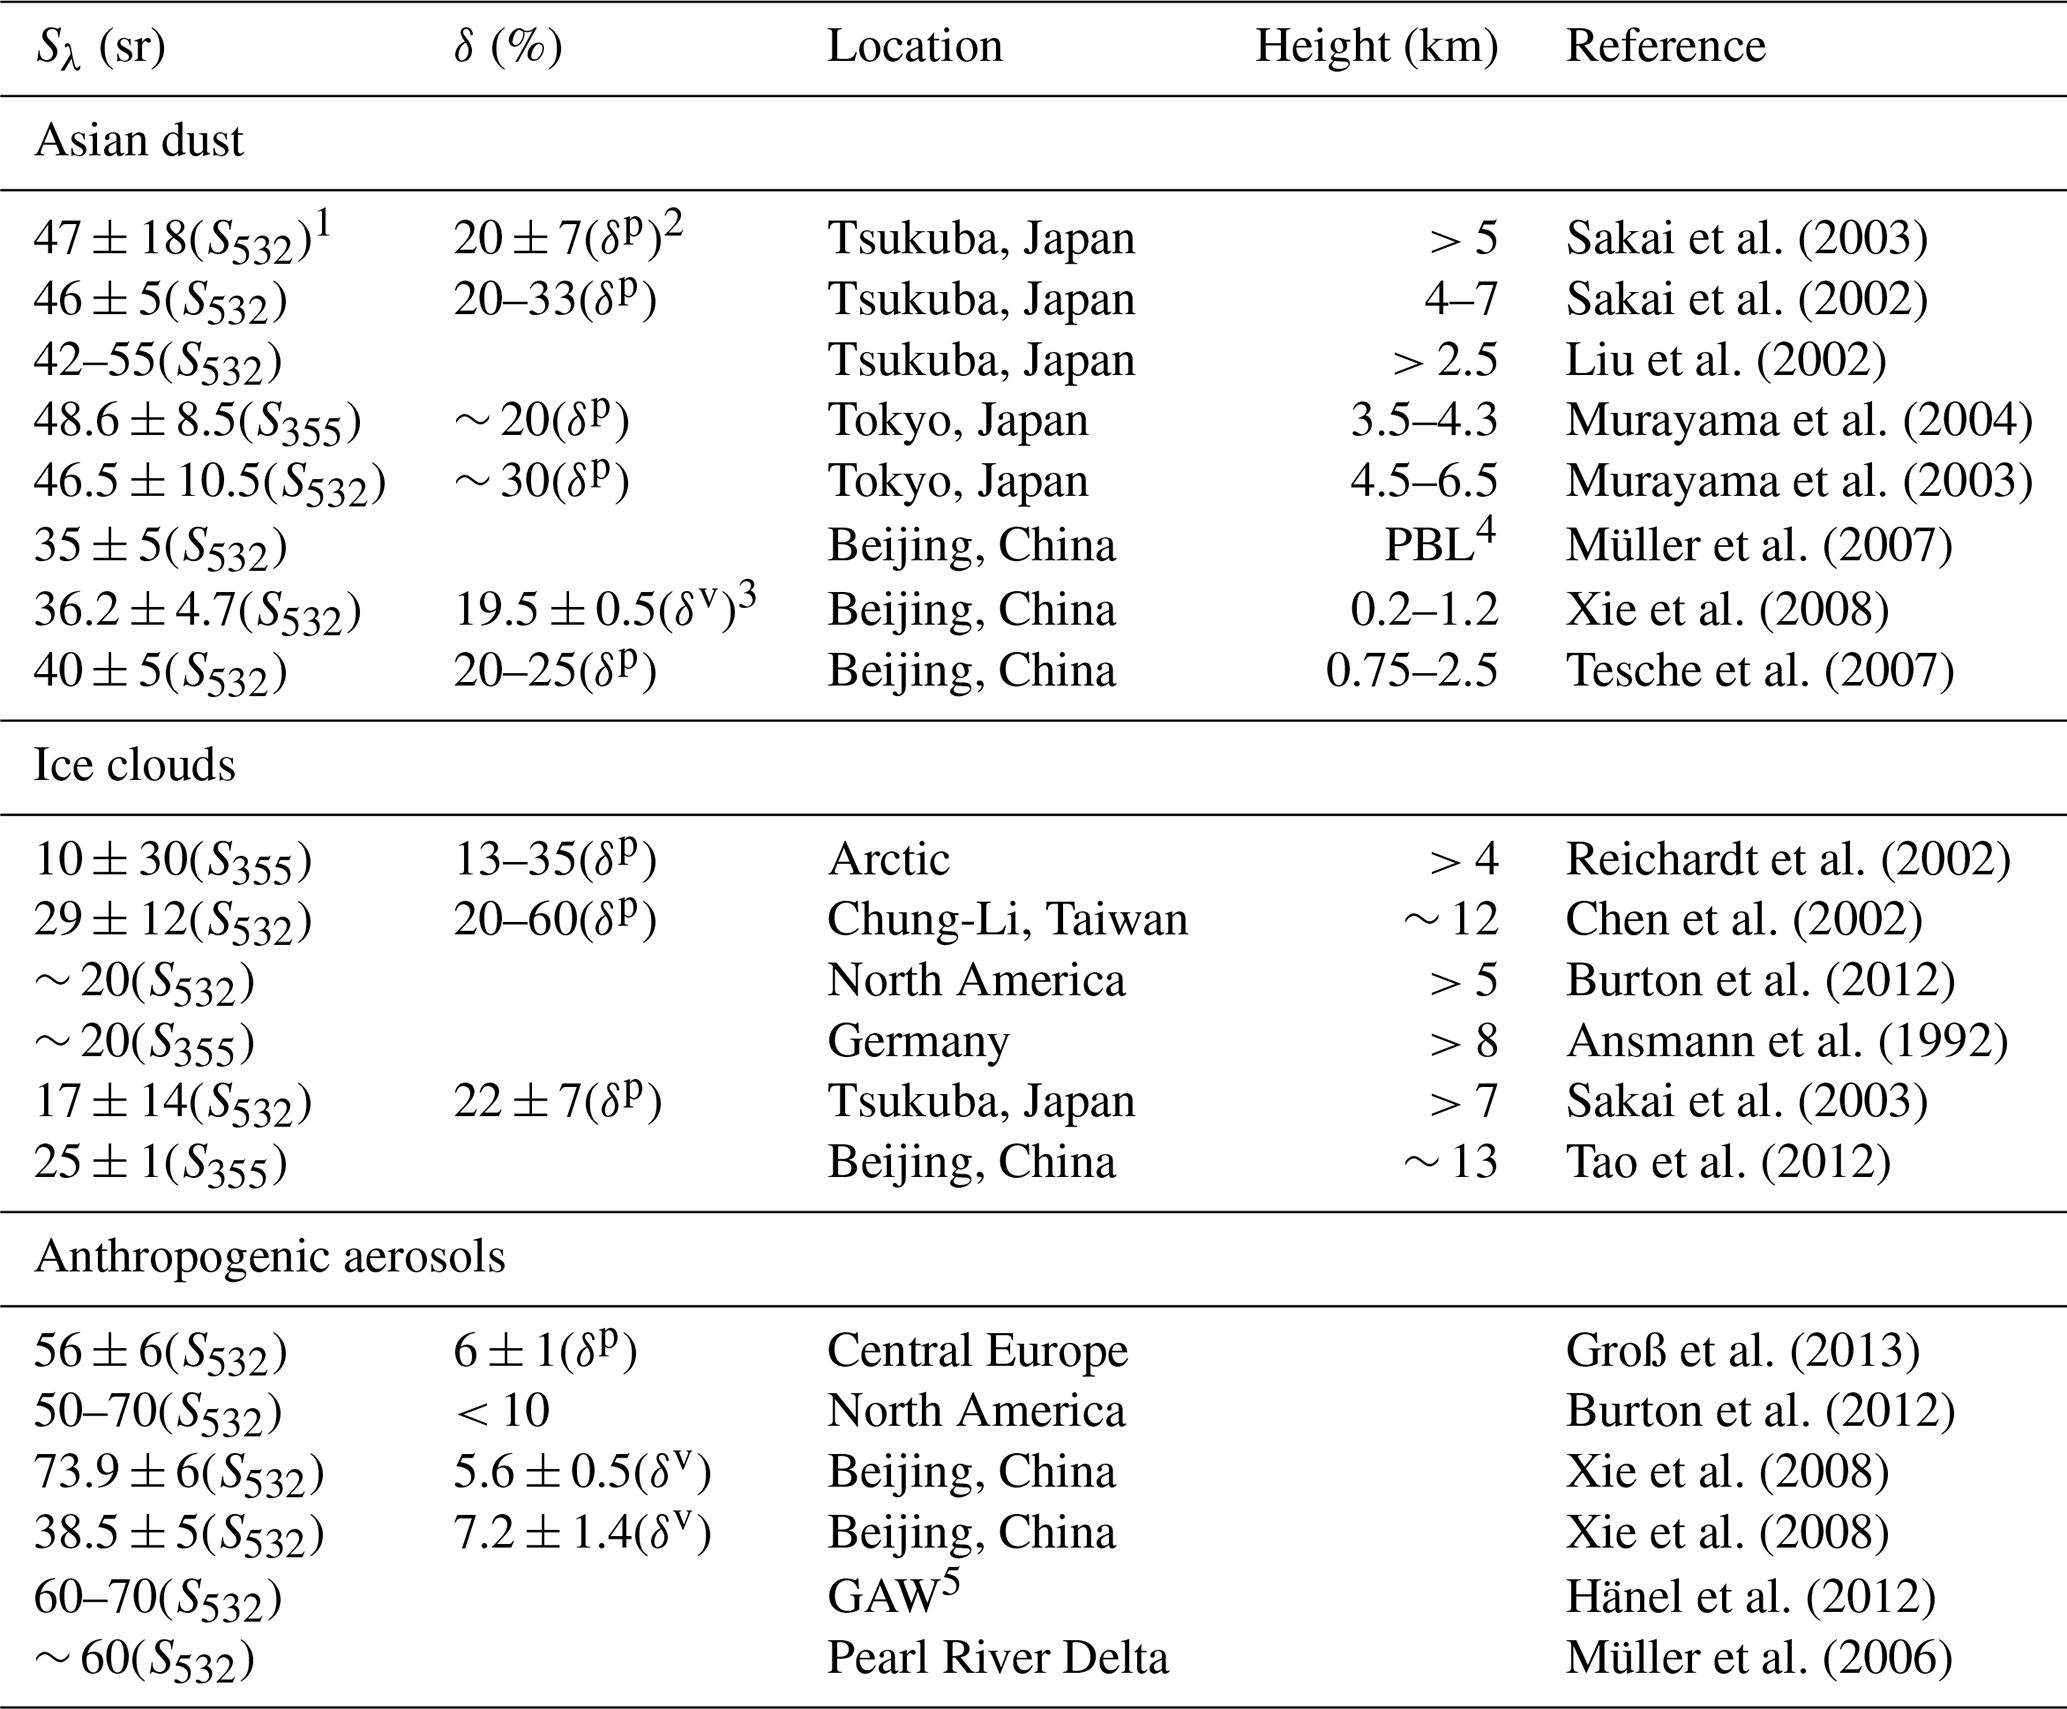
1 ± for 1 standard deviation. 2 The superscript “p” is for particle linear depolarization ratio at 532 nm. 3 The superscript “v” is for volume linear depolarization ratio at 532 nm. 4 PBL indicates the lower aerosol layer. 5 Global Atmospheric Watch (GAW) station of Shangdianzi (46∘ N, 117∘ E) in the North China Plain, 100 km northeast of Beijing.
RL can provide independent measurements of backscatter and extinction profiles (Ansmann et al., 1990; Ferrare et al., 1998) to compute the LR. As the LR is related to the absorption and scattering of particles (Müller et al., 2007; Omar et al., 2009), a higher LR indicates that the particles tend to be more absorbing. The typical value of LR for Asian dust is 40–60 sr (Omar et al., 2009). The LR of Asian dust observed in Beijing is smaller, from 30 to 47 sr, and it is usually located below 3000 m (see Table 3). By contrast, the LR for ice clouds is lower, less than 30 sr. Therefore, a threshold of 30 sr can be set to distinguish between dust and ice clouds (Sakai et al., 2003). The combined PLDR and LR can distinguish between dust and ice clouds. Asian dust has a higher PLDR (20 %–33 %), and the LR is usually greater than 30 sr. The PLDR of ice clouds is even higher (20 %–60 %), but the LR is typically less than 30 sr. In addition to Asian dust and ice clouds, the LR and PLDR of anthropogenic aerosols are also summarized in Table 3. The low PLDR of anthropogenic aerosols (less than 10 %) indicates spherical particles (Tesche et al., 2009). The high LR of anthropogenic aerosols is very distinct compared with Asian dust and ice clouds, and the values range from 40 to 80 sr.
3.1 Vertical layering of particles in North China
We focused on the transmission, explosive growth, and dissipation of air pollution along with the interactions between aerosol and meteorology in North China. The EXT355 (EXT at 355 nm wavelength) measured via RL shows a periodic cycle of 2–5 d, rising rapidly from less than 0.5 km−1 in the early stage of each heavy pollution incident (HPI) to 3–5 km−1 within 1–2 d (Fig. 2). For the subsequent discussion, the whole observation set was classified into clean stages, cumulative growth stages (CS), and dissipation stages (DS) based on the surface EXT360 (EXT at 360 nm wavelength) measured via MAX-DOAS and the surface winds from model simulations. Clean stages are defined as the times when the surface EXT360 is less than 0.5 km−1. The surface EXT360 during CS and DS is typically greater than 0.5 km−1, and the surface winds during CS were dominated by southerly weak winds or a static atmosphere, while much stronger northwesterly surface winds were most prevalent in the DS. An entire HPI includes a clean period plus the subsequent CS and DS. During our whole observation (Figs. S6, S7, Table S1), nine HPIs were observed. The PLDR in the upper lidar layer of eight HPIs is significantly higher than that of the lower lidar layer (except HPI 3), indicating the contribution of dust in the upper lidar layer and anthropogenic aerosols in the lower lidar layer and indicating that the aerosols were stratified. The aerosol stratification was most prominent in HPI 1, HPI 2, and HPI 5; HPI 5 lasted for less than 2 d during the whole observation period (Table S1), whereas the other two HPIs persisted for more than 4 d and had peak PM2.5 mass concentrations greater than 500 µg m−3. Thus, two HPIs (Table 4), namely, 22 to 26 January 2017 (HPI 1), and 1 to 5 February 2017 (HPI 2), measured via RL and MAX-DOAS, were selected to represent the typical wintertime pollution cycles in North China (Figs. 2 and S8).
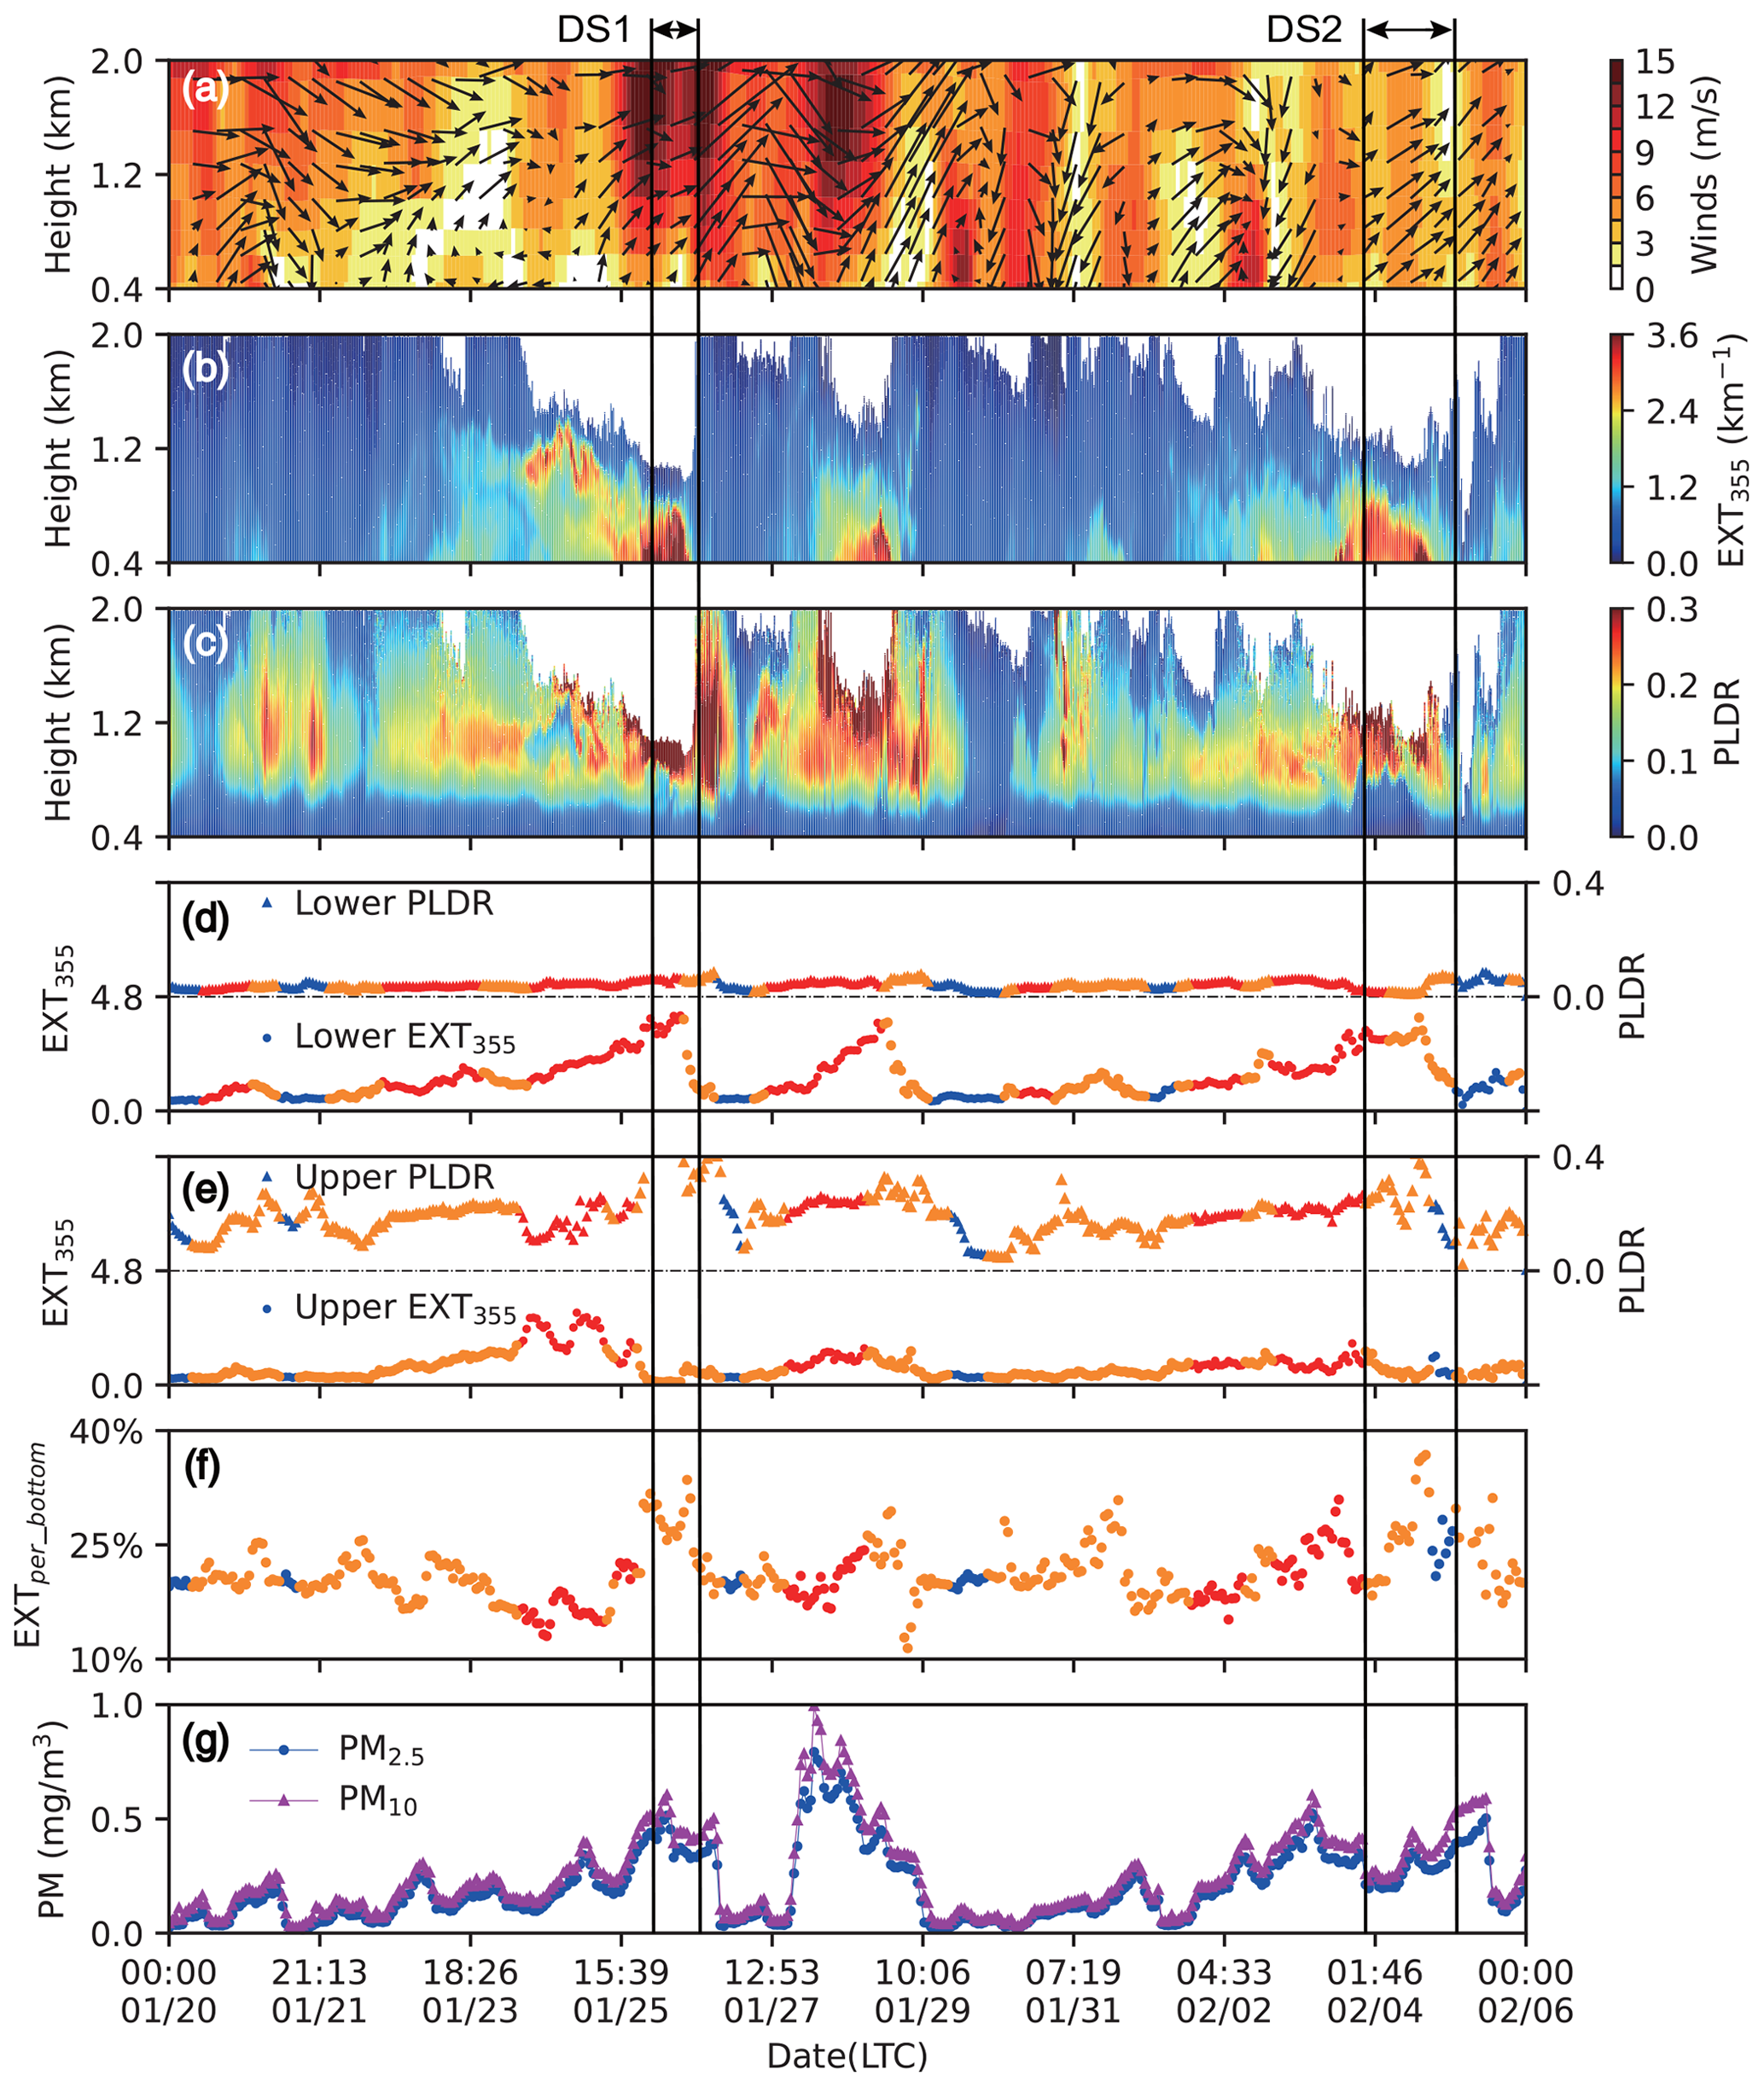
Figure 2Periodic air pollution cycles in North China. The colored contours show the vertical structure of (a) horizontal winds simulated by WRF-Chem, (b) EXT355, and (c) the PLDR measured by RL. Temporal evolutions of spatially averaged PLDR and EXT355 at (d) 450–550 m and (e) 950–1050 m. (f) The percentage of bottom EXT355. (g) Temporal evolutions of surface average PM2.5 and PM10 mass concentrations. The black arrow in (a) indicates the wind direction; the upper arrow is for south winds. The colors in (d), (e), and (f) represent the air masses originating from southwest (red), Gobi desert (yellow), and sparsely populated northern mountain areas (blue), similar to those in Fig. S1. The observed PM2.5 and PM10 mass concentrations are the averages of the six environmental monitoring stations in Baoding. The percentage of bottom EXT355 is used to characterize the aerosol concentrations in the lower layer, which is defined as , where EXTper_bottom is the percentage of bottom EXT355 and z is the height.
We evaluated the aerosol optical parameters, including the PLDR and LR provided by RL during the HPI 1 and HPI 2 in the upper lidar layer (700–1300 m) and lower lidar layer (400–600 m). Aerosols that accumulated in the upper lidar layer had a relatively broad PLDR value (4 %–43 % in most cases) and LR range of 32–72 sr (34–60 sr, in more than 90 % of the cases) during HPI 1 and HPI 2 (Fig. 3a and b). Therefore, aerosols that accumulated in the upper lidar layer are mainly scattering nonspherical particles. We also selected several RH profiles to identify the aerosol types in the upper lidar layer (Fig. S9). All of the available RH values of aerosols in the upper lidar layer were less than 80 %, whereas the RH of ice clouds was usually greater than 100 % (Ferrare et al., 1998; Sakai et al., 2003). Furthermore, the nonspherical scattering particles in the upper lidar layer during the two HPIs had the same origin (Fig. S1) and also had similar distribution heights (700–1300 m). Because anthropogenic aerosols also occurred in the upper lidar layer due to the southerly industrial transport, the nonspherical particles in the upper lidar layer during the HPI 1 and HPI 2 are mainly dust or mixtures of dust and anthropogenic aerosols (polluted dust).
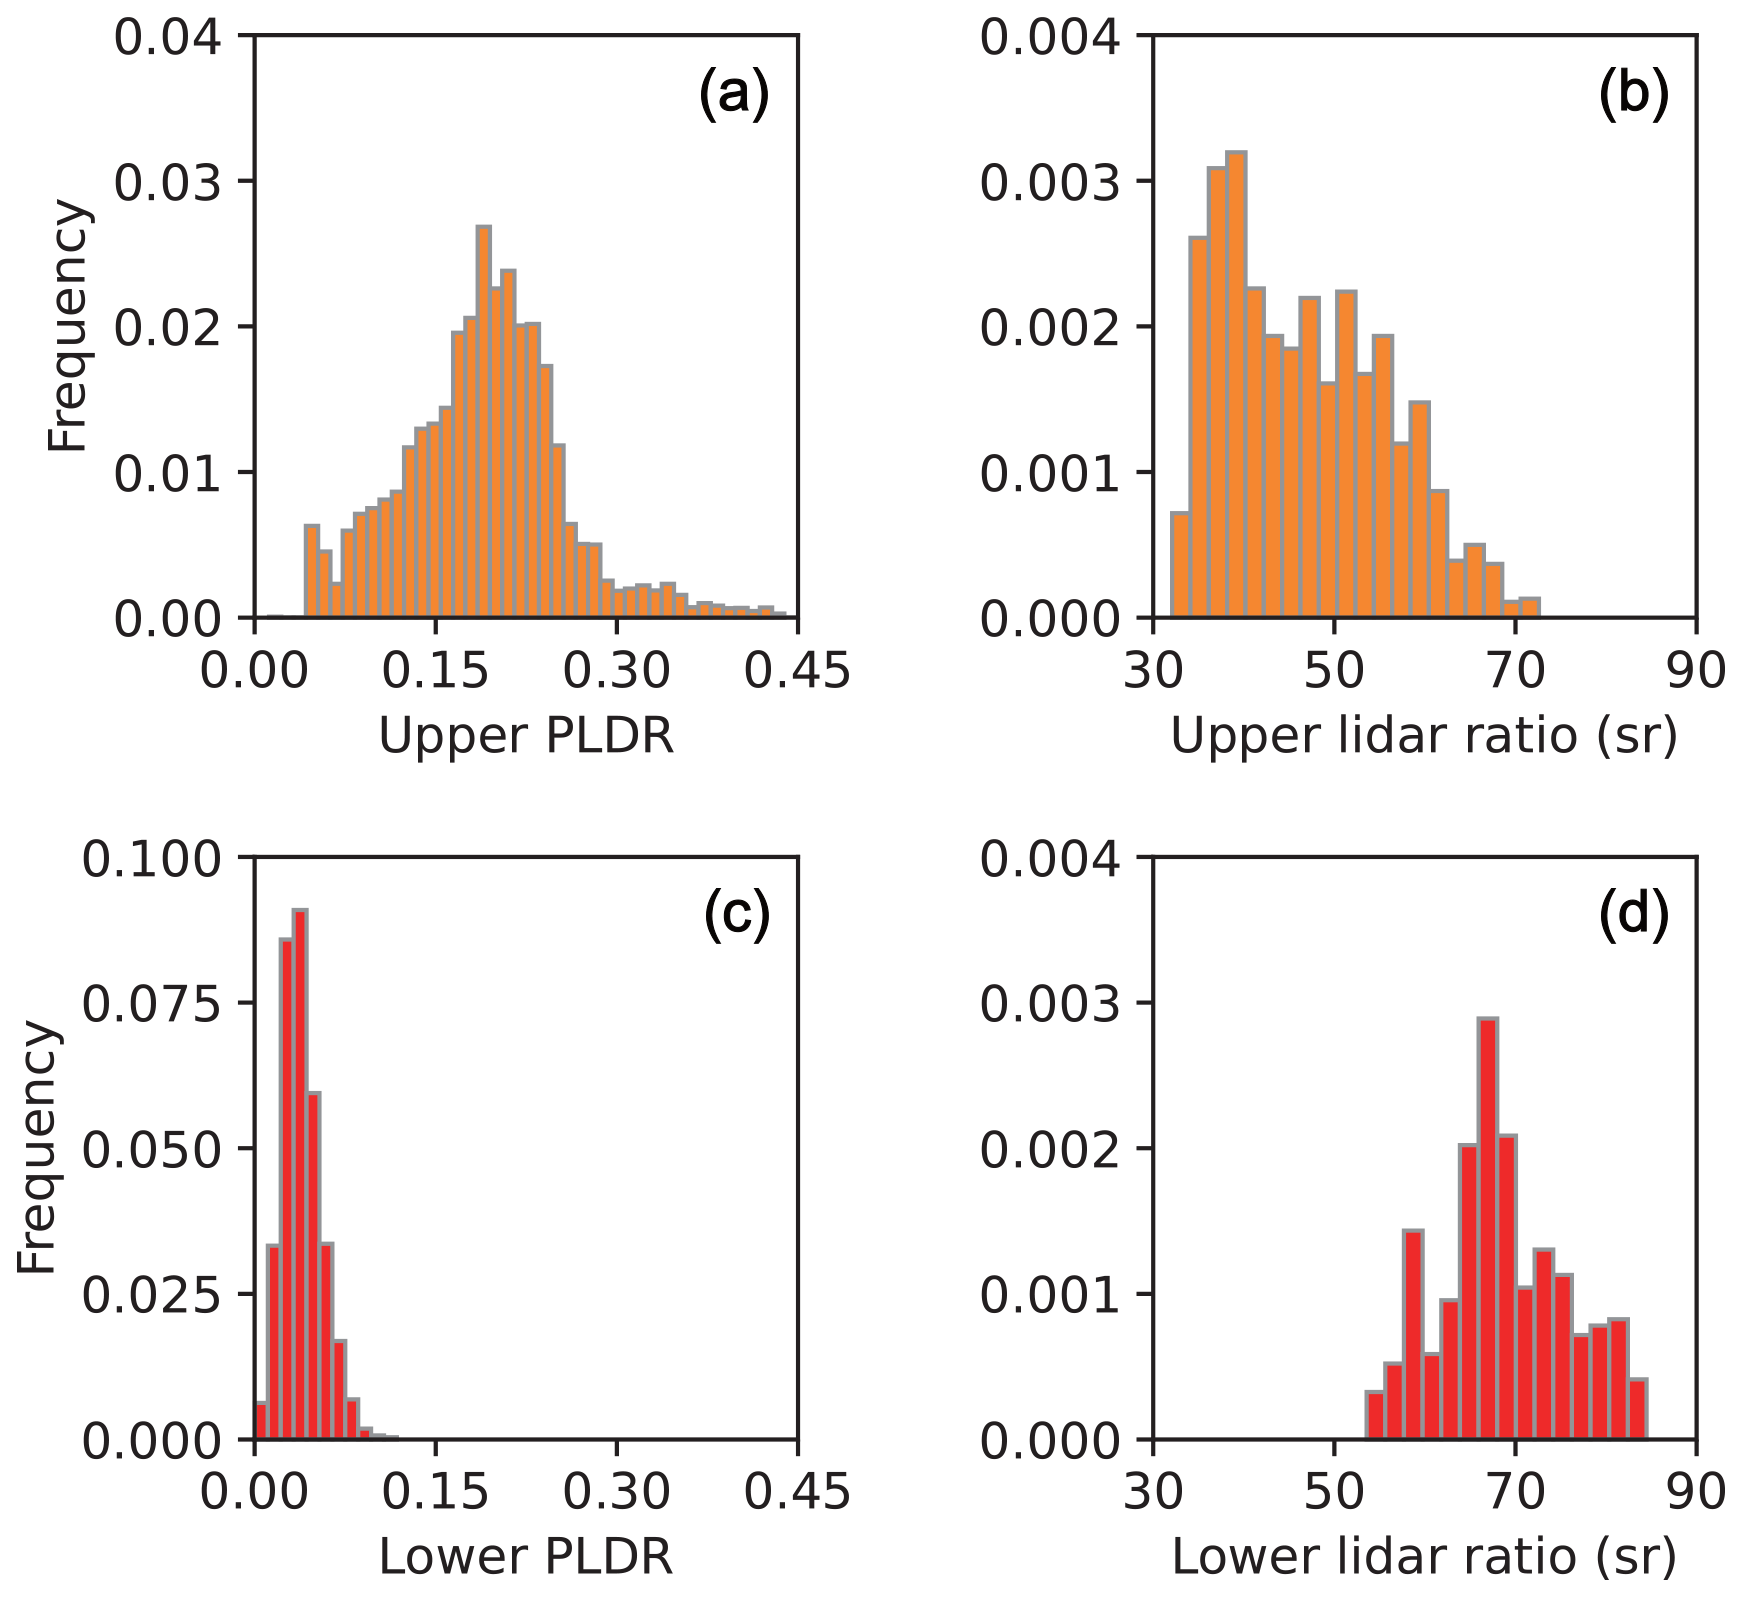
Figure 3Frequency histogram of RL parameters during HPI 1 and HPI 2. Frequency distributions of (a) the PLDR in the upper lidar layer, (b) the lidar ratio (LR) in the upper lidar layer, (c) the PLDR in the lower lidar layer, and (d) the lidar ratio in the lower lidar layer. The steps of the PLDR and lidar ratio are 0.01 and 2 sr, respectively.
By contrast, a low PLDR of less than 10 % (1 %–9 % in most cases) in the lower lidar layer was always found during HPI 1 and HPI 2, and a much higher LR (53–85 sr) was found in the lower lidar layer (Fig. 3c and d), indicating the aerosol's trend to be more absorbing (Müller et al., 2007). The RH of pollutants in the lower lidar layer varied from 25 % to 85 % and increased as the pollution grew more severe (see Fig. S9). Moreover, aerosols that accumulated in the lower lidar layer came from the polluted industrial regions (Zhang et al., 2019a, b) (Fig. S1). Therefore, these spherical absorbing particles were mainly anthropogenic aerosols. Based on these measured lidar parameters, we conclude that the aerosols in the upper lidar layer primarily consisted of dust or polluted dust, while the aerosols in the lower lidar layer are mainly anthropogenic aerosols.
During the period from 20 January to 5 February 2017, weak southerly winds (47 %) typically prevailed in the lower lidar layer between the polluted periods (Fig. S1), carrying polluted air masses from industrial areas and resulting in a sharp increase in EXT355. The strong northwesterly winds in the lower lidar layer from the Gobi desert (37 %) and sparsely populated northern mountain areas (16 %) were most prevalent in the dissipation stage and clean period, causing EXT355 to drop distinctly (Fig. 2d). The average EXT355 in the lower lidar layer during the weak southerly wind conditions was 1.76 km−1, followed by winds from Gobi desert (1.35 km−1) and sparsely populated northern mountain areas (0.62 km−1). The measured PLDR in the lower lidar layer was relatively low and fluctuated with the PLDR in the upper lidar layer. In the upper lidar layer, strong northwesterly winds (66 %) from the Gobi desert prevailed, carrying dust to the CWBF, leading to a significant increment in PLDR. The strong northwesterly winds (7 %) in the upper lidar layer from the sparsely populated northern mountain areas usually occurred during the period of PLDR decline (Fig. 2e). The EXT355 in the upper lidar layer is less than 1.5 km−1 in most cases, except that during the period of southerly wind (27 %) transmission, EXT355 increased considerably. The average EXT355 in the upper lidar layer during the weak southerly wind conditions was 1.00 km−1, which is clearly higher than that during the winds from Gobi desert (0.66 km−1) and sparsely populated northern mountain areas (0.38 km−1).
The shift of the origin of the air mass from northerly to southerly, together with a considerable decrease in wind speed, promotes the southerly transport of industrial pollutants and explosive increase of new particles under stagnant weather conditions (Guo et al., 2014; Zheng et al., 2015) through chemical reactions, such as multiphase chemical formation (Cheng et al., 2016), which is conducive to the accumulation of aerosols in the lower and upper lidar layers. The air mass origin in the upper lidar layer shifts from industrial areas to the Gobi desert with a substantially increasing wind speed, driving the increase of dust concentrations in the upper lidar layer. As a consequence of these shifts, aerosols are stratified in distinct layers, with anthropogenic aerosols in the lower lidar layer and dust or polluted dust in the upper lidar layer. Thus, the meteorological conditions not only regulate the transmission, accumulation, and dissipation of aerosols, but also control the stratification of air pollutants, which is one of the most powerful factors that promote haze pollution in North China.
3.2 Correlation between elevated dust and surface haze pollution
Stratified aerosol typically shrouded CWBF during 20 January to 5 February 2017. The maximum value of PLDR in the upper lidar layer usually appeared during the DS. Moreover, the percentage of EXT355 of total EXT355 in the lower lidar layer during the DS is considerably higher than during the CS and clean periods (Fig. S10). To further investigate the relationship between elevated dust and surface anthropogenic aerosols, HPI 1 and HPI 2 were examined in detail. During HPI 1, the upper dust layer formed slightly later than the accumulation of the anthropogenic aerosols in the lower lidar layer (Fig. 2), indicating that the formation of upper dust is independent of the formation of anthropogenic aerosols in the lower lidar layer. At the end of the CS during HPI 1, the air mass in the upper lidar layer was mainly from the northwest, and the wind speed increased significantly. Particularly, the upper PLDR and the percentage of bottom EXT355 rose considerably. The weak southerly winds in the lower lidar layer rapidly shifted to strong northwesterly winds during DS during HPI 1. The value of PLDR reached a maximum, while the percentage of bottom EXT355 rose at first and then declined. The upper dust layer during HPI 2 appeared earlier than the anthropogenic aerosols in the lower lidar layer (Fig. 2). Similar to HPI 1, the northwesterly winds in the lower lidar layer increased significantly during DS in HPI 2, and both upper PLDR and the percentage of bottom EXT355 reached a maximum.
We selected hourly and spatially (950–1050 m) averaged PLDR as an indicator of dust in the upper lidar layer. Also, the percentage of bottom EXT360 in total EXT360 and the percentage of bottom NO2 VMR in total NO2 VMR measured via MAX-DOAS were used to represent the air pollution near the ground. We find that the hourly and spatially averaged PLDR roughly correlates with the hourly average percentage of bottom EXT360 and percentage of bottom NO2 VMR during HPI 1 and HPI 2 (Fig. 4). This positive correlation suggests that the increase in the upper level PLDR is related to the aggravation of the proportion of aerosol and trace gas at the surface in the whole layer.

Figure 4Average PLDR trend in the upper lidar layer during the two HPIs and its impact on lower level air pollution. Scatterplots showing relationships between the average PLDR and the average percentages of bottom (a) EXT360 during the HPI 1, (b) EXT360 during the HPI 2, (c) NO2 VMRs during the HPI 1, and (d) NO2 VMRs during the HPI 2. The colors in (a) and (b) represent the surface EXT360, and the colors in (c) and (d) represent the surface NO2 concentration. The spatially averaged range of PLDR is 950–1050 m. The hourly averages of PLDR, percentage of bottom EXT360, and percentage of bottom NO2 VMR are used due to the different temporal resolution between RL and MAX-DOAS. The correlation coefficients are shown in the top left; N= number of samples. The analysis period was from 08:00 to 16:00 LT because MAX-DOAS can only be performed during the day.
3.3 Mechanism of the elevated dust layer enhances surface air pollution
We conducted two parallel experiments using WRF-Chem to investigate the mechanism by which the elevated dust layer enhances air pollution near the ground, especially during DS: (1) without considering the dust (dust_off) and (2) with consideration of the dust (dust_on). In the MOSAIC aerosol scheme, dust is represented by the difference of “other inorganic compounds” (OIN) between dust_on and dust_off, and non-dust particles include nitrate, sulfate, ammonium, organic compounds, and BC.
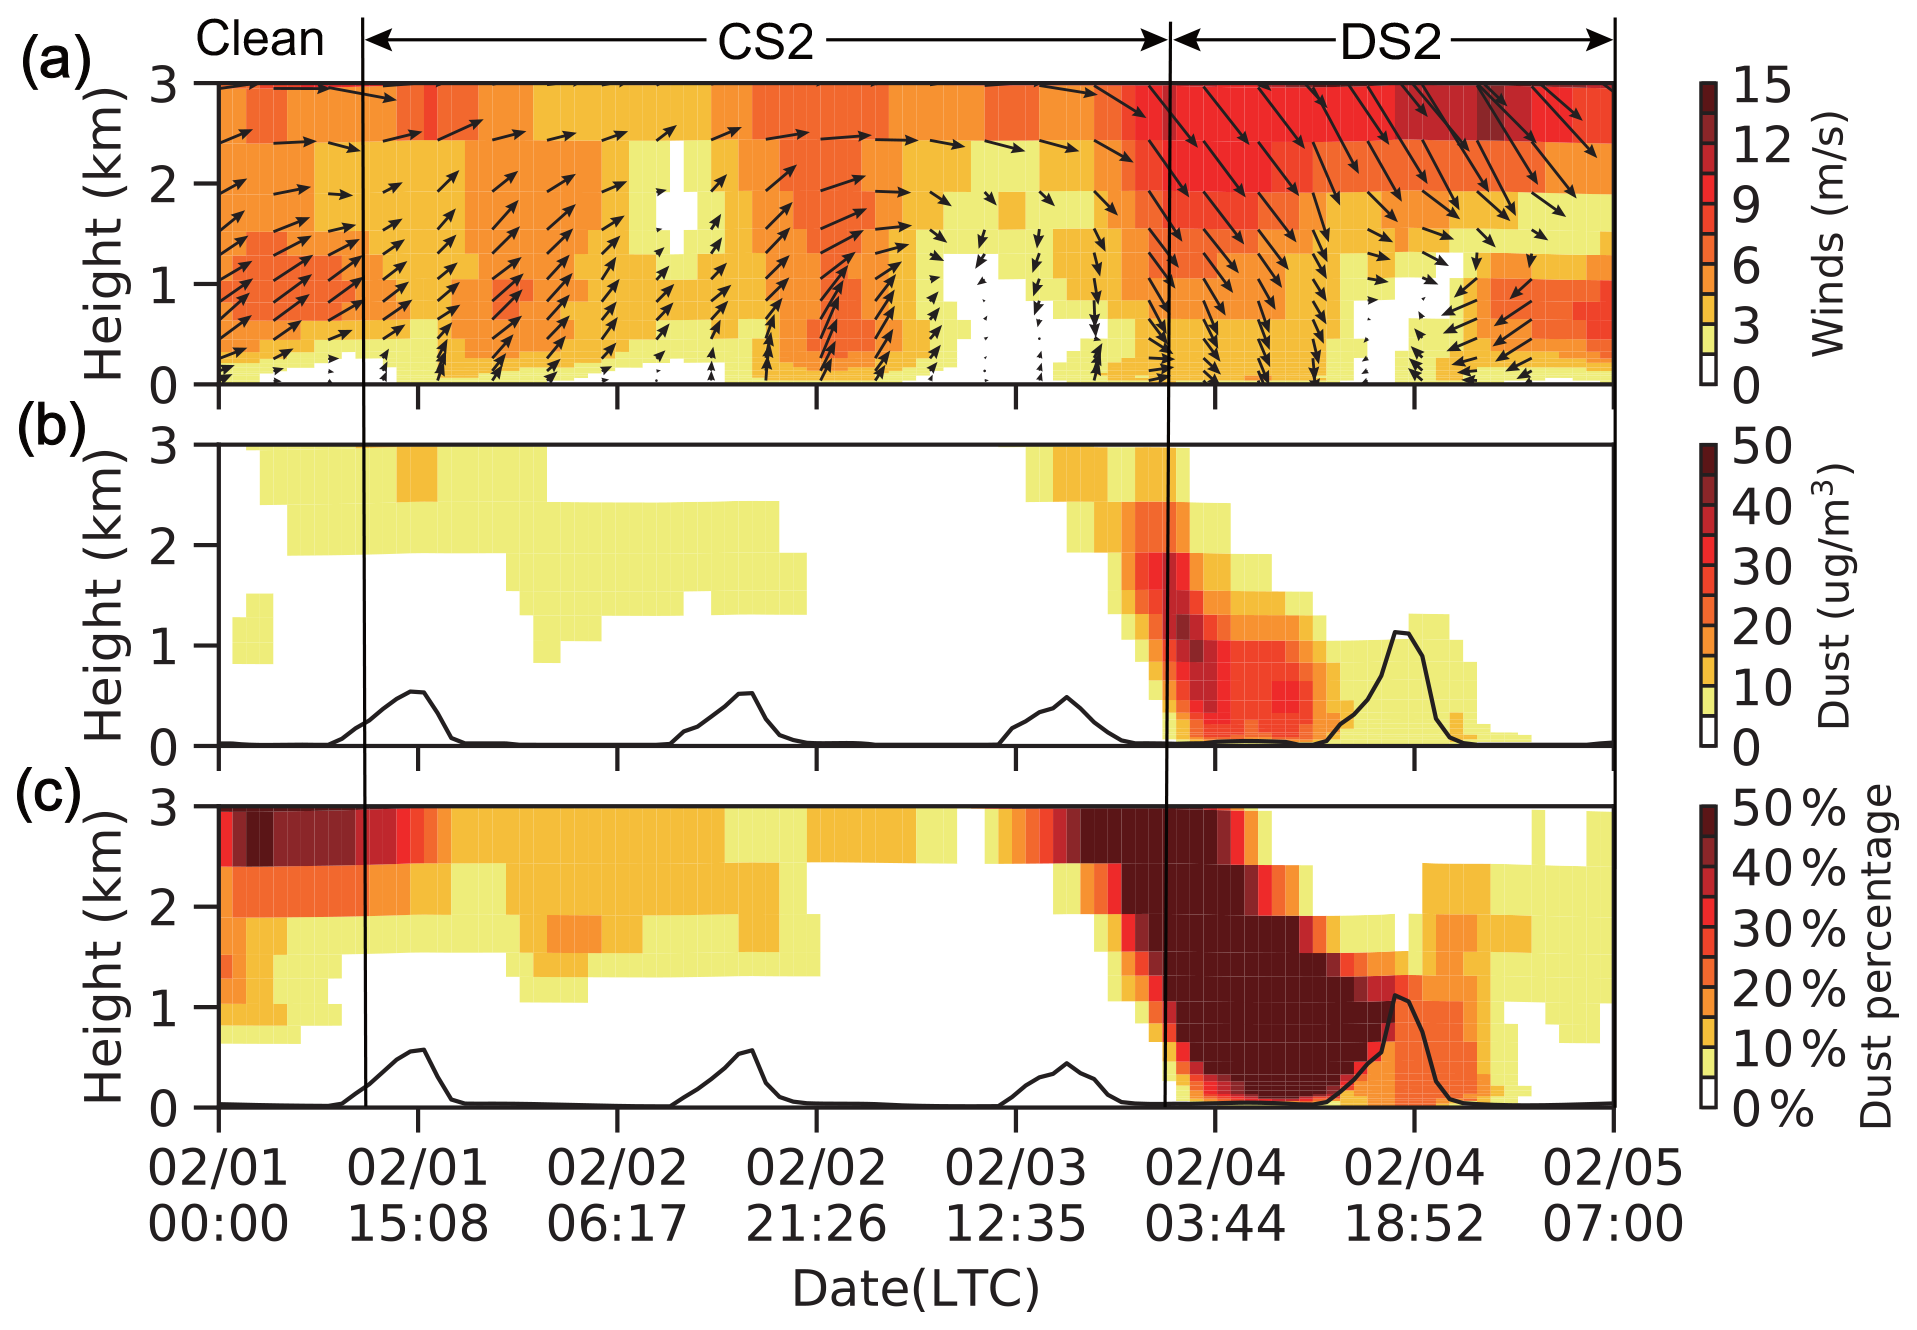
The dust concentrations are derived from the OIN difference between the two scenarios of dust_on and dust_off (Eq. 4), and model simulations reproduced the spatial and temporal variations of dust concentration at CWBF well (Figs. 5 and 6). The PBL height during the CS was usually below 800 m and decreased with the daily accumulation of air pollutants. Dust was typically concentrated above the PBL, and the fraction of dust in total PM10 concentrations increased with height. The lower PBL height led to a reduction of dust entrainment into the PBL from the upper levels, thereby promoting the stratification of aerosol at CWBF. The northwest wind strengthened during the DS, accompanied by a rise of the PBL. The dust concentration within and above the PBL increased significantly, which may be related to the northwesterly transportation and the rise of the PBL. The model simulations show, consistent with the RL observations, that a large amount of suspended dust can be transported from the Mongolia region to downstream urban/industrial regions in northern China, causing a dust layer that covers the anthropogenic aerosols below. Also, the higher PLDR (0.3–0.35) value during the DS suggests that dust controls the optical properties of the upper level aerosol (Freudenthaler et al., 2009). These invisible (at ground level) but common dust aerosols from northwestern China may induce strong aerosol–PBL feedbacks and affect the PBL structure along their transport path (Liu et al., 2002) and may also impede the dissipation of the underlying aerosol.
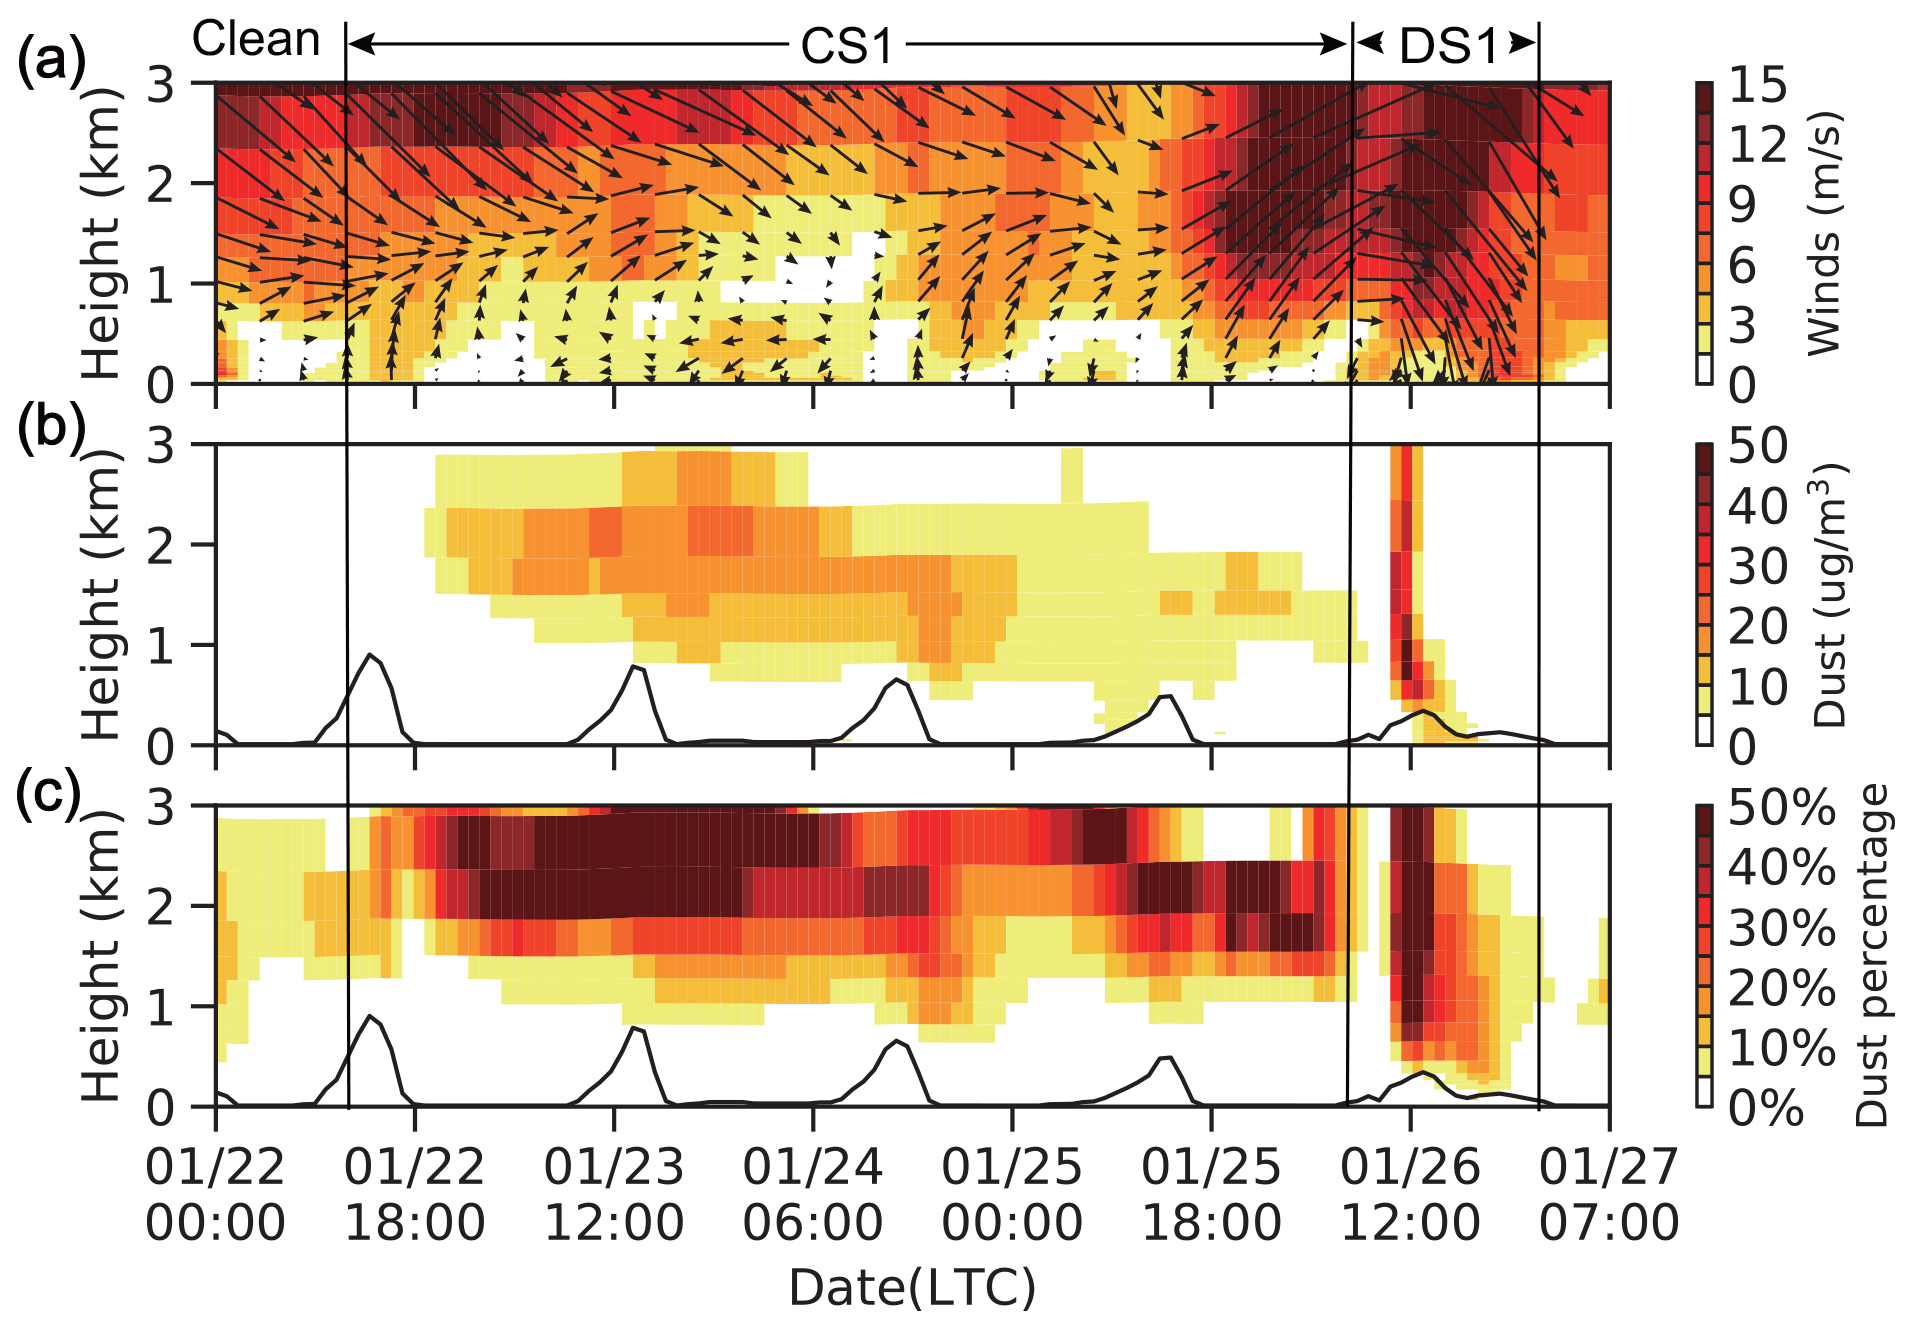
Figure 5Curtain plots of winds and dust concentrations in CWBF from 22 to 26 January 2017. (a) Winds simulated by WRF-Chem, (b) vertical structure of dust concentrations, and (c) vertical structure of the composition of dust in total PM10 concentrations. The black arrow in (a) indicates the wind direction; the upper arrow is for south winds. The black lines in (b) and (c) represent the PBL height evolution in WRF-Chem.
To explore the role of dust in aerosol–meteorology interactions and its impact on surface air pollution during the DS, we examined the dissipation process during HPI 1 and HPI 2. The suspended dust above the PBL is widely distributed in North China during HPI 1, whereas it is mainly located in the upper air over the BTH region during HPI 2 (Fig. 7a). Surface dust concentrations also increased but are clearly less than those within the PBL (Fig. 7b). Unexpectedly, the concentration of surface non-dust particles increased by 0–11.4 µg/m3 after the upper level suspended dust had passed across the downstream urban/industrial regions in northern China (Fig. 7c). In addition, the gaseous pollutants (NO2) exhibited the same variation (increases by 0–4.4 ppb) as the non-dust particle concentration (Fig. 7d). The relative increment of surface non-dust particle and NO2 concentrations is 0 %–21 % (Fig. 7e and f). This indicates that, in addition to directly acting as an important component of air pollutants, suspended dust can also induce the enhancement of non-dust particles and precursor gases during DS, thus further increasing the surface anthropogenic aerosol concentrations.
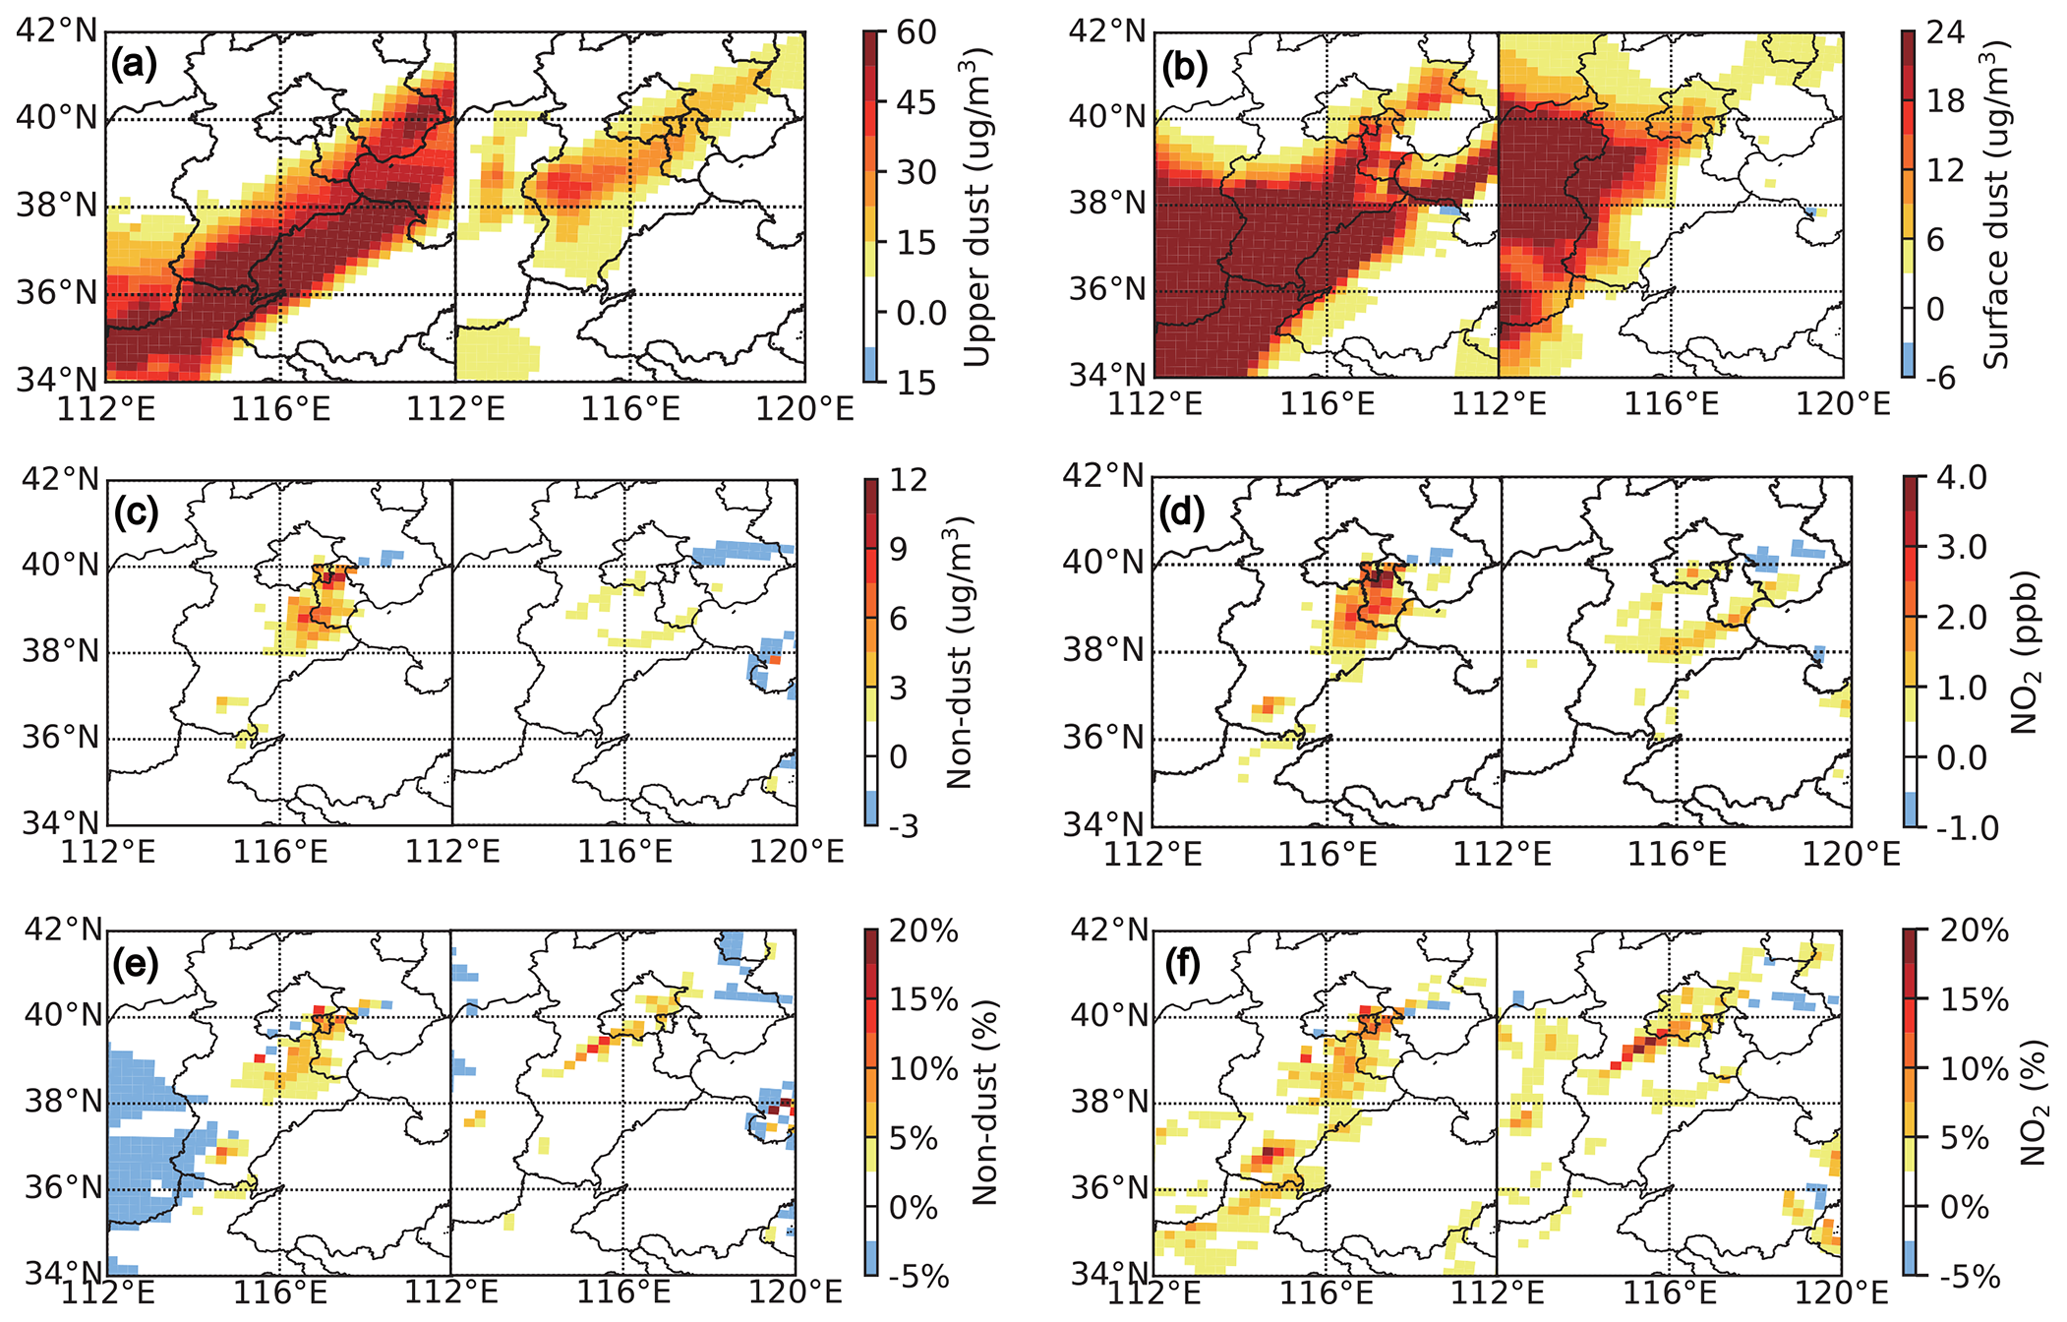
Figure 7Influence of upper level dust on surface non-dust aerosol in HPI 1 and HPI 2 dissipation stages. Horizontal distribution of (a) upper level suspended dust concentration and (b) surface dust concentration. Difference in (c) surface non-dust particle concentration, and (d) surface NO2 concentration between the experiments dust_on and dust_off. The percentage change of (e) surface non-dust particle concentration and (f) surface NO2 concentration between the experiments dust_on and dust_off. The time of each subgraph is the HPI 1 dissipation stage at 13:00 LT on 26 January 2017 (left panels) and HPI 2 dissipation stage at 16:00 LT on 4 February 2017 (right panels).
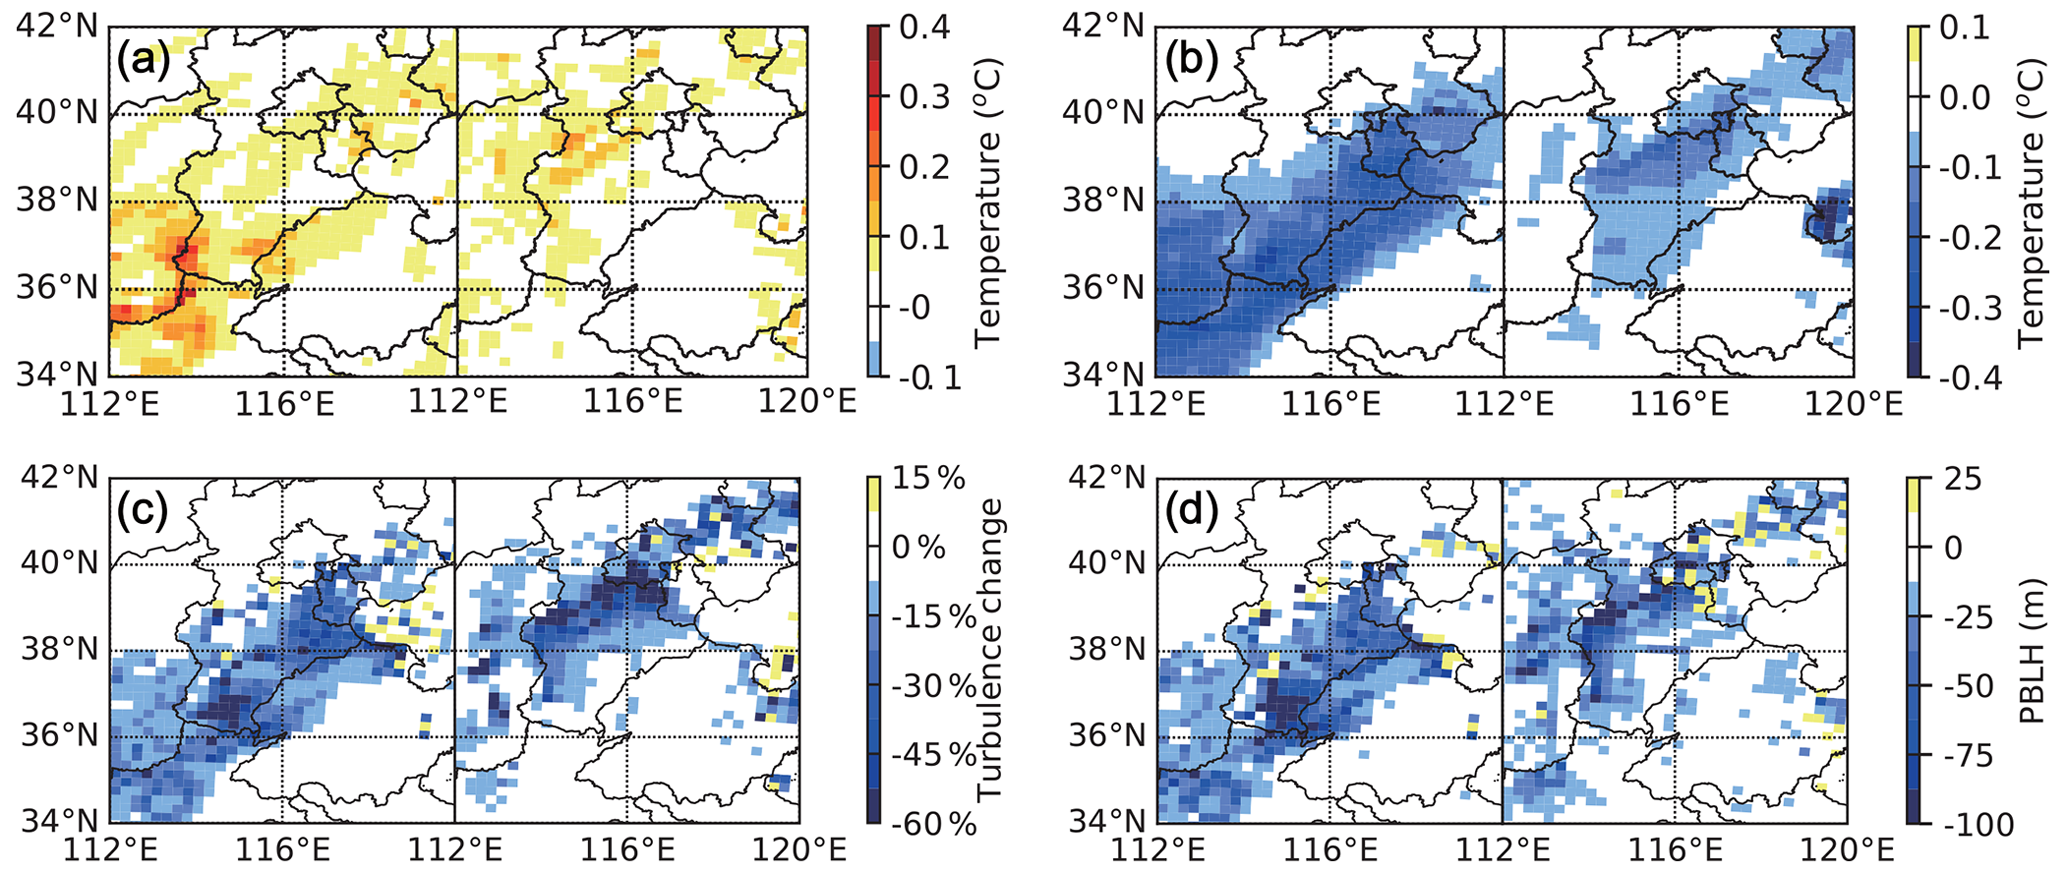
Figure 8Influence of upper level dust on meteorology parameters in HPI 1 and HPI 2 dissipation stages. (a) Maximum enhancement in temperature above the PBL. (b) Maximum temperature reduction within the PBL. Difference in (c) turbulence within the PBL and (d) PBL height between the experiments dust_on and dust_off. The time of each subgraph is the HPI 1 dissipation stage at 13:00 LT on 26 January 2017 (left panels) and HPI 2 dissipation stage at 16:00 LT on 4 February 2017 (right panels).
The interaction between dust and meteorology appears to be responsible for the enhancement of surface air pollution during DS. The dust layer during DS plays an important role in modifying the temperature vertical structure (Fig. 8a and b). The opposing effects of the dust on temperature, a net heating above the PBL, and cooling within the PBL favor formation of a capping inversion and thereby promote aerosol stratification. Consequently, the role of dust in aerosol–meteorology interactions results in more stagnant conditions, with the turbulent exchange coefficient within the PBL falling by over 60 %. Similarly, a significant decrease in PBL height was also attributable to the stable stratification (Fig. 8c and d). Also, the maximum reduction of surface horizontal wind speed up to 1.2 m/s, the relative attenuation of surface horizontal wind speed, is 0 %–27 % (Fig. S11), indicating that the elevated dust also weakens the surface advection. In addition, there is no active convection activity (Fig. S11) during our observed period (Baró et al., 2015; Gao et al., 2013). As a consequence, although the strong northwesterly winds during DS increase the horizontal and vertical diffusion in the atmosphere considerably, the upper level dust brought in simultaneously by the northwesterly wind strengthens the temperature inversion due to both scattering and absorption of solar radiation, thereby weakening convective motion. Enhanced horizontal and vertical atmospheric stability due to dust during DS hinders the air pollutants from being dispersed and leads to a reduction of the dissipation rates of surface air pollution (Li et al., 2017; Liu et al., 2016b; Wilcox et al., 2016).
Table 4Stages of HPI along with the horizontal surface wind speed during the different pollution stages.
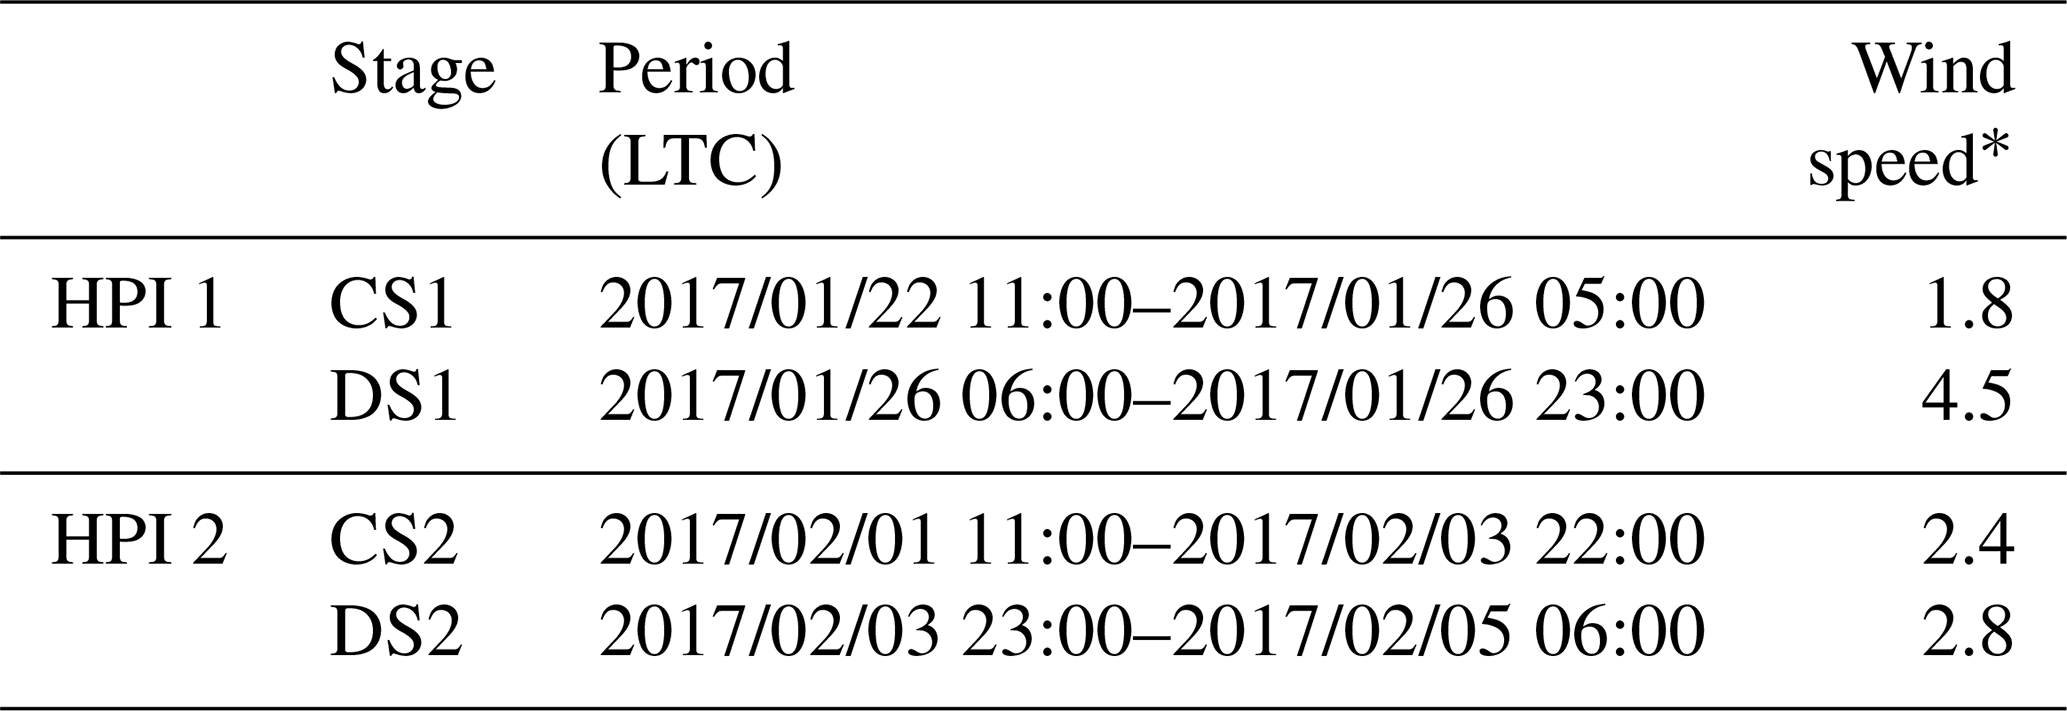
* Spatially averaged wind speed below 100 m. Units are meters per second (m/s).
The results demonstrate that dust aerosols during DS can substantially affect meteorological conditions by strong radiative feedbacks and hence increase the surface air pollution (aerosols and precursor gases) by inhibiting the vertical diffusion of air pollutants. Evidently, such a deterioration of surface air quality is ultimately driven by the emission of pollutants but is also strongly related to the reduced vertical diffusion capacity of the atmosphere. Surface dimming and upper PBL warming by dust aerosols help strengthen the capping inversion and weaken turbulent mixing (Li et al., 2017). Previous studies have also found that the levels of gaseous pollutants, such as NO2 (Wallace and Kanaroglou, 2009), are closely related to temperature inversion. Changes of atmospheric stability, precursor gases, and solar radiation could significantly modify new particle formation (Zhang, 2010) and photochemical reactions (Zhou et al., 2007), which may also contribute to the surface air pollution. The decreasing upper level dust concentration (usually less than 40 µg/m3 in the model) during CS has an insignificant impact on low-level meteorological conditions, while its mixing with anthropogenic aerosols affects upper level aerosol optical properties. Moreover, the mixing of dust and anthropogenic aerosols will promote the atmospheric chemical reactions (Cwiertny et al., 2008) and enhance the formation and growth rates of particles (Nie et al., 2014) to strengthen the particle concentrations in the upper lidar layer (Tao et al., 2014), which in turn further enhances the atmospheric stability and promotes the temperature inversion (Reichardt et al., 2002).
Our observations clearly show the stratification of aerosols over North China, especially during the DS. Absorbing spherical particles (anthropogenic aerosols) and scattering nonspherical particles (dust or polluted dust) prevailed in the lower and upper lidar layers, respectively. This stratification was primarily determined by the meteorological conditions. Firstly, the air mass origins of the different layers resulted in different aerosol types, whereby low-level anthropogenic aerosols came from the southerly polluted industrial regions (Wang et al., 2013), and the upper dust layers arrived mostly from Mongolia (Sun et al., 2001). Secondly, unfavorable vertical diffusion conditions, when strong northwesterly winds prevailed above the PBL with southerly air masses within the PBL, produced lengthy and intense temperature inversions and low PBL heights (Tao et al., 2014). The suppressed convection constrained dust into the PBL, which may also have contributed to higher surface relative humidity (Wilcox et al., 2016). These unique and unfavorable meteorological conditions in North China promote the extremely serious haze pollution and lead to a stratification of aerosols. The PLDR in the upper lidar layer and the percentage of EXT355 in total EXT355 in the lower lidar layer during the DS is considerably higher than during the CS and clean periods. Moreover, the increased share of elevated dust to the upper aerosols coincides with the increase in the proportion of surface aerosol and trace gas in the whole layer. Model simulations show that the elevated dust during DS reduces the lower level atmospheric turbulent mixing and thereby weakens the diffusion and convection of surface aerosols.
During our 3-month observations, we captured nine HPIs, and eight of them showed differences of meteorological conditions in the PBL and in the free troposphere, which have led to the stratification of aerosols. Therefore, aerosol stratification is common in North China. Here we conclude when southerly transmission is dominant in the PBL (anthropogenic aerosols) and northwest transportation prevails in the free troposphere (dust), this usually leads to aerosol stratification. Upper dust aerosol induced dust–meteorology interactions; the dust–meteorology interactions mainly includes two aspects. Firstly, the difference in meteorological conditions between the upper and lower lidar layer leads to the aerosol stratification of upper dust and lower anthropogenic aerosols. Secondly, elevated dust alters the atmospheric thermodynamics and stability, mostly by lower level cooling and upper level heating, especially during the dissipation stage. The suppressed turbulent exchange and decrease in PBL height impede dissipation of persistent heavy haze pollution. The dust–meteorology interactions provide very important information toward a complete understanding of the formation mechanism of winter haze in North China and may also explain the special multiphase chemistry in this region.
In summary, we use ground-based observations combined with WRF-Chem simulations to investigate the role of dust on meteorology and air pollution in North China, specifically focusing on the dissipation process during persistent heavy air pollution events over 4 d. Our results show that elevated dust not only directly affects the air quality, but also worsens the meteorological conditions to impede the rate of dissipation of surface air pollution, which may be one of the reasons why haze pollution in North China is heavier than that in other parts of the country. The interactions between natural dust and heavy anthropogenic surface air pollution events help us better understand the transmission, explosive growth, and dissipation of persistent wintertime air pollution in North China. In a similar way, considering the extremely strong long-range transport potential of dust aerosol, Saharan dust could affect India (Deepshikha et al., 2006), Europe (Papayannis et al., 2008) and the United States (Prospero, 1999), since Asian dust can even be transported one full circuit around the globe (Uno et al., 2009). Similar stratification and effects should be investigated in other parts of the world that also suffer from severe particulate pollution (Wu et al., 2017).
All code and data needed to evaluate the conclusions in the paper are present in the paper and/or the Supplement. Additional code and data related to this paper may be requested from the authors.
The supplement related to this article is available online at: https://doi.org/10.5194/acp-20-14917-2020-supplement.
CL, ZX, and QH conceived and supervised the study. ZW analyzed the Raman lidar data. YD provided the technical support for Raman lidar and data inversion recommendations. ZW wrote the manuscript with input from CL, ZX, and QH. MOA reviewed and commented on the paper. CZ, TL, YZ, and QH provided the WRF-Chem model simulations. HL, CX, WT, XJ, and JL provided the MAX-DOAS data. MOA, CL, ZX, QH, and JL contributed to discussing the results and revised the manuscript.
The authors declare that they have no conflict of interest.
The authors acknowledge the National Oceanic and Atmospheric Administration (NOAA) Air Resources Laboratory (ARL) for the provision of the HYSPLIT transport and dispersion model used in this publication. We thank WRF-Chem developers for making the model available to the scientific community. We thank NASA Langley Research Center Atmospheric Sciences Data Center for providing the CALIPSO data.
This research has been supported by the National Key Research and Development Program of China (grant nos. 2018YFC0213104, 2017YFC0210002, and 2016YFC0203302), the Anhui Science and Technology Major Project (grant no. 18030801111), the National Natural Science Foundation of China (grant nos. 41722501, 51778596, and 41977184), the Strategic Priority Research Program of the Chinese Academy of Sciences (grant no. XDA23020301), the National Key Project for Causes and Control of Heavy Air Pollution (grant nos. DQGG0102 and DQGG0205), the Major Projects of High Resolution Earth Observation Systems of National Science and Technology (grant no. 05-Y30B01-9001-19/20-3), and the Civil Aerospace Technology Advance Research Project (grant no. Y7K00100KJ).
This paper was edited by Matthias Tesche and reviewed by two anonymous referees.
Ansmann, A., Riebesell, M., and Weitkamp, C.: Measurement of atmospheric aerosol extinction profiles with a Raman lidar, Opt. Lett., 15, 746–748, https://doi.org/10.1364/OL.15.000746, 1990.
Ansmann, A., Wandinger, U., Riebesell, M., Weitkamp, C., and Michaelis, W.: Independent measurement of extinction and backscatter profiles in cirrus clouds by using a combined Raman elastic-backscatter lidar, Appl. Optics, 31, 7113–7131, https://doi.org/10.1364/AO.31.007113, 1992.
Baró, R., Jiménez-Guerrero, P., Balzarini, A., Curci, G., Forkel, R., Grell, G., and Pirovano, G.: Sensitivity analysis of the microphysics scheme in WRF-Chem contributions to AQMEII phase 2, Atmos. Environ., 115, 620–629, https://doi.org/10.1016/j.atmosenv.2015.01.047, 2015.
Burton, S. P., Ferrare, R. A., Hostetler, C. A., Hair, J. W., Rogers, R. R., Obland, M. D., Butler, C. F., Cook, A. L., Harper, D. B., and Froyd, K. D.: Aerosol classification using airborne High Spectral Resolution Lidar measurements – methodology and examples, Atmos. Meas. Tech., 5, 73–98, https://doi.org/10.5194/amt-5-73-2012, 2012.
Chen, W. N., Chiang, C. W., and Nee, J. B.: Lidar ratio and depolarization ratio for cirrus clouds, Appl. Optics, 41, 6470–6476, https://doi.org/10.1364/ao.41.006470, 2002.
Cheng, Y., Zheng, G., Wei, C., Mu, Q., Zheng, B., Wang, Z., Gao, M., Zhang, Q., He, K., Carmichael, G., Poschl, U., and Su, H.: Reactive nitrogen chemistry in aerosol water as a source of sulfate during haze events in China, Sci. Adv., 2, e1601530, https://doi.org/10.1126/sciadv.1601530, 2016.
Cwiertny, D. M., Young, M. A., and Grassian, V. H.: Chemistry and photochemistry of mineral dust aerosol, Annu. Rev. Phys. Chem., 59, 27–51, https://doi.org/10.1146/annurev.physchem.59.032607.093630, 2008.
Deepshikha, S., Satheesh, S. K., and Srinivasan, J.: Dust aerosols over India and adjacent continents retrieved using METEOSAT infrared radiance Part I: sources and regional distribution, Ann. Geophys., 24, 37–61, https://doi.org/10.5194/angeo-24-37-2006, 2006.
de Foy, B., Burton, S. P., Ferrare, R. A., Hostetler, C. A., Hair, J. W., Wiedinmyer, C., and Molina, L. T.: Aerosol plume transport and transformation in high spectral resolution lidar measurements and WRF-Flexpart simulations during the MILAGRO Field Campaign, Atmos. Chem. Phys., 11, 3543–3563, https://doi.org/10.5194/acp-11-3543-2011, 2011.
Ding, A. J., Huang, X., Nie, W., Sun, J. N., Kerminen, V. M., Petäjä, T., Su, H., Cheng, Y. F., Yang, X. Q., Wang, M. H., Chi, X. G., Wang, J. P., Virkkula, A., Guo, W. D., Yuan, J., Wang, S. Y., Zhang, R. J., Wu, Y. F., Song, Y., Zhu, T., Zilitinkevich, S., Kulmala, M., and Fu, C. B.: Enhanced haze pollution by black carbon in megacities in China, Geophys. Res. Lett., 43, 2873–2879, https://doi.org/10.1002/2016gl067745, 2016.
Ek, M. B., Mitchell, K. E., Lin, Y., Rogers, E., Grunmann, P., Koren, V., Gayno, G., and Tarpley, J. D.: Implementation of Noah land surface model advances in the National Centers for Environmental Prediction operational mesoscale Eta model, J. Geophys. Res.-Atmos., 108, 8851, https://doi.org/10.1029/2002jd003296, 2003.
Ferrare, R., Melfi, S., Whiteman, D., Evans, K., Poellot, M., and Kaufman, Y.: Raman lidar measurements of aerosol extinction and backscattering: 2. Derivation of aerosol real refractive index, single-scattering albedo, and humidification factor using Raman lidar and aircraft size distribution measurements, J. Geophys. Res.-Atmos., 103, 19673–19689, https://doi.org/10.1029/98JD01647, 1998.
Freudenthaler, V., Esselborn, M., Wiegner, M., Heese, B., Tesche, M., Ansmann, A., MüLler, D., Althausen, D., Wirth, M., Fix, A., Ehret, G., Knippertz, P., Toledano, C., Gasteiger, J., Garhammer, M., and Seefeldner, M.: Depolarization ratio profiling at several wavelengths in pure Saharan dust during SAMUM 2006, Tellus B, 61, 165–179, https://doi.org/10.1111/j.1600-0889.2008.00396.x, 2009.
Frieß, U., Monks, P. S., Remedios, J. J., Rozanov, A., Sinreich, R., Wagner, T., and Platt, U.: MAX-DOAS O4 measurements: A new technique to derive information on atmospheric aerosols: 2. Modeling studies, J. Geophys. Res., 111, D14203 https://doi.org/10.1029/2005jd006618, 2006.
Gao, M., Carmichael, G. R., Wang, Y., Saide, P. E., Yu, M., Xin, J., Liu, Z., and Wang, Z.: Modeling study of the 2010 regional haze event in the North China Plain, Atmos. Chem. Phys., 16, 1673–1691, https://doi.org/10.5194/acp-16-1673-2016, 2016.
Gao, Y., Wu, T., Chen, B., Wang, J., and Liu, Y.: A numerical simulation of microphysical structure of cloud associated with the 2008 winter freezing rain over southern China, J. Meteorol. Soc. Jpn., 91, 101–117, https://doi.org/10.2151/jmsj.2013-202, 2013.
Grell, G. A. and Dévényi, D.: A generalized approach to parameterizing convection combining ensemble and data assimilation techniques, Geophys. Res. Lett., 29, 38-1–38-4, https://doi.org/10.1029/2002gl015311, 2002.
Groß, S., Esselborn, M., Weinzierl, B., Wirth, M., Fix, A., and Petzold, A.: Aerosol classification by airborne high spectral resolution lidar observations, Atmos. Chem. Phys., 13, 2487–2505, https://doi.org/10.5194/acp-13-2487-2013, 2013.
Guo, S., Hu, M., Zamora, M. L., Peng, J., Shang, D., Zheng, J., Du, Z., Wu, Z., Shao, M., Zeng, L., Molina, M. J., and Zhang, R.: Elucidating severe urban haze formation in China, P. Natl. Acad. Sci. USA, 111, 17373–17378, https://doi.org/10.1073/pnas.1419604111, 2014.
Hänel, A., Baars, H., Althausen, D., Ansmann, A., Engelmann, R., and Sun, J. Y.: One-year aerosol profiling with EUCAARI Raman lidar at Shangdianzi GAW station: Beijing plume and seasonal variations, J. Geophys. Res.-Atmos., 117, D13201, https://doi.org/10.1029/2012jd017577, 2012.
Heese, B., Flentje, H., Althausen, D., Ansmann, A., and Frey, S.: Ceilometer lidar comparison: backscatter coefficient retrieval and signal-to-noise ratio determination, Atmos. Meas. Tech., 3, 1763–1770, https://doi.org/10.5194/amt-3-1763-2010, 2010.
Huang, R. J., Zhang, Y., Bozzetti, C., Ho, K. F., Cao, J. J., Han, Y., Daellenbach, K. R., Slowik, J. G., Platt, S. M., Canonaco, F., Zotter, P., Wolf, R., Pieber, S. M., Bruns, E. A., Crippa, M., Ciarelli, G., Piazzalunga, A., Schwikowski, M., Abbaszade, G., Schnelle-Kreis, J., Zimmermann, R., An, Z., Szidat, S., Baltensperger, U., El Haddad, I., and Prevot, A. S.: High secondary aerosol contribution to particulate pollution during haze events in China, Nature, 514, 218–222, https://doi.org/10.1038/nature13774, 2014.
Huang, X., Wang, Z., and Ding, A.: Impact of Aerosol–PBL Interaction on Haze Pollution: Multiyear Observational Evidences in North China, Geophys. Res. Lett., 45, 8596–8603, https://doi.org/10.1029/2018gl079239, 2018.
Irie, H., Kanaya, Y., Akimoto, H., Iwabuchi, H., Shimizu, A., and Aoki, K.: First retrieval of tropospheric aerosol profiles using MAX-DOAS and comparison with lidar and sky radiometer measurements, Atmos. Chem. Phys., 8, 341–350, https://doi.org/10.5194/acp-8-341-2008, 2008.
Ji, X., Liu, C., Xie, Z., Hu, Q., Dong, Y., Fan, G., Zhang, T., Xing, C., Wang, Z., Javed, Z., and Liu, J.: Comparison of mixing layer height inversion algorithms using lidar and a pollution case study in Baoding, China, J. Environ. Sci. (China), 79, 81–90, https://doi.org/10.1016/j.jes.2018.11.003, 2019.
Li, M., Zhang, Q., Streets, D. G., He, K. B., Cheng, Y. F., Emmons, L. K., Huo, H., Kang, S. C., Lu, Z., Shao, M., Su, H., Yu, X., and Zhang, Y.: Mapping Asian anthropogenic emissions of non-methane volatile organic compounds to multiple chemical mechanisms, Atmos. Chem. Phys., 14, 5617–5638, https://doi.org/10.5194/acp-14-5617-2014, 2014.
Li, T., Wang, H., Zhao, T., Xue, M., Wang, Y., Che, H., and Jiang, C.: The Impacts of Different PBL Schemes on the Simulation of PM2.5 during Severe Haze Episodes in the Jing-Jin-Ji Region and Its Surroundings in China, Adv. Meteorol., 2016, 1–15, https://doi.org/10.1155/2016/6295878, 2016.
Li, Z., Guo, J., Ding, A., Liao, H., Liu, J., Sun, Y., Wang, T., Xue, H., Zhang, H., and Zhu, B.: Aerosol and boundary-layer interactions and impact on air quality, Natl. Sci. Rev., 4, 810–833, https://doi.org/10.1093/nsr/nwx117, 2017.
Lin, Y.-L., Farley, R. D., and Orville, H. D.: Bulk parameterization of the snow field in a cloud model, J. Clim. Appl. Meteorol., 22, 1065–1092, 1983.
Liu, F., Zhang, Q., Tong, D., Zheng, B., Li, M., Huo, H., and He, K. B.: High-resolution inventory of technologies, activities, and emissions of coal-fired power plants in China from 1990 to 2010, Atmos. Chem. Phys., 15, 13299–13317, https://doi.org/10.5194/acp-15-13299-2015, 2015.
Liu, H., Liu, C., Xie, Z., Li, Y., Huang, X., Wang, S., Xu, J., and Xie, P.: A paradox for air pollution controlling in China revealed by “APEC Blue” and “Parade Blue”, Sci. Rep., 6, 34408, https://doi.org/10.1038/srep34408, 2016a.
Liu, L., Huang, X., Ding, A., and Fu, C.: Dust-induced radiative feedbacks in north China: A dust storm episode modeling study using WRF-Chem, Atmos. Environ., 129, 43–54, https://doi.org/10.1016/j.atmosenv.2016.01.019, 2016b.
Liu, Z., Sugimoto, N., and Murayama, T.: Extinction-to-backscatter ratio of Asian dust observed with high-spectral-resolution lidar and Raman lidar, Appl. Optics, 41, 2760–2767, https://doi.org/10.1364/AO.41.002760, 2002.
Liu, Z., Liu, D., Huang, J., Vaughan, M., Uno, I., Sugimoto, N., Kittaka, C., Trepte, C., Wang, Z., Hostetler, C., and Winker, D.: Airborne dust distributions over the Tibetan Plateau and surrounding areas derived from the first year of CALIPSO lidar observations, Atmos. Chem. Phys., 8, 5045–5060, https://doi.org/10.5194/acp-8-5045-2008, 2008.
Mlawer, E. J., Taubman, S. J., Brown, P. D., Iacono, M. J., and Clough, S. A.: Radiative transfer for inhomogeneous atmospheres: RRTM, a validated correlated-k model for the longwave, J. Geophys. Res.-Atmos., 102, 16663–16682, https://doi.org/10.1029/97jd00237, 1997.
Müller, D., Tesche, M., Eichler, H., Engelmann, R., Althausen, D., Ansmann, A., Cheng, Y. F., Zhang, Y. H., and Hu, M.: Strong particle light absorption over the Pearl River Delta (south China) and Beijing (north China) determined from combined Raman lidar and Sun photometer observations, Geophys. Res. Lett., 33, L20811, https://doi.org/10.1029/2006gl027196, 2006.
Müller, D., Ansmann, A., Mattis, I., Tesche, M., Wandinger, U., Althausen, D., and Pisani, G.: Aerosol-type-dependent lidar ratios observed with Raman lidar, J. Geophys. Res., 112, D16202, https://doi.org/10.1029/2006jd008292, 2007.
Murayama, T., Okamoto, H., Kaneyasu, N., Kamataki, H., and Miura, K.: Application of lidar depolarization measurement in the atmospheric boundary layer: Effects of dust and sea-salt particles, J. Geophys. Res.-Atmos., 104, 31781–31792, https://doi.org/10.1029/1999jd900503, 1999.
Murayama, T., Masonis, S. J., Redemann, J., Anderson, T. L., Schmid, B., Livingston, J. M., Russell, P. B., Huebert, B., Howell, S. G., McNaughton, C. S., Clarke, A., Abo, M., Shimizu, A., Sugimoto, N., Yabuki, M., Kuze, H., Fukagawa, S., Maxwell-Meier, K., Weber, R. J., Orsini, D. A., Blomquist, B., Bandy, A., and Thornton, D.: An intercomparison of lidar-derived aerosol optical properties with airborne measurements near Tokyo during ACE-Asia, J. Geophys. Res., 108, 8651, https://doi.org/10.1029/2002jd003259, 2003.
Murayama, T., Müller, D., Wada, K., Shimizu, A., Sekiguchi, M., and Tsukamoto, T.: Characterization of Asian dust and Siberian smoke with multi-wavelength Raman lidar over Tokyo, Japan in spring 2003, Geophys. Res. Lett., 31, L23103, https://doi.org/10.1029/2004gl021105, 2004.
Nie, W., Ding, A., Wang, T., Kerminen, V. M., George, C., Xue, L., Wang, W., Zhang, Q., Petaja, T., Qi, X., Gao, X., Wang, X., Yang, X., Fu, C., and Kulmala, M.: Polluted dust promotes new particle formation and growth, Sci. Rep., 4, 6634, https://doi.org/10.1038/srep06634, 2014.
Omar, A. H., Winker, D. M., Vaughan, M. A., Hu, Y., Trepte, C. R., Ferrare, R. A., Lee, K.-P., Hostetler, C. A., Kittaka, C., Rogers, R. R., Kuehn, R. E., and Liu, Z.: The CALIPSO Automated Aerosol Classification and Lidar Ratio Selection Algorithm, J. Atmos. Ocean. Technol., 26, 1994–2014, https://doi.org/10.1175/2009jtecha1231.1, 2009.
Papayannis, A., Amiridis, V., Mona, L., Tsaknakis, G., Balis, D., Bösenberg, J., Chaikovski, A., De Tomasi, F., Grigorov, I., Mattis, I., Mitev, V., Müller, D., Nickovic, S., Pérez, C., Pietruczuk, A., Pisani, G., Ravetta, F., Rizi, V., Sicard, M., Trickl, T., Wiegner, M., Gerding, M., Mamouri, R. E., D'Amico, G., and Pappalardo, G.: Systematic lidar observations of Saharan dust over Europe in the frame of EARLINET (2000–2002), J. Geophys. Res.-Atmos., 113, D10204, https://doi.org/10.1029/2007jd009028, 2008.
Prospero, J. M.: Long-range transport of mineral dust in the global atmosphere: Impact of African dust on the environment of the southeastern United States, P. Natl. Acad. Sci. USA., 96, 3396–3403, https://doi.org/10.1073/pnas.96.7.3396, 1999.
Reichardt, J., Reichardt, S., Behrendt, A., and McGee, T. J.: Correlations among the optical properties of cirrus-cloud particles: Implications for spaceborne remote sensing, Geophys. Res. Lett., 29, 1668, https://doi.org/10.1029/2002gl014836, 2002.
Sakai, T., Shibata, T., Iwasaka, Y., Nagai, T., Nakazato, M., Matsumura, T., Ichiki, A., Kim, Y.-S., Tamura, K., and Troshkin, D.: Case study of Raman lidar measurements of Asian dust events in 2000 and 2001 at Nagoya and Tsukuba, Japan, Atmos. Environ., 36, 5479–5489, https://doi.org/10.1016/S1352-2310(02)00664-7, 2002.
Sakai, T., Nagai, T., Nakazato, M., Mano, Y., and Matsumura, T.: Ice clouds and Asian dust studied with lidar measurements of particle extinction-to-backscatter ratio, particle depolarization, and water-vapor mixing ratio over Tsukuba, Appl. Optics, 42, 7103–7116, https://doi.org/10.1364/AO.42.007103, 2003.
Sassen, K.: The polarization lidar technique for cloud research: A review and current assessment, B. Am. Meteorol. Soc., 72, 1848–1866, https://doi.org/10.1175/1520-0477(1991)072<1848:TPLTFC>2.0.CO;2, 1991.
Sokolik, I. N. and Toon, O. B.: Direct radiative forcing by anthropogenic airborne mineral aerosols, Nature, 381, 681, https://doi.org/10.1038/381681a0, 1996.
Sun, J., Zhang, M., and Liu, T.: Spatial and temporal characteristics of dust storms in China and its surrounding regions, 1960–1999: Relations to source area and climate, J. Geophys. Res.-Atmos., 106, 10325–10333, https://doi.org/10.1029/2000jd900665, 2001.
Tao, M., Chen, L., Wang, Z., Ma, P., Tao, J., and Jia, S.: A study of urban pollution and haze clouds over northern China during the dusty season based on satellite and surface observations, Atmos. Environ., 82, 183–192, https://doi.org/10.1016/j.atmosenv.2013.10.010, 2014.
Tao, Z., Liu, D., Zhong, Z., Shi, B., Nie, M., Ma, X., and Zhou, J.: Measurements of cirrus clouds with a three-wavelength lidar, Chin. Opt. Lett., 10, 050101–050103, https://doi.org/10.3788/col201210.050101, 2012.
Tesche, M., Ansmann, A., Müller, D., Althausen, D., Engelmann, R., Hu, M., and Zhang, Y.: Particle backscatter, extinction, and lidar ratio profiling with Raman lidar in south and north China, Appl. Optics, 46, 6302–6308, https://doi.org/10.1364/AO.46.006302, 2007.
Tesche, M., Ansmann, A., Müller, D., Althausen, D., Engelmann, R., Freudenthaler, V., and Groß, S.: Vertically resolved separation of dust and smoke over Cape Verde using multiwavelength Raman and polarization lidars during Saharan Mineral Dust Experiment 2008, J. Geophys. Res.-Atmos., 114, D13202, https://doi.org/10.1029/2009jd011862, 2009.
Uno, I., Eguchi, K., Yumimoto, K., Takemura, T., Shimizu, A., Uematsu, M., Liu, Z., Wang, Z., Hara, Y., and Sugimoto, N.: Asian dust transported one full circuit around the globe, Nat. Geosci., 2, 557–560, https://doi.org/10.1038/ngeo583, 2009.
Wallace, J. and Kanaroglou, P.: The effect of temperature inversions on ground-level nitrogen dioxide (NO2) and fine particulate matter (PM2.5) using temperature profiles from the Atmospheric Infrared Sounder (AIRS), Sci. Total Environ., 407, 5085–5095, https://doi.org/10.1016/j.scitotenv.2009.05.050, 2009.
Wandinger, U. and Ansmann, A.: Experimental determination of the lidar overlap profile with Raman lidar, Appl. Optics, 41, 511–514, https://doi.org/10.1364/AO.41.000511, 2002.
Wang, Z. B., Hu, M., Wu, Z. J., Yue, D. L., He, L. Y., Huang, X. F., Liu, X. G., and Wiedensohler, A.: Long-term measurements of particle number size distributions and the relationships with air mass history and source apportionment in the summer of Beijing, Atmos. Chem. Phys., 13, 10159–10170, https://doi.org/10.5194/acp-13-10159-2013, 2013.
Wang, Z., Huang, X., and Ding, A.: Optimization of vertical grid setting for air quality modelling in China considering the effect of aerosol-boundary layer interaction, Atmos. Environ., 210, 1–13, https://doi.org/10.1016/j.atmosenv.2019.04.042, 2019.
Wilcox, E. M., Thomas, R. M., Praveen, P. S., Pistone, K., Bender, F. A., and Ramanathan, V.: Black carbon solar absorption suppresses turbulence in the atmospheric boundary layer, P. Natl. Acad. Sci. USA, 113, 11794–11799, https://doi.org/10.1073/pnas.1525746113, 2016.
Wu, Y. C., Shiledar, A., Li, Y. C., Wong, J., Feng, S., Chen, X., Chen, C., Jin, K., Janamian, S., Yang, Z., Ballard, Z. S., Gorocs, Z., Feizi, A., and Ozcan, A.: Air quality monitoring using mobile microscopy and machine learning, Light. Sci. Appl., 6, e17046, https://doi.org/10.1038/lsa.2017.46, 2017.
Xia, X. and Zong, X.: Shortwave versus longwave direct radiative forcing by Taklimakan dust aerosols, Geophys. Res. Lett., 36, L07803, https://doi.org/10.1029/2009gl037237, 2009.
Xie, C., Nishizawa, T., Sugimoto, N., Matsui, I., and Wang, Z.: Characteristics of aerosol optical properties in pollution and Asian dust episodes over Beijing, China, Appl. Optics, 47, 4945–4951, https://doi.org/10.1364/AO.47.004945, 2008.
Xing, C., Liu, C., Wang, S., Chan, K. L., Gao, Y., Huang, X., Su, W., Zhang, C., Dong, Y., Fan, G., Zhang, T., Chen, Z., Hu, Q., Su, H., Xie, Z., and Liu, J.: Observations of the vertical distributions of summertime atmospheric pollutants and the corresponding ozone production in Shanghai, China, Atmos. Chem. Phys., 17, 14275–14289, https://doi.org/10.5194/acp-17-14275-2017, 2017.
Xing, C., Liu, C., Wang, S., Hu, Q., Liu, H., Tan, W., Zhang, W., Li, B., and Liu, J.: A new method to determine the aerosol optical properties from multiple-wavelength O4 absorptions by MAX-DOAS observation, Atmos. Meas. Tech., 12, 3289–3302, https://doi.org/10.5194/amt-12-3289-2019, 2019.
Zaveri, R. A. and Peters, L. K.: A new lumped structure photochemical mechanism for large-scale applications, J. Geophys. Res., 104, 30387, https://doi.org/10.1029/1999JD900876, 1999.
Zaveri, R. A., Easter, R. C., Fast, J. D., and Peters, L. K.: Model for simulating aerosol interactions and chemistry (MOSAIC), J. Geophys. Res., 113, D13204, https://doi.org/10.1029/2007jd008782, 2008.
Zhang, R.: Getting to the critical nucleus of aerosol formation, Science, 328, 1366–1367, https://doi.org/10.1126/science.1189732, 2010.
Zhang, C., Liu, C., Hu, Q., Cai, Z., Su, W., Xia, C., Zhu, Y., Wang, S., and Liu, J.: Satellite UV-Vis spectroscopy: implications for air quality trends and their driving forces in China during 2005–2017, Light. Sci. Appl., 8, 100, https://doi.org/10.1038/s41377-019-0210-6, 2019a.
Zhang, Q., Zheng, Y., Tong, D., Shao, M., Wang, S., Zhang, Y., Xu, X., Wang, J., He, H., Liu, W., Ding, Y., Lei, Y., Li, J., Wang, Z., Zhang, X., Wang, Y., Cheng, J., Liu, Y., Shi, Q., Yan, L., Geng, G., Hong, C., Li, M., Liu, F., Zheng, B., Cao, J., Ding, A., Gao, J., Fu, Q., Huo, J., Liu, B., Liu, Z., Yang, F., He, K., and Hao, J.: Drivers of improved PM2.5 air quality in China from 2013 to 2017, P. Natl. Acad. Sci. USA., 116, 24463–24469, https://doi.org/10.1073/pnas.1907956116, 2019b.
Zheng, G. J., Duan, F. K., Su, H., Ma, Y. L., Cheng, Y., Zheng, B., Zhang, Q., Huang, T., Kimoto, T., Chang, D., Pöschl, U., Cheng, Y. F., and He, K. B.: Exploring the severe winter haze in Beijing: the impact of synoptic weather, regional transport and heterogeneous reactions, Atmos. Chem. Phys., 15, 2969–2983, https://doi.org/10.5194/acp-15-2969-2015, 2015.
Zhong, J., Zhang, X., Dong, Y., Wang, Y., Liu, C., Wang, J., Zhang, Y., and Che, H.: Feedback effects of boundary-layer meteorological factors on cumulative explosive growth of PM2.5 during winter heavy pollution episodes in Beijing from 2013 to 2016, Atmos. Chem. Phys., 18, 247–258, https://doi.org/10.5194/acp-18-247-2018, 2018.
Zhou, X., Huang, G., Civerolo, K., Roychowdhury, U., and Demerjian, K. L.: Summertime observations of HONO, HCHO, and O3 at the summit of Whiteface Mountain, New York, J. Geophys. Res.-Atmos., 112, D08311, https://doi.org/10.1029/2006jd007256, 2007.