the Creative Commons Attribution 4.0 License.
the Creative Commons Attribution 4.0 License.
 | 02 Dec 2020
Characterisation of African biomass burning plumes and impacts on the atmospheric composition over the south-west Indian Ocean
Bert Verreyken
Crist Amelynck
Jérôme Brioude
Jean-François Müller
Niels Schoon
Nicolas Kumps
Aurélie Colomb
Jean-Marc Metzger
Christopher F. Lee
Theodore K. Koenig
Rainer Volkamer
Trissevgeni Stavrakou
We present an investigation of biomass burning (BB) plumes originating from Africa and Madagascar based on measurements of a suite of volatile organic compounds (VOCs), carbon monoxide (CO), ozone (O3) and nitrogen dioxide (NO2) obtained during the dry season of 2018 and 2019 at the high-altitude Maïdo observatory (21.1∘ S, 55.4∘ E, 2160 ), located on the remote island of La Réunion in the south-west Indian Ocean (SWIO). Biomass burning plume episodes were identified from increased acetonitrile (CH3CN) mixing ratios. Enhancement ratios (EnRs) – relative to CO – were calculated from in situ measurements for CH3CN, acetone (CH3COCH3), formic acid (HCOOH), acetic acid (CH3COOH), benzene (C6H6), methanol (CH3OH) and O3. We compared the EnRs to emission ratios (ERs) – relative to CO – reported in the literature in order to estimate loss or production of these compounds during transport. For CH3CN and CH3COOH, the calculated EnRs are similar to the ERs. For C6H6 and CH3OH, the EnR is lower than the ER, indicating a net sink of these compounds which was found to be in line with the expected atmospheric lifetime. For CH3COCH3 and HCOOH, the calculated EnRs are larger than the ERs. The discrepancy reaches an order of magnitude for HCOOH (18–34 pptv ppbv−1 compared to 1.8–4.5 pptv ppbv−1). This points to significant secondary production of HCOOH during transport. The Copernicus Atmospheric Monitoring Service (CAMS) global model simulations reproduce the temporal variation of CO mixing ratios well at the observatory but underestimate O3 and NO2 mixing ratios in the plumes by on average 16 ppbv and 60 pptv respectively. This discrepancy between modelled and measured O3 mixing ratios was attributed to (i) large uncertainties in VOC and NOx (NO+NO2) emissions due to BB in CAMS and (ii) misrepresentation of NOx recycling in the model during transport. Finally, transport of pyrogenically emitted CO is calculated with FLEXPART in order to (i) determine the mean plume age during the intrusions at the observatory and (ii) estimate the impact of BB on the pristine marine boundary layer (MBL). By multiplying the excess CO in the MBL with inferred EnRs at the observatory, we calculated the expected impact of BB on CH3CN, CH3COCH3, CH3OH and C6H6 concentrations in the MBL. These excesses constitute increases of ∼20 %–150 % compared to background measurements in the SWIO MBL reported in the literature.
- Article
(8520 KB) - Full-text XML
- BibTeX
- EndNote


Non-methane volatile organic compounds (NMVOCs) are key tropospheric constituents. Many of them are highly reactive with the major atmospheric oxidants, especially with the OH radical, and therefore they strongly affect the oxidation capacity of the troposphere (Atkinson, 2000). By being a strong sink for OH, they also exert control on the lifetime of methane (Zhao et al., 2019) and thus on climate. Moreover, OH-initiated NMVOC oxidation modulates tropospheric O3 concentrations and is the major source of this secondary pollutant in high-NOx (NO+NO2) environments (Monks et al., 2015). Less volatile NMVOC oxidation products contribute to the formation and growth of secondary organic aerosol, which deteriorates air quality and affects radiative forcing, and hence climate, both in a direct (by interacting with solar radiation) and indirect way (by acting as cloud condensation nuclei) (IPCC, 2013).
Whereas atmospheric oxidation of precursor VOC species is the dominant source of many oxygenated VOCs (OVOCs), primary anthropogenic emissions and (bidirectional) exchange with the biosphere and the ocean and biomass and biofuel burning also contribute to the atmospheric OVOC burden (Mellouki et al., 2015). Photochemical degradation and dry and wet deposition are the major sink processes. Global OVOC budgets are still prone to large uncertainties due to an incomplete understanding of direct emissions, photochemical production and loss processes, ocean–atmosphere exchange (Millet et al., 2010; Fischer et al., 2012; Read et al., 2012; Wang et al., 2019), and a paucity of (O)VOC data, especially in remote marine areas where the oxidative capacity of the atmosphere is mainly controlled by OVOCs in comparison to all other NMVOCs (Lewis et al., 2005; Carpenter and Nightingale, 2015; Travis et al., 2020).
The south-west Indian Ocean (SWIO) is one of the few pristine regions on Earth. It is largely decoupled from emissions originating from large bodies of land and is well suited to characterise remote marine air composition and ocean emissions (Colomb et al., 2009; Mallet et al., 2018). Located in the SWIO is the French overseas department La Réunion, a small volcanic island, home to the high-altitude Maïdo atmospheric observatory (21.1∘ S, 55.4∘ E, 2160 ) (Baray et al., 2013), hereafter referred to as RUN. From October 2017 to November 2019, a high-sensitivity quadrupole-based proton transfer reaction mass spectrometry VOC analyser (hs-PTR-MS) was deployed at RUN in the framework of the OCTAVE (Oxygenated Compounds in the Tropical Atmosphere: Variability and Exchanges) project (http://octave.aeronomie.be, last access: 25 October 2020). In combination with other ground-based and satellite data, the resulting near-continuous high-time-resolution 2-year dataset will serve to better constrain VOC emissions in the remote tropical marine atmosphere and to identify missing sources. Part of this dataset has already been used in a source apportionment study of formaldehyde (HCHO) (Rocco et al., 2020).
The present paper contributes to the disentanglement of the different sources contributing to the (O)VOC composition at RUN by focusing on the role of biomass burning (BB). It is established from ground-based remote-sensing Fourier transform infrared (FTIR) observations that BB impacts the atmosphere over La Réunion. The BB events affecting the region occur most frequently in southern Africa and Madagascar, but impacts from burning in South America and Malaysia have also been identified (Duflot et al., 2010; Vigouroux et al., 2012). Seasonality of in situ CO concentrations at RUN indicates that BB plumes also impact the atmospheric composition at the surface (Zhou et al., 2018). This was confirmed by the hs-PTR-MS dataset generated at RUN for the OCTAVE project (Fig. A1). Biomass burning represents the second largest global source of NMVOC emissions (Yokelson et al., 2008; Akagi et al., 2011). Pyrogenic emissions are reasonably well constrained by numerous laboratory studies (e.g. Holzinger et al., 1999; Christian et al., 2003; Yokelson et al., 2008) and observations of BB plumes in the atmosphere (e.g. Lefer et al., 1994; Yokelson et al., 1999, 2003; Jost et al., 2003; de Gouw et al., 2006; Vigouroux et al., 2012; Akagi et al., 2014). Emission factors for numerous compounds have been compiled recently by Andreae (2019). The investigation of compositional changes during BB plume transport may provide valuable clues for identifying missing sources of reactive trace species (e.g. Jost et al., 2003; de Gouw et al., 2006; Chaliyakunnel et al., 2016). This is of particular interest for the carboxylic acids, as current models underestimate their observed abundances, possibly in part due to a misrepresentation of the contribution of biomass burning (Paulot et al., 2011; Chaliyakunnel et al., 2016).
In this work, we focused on the first BB plume intrusions from the fire season in 2018 and 2019. Enhancement ratios (EnRs) – relative to excess CO – of excess acetonitrile (CH3CN), formic acid (HCOOH), acetone (CH3COCH3), acetic acid (CH3COOH), benzene (C6H6), methanol (CH3OH) and O3 were calculated from in situ measurements at RUN for the first time. Other VOCs could also be present in the BB plumes but either were not the focus of this study or local emissions from the island interfered too much with the signal to reliably quantify the EnRs (e.g. methyl ethyl ketone, MEK). In addition, observations of BB plumes at RUN were used to evaluate the global near-real-time (NRT) CO, O3 and NO2 modelled concentrations at RUN from the Copernicus Atmospheric Monitoring Service (CAMS). Finally, we propose a way to use in situ VOC measurements at RUN to estimate the impact of BB plumes on the pristine marine boundary layer (MBL) over the SWIO. This is done for CH3CN, CH3COCH3, C6H6 and CH3OH.
In Sect. 2 the instruments, methods and models used in this study are presented. The results are shown in Sect. 3 and discussed in Sect. 4.
2.1 Observations
2.1.1 In situ air mass characterisation
RUN houses routine instruments characterising in situ air constituents in the context of global networks such as GAW (Global Atmospheric Watch), ICOS (Integrated Carbon Observation System) and ACTRIS (European Research Infrastructure for the observation of Aerosol, Clouds and Trace Gases). A summary of routine measurements from the observatory used in this study is shown in Table 1. A detailed description of these and other operational routine instruments at the observatory can be found in Duflot et al. (2019), Baray et al. (2013) and Zhou et al. (2018).
Table 1In situ routine observations at RUN and their respective limits of detection (LoDs) and statistical uncertainties (σ) (Zhou et al., 2018; Duflot et al., 2019).

In the frame of the OCTAVE project, a hs-PTR-MS instrument (Ionicon Analytik GmbH, Austria) was deployed at RUN from October 2017 to November 2019. This resulted in a near-continuous high-time-resolution 2-year dataset of volatile organic compounds (VOCs). The instrument was run in the multiple ion detection mode using H3O+ precursor ions with a total cycle time of ∼2.7 min. Regular calibrations of the hs-PTR-MS were performed by diluting a gravimetrically prepared VOC∕N2 mixture (Apel-Riemer Environmental Inc., Miami, FL, USA; stated accuracy of 5 % for all VOCs) with zero-VOC air obtained by sending ambient air through a catalytic converter (Parker, type HPZA-3500, Haverhill, MA, USA). This resulted in VOC concentrations in the lower range of parts per billion by volume (ppbv). Calibrations as a function of relative humidity were performed bimonthly by controlling the humidity of the zero air with a dew point generator (LI-COR LI610, Lincoln, Nebraska, USA). The calibration factor (CF) for acetic acid (CH3COOH) was estimated from the experimentally determined CF for CH3COCH3. This is done by considering the calculated collision rate constants of H3O+ with CH3COOH and CH3COCH3 (Su, 1994), the contributions of the protonated molecules to the respective product ion distributions (Schwarz et al., 2009; Inomata and Tanimoto, 2010), and by assuming the same hs-PTR-MS transmission efficiency for ions with a mass difference of 2 Da. Similarly, the CF of HCOOH was determined from the measured one of acetaldehyde. The humidity dependence of formic and acetic acid CFs obtained at similar hs-PTR-MS operating conditions has been reported in the literature (Baasandorj et al., 2015) and has been taken into account for quantification. By considering the uncertainties in the different parameters involved in the carboxylic acid quantification in the present study, the total uncertainty in their mixing ratio is estimated to be 50 %. Measurements were averaged over 1 h to lower the limit of detection (LoD) and the random fluctuations of the measurements. A list of masses, and their associated compound(s), recorded by the hs-PTR-MS together with the LoD, dwell time and whether the compounds are directly calibrated is shown in Table 2.
Table 2A list of mass-to-charge ratios (m∕z) observed in multiple ion detection mode by the hs-PTR-MS at RUN with the associated chemical compounds, dwell times and information about the instrument calibration limit of detection (LoD) per compound (Y: yes, N: no, n/a: not applicable). Dwell time is shown for one cycle. The LoD is computed for the hourly averages used here. The corresponding accumulated dwell times are about 22 times the stated dwell times of an individual cycle.
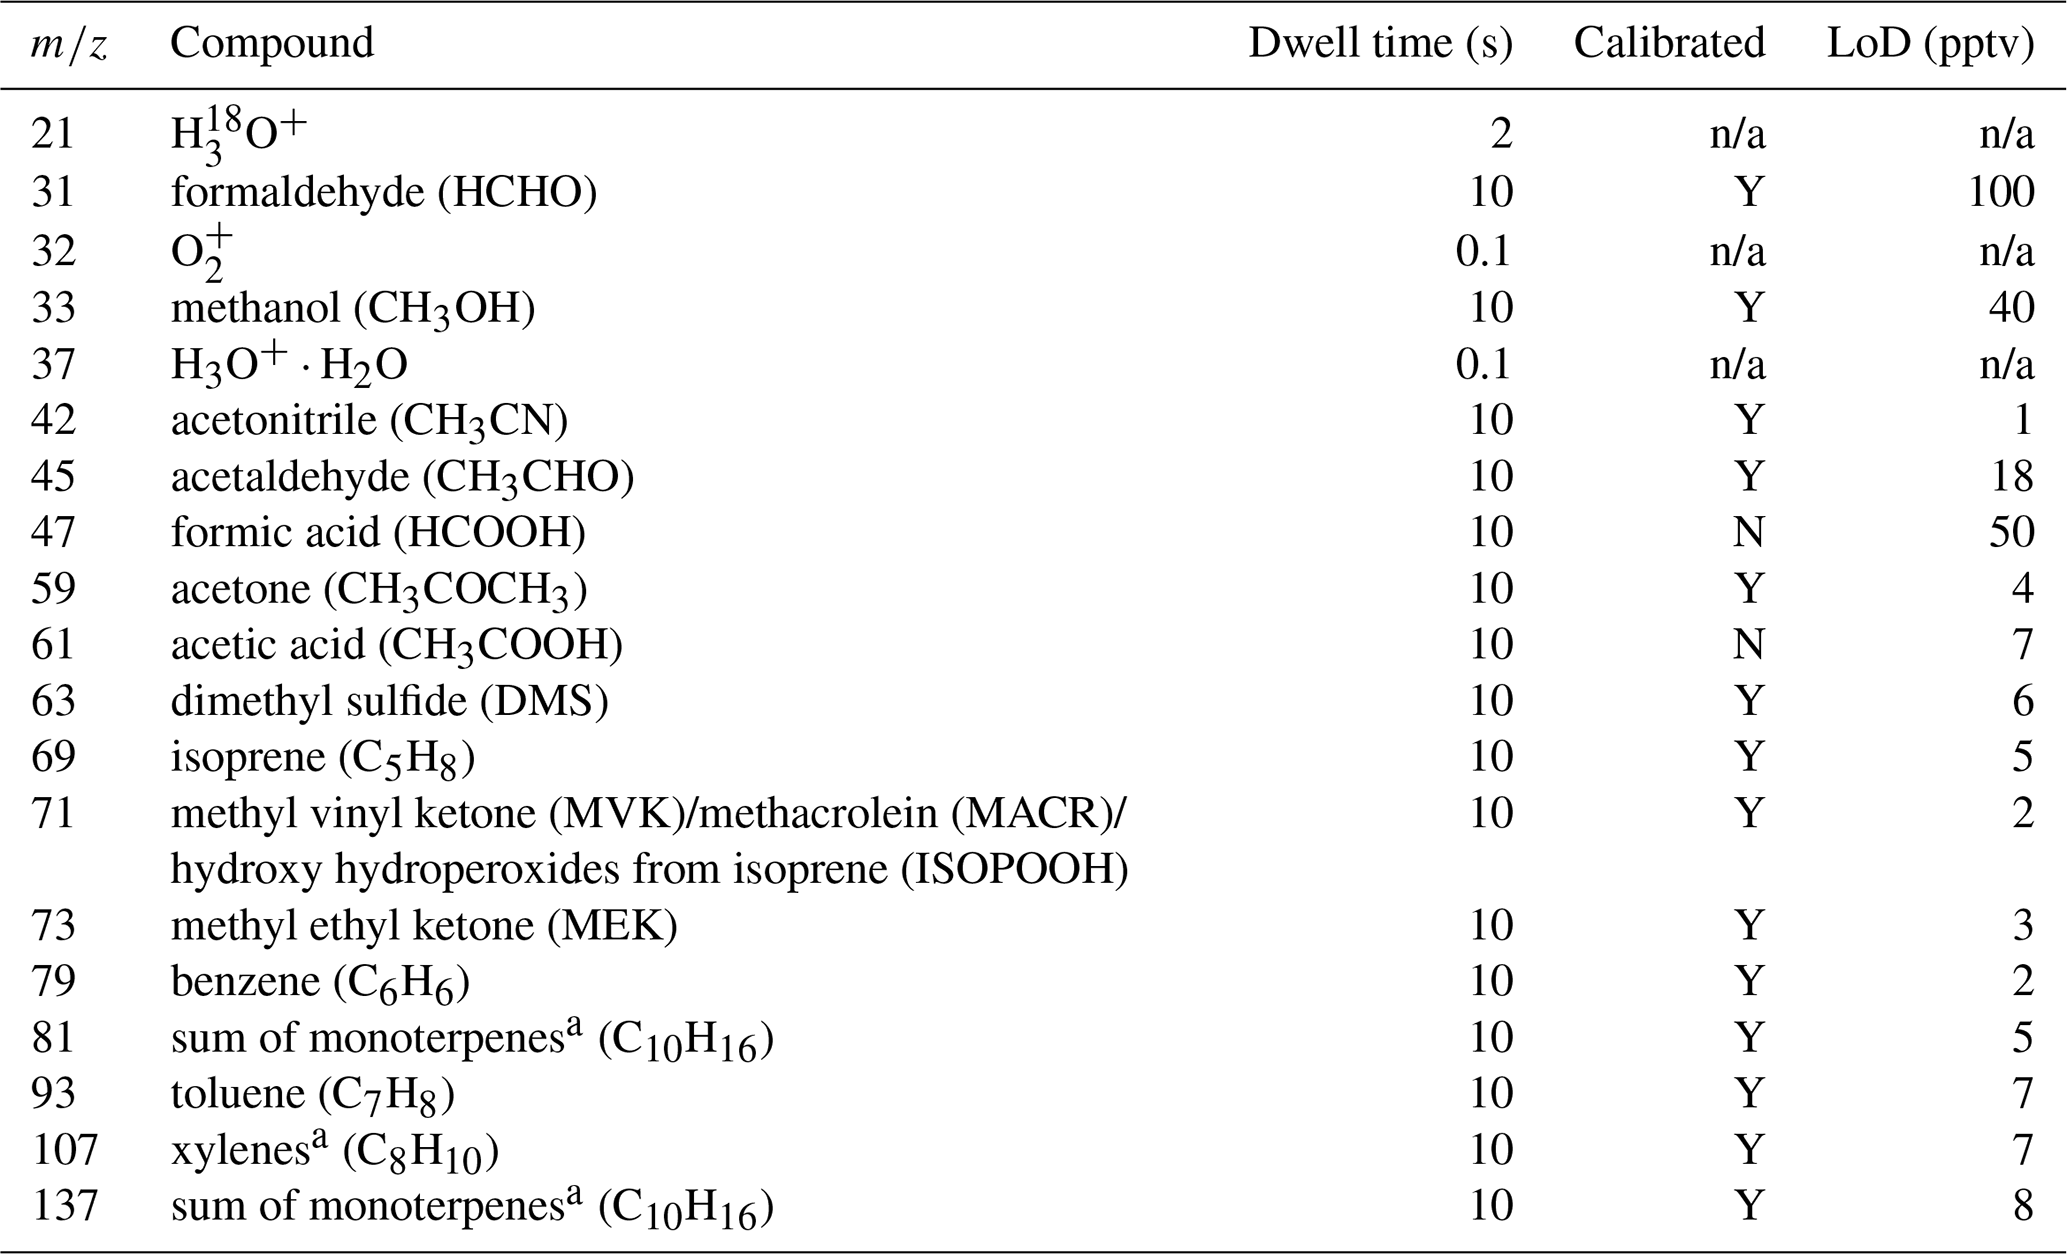
a o-Xylene and limonene were used for calibration.
2.1.2 Ground-based remote sensing
The University of Colorado Multi-AXis Differential Optical Absorption Spectroscopy (CU MAX-DOAS) instrument consists of a scanning (horizon–zenith–horizon) telescope coupled to two ultraviolet–visible grating spectrometers (Coburn et al., 2011). Scattered-light solar spectra are collected along lines of sight at different elevation angles above the horizon (Hönninger et al., 2004) and analysed using DOAS least-square fitting (Platt and Stutz, 2008) to retrieve trace gas slant column densities (SCDs) by the QDOAS software package (Danckaert et al., 2017). For this analysis, NO2 (Vandaele et al., 1998) and O2–O2 (Thalman and Volkamer, 2013) were retrieved in a fitting window from 425 to 490 nm, using the further fit settings as described in Kreher et al. (2020). Near-surface volume mixing ratios of NO2 were retrieved from limb (0∘ elevation angle) spectra following Dix et al. (2016). This approach takes advantage of the fact that the limb-viewing geometry is highly sensitive to absorbers near instrument altitude. O2–O2 is used to parameterise aerosol extinction near instrument altitude, avoiding the need for complex aerosol profile information (Sinreich et al., 2013; Dix et al., 2016). The NO2 profile shape was constructed using a typical tropical background with BB enhancements collocated to excess CO from FLEXPART (see Sect. 2.3.2). Variations on the retrieval settings and profile assumptions indicate that ∼10 pptv NO2 can be quantified with an uncertainty of 5 pptv using this approach. Further tests using NO2 and O4 at shorter wavelengths (Kreher et al., 2020) determined that the retrieved NO2 volume mixing ratios generally agree within the reported uncertainty, despite the different spectral ranges' average NO2 over different horizontal spatial scales. This indicates that the NO2 mixing ratio is representative of the regional lower troposphere predicted by the CAMS model.
2.2 Enhancement ratios
The impact of BB events on an atmospheric species X is often quantified by an emission factor (EFX) or an enhancement ratio relative to a compound Y (EnRX∕Y). The first is defined as the mass of compound X that is released by burning 1 kg of dry fuel, whereas the second is defined as the excess mixing ratio – due to BB – of compound X (ΔX), with respect to that of a reference species Y (ΔY). If the EnR is measured close to the source and/or if both X and Y were minimally affected by physico-chemical interactions, it is also referred to as the emission ratio of compound X normalised to Y (ERX∕Y). The ER can be computed from the EF by taking the molecular weights (MWs) of both species into account:
A list of EFs with the associated fuel type has been compiled most recently by Andreae (2019). When comparing the EnR values derived from our observations to ERs from the literature, production and loss of plume constituents during transport should be taken into consideration. Enhancement and emissions ratios are often used with CO as the reference species Y. Hereafter, enhancement ratios are always considered with respect to CO unless specifically stated otherwise.
Excess mixing ratios are determined above the background – unaffected by BB – diel profiles which were approximated by the seasonal median diel profiles (Appendix A2). During the day, mesoscale transport at La Réunion results in the observatory being located in the planetary boundary layer (PBL). The chemical composition of the PBL is determined by marine, biogenic and anthropogenic sources and sinks interacting in physico-chemical atmospheric processes. At night, air masses arriving at RUN originate primarily from the free troposphere (FT). This mesoscale transport results in a natural diel variation of compound mixing ratios which needs to be taken into account when calculating EnR.
2.3 Modelling
Below we discuss the model simulations used in this study. Each model is used with a specific goal in mind. First, we evaluate the CAMS NRT atmospheric composition service using in situ measurements. It is important that CAMS correctly reproduces CO concentrations at RUN as pyrogenic emissions used in this service will be used to calculate transport of excess CO (ΔCO) over the SWIO with the Lagrangian FLEXible PARTicle dispersion model, FLEXPART (Stohl et al., 1998, 2005; Stohl and Thomson, 1999; Pisso et al., 2019). We use FLEXPART to calculate the mean plume ages during the BB episodes at RUN but also to calculate the impact of pyrogenic emissions on the pristine MBL over the SWIO. Finally FLEXPART-AROME (Verreyken et al., 2019) is used to simulate mesoscale transport in complex terrain towards the observatory. This last simulation is performed in an effort to quantify the PBL–FT mixing during BB intrusions and identify the main transport mode of the plumes.
2.3.1 CAMS NRT
The CAMS NRT service was developed based on a series of Monitoring Atmospheric Composition and Climate (MACC) research projects. It provides daily forecasts of reactive trace gases, greenhouse gases and aerosol concentrations. The data are generated by the Integrated Forecast System (IFS) at the European Centre for Medium-Range Weather Forecasts (ECMWF). The chemical mechanism used is an extended version of the Carbon Bond 2005 lumped chemistry scheme (Flemming et al., 2015). BB emissions implemented in the NRT service rely on the Global Fire Assimilation System v1.2 (GFAS v1.2) inventory. The GFAS assimilates fire radiative power observations from the NASA MODIS satellites to quantify BB emissions (Di Giuseppe et al., 2018; Rémy et al., 2017; Kaiser et al., 2012). On 9 July 2019, the model was updated to use the CAMS emission inventories, CAMS_GLOB_ANT v2.1 and CAMS_GLOB_BIO v1.1 (Granier et al., 2019), instead of the previous MACCity (Lamarque et al., 2010) and the MEGAN_MACC (Sindelarova et al., 2014) inventories. BB plume injection heights were also introduced in this update. A full description and validation of the update was reported by Basart et al. (2019).
We used modelled mass mixing ratios at the location of RUN calculated on different pressure levels (1000, 950, 925, 900, 850, 800, 700 and 600 mbar levels) every 3 h (00:00, 03:00, 06:00, 09:00, 12:00, 15:00, 18:00, 21:00 UT) from the midnight forecast at resolution (available at: https://apps.ecmwf.int/datasets/data/cams-nrealtime/levtype=pl/, last access: 9 January 2020). The CO, O3 and NO2 mass mixing ratios are transformed to volume mixing ratios and compared to the in situ measurements.
2.3.2 FLEXPART
FLEXPART, driven by ECMWF IFS meteorology at horizontal resolution, was used to calculate the transport of ΔCO due to BB during 15 June–31 August 2018 and 17 June–22 August 2019. The CO emissions are provided by the GFAS v1.2 inventory. Three-hourly mean mixing ratios of CO were generated on vertical layers of 500 m depth between 0 and 3500 The output was given on a grid. Due to the low horizontal resolution, the orographic profile of La Réunion is not well resolved. For example, the ground level of RUN is only 284 in the model, much below the true altitude of 2160
Age classes (ACs) are used to estimate the mean plume age (T) for the different intrusions. The CO plumes are categorised by age with 2 d resolution (, d). BB plume excesses are traced for 24 d, after which the plume is assumed to be diluted to negligible background levels. The mean BB plume age is obtained from the FLEXPART output by
where ΔCOj is the mean mixing ratio calculated by FLEXPART with AC=j.
To estimate the impact of BB on the MBL for compound X, we use
where ΔCO is calculated by FLEXPART and EnRX is inferred from data. In this approach, the role of an ocean sink is neglected.
2.3.3 FLEXPART-AROME
FLEXPART-AROME 24 h back-trajectory simulations are used to estimate the respective contribution of the PBL and the free troposphere to the in situ measurements at RUN. Lesouëf et al. (2011) characterised the PBL impact on the Maïdo mountain region by using a passive boundary layer tracer initialised in an approximation of the minimal boundary layer. This PBL proxy is defined as 500 , capped at 1000 Here, the inverse approach is used by calculating the fraction of time air parcels have spent in the PBL proxy during the 24 h back-trajectory simulation. This fraction measures the potential impact of surface emissions on the in situ measurements. We will split this fraction up according to surface type (land/ocean) and call the separate components the mixing fraction (MF). Given the lack of a high-resolution anthropogenic emission inventory over La Réunion, we are not able to use the model to quantify mixing ratios unperturbed by BB plumes and instead use the median diel profile as stated in Sect. 2.2.
3.1 Data analysis
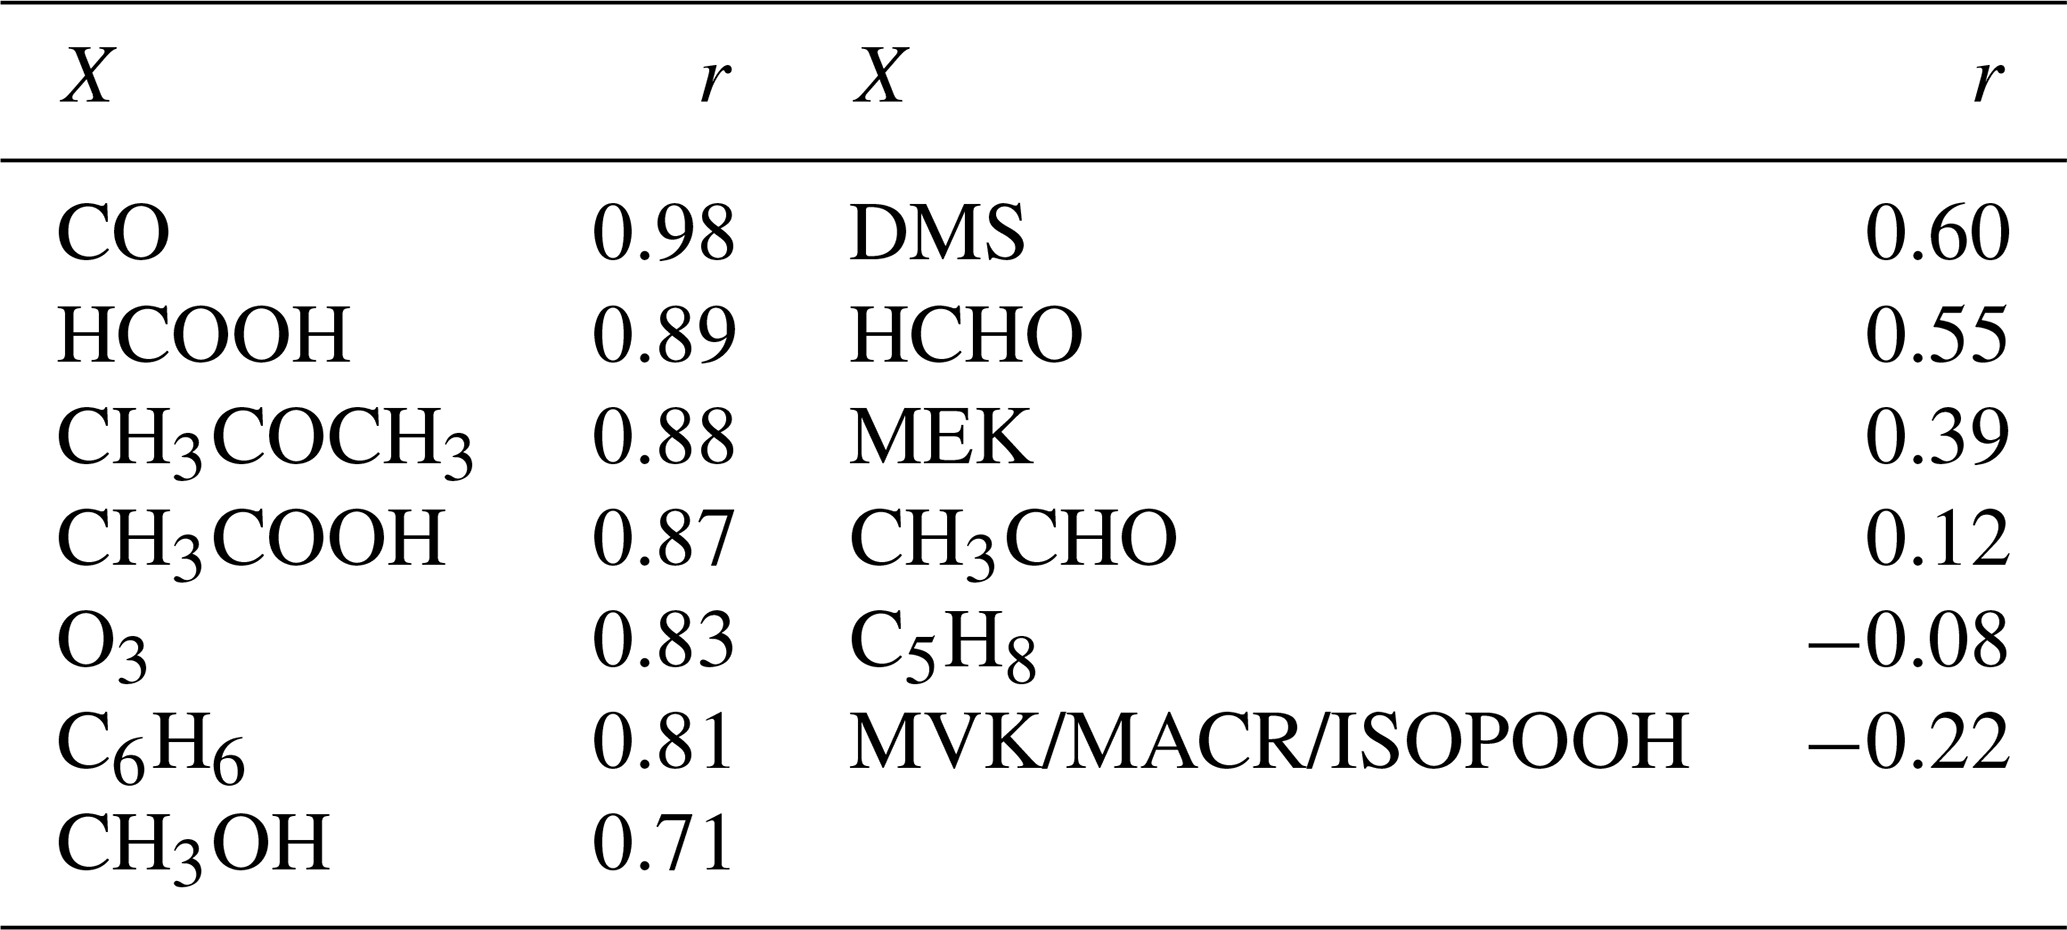
Six episodes of enhanced CH3CN, which is a typical BB compound, were identified in August 2018 and August 2019 (Fig. 1). The correlation (r) between the excess mixing ratio of the monitored trace gases and ΔCH3CN, during the identified intrusions, is shown in Table 3. As dimethyl sulfide (DMS) is only marginally present in pyrogenic emissions (0.0022–0.05 g emitted per kilogram of dry matter burned from tropical forest and agricultural residue burning respectively, Andreae, 2019) and has a short atmospheric lifetime (less than 1 d, Blake et al., 1999), the correlation between ΔDMS and ΔCH3CN is not expected to be directly related to the BB emissions. For this reason, compounds that correlated less well with ΔCH3CN than ΔDMS were not considered as plume constituents. Plume constituents in this analysis are thus limited to CH3CN, HCOOH, CH3COCH3, CH3COOH, O3, C6H6 and CH3OH.
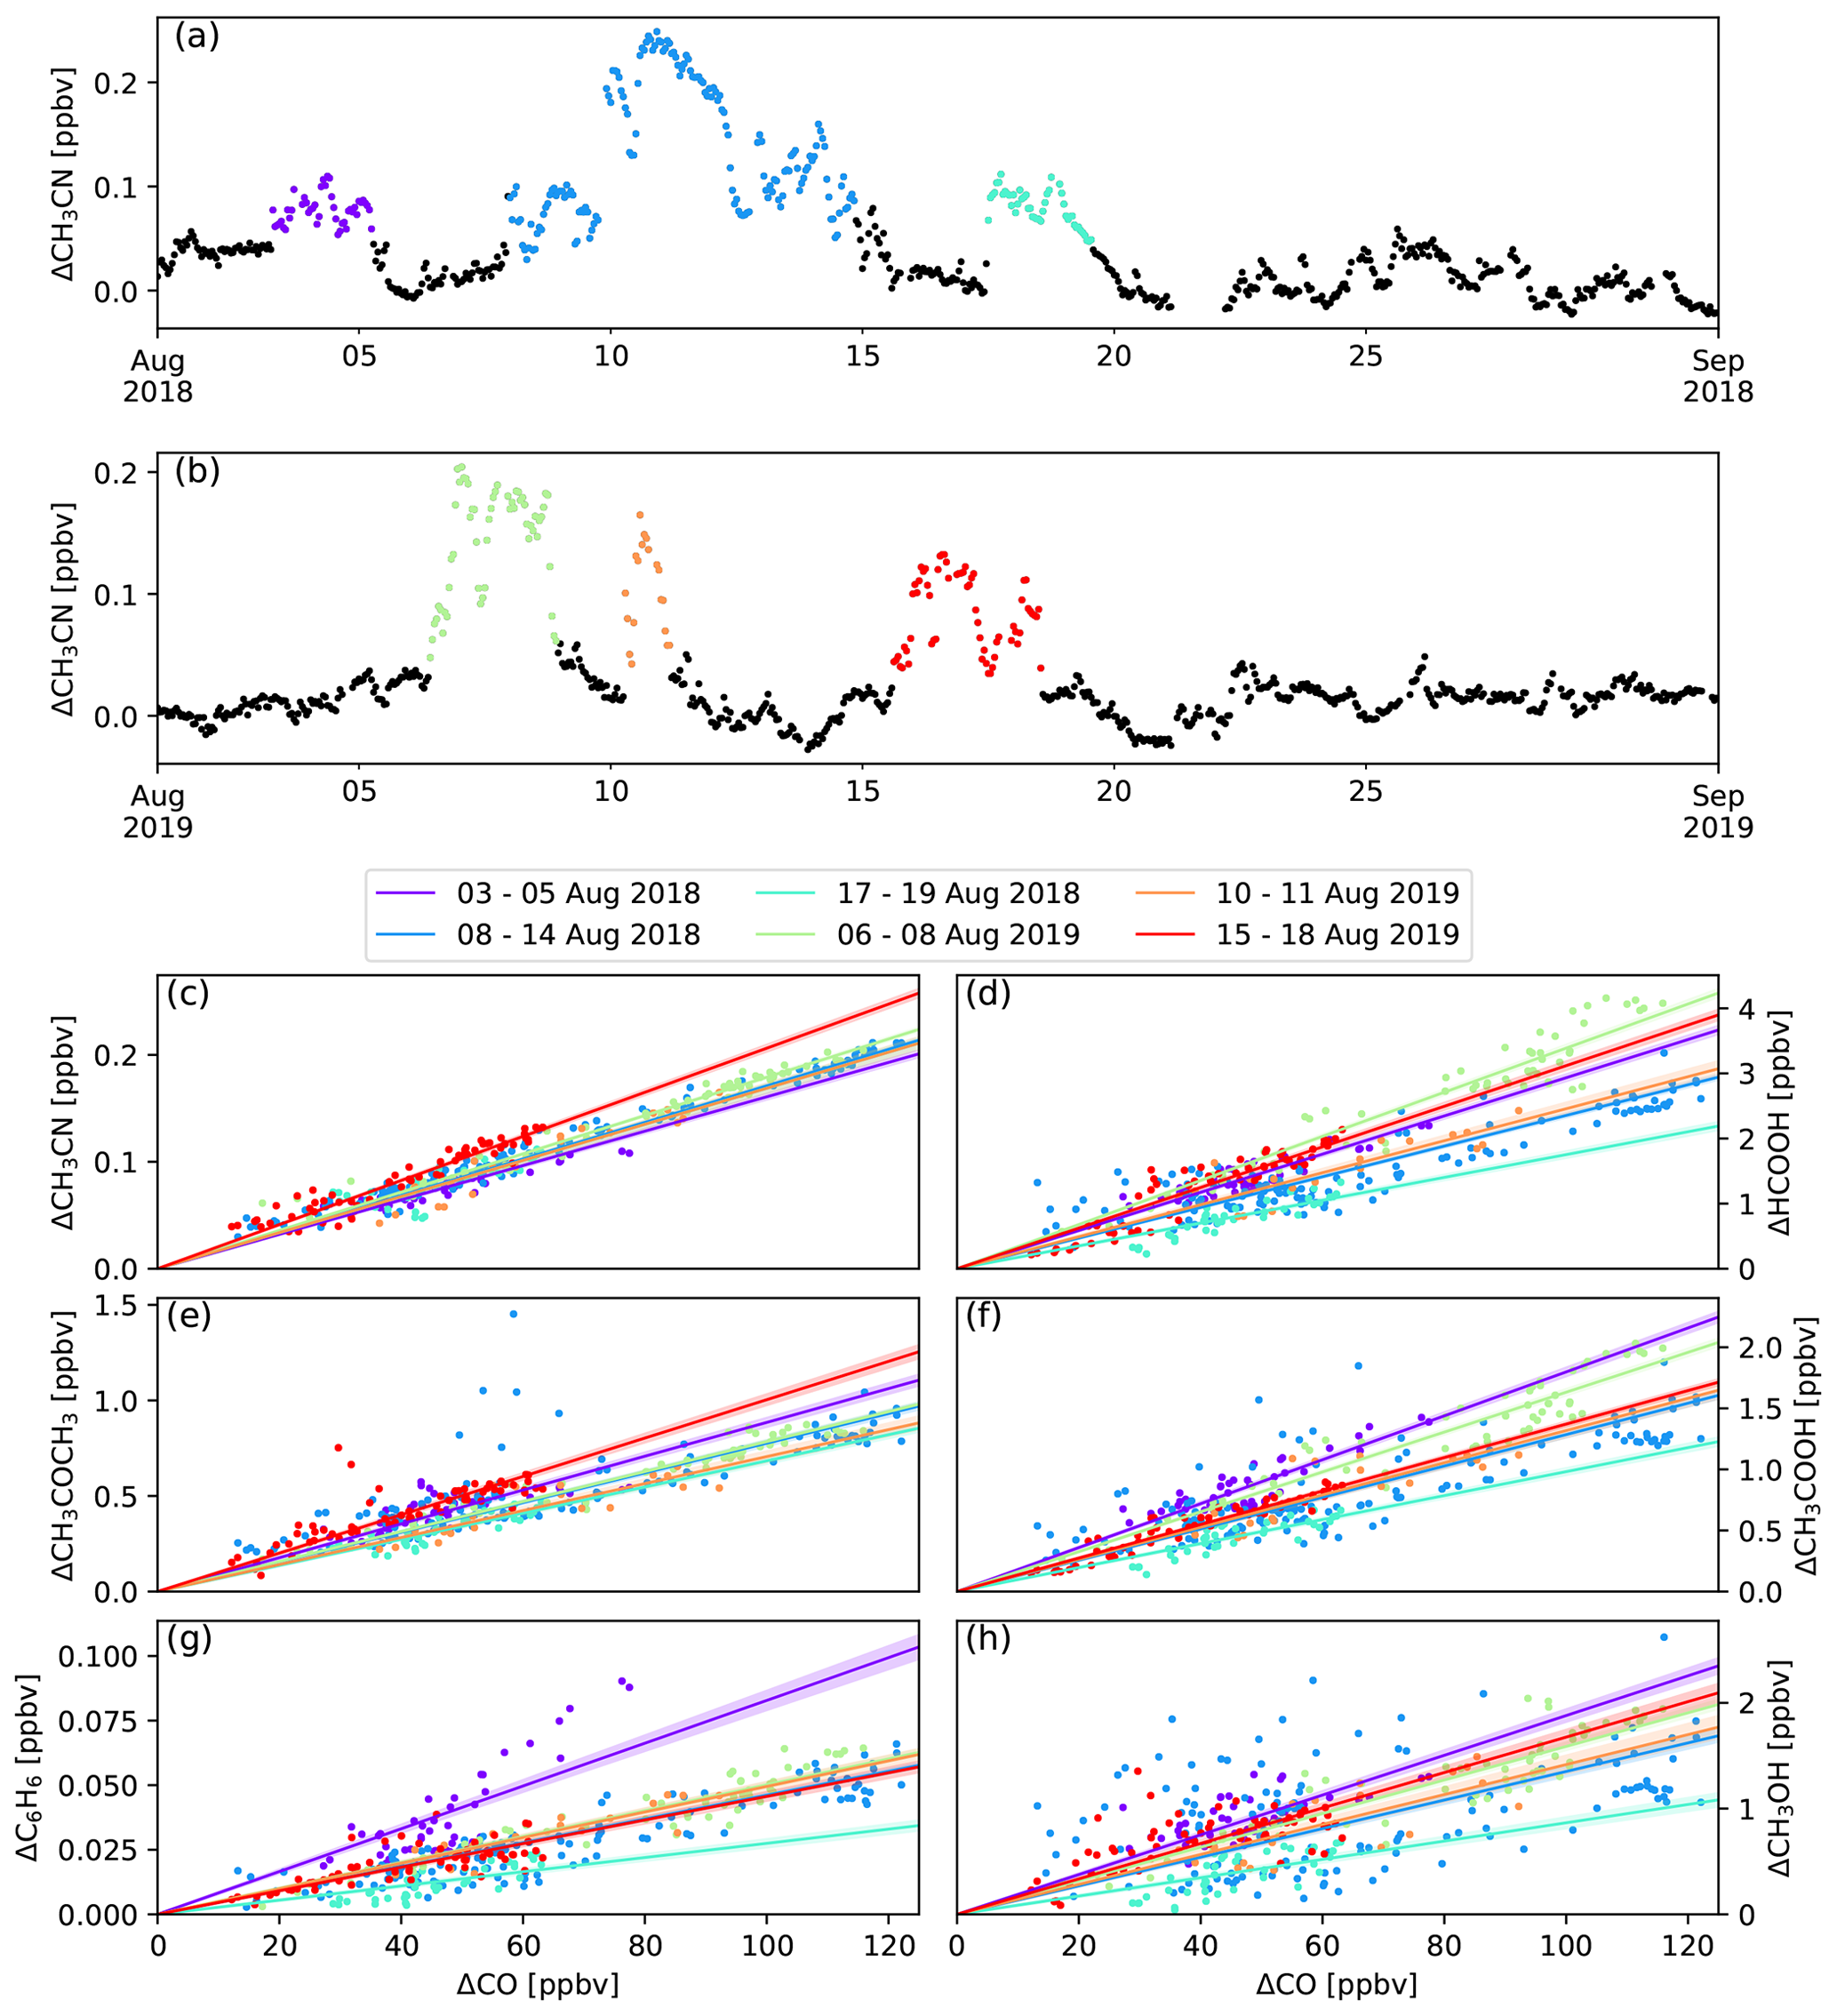
Figure 1Panels (a) and (b) show the six BB intrusions identified using ΔCH3CN (purple: 3–5 August 2018, blue: 8–14 August 2018, cyan: 17–19 August 2018, green: 6–8 August 2019, orange: 10–11 August 2019, red: 15–18 August 2019). The bottom six panels show the EnR fits for CH3CN (c), HCOOH (d), CH3COOH (e), CH3COCH3 (f), C6H6 (g) and CH3OH (h). EnRs are normalised to the excess mixing ratio of CO for the six intrusions in the colours used in panels (a) and (b). Uncertainty in the linear regression is shown as a coloured band around the curves.
Table 3Pearson correlation coefficients (r) between the excess of chemical compound X (ΔX) and the excess of the typical BB marker CH3CN during the BB episodes.
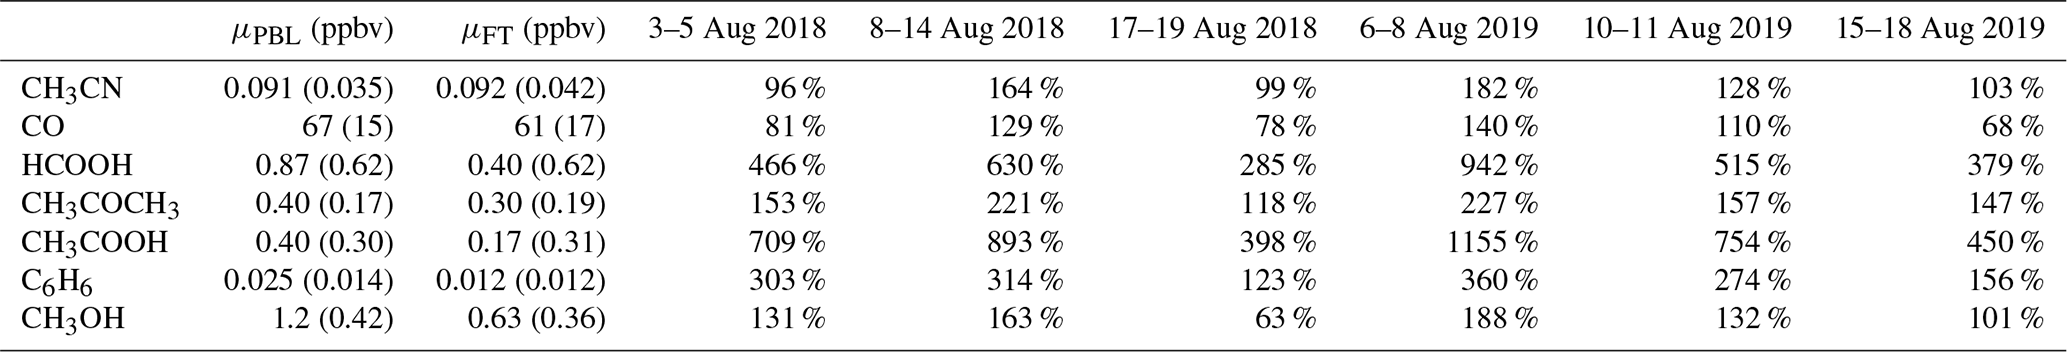
Mean background (i.e. outside BB episodes) concentrations of plume constituents in austral winter together with the mean excesses during the different BB intrusions (in percentage) are shown in Table 4. Correlation with CH3CN is especially strong for compounds showing large excesses compared to the diel background pattern (illustrated in Appendix A2). We note that trace species such as HCHO, MEK and acetaldehyde (CH3CHO) show elevated concentrations during the night in BB episodes, which suggests that they are related to BB. However, as the diel patterns for these compounds are subject to strong variability, excesses are poorly characterised during the day and not analysed further here.
Table 4Mean background mixing ratio during the daytime (10:00–16:00 LT, reflecting planetary boundary layer air composition) and nighttime (22:00–04:00 LT, measuring free tropospheric air masses), μPBL (ppbv) and μFT (ppbv) respectively, and mean excesses (%) during the August 2018 and August 2019 BB intrusions. The reported background values are mean mixing ratios recorded during austral winter (June, July, August), excluding BB incidents.
For each of the intrusions, the EnR is computed for CH3CN, CH3OH, CH3COCH3, C6H6, HCOOH, CH3COOH and O3. Figure 1 shows the scatter plots correlating the excess of the trace species monitored by the hs-PTR-MS instrument and ΔCO. The calculated EnRs are found in Table 5.
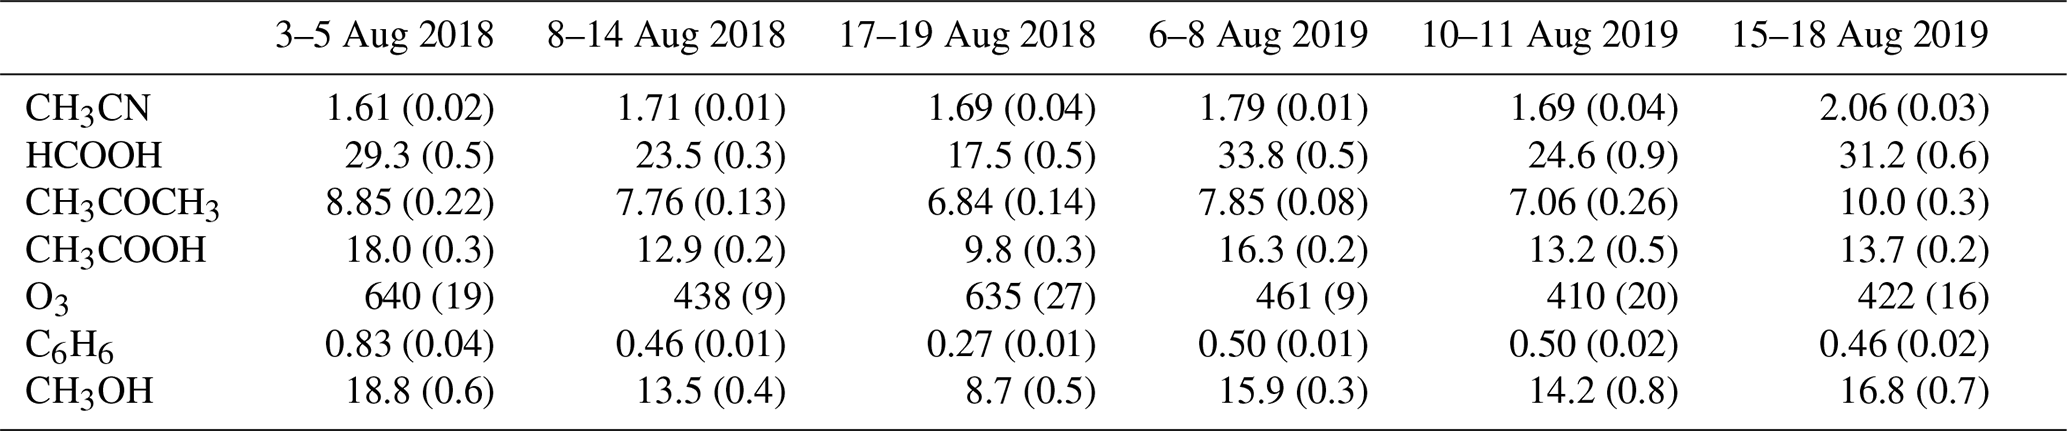
Table 5Calculated EnRs (pptv ppbv−1) – relative to CO – for the identified BB intrusions. Between parentheses are the standard deviations of the EnR (pptv ppbv−1) obtained from the linear fit.
3.2 Comparison with model
3.2.1 FLEXPART-AROME
Figure 2 shows the fraction of time spent in the PBL-proxy from Lesouëf et al. (2011) over sea (blue) and land (brown), during the 24 h back-trajectory calculations with FLEXPART-AROME, together with the relative humidity (RH) at the observatory. Biomass burning intrusions have lower than average RH values. The humidity peaks during the BB episodes are coincident with peak impacts of the MBL. It is also shown that the impact of mesoscale PBL emissions on the VOC concentrations is lower during the BB intrusions in August 2018 than in August 2019.
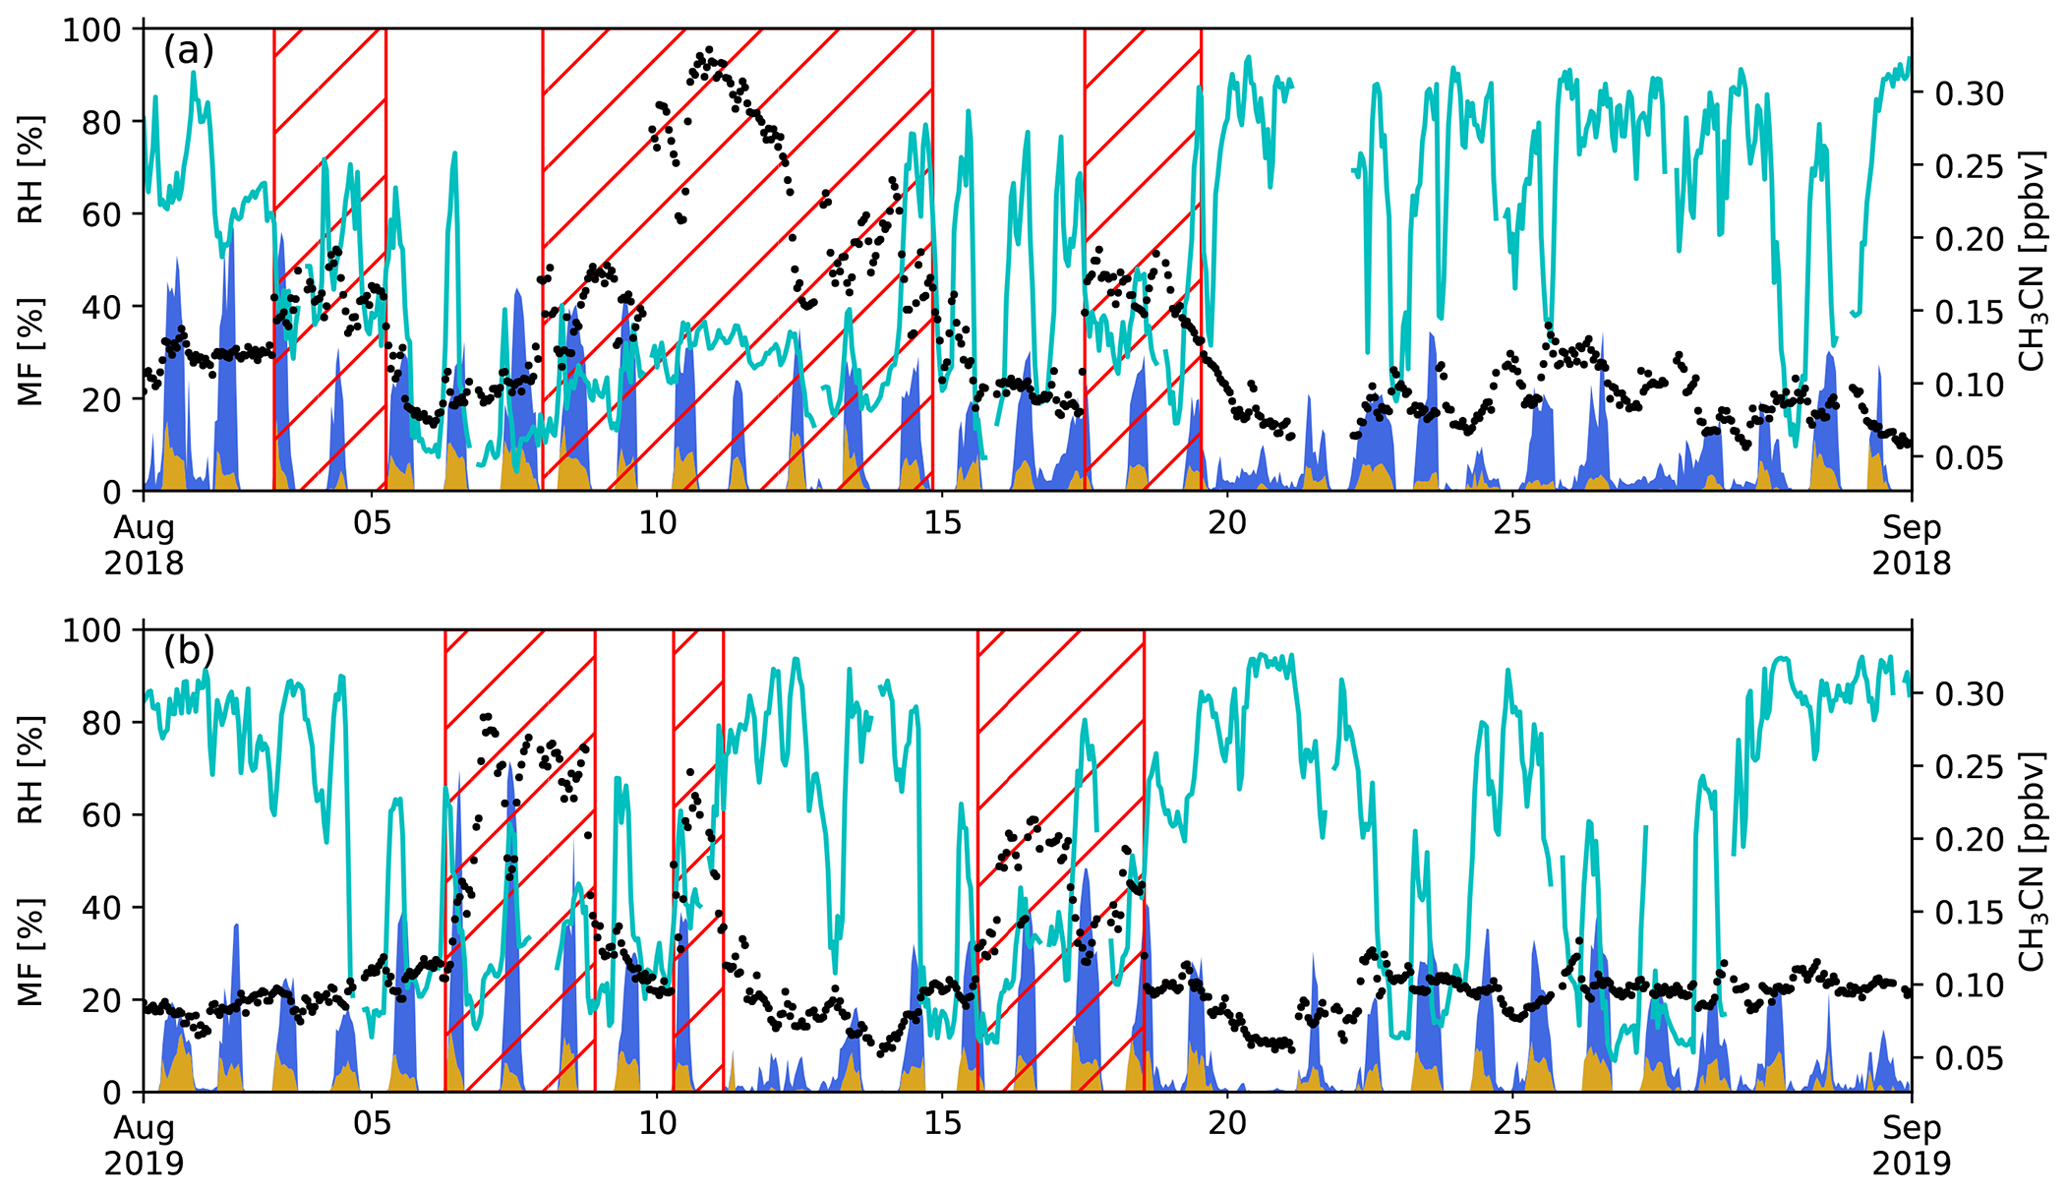
Figure 2Measured relative humidity (RH, cyan curve), CH3CN mixing ratio (ppbv) (black points) and modelled mesoscale MF (fraction of time air parcels are situated over a certain source in the PBL proxy from Lesouëf et al., 2011) (%) from 24 h back-trajectories using FLEXPART-AROME in August 2018 (a) and August 2019 (b). Blue denotes the marine boundary layer MF, brown represents the island surface PBL MF. The hatched red area represents the different BB intrusions.
3.2.2 CAMS near-real-time model simulations
The modelled mixing ratios at RUN calculated by the CAMS NRT service are compared to data recorded at the observatory for CO, O3 and NO2 (Fig. 3). The model bias for CO, during the BB intrusions, is lowest on the 800 mbar pressure level (bias of 9.7 ppbv), which is closest to the mean pressure measured at the observatory during the same period (792.8 mbar). Note that CAMS reflects the CO mixing ratios well at Maïdo both during and outside (5.1 ppbv bias) BB episodes. As CO is a chemically stable compound in the atmosphere, the agreement between model and measurements indicates that synoptic-scale transport and mesoscale mixing with the BB plumes at the location of RUN is sufficiently reproduced by the CAMS NRT model.
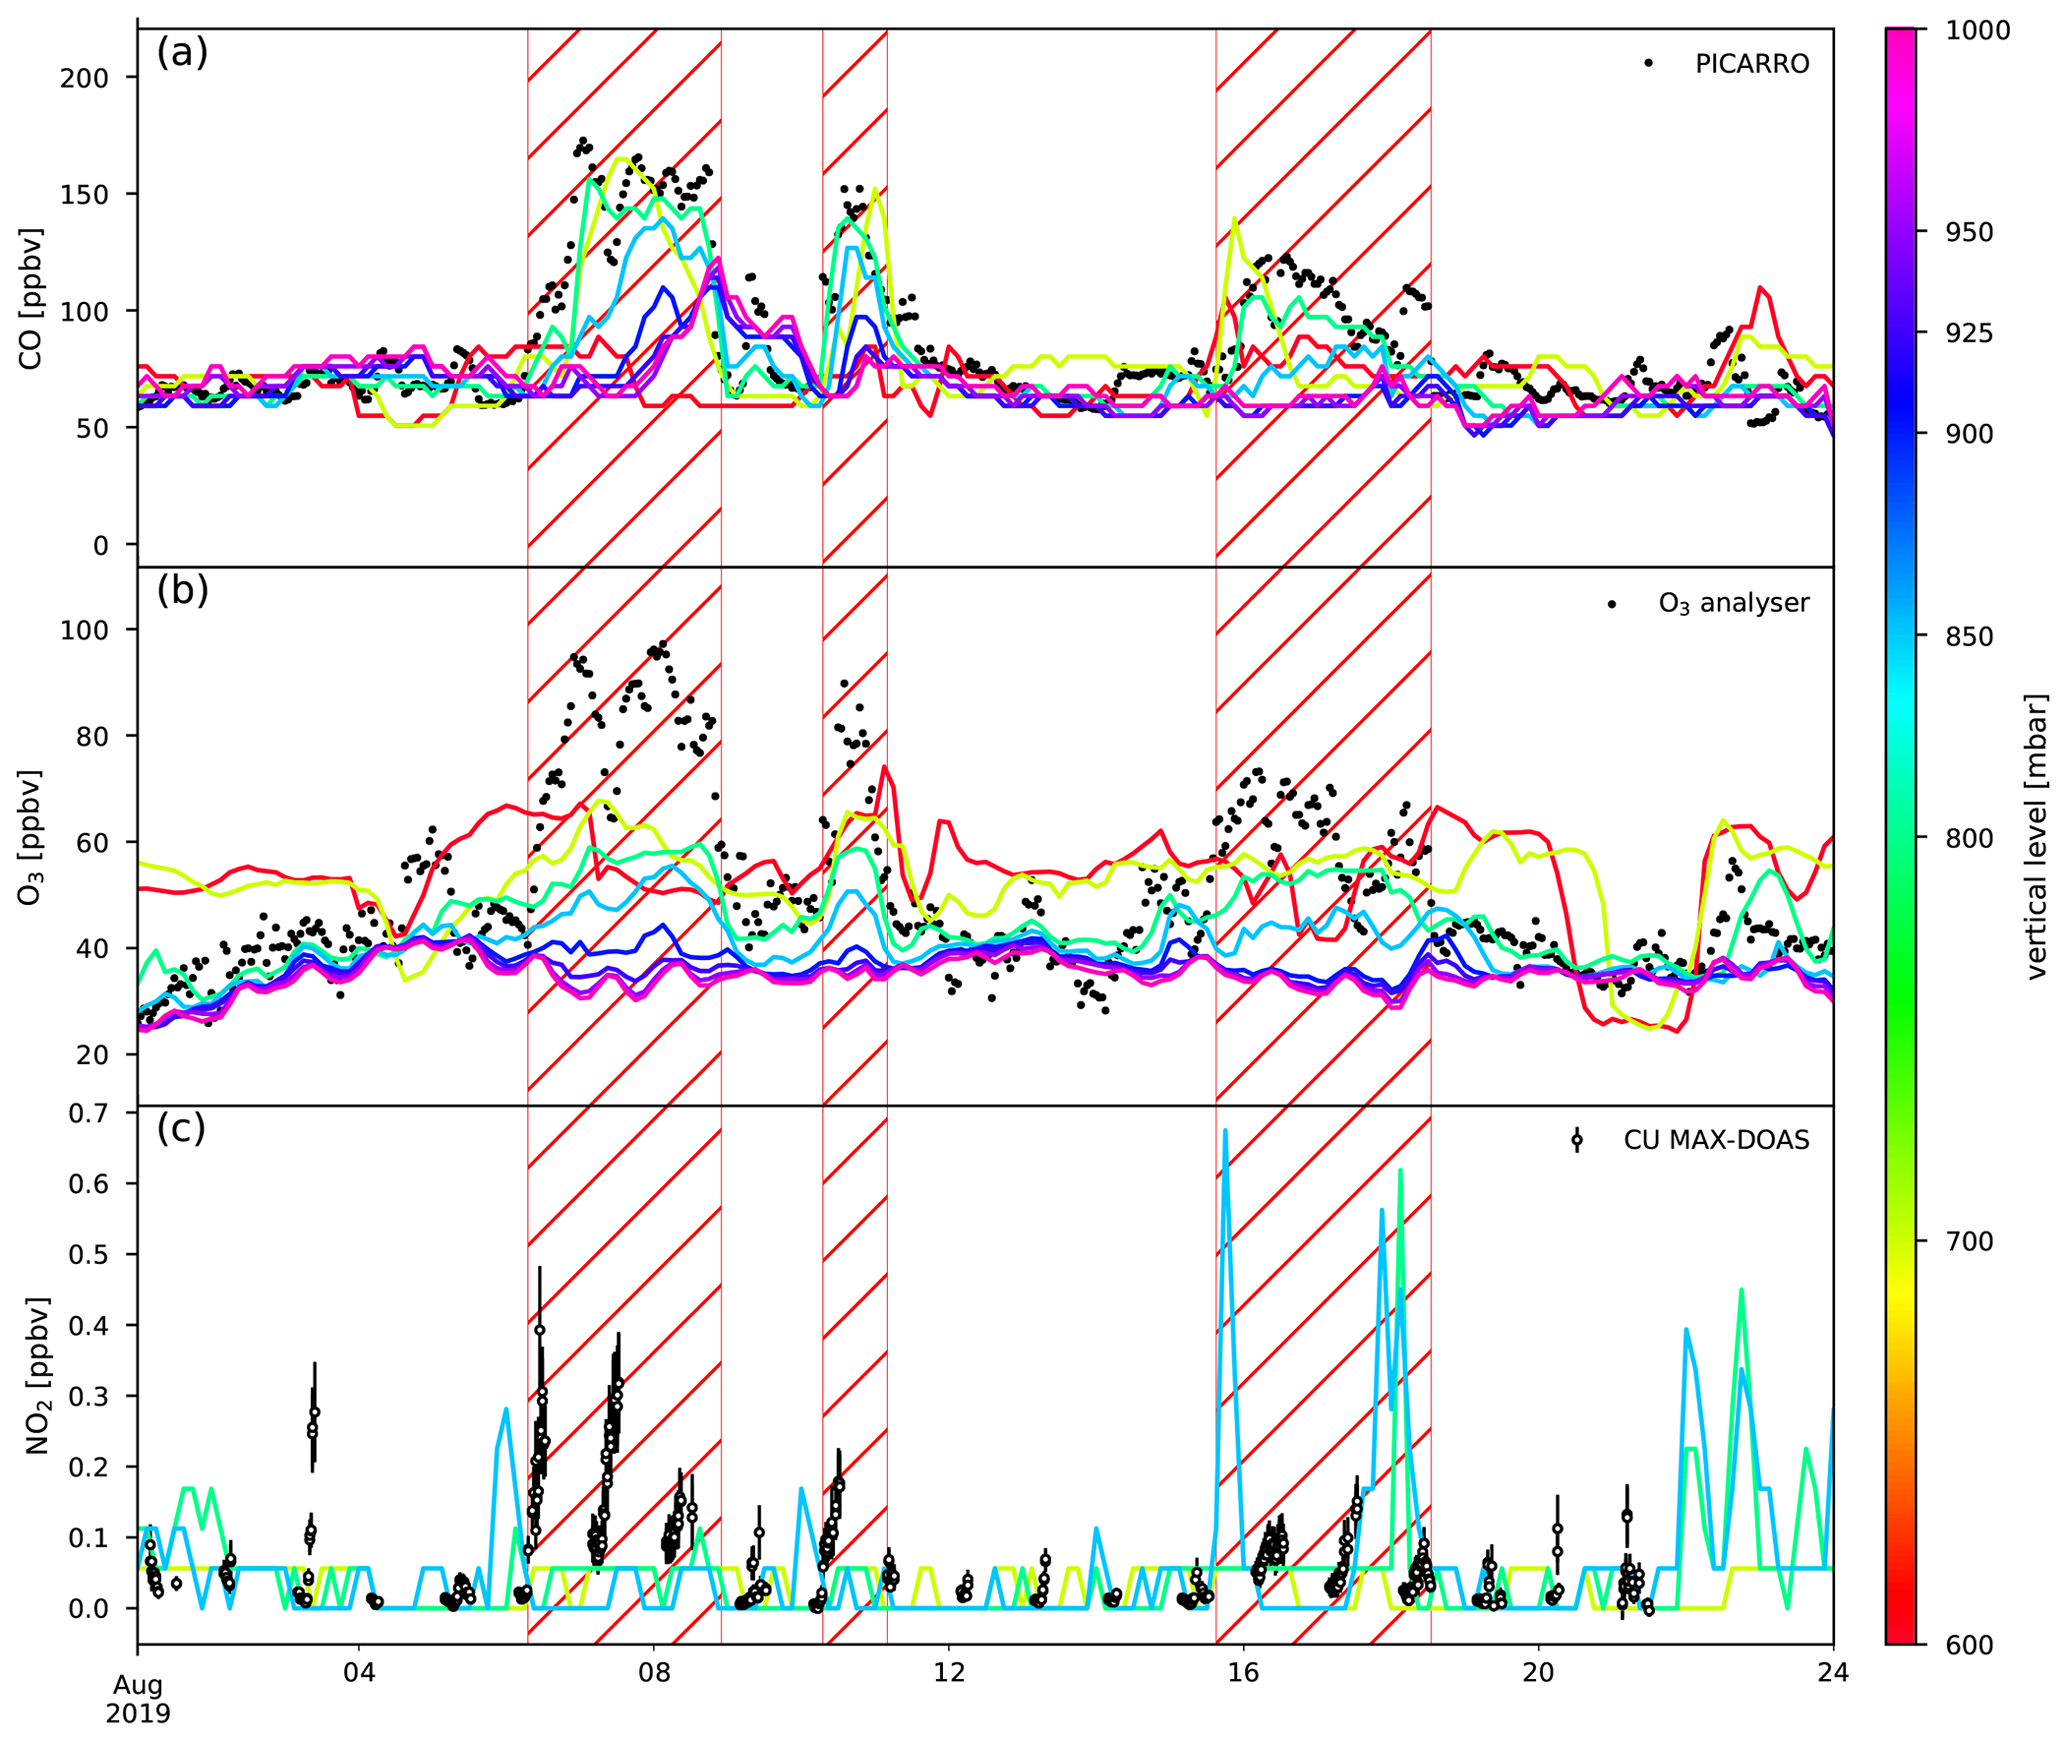
Figure 3Comparison between measured (black dots) and calculated mixing ratios (coloured lines) of CO (a), O3 (b) and NO2 (c) from CAMS. The coloured lines indicate the lowest eight pressure levels in the model (1000, 950, 925, 900, 850, 800, 700 and 600 mbar). The hatched red area represents the different BB intrusions.
The O3 model bias is 16 ppbv during the BB episodes with a maximum bias of 39 ppbv (67 % above the calculated value). Outside the BB episodes, the CAMS O3 concentrations show only a small bias (0.8 ppbv), within the uncertainty of measurements. This good agreement outside of the BB events suggests that mesoscale O3 sources and sinks either have a limited impact or are correctly calculated by the model at the location of RUN.
The NO2 bias reaches 60 pptv during BB episodes, while it is only 9 pptv (within 10 pptv DOAS accuracy error) in other periods. Note that the NO2 measurements are from the ground-based remote sensing CU MAX-DOAS instrument and reflect the NO2 mixing ratio in the lower free troposphere. The large discrepancy in modelled and measured NO2 on 3 August 2019 may be due to a weak BB plume passing near RUN (Appendix B).
3.2.3 FLEXPART forward simulation
A comparison between ΔCO obtained from measurements and the calculated ΔCO from transport of the GFAS v1.2 emission inventory, simulated by FLEXPART, is shown in Fig. 4. Due the misrepresentation of the orographic profile of La Réunion, ground level at the location of the observatory is only 284 in the model. The real altitude of RUN (2160 ) is situated near the boundary between layers 1500–2000 and 2000–2500 in the FLEXPART output. In reality, mesoscale transport, not resolved in FLEXPART, mixes the different vertical layers, and data recorded at Maïdo correspond to a mixture between different output levels. In what follows, we consider RUN to be located in the layer between 2000 and 2500

Figure 4Comparison between measured excess CO (black) at RUN to that modelled on different vertical levels of the FLEXPART model during August 2018 (a) and August 2019 (b). FLEXPART output levels are defined in metres above ground level (m a.g.l.).
The model overestimates ΔCO mixing ratios at RUN by 37 and 17 ppbv on average during the BB episodes in 2018 and 2019 respectively. Peak differences between modelled and observed mixing ratios are 340 ppbv during the BB episodes in 2018 and 162 ppbv during those in 2019. The model bias outside BB episodes, decreases to 3 ppbv for both 2018 and 2019.
As the timing of BB intrusions is well represented in the model, as can be visually confirmed from Fig. 4, calculated mean plume ages during the different episodes are expected to be accurate. The calculated plume ages are, in chronological order of arrival at RUN, 7.5, 10.6 and 11.3 d in 2018 and 7.4, 9.3 and 13.7 d in 2019.
4.1 Transport and dominant sink
The relative humidity during the BB intrusions was generally low (see Fig. 2). Peak RH values correspond to a large impact of the MBL and often lower ΔCH3CN concentration (e.g. 7 and 17 August 2019, Fig. 2). From this, we expect the plume to be primarily located in the free troposphere, which is drier than the PBL. This is consistent with results from FLEXPART (Fig. 4), where ΔCO is especially significant in layers above 1500 The same is also found from the CAMS NRT model where elevated CO mixing ratios are calculated between the 850 and 700 mbar pressure levels (∼1500–3000 ). As the BB plume is primarily located in the FT during austral winter (the dry season) we expect that wet deposition is negligible for all compounds.
4.2 Plume characterisation
The emission ratios – computed based on emission factors from Andreae (2019) – of CH3CN, HCOOH, CH3COOH, CH3COCH3, C6H6 and CH3OH are shown in Table 6. Possible fuel types for BB plumes arriving at RUN are savanna and grassland, tropical forest, or agricultural residue. Enhancement ratios are compared to the emission ratios to check for consistency with accepted knowledge regarding sources and sinks during transport.
Vigouroux et al. (2012)de Gouw et al. (2006)Lefer et al. (1994)Table 6ER (pptv ppbv−1) – relative to CO – for the three most probable fuel types (savanna and grassland, tropical forest, and agricultural residue) of the BB plume sampled at RUN. Between parentheses is the uncertainty obtained by combining the standard deviations of the EFs recorded by Andreae (2019).
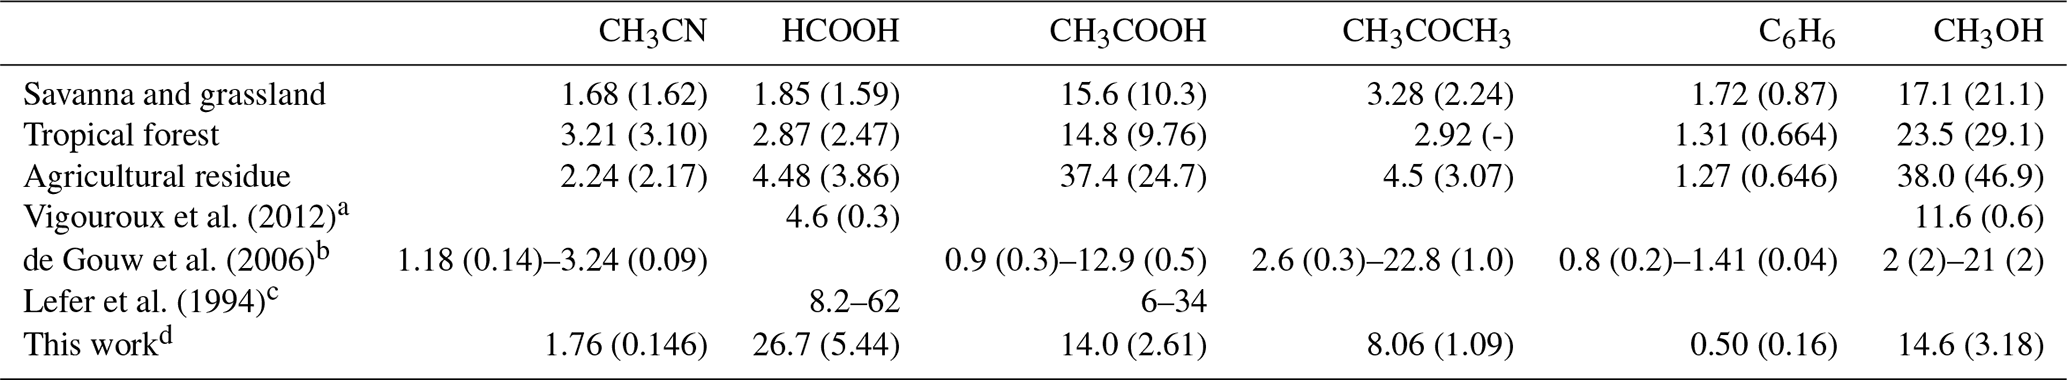
a EnRs derived from FTIR measurements at RUN. b EnR ranges from 11 forest fire plumes sampled during NEAQS-ITCT 2k4. c EnR ranges from 10 subarctic forest fire plumes
sampled during ABLE 3B. d This work, mean EnR and the standard deviation.
4.2.1 Acetonitrile, acetone, methanol and benzene
During the synoptic-scale transport in the free troposphere, the photochemical sink is expected to be dominant over wet scavenging. As the lifetime with regards to this sink is larger than the maximum plume age (13.7 d) for both CH3CN ( years, de Gouw et al., 2003) and CH3COCH3 (–39 d, Arnold et al., 2005; Fischer et al., 2012), the EnRs are expected to correspond well with the ERs from the literature. This is the case for CH3CN (Table 6). In contrast, the EnR of acetone (∼8 pptv ppbv−1) is at least a factor of ∼2 larger than the ER from the literature (Table 6), a likely indication of secondary CH3COCH3 formation in the BB plume. Acetone production has been recorded in BB plumes over the eastern Mediterranean (Holzinger et al., 2005) and over Namibia (Jost et al., 2003). In contrast, aged BB plumes over eastern Canada and Alaska did not show evidence of acetone production (de Gouw et al., 2006). Known pyrogenic CH3COCH3 precursors are propane, i-butane and i-butene (Singh et al., 1994). Using the EFs from Andreae (2019), we find ERpropane=1.2–3.2 pptv ppbv−1, ERi-butane=0.05–0.1 pptv ppbv−1 and ERi-butene=0.30–0.52 pptv ppbv−1. Taking these known precursors of secondary CH3COCH3 into account, as well as acetone formation yields at high NOx estimated based on the Master Chemical Mechanism MCMv3 (http://mcm.leeds.ac.uk/MCM/, last access: 4 June 2020) (Saunders et al., 2003), the secondary production of acetone can be estimated. It is found to enhance the acetone EnR by 1.16–2.80 pptv ppbv−1, therefore explaining the major part of the discrepancy. This is at odds with results from Jost et al. (2003) where fast CH3COCH3 production is observed and propane could not be considered as a precursor since this conversion is a slow process.
Both methanol and benzene have shorter expected lifetimes compared to the age of the BB plume arriving at RUN: d (Jacob et al., 2005), d (Monod et al., 2001). This is consistent with the reduced EnRs inferred from data at RUN compared to the reported average emission ratios from the literature (Table 6).
4.2.2 Carboxylic acids
Due to the relatively short global average atmospheric lifetime of HCOOH (τHCOOH=2–4 d, Stavrakou et al., 2012) and CH3COOH ( d, Khan et al., 2018), EnRs in aged BB plumes should not be compared to emissions ratios from the literature (Paulot et al., 2011). However, as wet- and dry deposition are dominant sinks for both CH3COOH and HCOOH, their effective lifetime during transport in the FT is expected to be much longer (τHCOOH≈25 d from photochemical oxidation, Millet et al., 2015).
The much higher HCOOH enhancement ratio estimated from RUN data (20–30 pptv ppbv−1) compared to reported emission ratios (2–4 pptv ppbv−1) points to significant secondary production during transport to RUN. Similar to secondary production of CH3COCH3, we identified HCOOH precursor species from the literature and cross-referenced these with pyrogenic EFs (Andreae, 2019). A potential precursor to HCOOH strongly emitted by agricultural residue burning is glycolaldehyde (ER = 19±12 pptv ppbv−1, Andreae, 2019). The yield of HCOOH from glycolaldehyde oxidation has been measured to be 18 % at 296 K and 52 % at 233 K (Butkovskaya et al., 2006). This may account for part of the HCOOH production during transport. However, recent studies indicate that this production is effective only in high NOx conditions that are not realistic in a natural environment (Orlando et al., 2012; Orlando and Tyndall, 2020). Production of HCOOH from glycolaldehyde is thus most likely only a minor source. No other known precursors of HCOOH were identified in pyrogenic emissions to account for the high production during transport to RUN suggesting a missing source in current knowledge.
Secondary production of HCOOH was also found in BB plumes over Canada (Lefer et al., 1994) but was not observed in previous ground-based FTIR studies at La Réunion (Vigouroux et al., 2012). Enhancement ratios of HCOOH calculated from the Tropospheric Emission Spectrometer instrument aboard the NASA's Aura spacecraft over Africa ranged from 26 to 28 pptv ppbv−1 (Chaliyakunnel et al., 2016), consistent with our results. This secondary HCOOH production in BB plumes could account for part of the discrepancy in the global HCOOH budget between models and observations (Chaliyakunnel et al., 2016). As these EnRs are inferred from data over biomass burning hotspots in Africa, HCOOH is probably formed primarily close to the source and conserved during synoptic-scale transport towards RUN.
For CH3COOH the enhancement ratio (EnR pptv ppbv−1) is of the same order of magnitude as the emission ratios from the literature (Table 6). Therefore, in contrast with the case of HCOOH, no significant secondary production of acetic acid in BB plumes is identified.
4.2.3 Ozone and NO2
It is generally accepted that O3 is produced in BB plumes during transport (Taupin et al., 2002; Jaffe and Wigder, 2012; Parrington et al., 2013; Arnold et al., 2015; Brocchi et al., 2018). The EnRs obtained in this study (410–640 pptv ppbv−1) are in agreement with the range of EnRs obtained in tropical BB plumes older than 5 d, compiled by Jaffe and Wigder (2012), 410–750 pptv ppbv−1.
Figure 3 shows that the CAMS model reproduces correctly the O3 concentrations at RUN outside the BB episodes but underestimates O3 during these episodes. The large underestimation of O3 during these episodes indicates a misrepresentation of the BB emissions at the source and/or missing O3 production during transport in the chemically complex plumes.
The O3 production in the troposphere is highly dependent on the ratio between VOCs and NOx. The CAMS NRT service is known to overestimate NO2 over southern Africa in austral winter–spring (Flemming et al., 2015; Basart et al., 2020). However, this overestimation was reduced since the upgrade in 2017 (Basart et al., 2020). Total BB VOC emissions in the IFS of ECMWF was ∼40 Tg in the year 2008 (Flemming et al., 2015). This is too low in comparison with the top-down estimate by Stavrakou et al. (2015) where the global pyrogenic VOC emissions are estimated to be 67–75 Tg yr−1.
Ozone production in BB plumes tends to be NOx-limited (Jaffe and Wigder, 2012). The measured NO2 mixing ratio during BB episodes is significantly higher than those calculated by CAMS (Fig. 3). The largest and smallest difference between model and measurements for both NO2 and O3 were recorded during the first and last BB intrusion in 2019 respectively. This mismatch for NO2 may be caused by an underestimation of NOx emissions by fires or by a misrepresentation of NOx recycling (e.g. through peroxyacetyl nitrate or PAN). BB plumes reaching RUN are located at relatively low altitudes where warmer temperatures make thermal decomposition of PAN a likely source of NOx. This could be a decisive factor in harmonising modelled and recorded O3 mixing ratios as an increase in VOC emissions related to BB is unlikely to lead to O3 production in the absence of NOx.
Uncertainties in VOC and NOx emissions by BB and misrepresentations of NOx recycling during transport are both likely contributors to the misrepresentation of O3 mixing ratios at the location of RUN.
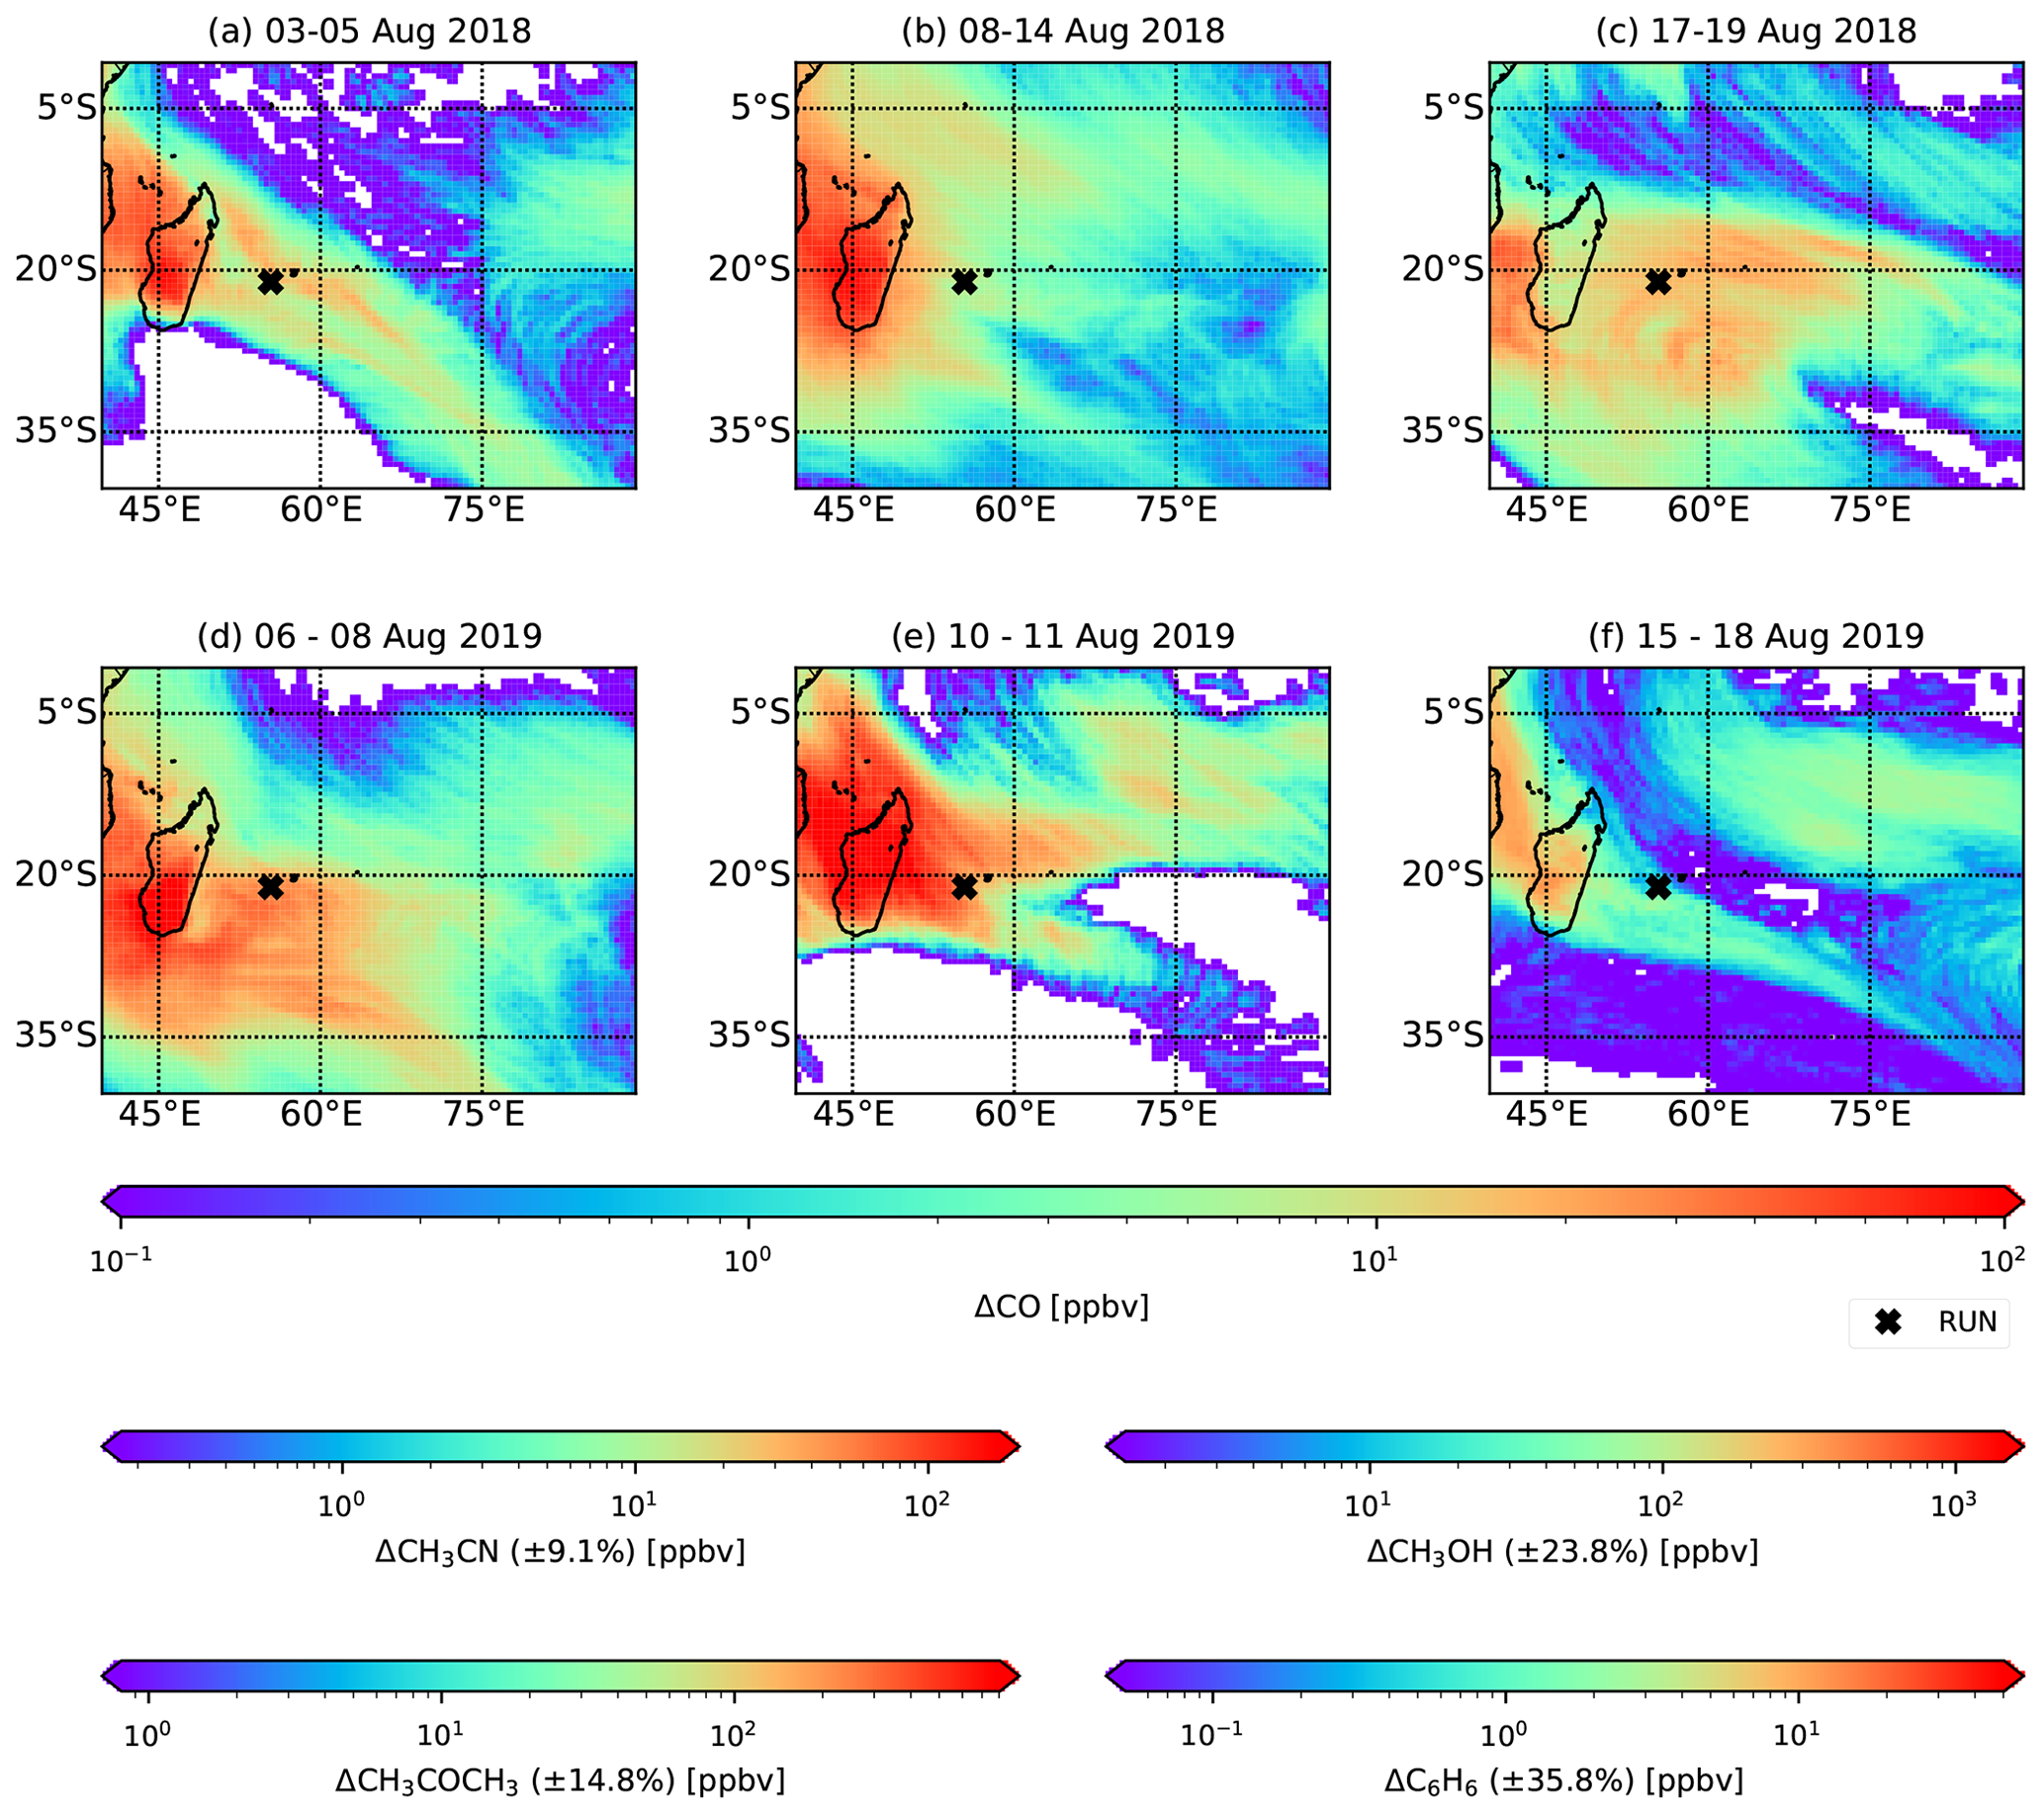
Figure 5Excess CO over the south-west Indian Ocean between 0 and 500 from BB emissions as simulated by FLEXPART. Additional colour scales quantify the projected CH3CN, CH3COCH3, C6H6 and CH3OH excesses.
4.3 Plume dispersion over the SWIO
Transport of BB plumes recorded by the hs-PTR-MS at RUN takes place primarily in the lower FT. This implies that dispersion of the plume into the MBL is possible through turbulent mixing in shallow cumulus clouds and development of the MBL. Figure 5 shows ΔCO due to pyrogenic emissions from plumes between 4 and 16 d old (corresponding to the extremes of plume ages observed at Maïdo) as calculated with FLEXPART on the model output layer 0–500 By using Eq. (3), estimates of ΔCH3CN, ΔCH3COCH3, ΔCH3OH and ΔC6H6 in the pristine marine boundary layer environment were made (Fig. 5). To illustrate the importance of these BB plumes on the MBL composition, these expected excesses are compared with background VOC measurements performed in the SWIO during the MANCHOT campaign that took place in December 2004 (Colomb et al., 2009). Shipborne measurements of VOC concentrations were performed south of La Réunion to characterise the impact of oceanic fronts on MBL composition (Colomb et al., 2009). We use background measurements north (zone I, 24.2–30.2∘ S) and south (zone III, 45.9–49.2∘ S) of the different oceanic fronts that were under consideration (Colomb et al., 2009). Due to the higher concentrations of anthropogenic tracers in zone I of the campaign, it was suggested that there may have been an impact of African outflow on these backgrounds (Colomb et al., 2009). Note that MANCHOT took place in December 2004, which is typically the end of the BB season over the SWIO. Due to the long lifetime of CH3CN and to a lesser extent CH3COCH3, part of these concentrations in zone I may be originating from accumulation of BB plumes in the troposphere.
The low variability in EnRs, between different BB intrusions at RUN, for both CH3CN and CH3COCH3 allows for characterisation of mixing ratios in the marine boundary layer with small relative uncertainties (8.3 % and 13.5 % respectively). The local impact of ΔCH3CN in the SWIO MBL during the August BB episodes (∼50 pptv) constitutes an increase of ∼60 %–150 % over the SWIO as measured during the MANCHOT campaign (zone I: 80±20 pptv, zone III: 20±10 pptv). Acetone excesses are based on the assumption that acetone production in the BB plume is similar in the free troposphere and in the marine boundary layer. The excesses over the SWIO can reach up to 300 pptv, ∼30 %–75 % above the backgrounds recorded during MANCHOT.
The relatively short lifetimes of CH3OH and C6H6 result in a larger variability of the enhancement ratios between different BB intrusions. This is reflected in the larger relative uncertainty in the calculated excesses over the SWIO (21.7 % and 32.6 % for CH3OH and C6H6 respectively). Calculated ΔCH3OH over the SWIO is ∼0.5 ppbv, corresponding to an increase of 25 % (zone I) to at least 100 % (zone III) compared to the values recorded during MANCHOT (Colomb et al., 2009). The expected ΔC6H6 over the SWIO is 30 pptv. This is only a minor increase compared to zone I of the MANCHOT campaign (160±40 pptv) but constitutes a significant increase (150 %) in zone III, further south over the SWIO.
Due to the short lifetime of carboxylic acids in the humid marine boundary layer, the method used above to estimate the BB impact on the SWIO is not valid for HCOOH and CH3COOH.
We have shown that BB plumes were recorded with the hs-PTR-MS instrument deployed at the high-altitude Maïdo observatory located in the south-west Indian Ocean. Six different episodes of biomass burning plumes have been identified and studied in August 2018 and August 2019. Enhancement ratios relative to CO have been calculated for CH3CN (1.61–2.06 pptv ppbv−1), HCOOH (17.5–33.8 pptv ppbv−1), CH3COCH3 (6.84–10.0 pptv ppbv−1), CH3COOH (9.8–18.0 pptv ppbv−1), C6H6 (0.27–0.83 pptv ppbv−1), CH3OH (8.7–18.8 pptv ppbv−1) and O3 (410–640 pptv ppbv−1). Comparison between these EnRs and the ERs calculated from the literature showed production of CH3COCH3 and HCOOH. Secondary production of CH3COCH3 was accounted for by pyrogenic emission of precursor species propane and to a lesser extent i-butane and i-butene. Production was especially significant for HCOOH with EnRs about 10 times larger than the ERs. This HCOOH production can not be accounted for by known precursor species.
The CAMS NRT atmospheric composition service was shown to reproduce the CO concentrations well at RUN both during and outside BB episodes. In contrast, O3 concentrations were only correctly reproduced outside the BB episodes. The large underestimation of O3 concentrations during the BB episodes were linked to (i) large uncertainties in VOC and NOx emissions and (ii) misrepresentation of NOx recycling during transport of the BB plume in the CAMS NRT service. FLEXPART-AROME mesoscale back-trajectory simulations showed that biomass burning plumes were diluted at the observatory when the impact of PBL air increased. This implies that the BB plume recorded at the observatory is primarily transported through the FT. Large-scale transport of ΔCO originating from pyrogenic emissions, simulated with FLEXPART, supported this by showing larger ΔCO concentrations at higher altitudes. Finally, the horizontal distribution of ΔCO in the SWIO MBL – calculated with FLEXPART – is multiplied with the EnR values inferred from data at the Maïdo observatory. This provided estimates for the impact of BB on air mass composition in the MBL over the SWIO. We compared the calculated estimates with background VOC measurements in the region reported in the literature. Expected excesses for CH3CN, CH3COCH3, C6H6 and CH3OH represent an increase in background concentrations by 60 %–150 %, 30 %–75 %, 15 %–150 % and 25 %–> 100 %, respectively. In the future, synchronous VOC measurements at RUN and marine campaigns should be conducted in order to (i) better quantify the ocean–atmosphere interaction in regions with locally enhanced atmospheric concentrations of these species from BB and (ii) identify the different ageing mechanisms during transport in the MBL compared to transport in the FT. This would be especially valuable for CH3COCH3 and CH3OH, for which the role of the ocean on the total atmospheric budget remains uncertain.
A1 Seasonal biomass burning profile
Hourly averages of CO and CH3CN are shown in Fig. A1. Both CO and CH3CN have large peak values from August to November. This corresponds to the biomass burning season as determined from ground-based remote-sensing data studies performed at La Réunion (Duflot et al., 2010; Vigouroux et al., 2012). The analysis presented in this study focuses on the first biomass burning intrusions measured for each season. The motivation for this choice is that the variability in diel profiles between different days is less pronounced during this period and backgrounds do not suffer from accumulated BB tracers for compounds with long atmospheric lifetimes.
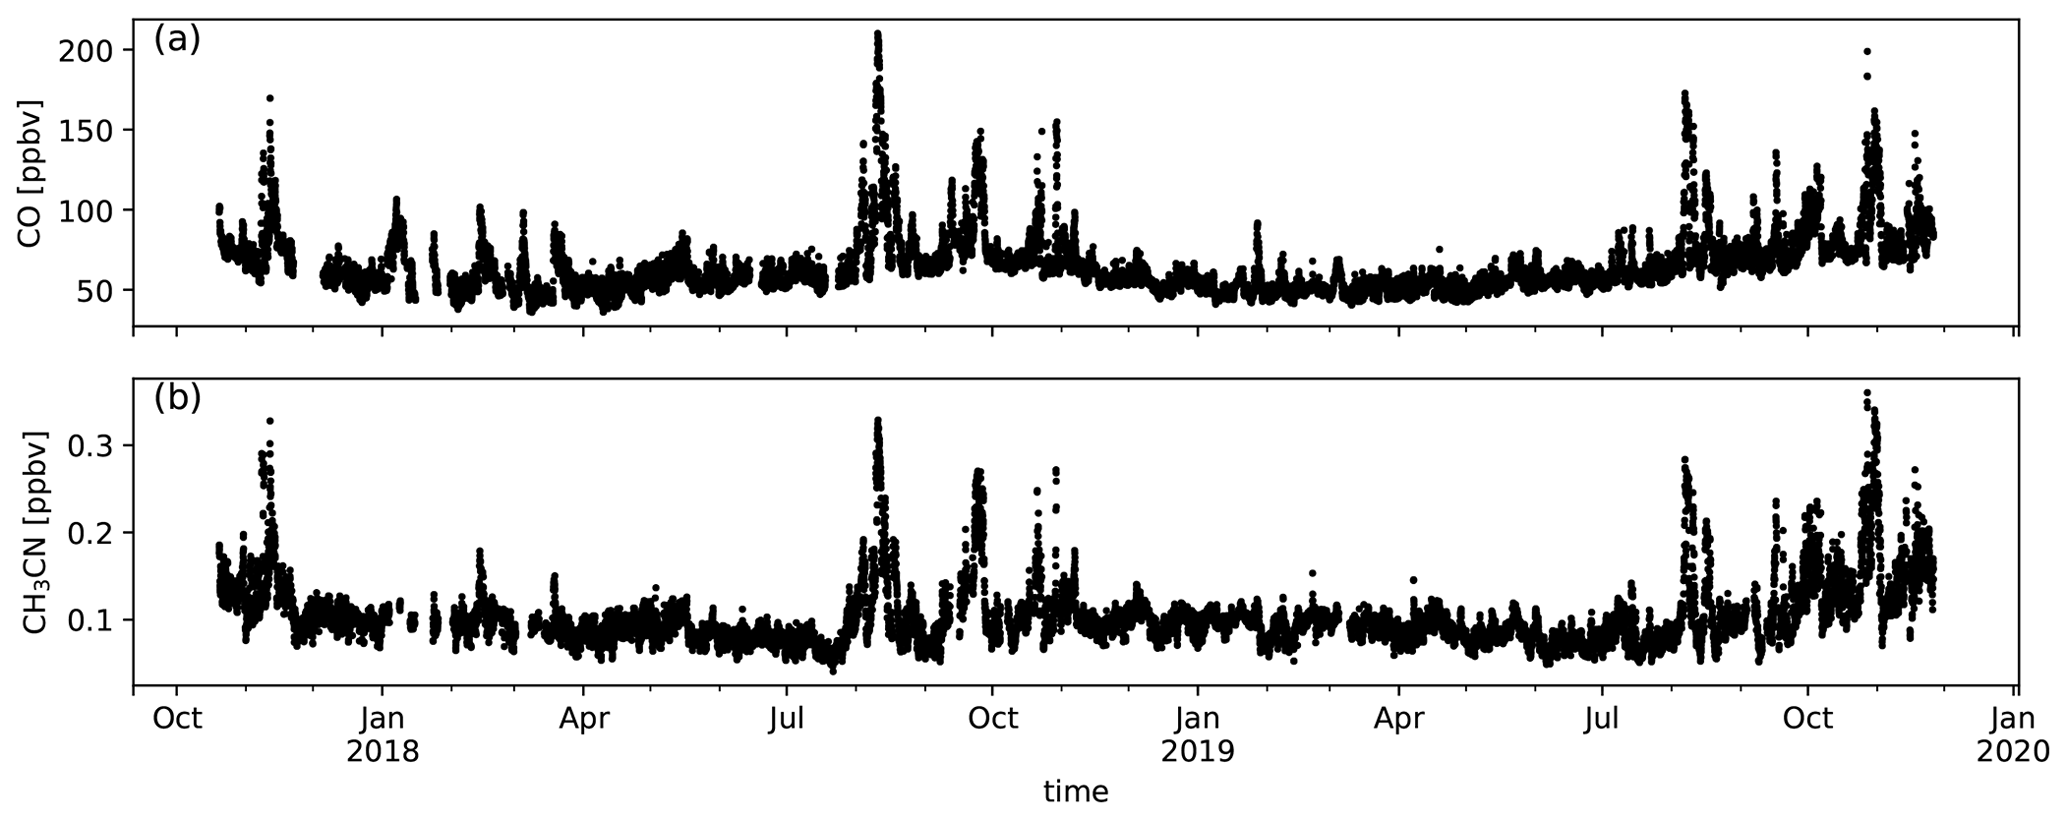
Figure A1Measured CO (a) and CH3CN (b) mixing ratios (ppbv) during the deployment of the hs-PTR-MS for the OCTAVE project.
A2 Austral winter variation of in situ measurements at RUN
The temporal evolution of biomass burning plume constituents during austral winter 2018 and austral winter 2019 are shown together with the diel distribution of hourly averaged mixing ratio from Figs. A2 to A10. The median diel profile is used as an estimate of background variation above which the biomass burning excesses are determined. This works especially well for compounds with relatively small variability between different days compared to the excesses due to biomass burning (e.g. CO, CH3CN, HCOOH, CH3COCH3 and CH3COOH) but may introduce errors for other compounds (e.g. C6H6, CH3OH and O3). When this difference becomes negligible, the analysis no longer works and these compounds are not considered (e.g. HCHO and CH3CHO).
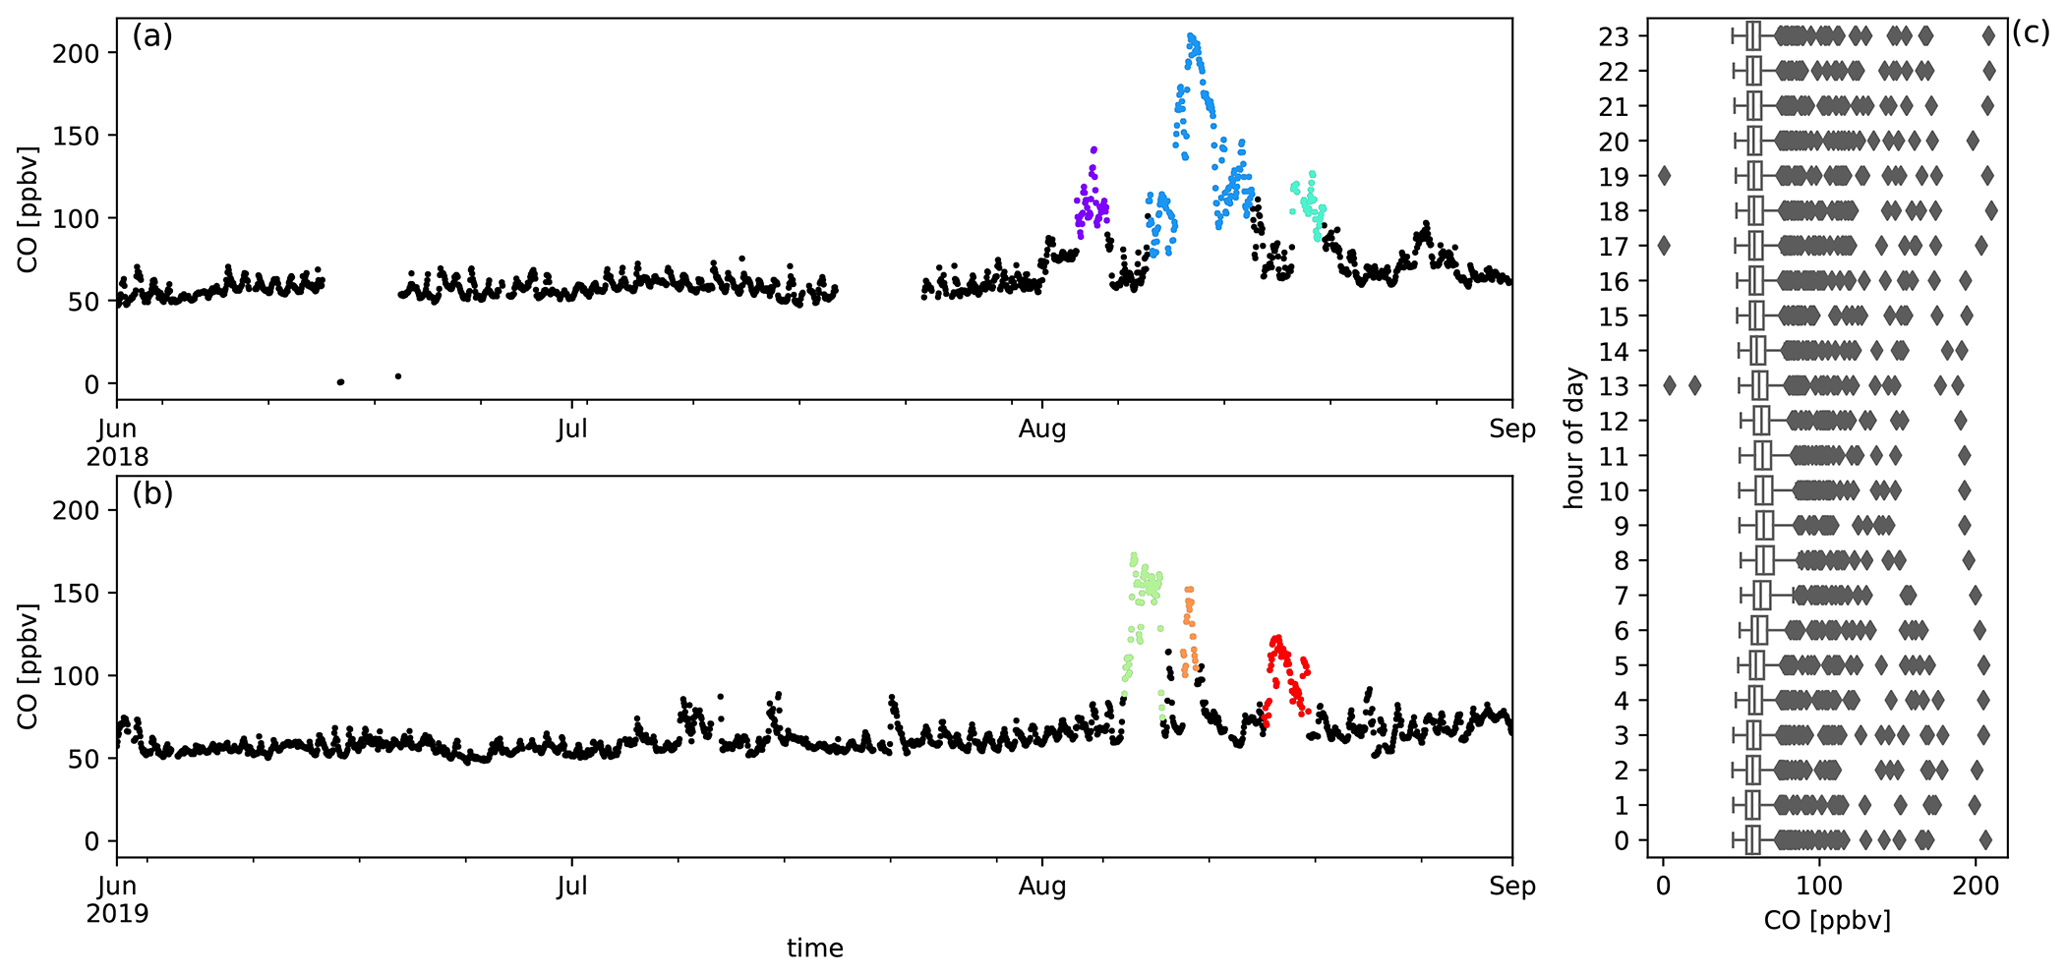
Figure A2Measured CO mixing ratios (ppbv) during austral winter 2018 (a) and austral winter 2019 (b) together with the diel distribution of hourly averages (c). Biomass burning plumes under investigation are highlighted in colours.
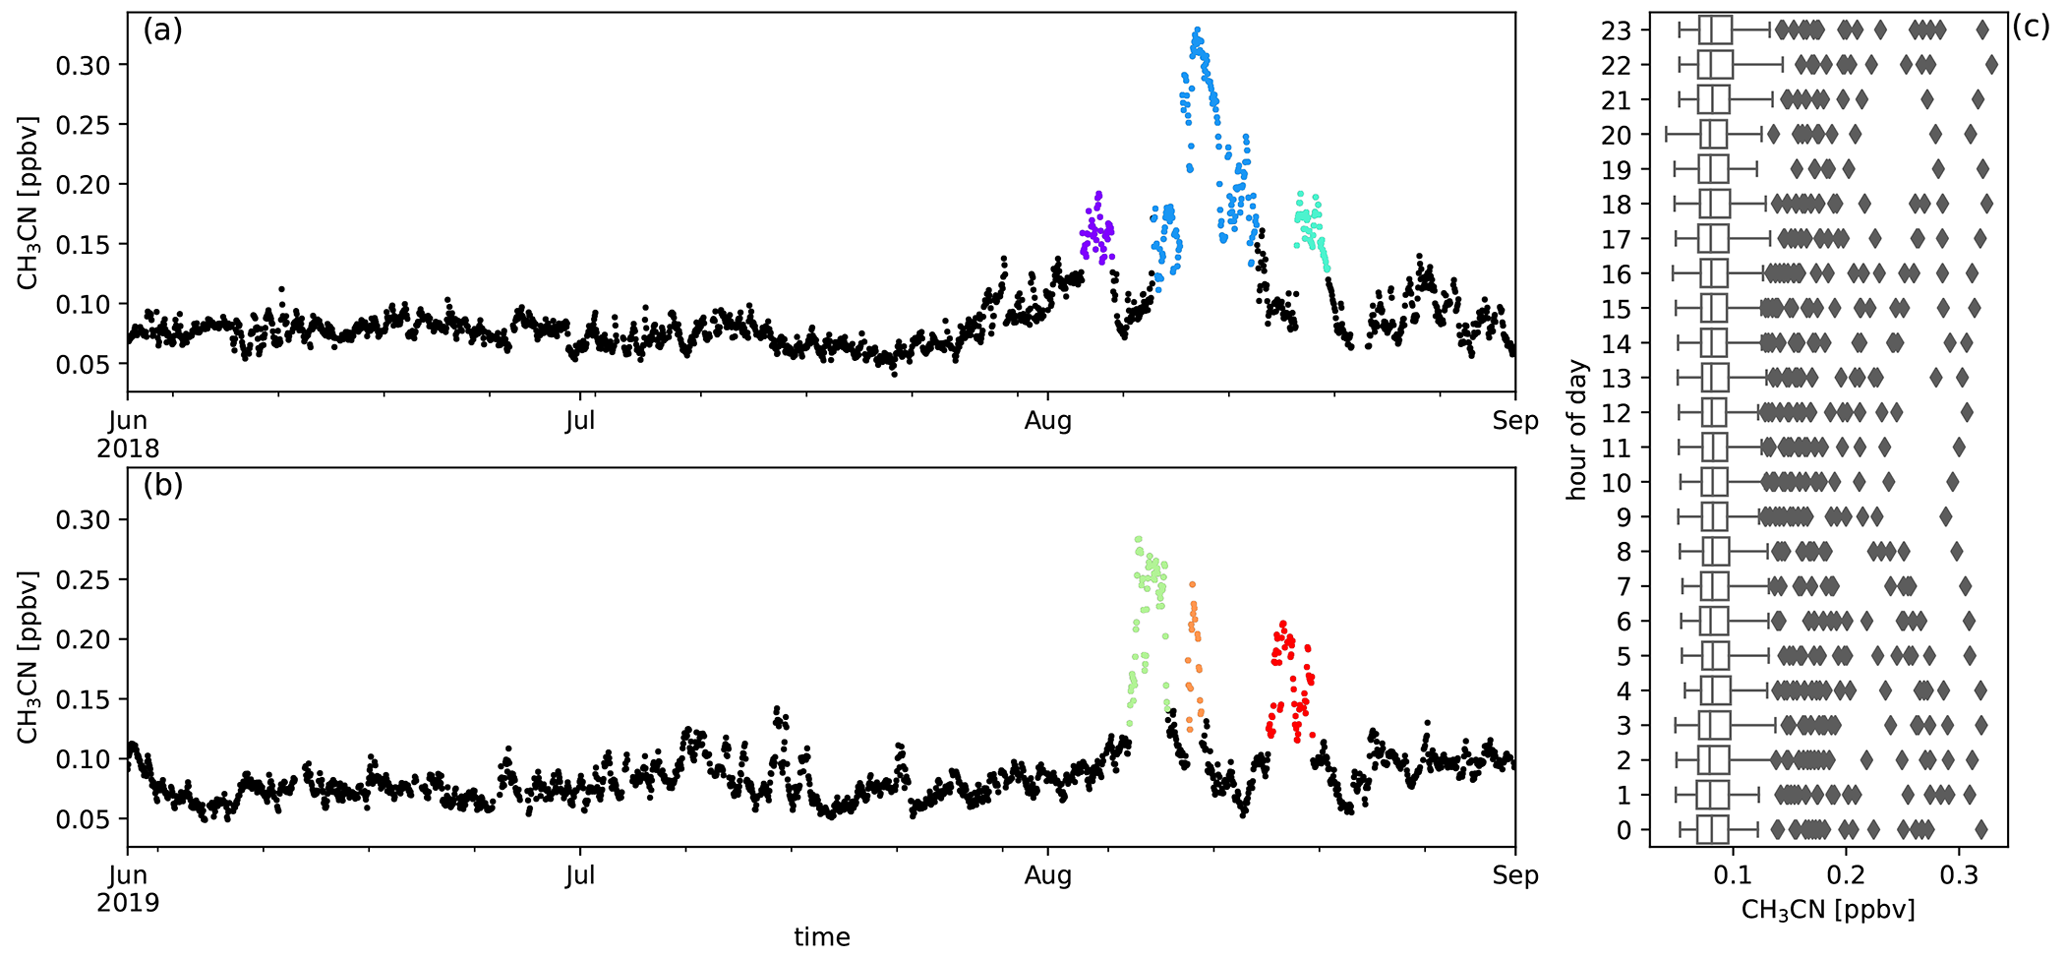
Figure A3Measured CH3CN mixing ratios (ppbv) during austral winter 2018 (a) and austral winter 2019 (b) together with the diel distribution of hourly averages (c). Biomass burning plumes under investigation are highlighted in colours.

Figure A4Measured HCOOH mixing ratios (ppbv) during austral winter 2018 (a) and austral winter 2019 (b) together with the diel distribution of hourly averages (c). Biomass burning plumes under investigation are highlighted in colours.

Figure A5Measured CH3COCH3 mixing ratios (ppbv) during austral winter 2018 (a) and austral winter 2019 (b) together with the diel distribution of hourly averages (c). Biomass burning plumes under investigation are highlighted in colours.
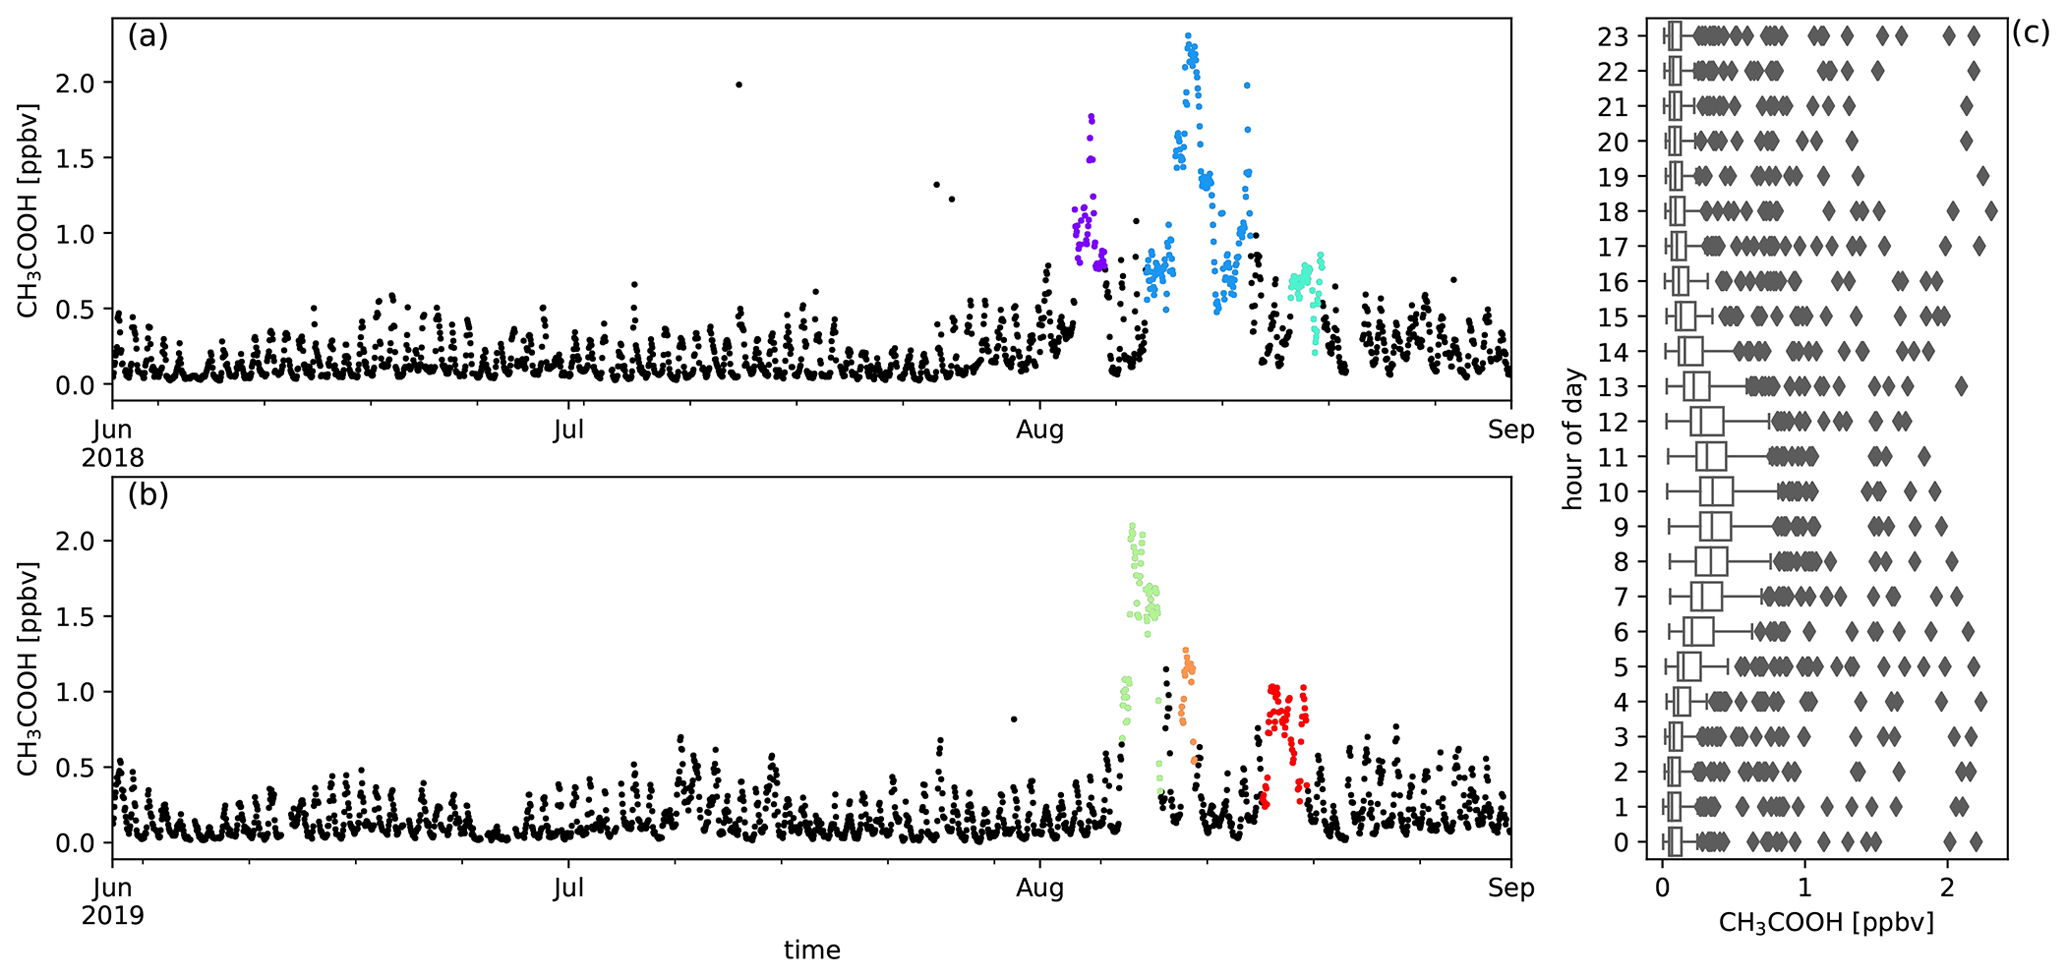
Figure A6Measured CH3COOH mixing ratios (ppbv) during austral winter 2018 (a) and austral winter 2019 (b) together with the diel distribution of hourly averages (c). Biomass burning plumes under investigation are highlighted in colours.
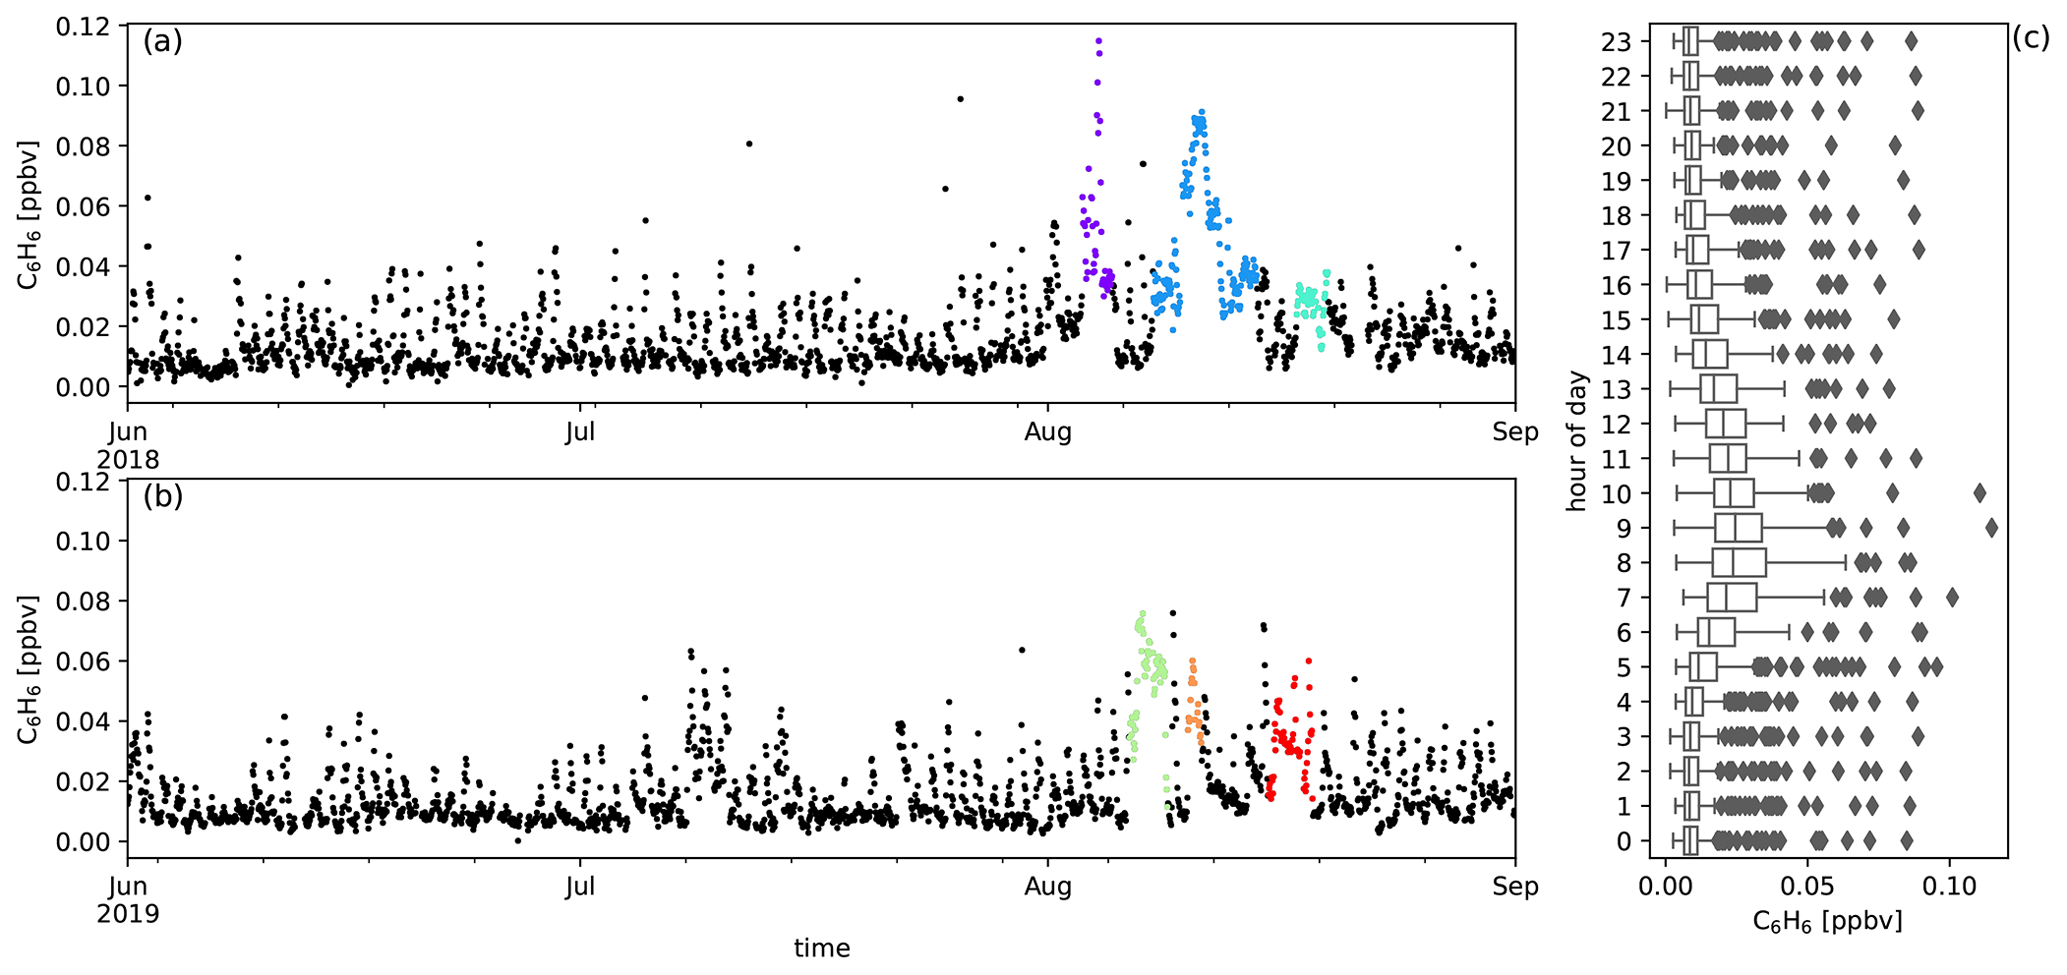
Figure A7Measured C6H6 mixing ratios (ppbv) during austral winter 2018 (a) and austral winter 2019 (b) together with the diel distribution of hourly averages (c). Biomass burning plumes under investigation are highlighted in colours.
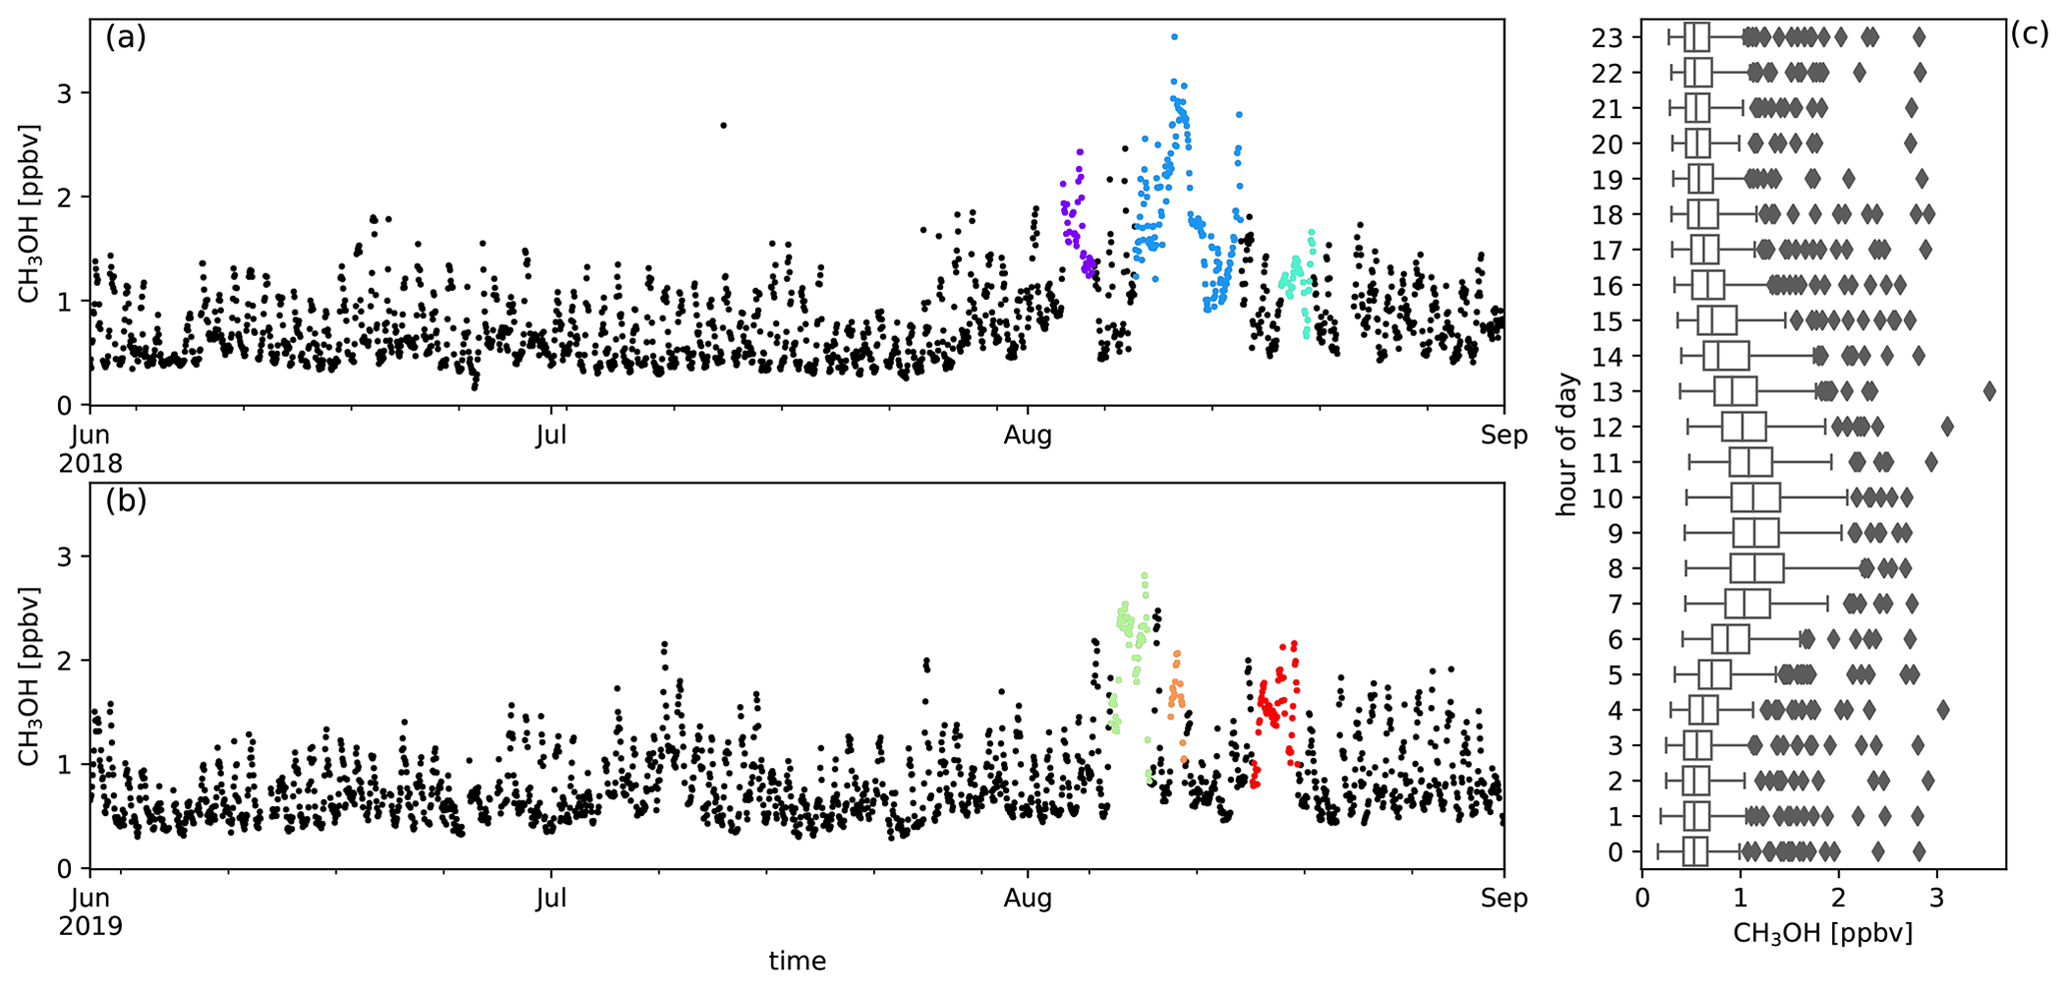
Figure A8Measured CH3OH mixing ratios (ppbv) during austral winter 2018 (a) and austral winter 2019 (b) together with the diel distribution of hourly averages (c). Biomass burning plumes under investigation are highlighted in colours.
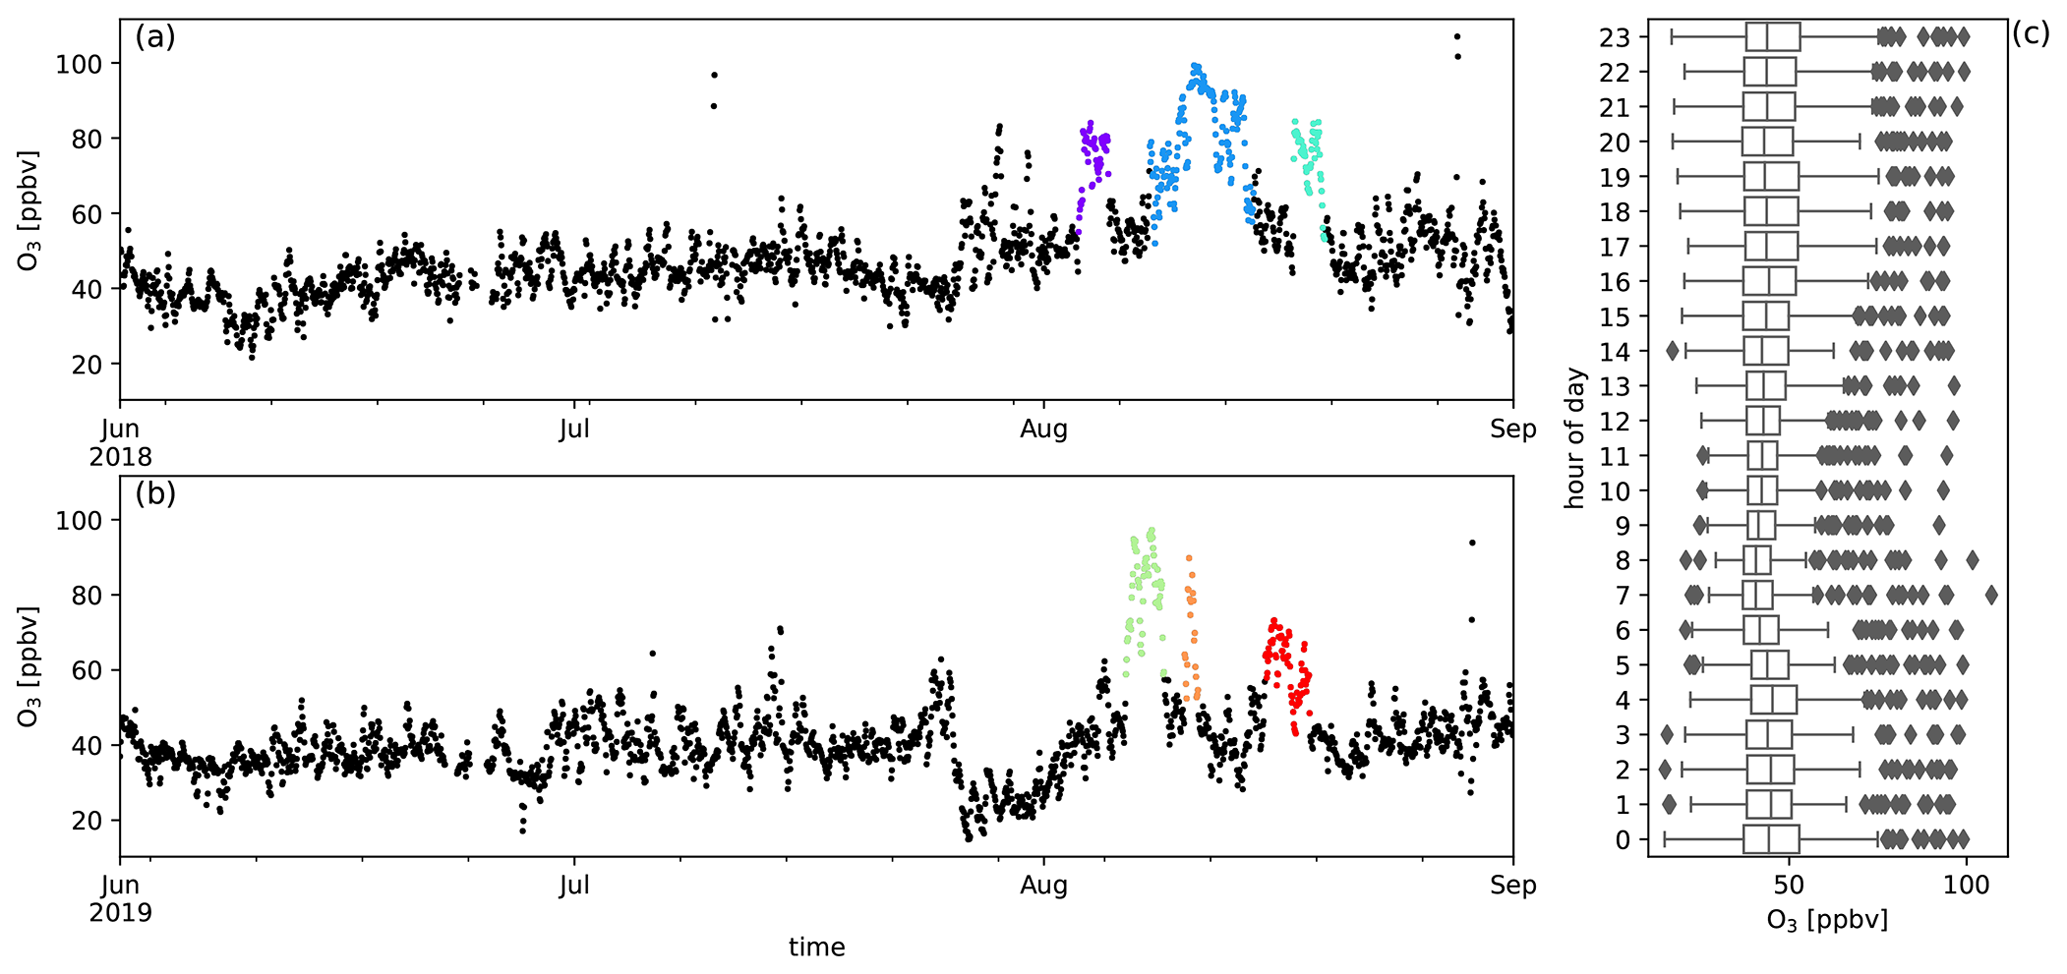
Figure A9Measured O3 mixing ratios (ppbv) during austral winter 2018 (a) and austral winter 2019 (b) together with the diel distribution of hourly averages (c). Biomass burning plumes under investigation are highlighted in colours.

Figure A10Measured CH3CHO mixing ratios (ppbv) during austral winter 2018 (a) and austral winter 2019 (b) together with the diel distribution of hourly averages (c). Biomass burning plumes under investigation are highlighted in colours.

Figure A11NO2 (ppbv) from CU MAX-DOAS in comparison with ΔCO (ppbv) from FLEXPART simulations. Altitude () corresponds with vertical layers in the FLEXPART output at the location of RUN. The ground level of RUN in the model is 284
NO2 volume mixing ratios from the CU MAX-DOAS instrument are generally lower than 100 pptv outside of the BB episodes. A notable exception to this is 3 August 2019 when it reaches ∼280 pptv. This coincides with slightly elevated ΔCO signals simulated by FLEXPART at RUN (Fig. A11). At the visible wavelengths, the horizontal spatial scale probed is about 40 km and the overlap with the PBL is only a few kilometres. As a results, measurements from the CU MAX-DOAS instrument are expected to compare well to the FLEXPART and CAMS models, which have a low spatial resolution. Note that when the NO2 mixing ratio from the CU MAX-DOAS instrument is above 100 pptv, FLEXPART ΔCO is generally enhanced between 1000 and 1500
As the plume on 3 August is not clearly observed in the in situ measurements we assume that it is not well mixed with boundary layer air at RUN and do not investigate it further here.
The core hs-PTR-MS dataset can be downloaded from https://doi.org/10.18758/71021059 (Amelynck et al., 2020). Other data are available upon request.
The formal analysis was performed by BV. The hs-PTR-MS data acquisition, processing and management was done by CA and NS. AC and JMM were responsible for data acquisition and management of the Thermo Scientific model 49i instrument. The data acquisition and management of the Picarro G2401 instrument was done by NK and JMM. The CU MAX-DOAS data acquisition, processing and management was done by RV, TKK and CFL. FLEXPART and FLEXPART-AROME simulations were performed by BV and JB. The original draft was prepared by BV. Review and editing was done by CA, JFM, TS, JB, RV, NS and AC.
The authors declare that they have no conflict of interest.
This work contains modified Copernicus Atmosphere Monitoring Service Information, neither the European Commission nor ECMWF is responsible for any use that may be made of the information it contains.
We would like to thank UMS3365 of OSU-Réunion for its support in the deployment of the hs-PTR-MS at Maïdo.
This research has been supported by the Belgian Federal Science Policy Office (grant no. BR/175/A2/OCTAVE), the Horizon 2020 (ACTRIS-2, grant no. 654109), and the National Science Foundation, Division of Atmospheric and Geospace Sciences (grant no. AGS-1620530).
This paper was edited by Maria Kanakidou and reviewed by two anonymous referees.
Akagi, S. K., Yokelson, R. J., Wiedinmyer, C., Alvarado, M. J., Reid, J. S., Karl, T., Crounse, J. D., and Wennberg, P. O.: Emission factors for open and domestic biomass burning for use in atmospheric models, Atmos. Chem. Phys., 11, 4039–4072, https://doi.org/10.5194/acp-11-4039-2011, 2011. a
Akagi, S. K., Burling, I. R., Mendoza, A., Johnson, T. J., Cameron, M., Griffith, D. W. T., Paton-Walsh, C., Weise, D. R., Reardon, J., and Yokelson, R. J.: Field measurements of trace gases emitted by prescribed fires in southeastern US pine forests using an open-pa th FTIR system, Atmos. Chem. Phys., 14, 199–215, https://doi.org/10.5194/acp-14-199-2014, 2014. a
Amelynck, C., Schoon, N., and Verreyken, B.: Supplement to “Characterisation of African biomass burning plumes and impacts on the atmospheric composition over the South-West Indian Ocean” by Bert Verreyken et al., Atmospheric Chemistry and Physics, in review (2020) [Data set], Royal Belgian Institute for Space Aeronomy, https://doi.org/10.18758/71021059, 2020. a
Andreae, M. O.: Emission of trace gases and aerosols from biomass burning – an updated assessment, Atmos. Chem. Phys., 19, 8523–8546, https://doi.org/10.5194/acp-19-8523-2019, 2019. a, b, c, d, e, f, g, h
Arnold, S. R., Chipperfield, M. P., and Blitz, M. A.: A three-dimensional model study of the effect of new temperature-dependent quantum yields for acetone photolysis, J. Geophys. Res.-Atmos., 110, D22305, https://doi.org/10.1029/2005JD005998, 2005. a
Arnold, S. R., Emmons, L. K., Monks, S. A., Law, K. S., Ridley, D. A., Turquety, S., Tilmes, S., Thomas, J. L., Bouarar, I., Flemming, J., Huijnen, V., Mao, J., Duncan, B. N., Steenrod, S., Yoshida, Y., Langner, J., and Long, Y.: Biomass burning influence on high-latitude tropospheric ozone and reactive nitrogen in summer 2008: a multi-model analysis based on POLMIP simulations, Atmos. Chem. Phys., 15, 6047–6068, https://doi.org/10.5194/acp-15-6047-2015, 2015. a
Atkinson, R.: Atmospheric chemistry of VOCs and NOx, Atmos. Environ., 34, 2063–2101, https://doi.org/10.1016/S1352-2310(99)00460-4, 2000. a
Baasandorj, M., Millet, D. B., Hu, L., Mitroo, D., and Williams, B. J.: Measuring acetic and formic acid by proton-transfer-reaction mass spectrometry: sensitivity, humidity dependence, and quantifying interferences, Atmos. Meas. Tech., 8, 1303–1321, https://doi.org/10.5194/amt-8-1303-2015, 2015. a
Baray, J.-L., Courcoux, Y., Keckhut, P., Portafaix, T., Tulet, P., Cammas, J.-P., Hauchecorne, A., Godin Beekmann, S., De Mazière, M., Hermans, C., Desmet, F., Sellegri, K., Colomb, A., Ramonet, M., Sciare, J., Vuillemin, C., Hoareau, C., Dionisi, D., Duflot, V., Vérèmes, H., Porteneuve, J., Gabarrot, F., Gaudo, T., Metzger, J.-M., Payen, G., Leclair de Bellevue, J., Barthe, C., Posny, F., Ricaud, P., Abchiche, A., and Delmas, R.: Maïdo observatory: a new high-altitude station facility at Reunion Island (21∘ S, 55∘ E) for long-term atmospheric remote sensing and in situ measurements, Atmos. Meas. Tech., 6, 2865–2877, https://doi.org/10.5194/amt-6-2865-2013, 2013. a, b
Basart, S., Benedictow, A., Bennouna, Y., Blechschmidt, A.-M., Chabrillat, S., Christophe, Y., Cuevas, E., Eskes, H. J., Hanse, K. M., Jorba, O., Kapsomenakis, J., Langerock, B., Pay, T., Richter, A., Sudarchikova, N., Schulz, M., Wagner, A., and Zerefos, C.: Upgrade verification note for the CAMS real-time global atmospheric composition service Evaluation of the e-suite for the CAMS upgrade of July 2019, report, The Copernicus Atmosphere Monitoring Service (CAMS), https://doi.org/10.24380/fcwq-yp50, 2019. a
Basart, S., Benedictow, A., Bennouna, Y., Blechschmidt, A.-M., Chabrillat, S., Cuevas, E., El-Yazidi, A., Flentje, H., Hansen, K. M., Im, U., Kapsomenakis, J., Langerock, B., Richter, A., Sudarchikova, N., Thouret, V., Warneke, T., and Zerefos, C.: Validation report of the CAMS near-real-time global atmospheric composition service. Period September–November 2019, report, The Copernicus Atmosphere Monitoring Service (CAMS), https://doi.org/10.24380/xzkk-bz05, 2020. a, b
Blake, N. J., Blake, D. R., Wingenter, O. W., Sive, B. C., Kang, C. H., Thornton, D. C., Bandy, A. R., Atlas, E., Flocke, F., Harris, J. M., and Rowland, F. S.: Aircraft measurements of the latitudinal, vertical, and seasonal variations of NMHCs, methyl nitrate, methyl halides, and DMS during the First Aerosol Characterization Experiment (ACE 1), J. Geophys. Res.-Atmos., 104, 21803–21817, https://doi.org/10.1029/1999JD900238, 1999. a
Brocchi, V., Krysztofiak, G., Catoire, V., Guth, J., Marécal, V., Zbinden, R., El Amraoui, L., Dulac, F., and Ricaud, P.: Intercontinental transport of biomass burning pollutants over the Mediterranean Basin during the summer 2014 ChArMEx-GLAM airborne campaign, Atmos. Chem. Phys., 18, 6887–6906, https://doi.org/10.5194/acp-18-6887-2018, 2018. a
Butkovskaya, N. I., Pouvesle, N., Kukui, A., and Le Bras, G.: Mechanism of the OH-Initiated Oxidation of Glycolaldehyde over the Temperature Range 233–296 K, J. Phys. Chem. A, 110, 13492–13499, https://doi.org/10.1021/jp064993k, 2006. a
Carpenter, L. J. and Nightingale, P. D.: Chemistry and Release of Gases from the Surface Ocean, Chem. Rev., 115, 4015–4034, https://doi.org/10.1021/cr5007123, 2015. a
Chaliyakunnel, S., Millet, D., Wells, K., Cady-Pereira, K., and Shephard, M.: A Large Underestimate of Formic Acid from Tropical Fires: Constraints from Space-Borne Measurements, Environ. Sci. Technol., 50, 5631–5640, https://doi.org/10.1021/acs.est.5b06385, 2016. a, b, c, d
Christian, T. J., Kleiss, B., Yokelson, R. J., Holzinger, R., Crutzen, P. J., Hao, W. M., Saharjo, B. H., and Ward, D. E.: Comprehensive laboratory measurements of biomass-burning emissions: 1. Emissions from Indonesian, African, and other fuels, J. Geophys. Res.-Atmos., 108, 4719, https://doi.org/10.1029/2003JD003704, 2003. a
Coburn, S., Dix, B., Sinreich, R., and Volkamer, R.: The CU ground MAX-DOAS instrument: characterization of RMS noise limitations and first measurements near Pensacola, FL of BrO, IO, and CHOCHO, Atmos. Meas. Tech., 4, 2421–2439, https://doi.org/10.5194/amt-4-2421-2011, 2011. a
Colomb, A., Gros, V., Alvain, S., Sarda-Esteve, R., Bonsang, B., Moulin, C., Klüpfel, T., and J., W.: Variation of atmospheric volatile organic compounds over the Southern Indian Ocean (30–49∘ S), Environ. Chem., 6, 80–82, https://doi.org/10.1071/EN08072, 2009. a, b, c, d, e, f
Danckaert, T., Fayt, C., Van Roozendael, M., De Smedt, I., Letocart, V., Merlaud, A., and Pinardi, G.: QDOAS software user manual, v3.2, available at: http://uv-vis.aeronomie.be/software/QDOAS (last access: 10 June 2019), 2017. a
de Gouw, J. A., Warneke, C., Parrish, D. D., Holloway, J. S., Trainer, M., and Fehsenfeld, F. C.: Emission sources and ocean uptake of acetonitrile (CH3CN) in the atmosphere, J. Geophys. Res.-Atmos., 108, 4329, https://doi.org/10.1029/2002JD002897, 2003. a
de Gouw, J. A., Warneke, C., Stohl, A., Wollny, A. G., Brock, C. A., Cooper, O. R., Holloway, J. S., Trainer, M., Fehsenfeld, F. C., Atlas, E. L., Donnelly, S. G., Stroud, V., and Lueb, A.: Volatile organic compounds composition of merged and aged forest fire plumes from Alaska and western Canada, J. Geophys. Res.-Atmos., 111, D10303, https://doi.org/10.1029/2005JD006175, 2006. a, b, c, d
Di Giuseppe, F., Rémy, S., Pappenberger, F., and Wetterhall, F.: Using the Fire Weather Index (FWI) to improve the estimation of fire emissions from fire radiative power (FRP) observations, Atmos. Chem. Phys., 18, 5359–5370, https://doi.org/10.5194/acp-18-5359-2018, 2018. a
Dix, B., Koenig, T. K., and Volkamer, R.: Parameterization retrieval of trace gas volume mixing ratios from Airborne MAX-DOAS, Atmos. Meas. Tech., 9, 5655–5675, https://doi.org/10.5194/amt-9-5655-2016, 2016. a, b
Duflot, V., Dils, B., Baray, J. L., De Mazière, M., Attié, J. L., Vanhaelewyn, G., Senten, C., Vigouroux, C., Clain, G., and Delmas, R.: Analysis of the origin of the distribution of CO in the subtropical southern Indian Ocean in 2007, J. Geophys. Res.-Atmos., 115, D22106, https://doi.org/10.1029/2010JD013994, 2010. a, b
Duflot, V., Tulet, P., Flores, O., Barthe, C., Colomb, A., Deguillaume, L., Vaïtilingom, M., Perring, A., Huffman, A., Hernandez, M. T., Sellegri, K., Robinson, E., O'Connor, D. J., Gomez, O. M., Burnet, F., Bourrianne, T., Strasberg, D., Rocco, M., Bertram, A. K., Chazette, P., Totems, J., Fournel, J., Stamenoff, P., Metzger, J.-M., Chabasset, M., Rousseau, C., Bourrianne, E., Sancelme, M., Delort, A.-M., Wegener, R. E., Chou, C., and Elizondo, P.: Preliminary results from the FARCE 2015 campaign: multidisciplinary study of the forest–gas–aerosol–cloud system on the tropical island of La Réunion, Atmos. Chem. Phys., 19, 10591–10618, https://doi.org/10.5194/acp-19-10591-2019, 2019. a, b
Fischer, E. V., Jacob, D. J., Millet, D. B., Yantosca, R. M., and Mao, J.: The role of the ocean in the global atmospheric budget of acetone, Geophys. Res. Lett., 39, L01807, https://doi.org/10.1029/2011GL050086, 2012. a, b
Flemming, J., Huijnen, V., Arteta, J., Bechtold, P., Beljaars, A., Blechschmidt, A.-M., Diamantakis, M., Engelen, R. J., Gaudel, A., Inness, A., Jones, L., Josse, B., Katragkou, E., Marecal, V., Peuch, V.-H., Richter, A., Schultz, M. G., Stein, O., and Tsikerdekis, A.: Tropospheric chemistry in the Integrated Forecasting System of ECMWF, Geosci. Model Dev., 8, 975–1003, https://doi.org/10.5194/gmd-8-975-2015, 2015. a, b, c
Granier, C., Darras, S., van der Gon, H. D., Doubalova, J., Elguindi, N., Galle, B., Gauss, M., Guevara, M., Jalkanen, J.-P., Kuenen, J., Liousse, C., Quack, B., Simpson, D., and Sindelarova, K.: The Copernicus Atmosphere Monitoring Service global and regional emissions (April 2019 version), report, The Copernicus Atmosphere Monitoring Service (CAMS), https://doi.org/10.24380/d0bn-kx16, 2019. a
Holzinger, R., Warneke, C., Hansel, A., Jordan, A., Lindinger, W., Scharffe, D. H., Schade, G., and Crutzen, P. J.: Biomass burning as a source of formaldehyde, acetaldehyde, methanol, acetone, acetonitrile, and hydrogen cyanide, Geophys. Res. Lett., 26, 1161–1164, https://doi.org/10.1029/1999GL900156, 1999. a
Holzinger, R., Williams, J., Salisbury, G., Klüpfel, T., de Reus, M., Traub, M., Crutzen, P. J., and Lelieveld, J.: Oxygenated compounds in aged biomass burning plumes over the Eastern Mediterranean: evidence for strong secondary production of methanol and acetone, Atmos. Chem. Phys., 5, 39–46, https://doi.org/10.5194/acp-5-39-2005, 2005. a
Hönninger, G., von Friedeburg, C., and Platt, U.: Multi axis differential optical absorption spectroscopy (MAX-DOAS), Atmos. Chem. Phys., 4, 231–254, https://doi.org/10.5194/acp-4-231-2004, 2004. a
Inomata, S. and Tanimoto, H.: A Quantitative Examination of the Detection Sensitivities of Proton-Transfer Reaction Mass Spectrometry for Gaseous 2-Propanol and Acetic Acid, B. Chem. Soc. Jpn., 83, 900–904, https://doi.org/10.1246/bcsj.20100043, 2010. a
IPCC: Climate Change 2013: The Physical Science Basis, Contribution of Working Group I to the Fifth Assessment Report of the Intergovernmental Panel on Climate Change, Cambridge University Press, Cambridge, UK and New York, NY, USA, 2013. a
Jacob, D. J., Field, B. D., Li, Q., Blake, D. R., de Gouw, J., Warneke, C., Hansel, A., Wisthaler, A., Singh, H. B., and Guenther, A.: Global budget of methanol: Constraints from atmospheric observations, J. Geophys. Res.-Atmos., 110, D08303, https://doi.org/10.1029/2004JD005172, 2005. a
Jaffe, D. A. and Wigder, N. L.: Ozone production from wildfires: A critical review, Atmos. Environ., 51, 1–10, https://doi.org/10.1016/j.atmosenv.2011.11.063, 2012. a, b, c
Jost, C., Trentmann, J., Sprung, D., Andreae, M. O., and Dewey, K.: Deposition of acetonitrile to the Atlantic Ocean off Namibia and Angola and its implications for the atmospheric budget of acetonitrile, Geophys. Res. Lett., 30, 1837–1841, https://doi.org/10.1029/2003GL017347, 2003. a, b, c, d
Kaiser, J. W., Heil, A., Andreae, M. O., Benedetti, A., Chubarova, N., Jones, L., Morcrette, J.-J., Razinger, M., Schultz, M. G., Suttie, M., and van der Werf, G. R.: Biomass burning emissions estimated with a global fire assimilation system based on observed fire radiative power, Biogeosciences, 9, 527–554, https://doi.org/10.5194/bg-9-527-2012, 2012. a
Khan, M. A. H., Lyons, K., Chhantyal-Pun, R., McGillen, M. R., Caravan, R. L., Taatjes, C. A., Orr-Ewing, A. J., Percival, C. J., and Shallcross, D. E.: Investigating the Tropospheric Chemistry of Acetic Acid Using the Global 3-D Chemistry Transport Model, STOCHEM-CRI, J. Geophys. Res.-Atmos., 123, 6267–6281, https://doi.org/10.1029/2018JD028529, 2018. a
Kreher, K., Van Roozendael, M., Hendrick, F., Apituley, A., Dimitropoulou, E., Frieß, U., Richter, A., Wagner, T., Lampel, J., Abuhassan, N., Ang, L., Anguas, M., Bais, A., Benavent, N., Bösch, T., Bognar, K., Borovski, A., Bruchkouski, I., Cede, A., Chan, K. L., Donner, S., Drosoglou, T., Fayt, C., Finkenzeller, H., Garcia-Nieto, D., Gielen, C., Gómez-Martín, L., Hao, N., Henzing, B., Herman, J. R., Hermans, C., Hoque, S., Irie, H., Jin, J., Johnston, P., Khayyam Butt, J., Khokhar, F., Koenig, T. K., Kuhn, J., Kumar, V., Liu, C., Ma, J., Merlaud, A., Mishra, A. K., Müller, M., Navarro-Comas, M., Ostendorf, M., Pazmino, A., Peters, E., Pinardi, G., Pinharanda, M., Piters, A., Platt, U., Postylyakov, O., Prados-Roman, C., Puentedura, O., Querel, R., Saiz-Lopez, A., Schönhardt, A., Schreier, S. F., Seyler, A., Sinha, V., Spinei, E., Strong, K., Tack, F., Tian, X., Tiefengraber, M., Tirpitz, J.-L., van Gent, J., Volkamer, R., Vrekoussis, M., Wang, S., Wang, Z., Wenig, M., Wittrock, F., Xie, P. H., Xu, J., Yela, M., Zhang, C., and Zhao, X.: Intercomparison of NO2, O4, O3 and HCHO slant column measurements by MAX-DOAS and zenith-sky UV–visible spectrometers during CINDI-2, Atmos. Meas. Tech., 13, 2169–2208, https://doi.org/10.5194/amt-13-2169-2020, 2020. a, b
Lamarque, J.-F., Bond, T. C., Eyring, V., Granier, C., Heil, A., Klimont, Z., Lee, D., Liousse, C., Mieville, A., Owen, B., Schultz, M. G., Shindell, D., Smith, S. J., Stehfest, E., Van Aardenne, J., Cooper, O. R., Kainuma, M., Mahowald, N., McConnell, J. R., Naik, V., Riahi, K., and van Vuuren, D. P.: Historical (1850–2000) gridded anthropogenic and biomass burning emissions of reactive gases and aerosols: methodology and application, Atmos. Chem. Phys., 10, 7017–7039, https://doi.org/10.5194/acp-10-7017-2010, 2010. a
Lefer, B. L., Talbot, R. W., Harriss, R. H., Bradshaw, J. D., Sandholm, S. T., Olson, J. O., Sachse, G. W., Collins, J., Shipham, M. A., Blake, D. R., Klemm, K. I., Klemm, O., Gorzelska, K., and Barrick, J.: Enhancement of acidic gases in biomass burning impacted air masses over Canada, J. Geophys. Res.-Atmos., 99, 1721–1737, https://doi.org/10.1029/93JD02091, 1994. a, b, c
Lesouëf, D., Gheusi, F., Delmas, R., and Escobar, J.: Numerical simulations of local circulations and pollution transport over Reunion Island, Ann. Geophys., 29, 53–69, https://doi.org/10.5194/angeo-29-53-2011, 2011. a, b, c
Lewis, A. C., Hopkins, J. R., Carpenter, L. J., Stanton, J., Read, K. A., and Pilling, M. J.: Sources and sinks of acetone, methanol, and acetaldehyde in North Atlantic marine air, Atmos. Chem. Phys., 5, 1963–1974, https://doi.org/10.5194/acp-5-1963-2005, 2005. a
Mallet, P.-E., Pujol, O., Brioude, J., Evan, S., and Jensen, A.: Marine aerosol distribution and variability over the pristine Southern Indian Ocean, Atmos. Environ., 182, 17–30, https://doi.org/10.1016/j.atmosenv.2018.03.016, 2018. a
Mellouki, A., Wallington, T. J., and Chen, J.: Atmospheric Chemistry of Oxygenated Volatile Organic Compounds: Impacts on Air Quality and Climate, Chem. Rev., 115, 3984–4014, https://doi.org/10.1021/cr500549n, 2015. a
Millet, D. B., Guenther, A., Siegel, D. A., Nelson, N. B., Singh, H. B., de Gouw, J. A., Warneke, C., Williams, J., Eerdekens, G., Sinha, V., Karl, T., Flocke, F., Apel, E., Riemer, D. D., Palmer, P. I., and Barkley, M.: Global atmospheric budget of acetaldehyde: 3-D model analysis and constraints from in-situ and satellite observations, Atmos. Chem. Phys., 10, 3405–3425, https://doi.org/10.5194/acp-10-3405-2010, 2010. a
Millet, D. B., Baasandorj, M., Farmer, D. K., Thornton, J. A., Baumann, K., Brophy, P., Chaliyakunnel, S., de Gouw, J. A., Graus, M., Hu, L., Koss, A., Lee, B. H., Lopez-Hilfiker, F. D., Neuman, J. A., Paulot, F., Peischl, J., Pollack, I. B., Ryerson, T. B., Warneke, C., Williams, B. J., and Xu, J.: A large and ubiquitous source of atmospheric formic acid, Atmos. Chem. Phys., 15, 6283–6304, https://doi.org/10.5194/acp-15-6283-2015, 2015. a
Monks, P. S., Archibald, A. T., Colette, A., Cooper, O., Coyle, M., Derwent, R., Fowler, D., Granier, C., Law, K. S., Mills, G. E., Stevenson, D. S., Tarasova, O., Thouret, V., von Schneidemesser, E., Sommariva, R., Wild, O., and Williams, M. L.: Tropospheric ozone and its precursors from the urban to the global scale from air quality to short-lived climate forcer, Atmos. Chem. Phys., 15, 8889–8973, https://doi.org/10.5194/acp-15-8889-2015, 2015. a
Monod, A., Sive, B. C., Avino, P., Chen, T., Blake, D. R., and Rowland, F. S.: Monoaromatic compounds in ambient air of various cities: a focus on correlations between the xylenes and ethylbenzene, Atmos. Environ., 35, 135–149, https://doi.org/10.1016/S1352-2310(00)00274-0, 2001. a
Orlando, J. J. and Tyndall, G. S.: The atmospheric oxidation of hydroxyacetone: Chemistry of activated and stabilized CH3C(O)CH(OH)OO⋅ radicals between 252 and 298 K, Int. J. Chem. Kinet., 52, 236–250, https://doi.org/10.1002/kin.21346, 2020. a
Orlando, J. J., Tyndall, G. S., and Taraborrelli, D.: Atmospheric Oxidation of Two Isoprene By-Products, Hydroxyacetone and Glycolaldehyde, in: AGU Fall Meeting Abstracts, 3–7 December 2012, San-Francisco, California, USA, vol. 2012, A33L–0315, 2012. a
Parrington, M., Palmer, P. I., Lewis, A. C., Lee, J. D., Rickard, A. R., Di Carlo, P., Taylor, J. W., Hopkins, J. R., Punjabi, S., Oram, D. E., Forster, G., Aruffo, E., Moller, S. J., Bauguitte, S. J.-B., Allan, J. D., Coe, H., and Leigh, R. J.: Ozone photochemistry in boreal biomass burning plumes, Atmos. Chem. Phys., 13, 7321–7341, https://doi.org/10.5194/acp-13-7321-2013, 2013. a
Paulot, F., Wunch, D., Crounse, J. D., Toon, G. C., Millet, D. B., DeCarlo, P. F., Vigouroux, C., Deutscher, N. M., González Abad, G., Notholt, J., Warneke, T., Hannigan, J. W., Warneke, C., de Gouw, J. A., Dunlea, E. J., De Mazière, M., Griffith, D. W. T., Bernath, P., Jimenez, J. L., and Wennberg, P. O.: Importance of secondary sources in the atmospheric budgets of formic and acetic acids, Atmos. Chem. Phys., 11, 1989–2013, https://doi.org/10.5194/acp-11-1989-2011, 2011. a, b
Pisso, I., Sollum, E., Grythe, H., Kristiansen, N. I., Cassiani, M., Eckhardt, S., Arnold, D., Morton, D., Thompson, R. L., Groot Zwaaftink, C. D., Evangeliou, N., Sodemann, H., Haimberger, L., Henne, S., Brunner, D., Burkhart, J. F., Fouilloux, A., Brioude, J., Philipp, A., Seibert, P., and Stohl, A.: The Lagrangian particle dispersion model FLEXPART version 10.4, Geosci. Model Dev., 12, 4955–4997, https://doi.org/10.5194/gmd-12-4955-2019, 2019. a
Platt, U. and Stutz, J.: Differential optical absorption spectroscopy – principles and applications, Springer, Heidelberg, Germany, 2008. a
Read, K. A., Carpenter, L. J., Arnold, S. R., Beale, R., Nightingale, P. D., Hopkins, J. R., Lewis, A. C., Lee, J. D., Mendes, L., and Pickering, S. J.: Multiannual observations of acetone, methanol, and acetaldehyde in remote tropical atlantic air: implications for atmospheric OVOC budgets and oxidative capacity, Environ. Sci. Technol., 46, 11028–11039, https://doi.org/10.1021/es302082p, 2012. a
Rémy, S., Veira, A., Paugam, R., Sofiev, M., Kaiser, J. W., Marenco, F., Burton, S. P., Benedetti, A., Engelen, R. J., Ferrare, R., and Hair, J. W.: Two global data sets of daily fire emission injection heights since 2003, Atmos. Chem. Phys., 17, 2921–2942, https://doi.org/10.5194/acp-17-2921-2017, 2017. a
Rocco, M., Colomb, A., Baray, J.-L., Amelynck, C., Verreyken, B., Borbon, A., Pichon, J.-M., Bouvier, L., Schoon, N., Gros, V., Sarda-Esteve, R., Tulet, P., Metzger, J.-M., Duflot, V., Guadagno, C., Peris, G., and Brioude, J.: Analysis of Volatile Organic Compounds during the OCTAVE Campaign: Sources and Distributions of Formaldehyde on Reunion Island, Atmosphere, 11, 110, https://doi.org/10.3390/atmos11020140, 2020. a
Saunders, S. M., Jenkin, M. E., Derwent, R. G., and Pilling, M. J.: Protocol for the development of the Master Chemical Mechanism, MCM v3 (Part A): tropospheric degradation of non-aromatic volatile organic compounds, Atmos. Chem. Phys., 3, 161–180, https://doi.org/10.5194/acp-3-161-2003, 2003. a
Schwarz, K., Filipiak, W., and Amann, A.: Determining concentration patterns of volatile compounds in exhaled breath by PTR-MS, J. Breath Res., 3, 027002, https://doi.org/10.1088/1752-7155/3/2/027002, 2009. a
Sindelarova, K., Granier, C., Bouarar, I., Guenther, A., Tilmes, S., Stavrakou, T., Müller, J.-F., Kuhn, U., Stefani, P., and Knorr, W.: Global data set of biogenic VOC emissions calculated by the MEGAN model over the last 30 years, Atmos. Chem. Phys., 14, 9317–9341, https://doi.org/10.5194/acp-14-9317-2014, 2014. a
Singh, H. B., O'Hara, D., Herlth, D., Sachse, W., Blake, D. R., Bradshaw, J. D., Kanakidou, M., and Crutzen, P. J.: Acetone in the atmosphere: Distribution, sources, and sinks, J. Geophys. Res.-Atmos., 99, 1805–1819, https://doi.org/10.1029/93JD00764, 1994. a
Sinreich, R., Merten, A., Molina, L., and Volkamer, R.: Parameterizing radiative transfer to convert MAX-DOAS dSCDs into near-surface box-averaged mixing ratios, Atmos. Meas. Tech., 6, 1521–1532, https://doi.org/10.5194/amt-6-1521-2013, 2013. a
Stavrakou, T., Müller, J.-F., Peeters, J., Razavi, A., Clarisse, L., Clerbaux, C., Coheur, P.-F., Hurtmans, D., Mazière, M. D., Vigouroux, C., Deutscher, N. M., Griffith, D. W. T., Jones, N., and Paton-Walsh, C.: Satellite evidence for a large source of formic acid from boreal and tropical forests, Nat. Geosci., 5, 26–30, https://doi.org/10.1038/ngeo1354, 2012. a
Stavrakou, T., Müller, J.-F., Bauwens, M., De Smedt, I., Van Roozendael, M., De Mazière, M., Vigouroux, C., Hendrick, F., George, M., Clerbaux, C., Coheur, P.-F., and Guenther, A.: How consistent are top-down hydrocarbon emissions based on formaldehyde observations from GOME-2 and OMI?, Atmos. Chem. Phys., 15, 11861–11884, https://doi.org/10.5194/acp-15-11861-2015, 2015. a
Stohl, A. and Thomson, D. J.: A Density Correction for Lagrangian Particle Dispersion Models, Bound.-Lay. Meteorol., 90, 155–167, https://doi.org/10.1023/A:1001741110696, 1999. a
Stohl, A., Hittenberger, M., and Wotawa, G.: Validation of the Lagrangian particle dispersion model FLEXPART against large-scale tracer experiment data, Atmos. Environ., 32, 4245–4264, https://doi.org/10.1016/S1352-2310(98)00184-8, 1998. a
Stohl, A., Forster, C., Frank, A., Seibert, P., and Wotawa, G.: Technical note: The Lagrangian particle dispersion model FLEXPART version 6.2, Atmos. Chem. Phys., 5, 2461–2474, https://doi.org/10.5194/acp-5-2461-2005, 2005. a
Su, T.: Parametrization of kinetic energy dependences of ion–polar molecule collision rate constants by trajectory calculations, J. Chem. Phys., 100, 4703–4703, https://doi.org/10.1063/1.466255, 1994. a
Taupin, F. G., Beekmann, M., Brémaud, P. J., and Randriambelo, T.: Ozone generation over the Indian Ocean during the South African biomass-burning period: case study of October 1992, Ann. Geophys., 20, 547–557, https://doi.org/10.5194/angeo-20-547-2002, 2002. a
Thalman, R. and Volkamer, R.: Temperature dependent absorption cross-sections of O2–O2 collision pairs between 340 and 630 nm and at atmospherically relevant pressure, Phys. Chem. Chem. Phys., 15, 15371–15381, https://doi.org/10.1039/C3CP50968K, 2013. a
Travis, K. R., Heald, C. L., Allen, H. M., Apel, E. C., Arnold, S. R., Blake, D. R., Brune, W. H., Chen, X., Commane, R., Crounse, J. D., Daube, B. C., Diskin, G. S., Elkins, J. W., Evans, M. J., Hall, S. R., Hintsa, E. J., Hornbrook, R. S., Kasibhatla, P. S., Kim, M. J., Luo, G., McKain, K., Millet, D. B., Moore, F. L., Peischl, J., Ryerson, T. B., Sherwen, T., Thames, A. B., Ullmann, K., Wang, X., Wennberg, P. O., Wolfe, G. M., and Yu, F.: Constraining remote oxidation capacity with ATom observations, Atmos. Chem. Phys., 20, 7753–7781, https://doi.org/10.5194/acp-20-7753-2020, 2020. a
Vandaele, A., Hermans, C., Simon, P., Carleer, M., Colin, R., Fally, S., Mérienne, M., Jenouvrier, A., and Coquart, B.: Measurements of the NO2 absorption cross-section from 42 000 cm−1 to 10 000 cm−1 (238–1000 nm) at 220 K and 294 K, J. Quant. Spectrosc. Ra., 59, 171–184, https://doi.org/10.1016/S0022-4073(97)00168-4, 1998. a
Verreyken, B., Brioude, J., and Evan, S.: Development of turbulent scheme in the FLEXPART-AROME v1.2.1 Lagrangian particle dispersion model, Geosci. Model Dev., 12, 4245–4259, https://doi.org/10.5194/gmd-12-4245-2019, 2019. a
Vigouroux, C., Stavrakou, T., Whaley, C., Dils, B., Duflot, V., Hermans, C., Kumps, N., Metzger, J.-M., Scolas, F., Vanhaelewyn, G., Müller, J.-F., Jones, D. B. A., Li, Q., and De Mazière, M.: FTIR time-series of biomass burning products (HCN, C2H6, C2H2, CH3OH, and HCOOH) at Reunion Island (21∘ S, 55∘ E) and comparisons with model data, Atmos. Chem. Phys., 12, 10367–10385, https://doi.org/10.5194/acp-12-10367-2012, 2012. a, b, c, d, e
Wang, S., Hornbrook, R. S., Hills, A., Emmons, L. K., Tilmes, S., Lamarque, J.-F., Jimenez, J. L., Campuzano-Jost, P., Nault, B. A., Crounse, J. D., Wennberg, P. O., Kim, M., Allen, H., Ryerson, T. B., Thompson, C. R., Peischl, J., Moore, F., Nance, D., Hall, B., Elkins, J., Tanner, D., Huey, L. G., Hall, S. R., Ullmann, K., Orlando, J. J., Tyndall, G. S., Flocke, F. M., Ray, E., Hanisco, T. F., Wolfe, G. M., St. Clair, J., Commane, R., Daube, B., Barletta, B., Blake, D. R., Weinzierl, B., Dollner, M., Conley, A., Vitt, F., Wofsy, S. C., Riemer, D. D., and Apel, E. C.: Atmospheric Acetaldehyde: Importance of Air-Sea Exchange and a Missing Source in the Remote Troposphere, Geophys. Res. Lett., 46, 5601–5613, https://doi.org/10.1029/2019GL082034, 2019. a
Yokelson, R. J., Goode, J. G., Ward, D. E., Susott, R. A., Babbitt, R. E., Wade, D. D., Bertschi, I., Griffith, D. W. T., and Hao, W. M.: Emissions of formaldehyde, acetic acid, methanol, and other trace gases from biomass fires in North Carolina measured by airborne Fourier transform infrared spectroscopy, J. Geophys. Res.-Atmos., 104, 30109–30125, https://doi.org/10.1029/1999JD900817, 1999. a
Yokelson, R. J., Bertschi, I. T., Christian, T. J., Hobbs, P. V., Ward, D. E., and Hao, W. M.: Trace gas measurements in nascent, aged, and cloud-processed smoke from African savanna fires by airborne Fourier transform infrared spectroscopy (AFTIR), J. Geophys. Res.-Atmos., 108, 8478, https://doi.org/10.1029/2002JD002322, 2003. a
Yokelson, R. J., Christian, T. J., Karl, T. G., and Guenther, A.: The tropical forest and fire emissions experiment: laboratory fire measurements and synthesis of campaign data, Atmos. Chem. Phys., 8, 3509–3527, https://doi.org/10.5194/acp-8-3509-2008, 2008. a, b
Zhao, Y., Saunois, M., Bousquet, P., Lin, X., Berchet, A., Hegglin, M. I., Canadell, J. G., Jackson, R. B., Hauglustaine, D. A., Szopa, S., Stavert, A. R., Abraham, N. L., Archibald, A. T., Bekki, S., Deushi, M., Jöckel, P., Josse, B., Kinnison, D., Kirner, O., Marécal, V., O'Connor, F. M., Plummer, D. A., Revell, L. E., Rozanov, E., Stenke, A., Strode, S., Tilmes, S., Dlugokencky, E. J., and Zheng, B.: Inter-model comparison of global hydroxyl radical (OH) distributions and their impact on atmospheric methane over the 2000–2016 period, Atmos. Chem. Phys., 19, 13701–13723, https://doi.org/10.5194/acp-19-13701-2019, 2019. a
Zhou, M., Langerock, B., Vigouroux, C., Sha, M. K., Ramonet, M., Delmotte, M., Mahieu, E., Bader, W., Hermans, C., Kumps, N., Metzger, J.-M., Duflot, V., Wang, Z., Palm, M., and De Mazière, M.: Atmospheric CO and CH4 time series and seasonal variations on Reunion Island from ground-based in situ and FTIR (NDACC and TCCON) measurements, Atmos. Chem. Phys., 18, 13881–13901, https://doi.org/10.5194/acp-18-13881-2018, 2018. a, b, c
- Abstract
- Introduction
- Observations and methods
- Results
- Discussion
- Conclusions
- Appendix A: In situ measurement data visualisation
- Appendix B: NO2 coincidence with FLEXPART simulations
- Data availability
- Author contributions
- Competing interests
- Disclaimer
- Acknowledgements
- Financial support
- Review statement
- References