the Creative Commons Attribution 4.0 License.
the Creative Commons Attribution 4.0 License.
 | 02 Dec 2020
Significant wintertime PM2.5 mitigation in the Yangtze River Delta, China, from 2016 to 2019: observational constraints on anthropogenic emission controls
Liqiang Wang
Pengfei Li
Xue Chen
Zhen Li
Yibo Zhang
Mengying Li
Khalid Mehmood
Weiping Liu
Tianfeng Chai
Yannian Zhu
Daniel Rosenfeld
John H. Seinfeld
Ambient fine particulate matter (PM2.5) mitigation relies strongly on anthropogenic emission control measures, the actual effectiveness of which is challenging to pinpoint owing to the complex synergies between anthropogenic emissions and meteorology. Here, observational constraints on model simulations allow us to derive not only reliable PM2.5 evolution but also accurate meteorological fields. On this basis, we isolate meteorological factors to achieve reliable estimates of surface PM2.5 responses to both long-term and emergency emission control measures from 2016 to 2019 over the Yangtze River Delta (YRD), China. The results show that long-term emission control strategies play a crucial role in curbing PM2.5 levels, especially in the megacities and other areas with abundant anthropogenic emissions. The G20 summit hosted in Hangzhou in 2016 provides a unique and ideal opportunity involving the most stringent, even unsustainable, emergency emission control measures. These emergency measures lead to the largest decrease (∼ 35 µg m−3, ∼ 59 %) in PM2.5 concentrations in Hangzhou. The hotspots also emerge in megacities, especially in Shanghai (32 µg m−3, 51 %), Nanjing (27 µg m−3, 55 %), and Hefei (24 µg m−3, 44 %) because of the emergency measures. Compared to the long-term policies from 2016 to 2019, the emergency emission control measures implemented during the G20 Summit achieve more significant decreases in PM2.5 concentrations (17 µg m−3 and 41 %) over most of the whole domain, especially in Hangzhou (24 µg m−3, 48 %) and Shanghai (21 µg m−3, 45 %). By extrapolation, we derive insight into the magnitude and spatial distribution of PM2.5 mitigation potential across the YRD, revealing significantly additional room for curbing PM2.5 levels.
- Article
(11295 KB) - Full-text XML
-
Supplement
(3530 KB) - BibTeX
- EndNote


Anthropogenically induced fine particulate matter (particulate matter with an aerodynamic diameter smaller than 2.5 µm, hereinafter denoted as PM2.5) is a principal object of air pollution control in China (Huang et al., 2014; Zhang et al., 2015). Moreover, the government has made major strides in curbing anthropogenic emissions (e.g., SO2, NOx, and CO) via both long-term and emergency measures during the past decade (Yan et al., 2018; Yang et al., 2019; Zhang et al., 2012). However, owing to the complex synergy of chemistry and meteorology (Seinfeld and Pandis, 2016), the extent to which these measures have abated PM2.5 pollution, as well as the attainable mitigation potential, remains unclear (An et al., 2019).
The main challenge involves reliably representing substantial and rapid changes in anthropogenic emissions resulting from both long-term and emergency control measures (Chen et al., 2019; Cheng et al., 2019; Yang et al., 2016; Zhai et al., 2019; Zhang et al., 2019; Zhong et al., 2018). To gain timely insight into variations in anthropogenic emissions, considerable efforts went into establishing detailed bottom-up emissions and derived valuable findings (Cheng et al., 2019; Zhang et al., 2019). Yet bottom-up inventories were built on the basis of activity data as well as emission factors. These input data can be absent or outdated, likely leading to misunderstandings of anthropogenic impacts, particularly in terms of the magnitude (Jiang et al., 2018). Recent studies applied available observations to construct multilinear regression models (emission-based or meteorology-related), thus allowing us to separate contributions from anthropogenic emissions and meteorology to some extent (Zhai et al., 2019; Zhong et al., 2018). However, the uncertainties in bottom-up inventories and meteorology remained. Here we switched to observational constraints on a state-of-the-art chemical model. This can be a potential way to tackle this challenge.
Since 2013, the China National Environmental Monitoring Center (CNEMC) has established 1415 ground-based PM2.5 measurement sites across 367 key cities (Zhang and Cao, 2015). In contrast to satellite observations with sparse spatiotemporal coverage (Ma et al., 2014, 2015; Xue et al., 2019), these ground sites can provide hourly PM2.5 concentrations at high spatial resolution in urban areas. Data assimilation (DA) methods that have been widely used in meteorology can be extended to integrate those continuous observational constraints with chemical transport models (CTMs) (Bocquet et al., 2015; Chai et al., 2017; Gao et al., 2017; Jung et al., 2019; Ma et al., 2019). It has been demonstrated that the capability of several representative DA methods, such as the optimal interpolation (OI) (Chai et al., 2017), 3D and 4D variational methods (Li et al., 2016), and the ensemble Kalman filter algorithm (Chen et al., 2019), can bridge the estimation gaps between observed and simulated results. Thus, observational constraints can be taken full advantage of to identify the effects of anthropogenic emission controls.
From the perspective of policymaking, 2016 was a special year for air pollution control in China. Since 2013, the Chinese government instituted extensive policies, such as the Air Pollution Prevention and Control Action Plan. These strategies were initiated and implemented through generally shutting down or relocating high-emission traditional industrial enterprises (Sheehan et al., 2014; Shi et al., 2016; Xie et al., 2015). Starting from 1 January 2016, the relevant law, as well as the “Blue Sky Battle Plan”, came into full effect and profoundly shifted how China prioritized air quality management (Feng and Liao, 2016; K. Li et al., 2019). Hence, we address the impact of long-term emission control strategies on PM2.5 mitigation from 2016 onward.
The G20 summit hosted in Hangzhou in 2016 (hereinafter termed the G20 summit) provides a unique and ideal opportunity to further explore the attainable PM2.5 mitigation potential across the Yangtze River Delta (YRD) (P. Li et al., 2017; Ma et al., 2019; Shu et al., 2020; Yang et al., 2019). Prior to and during this period, the Chinese government enforced the historically strictest, even unsustainable, emergency emission control measures, including significant control and even cessation of factory operations and restrictions on vehicles in the region, thus achieving significant PM2.5 abatement at specific locations (e.g., Hangzhou) (Ji et al., 2018; P. Li et al., 2017; Yang et al., 2019). Those measures were conducted across the whole YRD (including Zhejiang province, Shanghai municipality, Jiangsu province, and Anhui province), particularly in Hangzhou, which served as the host city (H. Li et al., 2019; P. Li et al., 2017; Ni et al., 2020; Yu et al., 2018). Li et al. (2017) assumed that most of anthropogenic emissions (e.g., those from industry, power plant, residential, and on-road transportation sectors) were reduced by around 50 %. The role of these emergency emission control measures, that is, the relatively localized PM2.5 mitigation potential, can thus be identified and further extended to the entire YRD.
To quantify the effectiveness of the emission control strategies, we constrained a state-of-the-art CTM by a reliable DA method with extensive chemical and meteorological observations. This comprehensive technical design provides a crucial advance in isolating the influences of emission changes and meteorological perturbations over the YRD from 2016 to 2019, thus deriving estimates of PM2.5 responses to both long-term and emergency emission control measures, and establishing the first map of the PM2.5 mitigation potential across the YRD.
2.1 The two-way coupled WRF-CMAQ model
The two-way coupled Weather Research and Forecasting (WRF) and Community Multiscale Air Quality (CMAQ) model (the WRF-CMAQ model), as the key core of the DA system, was applied to investigate the ambient PM2.5 feedbacks under different constraining circumstances (Byun and Schere, 2006; Wong et al., 2012; Yu et al., 2014). We utilized the CB05 and AERO6 modules for gas-phase chemistry and aerosol evolution (Carlton et al., 2010; Yarwood et al., 2005), respectively. Both secondary inorganic and organic aerosol (i.e., SIA and SOA) were thus explicitly treated with the AERO6 scheme in the WRF-CMAQ model. Together with the ISORROPIA II thermodynamic equilibrium module (Fountoukis and Nenes, 2007), SIA in the Aitken and accumulation modes (Binkowski and Roselle, 2003) was assumed to be in thermodynamic equilibrium with the gas phase, while that in the coarse mode was treated dynamically. SOA was formed via gas-, aqueous-, and aerosol-phase oxidation processes, such as in-cloud oxidation of glyoxal and methylglyoxal, absorptive partitioning of condensable oxidation of monoterpenes, long-chain alkanes, low-yield aromatic products (based on m-xylene data), high-yield aromatics, and NOx-dependent yields from aromatic compounds (Carlton et al., 2010). The subsequent reaction products can be divided into two groups: non-volatile and semi-volatile. Such treatments have been widely used and comprehensively validated. Longwave and shortwave radiation were both treated using the RRTMG radiation scheme (Clough et al., 2005). Related land surface energy balance and planetary boundary layer simulations were included in the Pleim–Xiu land surface scheme (Xiu and Pleim, 2001) and the asymmetric convective model (Pleim, 2007b, a), respectively. The two-moment Morrison cloud microphysics scheme (Morrison and Gettelman, 2008) and the Kain–Fritsch cumulus cloud scheme (Kain, 2004) were employed for simulating aerosol–cloud interactions and precipitation. Default settings in the model were used to prescribe chemical initial and boundary conditions. A spin-up period of 7 d was carried out in advance to eliminate artifacts associated with initial conditions. Meteorological initial and boundary conditions were obtained from the ECMWF reanalysis dataset with the spatial resolution of 1∘ × 1∘ and temporal resolution of 6 h (https://www.ecmwf.int/en/forecasts/datasets/browse-reanalysis-datasets, last access: 7 March 2020). Biogenic and dust emissions were calculated on-line using the Biogenic Emission Inventory System version 3.14 (BEISv3.14) (Carlton and Baker, 2011) and a windblown dust scheme embedded in CMAQ (Choi and Fernando, 2008), respectively.
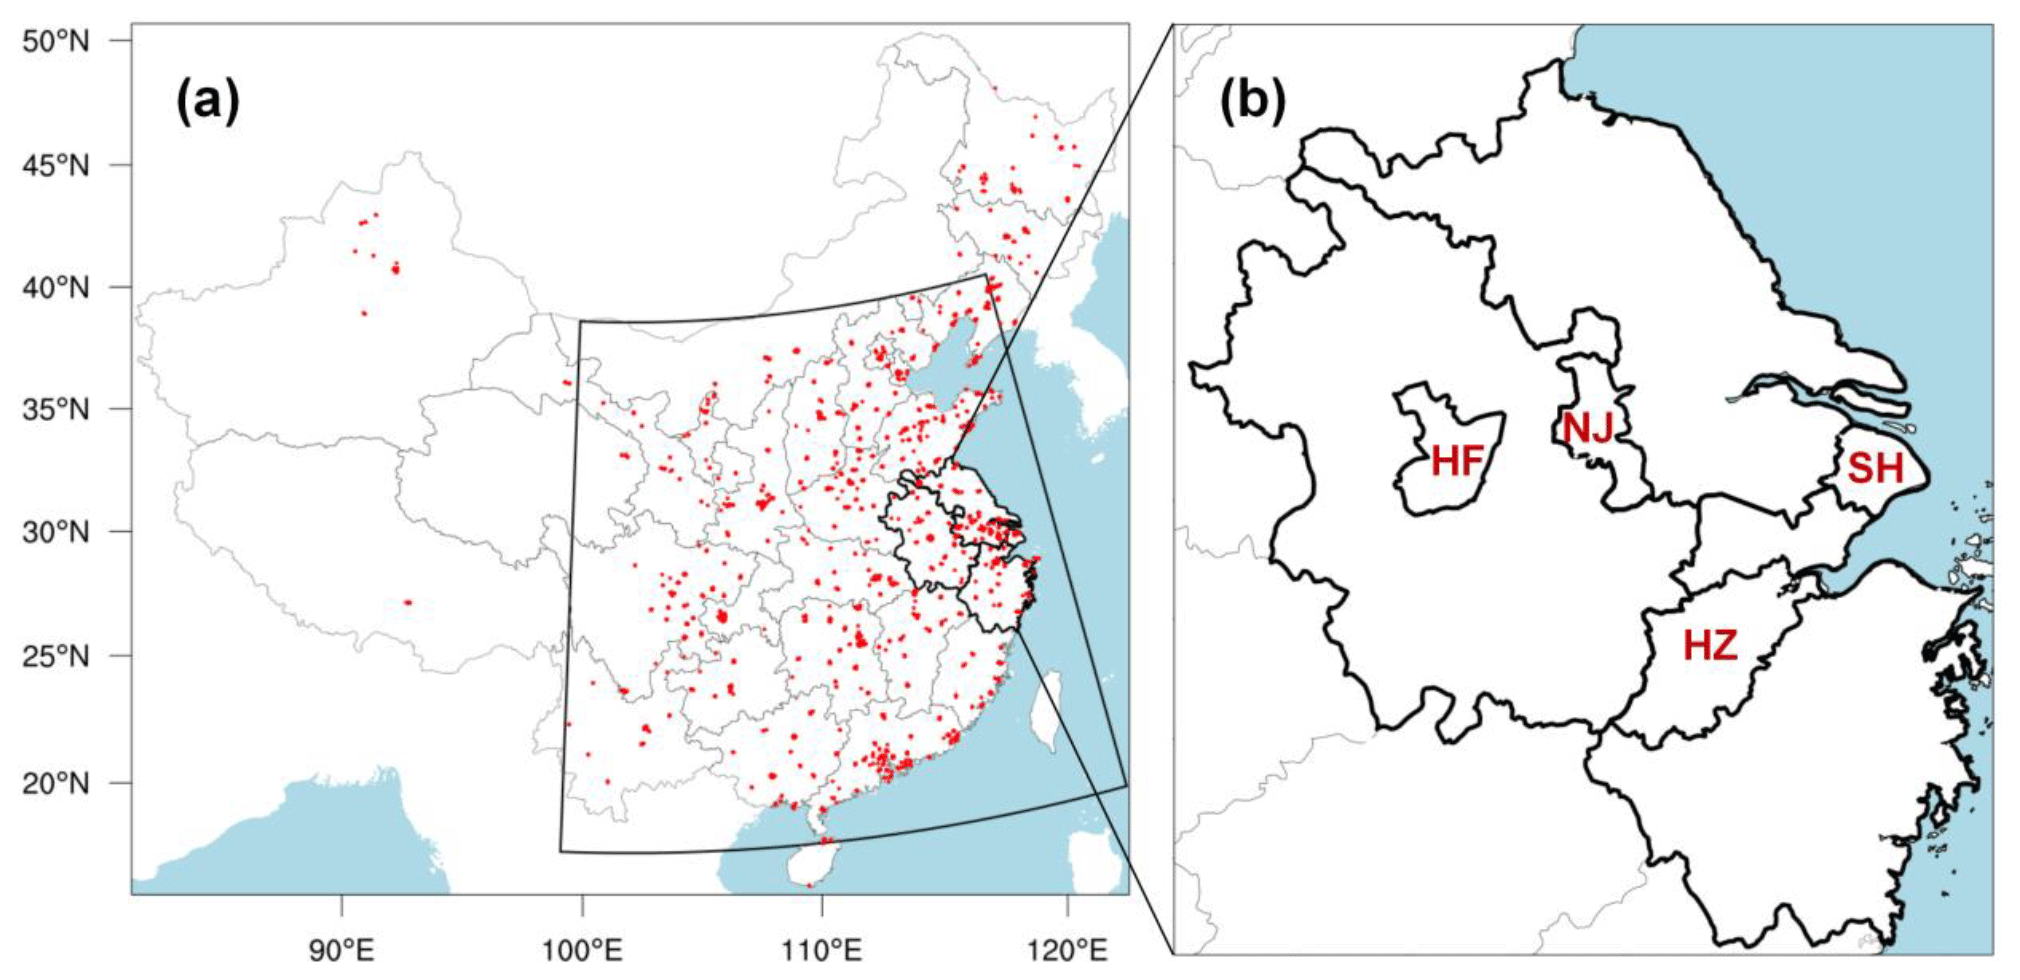
Figure 1(a) The model domain. Red dots denote the ground-level PM2.5 measurements, which, within the fan-shaped quadrilateral, are used to constrain the model predictions. (b) Black lines outline the boundaries of the Yangtze River Delta (YRD), as well as the four major cities considered (i.e., SH: Shanghai; HZ: Hangzhou; NJ: Nanjing; HF: Hefei).
The horizontal domain of the model covered mainland China by a 395 × 345 grid with a 12 km horizontal resolution following a Lambert conformal conic projection (Fig. 1). In terms of the vertical configuration, 29σ-pressure layers ranged from the surface to the upper level pressure of 100 hPa, 20 layers of which are located below around 3 km to derive finer meteorological and chemical characteristics within the planetary boundary layer.
As a state-of-the-art CTM, the WRF-CMAQ model has been widely used to simulate spatiotemporal PM2.5 distributions at regional scales. However, model biases remain, mainly due to imperfect representations of chemical and meteorological processes. Inaccurate anthropogenic emissions will exacerbate these biases. Therefore, external constraints on simulated results enforced by the DA method will be taken into account in order to optimize spatiotemporal PM2.5 distributions (Bocquet et al., 2015).
2.2 Anthropogenic emissions
The anthropogenic emissions were obtained from the Multi-resolution Emission Inventory for China version 1.2 (MEIC) (M. Li et al., 2017), which contained primary species (e.g., primary PM2.5, SO2, NOx, CO, and NH4) from five anthropogenic sectors (i.e., agriculture, power plant, industry, residential, and transportation). This inventory was initially designed with the spatial resolution of 0.25∘ × 0.25∘ and thus needed to be reallocated to match the domain configuration (i.e., 12 km × 12 km) in the study.
Recent findings show that MEIC generally provides reasonable estimates of total anthropogenic emissions for several typical regions in China, such as the Beijing–Tianjin–Hebei region (BTH), the YRD, and the Pearl River Delta region (M. Li et al., 2017). Nevertheless, large uncertainties in spatial proxies (e.g., population density and road networks) still exist within these specific regions (Geng et al., 2017). Moreover, MEIC was originally constructed for the 2016 base year. Hence, owing to the impact of the long-term emission control measures, MEIC was considered to be inappropriate for this study period (i.e., 2019). Comparatively, emergency control measures could give rise to much more significant emission controls in the short term, thereby leading to further uncertainties.
2.3 Observational network
To track real-time air quality in China, the National Environmental Monitoring Center (CNEMC, http://www.cnemc.cn/, last access: 7 March 2020) has established 1415 sites across 367 cities since 2013 (Fig. 1). Among these, 244 monitoring sites were densely distributed in 6660 grid cells across the YRD providing hourly PM2.5 measurements, resulting in potentially excellent roles in constraining simulated PM2.5 (Bocquet et al., 2015). In this study, we applied observed PM2.5 concentrations to constrain and evaluate the model performance. It is worth noting that the constraining capability of those observations varies depending on specific configurations (e.g., the nature of the utilized DA method, the assimilation frequency, and the representative errors of observations) (Bocquet et al., 2015; Chai et al., 2017; Ma et al., 2019; Rutherford, 1972). As shown in Fig. 1a, to consider regional impacts outside the YRD, the ground-level observations in the fan-shaped quadrilateral were used to constrain the model performance. This was mainly due to the fact that this fan-shaped geographical scope covered almost all key regions that had potentially regional impacts on the YRD, involving the Beijing–Tianjin–Hebei region, the Pearl River Delta region, the Sichuan-Chongqing region, and the Shaanxi-Gansu region (Zhang et al., 2019). On the other hand, the ground monitoring sites within the fan-shaped quadrilateral were significantly denser than those outside it, thus leading to much more effective DA results in practice (Bocquet et al., 2015; Chai et al., 2017). Collectively, assimilating the observations in the fan-shaped quadrilateral might be a sensible way to balance the DA effectiveness and the computing efficiency. A resultant evidence lies in the model performance evaluation in Sect. 3.1, which would prove that this DA configuration can enable reliable PM2.5 simulations.
2.4 Optimal interpolation
Optimal interpolation (OI) was chosen to assimilate hourly observations into the WRF-CMAQ model, aiming to generate the accurate state of spatiotemporal PM2.5 distributions. Compared to the solely model-dependent results, this constraining method relies on observations and thus makes it possible to minimize model uncertainties in optimizing the spatiotemporal PM2.5 changes resulting from emission controls (Chai et al., 2017; Jung et al., 2019). The analyzed states from the OI method were calculated based on the following interpolation equation:
where Xa and Xb denote the analysis (constrained) and background (simulated) values, respectively. B and O are background and observation error-covariance matrices, respectively, for which we assumed no correlation in this study. H refers to a linearized observational operator, and Y represents the observation vector. The OI method is described in detail in Adhikary et al. (2008).
Once available measurements were assimilated, the states of the simulated variables were adjusted from their background values to corresponding analysis states using the scaling ratio Xa∕Xb obtained following Eq. (1). As the measurements were conducted at the surface, this ratio at each grid cell was used to scale all aerosol components below the boundary layer top. Such simplification compensated for the lack of information to constrain speciated aerosol components or their vertical distributions. When ground-level PM2.5 measurements were assimilated, hourly observations were put into Eq. (1) to construct the new analysis fields. All-day state variables associated with aerosols in the model were adjusted from their background (simulated) to their analysis (constrained) states using the scaling factors (Xa∕Xb). The adjusted model state variables were then used to initiate the model to predict the next background state (Xb) in Eq. (1). Therefore, the background state (Xb) served as a prior model prediction before it was combined with the newly available observation (Y) to generate a new analysis state (Xa) using Eq. (1).
Measurements within the background-error correlation length scale were used to shape analysis states (Xa). The background error covariance COVij between any two grid cells i and j was simulated as
where εi and εj referred to the standard deviations of the background errors in two grid cells and Δij denotes the distance between the two grids. As a result, L was the background-error correlation length scale, which can be measured using the Hollingsworth–Lönnberg method (Chai et al., 2017; Hollingsworth and Lönnberg, 1986; Kumar et al., 2012). Figure 2 shows the correlation coefficient, i.e., COVij∕εiεj, as a function of the separation distance between two grid cells, which was averaged over 10 km bins. The results identified that a correlation length scale of ∼ 180 km could be treated as the threshold. It allowed the correlation coefficients to fall within the range of e−1, defining the effective radius of each individual observation. Due to the intensive monitoring sites in our study domain, this threshold was applied uniformly for the YRD. In this study, observations beyond the background-error correlation length scale would have no effect on Xa. Following Chai et al. (2017), the standard deviation of the background errors was assigned as 60 % of the background values, while the observational errors were assumed to be ± 20 % of the measurement values.

Figure 2Correlation coefficients (averaged over 10 km) as a function of the separation distances between two surface-level monitoring stations using the Hollingsworth–Lönnberg method.
2.5 Experiment design
Anthropogenic emission controls and meteorological perturbations are both critical factors that dominate interannual and daily variations in ambient PM2.5 (Zhang et al., 2019). Our major objective is to isolate the impacts of emission-oriented long-term and emergency measures and further explore the attainable PM2.5 mitigation potential. We designed three sets of experiments, which focused on three time periods, January 2016, January 2019, and the G20 period (from 26 August 2016 to 7 September 2016) (Table 1).
Table 1The experiments to isolate the effects of anthropogenic emission controls due to the long-term and emergency emission control strategies.

For all experiments, the anthropogenic emissions were kept consistent (i.e., MEIC), while the ECMWF reanalysis datasets accounted for the hourly observational constraints on spatiotemporal meteorological evolutions. The ECMWF reanalysis datasets accounted for the hourly observational constraints on spatiotemporal meteorological evolutions. Therein almost all necessary meteorological factors (nine variables), involving temperature, U wind component, V wind component, pressure, relative humidity, precipitation, short-wave radiation, cloud cover, and planetary boundary layer height (PBLH), were assimilated (https://apps.ecmwf.int/datasets/data/interim-full-daily/levtype=sfc/, last access: 7 March 2020). These configurations unified both chemical (i.e., emission inventories) and meteorological input data for the WRF-CMAQ model. Hence, the extent to which we introduce observational constraints on simulated PM2.5 variations using the OI method is the key to isolating the impacts of anthropogenic emission controls. Specifically, the differences in the constrained PM2.5 concentrations between DA_2016 and DA_2019 reflected the net effects of anthropogenic emission controls and meteorological perturbations between 2016 and 2019, while meteorological impacts therein were calculated as the discrepancies in simulated PM2.5 concentrations between NO_2016 and NO_2019 (Chen et al., 2019). Hence, by subtracting meteorological impacts from the net effects, we can isolate the effects of anthropogenic emission controls attributable to the long-term strategies.
The G20 summit provided a unique opportunity to realize the PM2.5 mitigation potential in specific regions (B. Li et al., 2019; P. Li et al., 2017; Ma et al., 2019; Shu et al., 2020; Yang et al., 2019). This is due to the fact that the Chinese government implemented the most historically stringent, even unsustainable, strategies to curb anthropogenic emissions during that period in Hangzhou and surrounding areas. To quantify the projected PM2.5 abatement, we adopted the abovementioned method to constrain the unique PM2.5 variations in the DA_G20 experiment and further compared the corresponding results with those of the sole model-dependent analysis (i.e., NO_G20). However, the subsequent discrepancies were related not only to the effects of emergency anthropogenic emission strategies but also to the inherent biases mainly due to the emission inventory (Zhang et al., 2019). In theory, such biases would generally remain unchanged in the short term when no emergency emission controls occurred. Their consequent impacts could thus be stable under similar meteorological conditions. Therefore, to avoid additional uncertainties, the adjacent periods of the G20 summit (i.e., pre- and post- periods, from 11 to 23 August 2016 and from 18 to 30 September 2016, respectively) are the optimal alternative to eliminate the impacts of those inherent biases. Figure S1 in the Supplement demonstrates the significantly similar meteorological fields among these three periods. As a result, the corresponding experiments (i.e., DA_CON_G20 and NO_CON_G20) (Table 1) were conducted. By subtracting such differences, we could isolate the PM2.5 responses to the solely emergency anthropogenic emission strategies and finally achieve the PM2.5 mitigation potential for specific locations. Such localized PM2.5 mitigation potential should be further expanded to the entire YRD based on the impacts of both long-term and emergency strategies.
There is an essential prerequisite to the above analysis. As the evaluation protocols, we need to verify that the DA experiments (i.e., DA_2016, DA_2019, DA_G20, and DA_CON_G20) can reproduce the spatiotemporal variations in the PM2.5 and major meteorological fields (i.e., temperature, relative humidity, wind speed, and air pressure) (Chai et al., 2017). While 244 monitoring stations reside in 6660 grid cells, 16 grid cells have 2 to 3 monitors in them. For these grid cells, only one averaged measurement was used for DA. However, all the observations were compared against the constrained results. Although SIA and SOA are key components of the ambient PM2.5, extensive measurements at the regional scale of these components are generally lacking. It is thus difficult to generate appropriate constraints on SIA and SOA (Chai et al., 2017; Gao et al., 2017). Note that different anthropogenic emissions might lead to inconsistent estimation of meteorological effects on ambient PM2.5 (Chen et al., 2019). To eliminate this doubt, we conducted sensitivity tests by reducing MEIC with three reasonable ratios (i.e., −5 %, −25 %, and −40 %) over the YRD based on NO_2016 and NO_2019.
3.1 Data assimilation performance
Figure 3 shows spatial comparisons of hourly averaged concentrations of constrained and simulated PM2.5 (i.e., the ones from the cases with and without DA, respectively) with ground-level observations across the YRD for January 2016, January 2019, and the G20 summit. In the NO_2016, NO_2019, and NO_G20 experiments, the simulated PM2.5 concentrations generally overestimated observed values by 16–57 µg m−3, especially those in Hangzhou and surrounding areas during the G20 summit (> 21 µg m−3). Such prevailing overestimates were mainly a result of the anthropogenic emission inventory (i.e., MEIC), as a bottom-up product, which notably cannot capture interannual emission changes since the base year 2012, as well as the large emission controls resulting from the emergency controls during the G20 summit. By comparison, the constrained results significantly approach observations. Specifically, in the DA_2016, DA_2019, and DA_G20 cases, the biases of the assimilated PM2.5 were all constrained in an extremely narrow range (i.e., 10, 12, and 13 µg m−3, respectively), suggesting that the DA method can reproduce the spatiotemporal distributions of surface PM2.5 at the regional scale.
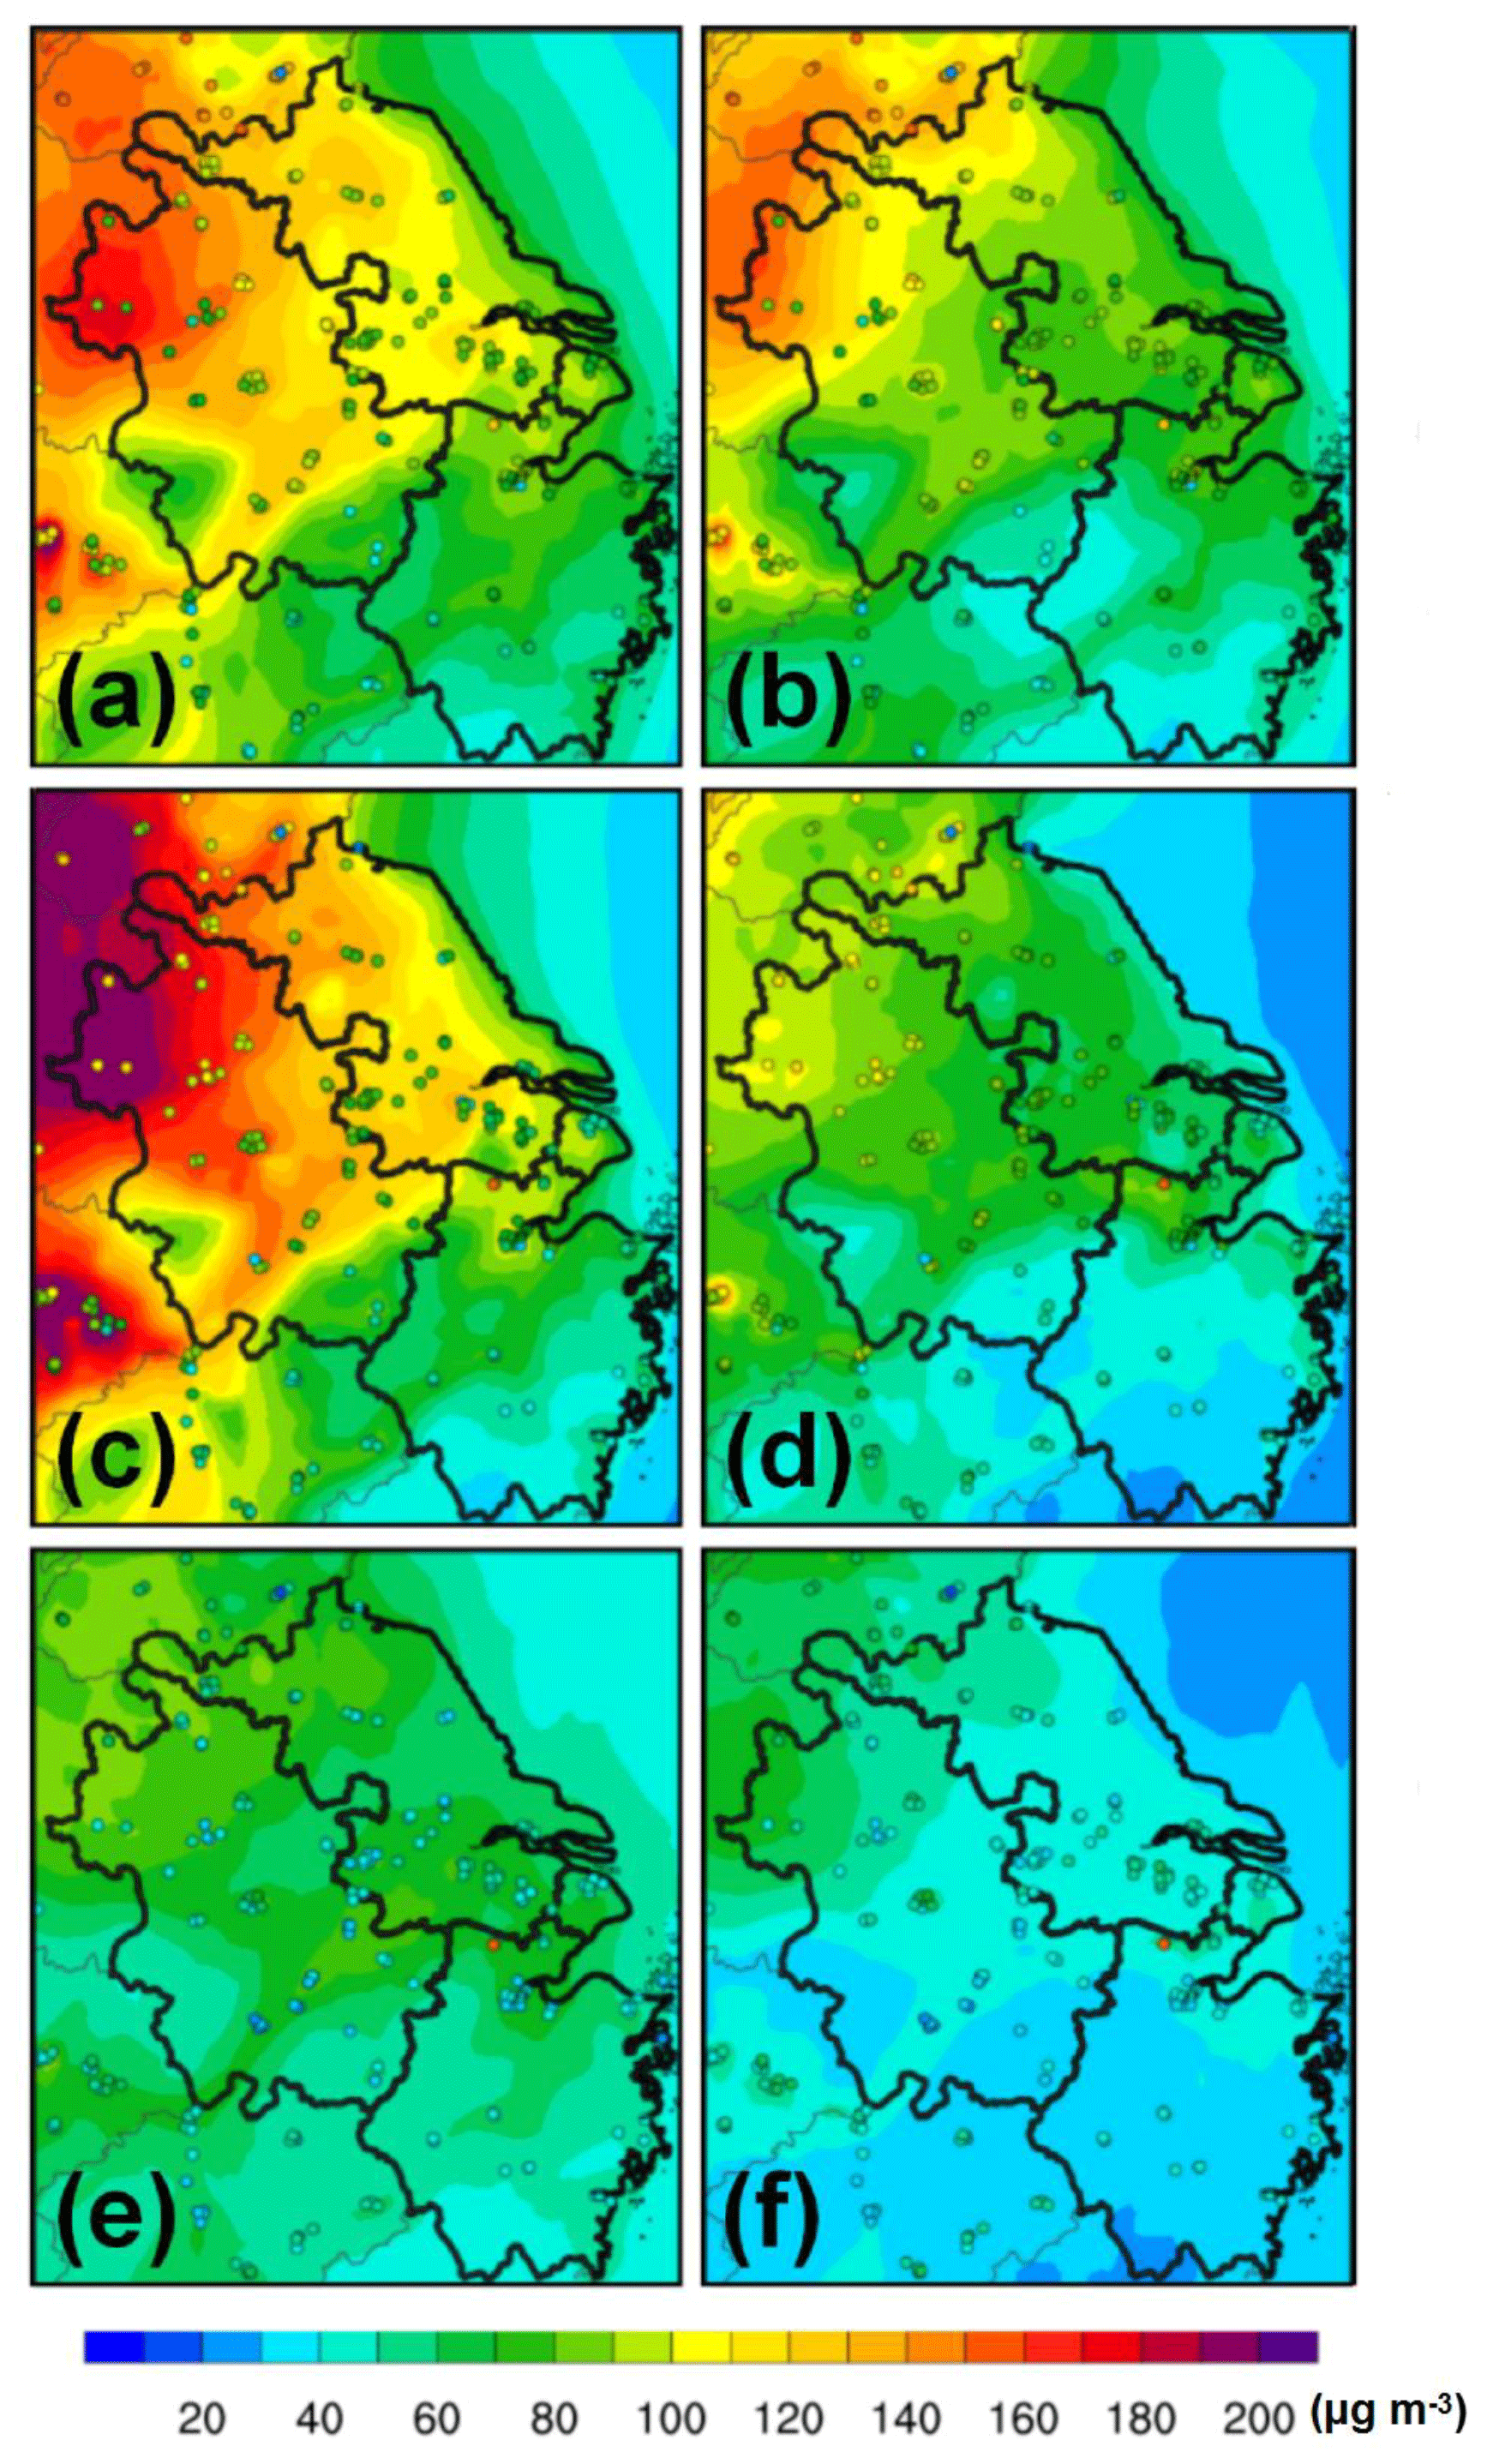
Figure 3Spatial comparisons of hourly-averaged concentrations of simulated and constrained PM2.5 with surface observations across the YRD for January 2016 (a, b), January 2019 (c, d), and the G20 summit (e, f): (a) NO_2016; (b) DA_2016; (c) NO_2019; (d) DA_2019; (e) NO_G20; (f) DA_G20. Circles denote ground measurement sites.
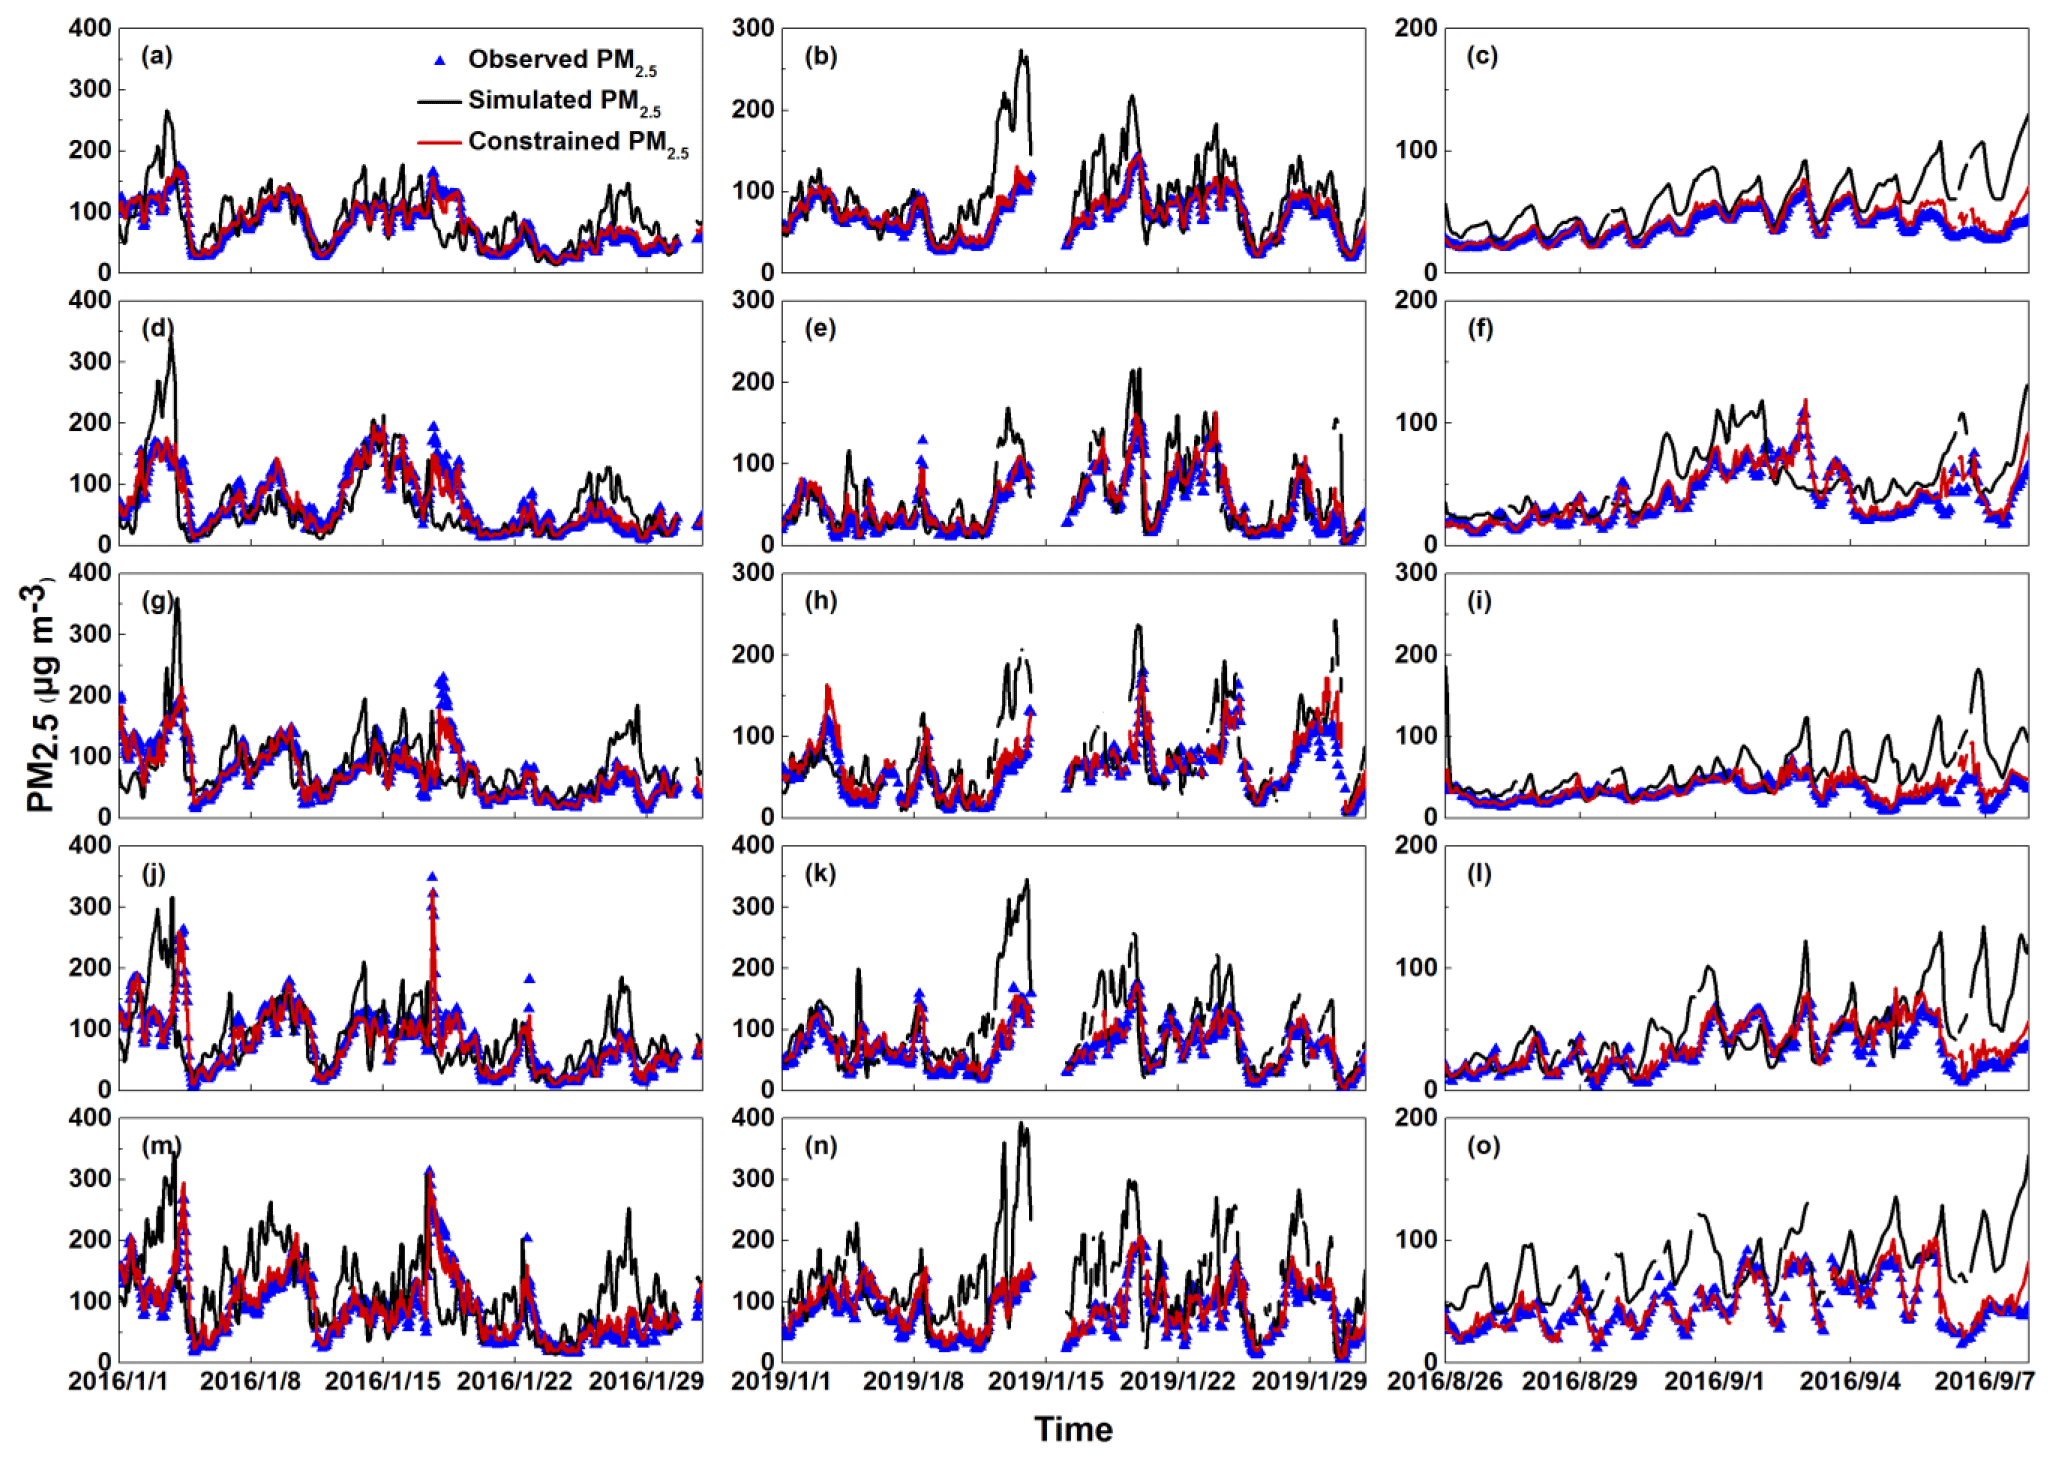
Figure 4Time series of the comparisons between hourly observed, simulated, and constrained PM2.5 concentrations for January 2016 (left column), January 2019 (middle column), and the G20 summit (right column) over (a–c) the whole domain as well as in four representative cities, which are as follows: (d–f) Shanghai, (g–i) Hangzhou, (j–l) Nanjing, and (m–o) Hefei. The black circles, black lines, and red lines denote the hourly observed, simulated, and constrained PM2.5 concentrations, respectively.
To achieve more targeted evaluations, it is necessary to further assess the ability of the DA method in reproducing the city-level PM2.5 responses. With the analysis of time series over the same periods, Fig. 4 illustrates the comparisons between hourly observed, simulated, and constrained PM2.5 concentrations over the whole domain and four representative cities (i.e., Shanghai, Hangzhou, Nanjing, and Hefei). Similar to the spatial comparisons, the constrained PM2.5 generally reproduces the temporal variations in observations, while the model-dependent simulated results are prone to overestimating those observations, in particular, the peaks by 85–257 µg m−3.
As expected, basic evaluation indicators (i.e., the normalized mean bias, NMB, and R values) of assimilated PM2.5 exhibited significantly better behavior than those without constraints (Fig. S2). Taking the simulated and assimilated results for Hangzhou during January 2016 as an example, the corresponding R values improved from 0.63 to 0.98, while the NMB values were reduced from 17 % to 3 %. Similar improvements, but with varying extent, were found in other paired experiments.
Owing to the fact that the distinct PM2.5 levels might also play a potential role in the DA performance, we thus separated the entire range of the observed PM2.5 concentrations into four intervals (i.e., < 35, 35–75, 75–115, and > 115 µg m−3), exactly corresponding to the continuously increasing PM2.5 levels. Figure S3 demonstrates that, relative to the sole model-dependent configurations, this constraining method could substantially strengthen the model performance, especially for the relatively elevated concentration intervals. Overall, the ranges of the NMB values and associated standard deviations decreased from −24 %–86 % to −9 %–25 % and 34–174 to 12–52 µg m−3, respectively. Theoretically, more frequent DA should lead to more robust simulations. Hourly observational constraints on the PM2.5 concentrations were thus adopted to tackle this issue. This is the reason why the corresponding NMB values in the constraining cases roughly maintain stability, fluctuating over a narrow range (i.e., ± 20 %) in the study periods (Fig. S4). In addition, given that the assimilated ERA reanalysis dataset has much wider spatial coverage than ground-based measurements, we also reproduced the spatiotemporal variations in the meteorological factors (e.g., temperature, relative humidity, wind speed, and air pressure) (Figs. S5–S8). Together with the comprehensive evaluation statistics as summarized in Tables S1–S5, it has been demonstrated that the DA method can enable one to derive not only reliable PM2.5 evolution but also accurate meteorological fields. Regional transport of PM2.5 can thus be captured reasonably in this way.
3.2 Ambient PM2.5 responses to the long-term strategies
The Chinese government has been implementing stringent emission control strategies since 2016, especially in the YRD (Feng and Liao, 2016; K. Li et al., 2019). To quantify subsequent PM2.5 responses is thus the prerequisite to our final objective, that is, to explore the associated PM2.5 mitigation potential.
Interannual changes in spatiotemporal PM2.5 distributions depended strongly on both anthropogenic emission controls and meteorological variations from 2016 to 2019. Their combined effects were reflected by the differences between the constrained results from DA_2016 and DA_2019. As shown in Fig. 5a, such net impacts led to prevailing PM2.5 abatement in the domain, especially in megacities, such as Shanghai (13 µg m−3, 21 %), Hangzhou (13 µg m−3, 17 %), Nanjing (6 µg m−3, 8 %), and Hefei (2 µg m−3, 2 %). In addition, noticeable PM2.5 controls also occurred in the western and northern YRD, where abundant anthropogenic emissions are concentrated (Fig. S9). Detailed differences are shown in Table S6.
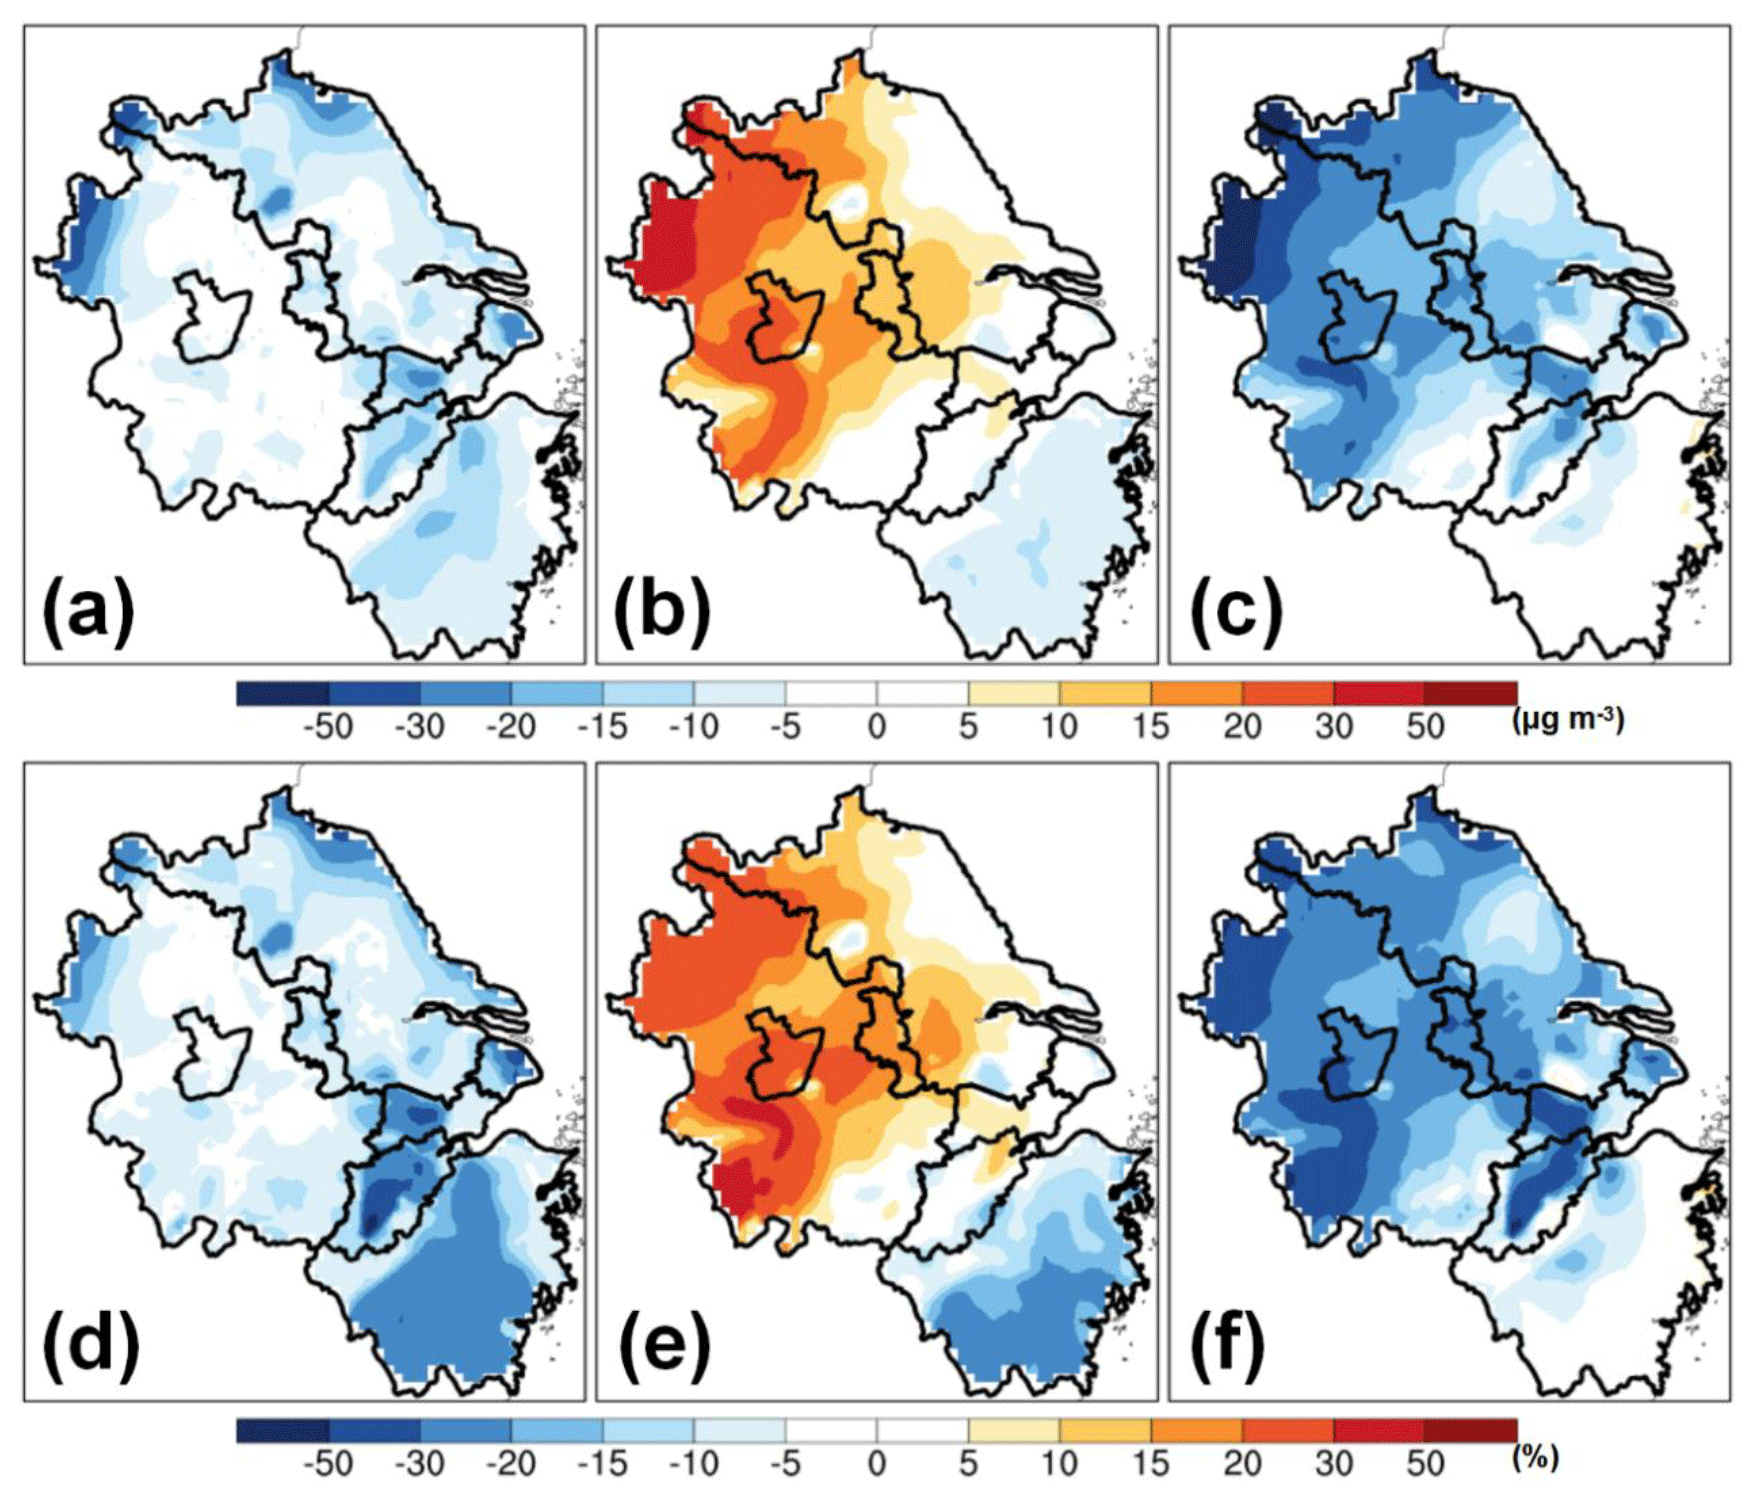
Figure 5The impacts of anthropogenic emission controls and meteorological variations on spatial PM2.5 concentrations in January from 2016 to 2019. (a, d) Their net impacts. (b, e) Meteorological impacts. (c, f) The impacts of anthropogenic emission controls. Panels (a)–(c) and (d)–(f) refer to the changes in absolute values and relative percentages, respectively.
Figure 5b highlights that the sole meteorological interferences played an extensively positive role in increasing the regional PM2.5 concentrations for most areas of the domain (∼ 12 µg m−3, 15 %). This also indirectly implied the importance of assimilating meteorology, which, however, was generally neglected by previous studies (Chen et al., 2019). In this study, we have eliminated this speculation. As shown in Figs. 5 and S10, even with the largest adjustment (i.e., −40 %), such interferences could be well controlled within the 5 % (< 3 µg m−3) scope, let alone other tests (i.e., < 3 %, < 2 µg m−3). Moreover, these findings are consistent with previous analyses (Chen et al., 2019; Zhang et al., 2019). They generally reveal that reasonable changes in the bottom-up emissions, together with the same meteorology input data, would not remarkably alter the simulated results associated with meteorological effects on surface PM2.5 (< 5 %). As a result, some past studies even directly ignored such sensitivity tests without any discussion (Chen et al., 2019). Therefore, by subtracting those meteorological influences from the combined outcomes, we can finally derive the contributions of anthropogenic emission controls to the PM2.5 mitigation at the regional scale. Figure 5c illustrates that long-term emission control strategies from 2016 to 2019 produced substantial (> 14 µg m−3, 19 %) decreases in regional PM2.5 concentrations, which are similar to those combined effects in terms of the spatial distributions.
For the entire domain, as well as the four representative cities, the synergy between anthropogenic emission controls and meteorological interferences on the PM2.5 concentrations were calculated at the city level (Fig. 6). We found that their net effects resulted in uniformly positive mitigation as follows: −2 µg m−3 (−3 %), −13 µg m−3 (−21 %), −12 µg m−3 (−17 %), −6 µg m−3 (−8 %), and −2 µg m−3 (−3 %) for the whole domain, Shanghai, Hangzhou, Nanjing, and Hefei, respectively, while the meteorological conditions therein offset such effects to different extents (5–18 µg m−3, 16 %–24 %). We recognized that the impacts of anthropogenic drivers on PM2.5 concentrations in the southern and eastern parts of Zhejiang were evidently weaker than those in other regions in the YRD. This divergence can mostly be explained by spatial distributions of anthropogenic emissions. That is, anthropogenic emissions in the southern and eastern of Zhejiang were also significantly lower than those in other regions (Fig. S9), thus leading to substantially low PM2.5 concentrations (Fig. 3). As well as this, meteorological fields in coastal regions, more conducive to PM2.5 diffusion (Fig. 5), might be another cause. The above findings confirmed that the PM2.5 mitigation was dominated by anthropogenic emission controls, rather than meteorological variations. Furthermore, the corresponding spatiotemporal patterns were highly correlated to those of the anthropogenic emissions (Fig. S9). This indicates that the impacts of the long-term strategies are mainly driven by anthropogenic emission mitigation.
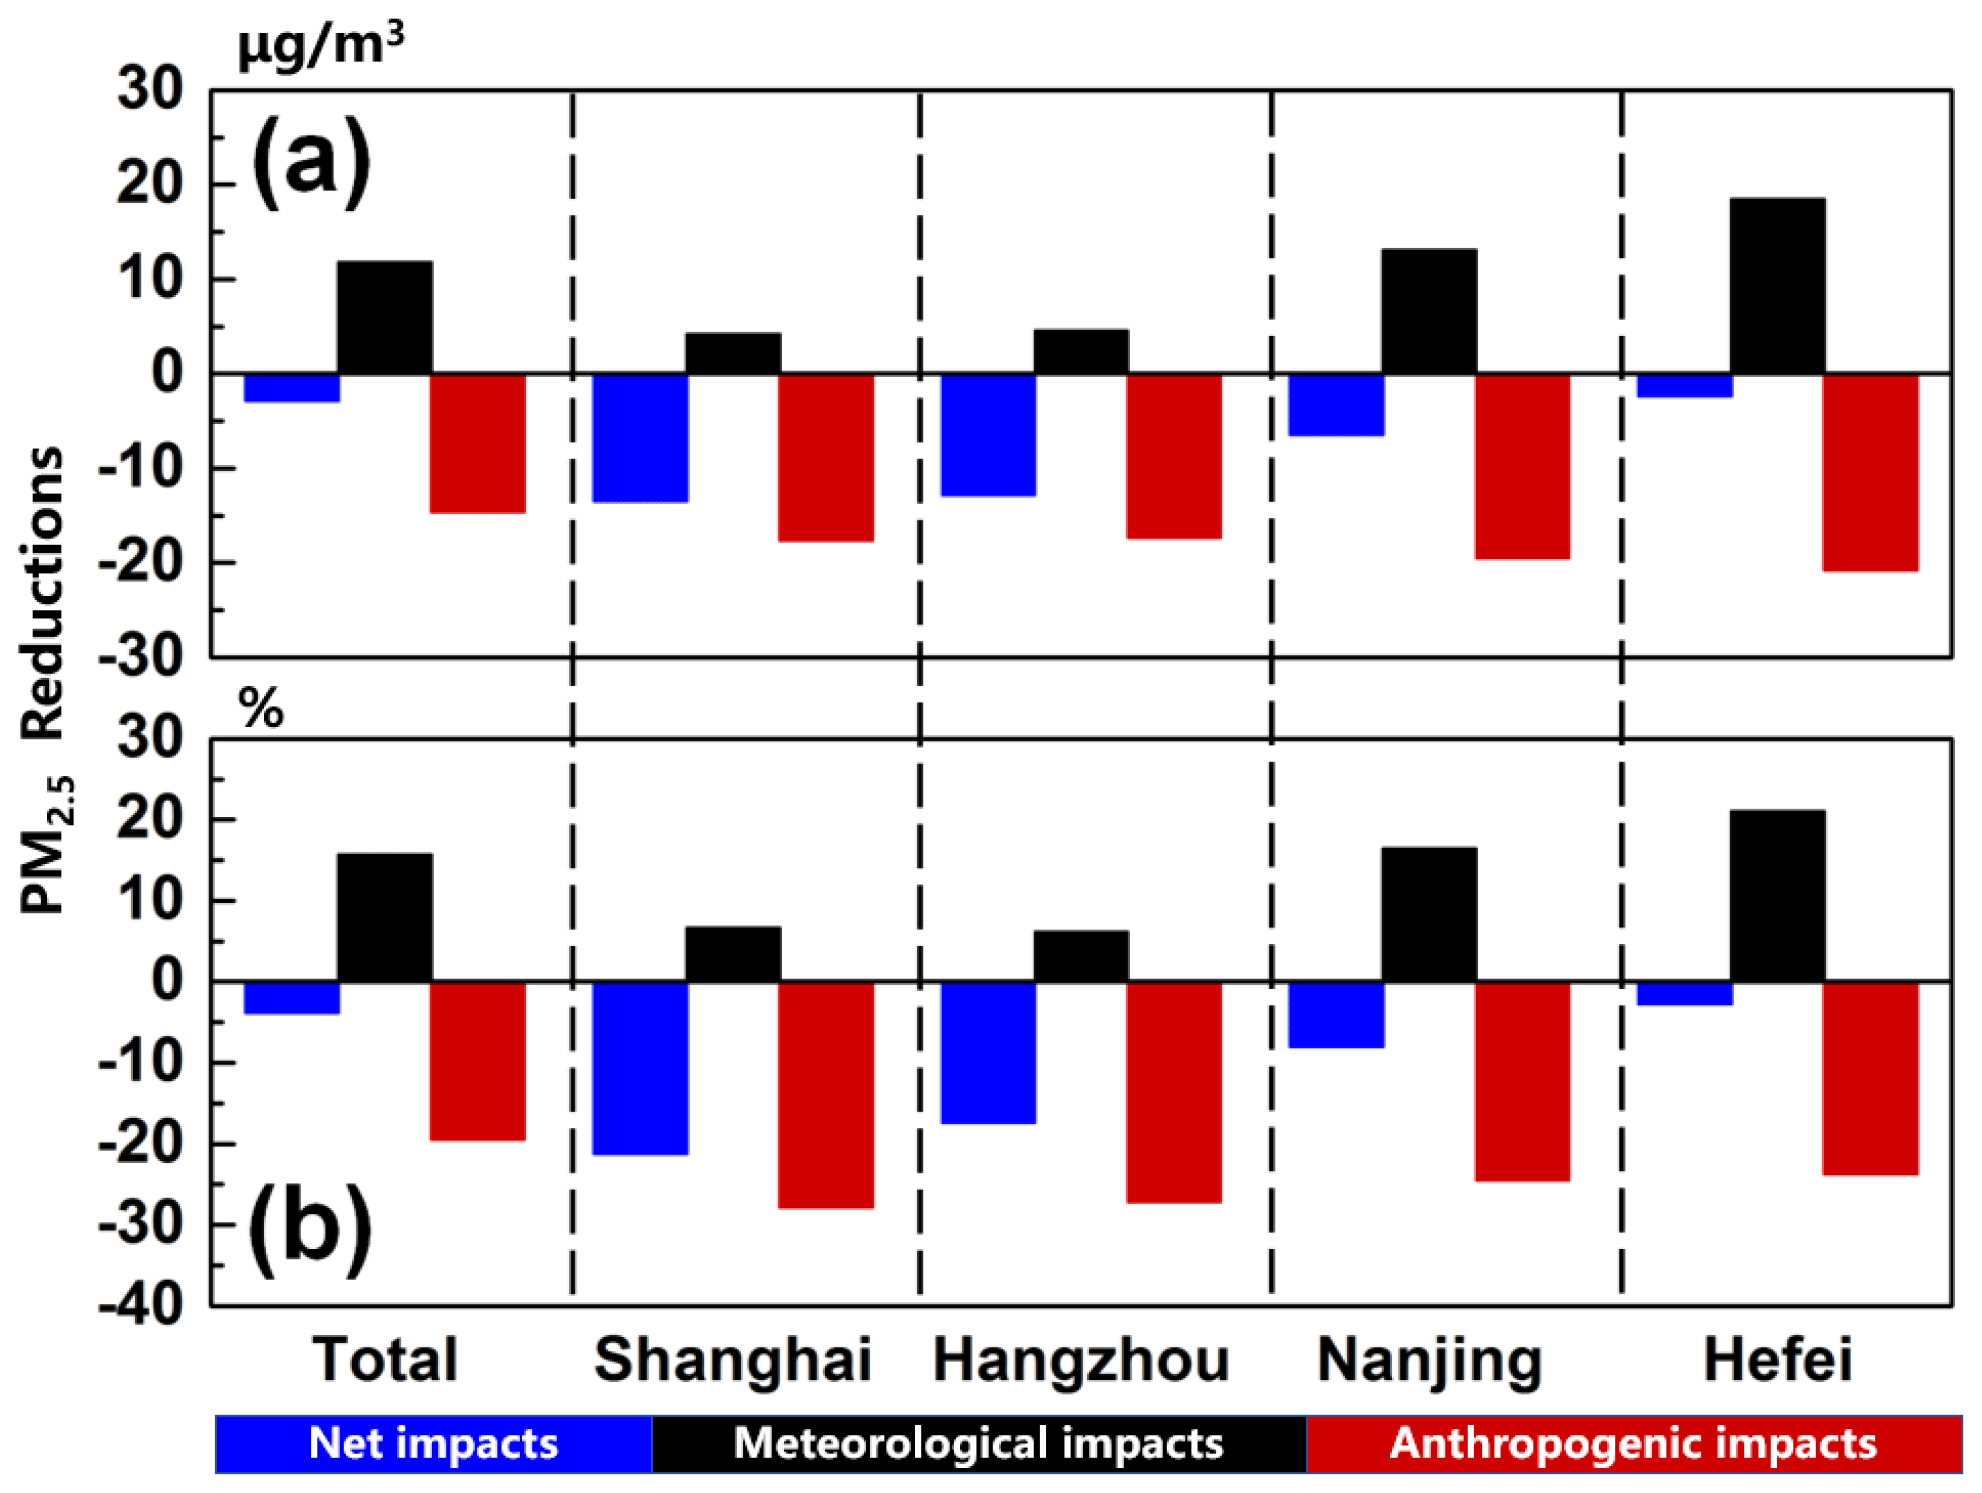
Figure 6The impacts of anthropogenic emission controls and meteorological variations on PM2.5 concentrations in January from 2016 to 2019 over the whole domain as well as in four representative cities (i.e., Shanghai, Hangzhou, Nanjing, and Hefei). Panels (a) and (b) refer to the changes in absolute values and relative percentages, respectively.
3.3 Ambient PM2.5 mitigation potential
The G20 summit offered a unique and ideal opportunity to clarify the effects of the most stringent emission control measures across the YRD from 2016 to 2019, which could be regarded as the localized PM2.5 mitigation potential. Figure 7a shows the spatial differences between the constrained and simulated PM2.5 concentrations, which were extracted from DA_G20 and NO_G20, for the period of the G20 summit. Inherent biases remained, primarily attributable to the priori anthropogenic emissions. Their subsequent impacts were then quantified by comparing the discrepancies between the results from two additional experiments (i.e., DA_CON_G20 and NO_CON_G20) (Fig. 7b). Moreover, such impacts were associated with relatively low standard deviations (< 5 %), thus presenting a stably spatiotemporal state (Fig. S11). This means that such estimations were also suitable for the G20 summit. Therefore, by subtracting them, the re-corrected differences would reflect the actual effects of the most stringent emission control measures for the G20 summit (Fig. 7c). Such hotspots with extremely negative values reveal the dramatic PM2.5 mitigation for these specific locations. The corresponding largest decreases in PM2.5 concentrations (35 µg m−3, 59 %) occurred in Hangzhou and its surrounding areas, as expected. Following Hangzhou, other hotspots with relatively prominent declines also emerged in megacities, especially in Shanghai (32 µg m−3, 51 %), Nanjing (27 µg m−3, 55 %), and Hefei (24 µg m−3, 44 %). This behavior could be explained by two inferences: (i) local emission controls in Hangzhou were projected to be conducted with the maximum execution efficiency compared to those in surrounding regions; (ii) most of the emergency measurements generally targeted the vehicle and industry emissions that are clustered around the urban rather than rural areas.
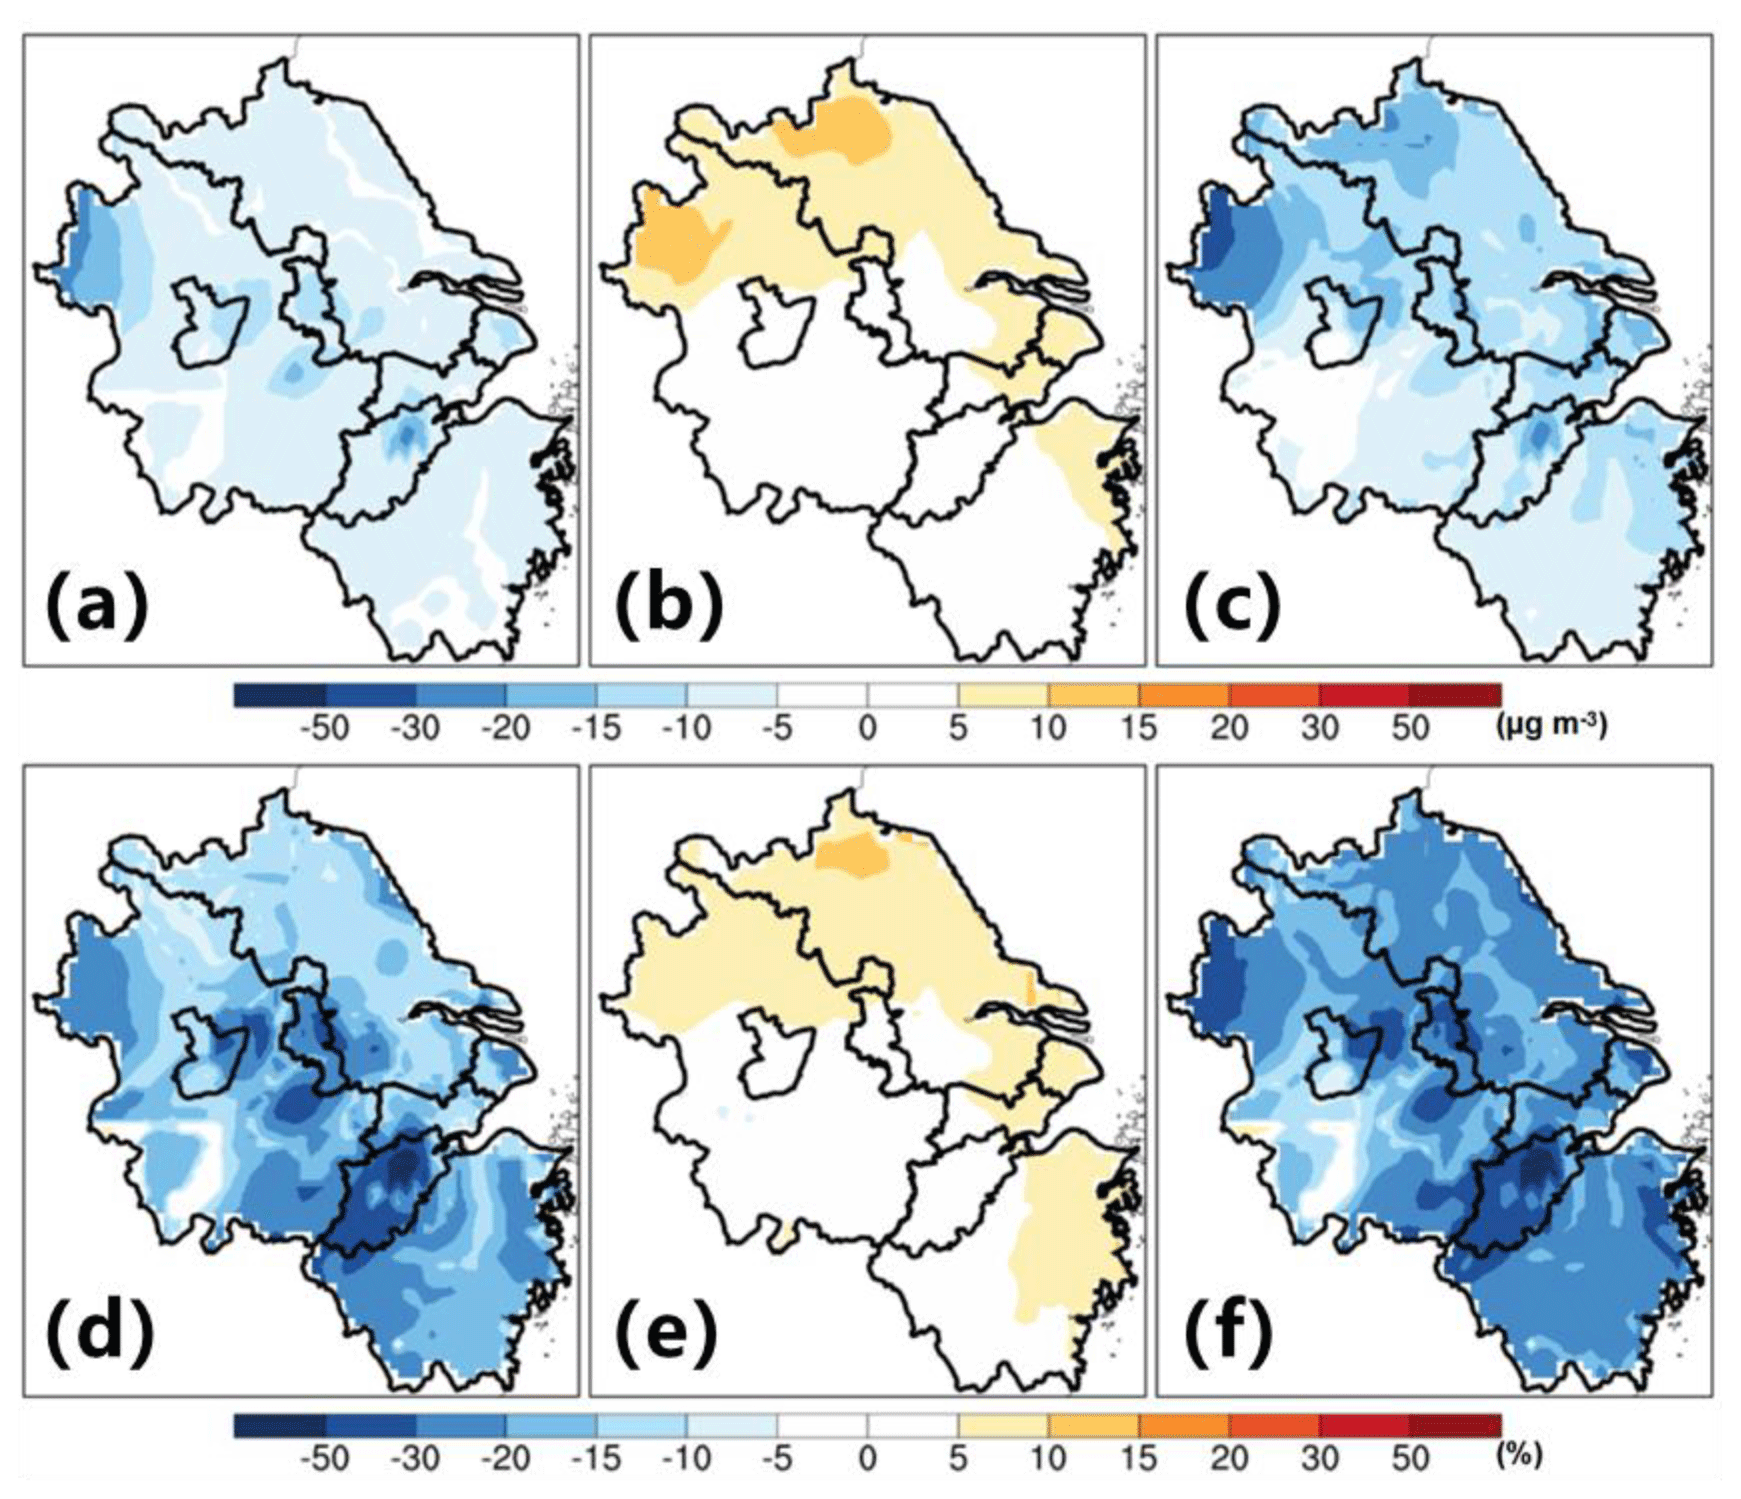
Figure 7The impacts of anthropogenic emission controls and inherent biases on spatial PM2.5 concentrations during the G20 summit. (a, d) Their net impacts. (b, e) The impacts of inherent biases. (c, f) The impacts of anthropogenic emission controls. Panels (a)–(c) and (d)–(f) refer to the changes in absolute values and relative percentages, respectively. Inherent biases are mainly due to the prior anthropogenic emissions.
Compared to the long-term policies from 2016 to 2019, the emergency emission control measures implemented during the G20 Summit achieved more significant decreases in PM2.5 concentrations (17 µg m−3 and 41 %) over most of the whole domain, especially in Hangzhou (24 µg m−3, 48 %) and Shanghai (21 µg m−3, 45 %) (Fig. 8). Detailed differences are summarized in Table S6.

Figure 8The impacts of anthropogenic emission controls and inherent biases on PM2.5 concentrations during the G20 summit over the whole domain as well as in four representative cities (i.e., Shanghai, Hangzhou, Nanjing, and Hefei). Panels (a) and (b) refer to the changes in absolute values and relative percentages, respectively. Inherent biases are mainly due to the prior anthropogenic emissions.
To gain the regional PM2.5 mitigation potential, we did the following. (i) We first pinpointed the main urban areas of Hangzhou that covered 25 grid cells (Fig. S12), in which the most substantial PM2.5 abatement; i.e., the localized PM2.5 mitigation potential (> 22 µg m−3 and > 59 %) was identified. (ii) As in the above hypothesis, the spatial distributions of the regional PM2.5 mitigation potential across the YRD were then assumed to follow those of the long-term strategy effects. (iii) Thus, by extrapolation in equal proportion following such patterns and the localized PM2.5 mitigation potential, we established the map of the PM2.5 mitigation potential across the YRD (Fig. 9a). It should be noted that, as long as three premises, including typical weather backgrounds, stable structures of anthropogenic emissions, and analogous emission control measures, remain unchanged, Fig. 9a is a reliably quantitative reference to characterize the attainable PM2.5 abatement for the YRD in future.
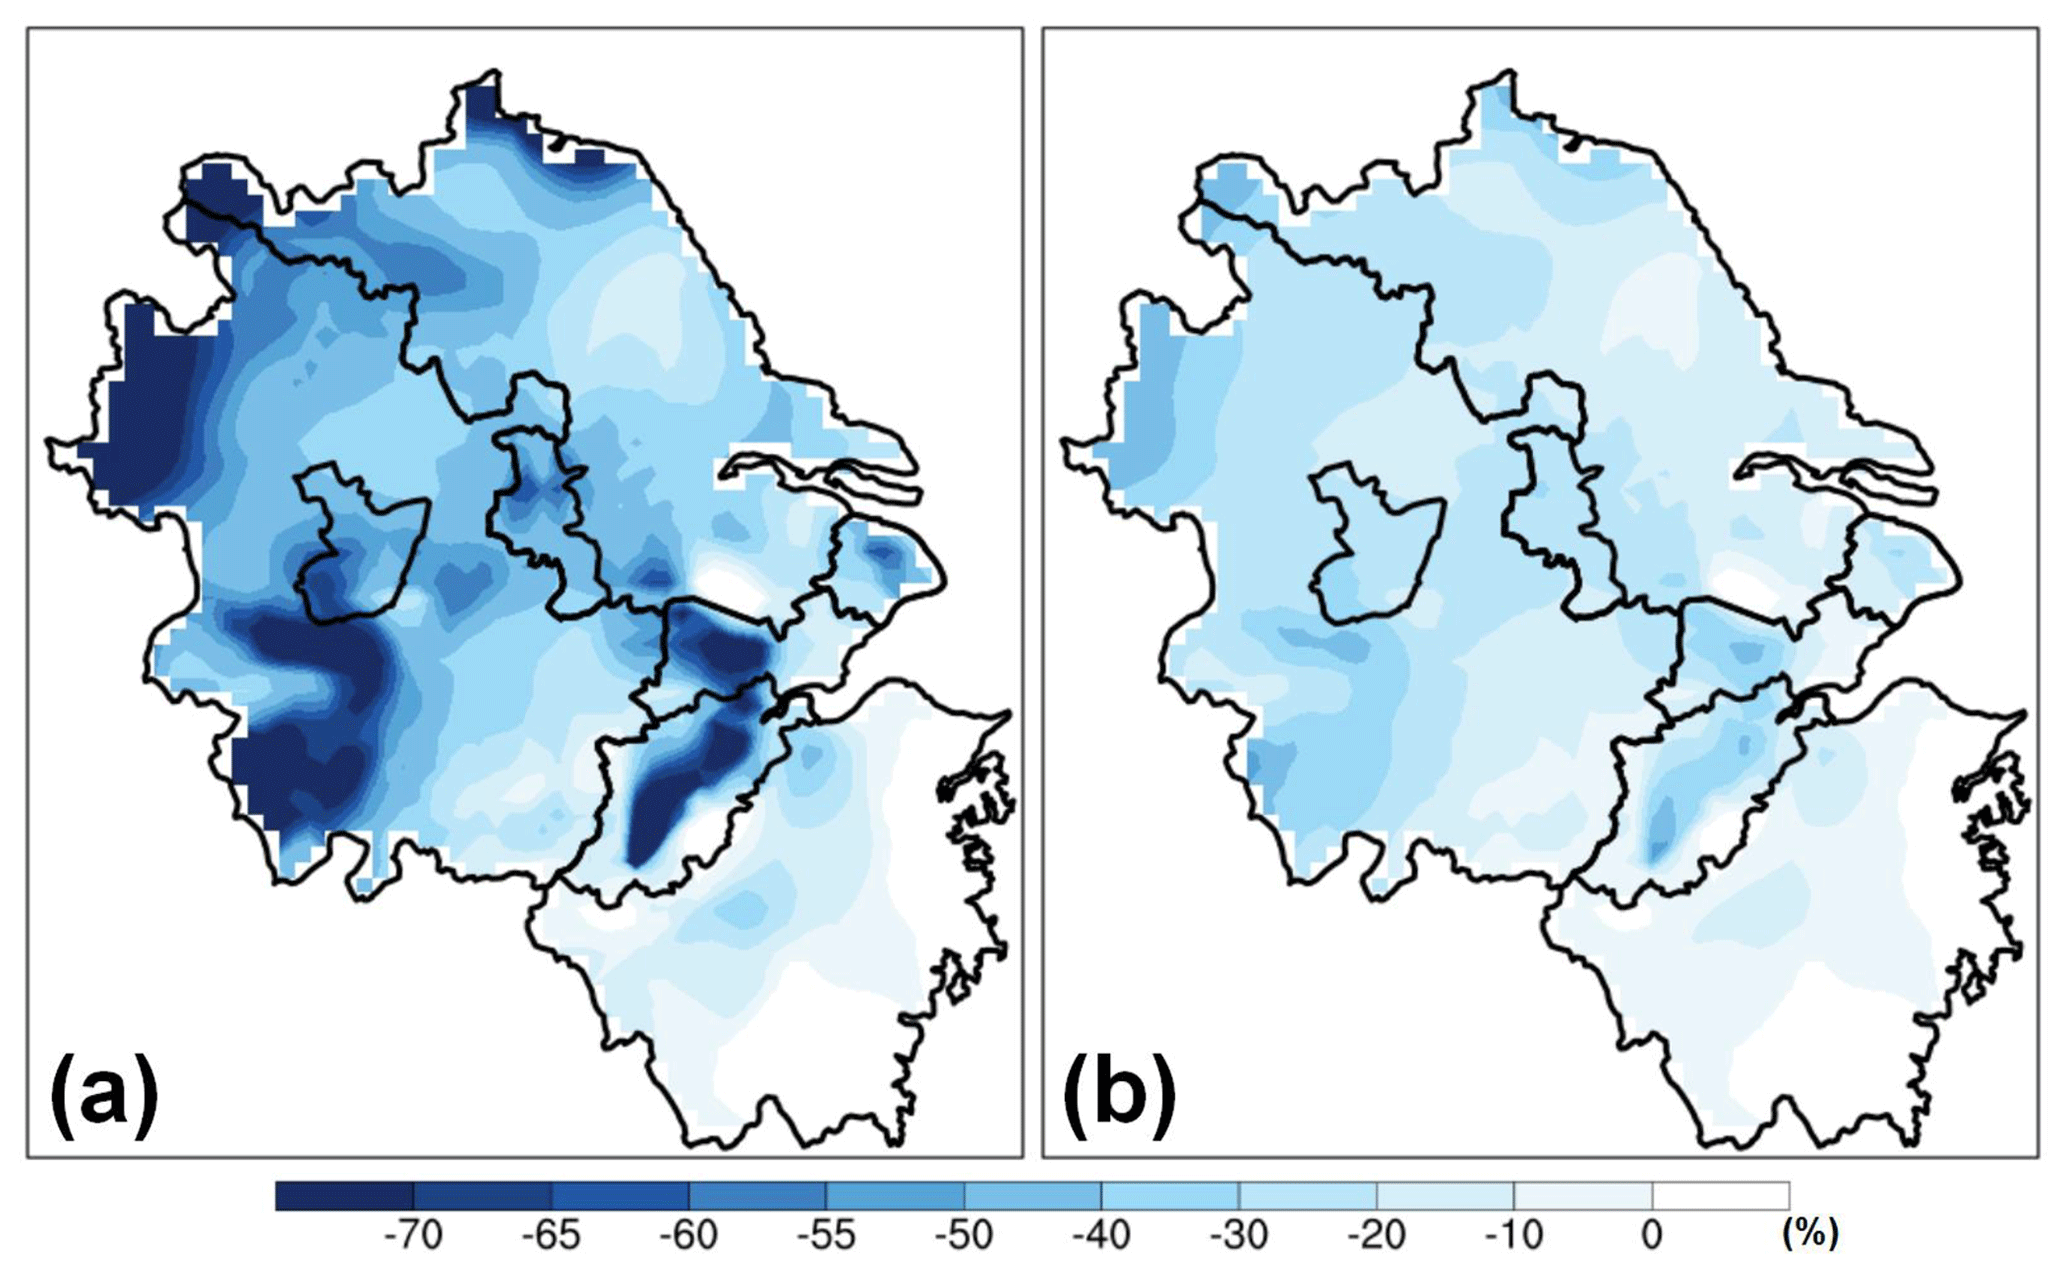
Figure 9(a) Spatial distributions of the PM2.5 mitigation potential across the YRD and (b) their differences with the impacts of long-term emission control strategies from 2016 to 2019 (Fig. 5f). Both spatial patterns of long-term emission control strategy impacts (Fig. 5f) and the localized PM2.5 mitigation potential in the main urban areas of Hangzhou (Fig. S10), with the proportion calculator, result in panel (a).
The actual effectiveness of anthropogenic emission control measures, especially those directed at PM2.5 mitigation, has long been excluded from evaluation of air pollution policies in China, in part due to the complex synergy between anthropogenic emissions and meteorology. Here, we provide a novel approach to explore the PM2.5 responses to anthropogenic emission control measures and their mitigation potential from 2016 to 2019 across the YRD, China. With the data assimilation method, these estimates are projected to be highly reliable due to the sufficient observational constraints. The results demonstrate that long-term anthropogenic emission control strategies from 2016 to 2019 have led to extensive impacts on PM2.5 abatement across the YRD, especially in the megacities, Shanghai, Hangzhou, Nanjing, and Hefei. In the context of the G20 summit, the emergency strategies could achieve significant PM2.5 abatement (> 50 %) at specific locations, (i.e., urban Hangzhou), representing the localized mitigation potential. By extrapolation based on the above results, we have established the first map of the PM2.5 mitigation potential for the YRD.
Numerous analyses have focused on Hangzhou during the G20 summit to detect impacts of emergency emission controls (H. Li et al., 2019; P. Li et al., 2017; Yu et al., 2018). However, previous analyses generally found more effective predictions (> 50 %) at the city level. This discrepancy might be related to the fact that such results were generally based on sole model-dependent predictions, which are normally driven by uncertain bottom-up estimates of anthropogenic emissions. In addition, this study addresses the YRD after 2016. As well as this, similar opportunities also occurred at other spatiotemporal scales, such as the “APEC Blue” in 2014 and “Parade Blue” in 2015 over the BTH (Liu et al., 2016; Sun et al., 2016; Zhang et al., 2016). More aggressive achievements (> 55 %) were generally attributed to emergency anthropogenic emission control measures (Sun et al., 2016). This might be related to the fact that, compared to the YRD, the BTH is associated with more abundant primary emissions (Zhang et al., 2019). The impacts of natural sources (e.g., biogenic emissions, wildfires, and natural dust) are not considered in this study. This is mainly because of two reasons. First, it has been widely demonstrated that biogenic emission changes are dominated by meteorological variations over a period of a few years (Wang et al., 2019). Moreover, the former is generally of minor significance for interannual PM2.5 variations for the YRD (Mu and Liao, 2014; Tai et al., 2012). Second, satellite products, including MOD14 and AIRIBQAP_NRT.005 (https://worldview.earthdata.nasa.gov/, last access: 7 March 2020), show that there were no noticeable wildfires and natural dust storms during this study period, thus allowing us to ignore the corresponding interferences.
This study takes advantage of observational constraints to gain the regional PM2.5 mitigation potential. It could be further optimized by more extensive observations. As well as this, extending the PM2.5 mitigation potential in urban Hangzhou during the study period to the entire YRD in other time periods may introduce some uncertainties due to varying meteorology. As mentioned above, impacts of the extreme emergency emission controls are spatially inconsistent across the YRD. To explore regional PM2.5 mitigation potential, it is thus unavoidable to extrapolate from local to regional scale. The consequent uncertainty mainly relates to the hypothesis that the spatial patterns of the PM2.5 mitigation potential across the YRD should follow those of the impacts of the long-term emission control strategies. In addition, there are distinct DA methods (Bocquet et al., 2015). It is thus believed that replacing the OI with another DA algorithm would lead to slightly different results. Note that, as previous studies have demonstrated (Cheng et al., 2019; Zhai et al., 2019; Zhong et al., 2018), model uncertainties remain, although we have verified the constrained results. We have supplemented the additional discussions in Sect. 4 for further explanation. For instance, model simulations of aerosol components (e.g., sulfate and nitrate) are still poorly constrained. Moreover, they have not been evaluated due to lack of available observations. Previous studies find that the model tends to underestimate sulfate production during high relative humidity (as pointed by the reviewer) as well as SOA (G. Li et al., 2017; Wang et al., 2014; Zhong et al., 2018). As a result, these uncertainties can be propagated into the estimations of meteorological effects. As well as this, like other atmospheric chemical transport models, the WRF-CMAQ model cannot provide model uncertainty information, while Monte Carlo simulations for complex CTMs would be unrealistic due to extremely high computation loadings (Zhong et al., 2018). Looking forward, continued advances in observational techniques, better understanding of chemical and meteorological processes, and their improved representations in CTMs are all factors that are critical to optimizing the estimates of the PM2.5 mitigation potential.
Ground-based PM2.5 measurement data and meteorology measurements are obtained from the China National Environmental Monitoring Centre (http://106.37.208.233:20035/, last access: 1 December 2020) and the National Climate Data Center (NCDC; https://www7.ncdc.noaa.gov/CDO/cdoselect.cmd, last access: 1 December 2020), respectively.
The supplement related to this article is available online at: https://doi.org/10.5194/acp-20-14787-2020-supplement.
SY and PL designed this study. SY, PL, LW, XC, and JHS carried out analyses, interpreted data, and wrote the article. ZL, YiZ, ML, KM, WL, TC, YaZ, and DR contributed to the discussions.
The authors declare that they have no conflict of interest.
This study was supported by the Department of Science and Technology of China (nos. 2016YFC0202702, 2018YFC0213506, and 2018YFC0213503), National Research Program for Key Issues in Air Pollution Control in China (no. DQGG0107) and National Natural Science Foundation of China (nos. 21577126 and 41561144004). Pengfei Li is supported by Initiation Fund for Introducing Talents of Hebei Agricultural University (412201904) and Hebei Youth Top Fund (BJ2020032).
This research has been supported by the Department of Science and Technology of China (grant nos. 2016YFC0202702, 2018YFC0213506, and 2018YFC0213503), National Research Program for Key Issues in Air Pollution Control in China (grant no. DQGG0107), National Natural Science Foundation of China (grant nos. 21577126, 41561144004, and 22006030), Initiation Fund for Introducing Talents of Hebei Agricultural University (grant no. 412201904), and Hebei Youth Top Fund (grant no. BJ2020032).
This paper was edited by Pedro Jimenez-Guerrero and reviewed by Yuzhong Zhang and one anonymous referee.
Adhikary, B., Kulkarni, S., Dallura, A., Tang, Y., Chai, T., Leung, L. R., Qian, Y., Chung, C. E., Ramanathan, V., and Carmichael, G. R.: A regional scale chemical transport modeling of Asian aerosols with data assimilation of AOD observations using optimal interpolation technique, Atmos. Environ., 42, 8600–8615, 2008.
An, Z., Huang, R.-J., Zhang, R., Tie, X., Li, G., Cao, J., Zhou, W., Shi, Z., Han, Y., Gu, Z., and Ji, Y.: Severe haze in Northern China: A synergy of anthropogenic emissions and atmospheric processes, P. Natl. Acad. Sci. USA, 116, 8657–8666, 2019.
Binkowski, F. S. and Roselle, S. J.: Models-3 Community Multiscale Air Quality (CMAQ) model aerosol component 1. Model description, J. Geophys. Res.-Atmos., 108, 335–346, 2003.
Bocquet, M., Elbern, H., Eskes, H., Hirtl, M., Žabkar, R., Carmichael, G. R., Flemming, J., Inness, A., Pagowski, M., Pérez Camaño, J. L., Saide, P. E., San Jose, R., Sofiev, M., Vira, J., Baklanov, A., Carnevale, C., Grell, G., and Seigneur, C.: Data assimilation in atmospheric chemistry models: current status and future prospects for coupled chemistry meteorology models, Atmos. Chem. Phys., 15, 5325–5358, https://doi.org/10.5194/acp-15-5325-2015, 2015.
Byun, D. and Schere, K. L.: Review of the governing equations, computational algorithms, and other components of the Models-3 Community Multiscale Air Quality (CMAQ) modeling system, Appl. Mech. Rev., 59, 51–77, 2006.
Carlton, A. G. and Baker, K. R.: Photochemical modeling of the Ozark isoprene volcano: MEGAN, BEIS, and their impacts on air quality predictions, Environ. Sci. Technol., 45, 4438–4445, 2011.
Carlton, A. G., Bhave, P. V, Napelenok, S. L., Edney, E. O., Sarwar, G., Pinder, R. W., Pouliot, G. A., and Houyoux, M.: Model representation of secondary organic aerosol in CMAQv4. 7, Environ. Sci. Technol., 44, 8553–8560, 2010.
Chai, T., Kim, H.-C., Pan, L., Lee, P., and Tong, D.: Impact of Moderate Resolution Imaging Spectroradiometer Aerosol Optical Depth and AirNow PM2.5 assimilation on Community Multi-scale Air Quality aerosol predictions over the contiguous United States, J. Geophys. Res.-Atmos., 122, 5399–5415, 2017.
Chen, D., Liu, Z., Ban, J., Zhao, P., and Chen, M.: Retrospective analysis of 2015–2017 wintertime PM2.5 in China: response to emission regulations and the role of meteorology, Atmos. Chem. Phys., 19, 7409–7427, https://doi.org/10.5194/acp-19-7409-2019, 2019.
Cheng, J., Su, J., Cui, T., Li, X., Dong, X., Sun, F., Yang, Y., Tong, D., Zheng, Y., Li, Y., Li, J., Zhang, Q., and He, K.: Dominant role of emission reduction in PM2.5 air quality improvement in Beijing during 2013–2017: a model-based decomposition analysis, Atmos. Chem. Phys., 19, 6125–6146, https://doi.org/10.5194/acp-19-6125-2019, 2019.
Choi, Y.-J. and Fernando, H. J. S.: Implementation of a windblown dust parameterization into MODELS-3/CMAQ: Application to episodic PM events in the US/Mexico border, Atmos. Environ., 42, 6039–6046, 2008.
Clough, S. A., Shephard, M. W., Mlawer, E. J., Delamere, J. S., Iacono, M. J., Cady-Pereira, K., Boukabara, S., and Brown, P. D.: Atmospheric radiative transfer modeling: a summary of the AER codes, J. Quant. Spectrosc. Ra., 91, 233–244, 2005.
Feng, L. and Liao, W.: Legislation, plans, and policies for prevention and control of air pollution in China: achievements, challenges, and improvements, J. Clean. Prod., 112, 1549–1558, 2016.
Fountoukis, C. and Nenes, A.: ISORROPIA II: a computationally efficient thermodynamic equilibrium model for K+–Ca2+–Mg2+––Na+–––Cl−–H2O aerosols, Atmos. Chem. Phys., 7, 4639–4659, https://doi.org/10.5194/acp-7-4639-2007, 2007.
Gao, M., Saide, P. E., Xin, J., Wang, Y., Liu, Z., Wang, Y., Wang, Z., Pagowski, M., Guttikunda, S. K., and Carmichael, G. R.: Estimates of health impacts and radiative forcing in winter haze in eastern China through constraints of surface PM2.5 predictions, Environ. Sci. Technol., 51, 2178–2185, 2017.
Geng, G., Zhang, Q., Martin, R. V., Lin, J., Huo, H., Zheng, B., Wang, S., and He, K.: Impact of spatial proxies on the representation of bottom-up emission inventories: A satellite-based analysis, Atmos. Chem. Phys., 17, 4131–4145, https://doi.org/10.5194/acp-17-4131-2017, 2017.
Hollingsworth, A. and Lönnberg, P.: The statistical structure of short-range forecast errors as determined from radiosonde data. Part I: The wind field, Tellus A, 38, 111–136, 1986.
Huang, R.-J., Zhang, Y., Bozzetti, C., Ho, K.-F., Cao, J.-J., Han, Y., Daellenbach, K. R., Slowik, J. G., Platt, S. M., Canonaco, F., Zotter, P., Wolf, R., Pieber, S. M., Bruns, E. A., Crippa, M.,Ciarelli, G., Piazzalunga, A., Schwikowski, M., Abbaszade, G.,SchnelleKreis, J., Zimmermann, R., An, Z., Szidat, S., Baltensperger, U., Haddad, I. E., and Prévôt, A. S. H.: High secondary aerosol contribution to particulate pollution during haze events in China, Nature, 514, 218–222, 2014.
Ji, Y., Qin, X., Wang, B., Xu, J., Shen, J., Chen, J., Huang, K., Deng, C., Yan, R., Xu, K., and Zhang, T.: Counteractive effects of regional transport and emission control on the formation of fine particles: a case study during the Hangzhou G20 summit, Atmos. Chem. Phys., 18, 13581–13600, https://doi.org/10.5194/acp-18-13581-2018, 2018.
Jiang, Z., McDonald, B. C., Worden, H., Worden, J. R., Miyazaki, K., Qu, Z., Henze, D. K., Jones, D. B. A., Arellano, A. F., Fischer, E. V., Zhu, L., and Boersma K. F.: Unexpected slowdown of US pollutant emission reduction in the past decade, P. Natl. Acad. Sci. USA, 115, 5099–5104, 2018.
Jung, J., Souri, A. H., Wong, D. C., Lee, S., Jeon, W., Kim, J., and Choi, Y.: The Impact of the Direct Effect of Aerosols on Meteorology and Air Quality Using Aerosol Optical Depth Assimilation During the KORUS-AQ Campaign, J. Geophys. Res.-Atmos., 124, 8303–8319, 2019.
Kain, J. S.: The Kain-Fritsch convective parameterization: an update, J. Appl. Meteorol., 43, 170–181, 2004.
Kumar, U., De Ridder, K., Lefebvre, W., and Janssen, S.: Data assimilation of surface air pollutants (O3 and NO2) in the regional-scale air quality model AURORA, Atmos. Environ., 60, 99–108, https://doi.org/10.1016/j.atmosenv.2012.06.005, 2012.
Li, B., Wang, F., Yin, H., and Li, X.: Mega events and urban air quality improvement: A temporary show?, J. Clean. Prod., 217, 116–126, 2019.
Li, G., Bei, N., Cao, J., Huang, R., Wu, J., Feng, T., Wang, Y., Liu, S., Zhang, Q., Tie, X., and Molina, L. T.: A possible pathway for rapid growth of sulfate during haze days in China, Atmos. Chem. Phys., 17, 3301–3316, https://doi.org/10.5194/acp-17-3301-2017, 2017.
Li, H., Wang, D., Cui, L., Gao, Y., Huo, J., Wang, X., Zhang, Z., Tan, Y., Huang, Y., Cao, J., Chow, J. C., Lee, S., and Fu, Q.: Characteristics of atmospheric PM2.5 composition during the implementation of stringent pollution control measures in shanghai for the 2016 G20 summit, Sci. Total Environ., 648, 1121–1129, 2019.
Li, K., Jacob, D. J., Liao, H., Zhu, J., Shah, V., Shen, L., Bates, K. H., Zhang, Q., and Zhai, S.: A two-pollutant strategy for improving ozone and particulate air quality in China, Nat. Geosci., 12, 906–910, 2019.
Li, M., Zhang, Q., Kurokawa, J.-I., Woo, J.-H., He, K., Lu, Z., Ohara, T., Song, Y., Streets, D. G., Carmichael, G. R., Cheng, Y., Hong, C., Huo, H., Jiang, X., Kang, S., Liu, F., Su, H., and Zheng, B.: MIX: a mosaic Asian anthropogenic emission inventory under the international collaboration framework of the MICS-Asia and HTAP, Atmos. Chem. Phys., 17, 935–963, https://doi.org/10.5194/acp-17-935-2017, 2017.
Li, P., Wang, L., Guo, P., Yu, S., Mehmood, K., Wang, S., Liu, W., Seinfeld, J. H., Zhang, Y., Wong, D. C., Alapaty, K., Pleim, J., and Mathur, R.: High reduction of ozone and particulate matter during the 2016 G-20 summit in Hangzhou by forced emission controls of industry and traffic, Environ. Chem. Lett., 15, 709–715, 2017.
Li, X., Choi, Y., Czader, B., Roy, A., Kim, H., Lefer, B., and Pan, S.: The impact of observation nudging on simulated meteorology and ozone concentrations during DISCOVER-AQ 2013 Texas campaign, Atmos. Chem. Phys., 16, 3127–3144, https://doi.org/10.5194/acp-16-3127-2016, 2016.
Liu, H., Liu, C., Xie, Z., Li, Y., Huang, X., Wang, S., Xu, J., and Xie, P.: A paradox for air pollution controlling in China revealed by “APEC Blue” and “Parade Blue,” Sci. Rep., 6, 1–13, 2016.
Ma, C., Wang, T., Mizzi, A. P., Anderson, J. L., Zhuang, B., Xie, M., and Wu, R.: Multi-constituent data assimilation with WRF-Chem/DART: Potential for adjusting anthropogenic emissions and improving air quality forecasts over eastern China, J. Geophys. Res.-Atmos., 124, 7393–7412, https://doi.org/10.1029/2019JD030421, 2019.
Ma, Z., Hu, X., Huang, L., Bi, J., and Liu, Y.: Estimating ground-level PM2.5 in China using satellite remote sensing, Environ. Sci. Technol., 48, 7436–7444, 2014.
Ma, Z., Hu, X., Sayer, A. M., Levy, R., Zhang, Q., Xue, Y., Tong, S., Bi, J., Huang, L., and Liu, Y.: Satellite-based spatiotemporal trends in PM2.5 concentrations: China, 2004–2013, Environ. Health Perspect., 124, 184–192, 2015.
Morrison, H. and Gettelman, A.: A new two-moment bulk stratiform cloud microphysics scheme in the Community Atmosphere Model, version 3 (CAM3). Part I: Description and numerical tests, J. Climate, 21, 3642–3659, 2008.
Mu, Q. and Liao, H.: Simulation of the interannual variations of aerosols in China: role of variations in meteorological parameters, Atmos. Chem. Phys., 14, 9597–9612, https://doi.org/10.5194/acp-14-9597-2014, 2014.
Ni, Z.-Z., Luo, K., Gao, Y., Gao, X., Jiang, F., Huang, C., Fan, J.-R., Fu, J. S., and Chen, C.-H.: Spatial–temporal variations and process analysis of O3 pollution in Hangzhou during the G20 summit, Atmos. Chem. Phys., 20, 5963–5976, https://doi.org/10.5194/acp-20-5963-2020, 2020.
Pleim, J. E.: A combined local and nonlocal closure model for the atmospheric boundary layer. Part I: Model description and testing, J. Appl. Meteorol. Clim., 46, 1383–1395, 2007a.
Pleim, J. E.: A combined local and nonlocal closure model for the atmospheric boundary layer. Part II: Application and evaluation in a mesoscale meteorological model, J. Appl. Meteorol. Clim., 46, 1396–1409, 2007b.
Rutherford, I. D.: Data assimilation by statistical interpolation of forecast error fields, J. Atmos. Sci., 29, 809–815, 1972.
Seinfeld, J. H. and Pandis, S. N.: Atmospheric chemistry and physics: from air pollution to climate change, John Wiley & Sons, Hoboken, NJ, USA, 1–1326, ISBN 978-1-118-94740-1, 2016.
Sheehan, P., Cheng, E., English, A., and Sun, F.: China's response to the air pollution shock, Nat. Clim. Change, 4, 306–309, 2014.
Shi, H., Wang, Y., Chen, J., and Huisingh, D.: Preventing smog crises in China and globally, J. Clean. Prod., 112, 1261–1271, 2016.
Shu, L., Wang, T., Han, H., Xie, M., Chen, P., Li, M., and Wu, H.: Summertime ozone pollution in the Yangtze River Delta of eastern China during 2013–2017: Synoptic impacts and source apportionment, Environ. Pollut., 257, 113631, https://doi.org/10.1016/j.envpol.2019.113631, 2020.
Sun, Y., Wang, Z., Wild, O., Xu , W., Chen, C., Fu, P., Du, W., Zhou, L., Zhang, Q., Han, T., Wang, Q., Pan, X., Zheng, H., Li, J., Guo, X., Liu, J., and Worsnop, D. R.: “APEC blue”: secondary aerosol reductions from emission controls in Beijing, Sci. Rep., 6, 20668, https://doi.org/10.1038/srep20668, 2016.
Tai, A. P. K., Mickley, L. J., and Jacob, D. J.: Impact of 2000–2050 climate change on fine particulate matter (PM2.5) air quality inferred from a multi-model analysis of meteorological modes, Atmos. Chem. Phys., 12, 11329–11337, https://doi.org/10.5194/acp-12-11329-2012, 2012.
Wang, P., Guo, H., Hu, J., Kota, S. H., Ying, Q., and Zhang, H.: Responses of PM2.5 and O3 concentrations to changes of meteorology and emissions in China, Sci. Total Environ., 662, 297–306, 2019.
Wang, Y., Zhang, Q., Jiang, J., Zhou, W., Wang, B., He, K., Duan, F., Zhang, Q., Philip, S., and Xie, Y.: Enhanced sulfate formation during China's severe winter haze episode in January 2013 missing from current models, J. Geophys. Res.-Atmos., 119, 10425–10440, https://doi.org/10.1002/2013JD021426, 2014.
Wong, D. C., Pleim, J., Mathur, R., Binkowski, F., Otte, T., Gilliam, R., Pouliot, G., Xiu, A., Young, J. O., and Kang, D.: WRF-CMAQ two-way coupled system with aerosol feedback: software development and preliminary results, Geosci. Model Dev., 5, 299–312, https://doi.org/10.5194/gmd-5-299-2012, 2012.
Xie, H., Wang, L., Ling, X., Miao, Y., Shen, X., Wang, M., and Xin, Y.: China air quality management assessment report (2016), Clean Air Asia, available at: https://environmental-partnership.org/wp-content/uploads/2015/09/China_Air_Quality_Management_Assessment_Report.pdf (last access: 1 December 2020), 2015.
Xiu, A. and Pleim, J. E.: Development of a land surface model. Part I: Application in a mesoscale meteorological model, J. Appl. Meteorol., 40, 192–209, 2001.
Xue, T., Zheng, Y., Tong, D., Zheng, B., Li, X., Zhu, T., and Zhang, Q.: Spatiotemporal continuous estimates of PM2.5 concentrations in China, 2000–2016: A machine learning method with inputs from satellites, chemical transport model, and ground observations, Environ. Int., 123, 345–357, 2019.
Yan, B., Liu, S., Zhao, B., Li, X., Fu, Q., and Jiang, G.: China's fight for clean air and human health, Environ. Sci. Technol., 52, 8063–8064, 2018.
Yang, W., Yuan, G., and Han, J.: Is China's air pollution control policy effective? Evidence from Yangtze River Delta cities, J. Clean. Prod., 220, 110–133, 2019.
Yang, Y., Liao, H., and Lou, S.: Increase in winter haze over eastern China in recent decades: Roles of variations in meteorological parameters and anthropogenic emissions, J. Geophys. Res.-Atmos., 121, 13050–13065, https://doi.org/10.1002/2016JD025136, 2016.
Yarwood, G., Rao, S., Yocke, M., and Whitten, G. Z.: Updates to the Carbon Bond Chemical Mechanism: CB05, Final Report Prepared for US EPA, 2015, available at: http://www.camx.com/publ/pdfs/CB05_Final_Report_120805.pdf (last access: 1 December 2020), 2005.
Yu, H., Dai, W., Ren, L., Liu, D., Yan, X., Xiao, H., He, J., and Xu, H.: The effect of emission control on the submicron particulate matter size distribution in Hangzhou during the 2016 G20 Summit, Aerosol Air Qual. Res., 18, 2038–2046, 2018.
Yu, S., Mathur, R., Pleim, J., Wong, D., Gilliam, R., Alapaty, K., Zhao, C., and Liu, X.: Aerosol indirect effect on the grid-scale clouds in the two-way coupled WRF–CMAQ: model description, development, evaluation and regional analysis, Atmos. Chem. Phys., 14, 11247–11285, https://doi.org/10.5194/acp-14-11247-2014, 2014.
Zhai, S., Jacob, D. J., Wang, X., Shen, L., Li, K., Zhang, Y., Gui, K., Zhao, T., and Liao, H.: Fine particulate matter (PM2.5) trends in China, 2013–2018: separating contributions from anthropogenic emissions and meteorology, Atmos. Chem. Phys., 19, 11031–11041, https://doi.org/10.5194/acp-19-11031-2019, 2019.
Zhang, L., Shao, J., Lu, X., Zhao, Y., Hu, Y., Henze, D. K., Liao, H., Gong, S., and Zhang, Q.: Sources and processes affecting fine particulate matter pollution over North China: an adjoint analysis of the Beijing APEC period, Environ. Sci. Technol., 50, 8731–8740, 2016.
Zhang, Q., He, K., and Huo, H.: Policy: cleaning China's air, Nature, 484, 161–162, https://doi.org/10.1038/484161a, 2012.
Zhang, Q., Zheng, Y., Tong, D., Shao, M., Wang, S., Zhang, Y., Xu, X., Wang, J., He, H., Liu, W., Ding, Y., Lei, Y., Li, J., Wang, Z., Zhang, X., Wang, Y., Cheng, J., Liu, Y., Shi, Q., Yan, L., Geng, G., Hong, C., Li, M., Liu, F., Zheng, B., Cao, J., Ding, A., Gao, J., Fu, Q., Huo, J., Liu, B., Liu, Z., Yang, F., He, K., and Hao, J.: Drivers of improved PM2.5 air quality in China from 2013 to 2017, P. Natl. Acad. Sci. USA, 116, 24463–24469, https://doi.org/10.1073/pnas.1907956116, 2019.
Zhang, R., Wang, G., Guo, S., Zamora, M. L., Ying, Q., Lin, Y., Wang, W., Hu, M., and Wang, Y.: Formation of urban fine particulate matter, Chem. Rev., 115, 3803–3855, 2015.
Zhang, Y.-L. and Cao, F.: Fine particulate matter (PM2.5) in China at a city level, Sci. Rep., 5, 14884, https://doi.org/10.1038/srep14884, 2015.
Zhong, Q., Ma, J., Shen, G., Shen, H., Zhu, X., Yun, X., Meng, W., Cheng, H., Liu, J., Li, B., Wang, X., Zeng, E. Y., Guan, D., and Tao, S.: Distinguishing Emission-Associated Ambient Air PM2.5 Concentrations and Meteorological Factor-Induced Fluctuations, Environ. Sci. Technol., 52, 10416–10425, https://doi.org/10.1021/acs.est.8b02685, 2018.