the Creative Commons Attribution 4.0 License.
the Creative Commons Attribution 4.0 License.
 | 02 Dec 2020
Validation of reanalysis Southern Ocean atmosphere trends using sea ice data
Andrew R. Klekociuk
Yuhang Pan
Reanalysis products are an invaluable tool for representing variability and long-term trends in regions with limited in situ data, and especially the Antarctic. A comparison of eight different reanalysis products shows large differences in sea level pressure and surface air temperature trends over the high-latitude Southern Ocean, with implications for studies of the atmosphere's role in driving ocean–sea ice changes. In this study, we use the established close coupling between sea ice cover and surface temperature to evaluate these reanalysis trends using the independent, 30-year sea ice record from 1980 to 2010. We demonstrate that sea ice trends are a reliable validation tool for most months of the year, although the sea ice–surface temperature coupling is weakest in summer when the surface energy budget is dominated by atmosphere-to-ocean heat fluxes. Based on our analysis, we find that surface air temperature trends in JRA55 are most consistent with satellite-observed sea ice trends over the polar waters of the Southern Ocean.
- Article
(3793 KB) - Full-text XML
-
Supplement
(24800 KB) - BibTeX
- EndNote


Atmospheric trends in the southern high latitudes have global importance. Wind patterns are essential for driving the Southern Ocean overturning, which is responsible for most of the global ocean's uptake of anthropogenic heat and approximately half its uptake of anthropogenic carbon (Frolicher et al., 2015). Local wind changes are a factor in the ocean melting of West Antarctic ice shelves (Lenaerts et al., 2017; Paolo et al., 2018; Dotto et al., 2019), with implications for global barystatic sea level rise (Dupont and Alley, 2005; Pritchard et al., 2012; Paolo et al., 2015), and polar winds are clearly related to observed Antarctic sea ice trends (Holland and Kwok, 2012). More immediately, variability in the Southern Annular Mode – the dominant mode of mid- to high-latitude Southern Hemisphere atmospheric variability – is thought to influence Australian rainfall (Meneghini et al., 2007), with implications for current and future droughts. Clearly, a reliable and accurate representation of high-latitude Southern Hemisphere atmosphere trends is essential.
For this data-sparse region, atmospheric reanalysis products are the primary research tool for analysing observed changes or as surface boundary conditions for ocean–sea ice models. However, there is a wide spread in surface atmosphere trends over the Southern Ocean amongst different reanalysis products, which introduces uncertainty when interpreting observed ocean and sea ice trends (Marshall, 2003; Swart and Fyfe, 2012; Hobbs et al., 2016). Reanalysis validation studies have attempted to address this uncertainty but have largely been restricted to comparisons with long-term surface measurement sites, almost all of which are located near the Antarctic coast (e.g. Turner et al., 2014); relatively few studies have been conducted for the sea ice zone (Bracegirdle and Marshall, 2012; Jones et al., 2016).
Figure 1 shows linear trends in 2 m air temperature (SAT) and mean sea level pressure (MSLP) from eight commonly used atmosphere reanalyses (summarized in Table 1) and clearly demonstrates this spread in trends. Much of this spread is due to differences in the forecast model and assimilation technique, but it should be noted that some of the products (ERA20C and 20CRv3) are not constrained by satellite data in order to give a consistent product over long historical periods; this is a major limitation in the remote Antarctic region. Some reanalyses show almost no warming at all in West Antarctica, whilst NCEP2 shows a warming over the entire sea ice zone. Station data show a distinct asymmetry in the long-term behaviour of SAT between Antarctica's eastern and western hemispheres, with the statistical significance of trends depending on epoch, season, and location. A general warming has occurred in recent decades in the Antarctic Peninsula and parts of West Antarctica, with weaker mixed trends in East Antarctica (Marshall et al., 2013; Nicolas and Bromwich, 2014; Turner et al., 2014). Compared with station measurements, SAT trends in reanalyses show less consistency, with spurious behaviour in some regions, particularly in East Antarctica, where surface stations are sparse (Bromwich et al., 2013; Steig and Orsi, 2013; Wang et al., 2016; Simmons et al., 2017). However, there is generally better agreement between observations and reanalyses when interannual variability rather than trends is considered (e.g. Wang et al., 2016).

There is a similar spread in MSLP trends; many of the reanalyses show the widely reported deepening of the Amundsen Sea Low (Hosking et al., 2013; Turner et al., 2013; Raphael et al., 2016) – although with some disagreement on magnitude and exact location – but by no means all of them. Additionally, there is a known spread amongst reanalyses in the magnitude of the Southern Annular Mode positive trend (Marshall, 2003; Swart and Fyfe, 2012). This raises the question of which representation is the most accurate for interpreting recent historical changes in the atmosphere–ocean–cryosphere system of the polar Southern Ocean.
There is a close link between sea ice cover and the atmosphere, both for interannual variability and at longer timescales (e.g. Comiso et al., 2017). Atmospheric thermal advection modulates the rate of sea ice freeze/melt, and wind-driven ice motion redistributes the existing sea ice. In the Southern Ocean the sea ice–atmosphere relationship tends to be stronger in the sea ice growth season and weaker in the melt season (Raphael and Hobbs, 2014; Schroeter et al., 2017). This may be because approximately half of the heat driving sea ice melt comes from the ocean (Gordon, 1981), diminishing the relative impact of the atmosphere. The atmosphere–sea ice relationship is particularly strong for surface air temperature (e.g. Comiso et al., 2017) due to positive feedbacks: a colder air temperature leads to increased sea ice cover, which due to increased albedo and much reduced ocean-to-atmosphere heat flux can further reduce air temperature. In short, sea ice affects air temperature, and air temperature affects sea ice.
Previous studies have exploited this close relationship to study sea ice. Notably, King and Harangozo (1998) demonstrated a close link between Antarctic Peninsula station temperature and local sea ice changes, Massonnet et al. (2013) were able to reproduce Antarctic sea ice variability in a model driven by SAT, and both Kusahara et al. (2017) and Schroeter et al. (2018) showed the important role that thermodynamic forcing has in Antarctic sea ice trends. This close coupling between SAT and sea ice concentration (SIC) indicates that the passive microwave sea ice record may be used as an independent validation of reanalysis SAT trends, at least for the broad spatial patterns that are clearly different in Fig. 1.
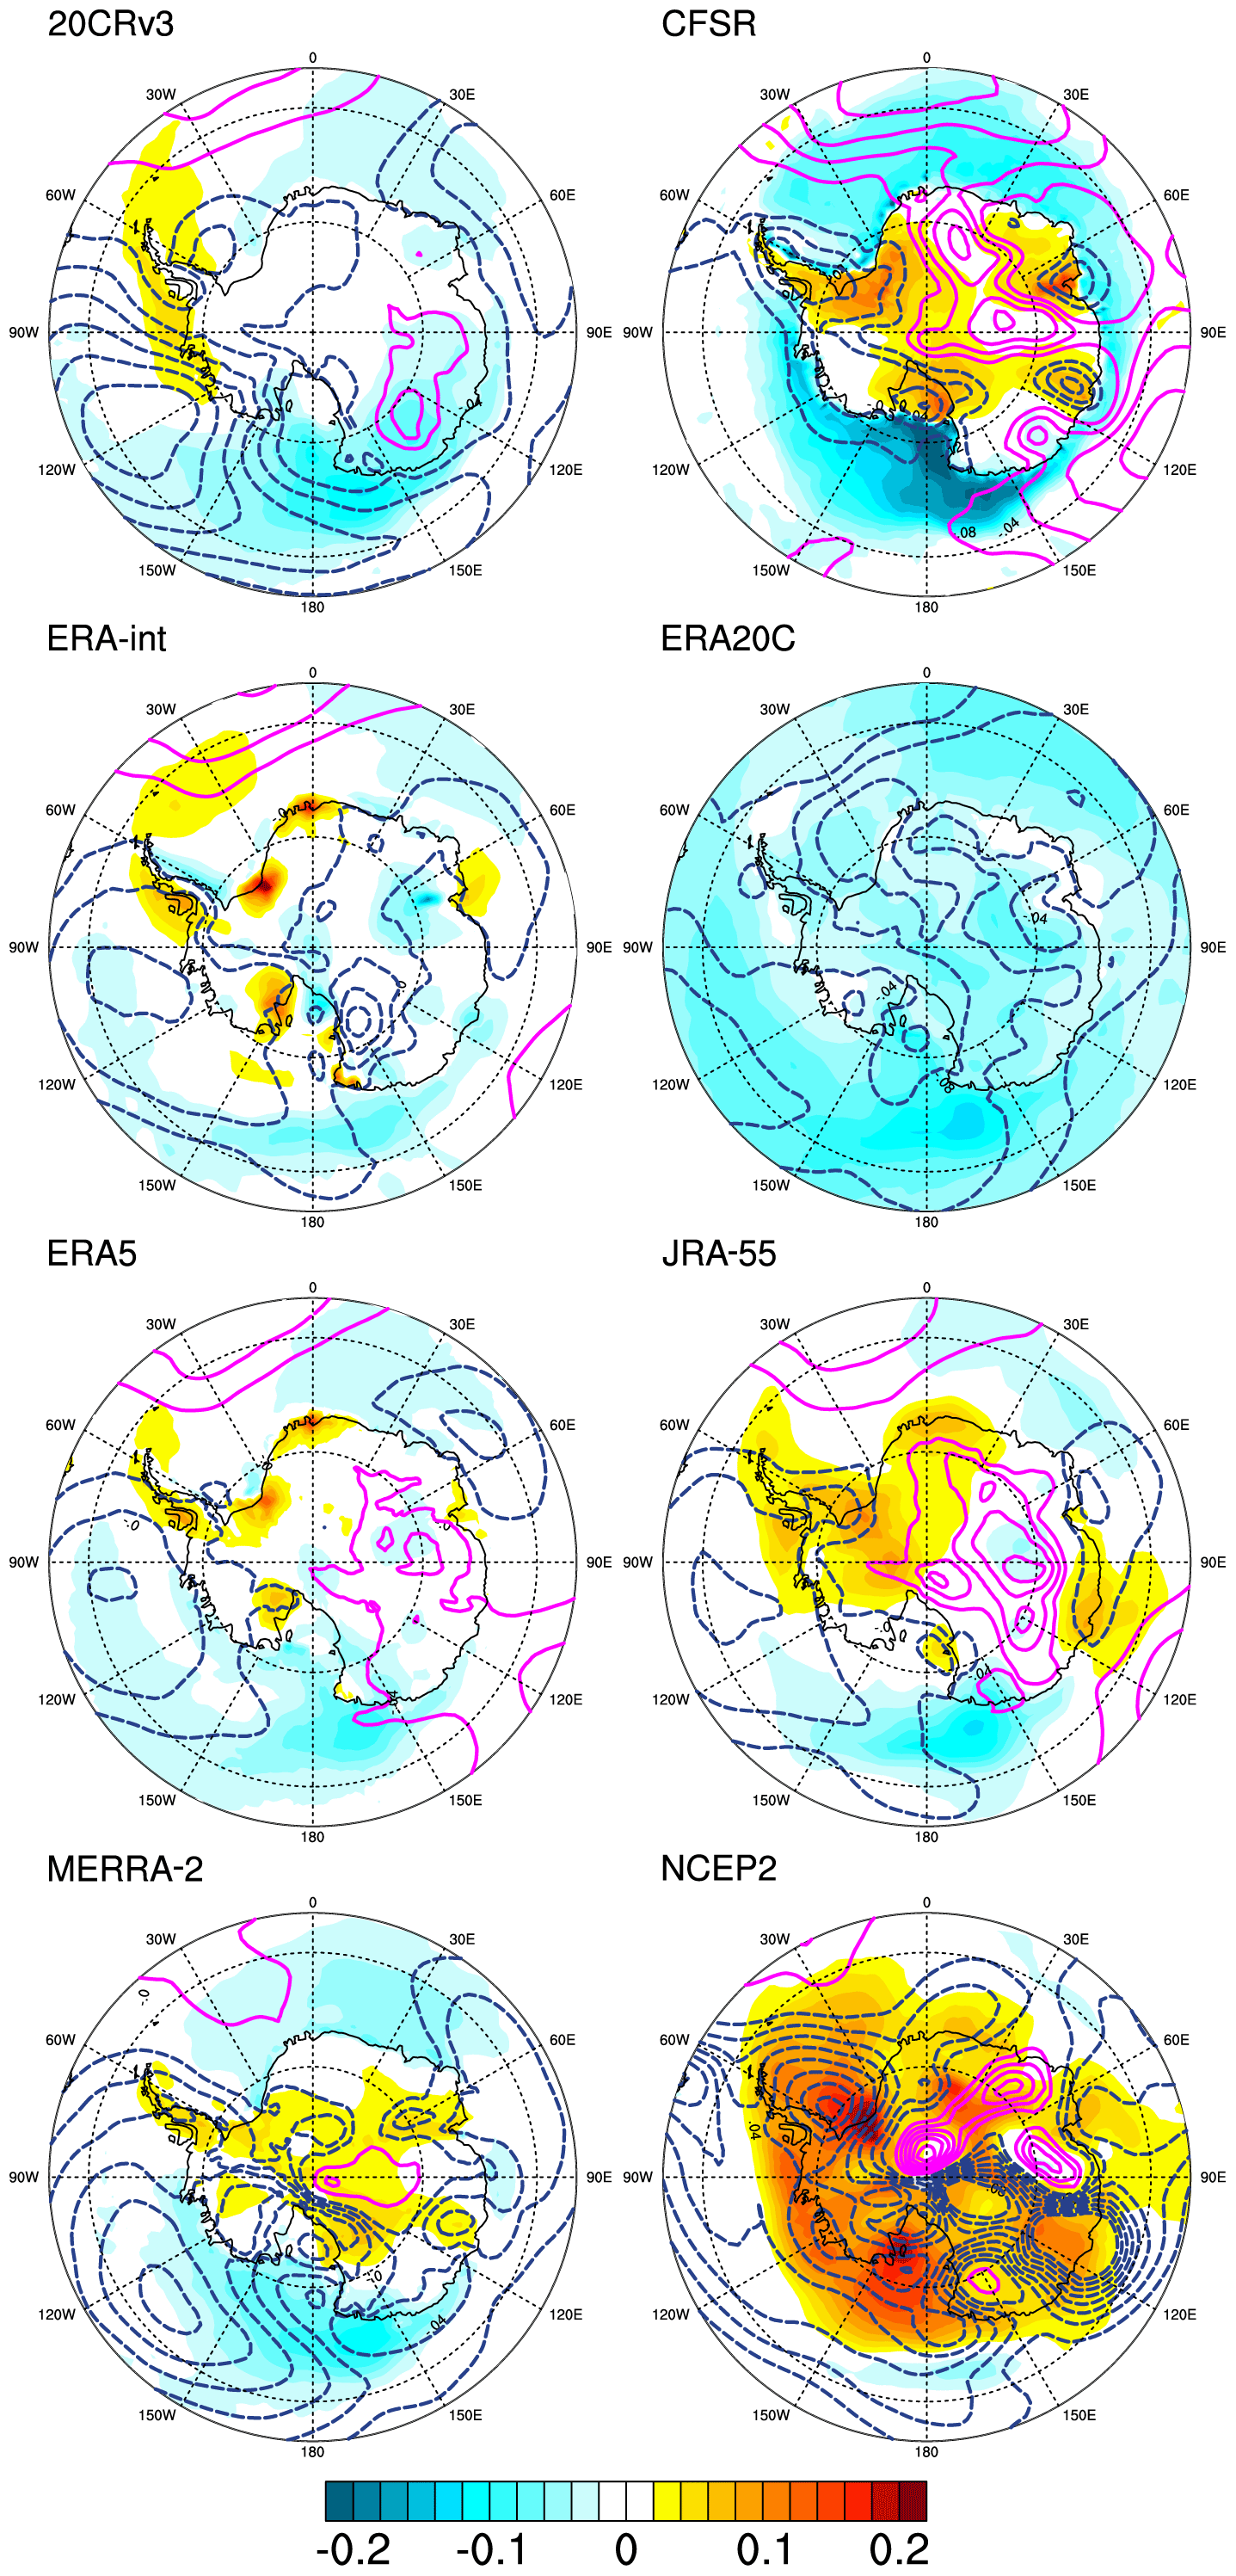
Figure 11980–2010 trends in annual-mean SAT (shading: ∘C/year) and MSLP (contour lines: positive trends in blue, negative trends in magenta, with contour spacing = 2.5 Pa/year) for eight individual reanalyses (refer to Table 1 for details). Trend patterns for each month are shown in the Supplement as Figs. S1–S12.
In this study, we perform just such an evaluation. We demonstrate that SIC and SAT variability is closely related for much of the year, except for the season of strongest sea ice melt. Based on that premise, we find that a number of reanalysis products have trends that are physically consistent with independently observed sea ice trends, with ERA5 showing a marginally better agreement than other products. A smaller group of products is very obviously inconsistent with the sea ice trends and should be avoided for studies of long-term change in the high-latitude Southern Hemisphere. We argue that the weak SAT–SIC relationship in summer is due to the direction of ocean–atmosphere heat flux in those months; since the net balance in the sea ice zone is from atmosphere to ocean, the surface energy budget is more a response to – rather than a driver of – the near-surface atmosphere.
We use monthly mean SIC from passive microwave satellite observations as the primary dataset for evaluating reanalysis SAT trends. Specifically, we use the Goddard-merged data from the NOAA/NSIDC climate data record for SIC, available on a 25 km × 25 km equal-area grid (Meier et al., 2014).
We analyse monthly mean SIC, SAT and MSLP from eight publicly available reanalysis products, which are summarized in Table 1. These products span a range of spatial resolutions, assimilation algorithms, and analysis periods. For this study, we consider the period 1980–2010 inclusive, which is the longest period covered by all eight reanalyses, constrained by MERRA2 (starting in January 1980) and ERA-20C (ending in December 2010), and matching the period of the SPARC Reanalysis Intercomparison Project (S-RIP: Fujiwara et al., 2017).
Although we consider the relationship between SAT and SIC at interannual timescales, our primary focus is on the 31-year trends of the analysis period, calculated by month using ordinary least squares regression. To quantify the level of agreement between trend patterns for SIC and reanalysis SAT, we use an uncentered pattern correlation (i.e. without removing spatial means), applying cosine weighting to account for latitude dependence of the grid area. To facilitate this, all variables were regridded onto a common 1∘ × 1∘ latitude–longitude grid using bilinear interpolation.
3.1 Evaluation of SAT based on sea ice trends
Although sea ice trends are not themselves the focus of this work, except as an independent validation of reanalysis SAT, the observed SIC trends are shown in Fig. 2 for illustrative purposes. (Note that while the trends are aggregated in Fig. 2 into seasons defined by sea ice melt/growth, for the SAT validation we used monthly trends, shown in the Supplement.) The trend patterns are well-established and have been described in many previous studies (e.g. Parkinson and Cavalieri, 2012; Hobbs et al., 2016; Comiso et al., 2017) and can be broadly summarized as a decrease in the Amundsen and Bellingshausen seas (60–120∘ W), with compensating increases in the western Ross Sea (150–180∘ E), Weddell Sea and King Haakon VII Sea (50∘ W–30∘ E). There is some seasonal dependence, and the Ross Sea is the only region that has statistically significant trends in all seasons. From this SIC pattern, we would expect a warming SAT trend in the region of the Antarctic Peninsula and a cooling one elsewhere, a pattern that is expressed by some of the reanalyses in Fig. 1 but by no means all.
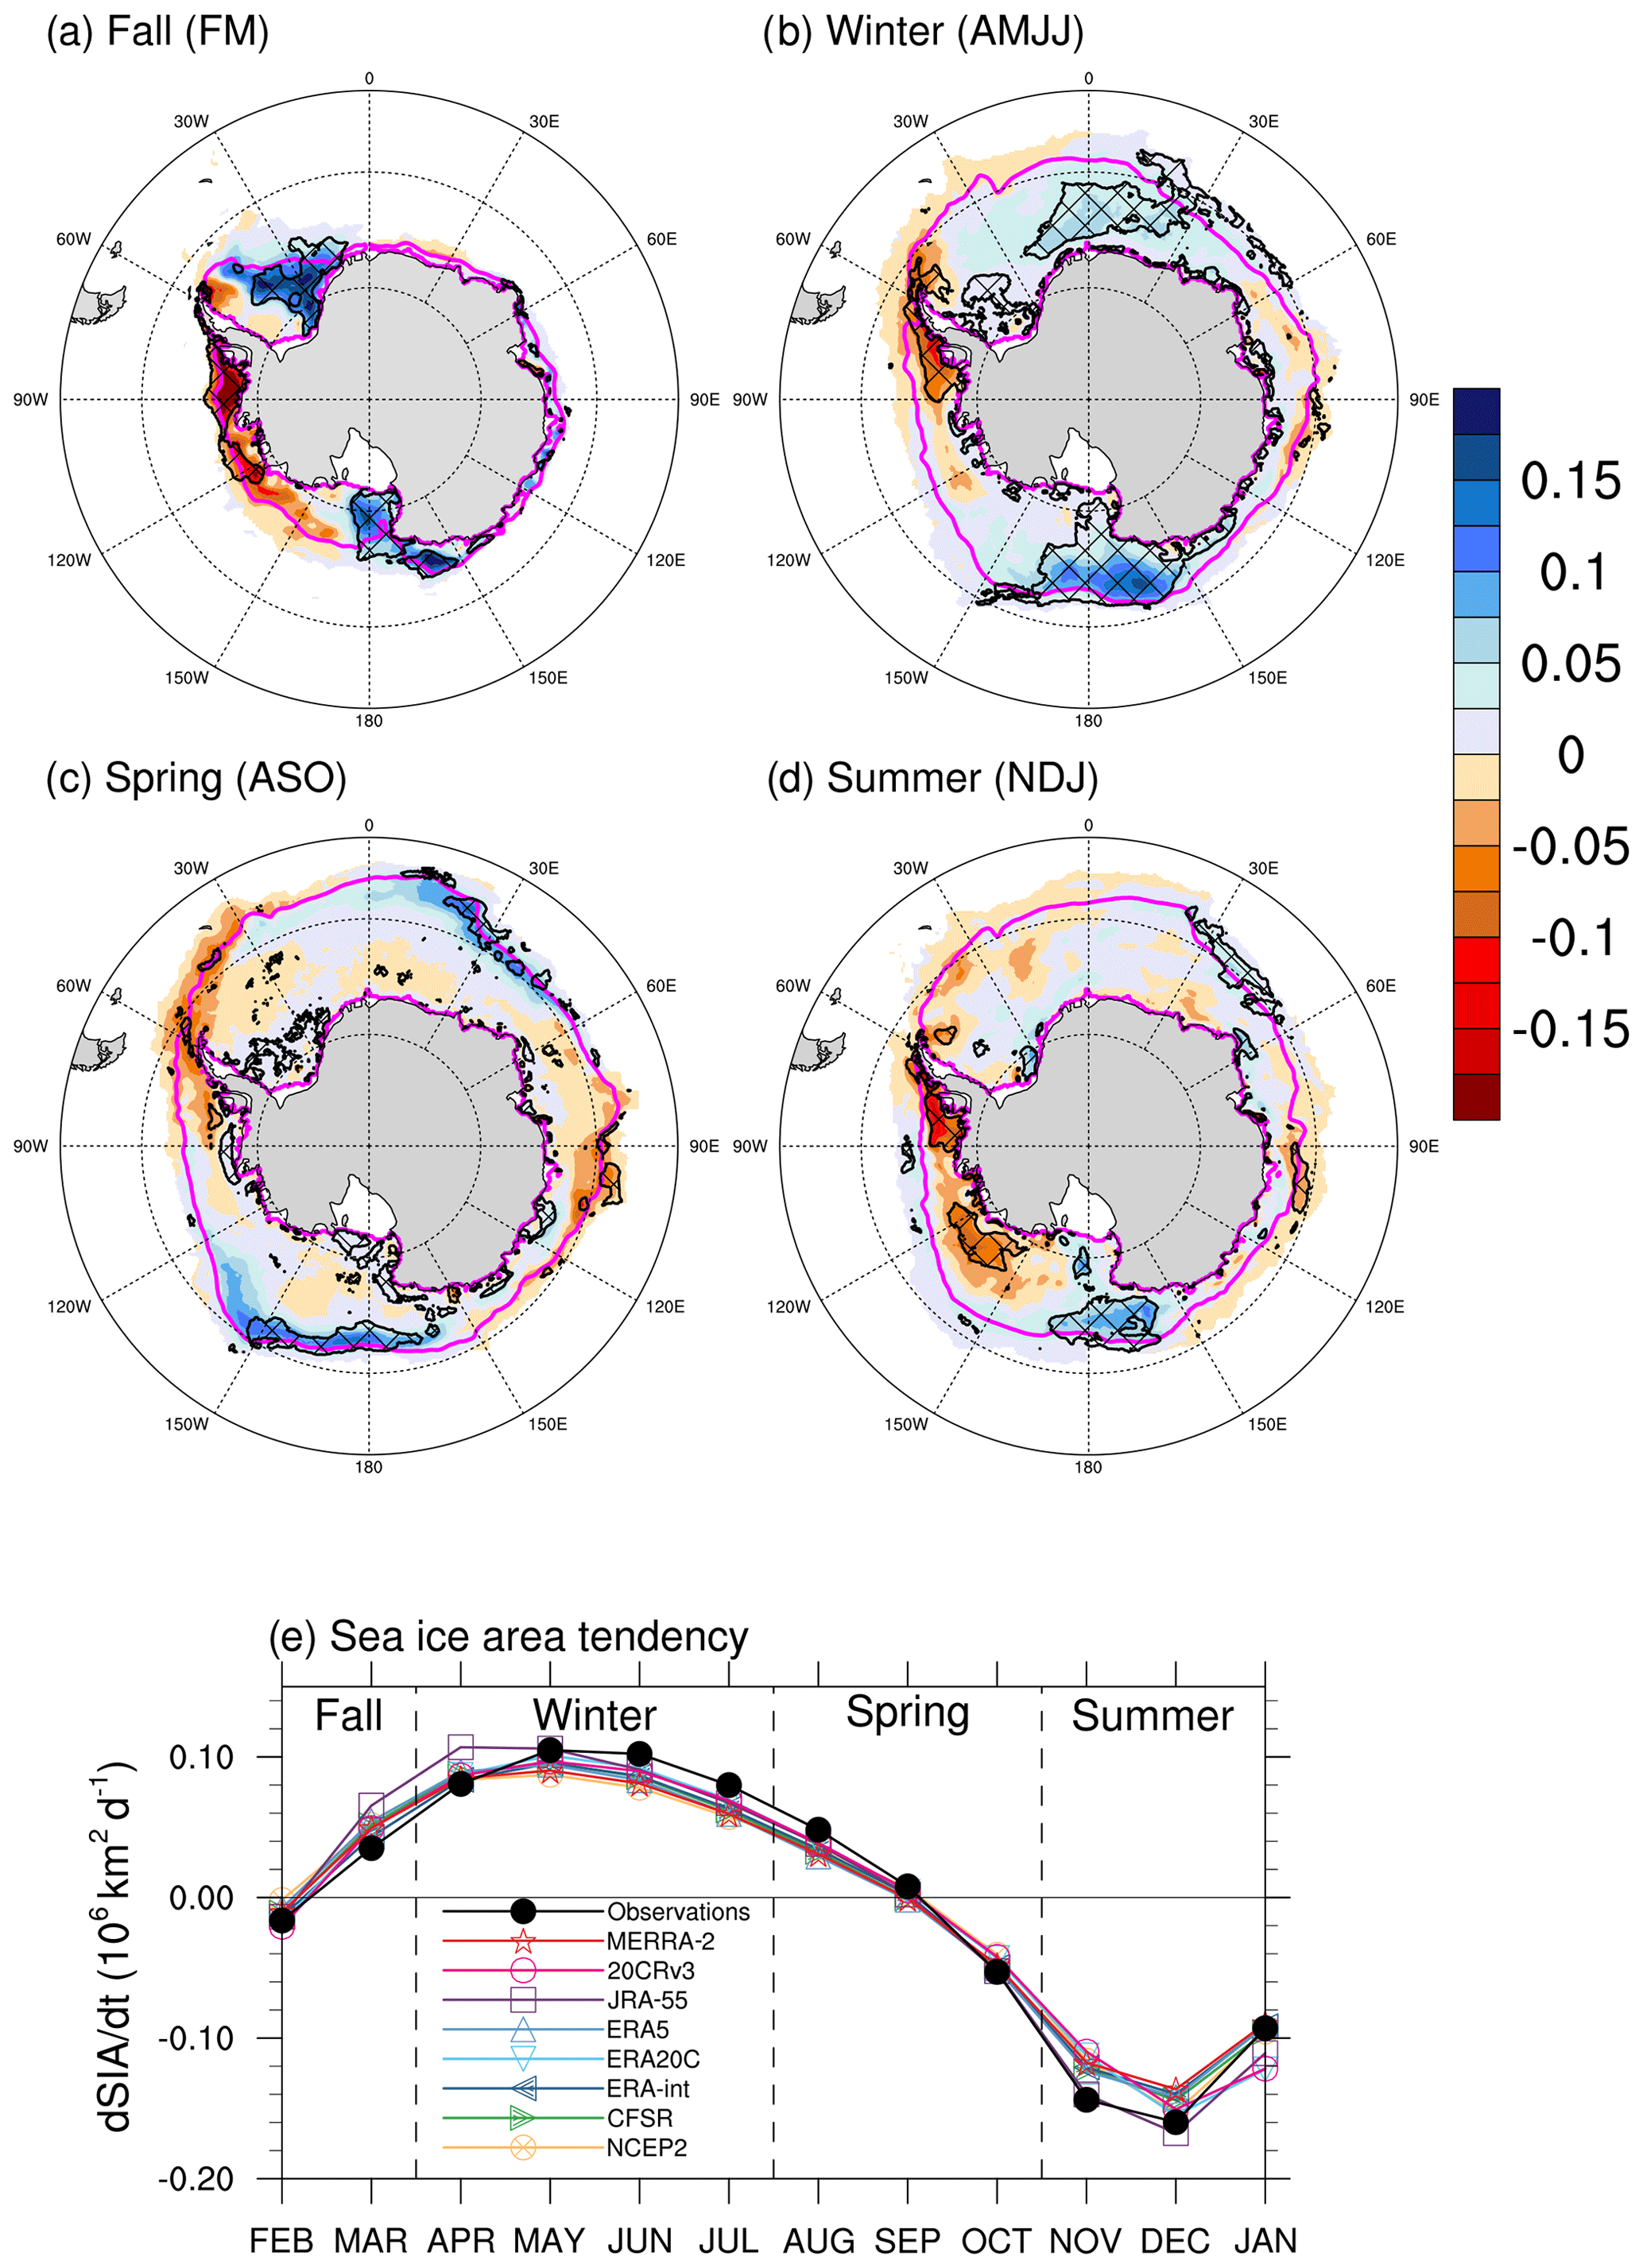
Figure 2Panels (a)–(d) show observed 1980–2010 Antarctic SIC trends by season (decade−1). Hatching indicates trends that are statistically significant at the 0.05 significance level, and magenta lines show the climatological sea ice edge (defined by the 15 % SIC isoline). Seasons are defined by total sea ice area (SIA) growth and melt (dSIA/dt), shown in panel (e). Line colours in (e) follow the SPARC Reanalysis Intercomparison Project (S-RIP) standard.
To quantify the level of agreement between SIC and SAT trends, we calculated correlations for each season and reanalysis amongst observed SIC, reanalysis SIC, and reanalysis SAT trends (Fig. 3). Most of the reanalyses use boundary sea ice conditions that match the passive microwave record reasonably well, with trend pattern correlations consistently greater than 0.9 for many products, the best match being for ERA5 (Fig. 3a). Both ERA-int and MERRA2 have a sea ice boundary condition that diverges somewhat from observations in late winter. The NCEP reanalyses (i.e. NCEP2 and CFSR) have a coupled, freely evolving ocean–sea ice system, which explains the very low agreement with the satellite record compared to the products which use a prescribed sea ice condition.
Figure 3b shows the pattern correlation between reanalysis SAT trends and the trend of each reanalysis product's prescribed SIC trend. This serves as a test for the expectation that SAT and prescribed SIC trends should be internally consistent, regardless of the actual SIC trend pattern. For most months and reanalyses this is indeed the case, with strong negative correlations for most of the year. NCEP2 is the exception and shows a positive correlation for much of the year, presumably because of its strong warming pattern in the sea ice zone (Fig. 1) that is inconsistent with an increased sea ice cover in much of the Antarctic domain. The sea ice–SAT trend relationship is strongest in the main sea ice growth season (March–July), consistent with previous model and observational studies showing that the sea ice–atmosphere relationship is stronger during the growth season (Raphael and Hobbs, 2014; Schroeter et al., 2017). The relationship is surprisingly weak in December and January, months combining high melt rates with relatively low sea ice cover. We explore this result in more detail in Sect. 3.2 and note that for these months SIC trends may be a less reliable test for SAT trends.

Figure 3Uncentered pattern correlations by month between 1980–2010 SIC and SAT trends: (a) correlations between the observed SIC trend and each reanalysis' SIC; (b) correlations between each reanalysis SAT trend and reanalysis' SIC trend; (c) correlation between reanalysis SAT trend and observed SIC trend. Differences between each reanalysis SIC and the Goddard merged SIC product for each month are shown in the Supplement Figs. S13–S24.
Figure 3c shows the pattern correlations between observed SIC trends and reanalysis SAT and therefore summarizes the evaluation of SAT in the reanalyses based on Antarctic sea ice trends. Other than for December–January when the SAT–SIC relationship is relatively weak, JRA55 and 20CRv3 have consistently the closest relationship between SAT and SIC trends despite ERA5 having a closer correspondence between prescribed SIC and the satellite record (Fig. 3a). ERA20C and ERA5 also have reasonable agreement for much of the year, but none of the ERA products have any SAT–SIC trend correlation in December–January. ERA-int also has a notably weak SAT–SIC relationship in August, which seems to be largely due to the disagreement between the observed SIC trend and that of ERA-int's sea ice (Fig. 3a), since the correlation between ERA-int SIC and SAT is strongly negative in August (Fig. 3b).
Based on this analysis we would conclude that JRA55 and 20CRv3 have the best representations of change since the late 1970s over the polar Southern Ocean, under the assumption that SIC trends should be closely related to SAT trends. We note that this may not hold true for earlier periods which are unconstrained by satellite retrievals and for which we do not have reliable sea ice observations. An interesting point to note is that although JRA55 performs well with respect to this metric, it has the strongest sea ice bias in March and April. This raises the question of whether the mean state is a good indicator of performance in respect of variability or trends.
The summer SIC–SAT relationship is much weaker in summer for all the products, but in the three ECMWF products analysed here (ERA5, ERA-int and ERA20C), this relationship completely disappears. We further tested the physical relationship between sea ice and air temperature by mapping the correlation coefficients between detrended, interannually varying reanalysis SAT and SIC, for each calendar month (Supplement Figs. S25–S36). The results are similar to those for the trend pattern correlations, showing a strong negative correlation throughout the ice pack in most months, but which is weaker and more complex in summer. In mid-winter the correlations are concentrated at the sea ice edge, where sea ice variability is greatest. The reanalyses with very high SIC have limited correlations within the ice pack, since sea ice concentrations > 0.9 must have limited variance and therefore weak covariance with SAT. In the next section, we explore the weak SAT–SIC relationship in December–January in more detail.
3.2 Further exploration of summer SAT–sea ice relationship
The correlations show that generally the relationship between SIC and SAT 30-year trends is weaker in December and January (Fig. 3b). It is worthwhile considering the physical reasons for this weak summer relationship between SAT and sea ice, which are strongly coupled for the rest of the year. We note that December and January are months with very strong sea ice melt (Fig. 2e) due to a surface heat flux from atmosphere to ocean. By contrast, for most of the year (March–October), the heat flux is from ocean to atmosphere, driving the ocean cooling that allows sea ice to form, and for these months there is a positive relationship between the magnitude of cooling and the strength of the SAT–SIC correlation for the reanalyses (Fig. 4); i.e. stronger cooling leads to a stronger negative SIC–SAT correlation. During these cold months, SAT is cooler where sea ice prevents a flux of heat from ocean to atmosphere and warmer over open water, which is the physical mechanism explaining the negative correlation between SAT and SIC trends.
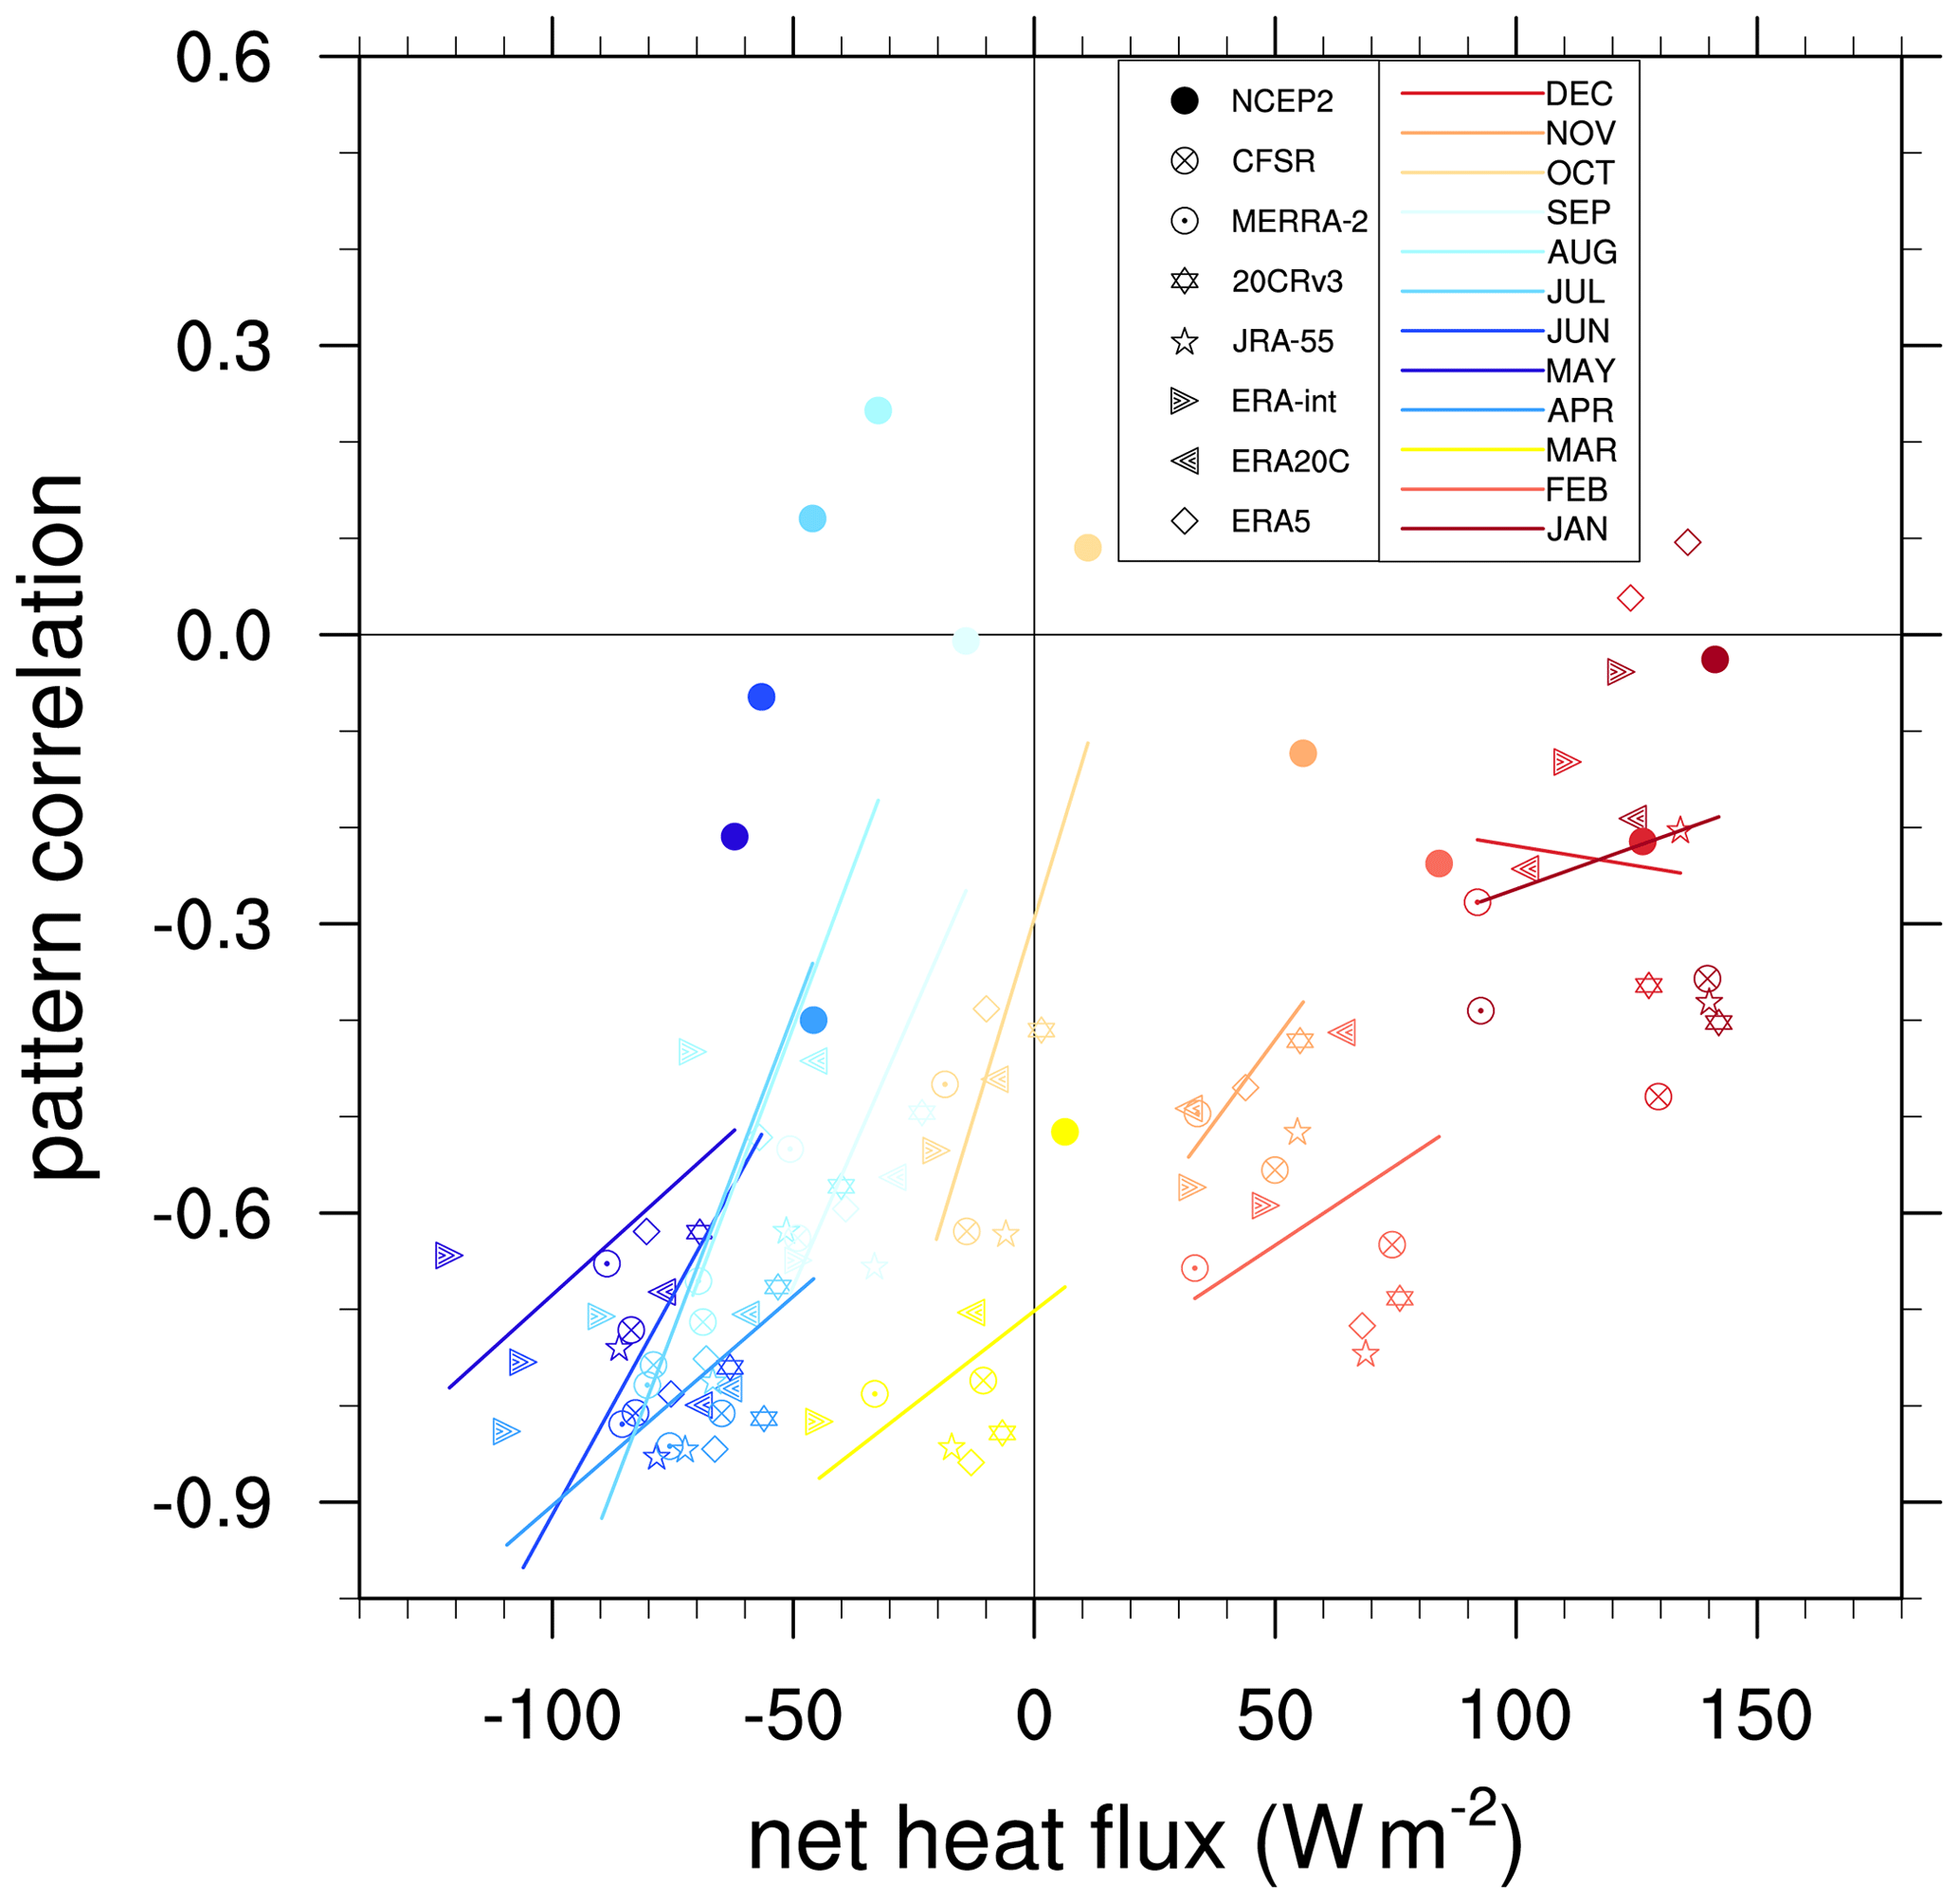
Figure 4Net heat flux averaged over sea ice zone (x axis: Wm−2, where positive indicates net flux from atmosphere to ocean), against the pattern correlation between reanalysis SIC and SAT (i.e. values plotted in Fig. 3b). Data points are coloured by month with different markers for each reanalysis. Coloured lines show the best-fit line for each month estimated by ordinary least squares regression.
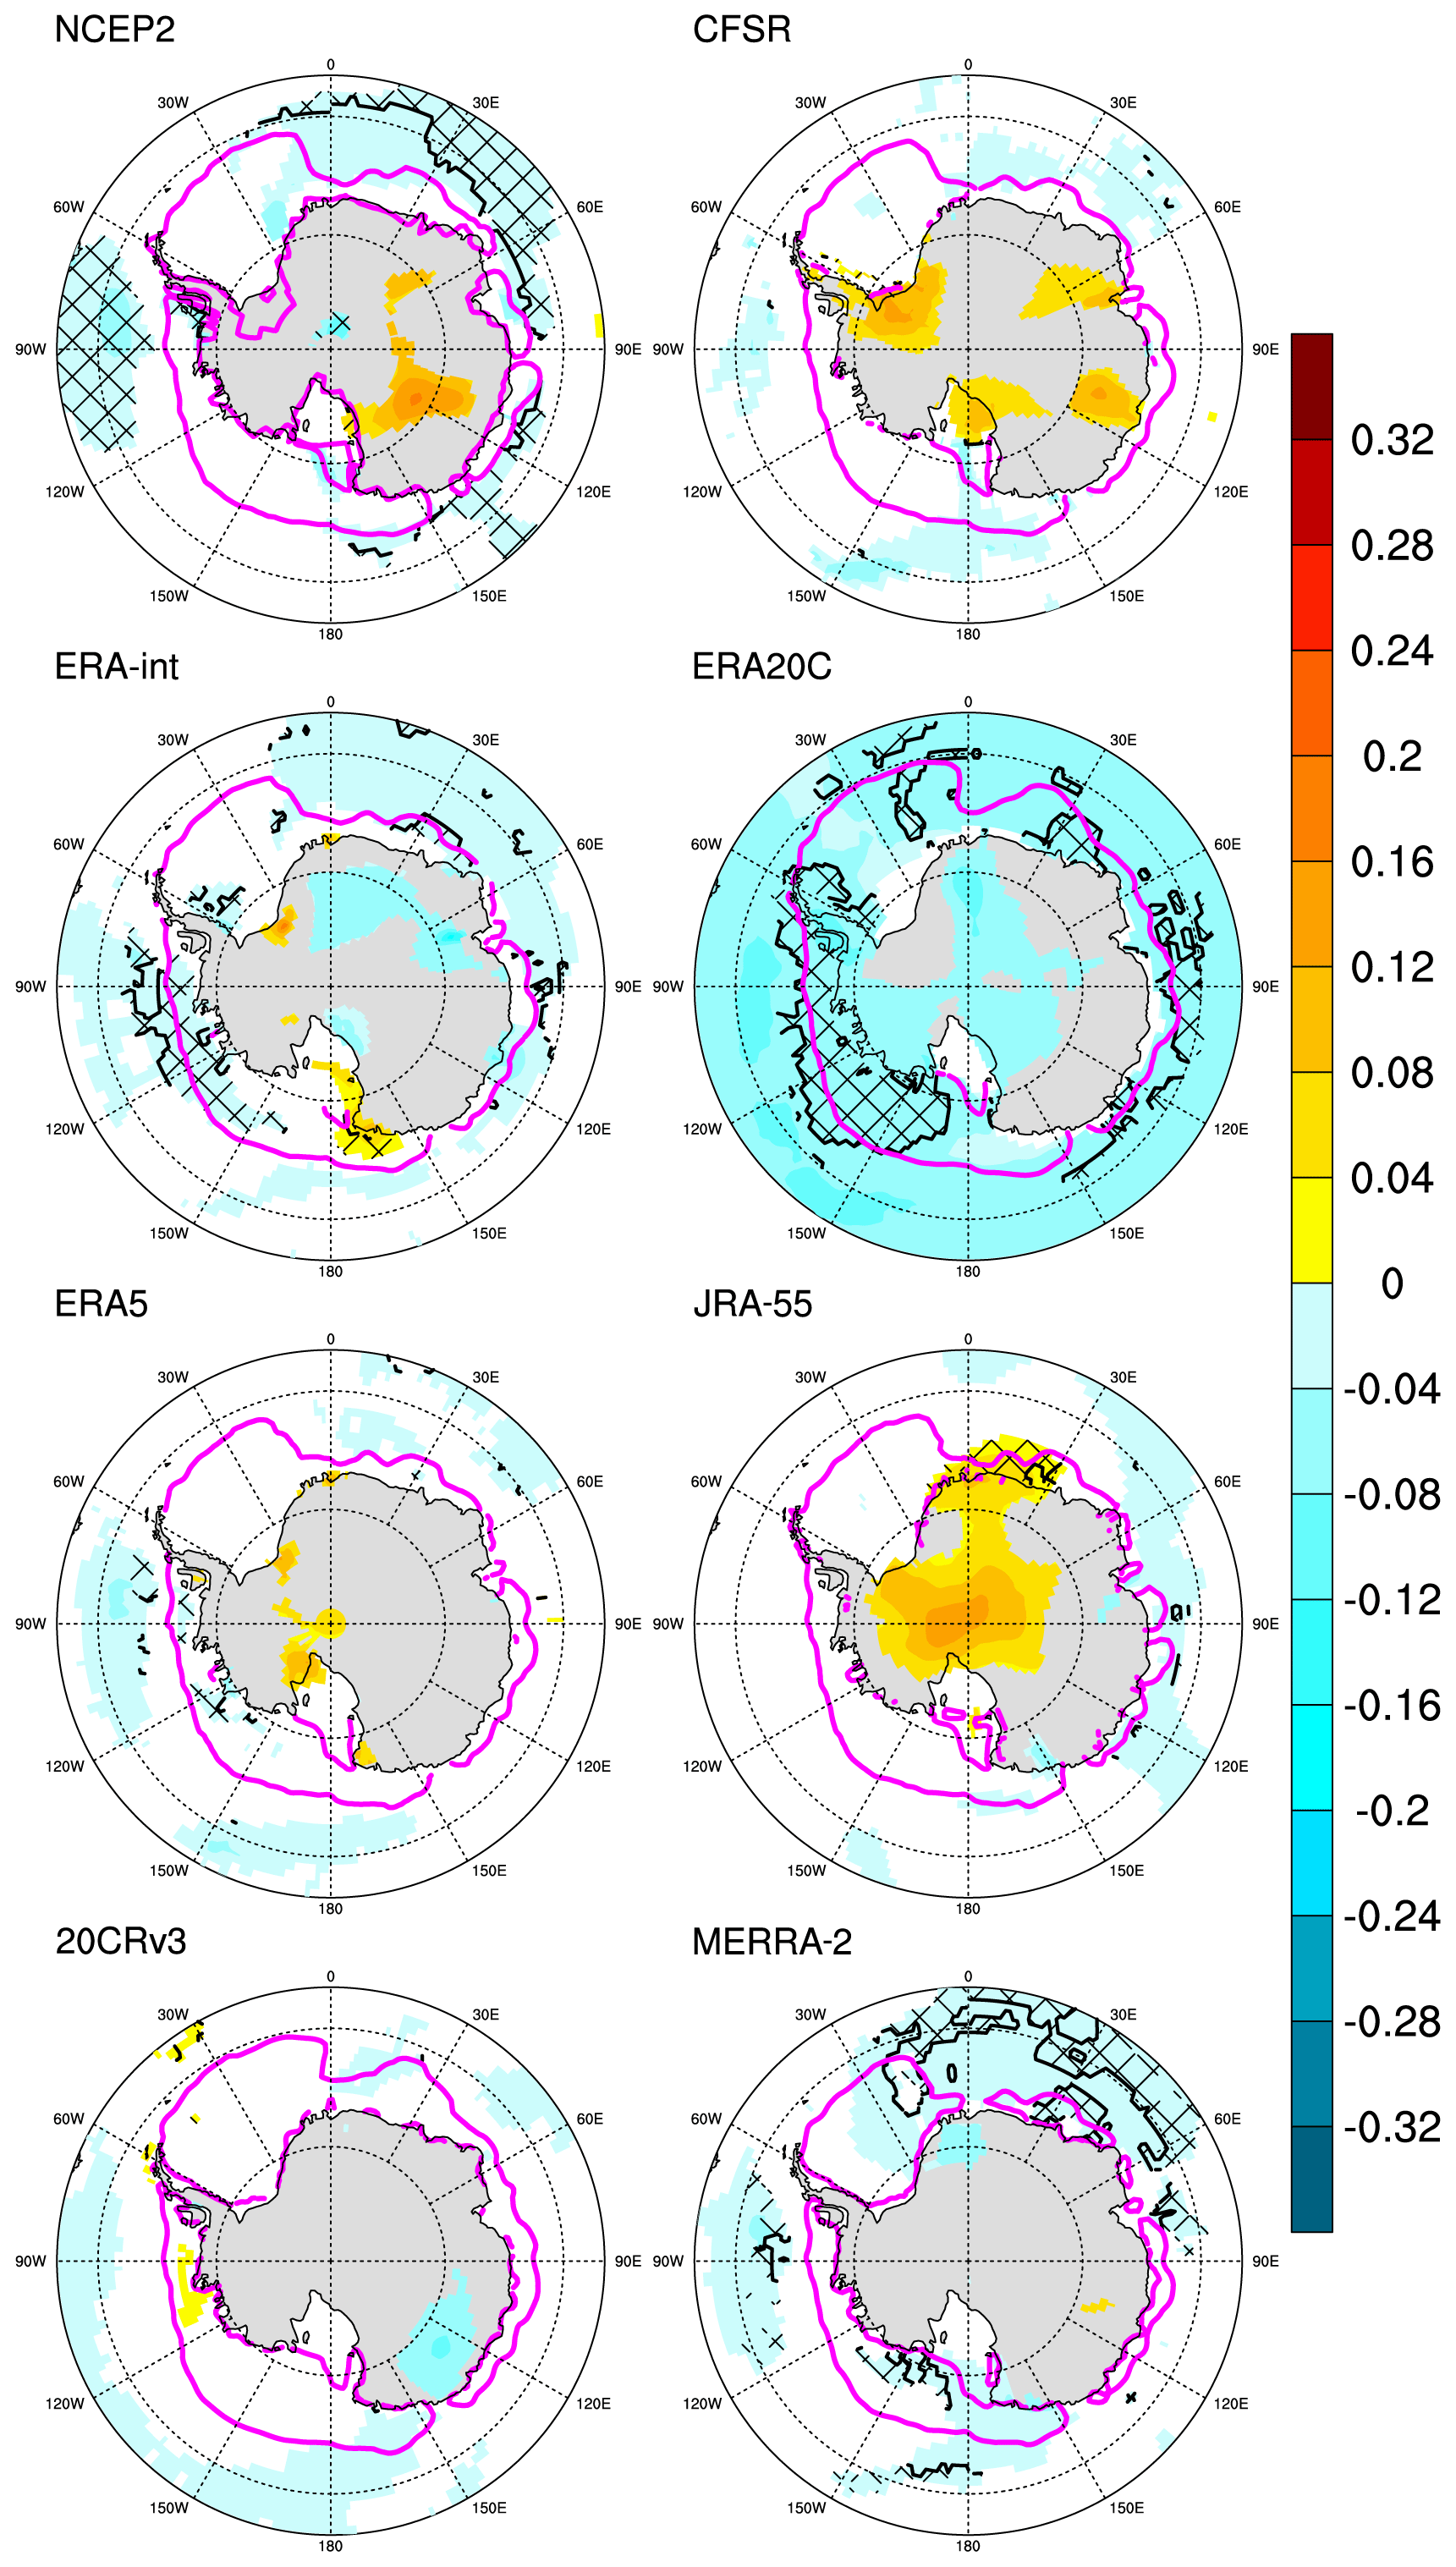
Figure 5Panels (a)–(h) 1980–2010 December–January mean reanalysis SAT trends over the climatological sea ice zone (∘C/year); only trends that are statistically significant at the 90 % level are shown. Hatched regions show where the signs of statistically significant reanalysis SIC and SAT trends are the same (i.e. the unexpected result of both a warming (cooling) and an increase (decrease) in sea ice cover). The magenta line shows the climatological sea ice edge.
During warmer months when the mean flux is from atmosphere to ocean, this relationship breaks down or even becomes negative (Fig. 4), indicating that surface heat flux is no longer a connection between ice and SAT variability. At a first pass we might still expect a relationship between the surface atmosphere and sea ice, since this heat flux is important for melting the sea ice. However, we suggest that two factors combine to break the SAT–SIC coupling. The first is that, from the perspective of the atmosphere (and in particular, an uncoupled atmosphere-only model which is the basis for most of the reanalyses), when the flux is from atmosphere to ocean, the ocean is a passive sink of energy that is modulated by atmospheric processes rather than an active driver of the surface atmosphere during periods of ocean-to-atmosphere energy transfer. We note that the CFSR – one of the only reanalyses to have coupled rather than prescribed sea ice – has a stronger summer SAT–SIC correlation (Fig. 3).
The second factor is the process of sea ice melt. Although the melt is largely driven by incoming solar radiation, there is in fact relatively little melt on top of the sea ice because of the high albedo of snow-covered sea ice (Gordon, 1981; Drinkwater and Xiang, 2000). Instead, areas of open water such as leads absorb solar radiation, warming the ocean mixed layer and melting the ice pack from beneath (Stammerjohn et al., 2012). This means that the impact of ice cover, which in summer mainly affects the surface air temperature by reflecting solar radiation, is spatially diffused by the ocean and so reduces the direct spatial relationship between solar radiation, atmosphere, and sea ice.
A third and final factor that is not immediately evident is the nature of the summer ice pack, which although small in area comprises a higher proportion of thick, wind-compacted sea ice at the coastline than other months, since this is the ice most likely to survive the spring melt. This thick, compacted sea ice is relatively insensitive the atmospheric warming (Enomoto and Ohmura, 1990; Massom et al., 2008), and so the sea ice–atmosphere relationship is also weak. As a result of these factors, we argue that a weak summer relationship between SIC and SAT is expected from the physical conditions in high summer.
However, this does not explain why the ERA products have apparently no SIC–SAT trend correlation in summer. Further analysis of the spatial distribution of SIC and SAT trends in Fig. 5 reveals a local inconsistency between summer sea ice trends and the ERA SAT trends; this inconsistency is shown by hatching, which shows where a sea ice reduction is accompanied by a local cooling, or vice versa. The ERA products all show, to a greater or lesser degree of statistical significance, a cooling over the Amundsen–Bellingshausen seas (60–150∘ W), a region with an intense and well-observed loss of summer sea ice (e.g. Parkinson, 2019). None of the other products show a statistically significant cooling in the same region. Whilst it has been hypothesized from model simulations that due to complex ocean–sea ice feedbacks, a surface cooling may lead to a loss of sea ice (Zhang, 2007), we note that in this particular region the sea ice loss has been robustly attributed to increasing poleward airflow, which both dynamically constrains the ice extent and advects warm air to the region (Holland and Kwok, 2012; Hosking et al., 2013; Raphael et al., 2016) and would be expected to drive warmer SAT. Furthermore, whilst there are no direct measurements of SAT in this region, there are a number of station observation records on the western Antarctic Peninsula and reconstructions of continental surface temperature; these all indicate a warming trend over the West Antarctic landmass (Steig et al., 2009; Nicolas and Bromwich, 2014) in response to the same increase in warm northerly airflow that has reduced Amundsen–Bellingshausen sea ice cover. This continental warming is most clearly evident in JRA55 (Fig. 5) but clearly does not seem to be consistent with a surface cooling over the adjacent ocean. We therefore consider that the ERA products must be considered with some degree of caution, especially for studies of change in the West Antarctic region.
Using the known close relation between sea ice cover and surface air temperature in polar oceans, we use satellite-observed Antarctic sea ice trends as an independent validation of reanalysis trends over the polar Southern Ocean. Based on this analysis, we find several reanalysis products that reproduce reasonable surface air temperature trends, with JRA55 showing the consistently highest agreement with observed sea ice throughout the year.
We find that the relationship between surface air temperature and sea ice concentration is strong for most months of the year except mid-summer (i.e. December and January). These are the only months of the year when the polar Southern Ocean is a sink rather than a source of the net surface heat flux, and although much of the heat is used to melt sea ice, the heat is distributed by ocean processes, and the direct spatial correlation between sea ice and air temperature is relatively weak.
Although all eight of the reanalysis products that we analyse here have a weaker air temperature–sea ice relationship in summer, the ECMWF reanalyses (ERA5, ERA-int and ERA20C) have no correlation in summer at all. This seems to be due to their representation of a surface cooling in the Amundsen and Bellingshausen seas, which is not consistent with a robustly observed local sea ice loss since the late 1970s nor with independent reconstructions of land surface temperature, which show a warming in the West Antarctic region adjacent to the Amundsen–Bellingshausen seas.
All data analysed in this manuscript are publicly available. Passive microwave sea ice concentration data were retrieved from the National Snow and Ice Data Center (https://doi.org/10.7265/N59P2ZTG, Meier et al., 2017). CFSR, ERA-int and JRA55 data were accessed using National Center for Atmospheric Research Data Archive (https://rda.ucar.edu/, European Centre for Medium-Range Weather Forecasts, 2009; Japan Meteorological Agency/Japan, 2013; Saha et al., 2010b). NCEP2 and 20CRv3 data were accessed from the NOAA Earth System Research Laboratories Physical Sciences Laboratory (https://psl.noaa.gov/data/gridded/index.html). ERA5 data were acquired from the Copernicus Climate Data Store (https://cds.climate.copernicus.eu/, Hersbach, 2019). ERA20C data were accessed from the ECMWF data repository (https://www.ecmwf.int/en/forecasts/datasets/reanalysis-datasets/era-20c, last access: 28 February 2020). MERRA2 data were accessed from the NASA Goddard Earth Sciences Data and Information Services Center (https://disc.gsfc.nasa.gov, Global Modeling and Assimilation Office, 2015).
The supplement related to this article is available online at: https://doi.org/10.5194/acp-20-14757-2020-supplement.
WRH conceived the study, undertook the analysis, and drafted the manuscript. ARK assisted with the analysis and manuscript and provided expertise on atmospheric reanalyses. YP performed much of the initial analysis.
The authors declare that they have no conflict of interest.
This article is part of the special issue “The SPARC Reanalysis Intercomparison Project (S-RIP) (ACP/ESSD inter-journal SI)”. It is not associated with a conference.
The authors thank the two anonymous reviewers for their helpful and constructive comments that improved this paper. This project received grant funding from the Australian Government as part of the Antarctic Science Collaboration Initiative programme, the Antarctic Climate and Ecosystems Cooperative Research Centre, and the Australian Research Council Antarctic Gateway Partnership. Data analysis and visualization were performed using the NCAR Command Language (https://doi.org/10.5065/D6WD3XH5, The NCAR Command Language, 2019). The authors are also grateful for the help and resources of the NCAR Research Data Archive (https://rda.ucar.edu/, last access: 30 November 2020) and https://reanalyses.org, last access: 30 November 2020 in acquiring and processing the data.
This paper was edited by Gabriele Stiller and reviewed by two anonymous referees.
Bracegirdle, T. J. and Marshall, G. J.: The Reliability of Antarctic Tropospheric Pressure and Temperature in the Latest Global Reanalyses, J. Clim., 25, 7138–7146, https://doi.org/10.1175/JCLI-D-11-00685.1, 2012.
Bromwich, D. H., Nicolas, J. P., Monaghan, A. J., Lazzara, M. A., Keller, L. M., Weidner, G. A., and Wilson, A. B.: Central West Antarctica among the most rapidly warming regions on Earth, Nat. Geosci., 6, 139–145, https://doi.org/10.1038/Ngeo1671, 2013.
Comiso, J. C., Gersten, R. A., Stock, L. V., Turner, J., Perez, G. J., and Cho, K.: Positive Trend in the Antarctic Sea Ice Cover and Associated Changes in Surface Temperature, J. Clim., 30, 2251–2267, https://doi.org/10.1175/jcli-d-16-0408.1, 2017.
Dee, D. P., Uppala, S. M., Simmons, A. J., Berrisford, P., Poli, P., Kobayashi, S., Andrae, U., Balmaseda, M. A., Balsamo, G., Bauer, P., Bechtold, P., Beljaars, A. C. M., van de Berg, L., Bidlot, J., Bormann, N., Delsol, C., Dragani, R., Fuentes, M., Geer, A. J., Haimberger, L., Healy, S. B., Hersbach, H., Holm, E. V., Isaksen, L., Kallberg, P., Kohler, M., Matricardi, M., McNally, A. P., Monge-Sanz, B. M., Morcrette, J. J., Park, B. K., Peubey, C., de Rosnay, P., Tavolato, C., Thepaut, J. N., and Vitart, F.: The ERA-Interim reanalysis: configuration and performance of the data assimilation system, Q. J. Roy. Meteor. Soc., 137, 553–597, https://doi.org/10.1002/qj.828, 2011.
Dotto, T. S., Naveira Garabato, A. C., Bacon, S., Holland, P. R., Kimura, S., Firing, Y. L., Tsamados, M., Wåhlin, A. K., and Jenkins, A.: Wind-Driven Processes Controlling Oceanic Heat Delivery to the Amundsen Sea, Antarctica, J. Phys. Oceanogr., 49, 2829–2849, https://doi.org/10.1175/JPO-D-19-0064.1, 2019.
Drinkwater, M. R. and Xiang, L.: Seasonal to interannual variability in Antarctic sea-ice surface melt, IEEE T. Geosci. Remote, 38, 1827–1842, https://doi.org/10.1109/36.851767, 2000.
Dupont, T. K. and Alley, R. B.: Assessment of the importance of ice-shelf buttressing to ice-sheet flow, Geophys. Res. Lett., 32, L04503, https://doi.org/10.1029/2004gl022024, 2005.
Enomoto, H. and Ohmura, A.: The influences of atmospheric half-yearly cycle on the sea ice extent in the Antarctic, J. Geophys. Res.-Ocean., 95, 9497–9511, https://doi.org/10.1029/JC095iC06p09497, 1990.
European Centre for Medium-Range Weather Forecasts: ERA-Interim Project, Research Data Archive at the National Center for Atmospheric Research, Computational and Information Systems Laboratory, https://doi.org/10.5065/D6CR5RD9 (last access: 26 September 2018), 2009.
Frolicher, T. L., Sarmiento, J. L., Paynter, D. J., Dunne, J. P., Krasting, J. P., and Winton, M.: Dominance of the Southern Ocean in Anthropogenic Carbon and Heat Uptake in CMIP5 Models, J. Clim., 28, 862–886, https://doi.org/10.1175/Jcli-D-14-00117.1, 2015.
Fujiwara, M., Wright, J. S., Manney, G. L., Gray, L. J., Anstey, J., Birner, T., Davis, S., Gerber, E. P., Harvey, V. L., Hegglin, M. I., Homeyer, C. R., Knox, J. A., Krüger, K., Lambert, A., Long, C. S., Martineau, P., Molod, A., Monge-Sanz, B. M., Santee, M. L., Tegtmeier, S., Chabrillat, S., Tan, D. G. H., Jackson, D. R., Polavarapu, S., Compo, G. P., Dragani, R., Ebisuzaki, W., Harada, Y., Kobayashi, C., McCarty, W., Onogi, K., Pawson, S., Simmons, A., Wargan, K., Whitaker, J. S., and Zou, C. Z.: Introduction to the SPARC Reanalysis Intercomparison Project (S-RIP) and overview of the reanalysis systems, Atmos. Chem. Phys., 17, 1417–1452, https://doi.org/10.5194/acp-17-1417-2017, 2017.
Gelaro, R., McCarty, W., Suárez, M. J., Todling, R., Molod, A., Takacs, L., Randles, C. A., Darmenov, A., Bosilovich, M. G., Reichle, R., Wargan, K., Coy, L., Cullather, R., Draper, C., Akella, S., Buchard, V., Conaty, A., da Silva, A. M., Gu, W., Kim, G.-K., Koster, R., Lucchesi, R., Merkova, D., Nielsen, J. E., Partyka, G., Pawson, S., Putman, W., Rienecker, M., Schubert, S. D., Sienkiewicz, M., and Zhao, B.: The Modern-Era Retrospective Analysis for Research and Applications, Version 2 (MERRA-2), J. Clim., 30, 5419–5454, https://doi.org/10.1175/JCLI-D-16-0758.1, 2017.
Global Modeling and Assimilation Office: Monthly mean,Single-Level,Assimilation,Single-Level Diagnostics V5.12.4, Goddard Earth Sciences Data and Information Services Center, https://doi.org/10.5067/5ESKGQTZG7FO (last access: 3 March 2020), 2015.
Gordon, A. L.: Seasonality of Southern-Ocean Sea Ice, J. Geophys. Res.-Ocean., 86, 4193–4197, https://doi.org/10.1029/JC086iC05p04193, 1981.
Hersbach, H., de Rosnay, P., Bell, B., Schepers, D., Simmons, A., Soci, C., Abdalla, S., Alonso-Balmaseda, M., Balsamo, G., Bechtold, P., Berrisford, P., Bidlot, J.-R., de Boisséson, E., Bonavita, M., Browne, P., Buizza, R., Dahlgren, P., Dee, D., Dragani, R., Diamantakis, M., Flemming, J., Forbes, R., Geer, A. J., Haiden, T., Hólm, E., Haimberger, L., Hogan, R., Horányi, A., Janiskova, M., Laloyaux, P., Lopez, P., Munoz-Sabater, J., Peubey, C., Radu, R., Richardson, D., Thépaut, J.-N., Vitart, F., Yang, X., Zsótér, E., and Zuo, H.: Operational global reanalysis: progress, future directions and synergies with NWP, ERA Report Series 27, 63 pp., https://doi.org/10.21957/tkic6g3wm, 2018.
Hersbach, H., Bell, B., Berrisford, P., Biavati, G., Horányi, A., Muñoz Sabater, J., Nicolas, J., Peubey, C., Radu, R., Rozum, I., Schepers, D., Simmons, A., Soci, C., Dee, D., and Thépaut, J.-N.: ERA5 monthly averaged data on pressure levels from 1979 to present, Copernicus Climate Change Service Climate Data Store, doi10.24381/cds.6860a573 (last access: 2 March 2020), 2019.
Hobbs, W., Massom, R., Stammerjohn, S., Reid, P., Williams, G. D., and Meier, W. N.: A Review of Recent Changes in Southern Ocean Sea Ice, their Drivers and Forcings, Glob. Planet. Change, 143, 228–250, https://doi.org/10.1016/j.gloplacha.2016.06.008, 2016.
Holland, P. R. and Kwok, R.: Wind-driven trends in Antarctic sea-ice drift, Nat. Geosci., 5, 872–875, https://doi.org/10.1038/NGEO1627, 2012.
Hosking, J. S., Orr, A., Marshall, G. J., Turner, J., and Phillips, T.: The Influence of the Amundsen-Bellingshausen Seas Low on the Climate of West Antarctica and Its Representation in Coupled Climate Model Simulations, J. Clim., 26, 6633–6648, https://doi.org/10.1175/JCLI-D-12-00813.1, 2013.
Japan Meteorological Agency/Japan: JRA-55: Japanese 55-year Reanalysis, Monthly Means and Variances. Research Data Archive at the National Center for Atmospheric Research, Computational and Information Systems Laboratory, https://doi.org/10.5065/D60G3H5B (last access: 26 May 2020), 2013.
Jones, J. M., Gille, S. T., Goosse, H., Abram, N. J., Canziani, P. O., Charman, D. J., Clem, K. R., Crosta, X., de Lavergne, C., Eisenman, I., England, M. H., Fogt, R. L., Frankcombe, L. M., Marshall, G. J., Masson-Delmotte, V., Morrison, A. K., Orsi, A. J., Raphael, M. N., Renwick, J. A., Schneider, D. P., Simpkins, G. R., Steig, E. J., Stenni, B., Swingedouw, D., and Vance, T. R.: Assessing recent trends in high-latitude Southern Hemisphere surface climate, Nat. Clim. Change, 6, 917–926, https://doi.org/10.1038/nclimate3103, 2016.
Kanamitsu, M., Ebisuzaki, W., Woollen, J., Yang, S. K., Hnilo, J. J., Fiorino, M., and Potter, G. L.: NCEP-DOE AMIP-II reanalysis (R-2), B. Am. Meteorol. Soc., 83, 1631–1643, https://doi.org/10.1175/Bams-83-11-1631(2002)083<1631:Nar>2.3.Co;2, 2002.
King, J. C. and Harangozo, S. A.: Climate change in the western Antarctic Peninsula since 1945: observations and possible causes, Ann. Glaciol., 27, 571–575, https://doi.org/10.3189/1998AoG27-1-571-575, 1998.
Kobayashi, S., Ota, Y., Harada, Y., Ebita, A., Moriya, M., Onoda, H., Onogi, K., Kamahori, H., Kobayashi, C., Endo, H., Miyaoka, K., and Takahashi, K.: The JRA-55 Reanalysis: General Specifications and Basic Characteristics, J. Meteorol. Soc. Jpn., 93, 5–48, https://doi.org/10.2151/jmsj.2015-001, 2015.
Kusahara, K., Williams, G. D., Massom, R., Reid, P., and Hasumi, H.: Roles of wind stress and thermodynamic forcing in recent trends in Antarctic sea ice and Southern Ocean SST: An ocean-sea ice model study, Glob. Planet. Change, 158, 103–118, https://doi.org/10.1016/j.gloplacha.2017.09.012, 2017.
Lenaerts, J. T. M., Lhermitte, S., Drews, R., Ligtenberg, S. R. M., Berger, S., Helm, V., Smeets, C. J. P. P., van den Broeke, M. R., van de Berg, W. J., van Meijgaard, E., Eijkelboom, M., Eisen, O., and Pattyn, F.: Meltwater produced by wind-albedo interaction stored in an East Antarctic ice shelf, Nat. Clim. Change, 7, 58–63, https://doi.org/10.1038/Nclimate3180, 2017.
Marshall, G. J.: Trends in the southern annular mode from observations and reanalyses, J. Clim., 16, 4134–4143, 2003.
Marshall, G. J., Orr, A., and Turner, J.: A Predominant Reversal in the Relationship between the SAM and East Antarctic Temperatures during the Twenty-First Century, J. Clim., 26, 5196–5204, https://doi.org/10.1175/JCLI-D-12-00671.1, 2013.
Massom, R. A., Stammerjohn, S. E., Lefebvre, W., Harangozo, S. A., Adams, N., Scambos, T. A., Pook, M. J., and Fowler, C.: West Antarctic Peninsula sea ice in 2005: Extreme ice compaction and ice edge retreat due to strong anomaly with respect to climate, J. Geophys. Res.-Ocean., 113, C02S20, https://doi.org/10.1029/2007jc004239, 2008.
Massonnet, F., Mathiot, P., Fichefet, T., Goosse, H., Beatty, C. K., Vancoppenolle, M., and Lavergne, T.: A model reconstruction of the Antarctic sea ice thickness and volume changes over 1980–2008 using data assimilation, Ocean Model., 64, 67–75, https://doi.org/10.1016/j.ocemod.2013.01.003, 2013.
Meier, W. N., Peng, G., Scott, D. J., and Savoie, M.: Verification of a new NOAA/NSIDC passive microwave sea-ice concentration climate record, Polar Res., 33, 21004, https://doi.org/10.3402/polar.v33.21004, 2014.
Meier, W. N., Fetterer, F., Savoie, M., Mallory, S., Duerr, R., and Stroeve J.: NOAA/NSIDC Climate Data Record of Passive Microwave Sea Ice Concentration, Version 3.01, Boulder, Colorado USA, NSIDC, National Snow and Ice Data Center, https://doi.org/10.7265/N59P2ZTG (last access: 30 November 2020), 2017.
Meneghini, B., Simmonds, I., and Smith, I. N.: Association between Australian rainfall and the Southern Annular Mode, Int. J. Climatol., 27, 109–121, https://doi.org/10.1002/joc.1370, 2007.
Nicolas, J. P. and Bromwich, D. H.: New Reconstruction of Antarctic Near-Surface Temperatures: Multidecadal Trends and Reliability of Global Reanalyses, J. Clim., 27, 8070–8093, https://doi.org/10.1175/JCLI-D-13-00733.1, 2014.
Paolo, F. S., Fricker, H. A., and Padman, L.: Volume loss from Antarctic ice shelves is accelerating, Science, 348, 327–331, https://doi.org/10.1126/science.aaa0940, 2015.
Paolo, F. S., Padman, L., Fricker, H. A., Adusumilli, S., Howard, S., and Siegfried, M. R.: Response of Pacific-sector Antarctic ice shelves to the El Ni no/Southern Oscillation, Nat. Geosci., 11, 121–126, https://doi.org/10.1038/s41561-017-0033-0, 2018.
Parkinson, C. L.: A 40-y record reveals gradual Antarctic sea ice increases followed by decreases at rates far exceeding the rates seen in the Arctic, P. Natl. Acad. Sci., 116, 14414–14423, https://doi.org/10.1073/pnas.1906556116, 2019.
Parkinson, C. L. and Cavalieri, D. J.: Antarctic sea ice variability and trends, 1979–2010, The Cryosphere, 6, 871–880, https://doi.org/10.5194/tc-6-871-2012, 2012.
Poli, P., Hersbach, H., Dee, D. P., Berrisford, P., Simmons, A. J., Vitart, F., Laloyaux, P., Tan, D. G. H., Peubey, C., Thépaut, J.-N., Trémolet, Y., Hólm, E. V., Bonavita, M., Isaksen, L., and Fisher, M.: ERA-20C: An Atmospheric Reanalysis of the Twentieth Century, J. Clim., 29, 4083–4097, https://doi.org/10.1175/JCLI-D-15-0556.1, 2016.
Pritchard, H. D., Ligtenberg, S. R., Fricker, H. A., Vaughan, D. G., van den Broeke, M. R., and Padman, L.: Antarctic ice-sheet loss driven by basal melting of ice shelves, Nature, 484, 502–505, https://doi.org/10.1038/nature10968, 2012.
Raphael, M. N. and Hobbs, W.: The influence of the large-scale atmospheric circulation on Antarctic sea ice during ice advance and retreat seasons, Geophys. Res. Lett., 41, 5037–5045, https://doi.org/10.1002/2014gl060365, 2014.
Raphael, M. N., Marshall, G. J., Turner, J., Fogt, R. L., Schneider, D., Dixon, D. A., Hosking, J. S., Jones, J. M., and Hobbs, W. R.: The Amundsen Sea Low: Variability, Change, and Impact on Antarctic Climate, B. Am. Meteorol. Soc., 97, 111–121, https://doi.org/10.1175/bams-d-14-00018.1, 2016.
Saha, S., Moorthi, S., Pan, H. L., Wu, X. R., Wang, J. D., Nadiga, S., Tripp, P., Kistler, R., Woollen, J., Behringer, D., Liu, H. X., Stokes, D., Grumbine, R., Gayno, G., Wang, J., Hou, Y. T., Chuang, H. Y., Juang, H. M. H., Sela, J., Iredell, M., Treadon, R., Kleist, D., Van Delst, P., Keyser, D., Derber, J., Ek, M., Meng, J., Wei, H. L., Yang, R. Q., Lord, S., Van den Dool, H., Kumar, A., Wang, W. Q., Long, C., Chelliah, M., Xue, Y., Huang, B. Y., Schemm, J. K., Ebisuzaki, W., Lin, R., Xie, P. P., Chen, M. Y., Zhou, S. T., Higgins, W., Zou, C. Z., Liu, Q. H., Chen, Y., Han, Y., Cucurull, L., Reynolds, R. W., Rutledge, G., and Goldberg, M.: The Ncep Climate Forecast System Reanalysis, B. Am. Meteorol. Soc., 91, 1015–1057, https://doi.org/10.1175/2010bams3001.1, 2010a.
Saha, S., Moorthi, S., Pan, H. L., Wu, X. R., Wang, J. D., Nadiga, S., Tripp, P., Kistler, R., Woollen, J., Behringer, D., Liu, H. X., Stokes, D., Grumbine, R., Gayno, G., Wang, J., Hou, Y. T., Chuang, H. Y., Juang, H. M. H., Sela, J., Iredell, M., Treadon, R., Kleist, D., Van Delst, P., Keyser, D., Derber, J., Ek, M., Meng, J., Wei, H. L., Yang, R. Q., Lord, S., Van den Dool, H., Kumar, A., Wang, W. Q., Long, C., Chelliah, M., Xue, Y., Huang, B. Y., Schemm, J. K., Ebisuzaki, W., Lin, R., Xie, P. P., Chen, M. Y., Zhou, S. T., Higgins, W., Zou, C. Z., Liu, Q. H., Chen, Y., Han, Y., Cucurull, L., Reynolds, R. W., Rutledge, G., and Goldberg, M.: NCEP Climate Forecast System Reanalysis (CFSR) Monthly Products, January 1979 to December 2010, Research Data Archive at the National Center for Atmospheric Research, Computational and Information Systems Laboratory, https://doi.org/10.5065/D6DN438J (last access: 26 May 2020), 2010b.
Schroeter, S., Hobbs, W., and Bindoff, N. L.: Interactions between Antarctic sea ice and large-scale atmospheric modes in CMIP5 models, The Cryosphere, 11, 789–803, https://doi.org/10.5194/tc-11-789-2017, 2017.
Schroeter, S., Hobbs, W., Bindoff, N. L., Massom, R., and Matear, R.: Drivers of Antarctic Sea Ice Volume Change in CMIP5 Models, J. Geophys. Res.-Ocean., 123, 7914–7938, https://doi.org/10.1029/2018jc014177, 2018.
Simmons, A. J., Berrisford, P., Dee, D. P., Hersbach, H., Hirahara, S., and Thépaut, J. N.: A reassessment of temperature variations and trends from global reanalyses and monthly surface climatological datasets, Q. J. Roy. Meteor. Soc., 143, 101–119, https://doi.org/10.1002/qj.2949, 2017.
Slivinski, L. C., Compo, G. P., Whitaker, J. S., Sardeshmukh, P. D., Giese, B. S., McColl, C., Allan, R., Yin, X., Vose, R., Titchner, H., Kennedy, J., Spencer, L. J., Ashcroft, L., Brönnimann, S., Brunet, M., Camuffo, D., Cornes, R., Cram, T. A., Crouthamel, R., Domínguez-Castro, F., Freeman, J. E., Gergis, J., Hawkins, E., Jones, P. D., Jourdain, S., Kaplan, A., Kubota, H., Blancq, F. L., Lee, T.-C., Lorrey, A., Luterbacher, J., Maugeri, M., Mock, C. J., Moore, G. W. K., Przybylak, R., Pudmenzky, C., Reason, C., Slonosky, V. C., Smith, C. A., Tinz, B., Trewin, B., Valente, M. A., Wang, X. L., Wilkinson, C., Wood, K., and Wyszyński, P.: Towards a more reliable historical reanalysis: Improvements for version 3 of the Twentieth Century Reanalysis system, Q. J. Roy. Meteor. Soc., 145, 2876–2908, https://doi.org/10.1002/qj.3598, 2019.
Stammerjohn, S., Massom, R., Rind, D., and Martinson, D.: Regions of rapid sea ice change: An inter-hemispheric seasonal comparison, Geophys. Res. Lett., 39, L06501, https://doi.org/10.1029/2012gl050874, 2012.
Steig, E. J. and Orsi, A. J.: The heat is on in Antarctica, Nat. Geosci., 6, 87–88, https://doi.org/10.1038/ngeo1717, 2013.
Steig, E. J., Schneider, D. P., Rutherford, S. D., Mann, M. E., Comiso, J. C., and Shindell, D. T.: Warming of the Antarctic ice-sheet surface since the 1957 International Geophysical Year (Vol 457, p. 459, 2009), Nature, 460, 766–766, https://doi.org/10.1038/Nature08286, 2009.
Swart, N. C. and Fyfe, J. C.: Observed and simulated changes in the Southern Hemisphere surface westerly wind-stress, Geophys. Res. Lett., 39, L16711, https://doi.org/10.1029/2012gl052810, 2012.
The NCAR Command Language (Version 6.6.2): UCAR/NCAR/CISL/TDD, https://doi.org/10.5065/D6WD3XH5, 2019.
Turner, J., Phillips, T., Hosking, J. S., Marshall, G. J., and Orr, A.: The Amundsen Sea low, Int. J. Climatol., 33, 1818–1829, https://doi.org/10.1002/joc.3558, 2013.
Turner, J., Barrand, N. E., Bracegirdle, T. J., Convey, P., Hodgson, D. A., Jarvis, M., Jenkins, A., Marshall, G., Meredith, M. P., Roscoe, H., Shanklin, J., French, J., Goosse, H., Guglielmin, M., Gutt, J., Jacobs, S., Kennicutt, M. C., Masson-Delmotte, V., Mayewski, P., Navarro, F., Robinson, S., Scambos, T., Sparrow, M., Summerhayes, C., Speer, K., and Klepikov, A.: Antarctic climate change and the environment: an update, Pol. Record, 50, 237–259, https://doi.org/10.1017/S0032247413000296, 2014.
Wang, Y., Zhou, D., Bunde, A., and Havlin, S.: Testing reanalysis data sets in Antarctica: Trends, persistence properties, and trend significance, J. Geophys. Res.-Atmos., 121, 12839–12855, https://doi.org/10.1002/2016JD024864, 2016.
Zhang, J. L.: Increasing Antarctic sea ice under warming atmospheric and oceanic conditions, J. Clim., 20, 2515–2529, https://doi.org/10.1175/Jcli4136.1, 2007.