the Creative Commons Attribution 4.0 License.
the Creative Commons Attribution 4.0 License.
 | 02 Dec 2020
Impacts of long-range transport of aerosols on marine-boundary-layer clouds in the eastern North Atlantic
Xiaojian Zheng
Xiquan Dong
Timothy Logan
Yuk L. Yung
Vertical profiles of aerosols are inadequately observed and poorly represented in climate models, contributing to the current large uncertainty associated with aerosol–cloud interactions. The US Department of Energy (DOE) Atmospheric Radiation Measurement (ARM) Aerosol and Cloud Experiments in the Eastern North Atlantic (ACE-ENA) aircraft field campaign near the Azores islands provided ample observations of vertical distributions of aerosol and cloud properties. Here we utilize the in situ aircraft measurements from the ACE-ENA and ground-based remote-sensing data along with an aerosol-aware Weather Research and Forecast (WRF) model to characterize the aerosols due to long-range transport over a remote region and to assess their possible influence on marine-boundary-layer (MBL) clouds. The vertical profiles of aerosol and cloud properties measured via aircraft during the ACE-ENA campaign provide detailed information revealing the physical contact between transported aerosols and MBL clouds. The European Centre for Medium-Range Weather Forecasts Copernicus Atmosphere Monitoring Service (ECMWF-CAMS) aerosol reanalysis data can reproduce the key features of aerosol vertical profiles in the remote region. The cloud-resolving WRF sensitivity experiments with distinctive aerosol profiles suggest that the transported aerosols and MBL cloud interactions (ACIs) require not only aerosol plumes to get close to the marine-boundary-layer top but also large cloud top height variations. Based on those criteria, the observations show that the occurrence of ACIs involving the transport of aerosol over the eastern North Atlantic (ENA) is about 62 % in summer. For the case with noticeable long-range-transport aerosol effects on MBL clouds, the susceptibilities of droplet effective radius and liquid water content are −0.11 and +0.14, respectively. When varying by a similar magnitude, aerosols originating from the boundary layer exert larger microphysical influence on MBL clouds than those entrained from the free troposphere.
- Article
(6794 KB) - Full-text XML
- BibTeX
- EndNote


It has been long hypothesized that increased high concentrations of aerosols serving as cloud condensation nuclei (CCNs) can reduce cloud droplet effective radius, enhance cloud albedo, suppress drizzle formation, and change cloud lifetime and fraction – the so-called aerosol indirect effects (AIEs; Twomey, 1977; Seinfeld et al., 2016). However, current radiative forcing stemming from cloud responses to anthropogenic aerosols remains highly uncertain in the climate system, representing the largest challenge in climate predictions (Fan et al., 2016). Note that the current IPCC assessment mainly considers the warm stratus and stratocumulus responses to aerosols, while aerosol-induced convective cloud response (Wang et al., 2014) and anthropogenic aerosol effects such as ice nuclei (Zhao et al., 2019) have not been fully accounted for yet. Even for warm clouds, the climate significance of whether liquid water content and cloud lifetime are enhanced or reduced by CCNs is still widely debated (Malavelle et al., 2017; Toll et al., 2019; Rosenfeld et al., 2019). Due to the nonlinear nature of cloud responses to CCN perturbations, the largest cloud susceptibility and AIEs typically occur for the marine-boundary-layer (MBL) clouds over remote regions (Garrett and Hobbs, 1995; Carslaw et al., 2013; Dong et al., 2015). Under pristine conditions with extremely low background CCN concentration (Kristensen et al., 2016), any aerosol intrusion following long-range transport has great potential to alter the local aerosol and CCN budget (Roberts et al., 2006). Hence, in this study, we aim to characterize long-range transport of aerosols and to assess their impacts on MBL clouds by combining in situ aircraft measurements with cloud-resolving model simulations.
For those aerosols resulting from long-range transport, one of the most important aspects pertinent to aerosol–cloud interactions (ACIs) is their vertical distribution, or in other words, their position relative to cloud layers. The vertical distribution of aerosols can be affected by a number of complex atmospheric processes, such as emission, transport, and deposition as well as microphysical and chemical processes. Previous studies suggest that aerosols can alter MBL cloud microphysical properties and enhance indirect effects through entrainment into the cloud top either when aerosol particles settle or the cloud deck deepens (Painemal et al., 2014; Lu et al., 2018). In the boundary layer of remote regions like the equatorial Pacific, the majority of CCNs were found to be supplied by long-range transport instead of local emission or formation (Clarke et al., 2013). In the northeast Pacific, where aerosol types are similar to the Azores, biomass-burning aerosols from the episodic wildfire events are found to be less efficient in altering cloud microphysics than the nonbiomass-burning aerosols (Hossein Mardi et al., 2019). Recent aircraft observations from the NASA's ORACLES (ObseRvations of Aerosols above CLouds and their intEractionS) campaign showed distinctive MBL cloud responses to aerosols above and below clouds depending on the history of smoke entrainment (Diamond et al., 2018). Therefore, it is critical to understand aerosol variability as a function of height and its influence on the aerosol indirect forcing assessment over the regions where MBL clouds are abundant.
Spaceborne active sensors that possess vertically profiling capabilities have been widely used to characterize aerosol and cloud spatial variations and to detect the aerosol above clouds (Painemal et al., 2014; Jiang et al., 2018). However, satellites likely miss the thin aerosol layers with relatively low concentration (but still higher than maritime background values), and thus overestimate the distance between the aerosol plume base and the cloud top. Also, when plumes are too thick near the aerosol source regions, satellite signals will be saturated, and the retrievals may underestimate the extent of thick layers (Rajapakshe et al., 2017). Therefore, aircraft observations with continuous vertical sampling are the most reliable source that can accurately characterize the vertical relationship between aerosol and cloud. The DOE ARM Aerosol and Cloud Experiments in the Eastern North Atlantic (ACE-ENA) aircraft field campaign near the Azores islands provided a unique opportunity to study aerosols from different sources and their impacts on MBL clouds (Wang et al., 2019). The eastern North Atlantic (ENA) site is located in the remote northeastern Atlantic Ocean, where MBL clouds are prevalent throughout the year due to the warm sea surface temperature and prevailing subsidence near the edge of the Hadley cell (Wood et al., 2015; Dong et al., 2015). The site also receives complex air mass dictated by different wind patterns. In addition to the local maritime air, the airflows originating from either the North American or the Saharan region complicate the local aerosol types and sources (Logan et al., 2014). This study leverages the airborne measurements of aerosol vertical profiles for different chemical species to understand aerosols and their influence on MBL cloud microphysical properties over the Azores, with the ultimate goal of providing observational constraints on the global climate model simulations. An aerosol reanalysis product is evaluated in the present study as well.
Even with the aircraft-measured vertical relationship between aerosol and cloud, it is difficult to estimate whether the aerosol aloft can impact the cloud beneath as the microphysical processes such as entrainment into the cloud top cannot be directly measured. Hence, we employ an aerosol-aware cloud-resolving model to simulate the MBL cloud development and aerosol transport in the free troposphere and to quantify the AIEs. Through the sensitivity experiment by imposing different aerosol vertical profiles, we can disentangle aerosol and other confounding meteorological factors in ACIs, which is challenging to do using only short-term observations. Section 2 describes the main observational data and introduces the numerical modeling tools. Section 3 reports the observed aerosols and clouds based on aircraft measurements and reanalysis products. Section 4 presents the analyses of cloud-resolving simulations using the Weather Research and Forecast (WRF) model. Section 5 summarizes the key findings in this study and provides additional discussions for the study's caveats and future work.
2.1 Aircraft observations and ancillary data descriptions
Vertical distributions of aerosols and MBL cloud microphysical properties over the Azores were obtained during two intensive operational periods (IOPs) of the ACE-ENA, i.e., early summer 2017 (late June to July) and winter 2018 (January to February). Since the aerosol concentration and variability are much larger in the summertime of Azores, we mainly focus on July 2017 in this study. The Gulfstream-159 (G-1) of the ARM Aerial Facility (AAF) provides accurate measurements of aerosol size distribution, total aerosol number concentration, and chemical constituents below and above cloud layers during the summer IOP. The condensation particle counter (CPC) on board the G-1 can detect aerosol particles larger than 10 nm, and it can provide profiles of condensation nuclei number concentration (NCN) when the aircraft ascends or descends. Note that NCN measurements inside clouds can be contaminated and thus have large uncertainty. CCN number concentration (NCCN) is obtained by the CCN-200 particle counter on board the G-1 aircraft. The NCCN is a measurement under the controlled supersaturation of 0.35 % with a humidified particle size range from 0.75 to 10 µm (Rose et al., 2008). We analyze sulfate and organic-carbon (OC) mass concentrations measured by the Aerodyne High-Resolution Time-of-Flight Aerosol Mass Spectrometer (HR-ToF-AMS) and refractory black carbon (BC) from the Single Particle Soot Photometer (SP2). The accuracy of each individual instrument can be found in the instrument handbooks available on the ARM website.
We use cloud and drizzle microphysical property profiles retrieved from a combination of ground-based observations including a Ka-band ARM zenith radar, ceilometer, and microwave radiometer. The Fast Cloud Droplet Probe (Glienke and Mei, 2020) measured cloud droplet properties (diameter between 1.5 and 46 µm), and the Two-Dimensional Stereo Probe (2DS, Glienke and Mei, 2019) measured drizzle properties (diameter greater than 45 µm) that were used to evaluate the ground-based retrievals. Following Dong et al. (1998) and Frisch et al. (1998), cloud droplet size distribution was assumed as a lognormal distribution. Differently, drizzle size distribution was assumed as a normalized Gamma distribution, as suggested by O'Connor et al. (2005) and Ulbrich (1983). The retrieved cloud and drizzle properties were validated against the collocated aircraft in situ measurements during ACE-ENA (Wu et al., 2020). Both the time series and vertical profiles from the retrievals agree well with in situ observations. Treating the aircraft measurements as ground truth, the median retrieval uncertainties are estimated as ∼20 % for cloud droplet effective radius and ∼30 % for cloud droplet number concentration, liquid water content (LWC), and drizzle drop median radius.
To characterize long-range aerosol intrusions over a monthly timescale, we employ global aerosol reanalysis data, namely the Copernicus Atmosphere Monitoring Service (CAMS). It provides four-dimensional mass concentrations of aerosols and reactive gases with a horizontal spatial resolution of approximately 80 km and 60 vertical levels. The CAMS reanalysis was constructed by assimilating several satellite products of the atmospheric constituents into a global model and data assimilation system (Flemming et al., 2017). The assimilated satellite datasets include aerosol optical depth (AOD) from the Moderate Resolution Imaging Spectroradiometer (MODIS) and Advanced Along-Track Scanning Radiometer (AATSR), CO from Measurements Of Pollution In The Troposphere (MOPITT), and NO2 and O3 from the Ozone Monitoring Instrument (OMI), Global Ozone Monitering Experiment (GOME), etc.
2.2 Model description
The WRF model version 3.6 is employed in this study to simulate MBL clouds and their possible interactions with transported aerosols. Four nested domains are set up with horizontal resolutions of 19.2 km, 4.8 km, 1.2 km, and 300 m (Fig. 5). Even for the innermost domain, we try to cover as large of an area as possible, considering the highly heterogeneous meteorological conditions in the midlatitudes. The innermost domain is configured in a similar way with large-eddy simulations, and it uses the three-dimensional Smagorinsky first-order closure for eddy coefficient computation. Boundary layer parameterization is turned off for this domain. Note that 300 m horizontal resolution does not strictly meet the classic large-eddy simulation (LES) requirement, but recent simulations with similar resolutions successfully reproduced the structure and drizzle onset of MBL clouds (Wang and Feingold, 2009) and were used to study boundary layer cloud interactions with aerosols (Lin et al., 2016). A total of 65 stretched sigma levels are used with a 40 m vertical resolution within the MBL. The large-scale forcing is adopted from the ERA5 reanalysis data with 25 km horizontal resolution (European Centre for Medium-Range Weather Forecasts, 2017).
To accurately depict MBL cloud microphysical processes, a spectral bin microphysical (SBM) scheme is employed, which utilizes a pair of 33 bins to represent cloud or rain drops and aerosols separately without prescribed size distributions (Fan et al., 2012; Wang et al., 2013). Aerosol activation is explicitly calculated using the model-predicted water vapor supersaturation. The Kölher theory is used to calculate the critical radius. The hygroscopicity of sulfate is assumed for aerosols in each size bin. At each time step, aerosols with a radius greater than the critical radius are removed from the aerosol spectrum, and the mass of the activated droplets is added to the cloud spectrum. Aerosol regeneration from complete evaporation of droplets and/or raindrops is also considered in the SBM. Since the aerosol size distribution in the SBM ranges from a few nanometers to a few micrometers, the definition of aerosol in the model is closer to the condensation nuclei in the aircraft observation. Hence, observed vertical profiles of NCN from selected cases are used for the initial and lateral boundary conditions of aerosols in the model. The model integrates from 12:00 UTC on the day before the selected case, and the first 12 h are considered as spin-up. Shortwave- and longwave-radiation-transfer calculations are accounted for by the Goddard and Rapid Radiation Transfer Model (RRTM) schemes, respectively. The radiative effect of aerosols above the cloud decks is not considered in the present model setup. We speculate that such an effect is small because of rather low aerosol optical depth over this remote region, even with the long-range-transported aerosols (aside from thick dust plumes from the Saharan Desert).
3.1 Characterization of aerosol vertical distribution using the CAMS reanalysis
Previous studies have shown that the CAMS aerosol product exhibits good agreement with ground-based observations such as AERONET and unassimilated satellite products such as the Multi-angle Imaging SpectroRadiometer (MISR) on a global scale (Christophe et al., 2019). The global spatial correlation of CAMS AOD with AERONET is about 0.83, and the bias in CAMS AOD seasonal variation is between −10 % and +20 %. Here we utilize this dataset to characterize the aerosol vertical distribution over the northeast Atlantic during the ACE-ENA field campaign. Vertical distributions and their temporal evolutions for five types of aerosols, including sulfate, organic carbon (OC), black carbon (BC), sea salt, and dust, over the whole month of July 2017 are displayed in Fig. 1 based on the CAMS aerosol reanalysis. Sulfate, OC, and BC are the predominant aerosol types possibly possessing an anthropogenic signature. BC and OC can also originate from biomass burning. Those aerosols share a similar spatiotemporal pattern in the free troposphere, indicating that they undergo similar long-range transport before arriving over the Azores islands. Marked and persistent low-altitude (1–2 km) pollution transport occurred between 1 and 13 July, as shown in the evolution of vertical profiles of sulfate, OC, and BC (Fig. 1a–c). High-altitude (3–6 km) pollution transport occurred between 6 and 20 July for those three aerosol types as well. Both modes of pollution transport occurred 50 % of the time during July 2017, indicating a high frequency of long-range transport over this area. The concentrations of OC, BC, and sulfate are generally low in the MBL, so aerosol penetration from the free troposphere into the lower MBL may not be significant during this month. One exception is sulfate during 18–21 July. Sulfate concentration experienced an increase in the MBL followed by a lag increase in the free troposphere. Since there is no significant transport signal before and during that time period, the elevated sulfate concentration within the boundary layer is likely due to some local sources such as oxidation of marine dimethyl sulfate (DMS). Typical high- and low-plume cases are represented by 18 and 12 July, respectively, so they will be investigated thoroughly in the later aircraft data analyses and model simulations.
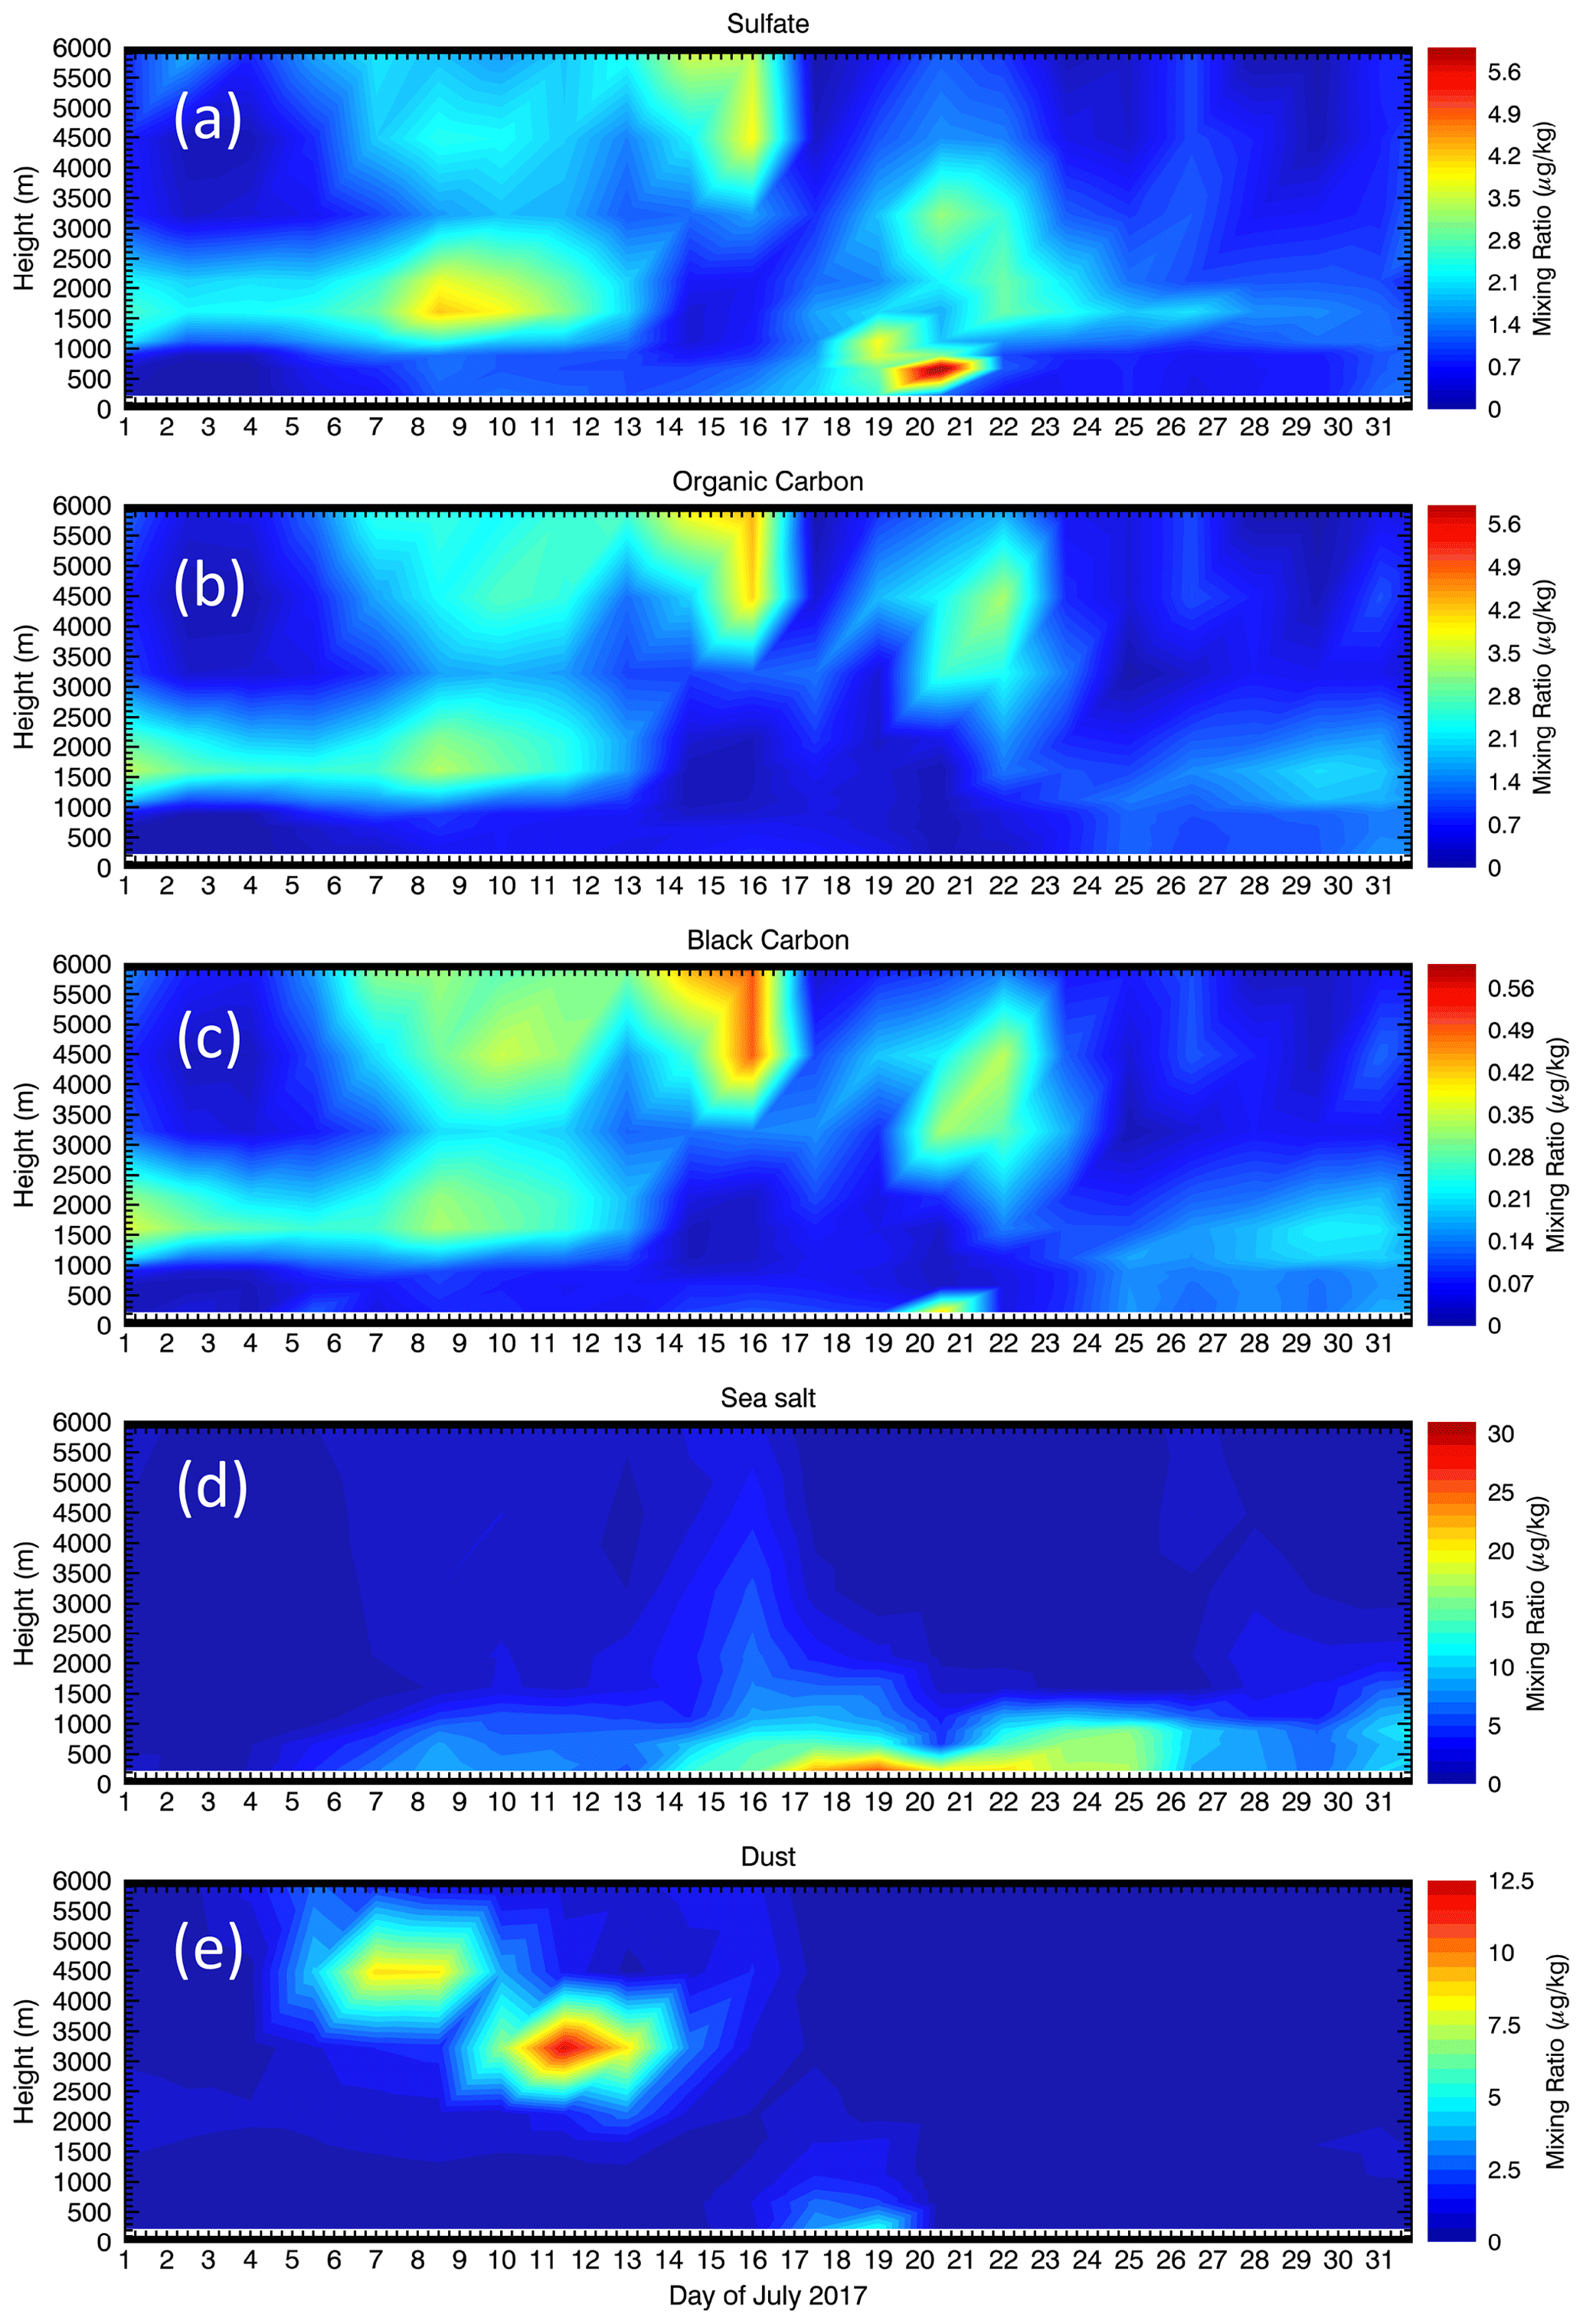
Figure 1Temporal evolutions of vertical distributions for five types of aerosols as shown in (a) sulfate, (b) organic carbon, (c) black carbon, (d) sea salt, and (e) dust during July 2017 over the Azores based on the ECMWF-CAMS aerosol reanalysis product.
The aerosols of natural sources, namely sea salt and dust, show different vertical distributions (Fig. 1d–e). Sea salt aerosols mainly reside near the surface and are rarely found above 1000 m. Dust particles are mainly found at high altitudes, typically above 3 km, during 5–14 July, indicating their long-range transport. However, the spatiotemporal pattern of dust in the free troposphere is quite distinctive from sulfate and smoke, implying different sources of long-range transport. Previous studies suggest the possible dust transport from the Saharan Desert to the northeast Atlantic region (Logan et al., 2014; Weinzierl et al., 2017). To address those issues, back-trajectory analyses were conducted, and the results are discussed later. During 15–19 July, dust particles are found within the boundary layer and even near the surface following the presence of a dust plume in the free troposphere earlier. Such a downward propagation does not occur for anthropogenic aerosols however, likely explained by the fact that dust particles are bigger in size with larger settling velocity.
3.2 Identification of source regions using back-trajectory analysis
The backward ensemble trajectories were computed using the NOAA Hybrid Single-Particle Lagrangian Integrated Trajectory (HYSPLIT; Stein et al., 2015) model based on the large-scale meteorological fields from the Global Data Assimilation System (GDAS) with a spatial resolution of 0.5∘. We focus on three cases over 3 d to examine the sources of typical high- and low-altitude plumes of anthropogenic aerosols and mineral dust. The model uses an endpoint height of 1.5, 2.4, and 3 km for three selected cases to represent the air parcels in the anthropogenic low altitude, high altitude, and fine-mode dust plumes, respectively. To capture the different lengths of transport procedure, the model was backward-integrated for 7 d for the anthropogenic aerosol cases and 13 d for the mineral dust one. A total of 20 ensemble members are employed for each case. They agree with each other better on horizontal trajectory than vertical displacement. Larger differences are found among the ensemble members after 3 d for anthropogenic aerosols and after 2 d for dust.
The back-trajectory analyses confirm that the source region of sulfate, BC, and OC in the plumes is the North American continent (Fig. 2a, c), consistent with previous analyses of data from the earlier field campaign over the ENA site (Logan et al., 2014). The westerly jet carries the pollutants across the Atlantic Ocean, and it takes 3 to 4 d to arrive at the Azores. Temporal evolutions of trajectory vertical displacement reveal when aerosols are elevated from the planetary boundary layer (PBL) to the free troposphere, and such information can be used to pinpoint the aerosol source. Figure 2b and d suggest that aerosols are mainly from the central US in the high-plume case and from eastern US in the low-plume case. The curved trajectories in the low-plume case reflect the influence of the Bermuda or Azores High located to the south. The dust transports exhibit a much different pathway. Starting at 3 km altitude, the back-trajectory develops westward initially but sharply turns around and points to the North Africa (Fig. 2e, f). It suggests that the Sahara is the most likely source for the dust particles observed over the Azores.

Figure 2Back-trajectory analyses of air mass history starting from the ENA site for the three selected cases using the NOAA HYSPLIT trajectory model. Anthropogenic-aerosol-dominated plume with high altitude (Anthro_High_Alt) and low altitude (Anthro_Low_Alt), dust plume (Dust).
Note that back-trajectory analysis of air mass has its own limitations. For example, shipping emissions over the northern Atlantic Ocean are not considered in the present analysis. Also, the source attribution based on episodic events may be not representative of the climatological mean scenario. Therefore, the source attribution results here need to be further evaluated in future studies, which can utilize a more sophisticated approach such as source tagging in a global climate model (GCM), nudged by the reanalysis data (Wang et al., 2014).
3.3 Vertical distributions of different aerosols in aircraft observations
Aircraft observations during the ACE-ENA provide more accurate depictions of aerosol vertical distribution and aerosol layer heights relative to cloud layer heights, with differentiation of aerosol type and hygroscopicity. During the summer IOP, quite diverse aerosol vertical profiles are found. Here we focus on those with noticeable aerosol plumes in the free troposphere. Figure 3 shows two representative vertical distributions of aerosol mass concentrations averaged over the flights on 18 and 12 July, corresponding to the high- and low-altitude aerosol plumes, respectively. In the high-altitude-plume case, BC, OC, and sulfate concentrations all increase with height above clouds, indicating downward propagation of aerosol plumes and possible interaction with MBL clouds. BC and OC concentrations are even higher than that of sulfate in the free troposphere, suggesting the biomass-burning signature of the plume on that day. Conversely, within the MBL, there is a much higher concentration of sulfate in the MBL than those of BC and OC. This phenomenon is also captured by the CAMS aerosol reanalysis (Fig. 1a), lending support to the fidelity of the reanalysis dataset. For the low-altitude plume (Fig. 3b), the vertical gradients of aerosol concentrations are not clear above clouds. Meanwhile, the aerosol concentrations within 500 m right above clouds are higher than those near the cloud base (Fig. 3b), corroborating the physical contact between aerosol plumes and MBL clouds. Comparing Figs. 3 and 1, the CAMS reanalysis data generally agree with aircraft-observed aerosol profiles on the selected days, but the predicted aerosol mass mixing ratios are an order of magnitude higher in the reanalysis data. Those discrepancies point out that any quantitative usage of aerosol reanalysis product should be done with caution.
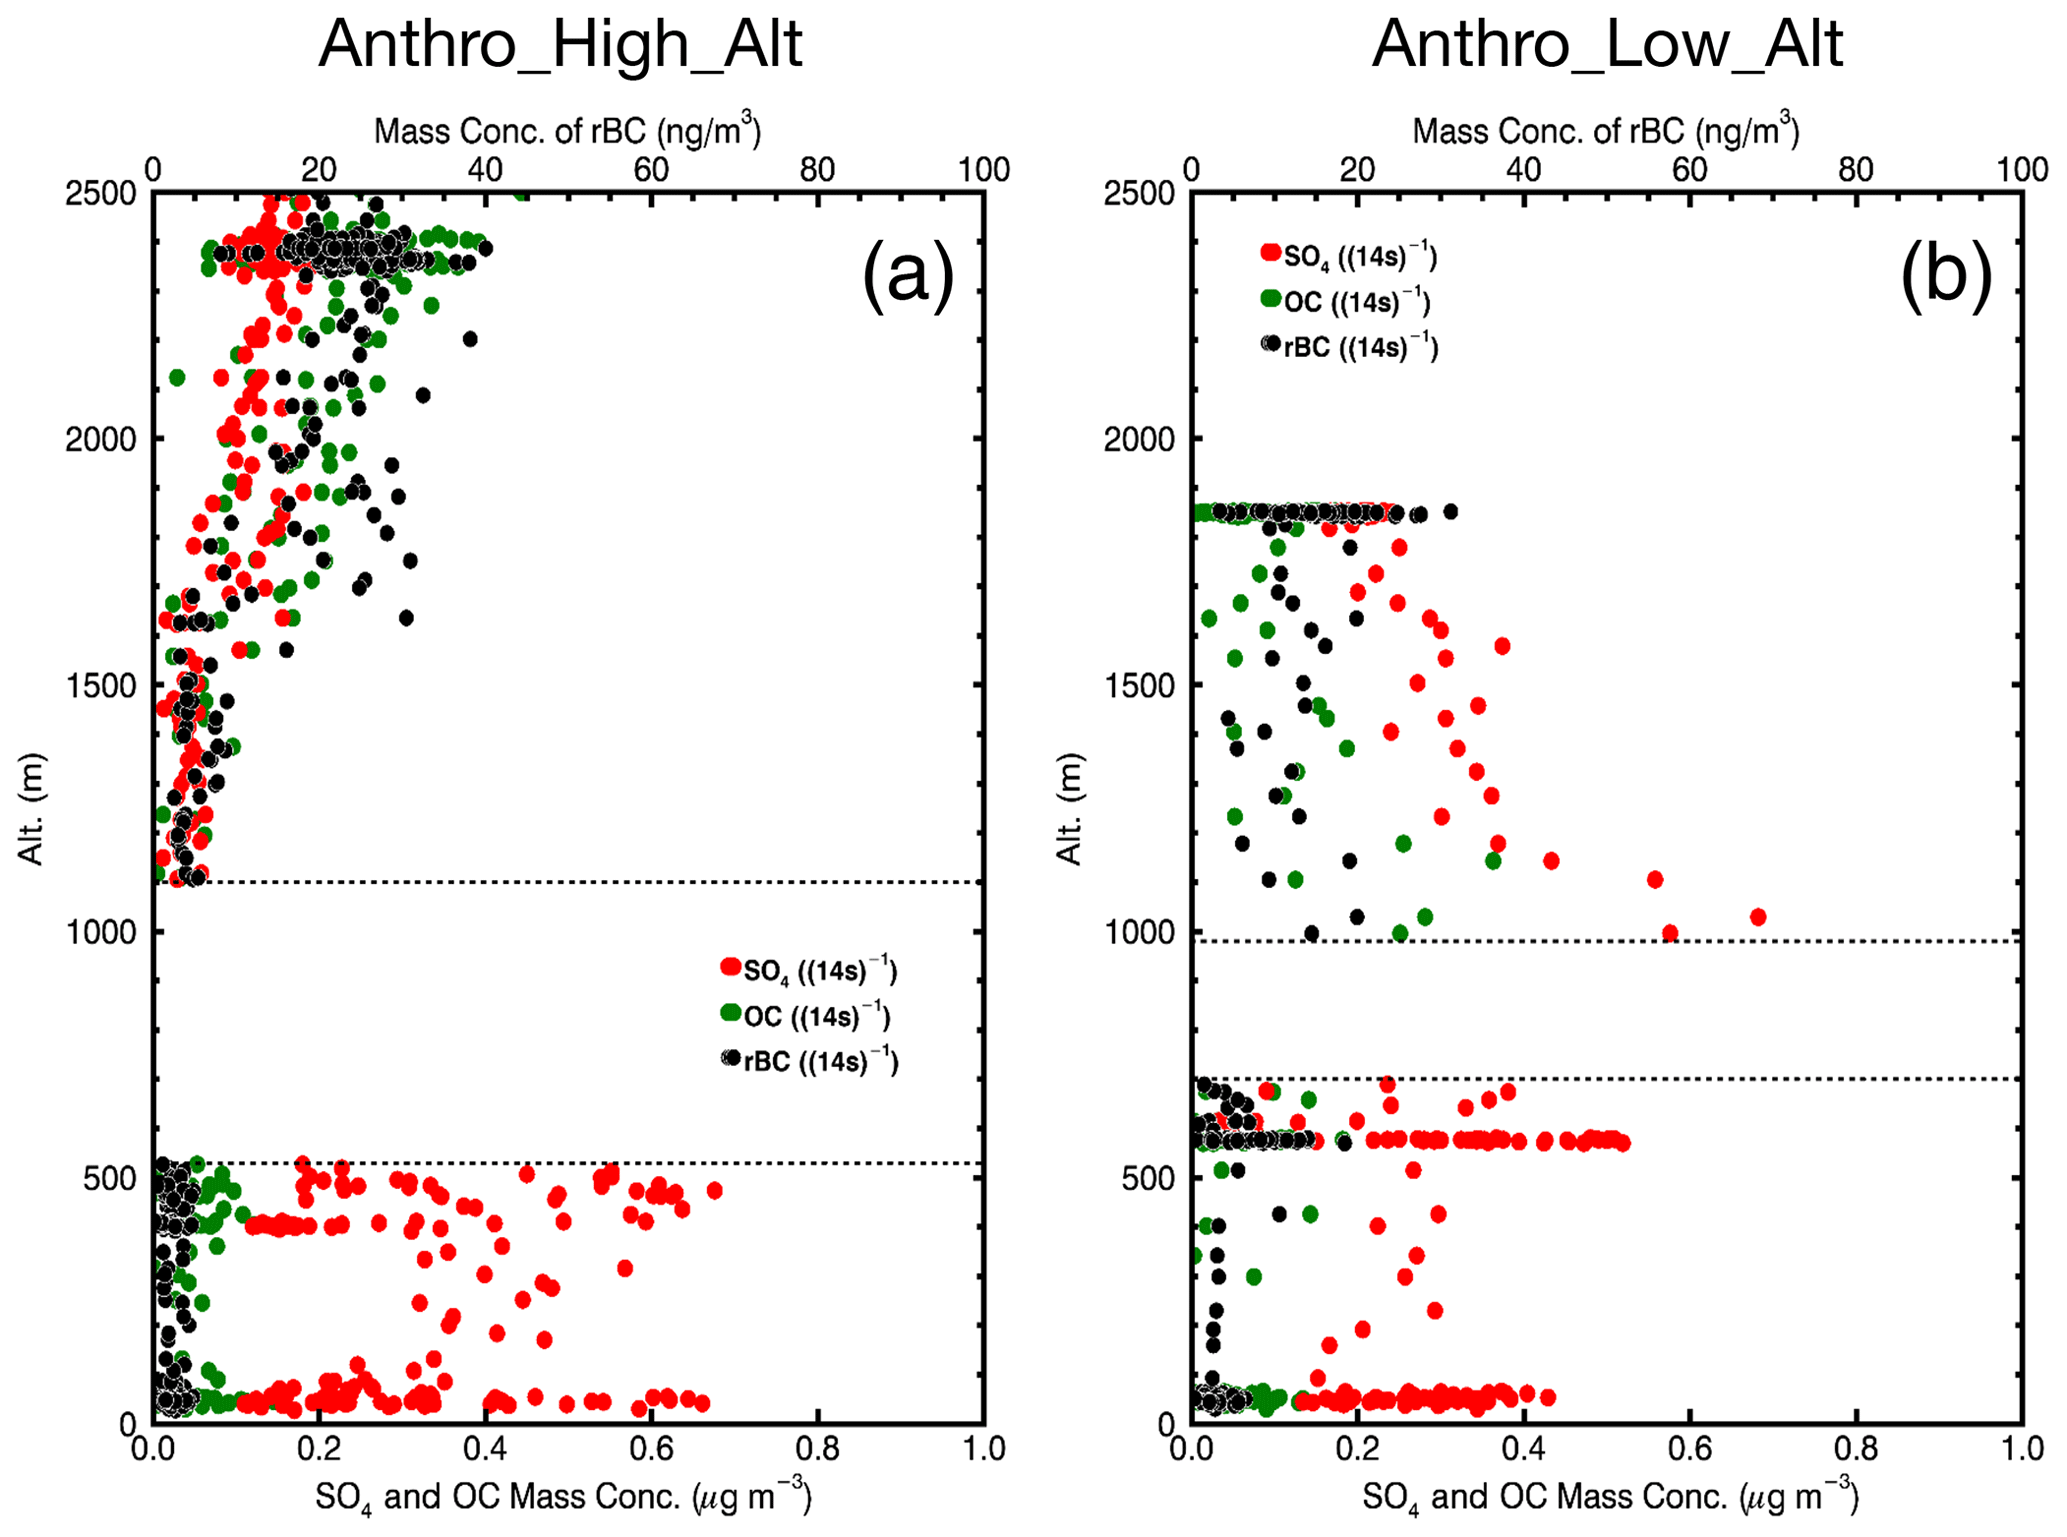
Figure 3Airborne-measured vertical profiles of sulfate (SO4; red dots), organic carbon (OC; green dots), and refractory BC (rBC; black dots) mass mixing ratios averaged over multiple flights in two characteristic cases: (a) high-altitude aerosol plume on 18 July and (b) low-altitude aerosol plume on 12 July 2017. The highly uncertain and noisy aerosol observations due to cloud contamination are not shown (between two dashed lines), so the blank regions approximately denote cloud layer.
Aerosol and CCN concentration vertical profiles are also available from the aircraft observations. For the high-altitude plume, NCN reaches a peak of ∼600 cm−3 at 2.5 km and then decreases dramatically downwards to ∼180 cm−3 near the cloud top (∼1.1 km), which is even lower than NCN values within the boundary layer, ranging from 200 to 300 cm−3 on that day (Fig. 4a). The measured 200 m average of NCN above the cloud top is 185 cm−3, smaller than that below the cloud base, 290 cm−3 (Table 1). From the surface to a height of 2.5 km, the minimum NCN occurs near the cloud top, reflecting the disconnection between MBL aerosols and those from long-range transport aloft. The characteristics of the NCCN profile are similar to those of NCN. In the low-altitude plume, both NCN and NCCN show a slower decline above the cloud layer (Fig. 4c, d). Also, the right-above-cloud-top NCN and NCCN at 1 km are higher than those below the cloud layer, indicating the physical contact of the aerosol plume with the cloud deck.
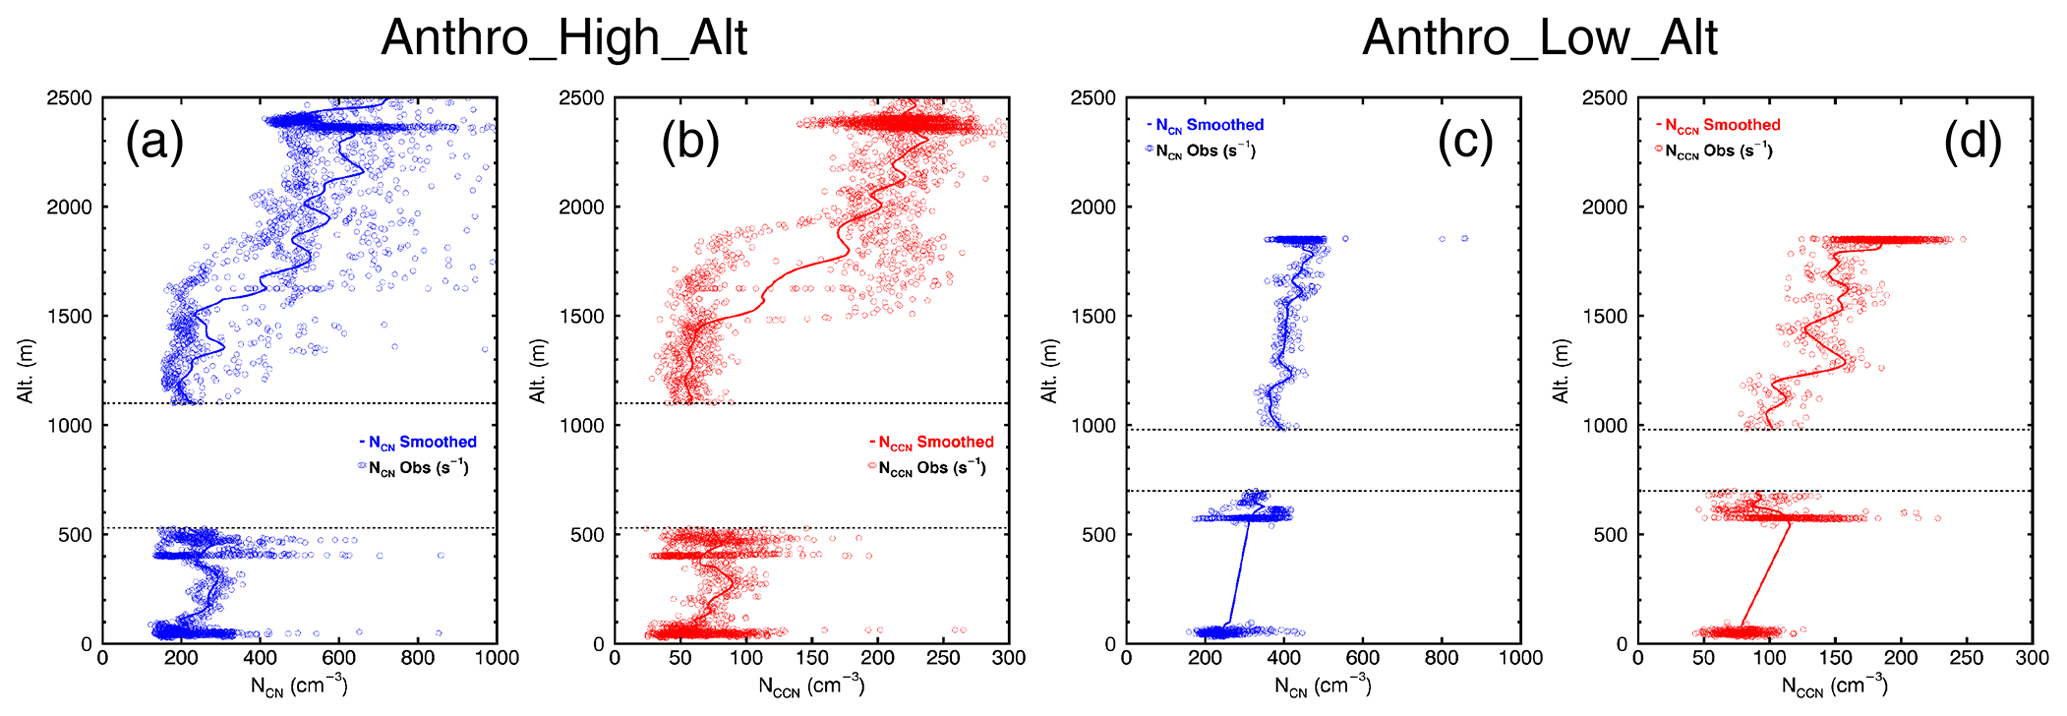
Figure 4Airborne-measured profiles of condensation nuclei (NCN; blue) and cloud condensation nuclei (NCCN; red) averaged over multiple flights in two cases with high- and low-altitude aerosol plumes. The highly uncertain and noisy aerosol observations within the cloud layer are not shown (between two dashed lines).
Table 1Characteristics of condensation nuclei concentration and cloud vertical profiles for all eight cases during the summer phase of the DOE ACE-ENA field campaign.
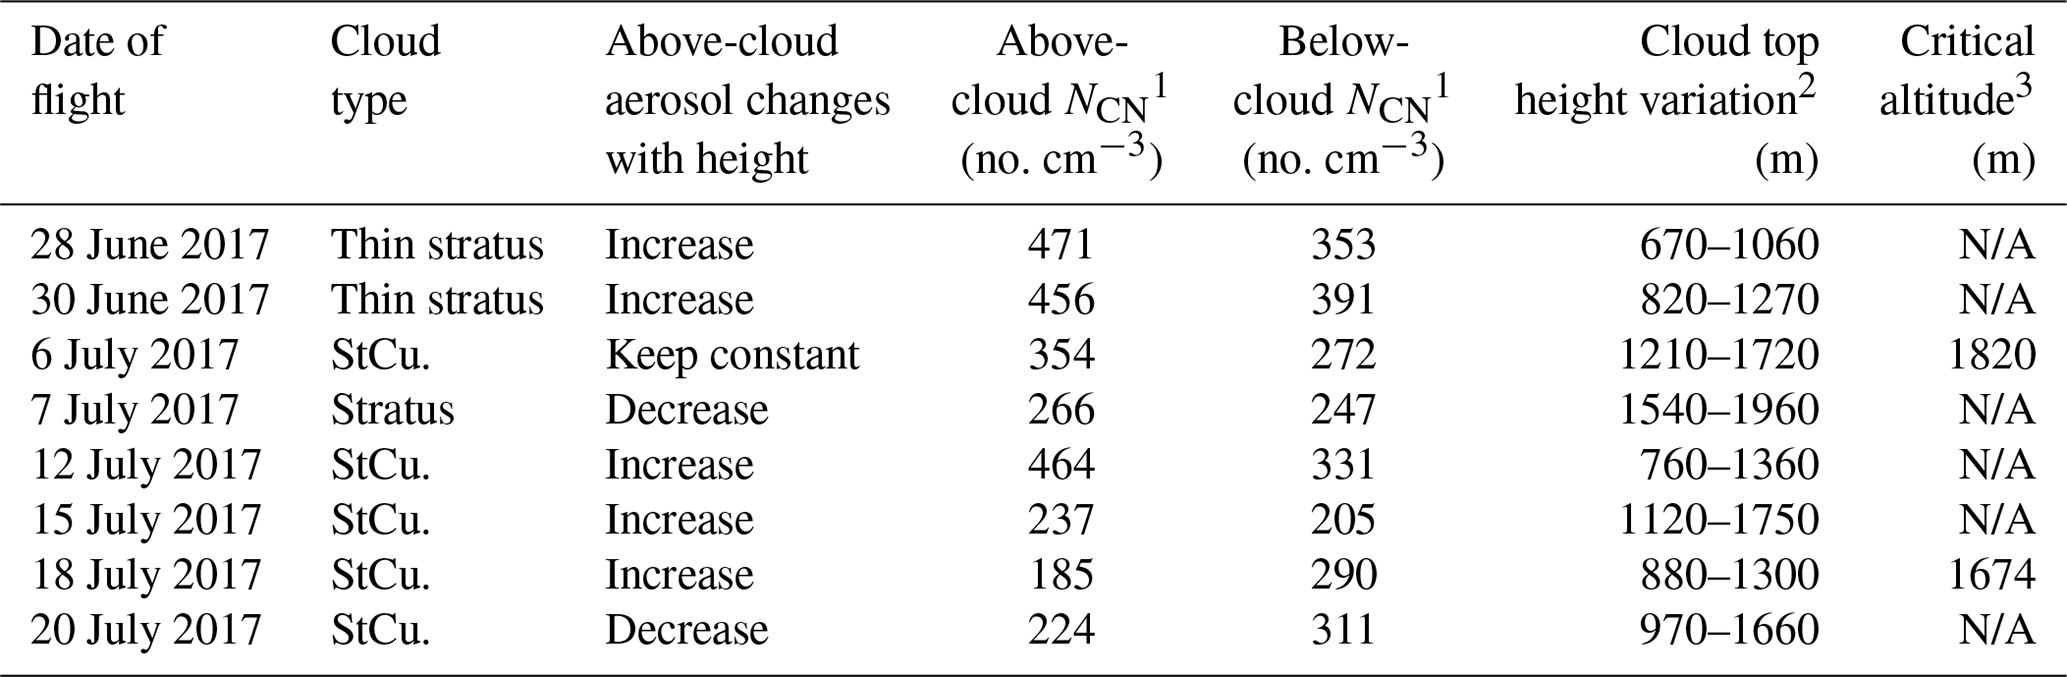
1 Average within 200 m above (below) cloud top (base). 2 For continuous cloud layer. 3 Critical altitude is defined as the height at which above-cloud NCN is equal to the below-cloud NCN. N/A indicates not available.
During the summer IOP, the aircraft was deployed over 20 d to collect data. Among those days, only 8 of them have stable MBL clouds during the flight hours, according to the ground-based cloud radar. We summarize the aircraft-observed aerosol and cloud vertical distribution characterizations for those 8 d and eight cases in Table 1. Among those eight cases, 5 d show an increase in above-cloud NCN along with height, and 1 d shows roughly constant NCN above clouds, all of which indicate the existence of long-range transport of aerosols in the free troposphere and downward-propagating influence on the aerosol budget near the cloud top. Moreover, five out of the eight cases have above-cloud NCN (within 200 m) significantly larger than below-cloud NCN, implying the potential influence of free-troposphere aerosols on MBL clouds from another angle of view.
In observation of quite diverse aerosol vertical profiles in the real atmosphere, an outstanding science question is under what conditions the long-range-transported aerosols can exert significant impacts on the MBL clouds beneath. To answer this question and to quantify the related aerosol indirect effects, cloud-resolving WRF simulations are performed, focusing on the two selected cases with the high- and low-altitude plumes on 18 and 12 July, respectively. In the model control simulations, the aircraft-measured aerosol profiles are used to set up initial and lateral boundary conditions of aerosol total number concentration for the two cases (Fig. 5). Sensitivity simulations for clean scenarios are conducted by replacing the observed aerosol concentrations above clouds with an assumed exponential decrease in NCN along with height in the free troposphere. Before sensitivity analyses, we want to examine the extent to which the cloud-resolving simulations can reproduce the local-scale meteorological variations and MBL cloud structure at Azores. Here we use the high-altitude-plume case as an example to evaluate the model's fidelity in the northeast Atlantic.
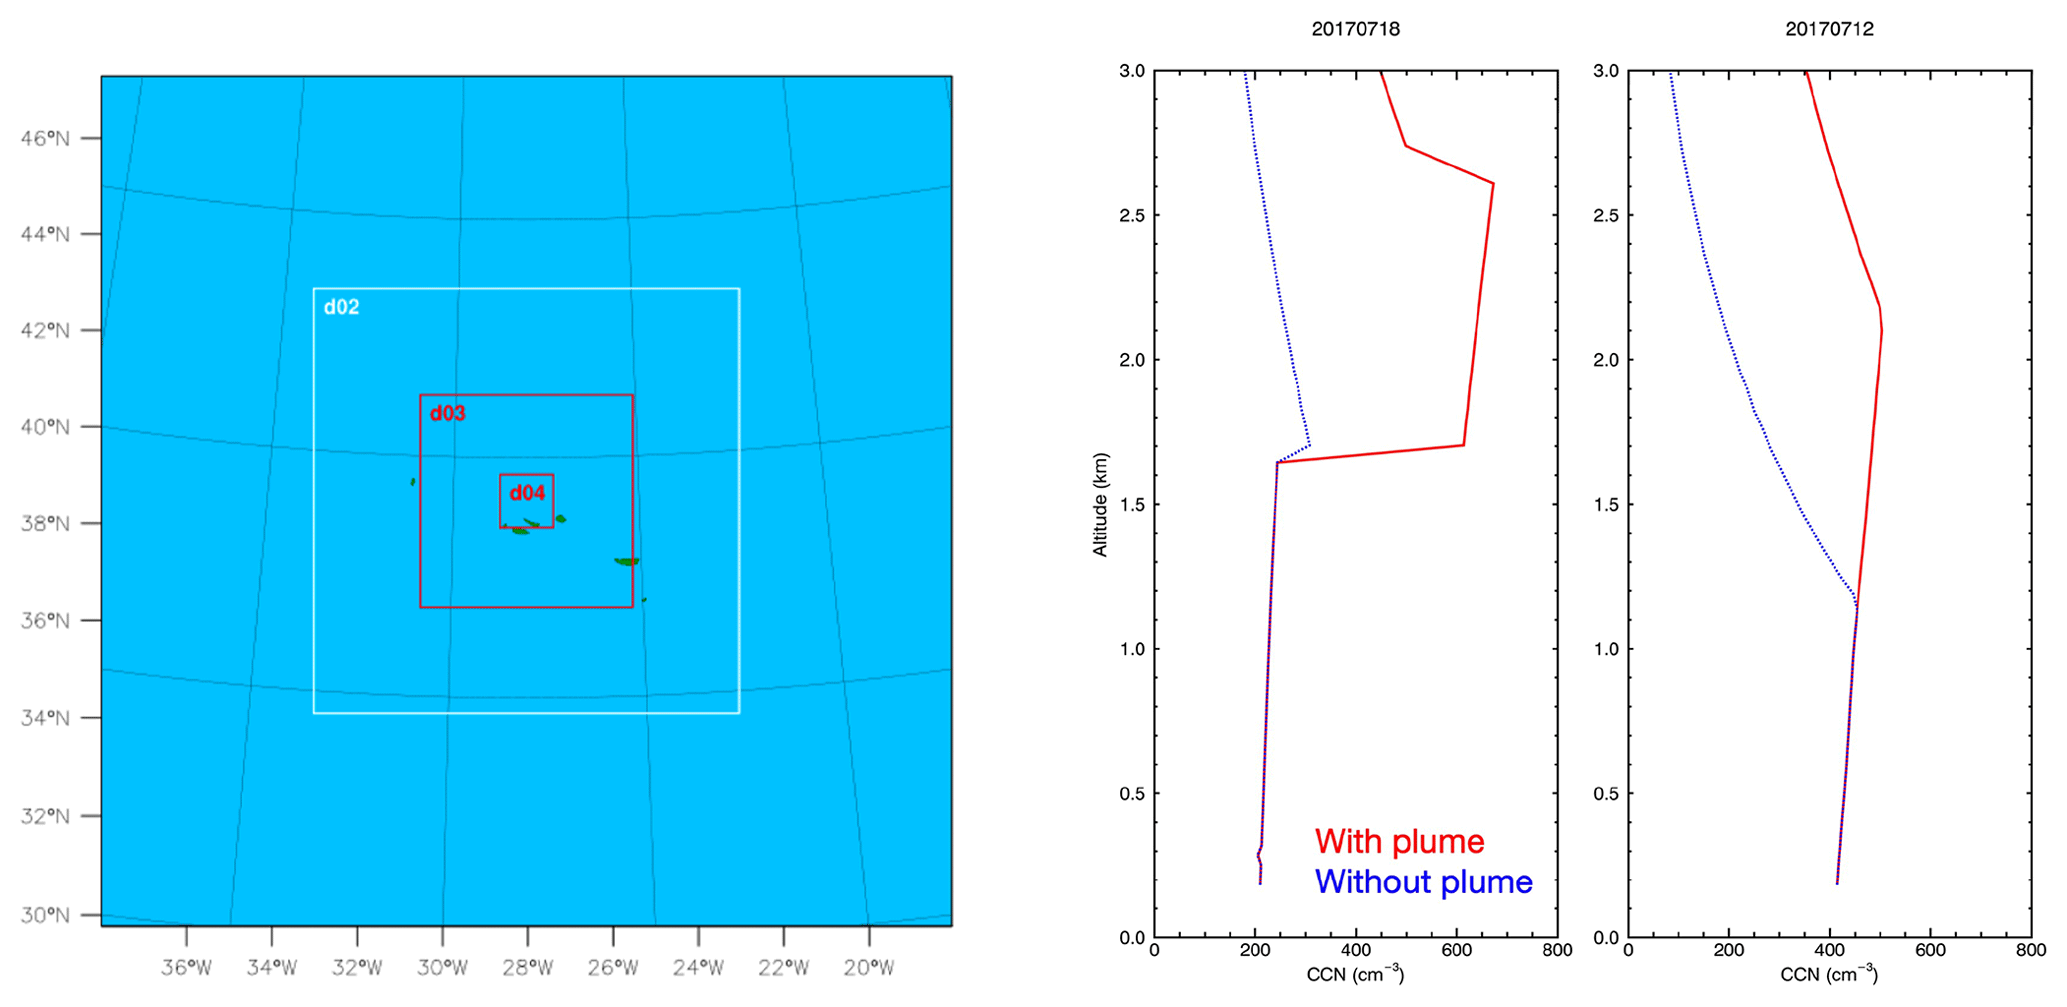
Figure 5WRF domain map and aerosol concentration profiles used in the model as initial and boundary conditions for the sensitivity runs of the two cases.
The large-scale wind pattern and boundary layer structure from the model control run are compared against the interpolated soundings over the ARM ENA site. Figure 6 shows that the model exhibits good agreement with the observed air temperature, moisture content, and relative humidity. The model captures the cold and dry air advection at 1 km height in the morning followed by the warm and moist air in the afternoon. The persistent supersaturation between 500 and 1000 m and associated cloud deck are also reproduced in the simulation. We find that the key model configuration to reproduce the main features of meteorological variability is to have appropriate domain nesting and dynamical downscaling. Particularly, the outmost domain with 19.2 km grid spacing is crucial and necessary for this midlatitude region. The region is featured by frequent mesoscale weather systems, so local wind and moisture fields vary drastically even within a day. The model setup with only three domains of 4.8 km, 1.2 km, and 300 m horizontal resolution induces large errors in the vertical profiles of moisture and temperature (Fig. 6c, f, i). A persistent dry bias occurs near the MBL top when the outmost domain with 19.2 km grid spacing is absent. Such meteorological biases further influence cloud simulation and result in a discontinuous cloud layer in its temporal evolution. The critical role of the outmost domain reveals the importance of mesoscale flows and thermodynamical states in regulating the MBL properties and resultant cloud vertical profiles. Those mesoscale effects are absent in the meteorological fields of the reanalysis data with 25 km resolution.
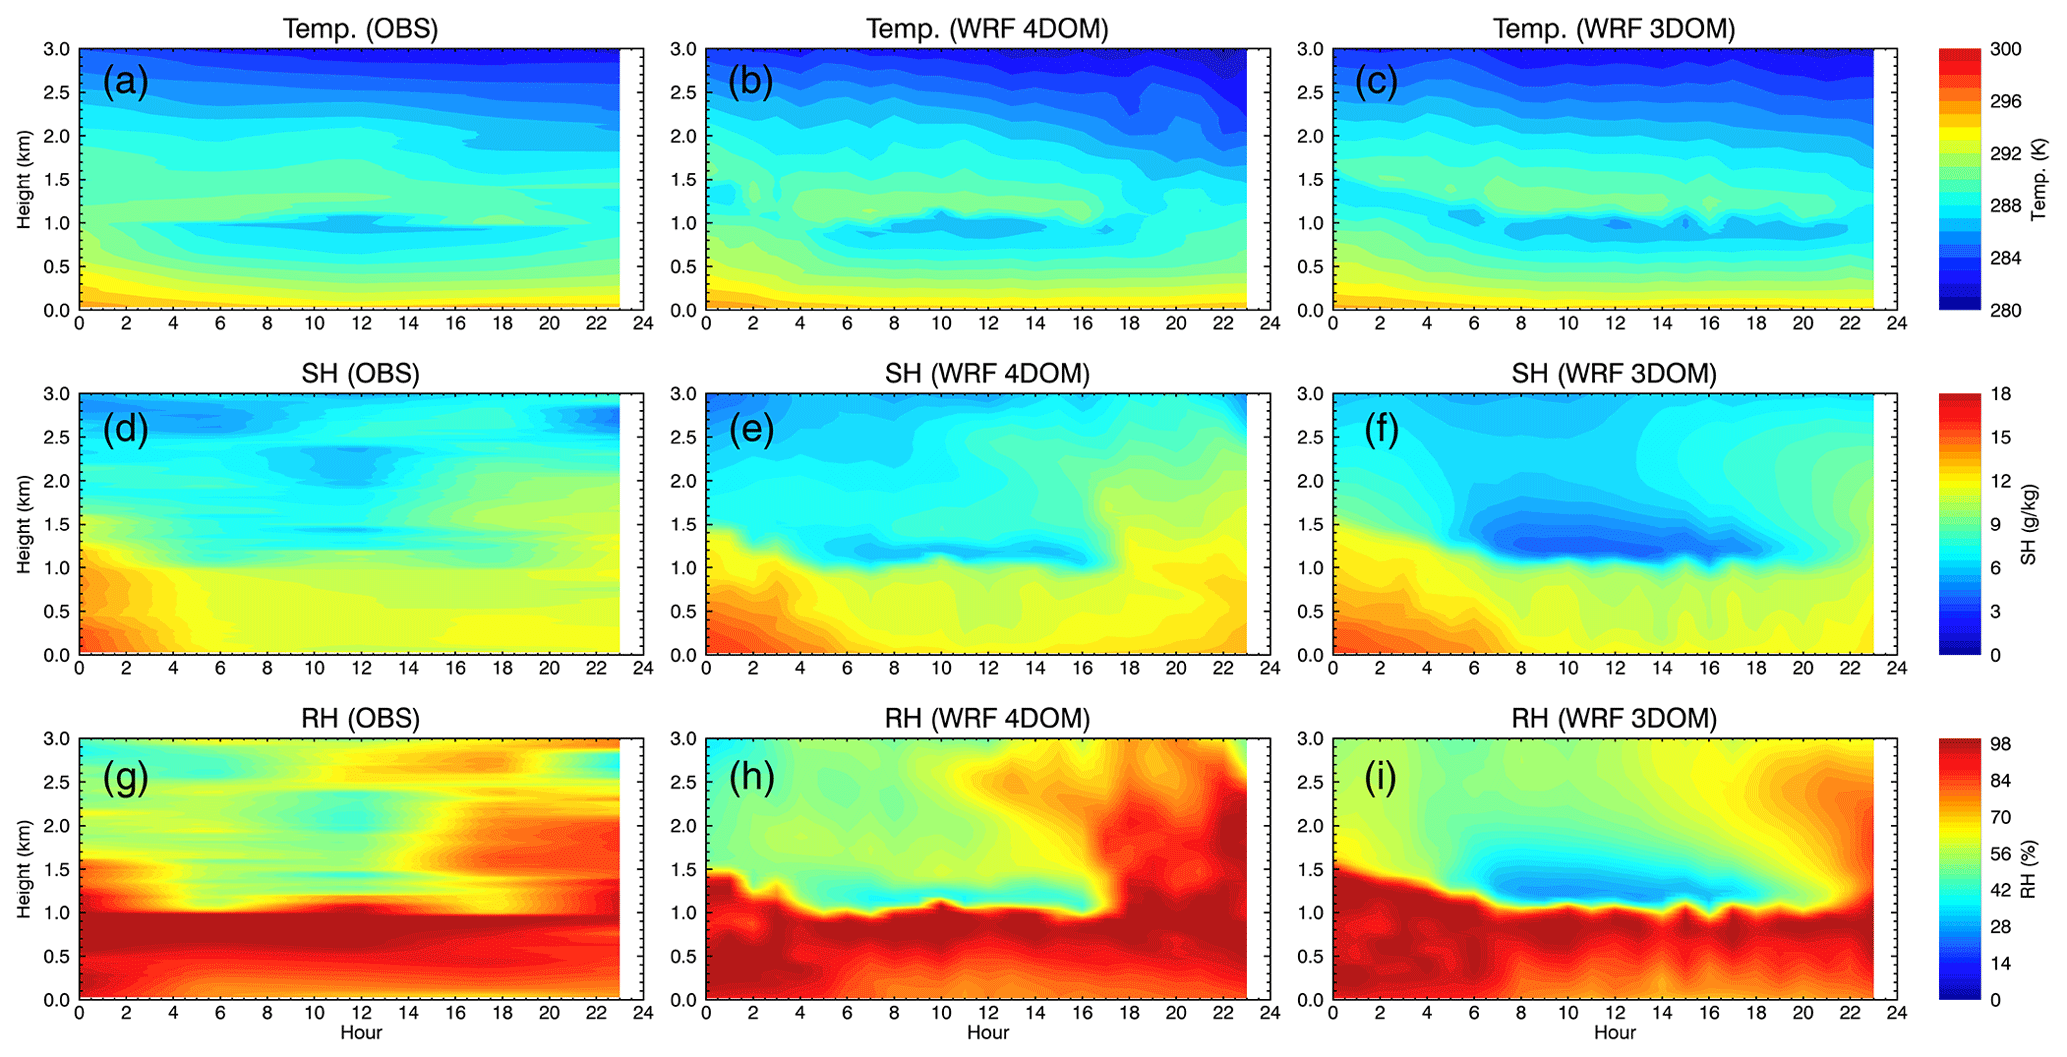
Figure 6WRF-simulated and merged-sounding-observed (OBS) spatiotemporal evolutions of air temperature (Temp.), specific humidity (SH), and relative humidity (RH) for the high-altitude-plume case. Two sets of WRF simulations are presented here, one with four domains (the baseline configuration) and one with three domains (without the 19.2 km domain). The model results are averaged over 10 × 10 grid points centering around the ENA ground site location from the innermost domain.
MBL cloud properties simulated by the WRF are evaluated against the retrievals from a combination of ground-based observations. The simulation captures the cloud top height at 1 km and cloud bottom height at 500 m during the day (Fig. 7a, b). Therefore, the cloud physical thickness is comparable between model and observation. LWC is generally smaller in the model than in the observation. Meanwhile, the simulation captures the larger LWC near the top of the cloud, reflecting the adiabatic growth of cloud droplets starting from the cloud bottom. The temporal evolution of simulated LWC does not match well with retrievals, partly due to the spatial sampling bias. Cloud droplet effective radius (Re) in the model is calculated as a function of volume mean droplet radius as well as relative dispersion (a ratio between standard deviation and mean radius in a size distribution; Liu and Daum, 2002). The model shows the comparable vertical distribution of Re with cloud radar retrievals, e.g., the larger Re near the cloud top but with larger variability in the size range than observations (Fig. 7c, d).
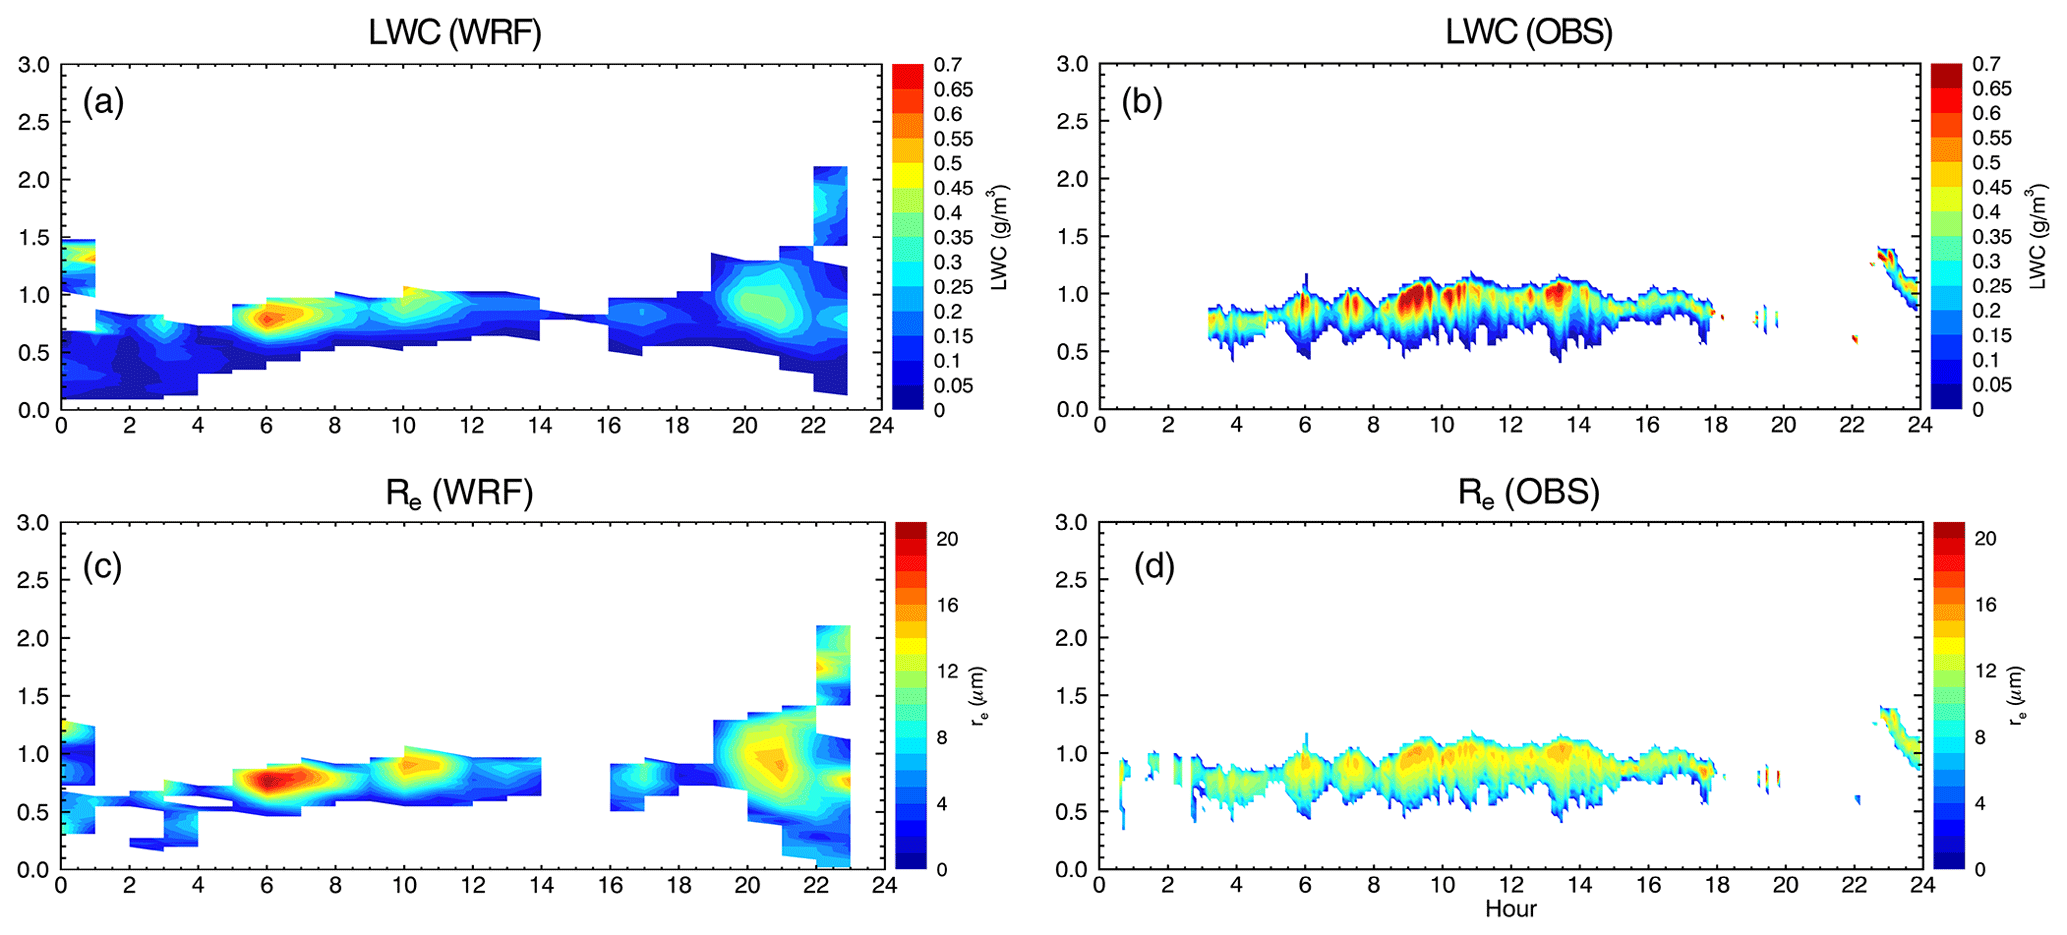
Figure 7WRF-simulated (a, b) and cloud-radar-retrieved (c, d) spatiotemporal evolution of liquid water content (a, c) and droplet effective radius (b, d) for the high-altitude-plume case. The model results are averaged over 10 × 10 grid points centering around the ENA ground site location in the innermost domain.
To explore the sensitivity of MBL cloud microphysical properties to the long-range aerosol transport, we contrast the simulations with and without observed long-range aerosol plumes in the free troposphere. For the high-altitude-plume case, the comparisons of model run with different aerosol vertical profiles show that both LWC and cloud fraction remain largely unchanged no matter whether the aerosol plume above 1.5 km exists or not. In fact, the cloud top height on that day experienced some temporal variations near the Azores as it extended to 1.5 km during the night due to strong radiative cooling and reduced to 1 km during most of the daytime. As a result, the distance between the aerosol plume and cloud deck varied from 500 to less than 100 m. Figure 8a–f show that the long-range-transported aerosols have no significant impacts on the MBL cloud properties underneath when the physical distance between the aerosol plume and cloud layer is greater than 100 m. This finding echoes the importance of accurate detection of plume base altitude using remote-sensing instruments (Rajapakshe et al., 2017).
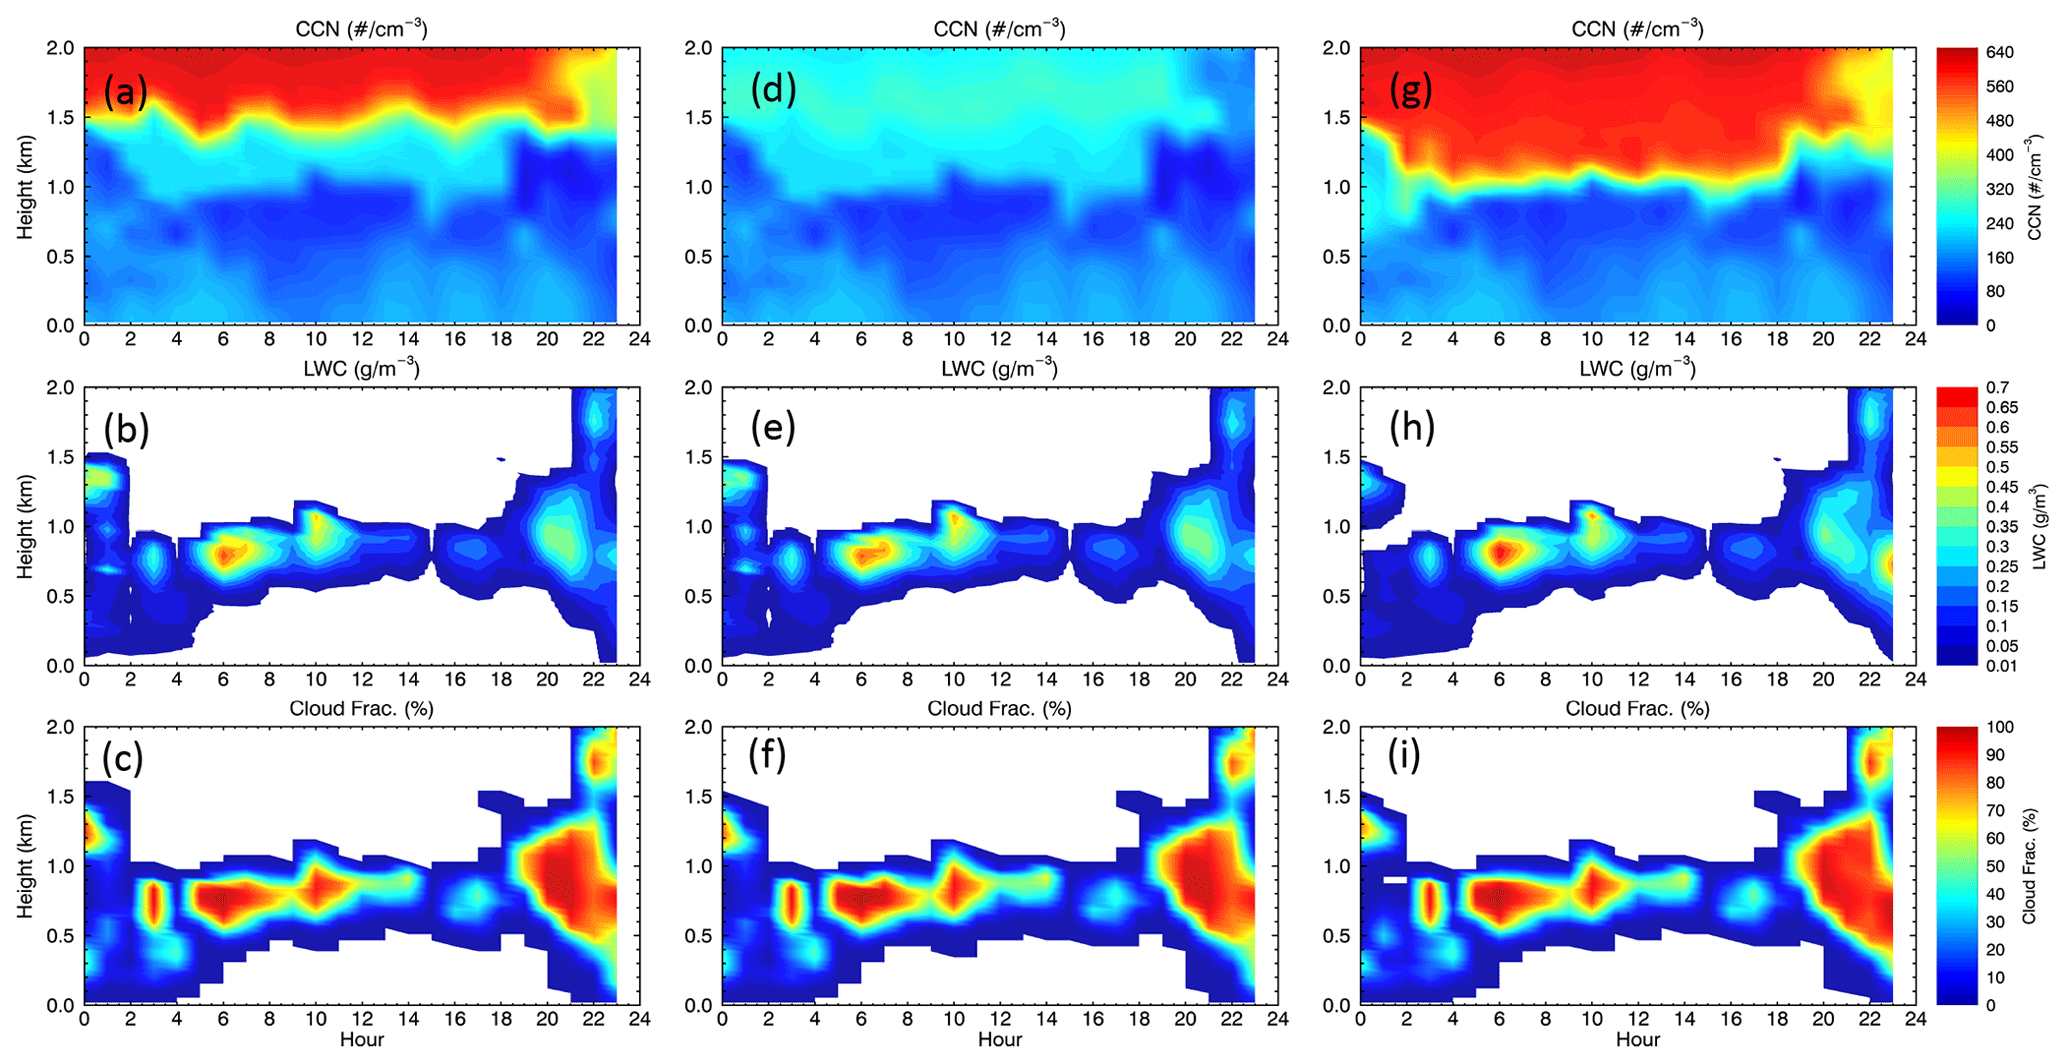
Figure 8WRF-simulated CCN concentration, liquid water content (LWC), and cloud fraction for the high-altitude-plume case (averaged over 20 × 20 grid points): (a–c) with the observed aerosol plume due to the long-range transport (above 1.5 km), (d–f) with the aerosol plume removed, and (g–i) with the aerosol plume moved downward to 1.1 km.
To answer the question of the height at which the aerosol plume starts to influence MBL cloud microphysical properties, we perform an additional simulation by lowering the aerosol plume bottom from 1.5 to 1.1 km, which is considered to be the height of the MBL and cloud tops during the daytime. In this sensitivity run, the aerosol indirect effect remains largely muted during the daytime. It reveals that when boundary layers and cloud decks are relatively stable, long-range-transport aerosols have a low chance of being entrained into the cloud top and being activated to cloud droplets. However, when the cloud deck becomes deeper at night, particularly after 22:00 UTC, when a significant part of the cloud extends into the aerosol layer above 1.1 km, an increase in LWC by up to 0.1 g m−3 is observed (Fig. 8g–h).
In contrast, the simulated clouds in the low-altitude-plume case exhibit large variations in the vertical (Fig. 9), and consequently the aerosol plume just above the cloud top imposes significant influence on the MBL cloud micro- and macrophysical properties. The mean LWC is increased by 5.7 %, and cloud fraction is increased by 5.4 % due to a 48.0 % increase in CCNs between 500 and 3000 m in altitude under the influence of the long-range aerosol transport. The distinctive responses of MBL clouds to aerosol plumes at different heights reinforce the notion that the vertical overlap between aerosol and cloud layers is crucial for ACIs pertinent to the long-range aerosol transport. Moreover, the extent of overlap is jointly controlled by aerosol plume height and cloud top variation. The latter is particularly important when the boundary layer is relatively stable, and the aerosol vertical mixing is rather weak for most marine stratus clouds.
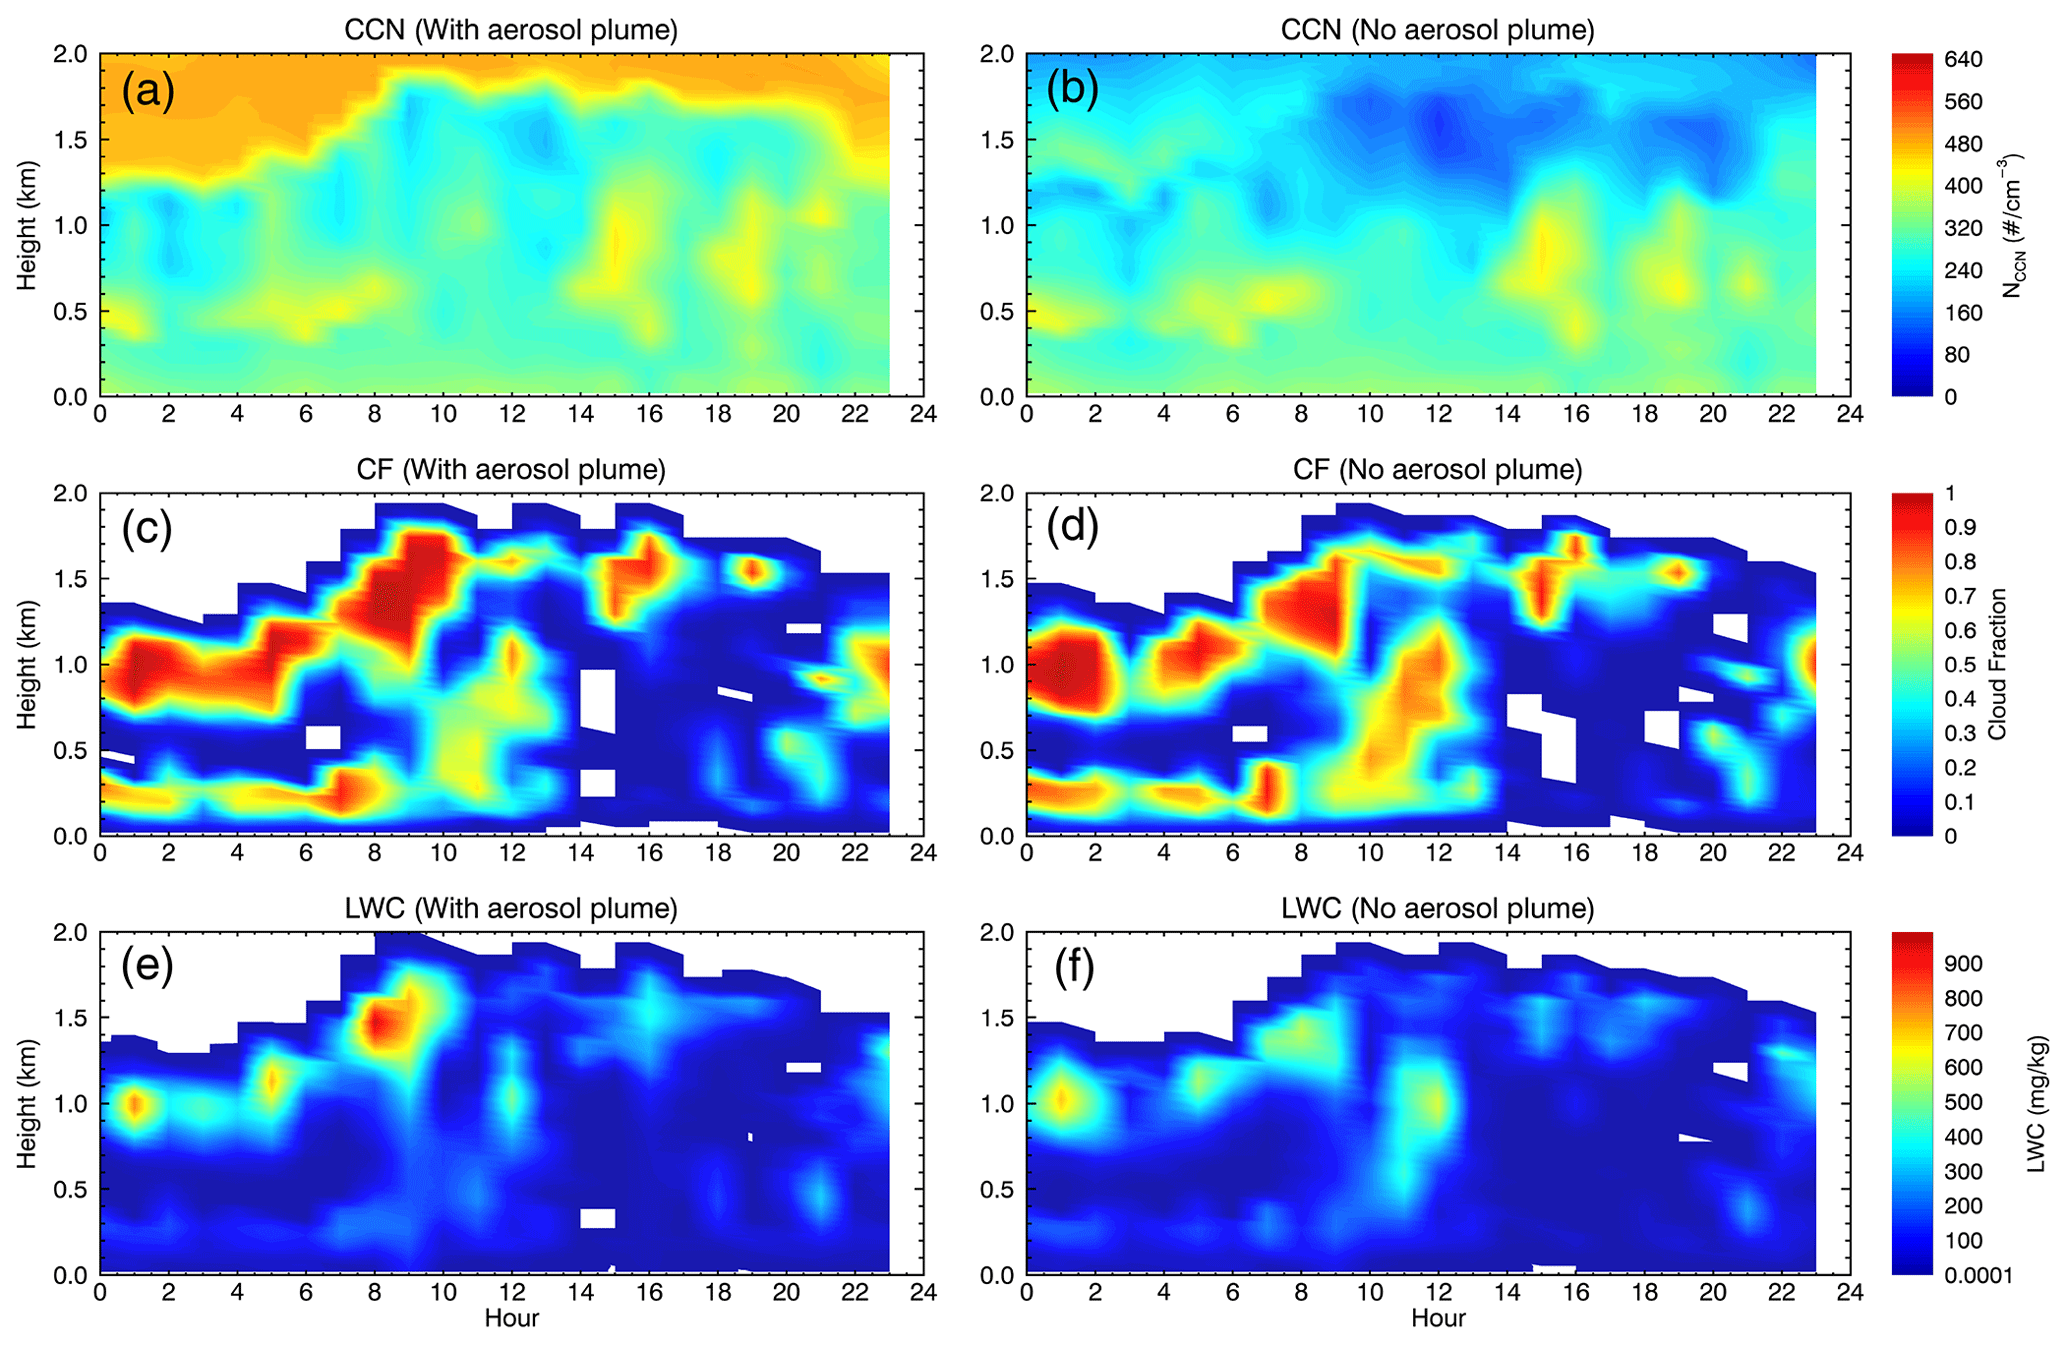
Figure 9WRF-simulated CCN concentration, liquid water content (LWC), and cloud fraction (averaged over 20 × 20 grid points near the ENA site) from the low-altitude-plume case, with observed aerosol profile (a, c, e) and idealized profile that removes aerosol transport in the free troposphere (b, d, f). The two different vertical profiles are shown in Fig. 5.
It is a nontrivial task to identify the physical contact between an aerosol plume and a cloud deck based on the aircraft measurements. Especially when the center of an aerosol plume is hundreds of meters above the cloud top, and aerosol concentration right above the cloud is lower than that within PBL, it is difficult to estimate whether aerosols can be entrained into the cloud layer. As the above model results suggested, ACIs require the critical mass of aerosols immersed into the cloud layers. Here we define a “critical altitude” at which above-cloud NCN is equal to the below-cloud NCN. With such a concept, we can compare this altitude to the cloud top variation during a period of interest. Take the high-altitude-plume case for example: according to the airborne measurements, the critical altitude is 1674 m, well beyond the range of cloud top variation (880–1300 m) on that day (Table 1). Thus, we can reach a conclusion that, even though long transport of aerosols was found in the free troposphere on that day, they were unlikely to interfere with MBL clouds below. Here we take all the airborne-measured vertical information into account, including aerosol changes above clouds, comparison of above- and below-cloud NCN, and cloud top height variations, and we reassess the eight observed cases in Table 1. We find that 5 d (28 June, 30 June, 6 July, 12 July and 15 July) out of 8 during the summer phase of the ACE-ENA field campaign clearly show the interactions between aerosols from long-range transport and local MBL clouds, corresponding to a 62.5 % occurrence frequency.
The previous cloud-resolving modeling studies of aerosol effects on MBL cloud properties either used a constant CCN concentration throughout the whole domain (Yamaguchi et al., 2019), or the CCN profiles in the MBL were prescribed with an exponential decrease in the free troposphere (Wang et al., 2013, 2018; Lin et al., 2016). The consequent sensitivity experiments were conducted by perturbing CCNs at different heights with the same scaling factor without differentiating the aerosols from different sources. Therefore, those studies share a common assumption that the CCNs are solely from a local source impacted by local boundary layer processes. Here we repeat this type of CCN perturbation experiment and compare the resultant aerosol effects with our current assessment for the effects of long-range-transported aerosols only. Three bottom-heavy CCN profiles (well mixed in MBL and exponentially decreasing in FT) are used to initialize the high-altitude-plume case. The CCN concentrations in MBL are 10, 100, and 1000 cm−3 in three sensitivity runs. The cloud susceptibility here is defined as the ratio between logarithmic cloud property changes in the simulations and logarithmic CCN differences in the initial profiles between 0.5 and 3 km. The cloud susceptibility derived from the comparison of those three idealized runs is found to range from −0.22 to −0.25 for Re and from +0.18 to +0.30 for LWC (Fig. 10a–b). Both Re and LWC susceptibility values are close to the high ends of most of the current AIE assessments (Sato and Suzuki, 2019; Zheng et al., 2020). For the noticeable long-range-transport effect in the low-altitude-plume case, the Re and LWC susceptibilities are −0.11 and +0.14, respectively. They are smaller than those from the idealized MBL aerosol perturbation experiments. Hence, this suggests that the aerosols of long-range transport are less efficient in altering MBL cloud properties than those originating from local sources. It can be attributed to the fact that dry air likely enters the cloud layer along with CCNs, resulting in less supersaturation and reduced activation rate. One caveat for our susceptibility calculation is that averaging CCNs over a broad spatial range (0.5–3 km) may introduce uncertainty to the absolute values of susceptibility by involving aerosols not involved in the aerosol–cloud interactions.

Figure 10Model-predicted cloud susceptibilities for the idealized CCN variations within the MBL for the high-altitude-plume case and the influence of CCN variations in the free troposphere (FT) for the low-altitude-plume case. The cloud properties are averaged over all cloud points in the innermost domain. NCCN values are obtained from the initial CCN profiles and averaged between 0.5–3 km.
Located in the remote eastern North Atlantic, the Azores islands experience frequent long-range transport of smoke and anthropogenic aerosols from the continental US. A recent DOE ARM ACE-ENA aircraft field campaign near the Azores in the summer of 2017 provides ample observations of aerosols and clouds with detailed vertical information. In this study, we combine the aircraft measurements, CAMS aerosol reanalysis, and an aerosol-aware and cloud-resolving WRF model to characterize spatial variations in aerosols from long-range transport over the Azores islands and assess their possible influence on the marine-boundary-layer clouds. The reanalysis data show high frequency of occurrence of long-range transport over this area. Evaluated by airborne aerosol measurement, the CAMS reanalysis data generally reproduce observed aerosol profiles over this remote region, but the predicted aerosol mass mixing ratios are still significantly biased. Our back-trajectory analyses confirm that anthropogenic and/or biomass-burning aerosols were mainly from the US continent during the summer phase of ACE-ENA, while the dust plumes mainly originated from the Sahara.
Aircraft observations show distinctive aerosol-vertical-distribution scenarios when long-range transport of aerosols is noticeable. In some cases, there is a sharp decrease in aerosol concentration in the free troposphere downwards to the cloud top, with a minimal value right above the cloud top, indicating a possible disconnect between aerosol in the clouds and the plume high above. In some other cases, a moderate decrease above the cloud occurs, and the aerosol concentration near the cloud top is higher than that below the cloud bottom, implying the possible downward-propagating influence on the aerosol budget near the cloud top. During the summer IOP, about 62.5 % of cases share such a feature of the influence of long-range transport when shallow clouds coexist. Note that in situ observations only show instantaneous conditions of aerosols in the free troposphere and MBL, and they are subject to the influence from earlier aerosol entrainment or horizontal transport with the MBL flow. This is intrinsic uncertainty associated with aircraft observations.
To identify the requirement for the long-range-transported aerosols to exert significant impacts on the MBL clouds beneath, a series of cloud-resolving WRF simulations are conducted for the selected cases. The model with dynamical downscaling from 19 km horizontal resolution down to 300 m grid spacing is found to be reliable in simulating the vertical variability of temperature and humidity fields over the Azores islands as well as in capturing the basic cloud structure. By imposing aerosol plumes at the observed heights and varying them in the sensitivity runs, the simulation results suggest that the aerosol plume cannot affect underlying MBL cloud properties when the bottom of the plume is over 100 m higher than the cloud top. Even when aerosols reside right on top of the stratified MBL cloud deck, the deepening of the cloud and destabilization of the boundary layer are required to have significant aerosol–cloud interactions. We find more marine-cloud fractions with larger water content by the aerosols from long-range transport when the aerosol layer is emerged into the cloud deck. For the case with noticeable long-range-transport aerosol effects on MBL clouds, the susceptibilities of droplet effective radius and liquid water content are −0.11 and +0.14, respectively. Additional model sensitivity experiments are conducted, which scale the whole-column aerosol concentration but keep the same bottom-heavy profile shape by assuming that aerosols originate from the MBL. The results show much larger susceptibility of cloud effective radius and liquid water path with a similar aerosol perturbation in PBL, indicating that the long-range-transported aerosols are less efficient in altering MBL cloud properties than those originating from local sources.
Through the comparisons of above- and below-cloud aerosol concentrations and the examination of aerosol plume and cloud top height variations, we find an occurrence frequency of the interaction between remote aerosols and local MBL clouds of about 63 % based on the eight flights during the summer phase of the ACE-ENA field campaign. Such a high frequency indicates the importance of long-range-transport aerosols for MBL clouds. Note that, due to the limited sample size, the frequency may not be accurate to represent the true value on a daily basis. To our knowledge, our study represents the first effort to utilize the ACE-ENA aircraft campaign data to study the impacts of long-range-transported aerosols on MBL clouds. Future studies will focus on the comparison of AIEs involving long-range-transport aerosols between different ARM sites and field campaigns.
The code of the WRF model used in this study is available at https://www2.mmm.ucar.edu/wrf/users/downloads.html (National Center for Atmospheric Research, 2020). It was developed and is maintained at the National Center for Atmospheric Research.
All the WRF model simulation output used for this research can be downloaded from the corresponding author's website at http://web.gps.caltech.edu/~yzw/share/Wang-2020-ACP-Azores (Wang, 2020). The aircraft and ground-based measurements used in this study were obtained from the Atmospheric Radiation Measurement (ARM) program sponsored by the US Department of Energy (DOE) Office of Energy Research, Office of Health and Environmental Research, and Environmental Sciences Division. The data can be downloaded from https://adc.arm.gov/discovery/#/results/site_code::ena (Atmospheric Radiation Measurement Data Center, 2020). The CAMS global aerosol reanalysis product at pressure level used in this study can be downloaded at https://apps.ecmwf.int/datasets/data/cams-nrealtime/levtype=pl/ (European Centre for Medium-Range Weather Forecasts, 2020). ERA5 data are available for download via the data archive at the National Center for Atmospheric Research, Computational and Information Systems Laboratory (https://doi.org/10.5065/D6X34W69) (European Centre for Medium-Range Weather Forecasts, 2017).
YW conceived and designed the research. YW performed the WRF simulations. YW and XZ performed the data analyses and produced the figures. YW wrote the paper. All authors contributed to the scientific discussions and preparation of the manuscript.
The authors declare that they have no conflict of interest.
This article is part of the special issue “Marine aerosols, trace gases, and clouds over the North Atlantic (ACP/AMT inter-journal SI)”. It is not associated with a conference.
This study was primarily supported by the collaborative NSF grant (award nos. AGS-1700727, 1700728). We acknowledge helpful discussions on the model setup with Zheng Lu at Texas A&M University. We thank the instrument mentors of the AMS, SP2, and CPC instruments and the individuals collecting measurements during the ACE-ENA field campaign. We also acknowledge high-performance computing support from Pleiades provided at NASA Ames. All requests for materials in this paper should be addressed to Yuan Wang (yuan.wang@caltech.edu).
This research has been supported by the National Science Foundation, Directorate for Geosciences (grant nos. AGS-1700727, AGS-1700728, and AGS-1700796).
This paper was edited by Hailong Wang and reviewed by Michael Diamond and one anonymous referee.
Atmospheric Radiation Measurement Data Center: Aircraft and ground observation, available at: https://adc.arm.gov/discovery/#/results/site_code::ena (last access: 17 July 2019), ARM, 2020.
Carslaw, K. S., Lee, L. A., Reddington, C. L., Pringle, K. J., Rap, A., Forster, P. M., Mann, G. W., Spracklen, D. V., Woodhouse, M. T., Regayre, L. A., and Pierce, J. R.: Large contribution ofnatural aerosols to uncertainty in indirect forcing, Nature, 503, 67–71, https://doi.org/10.1038/nature12674, 2013.
Christophe, Y., Schulz, M., Bennouna, Y., Eskes, H. J., Basart, S., Benedictow, A., Blechschmidt, A.-M., Chabrillat, S., Clark, H., Cuevas, E., Flentje, H., Hansen, K. M., Im, U., Kapsomenakis, J., Langerock, B., Petersen, K., Richter, A., Sudarchikova, N., Thouret, V., Wagner, A., Wang, Y., Warneke, T., and Zerefos, C.: Validation report of the CAMS global Reanalysis of aerosols and reactive gases, years 2003–2018, Copernicus Atmosphere Monitoring Service (CAMS) report, CAMS84_2018SC1_D5.1.1-2018_v1.pdf, https://doi.org/10.24380/dqws-kg08, 2019.
Clarke, A. D., Freitag, S., Simpson, R. M. C., Hudson, J. G., Howell, S. G., Brekhovskikh, V. L., Campos, T., Kapustin, V. N., and Zhou, J.: Free troposphere as a major source of CCN for the equatorial pacific boundary layer: long-range transport and teleconnections, Atmos. Chem. Phys., 13, 7511–7529, https://doi.org/10.5194/acp-13-7511-2013, 2013.
Diamond, M. S., Dobracki, A., Freitag, S., Small Griswold, J. D., Heikkila, A., Howell, S. G., Kacarab, M. E., Podolske, J. R., Saide, P. E., and Wood, R.: Time-dependent entrainment of smoke presents an observational challenge for assessing aerosol–cloud interactions over the southeast Atlantic Ocean, Atmos. Chem. Phys., 18, 14623–14636, https://doi.org/10.5194/acp-18-14623-2018, 2018.
Dong, X., Ackerman, T. P., Clothiaux, E. E., Pilewskie, P., and Han, Y.: Microphysical and radiative properties of boundary layer stratiform clouds deduced from ground-based measurements, J. Geophys. Res.-Atmos., 102, 23829–23843, https://doi.org/10.1029/97jd02119, 1997.
Dong, X., Ackerman, T. P., and Clothiaux, E. E.: Parameterizations of the microphysical and shortwave radiative properties of boundary layer stratus from ground-based measurements, J. Geophys. Res.-Atmos., 103, 31681–31693, https://doi.org/10.1029/1998JD200047, 1998.
Dong, X., Schwantes, A. C., Xi, B., and Wu, P.: Investigation of the marine boundary layer cloud and CCN properties under coupled and decoupled conditions over the azores, J. Geophys. Res., 120, 6179–6191, https://doi.org/10.1002/2014JD022939, 2015.
European Centre for Medium-Range Weather Forecasts: ERA5 Reanalysis, Research Data Archive at the National Center for Atmospheric Research, Computational and Information Systems Laboratory, https://doi.org/10.5065/D6X34W69 (last access: 1 June 2019), 2017.
European Centre for Medium-Range Weather Forecasts: CAMS Near-real-time, available at: https://apps.ecmwf.int/datasets/data/cams-nrealtime/levtype=pl/ (last access: 1 June 2019), 2020.
Fan, J., Leung, L. R., Li, Z., Morrison, H., Chen, H., Zhou, Y., Qian, Y., and Wang, Y.: Aerosol impacts on clouds and precipitation in eastern China: Results from bin and bulk microphysics, J. Geophys. Res.-Atmos., 117, D00K36, https://doi.org/10.1029/2011JD016537, 2012.
Fan, J., Wang, Y., Rosenfeld, D., and Liu, X.: Review of aerosol-cloud interactions: Mechanisms, significance, and challenges, J. Atmos. Sci., 73, 4221–4252, https://doi.org/10.1175/JAS-D-16-0037.1, 2016.
Flemming, J., Benedetti, A., Inness, A., Engelen, R. J., Jones, L., Huijnen, V., Remy, S., Parrington, M., Suttie, M., Bozzo, A., Peuch, V.-H., Akritidis, D., and Katragkou, E.: The CAMS interim Reanalysis of Carbon Monoxide, Ozone and Aerosol for 2003–2015, Atmos. Chem. Phys., 17, 1945–1983, https://doi.org/10.5194/acp-17-1945-2017, 2017.
Frisch, A. S., Feingold, G., Fairall, C. W., Uttal, T., and Snider, J. B.: On cloud radar and microwave radiometer measurements of stratus cloud liquid water profiles, J. Geophys. Res.-Atmos., 103, 23195–23197, https://doi.org/10.1029/98JD01827, 1998.
Garrett, T. J. and Hobbs, P. V.: Long-range transport of continental aerosols over the Atlantic Ocean and their effects on cloud structures, J. Atmos. Sci., 52, 2977–2984, https://doi.org/10.1175/1520-0469(1995)052<2977:LRTOCA>2.0.CO;2, 1995.
Glienke, S. and Mei, F.: Two-Dimensional Stereo (2D-S) Probe Instrument Handbook, DOE ARM Climate Research Facility, DOE/SC-ARM-TR-233, available at: https://www.arm.gov/publications/tech_reports/handbooks/doe-sc-arm-tr-233.pdf, last access: 5 June 2019.
Glienke, S. and Mei, F.: Fast Cloud Droplet Probe (FCDP) Instrument Handbook, DOE ARM Climate Research Facility, DOE/SC-ARM-TR-238, available at: https://www.arm.gov/publications/tech_reports/handbooks/doe-sc-arm-tr-238.pdf, last access: 15 June 2020.
Hossein Mardi, A., Dadashazar, H., MacDonald, A. B., Crosbie, E., Coggon, M. M., Azadi Aghdam, M., Woods, R. K., Jonsson, H. H., Flagan, R. C., Seinfeld, J. H. and Sorooshian, A.: Effects of Biomass Burning on Stratocumulus Droplet Characteristics, Drizzle Rate, and Composition, J. Geophys. Res.-Atmos., 124, 12301–12318, https://doi.org/10.1029/2019JD031159, 2019.
Jiang, J. H., Su, H., Huang, L., Wang, Y., Massie, S., Zhao, B., Omar, A., and Wang, Z.: Contrasting effects on deep convective clouds by different types of aerosols, Nat. Commun., 9, 3874, https://doi.org/10.1038/s41467-018-06280-4, 2018.
Kristensen, T. B., Müller, T., Kandler, K., Benker, N., Hartmann, M., Prospero, J. M., Wiedensohler, A., and Stratmann, F.: Properties of cloud condensation nuclei (CCN) in the trade wind marine boundary layer of the western North Atlantic, Atmos. Chem. Phys., 16, 2675–2688, https://doi.org/10.5194/acp-16-2675-2016, 2016.
Lin, Y., Wang, Y., Pan, B., Hu, J., Liu, Y., and Zhang, R.: Distinct impacts of aerosols on an evolving continental cloud complex during the RACORO field campaign, J. Atmos. Sci., 73, 3681–3700, https://doi.org/10.1175/JAS-D-15-0361.1, 2016.
Liu, Y. G. and Daum, P. H.: Anthropogenic aerosols: Indirect warming effect from dispersion forcing, Nature, 419, 580–581, https://doi.org/10.1038/419580a, 2002.
Logan, T., Xi, B., and Dong, X.: Aerosol properties and their influences on marine boundary layer cloud condensation nuclei at the ARM mobile facility over the Azores, J. Geophys. Res., 119, 4859–4872, https://doi.org/10.1002/2013JD021288, 2014.
Lu, Z., Liu, X., Zhang, Z., Zhao, C., Meyer, K., Rajapakshe, C., Wu, C., Yang, Z., and Penner, J. E.: Biomass smoke from southern Africa can significantly enhance the brightness of stratocumulus over the southeastern Atlantic Ocean, P. Natl. Acad. Sci. USA, 115, 2924–2929, https://doi.org/10.1073/pnas.1713703115, 2018.
Malavelle, F. F., Haywood, J. M., Jones, A., Gettelman, A., Clarisse, L., Bauduin, S., Allan, R. P., Karset, I. H. H., Kristjánsson, J. E., Oreopoulos, L., Cho, N., Lee, D., Bellouin, N., Boucher, O., Grosvenor, D. P., Carslaw, K. S., Dhomse, S., Mann, G. W., Schmidt, A., Coe, H., Hartley, M. E., Dalvi, M., Hill, A. A., Johnson, B. T., Johnson, C. E., Knight, J. R., O'Connor, F. M., Stier, P., Myhre, G., Platnick, S., Stephens, G. L., Takahashi, H., and Thordarson, T.: Strong constraints on aerosol-cloud interactions from volcanic eruptions, Nature, 546, 485–491, https://doi.org/10.1038/nature22974, 2017.
National Center for Atmospheric Research: WRF model, available at: https://www2.mmm.ucar.edu/wrf/users/downloads.html (last access: 20 January 2018), 2020.
O'Connor, E. J., Hogan, R. J., and Illingworth, A. J.: Retrieving stratocumulus drizzle parameters using doppler radar and lidar, J. Appl. Meteorol., 44, 14–27, https://doi.org/10.1175/JAM-2181.1, 2005.
Painemal, D., Kato, S., and Minnis, P.: Boundary layer regulation in the southeast Atlantic cloud microphysics during the biomass burning season as seen by the A-train satellite constellation, J. Geophys. Res., 119, 11288–11302, https://doi.org/10.1002/2014JD022182, 2014.
Rajapakshe, C., Zhang, Z., Yorks, J. E., Yu, H., Tan, Q., Meyer, K., Platnick, S. and Winker, D. M.: Seasonally transported aerosol layers over southeast Atlantic are closer to underlying clouds than previously reported, Geophys. Res. Lett., 44, 5818–5825, https://doi.org/10.1002/2017GL073559, 2017.
Roberts, G., Mauger, G., Hadley, O., and Ramanathan, V.: North American and Asian aerosols over the eastern Pacific Ocean and their role in regulating cloud condensation nuclei, J. Geophys. Res.-Atmos., 111, D13205, https://doi.org/10.1029/2005JD006661, 2006.
Rose, D., Gunthe, S. S., Mikhailov, E., Frank, G. P., Dusek, U., Andreae, M. O., and Pöschl, U.: Calibration and measurement uncertainties of a continuous-flow cloud condensation nuclei counter (DMT-CCNC): CCN activation of ammonium sulfate and sodium chloride aerosol particles in theory and experiment, Atmos. Chem. Phys., 8, 1153–1179, https://doi.org/10.5194/acp-8-1153-2008, 2008.
Rosenfeld, D., Zhu, Y., Wang, M., Zheng, Y., Goren, T., and Yu, S.: Aerosol-driven droplet concentrations dominate coverage and water of oceanic low-level clouds, Science, 363, eaav0566, https://doi.org/10.1126/science.aav0566, 2019.
Sato, Y. and Suzuki, K.: How do aerosols affect cloudiness?, Science, 363, 580–581, https://doi.org/10.1126/science.aaw3720, 2019.
Seinfeld, J. H., Bretherton, C., Carslaw, K. S., Coe, H., DeMott, P. J., Dunlea, E. J., Feingold, G., Ghan, S., Guenther, A. B., Kahn, R., Kraucunas, I., Kreidenweis, S. M., Molina, M. J., Nenes, A., Penner, J. E., Prather, K. A., Ramanathan, V., Ramaswamy, V., Rasch, P. J., Ravishankara, A. R., Rosenfeld, D., Stephens, G., and Wood, R.: Improving our fundamental understanding of the role of aerosol-cloud interactions in the climate system, P. Natl. Acad. Sci. USA, 113, 5781–5790, https://doi.org/10.1073/pnas.1514043113, 2016.
Stein, A. F., Draxler, R. R., Rolph, G. D., Stunder, B. J. B., Cohen, M. D., and Ngan, F.: Noaa's hysplit atmospheric transport and dispersion modeling system, B. Am. Meteorol. Soc., 96, 2059–2077, https://doi.org/10.1175/BAMS-D-14-00110.1, 2015.
Toll, V., Christensen, M., Quaas, J., and Bellouin, N.: Weak average liquid-cloud-water response to anthropogenic aerosols, Nature, 572, 51–55, https://doi.org/10.1038/s41586-019-1423-9, 2019.
Twomey, S.: The Influence of Pollution on the Shortwave Albedo of Clouds, J. Atmos. Sci., 34, 1149–1152, https://doi.org/10.1175/1520-0469(1977)034<1149:TIOPOT>2.0.CO;2, 1977.
Ulbrich, C. W.: Natural variations in the analytical form of the raindrop size distribution, J. Clim. Appl. Meteorol., 22, 1764–1775, https://doi.org/10.1175/1520-0450(1983)022<1764:NVITAF>2.0.CO;2, 1983.
Wang, H. and Feingold, G.: Modeling mesoscale cellular structures and drizzle in marine stratocumulus. Part I: Impact of drizzle on the formation and evolution of open cells, J. Atmos. Sci., 66, 3237–3256, https://doi.org/10.1175/2009JAS3022.1, 2009.
Wang, H., Rasch, P. J., Easter, R. C., Singh, B., Zhang, R., Ma, P.-L., Qian, Y., Ghan, S. J., and Beagley, N.: Using an explicit emission tagging method in global modeling of source-receptor relationships for black carbon in the Arctic: Variations, sources, and transport pathways, J. Geophys. Res., 119, 12888–12909, 2014.
Wang, J., Wood, R., Jensen, M., Azevedo, E., Bretherton, C., Chand, D., Chiu, C., Dong, X., Fast, J., Gettelman, A., Ghan, S., Giangrande, S., Gilles, M., Jefferson, A., Kollias, P., Kuang, C., Laskin, A., Lewis, E., Liu, X., Liu, Y., Luke, E., McComiskey, A., Mei, F., Miller, M., Sedlacek, A., and Shaw, R.: Aerosol and Cloud Experiments in Eastern North Atlantic (ACE-ENA) Field Campaign Report, DOE ARM Climate Research Facility, DOE/SC-ARM-19-012, available at: https://www.arm.gov/publications/programdocs/doe-sc-arm-19-012.pdf (last access: 1 January 2020), 2019.
Wang, Y.: WRF model output, available at: http://web.gps.caltech.edu/~yzw/share/Wang-2020-ACP-Azores, last access: 1 January 2020.
Wang, Y., Fan, J., Zhang, R., Leung, L. R., and Franklin, C.: Improving bulk microphysics parameterizations in simulations of aerosol effects, J. Geophys. Res.-Atmos., 118, 5361–5379, https://doi.org/10.1002/jgrd.50432, 2013.
Wang, Y., Wang, M., Zhang, R., Ghan, S. J., Lin, Y., Hu, J., Pan, B., Levy, M., Jiang, J. H., and Molina, M. J.: Assessing the effects of anthropogenic aerosols on Pacific storm track using a multiscale global climate model, P. Natl. Acad. Sci. USA, 111, 6894–6899, https://doi.org/10.1073/pnas.1403364111, 2014.
Wang, Y., Vogel, J. M., Lin, Y., Pan, B., Hu, J., Liu, Y., Dong, X., Jiang, J. H., Yung, Y. L., and Zhang, R.: Aerosol microphysical and radiative effects on continental cloud ensembles, Adv. Atmos. Sci., 35, 234–247, https://doi.org/10.1007/s00376-017-7091-5, 2018.
Weinzierl, B., Ansmann, A., Prospero, J. M., Althausen, D., Benker, N., Chouza, F., Dollner, M., Farrell, D., Fomba, W. K., Freudenthaler, V., Gasteiger, J., Groß, S., Haarig, M., Heinold, B., Kandler, K., Kristensen, T. B., Mayol-Bracero, O. L., Müller, T., Reitebuch, O., Sauer, D., Schäfler, A., Schepanski, K., Spanu, A., Tegen, I., Toledano, C., and Walser, A.: The Saharan aerosol long-range transport and aerosol-cloud-interaction experiment: Overview and selected highlights, B. Am. Meteorol. Soc., 98, 1427–1451, https://doi.org/10.1175/BAMS-D-15-00142.1, 2017.
Wood, R., Wyant, M., Bretherton, C. S., Rémillard, J., Kollias, P., Fletcher, J., Stemmler, J., De Szoeke, S., Yuter, S., Miller, M., Mechem, D., Tselioudis, G., Chiu, J. C., Mann, J. A. L., O'Connor, E. J., Hogan, R. J., Dong, X., Miller, M., Ghate, V., Jefferson, A., Min, Q., Minnis, P., Palikonda, R., Albrecht, B., Luke, E., Hannay, C., and Lin, Y.: Clouds, aerosols, and precipitation in the marine boundary layer: An arm mobile facility deployment, B. Am. Meteorol. Soc., 96, 419–440, https://doi.org/10.1175/BAMS-D-13-00180.1, 2015.
Wu, P., Dong, X., Xi, B., Tian, J., and Ward, D. M.: Profiles of MBL cloud and drizzle microphysical properties retrieved from ground-based observations and validated by aircraft in-situ measurements over the Azores, J. Geophys. Res.-Atmos., 125, e2019JD032205, https://doi.org/10.1029/2019jd032205, 2020.
Yamaguchi, T., Feingold, G., and Kazil, J.: Aerosol-Cloud Interactions in Trade Wind Cumulus Clouds and the Role of Vertical Wind Shear, J. Geophys. Res.-Atmos., 124, 12244–12261, https://doi.org/10.1029/2019JD031073, 2019.
Zhao, B., Wang, Y., Gu, Y., Liou, K. N., Jiang, J. H., Fan, J., Liu, X., Huang, L., and Yung, Y. L.: Ice nucleation by aerosols from anthropogenic pollution, Nat. Geosci., 12, 602–607, https://doi.org/10.1038/s41561-019-0389-4, 2019.
Zheng, X., Xi, B., Dong, X., Logan, T., Wang, Y., and Wu, P.: Investigation of aerosol–cloud interactions under different absorptive aerosol regimes using Atmospheric Radiation Measurement (ARM) southern Great Plains (SGP) ground-based measurements, Atmos. Chem. Phys., 20, 3483–3501, https://doi.org/10.5194/acp-20-3483-2020, 2020.
- Abstract
- Motivation and background
- Methodology
- Observational data analysis
- WRF modeling of MBL clouds and their response to transported aerosols
- Conclusion and discussion
- Code availability
- Data availability
- Author contributions
- Competing interests
- Special issue statement
- Acknowledgements
- Financial support
- Review statement
- References