the Creative Commons Attribution 4.0 License.
the Creative Commons Attribution 4.0 License.
 | 30 Nov 2020
Measurement report: Aircraft observations of ozone, nitrogen oxides, and volatile organic compounds over Hebei Province, China
Xinrong Ren
Sandra J. Roberts
Ross J. Salawitch
Zhanqing Li
Fei Wang
Yuying Wang
Fang Zhang
Min Shao
Sihua Lu
Russell R. Dickerson
To provide insight into the planetary boundary layer (PBL) production of ozone (O3) over the North China Plain, the Air chemistry Research in Asia (ARIAs) campaign conducted aircraft measurements of air pollutants over Hebei Province, China, between May and June 2016. We evaluate vertical profiles of trace gas species including O3, nitrogen oxides (NOx), carbon monoxide (CO), and volatile organic compounds (VOCs) and relate to rates of O3 production. This analysis shows measured O3 levels ranged from 45 to 146 ppbv, with the peak median concentration (∼ 92 ppbv) occurring between 1000 and 1500 m. The NOx concentrations exhibited strong spatial and altitudinal variations, with a maximum of 53 ppbv. Ratios of CO∕CO2 indicate the prevalence of low-efficiency combustion from biomass burning and residential coal burning but indicate some success of regional pollution controls compared to earlier studies in China. Concentrations of total measured VOCs reveal alkanes dominate the total measured volume mixing ratio of VOCs (68 %), and sources include vehicular emissions, fuel and solvent evaporation, and biomass burning. Alkanes and alkenes/alkynes are responsible for 74 % of the total VOC reactivity assessed by calculating the OH loss rates, while aromatics contribute the most to the total ozone formation potential (OFP) (43 %) with toluene, m/p-xylene, ethylene, propylene, and i-pentane playing significant roles in the aloft production of O3 in this region. In the PBL below 500 m, box model calculations constrained by measured precursors indicate the peak rate of mean O3 production was ∼ 7 ppbv h−1. Pollution frequently extended above the PBL into the lower free troposphere around 3000 m, where NO2 mixing ratios (∼ 400 pptv) led to net production rates of O3 up to ∼ 3 ppbv h−1; this pollution can travel substantial distances downwind. The O3 sensitivity regime is determined to be NOx-limited throughout the PBL, whereas it is more VOC-limited at low altitudes near urban centers, demonstrating that control of both VOCs and NOx is needed to reduce aloft O3 pollution over Hebei.
- Article
(8483 KB) - Full-text XML
-
Supplement
(1355 KB) - BibTeX
- EndNote


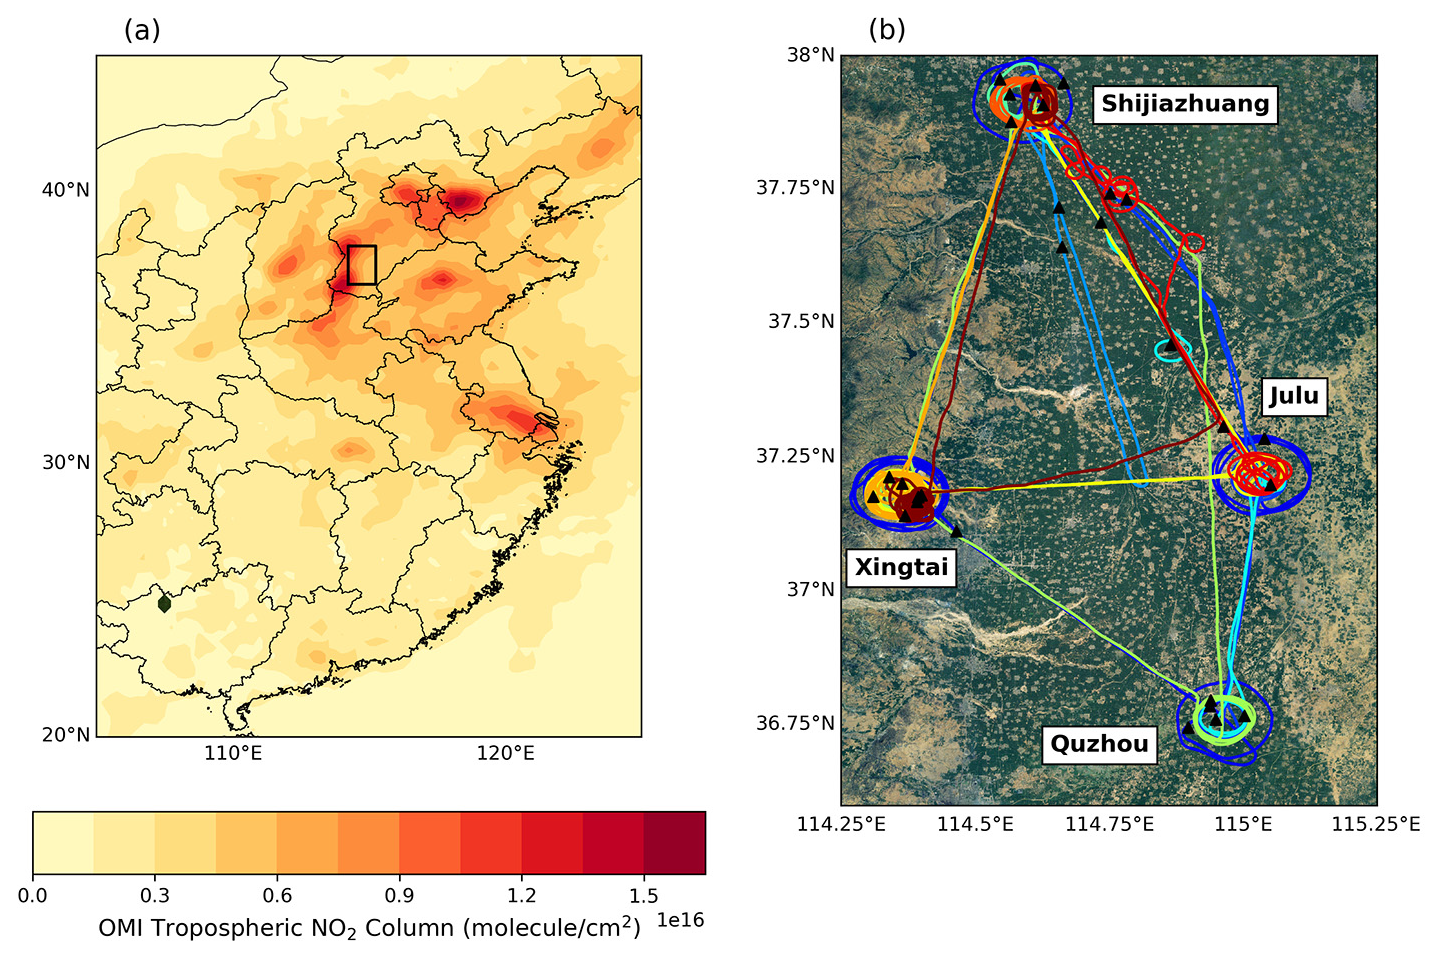
Figure 1(a) May and June 2016 OMI tropospheric column NO2 from the NASA Goddard Earth Sciences Data and Information Services Center. The North China Plain is clearly seen in the center with high column NO2 concentrations; the black rectangle indicates the ARIAs campaign domain and corresponds to the region shown in panel (b). (b) Map of 11 ARIAs flight tracks (colored by flight number) and location of VOC samples (black triangles). The background map is provided by Esri © 2009.
Explosive urbanization and rapid industrialization contributed to high ground-level ozone (O3) and particulate matter (PM) over the past several decades in the North China Plain (NCP) (Johnson et al., 2006; Ran et al., 2011; Shao et al., 2009; Zhang et al., 2014). Household burning of coal used for cooking and heating; emissions from gasoline, diesel, and liquified petroleum gas (LPG) vehicles; and large-scale burning of winter wheat residues in the NCP are some of the many sources responsible for O3 precursors, such as nitrogen oxides (NOx = NO + NO2) and volatile organic compounds (VOCs) (Chen et al., 2017; Long et al., 2016; Stavrakou et al., 2016). Ozone is harmful to both the human respiratory system (Bell et al., 2006; Jerrett et al., 2009) and to photosynthetic processes by vegetation (Avnery et al., 2011; Reich and Amundson, 1985), while some VOCs, such as benzene and chloroform, are known to be hemotoxic and carcinogenic (Environmental Protection Agency – Integrated Risk Information System, 2003; Lan et al., 2004). Several studies using the NASA Ozone Monitoring Instrument (OMI) have found reductions of some pollutants like sulfur dioxide (SO2) over the NCP (He et al., 2012; Krotkov et al., 2016; Li et al., 2010, 2017), but NO2 pollution still remains severe in China (Fig. 1a).
Ozone is created through the oxidation of NO by hydroperoxyl radicals (HO2) and organic peroxy radicals (RO2), products of carbon monoxide (CO) and VOC oxidation. When one of these precursors is the limiting reactant, the rate of O3 production is considered VOC- or NOx-sensitive (Finlayson-Pitts and Pitts, 1999; Sillman et al., 1990). The role of VOCs on the formation of O3 depends on the characteristics of the environment, including the main emission sources of primary pollutants and ambient temperature (Pusede et al., 2014), and the interaction of aerosols within the planetary boundary layer (PBL) to reduce photolysis (An et al., 2019). High aerosol concentrations have been shown to decrease photolysis and hinder summer surface O3 formation by 25 ppbv on average in Xi'an, China (Feng et al., 2016), which poses a challenge for pollution control strategies.
Natural emissions are the largest source of VOCs globally and react more efficiently with OH than most anthropogenic compounds (Di Carlo et al., 2004) but exhibit a strong seasonal, diurnal, and spatial dependence (Li et al., 2013). Biogenic VOCs have been found to play a significant role in the formation of O3 at the surface (Ma et al., 2019; Zong et al., 2018) and throughout the boundary layer in the NCP (Q. Wang et al., 2008), as well as influence production of PM2.5 (Guo et al., 2014) and secondary organic aerosols (SOAs) (K. Wu et al., 2020). In particular, isoprene has been estimated to account for 27 % of the total O3 production in June 2010 in Beijing (Mo et al., 2018), suggesting the need to consider biogenic isoprene emissions in formulating O3 control strategies. Quantifying the abundance of NOx and the suite of VOC chemicals throughout the lower troposphere is urgently needed to better understand the photochemistry of O3 production in the NCP, which in turn will lead to the development of successful mitigation strategies.
In situ airborne measurements provide valuable information regarding the horizontal and vertical distributions of air pollutants over a large spatial area. Airborne measurements are necessary to characterize air pollution over large cities, as well as surrounding areas. Ozone and PM are produced throughout the planetary boundary layer (PBL), so aircraft observations can lead to a more complete picture of pollution formation and transport than is available only from surface observations. While several airborne campaigns have deployed to investigate the regionally transported pollution problem in East Asia, including the NASA Korea-United States Air Quality Study (KORUS-AQ) (Al-Saadi et al., 2015; see https://www-air.larc.nasa.gov/missions/korus-aq/docs/White_paper_NASA_KORUS-AQ.pdf, last access: 15 October 2020), which occurred at the same time as our measurements, few airborne studies characterize the source region of severe smog within the Hebei Province region of China.
Through Chinese–American partnerships with Peking University, Beijing Normal University, and the University of Maryland, we conducted a field campaign in Hebei Province, China, called Air chemistry Research In Asia (ARIAs). The ARIAs campaign was designed to characterize and quantify the composition of trace gases and aerosol optical properties over Hebei to improve tools used to evaluate the effectiveness of air pollution reduction policies. Since air pollution transport from Asia typically peaks in early to mid-spring (Liu et al., 2003), we hoped to provide detailed altitude profiles over the Asian source region to enable Lagrangian experiments with KORUS-AQ, but only two sustained transport events occurred (Peterson et al., 2019). Despite the infrequent transboundary pollution events, ARIAs observations generated valuable characteristic pollution signatures that helped describe combustion efficiency and its impact downwind (Halliday et al., 2019) to correct model biases of CO in global chemistry–climate models (Gaubert et al., 2020) and to show that Measurement of Pollution in the Troposphere (MOPITT) bias increases at high CO concentrations (Tang et al., 2020). Furthermore, ARIAs measurements characterized aerosol optical properties in the PBL and free troposphere during clean and polluted conditions (F. Wang et al., 2018), as well as used in the validation of multiaxis differential optical absorption spectroscopy (MAX-DOAS) profiles of NO2, SO2, HONO, HCHO, CHOCHO, and aerosols (Y. Wang et al., 2019).
The Ministry of Environmental Protection of the People's Republic of China reported 6 of the top 10 cities with the worst air quality in 2016 were located in Hebei (including the capital city of Shijiazhuang). The North China Plain is one of the most polluted regions in the world, but implementation of pollution reduction measures through the Five-Year Plans has allowed for decreasing trends of many pollutants. In particular, Zhang et al. (2020) found an increased number of days of clean/light haze and a decreased number of days with heavy haze, along with a significant decline of SO2 concentrations. Similarly, using observations from MODIS and OMI, Si et al. (2019) found aerosol optical depth (AOD) and SO2 to decrease from 2006 to 2015, while NO2 rose by 4.79 % in the NCP during this period. While surface NO2 decreased 20 % from May 2014 to December 2018 throughout China, there are still a large number of measurement stations with increasing trends of NO2 due to changes in meteorological conditions and aerosol emissions (Fan et al., 2020), illustrating the need for more research characterizing air pollution in this region. In this study, we analyze concentrations of O3, NOx, NOy, CO, and VOCs obtained during 11 research flights between May and June 2016. The VOC chemical reactivity and impact on O3 production is assessed, and we utilize an observation-constrained box model to evaluate photochemical properties of the production of O3 that occurs throughout the lower free troposphere.
2.1 Air sampling and analysis
The ARIAs campaign included 11 research flights from May to June 2016 in Hebei Province (Fig. 1b). Flight days were chosen based on meteorological conditions associated with smog events, such as higher temperatures, little cloud cover, low relative humidity, weak winds, and shallow PBL height (Tang et al., 2012). The Y-12 aircraft was based at Luancheng Airport (37.91∘ N, 114.59∘ E; 58 ), located in southeast Shijiazhuang (population around 10 million), a major economic center in Hebei, including pharmaceutical and textile industries, machinery and chemical manufacturing, construction, and electronics production. Flight sampling occurred east of the Taihang Mountains, and the Y-12 flew vertical spirals from ∼ 300 to ∼ 3500 m over Shijiazhuang as well as three other locations: Julu (37.22∘ N, 115.02∘ E; 30 ), Quzhou (36.76∘ N, 114.96∘ E; 40 ), and Xingtai (37.18∘ N, 114.36∘ E; 182 ) (see Table S1 in the Supplement for a description of flight paths, weather conditions, and statistics of measured trace gases).
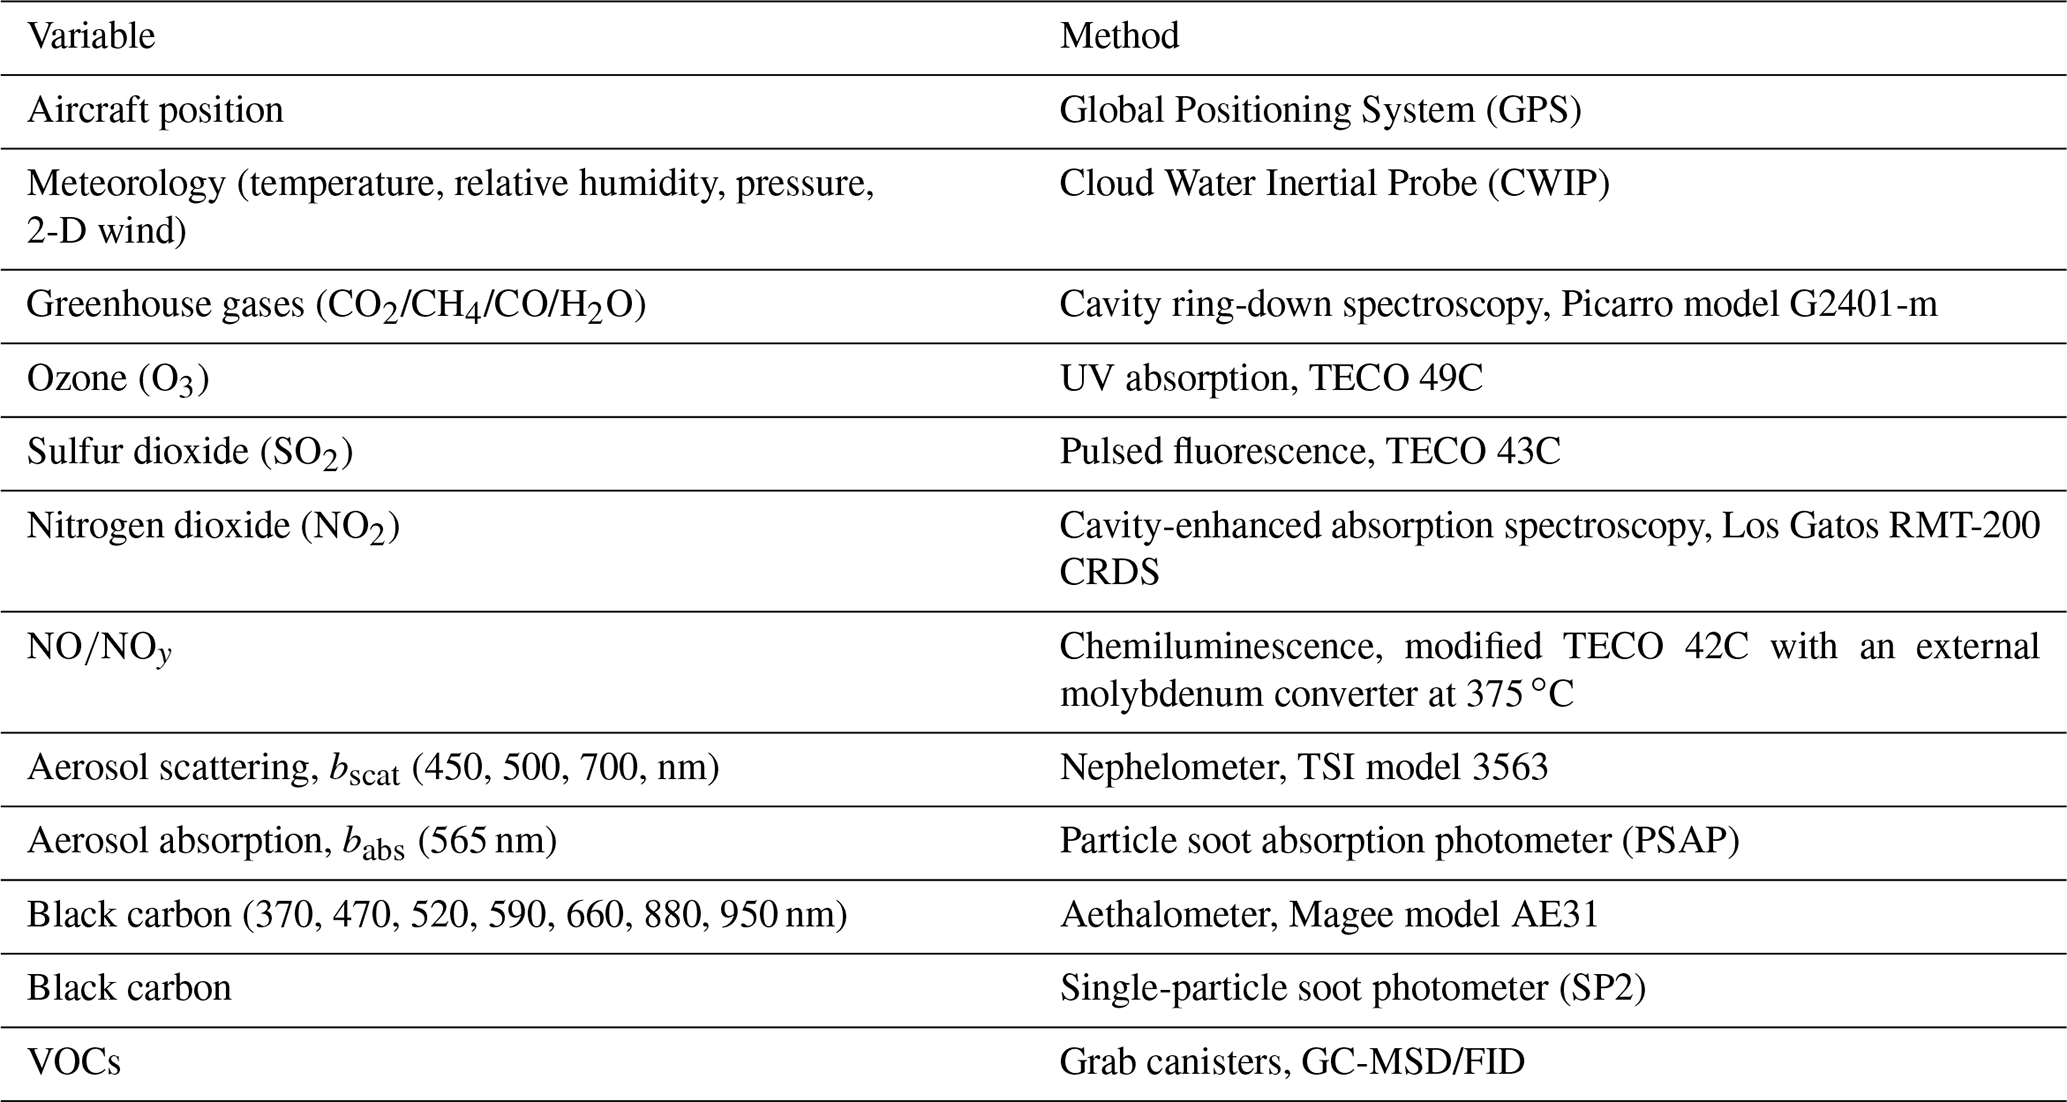
Various instruments aboard the Y-12 aircraft collected trace gas, aerosol, and meteorological data. The aircraft instrumentation (Table 1) included different gas and particle sample inlets on the top of the fuselage and pressure–temperature–humidity sensors (Cloud Water Inertial Probe (CWIP), Rain Dynamics) installed under one wing of the aircraft (Fig. S1 in the Supplement). Flight position data were recorded using a portable global positioning system (GPS) and the CWIP. The aircraft was equipped with the following trace gas analyzers: (1) a Picarro cavity ring-down spectrometer (CRDS) for measurements of CH4, CO2, CO, and H2O; (2) a Thermal Electron Corporation (TECO) Model 49C UV absorption O3 analyzer; (3) a TECO Model 43C pulsed fluorescence SO2 analyzer; (4) a Los Gatos Research model RMT-200 CRDS NO2 analyzer; and (5) a TECO Model 42C NO-NOy analyzer. Power constraints and a converter issue led to limited NOy, NOx, and CO measurements during the campaign, particularly in the lower free troposphere (LFT). We remove observations of NO∕NOy over three spiral locations due to limited measurements. Negative values indicate readings around the detection limit, usually at high altitudes. The aircraft was also equipped with an inlet to measure aerosols up to ∼ 5.0 µm diameter and aerosol optical properties, including a nephelometer (TSI model 3563) to measure aerosol scattering, a particle soot absorption photometer (PSAP) to measure aerosol absorption, and an Aethalometer (Magee model AE31) and a single-particle soot photometer (SP2, Droplet Measurement Technologies) to measure black carbon. Observed aerosol optical properties have been summarized by F. Wang et al. (2018); further details on aircraft instrumentation are given by Ren et al. (2018).
Twenty-six whole air samples (WASs) were collected directly into 3.2 L fused-silica-lined electropolished stainless-steel canisters (Entech Instruments Inc., Simi Valley, CA) at a variety of pressure altitudes from 400 to 3500 m between 01:30 and 09:00 UTC (09:30 and 17:00 LT). The sampling period for the WAS canisters was approximately 1–2 min during the spirals. Samples were analyzed for 54 VOCs and 16 halocarbons. Since the halogenated species have negligible effects on O3 production, we exclude these species from the analysis presented here. We also exclude two WAS canisters from this analysis due to evidence of contamination after collection (Text S1 in the Supplement). Limited samples collected over one province in one season may not be able to represent O3 chemistry for all of China, but the scarcity of airborne VOC measurements in this region makes these data valuable for characterizing the composition of air throughout and above the PBL, demonstrating how the production of O3 aloft differs from that at the surface.
The VOC analytical techniques used by the College of Environmental Sciences and Engineering at Peking University (PKU) in Beijing have been summarized in the past (Mo et al., 2015; B. Wang et al., 2010), and we briefly describe the method here. The WAS canisters were cleaned following a standard sampling procedure, pressured with nitrogen, and vacuumed three times to 2.6 Pa. The hydrocarbons were quantified using a gas chromatograph equipped with a mass selective detector (GC-MSD, Hewlett Packard 5975/7890, USA) and a flame ionization detector (FID) coupled with a cryofocusing preconcentration system (Entech Instrument 7100A, Simi Valley, CA). This system used a Deans Switch (Agilent Technologies, Santa Clara, CA, USA) to introduce the effluent into a DB-624 column (60 m × 0.25 mm × 1.8 µm; J&W Scientific, Folsom, CA, USA) with an MSD to separate and analyze C4–C12 hydrocarbons and halocarbons. A PLOT (Al/KCl) column (30 m × 0.25 mm × 3.0 µm; J&W Scientific) with an FID was used to measure the C2–C4 hydrocarbons.
The Photochemical Assessment Monitoring Stations (PAMS) (55 nonmethane hydrocarbons, NMHCs) and Toxic Organic-15 (TO-15) standard mixtures were used to calibrate the GC-MSD/FID system that measured the C2–C12 VOCs. Samples with known concentrations of four VOCs (bromochloromethane, 1,4-difluorobenzene, chlorobenzene-d5, and 1-bromo-3-fluorobenzene) were used as internal standards for each sample to calibrate the system. The GC-MSD/FID system was calibrated at five concentrations, ranging from 0.5 to 8 ppbv, for each of these four compounds before sample analysis. Correlation coefficients, ranging from 0.987 to 0.999, showed that the integral areas of peaks were proportional to the concentrations of the target compounds. A gas standard (diluting from 1 ppmv to 2 ppbv) was measured each day to check the stability of the system. Summary statistics of the VOCs along with the method detection limit (MDL) (ranging from 0.002 to 0.027 ppbv) are reported in Table S2. Total uncertainty for VOC measurements reflects instrument noise plus uncertainty in calibration standards, contamination, and pressurization. The best estimate of the total uncertainty is ± 20 % with 95 % confidence due to uncertainties associated with airborne sampling platforms. Intercomparison experiments of VOC measurements between PKU and other laboratories showed good agreement (Liu et al., 2008b).
The Atmosphere–Aerosol–Boundary Layer–Cloud (A2BC) Interaction Joint Experiment campaign collected meteorological, aerosol, and trace gas information from a ground-based site in Xingtai (37.18∘ N, 114.36∘ E; 182 ) from May to December 2016 (Y. Wang et al., 2018, 2019). An intensive observation period in May and June 2016 was conducted to coincide with ARIAs. Data from A2BC instruments used in our analysis include (1) a NOx analyzer with a molybdenum converter (Ecotech model 9841A), (2) an infrared absorption CO analyzer (Ecotech model 9830A), and (3) a UV absorption O3 analyzer (Ecotech model 9810A). Results of NO2, SO2, HONO, HCHO, CHOCHO, and aerosols derived from the differential optical absorption spectrometer (DOAS) are summarized by Y. Wang et al. (2019). The A2BC site is located in northwest Xingtai, nestled in the east foothill of the Taihang Mountains. Agricultural crops surround the site, consisting heavily of winter wheat, that is harvested, with the stubble burned in June (Liu and Si, 2011). Xingtai is a city with approximately 7 million people and is surrounded by industry including coal mining and coal-burning power plants, cement and steel industries, chemical processing, iron smelting, and glass manufacturing.
2.2 Box model simulations
A box model called Framework for 0-D Atmospheric Modelling (F0AMv3.1) (Wolfe et al., 2016) is used to evaluate oxidation processes to understand O3 photochemical production both at the surface and aloft. The box model simulations cover the Y-12 flight tracks during seven flights and daytime hours at the A2BC supersite in Xingtai (where the Y-12 conducted spirals) using the Carbon Bond mechanism, version 6, revision 2 (CB6r2). Both the Y-12 flights and surface simulations define a physical loss lifetime of 24 h to mitigate buildup of long-lived oxidation products over multiple days of integration.
For the ARIAs flight data, the model is constrained by 1 min average observed concentrations of NO2, CO, and O3. Due to the limited number of grab canisters per flight, VOCs are constrained based on the altitude of the sampling relative to the height of the PBL, which is determined using potential temperature and water vapor vertical profiles for each flight. All WAS canister data collected below the top of the PBL during a flight are averaged. Data from all of the WAS canisters for the entire campaign collected above the research flight's PBL are averaged for that flight. Periodic missing Y-12 NO2 data due to internal auto-zeroing are linearly interpolated since gaps were short (∼ 2 min). The chemical system defined by each set of observations is integrated 5 d forward in time, in 1 h time steps with diurnal variation of solar zenith angle (SZA), in order for calculated reactive intermediates to achieve diel steady state. Reaction rate constants are calculated using aircraft measurements of pressure, temperature, and relative humidity. The SZA is determined based on the time and location of the aircraft and used to calculate photolysis rates as described below.
For the A2BC surface data, the model is constrained by 5 min average concentrations of VOCs, NO2, CO, and O3 on days in which a flight occurred. For 17 May, surface data for NO2 are filled with 1 h average data collected for other days of the month, due to missing surface measurements on this day. The average concentrations from the WAS canisters below 500 m are used as ground concentrations since A2BC did not measure VOCs at the surface. Similar to the flight data, the chemical system for the surface observations is integrated for 3 d forward in time, in 1 h time steps with time-varying SZA, to reach diel steady state. Reaction rate constants are calculated from ground measurements of pressure, temperature, and relative humidity. Time and ground elevation are used to calculate the SZA, which controls photolysis frequencies as described below.
Photolysis frequencies, not measured during ARIAs or at the A2BC supersite, evolve over the course of a model step and are calculated by combining cross sections and quantum yields with solar spectra derived from the NCAR Tropospheric Ultraviolet and Visible (TUV) version 5.2 radiation model. At the start of the model run, input solar zenith angle, altitude or elevation, O3 column, and surface albedo are used for linear interpolation across TUV lookup tables (F0AM's hybrid method). We use SZA and altitude/elevation from ARIAs/A2BC measurements as well as constant values for ozone column (325 DU) and surface albedo (0.17), which we estimate based on concurrent data from the OMI Level-3 OMDOAO3e data product (https://disc.gsfc.nasa.gov/datasets/OMDOAO3e_003/summary?keywords=OMDOAO3e_003, last access: 6 August 2020). A correction factor of 0.8, determined by trial and error, is used to scale j values to better agree with the observed NO∕NO2 ratio.
The impact of aerosols on O3 production depends on the optical properties as well as the vertical distribution (Dickerson et al., 1997; Kelley et al., 1995). In the presence of scattering and absorbing aerosols, photolysis frequencies will be altered, thus changing the O3 formation and atmospheric oxidizing capability (J. Wu et al., 2020). Previous research over China has shown that as AOD increases, the extinction effect of aerosols on photolysis frequencies decreases due to a higher proportion of scattering aerosols under high-AOD conditions (W. Wang et al., 2019). Optical depth, single scattering albedo, and Ångström exponent during ARIAs (see F. Wang et al., 2018) are used in the TUV online calculator (https://www2.acom.ucar.edu/modeling/tropospheric-ultraviolet-and-visible-tuv-radiation-model, last access: 5 August 2020) to assess the impact of aerosols on photolysis frequencies. Most of the aerosol particles during ARIAs were concentrated in the lowest 2 km of the atmosphere with a single scattering albedo at 550 nm of 0.85 and an average AOD ∼ 0.2. The impact of aerosol optical properties measured during ARIAs on photolysis frequencies is small compared to the default setting, so no additional adjustments are made to the model values.
The method described here to constrain VOCs introduces large uncertainty due to the sparsity of measurements obtained over a large area that potentially consists of a wide variety of chemical compositions. However, the production of O3 aloft is not well characterized over Hebei, so our observations may help improve the understanding of air pollution in this region, despite this limitation. Additionally, unlike a three-dimensional chemical transport model, the box model simulations do not include advection or emissions. These processes, while important, are not included in the box model since O3 precursors were measured and used to constrain the box model calculations. Box modeling is used to gain an understanding of O3 production and its sensitivity to ambient levels of NOx and VOCs based upon measured meteorological parameters and the concentration of a wide variety of chemical species.
2.2.1 Ozone production and sensitivity calculations
The photochemical production of O3 during the daytime is determined by the production rate of NO2 molecules from the HO2 + NO and RO2 + NO reactions minus the loss mechanisms (Finlayson-Pitts and Pitts, 1999). Thus, the net O3 production rate, net(PO3), can be estimated following Eq. (1):
where k denotes the different reaction rate constants and RO2i is the concentration of individual organic peroxy radicals. The terms subtracted from the production of O3 are the loss mechanisms: the formation of nitrates, P(RONO2), the reaction of OH and NO2 to form nitric acid, the reactions of OH and HO2 with O3, the reaction of O(1D) with H2O, and the reactions of O3 with alkenes. Additional terms not included here are the rate of O3 loss by dry deposition and direct loss on aerosol surfaces (dilution is the only physical loss in the current F0AM setup).
We evaluate the sensitivity of O3 production to NOx and VOCs using the ratio of LN∕Q, where LN is the radical loss through reactions with NO and Q is the primary radical production (Kleinman, 2005a). When LN∕Q is much less than 0.5, the O3 production regime is NOx-limited; when the LN∕Q ratio is much higher than 0.5, the regime is VOC-limited. Different environments can have varying amounts of organic nitrates that impact the cut-off value of LN∕Q, so this value could vary around 0.5 (Kleinman, 2005b).
3.1 Observations of nitrogen oxides, carbon monoxide, and ozone
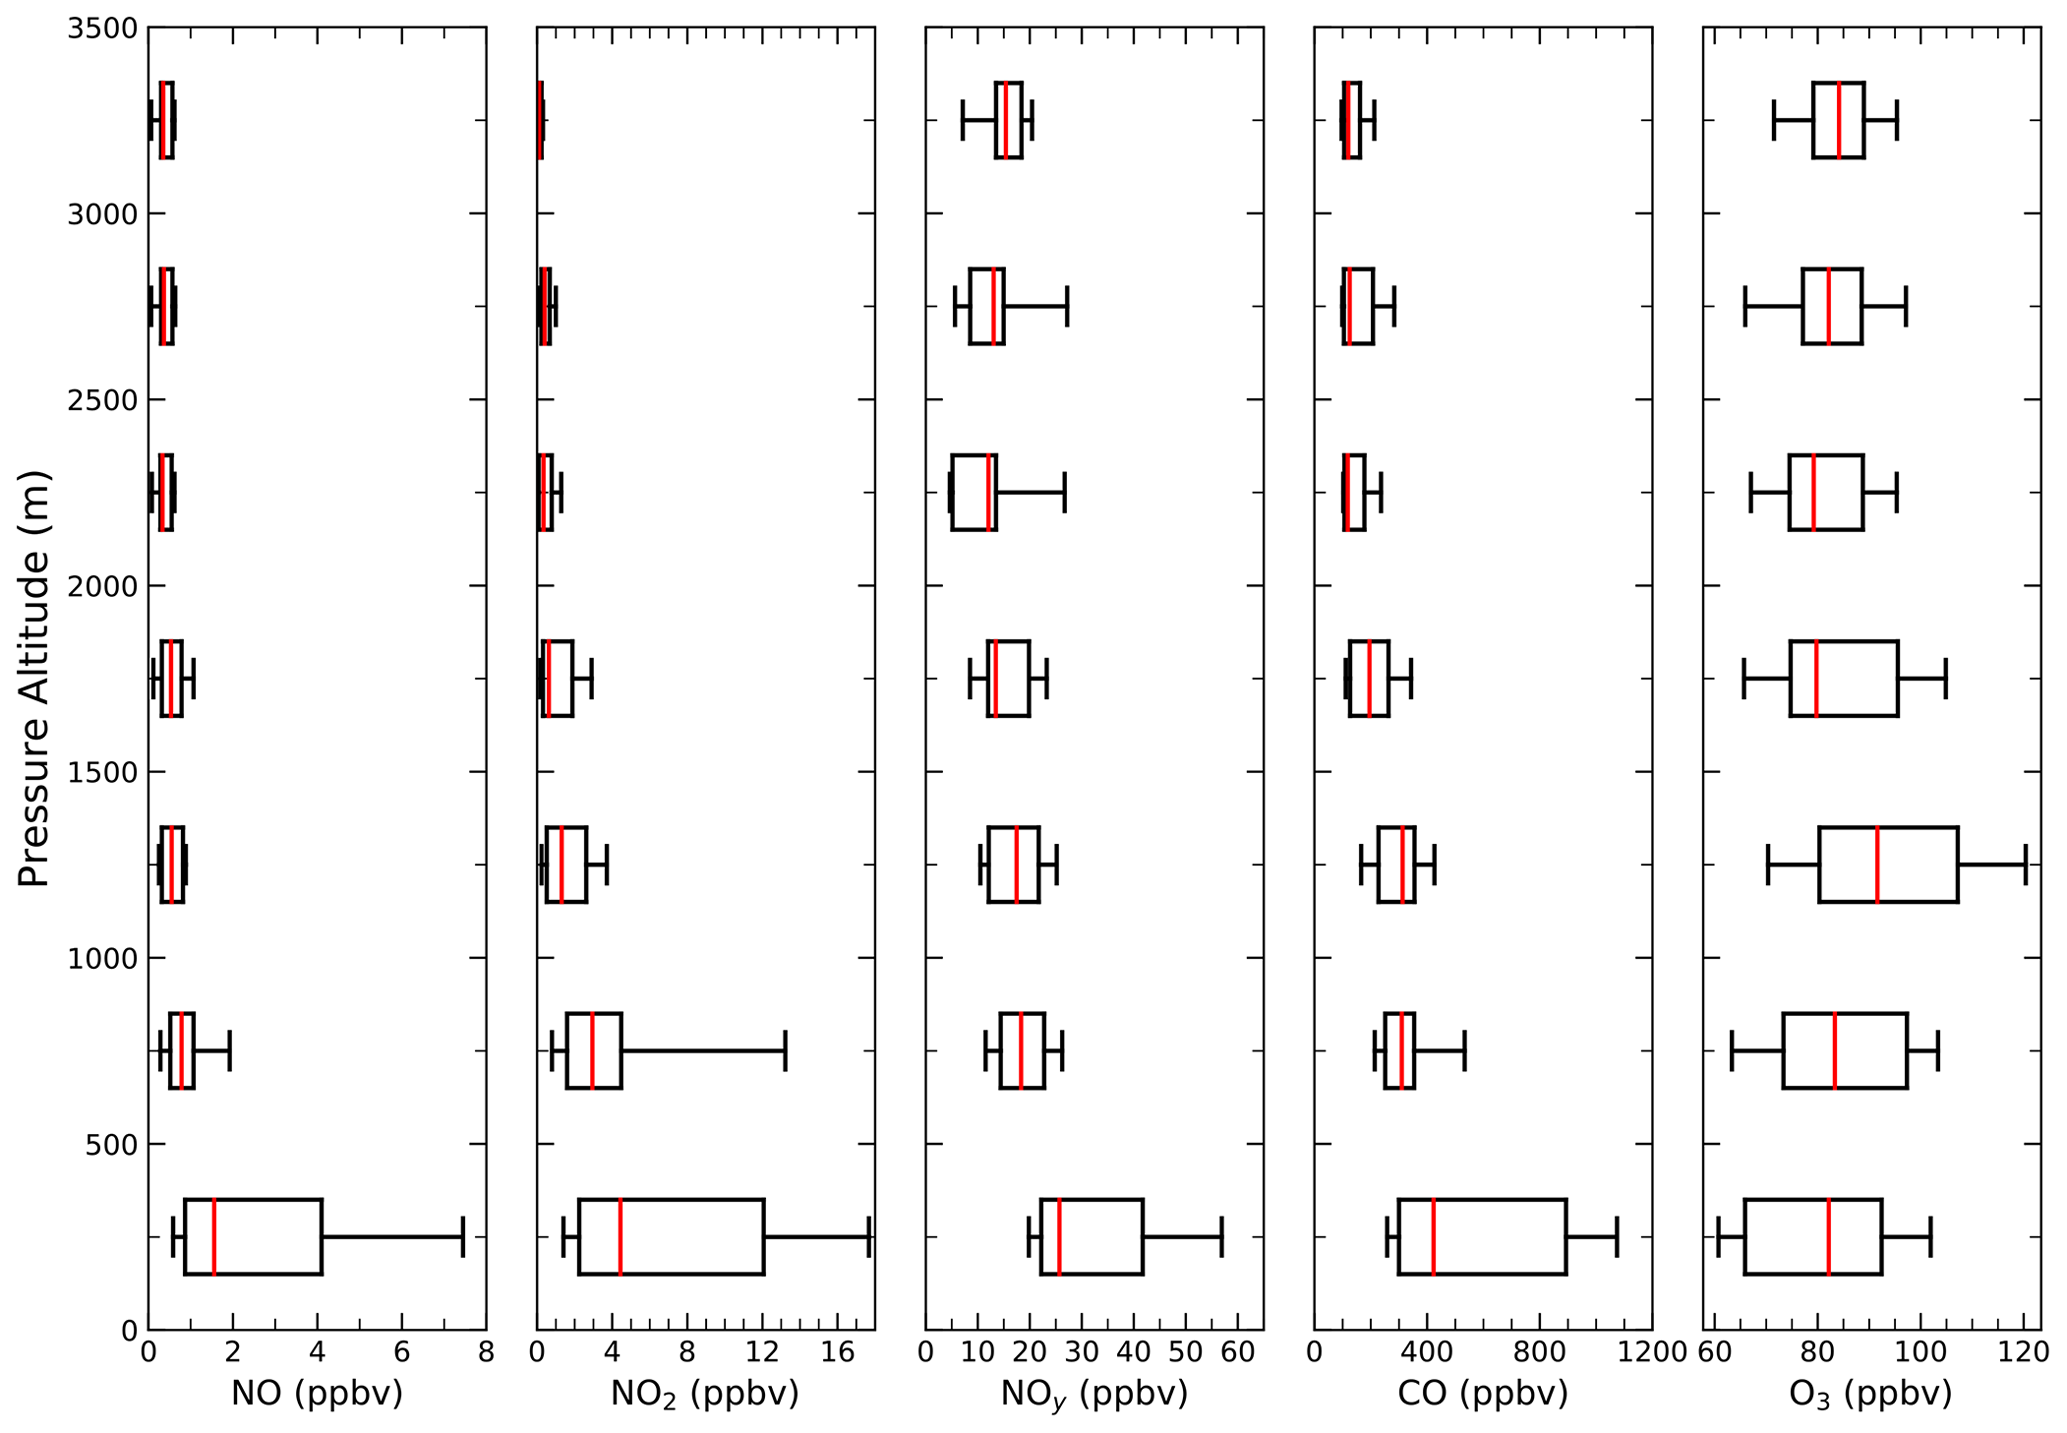
Figure 2Box and whisker plots of 1 s profiles of NO, NO2, NOy, CO, and O3 for data collected in 500 m bins. The whiskers show the 10th and 90th percentiles, the box denotes the 25th and 75th percentiles, and the central red line indicates the median value within each bin. Average PBL height for all ARIAs flight is ∼ 1500 m. The total number of observations at altitudes above 2500 m of NO and NOy is small (∼ 2200 or about ∼ 30 min of measurements) since the NO∕NOy instrument cannot measure both species simultaneously.
Our observations confirm heavy loadings of air pollution over Hebei. Vertical profiles show peak median concentrations of NO (1.6 ppbv), NO2 (4.4 ppbv), and NOy (25.7 ppbv) below 500 m with large variability (Fig. 2). Median concentrations of NO and NO2 drop off gradually with altitude, while median NOy remains close to ∼ 15 ppbv throughout most of the profile. Between 500 and 1000 m, sufficient levels of NOx are observed (median = 3.8 ppbv), indicating continued production of O3 in the PBL. Above 3000 m, median concentrations of NO and NO2 fall to 350 and 106 pptv, respectively (not measured simultaneously), which is still sufficient to produce O3 as air parcels travel downwind. Median mixing ratios of O3 and CO remain high (∼ 80 and ∼ 120 ppbv, respectively) throughout the altitudes sampled by the Y-12.
Unlike previous airborne studies over Beijing from 1994 to 2005 that found increased O3 concentrations below 1 km with constant levels (∼ 52 ppbv) between 1 and 2 km (Ding et al., 2008), our O3 concentrations peaked between 1000 and 1500 m (median = 91.6 ppbv). Low ratios of NOx∕NOy (< 0.30) indicate significant O3 production had already occurred, but the strong correlation (R = 0.71, Fig. S2) between 1 min NOz (NOy-NOx) and Ox (O3 + NO2), an empirical estimate of the O3 production efficiency (OPE), below 1500 m demonstrates moderate production of O3 continued during sampling. The OPE of ∼3.5 during ARIAs is smaller than the average OPE value of ∼8 obtained during 2013 DISCOVER-AQ flights in Houston (Mazzuca et al., 2016) and of ∼7.5 procured during 2011 DISCOVER-AQ flights in the Baltimore–Washington, DC, region (Hembeck et al., 2019). The higher OPE values obtained from these airborne US studies are likely due to the lower NOx concentrations observed in the USA relative to Hebei.
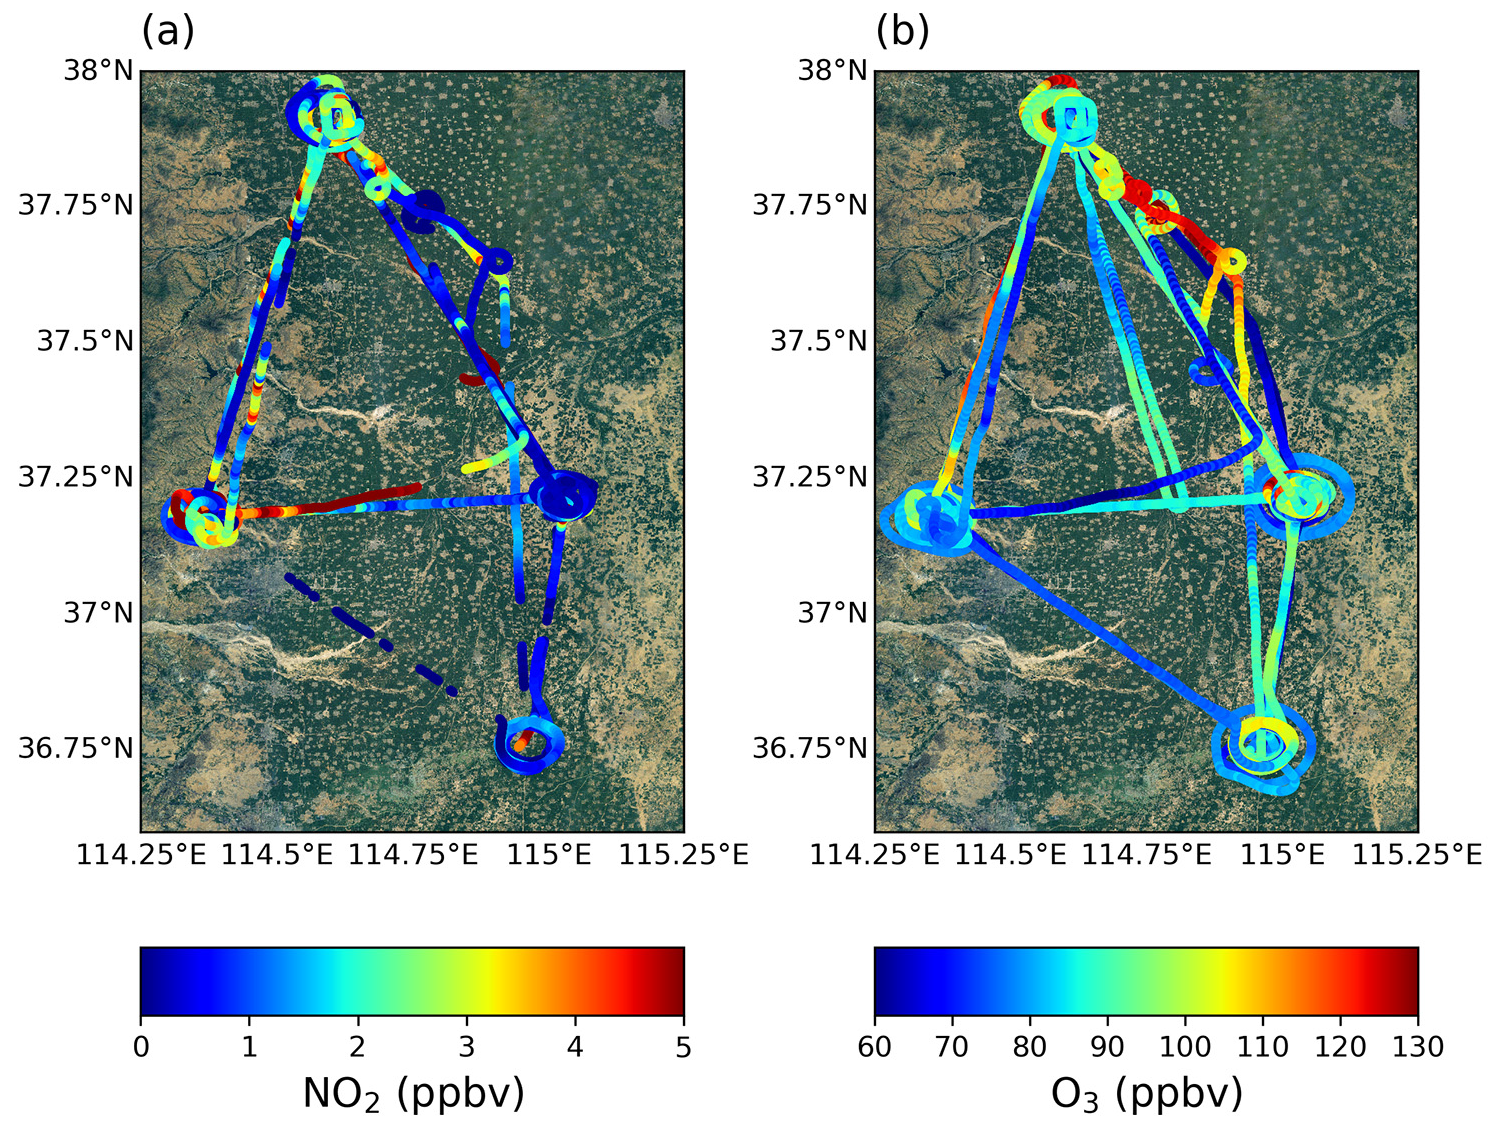
Figure 3Maps of the ARIAs flight track colored by the 1 s measured mixing ratio (ppbv) of NO2 (a) and O3 (b). The background map is provided by Esri © 2009.
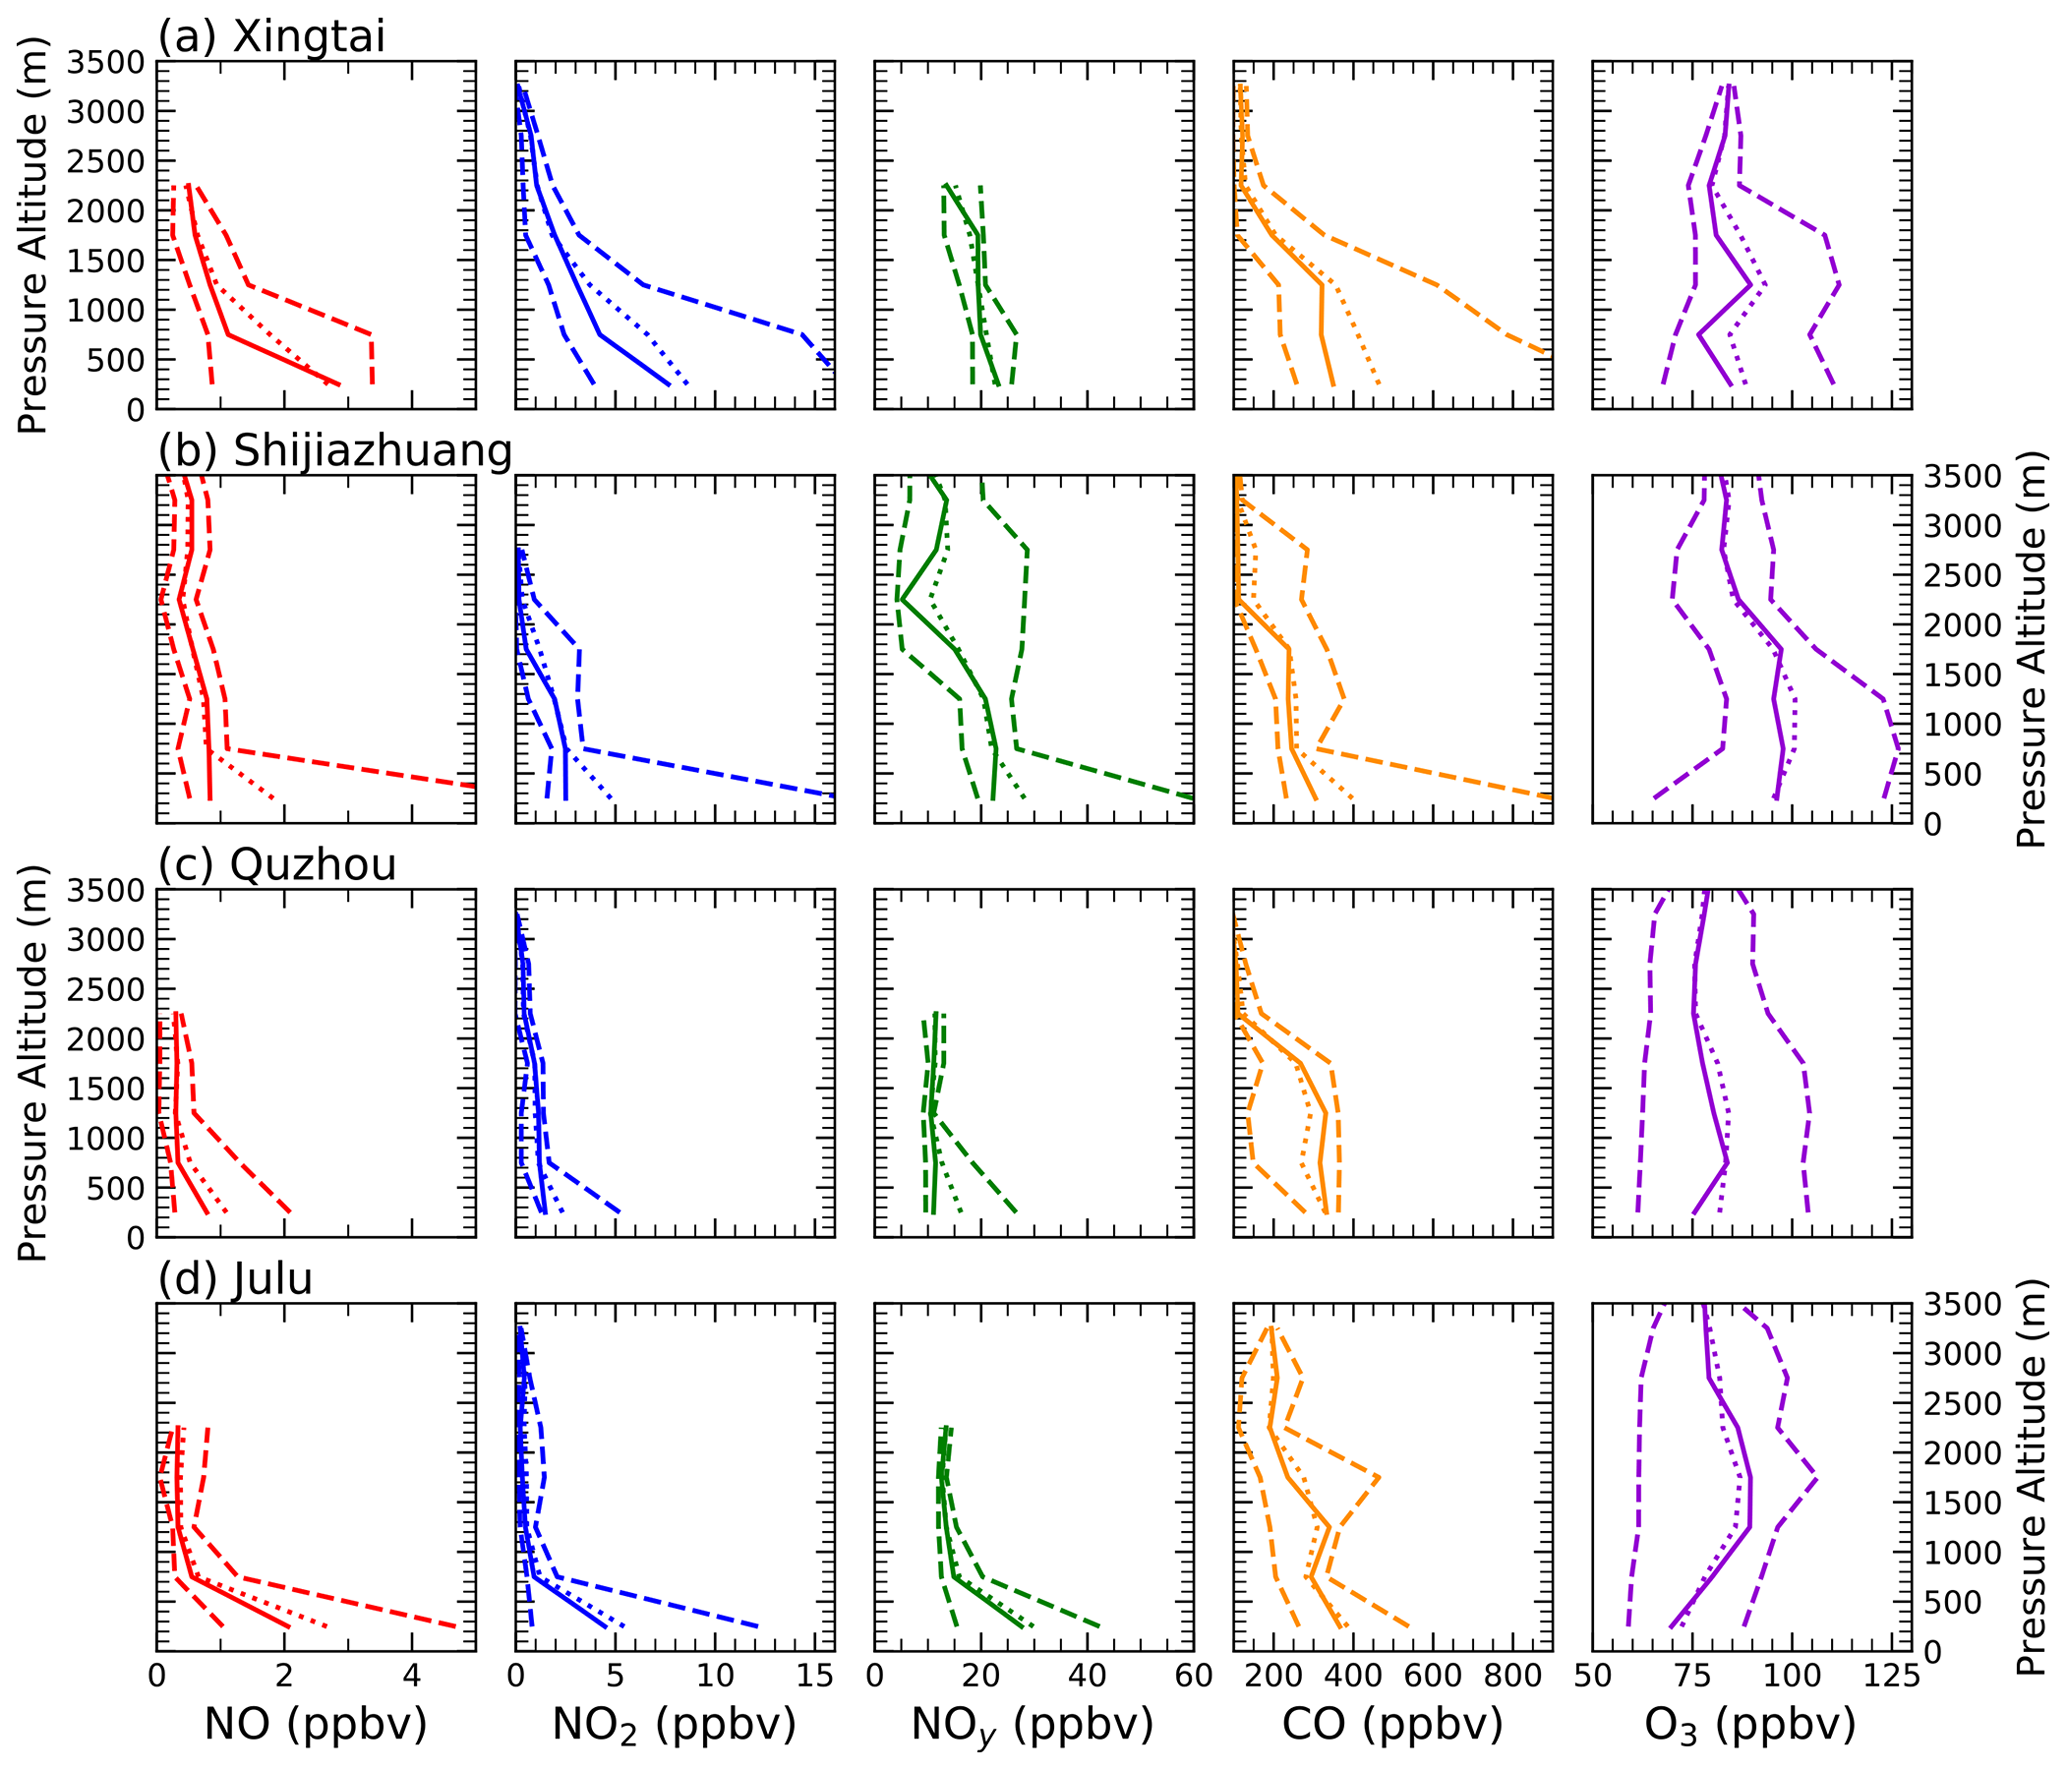
Figure 4Vertical profiles of 1 s NO (red), NO2 (blue), NOy (green), CO (orange), and O3 (purple) in 500 m bins over the four spiral locations: Xingtai (a), Shijiazhuang (b), Quzhou (c), and Julu (d). The dashed lines indicate the 10th and 90th percentiles, the solid line is the median, and the dotted line is the mean. We remove observations of NO∕NOy above 2500 m over three spiral locations due to limited measurements.
Maps of O3 and NO2 on the Y-12 flight tracks (Fig. 3) show the largest concentrations around the spiral locations as well as between the three most northern cities, Shijiazhuang, Julu, and Xingtai. Regions of elevated NO2 do not always correspond with high O3 concentrations. The flight with the maximum observed NO2 mixing ratio (35.3 ppbv) during ARIAs occurred on 17 May around 08:30 am LST. The aircraft was flying a flat transect at 500 m from Shijiazhuang to Julu when a large peak of NO2, CO2 (500 ppmv), and NO (15 ppbv) was sampled. Concentrations of O3 were low during the time of the peak (∼ 60 ppbv), indicating NO-O3 titration, but O3 levels were quite high (> 90 ppbv) throughout the remainder of the flight. The maximum O3 concentration (142.5 ppbv) was measured on 21 May during descent into Luancheng Airport in Shijiazhuang. Observations of NOx were not available for this flight, but elevated CO concentrations (565 ppbv) were observed. High concentrations of O3 were also observed away from the large megacities. For instance, an O3 plume (∼ 125 ppbv) was sampled on 6 June at 1500 m over a more suburban area between Shijiazhuang and Julu with NO2 levels ∼ 500 pptv.
Vertical profiles of trace gases over the four spiral locations (Fig. 4) generally show the highest concentrations over the two largest cities, Shijiazhuang and Xingtai. These two megacities exhibit the greatest variability, below 500 m altitude, of all trace gases discussed here below 500 m. At 3000 m, Xingtai demonstrates the most NO2 (∼ 800 pptv), while the other spiral locations show ∼ 300 pptv. Median profiles of NOy below 500 m are highest over Julu (27.6 ppbv). Median vertical profiles of CO are relatively consistent (∼ 300 ppbv) below 2000 m over the spiral locations, while Julu shows the highest median concentration between 2500 and 3000 m (209.1 ppbv). Measurements of CO above Xingtai indicate a large spread in observations at all altitudes from the lowest 500 m (10th percentile = 258 ppbv, 90th percentile = 1049 ppbv) up to 2000 m (10th percentile = 97.7 ppbv, 90th percentile = 135 ppbv). This variability may be partially explained by the possible burning of wheat straw during early summer 2016. Strong correlations between ethane and acetylene, two biomass burning markers (see Sect. 3.2), further suggest wheat residue burning over Xingtai. Median vertical profiles of O3 below 500 m were 10–25 ppbv higher in Shijiazhuang (median = 96.2 ppbv) than the other spiral locations. Concentrations of O3 are generally stable or slightly increasing in the lowest 2000 m, and median O3 is 75–80 ppbv even as high as 2500–3000 m. Xingtai shows the smallest variability of aloft O3 levels above 2000 m, likely due to the position of this city on the leeward side of the Taihang Mountains.
Table 2Aircraft monitoring results (all altitudes mostly in the PBL, 1 s data) in comparison with other airborne studies in the region. All units ppbv.
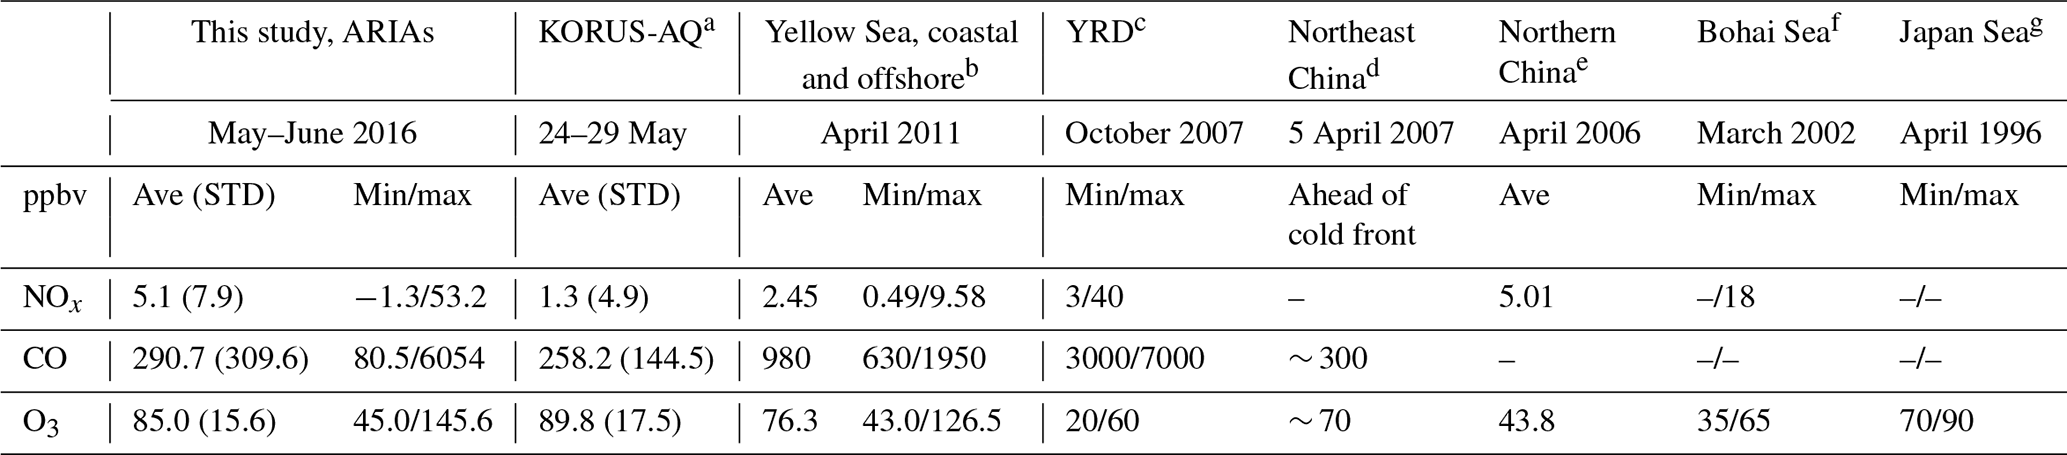
a Statistics calculated for 1 s data during three flights at all altitudes during the extreme pollution period (Choi et al., 2019) where the KORUS-AQ DC-8 flew over the Yellow Sea to measure outflow from China. b Yang et al. (2016). c Geng et al. (2009); YRD: Yangtze River Delta. d Dickerson et al. (2007). e Wang et al. (2008). f Hatakeyama et al. (2005). g Inomata et al. (2006).
The vertical profiles of O3 compared to concurrent surface measurements in Xingtai indicates the A2BC site usually observed larger average concentrations than observed aloft, but this difference was highly dependent upon time of day (Fig. S3). The early afternoon profiles on 8 May showed average surface concentrations only slightly higher than the Y-12 measurements at ∼ 400 m, while the midafternoon profiles on 21 May showed ∼ 25 ppbv higher surface O3 concentrations than Y-12 observations. At low altitudes (∼ 700 m), the late morning flight (around 11:00 LST) on 28 May observed levels of O3 ranging from 72 to 80 ppbv, which is comparable to average surface concentrations of 78 ppbv at the same time. By contrast, the afternoon flight (approximately 17:00 LST) at the same altitude later that day observed ∼ 25 ppbv lower levels of O3 compared to the surface (average = 121 ppbv). All profiles on 11 June showed 10–30 ppbv lower average surface concentrations than measured during the Y-12 spirals.
The overall measured concentrations (1 s data, SD, minimum, and maximum values) of NOx, CO, and O3 in this study are compared with other airborne studies in China including KORUS-AQ flights when outflow was directly from China (Table 2). Comparable to our range of NOx levels from concentrations near the detection limit to 53.2 ppbv, autumn flights in the Yangtze River Delta in 2007 documented large variability in NOx concentrations, ranging from 3 to 40 ppbv (Geng et al., 2009), while April 2006 observations in northern China similarly find a mean concentration ∼ 5 ppbv (W. Wang et al., 2008). The minimum CO concentration during ARIAs (80.5 ppbv) was measured in the lower free troposphere, which is a much smaller minimum concentration than reported by earlier studies. The warm-sector PBL air ahead of a cold front in April 2007 in Shenyang Province in northeast China found ∼ 300 ppbv CO between 1000 and 4000 m (Dickerson et al., 2007), generally larger than most ARIAs profiles (except for Julu). The maximum value of CO during ARIAs (over 6 ppmv) agrees better with the literature, although there are few reported aircraft measurements of CO in Northeast Asia. Average and maximum O3 concentrations during ARIAs were much higher than in other studies but comparable to KORUS-AQ measurements from 24 to 29 May when the flow of air was direct from China. Since the majority of past airborne studies occurred over the sea areas during other seasons, it is not surprising that an urbanized environment like Hebei experienced much larger amounts of O3 than previously reported.
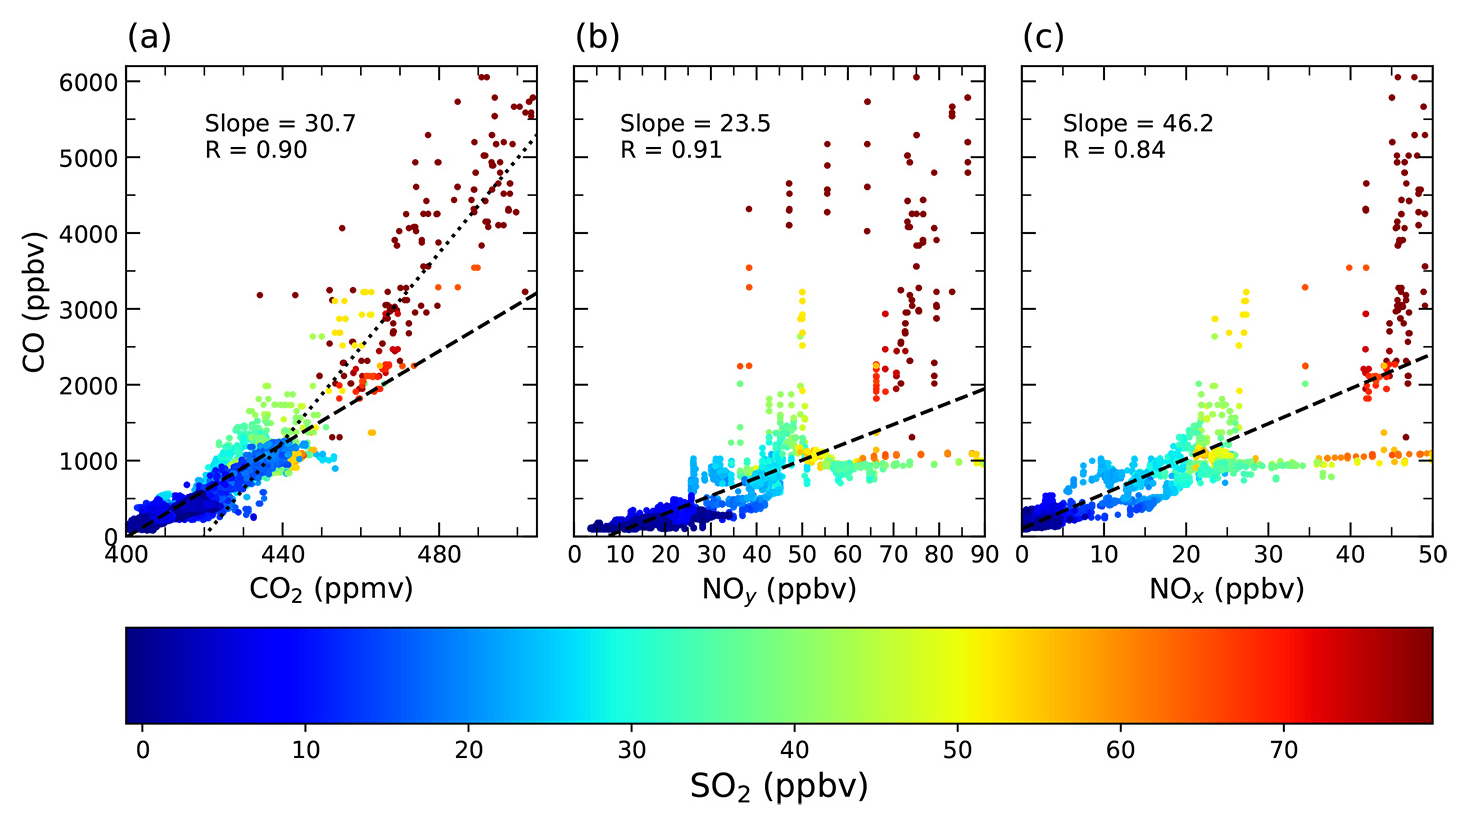
Figure 5Scatter plots of 1 s (a) CO and CO2, (b) CO and NOy, and (c) CO and NOx colored by the SO2 mixing ratio for all ARIAs flights. The dashed line shows the linear regression for each plot. The dotted line in panel (a) indicates the higher ratio commonly associated with biomass and biofuel burning.
Table 3Comparison of CO∕CO2 ratios during ARIAs to other ground-based and aloft measurements in China and developed regions of the world.

* Aircraft studies
The ratios between combustion tracers can be used to understand the source and efficiency. During high-efficiency combustion in modern power plants, fuel carbon is converted to CO2 with near unit efficiency, resulting in low CO∕CO2 (< 0.10 %), while low-efficiency combustion (cold or smoldering processes or low-technology combustion) yields larger ratios. The regression of 1 s CO against CO2 (Fig. 5a) shows high linear correlation (R = 0.90) and high ratios of CO∕CO2 (3.1 %) together with large amounts of SO2. These measurements are illustrative of low-efficiency fossil fuel combustion, likely from residential coal burning as these observations were all collected at ∼ 500 m and are compared to other studies in Table 3. Our results indicating the prevalence of low-efficiency combustion agree with KORUS-AQ airborne data over the West Sea with 2.18 % CO∕CO2 (Tang et al., 2018), as well as with December 2017 surface measurements at Jingdezhen station in central China of 2.6 % when air mass transport was from northern China (Xia et al., 2020). Compared to earlier studies in rural and urban areas of Beijing in the mid-2000s (Han et al., 2009; Y. Wang et al., 2010) and to 2011 measurements in Nanjing (Huang et al., 2015), the ARIAs CO∕CO2 ratio is 0.1 %–2.7 % lower, which is evidence of some success of regional pollution control strategies. By contrast, our CO∕CO2 ratio is higher than satellite-derived ratios over megacities that have implemented extensive pollution control measures (Silva et al., 2013). Similarly, compared to airborne measurements from the 2015 Wintertime INvestigation of Transport, Emissions, and Reactivity (WINTER) campaign in the Baltimore/Washington, D.C., region (Ren et al., 2018), our CO∕CO2 ratio is about a factor of 6 larger. Higher CO∕CO2 ratios (∼ 6 %) with less than 0.1 ppm SO2, as seen briefly during three ARIAs flights, are more in line with emissions from burning of wheat straw in Hebei of ∼ 6 % (Cao et al., 2008) and other inefficient, biofuel combustion.
The ΔCO∕ΔNOy ratio (equivalent to the slope in a CO vs. NOy plot) (Fig. 5b) is an indicator for distinguishing plumes with efficient O3 formation. Typical values of this ratio are ∼ 40 in background air and between ∼ 4 and 7 in fresh emissions plumes in Houston (Neuman et al., 2009). The ΔCO∕ΔNOy ratio of 23.5 measured during ARIAs indicates some photochemical aging and contributions from fossil fuel or biomass burning, but high values of CO, NOy, and SO2 suggest sampling of air parcels heavily influenced by power plants. The CO∕NOx emission ratio (Fig. 5c) from ARIAs agrees with higher emission ratios of gasoline vehicles, while higher amounts of CO, NOx, and SO2 indicate coal burning from the residential sector or inefficient electric generating units. While most of these observations are reflective of the prevalence of low-efficiency fossil fuel combustion, the aircraft sampled a plume on 6 June while flying spirals over Julu containing 0.9 % CO∕CO2 and 0.4 % SO2∕CO2 (Fig. S4), likely due to a coal-burning power plant operating at high combustion efficiency, either using a sulfur scrubber or burning low sulfur fuel.
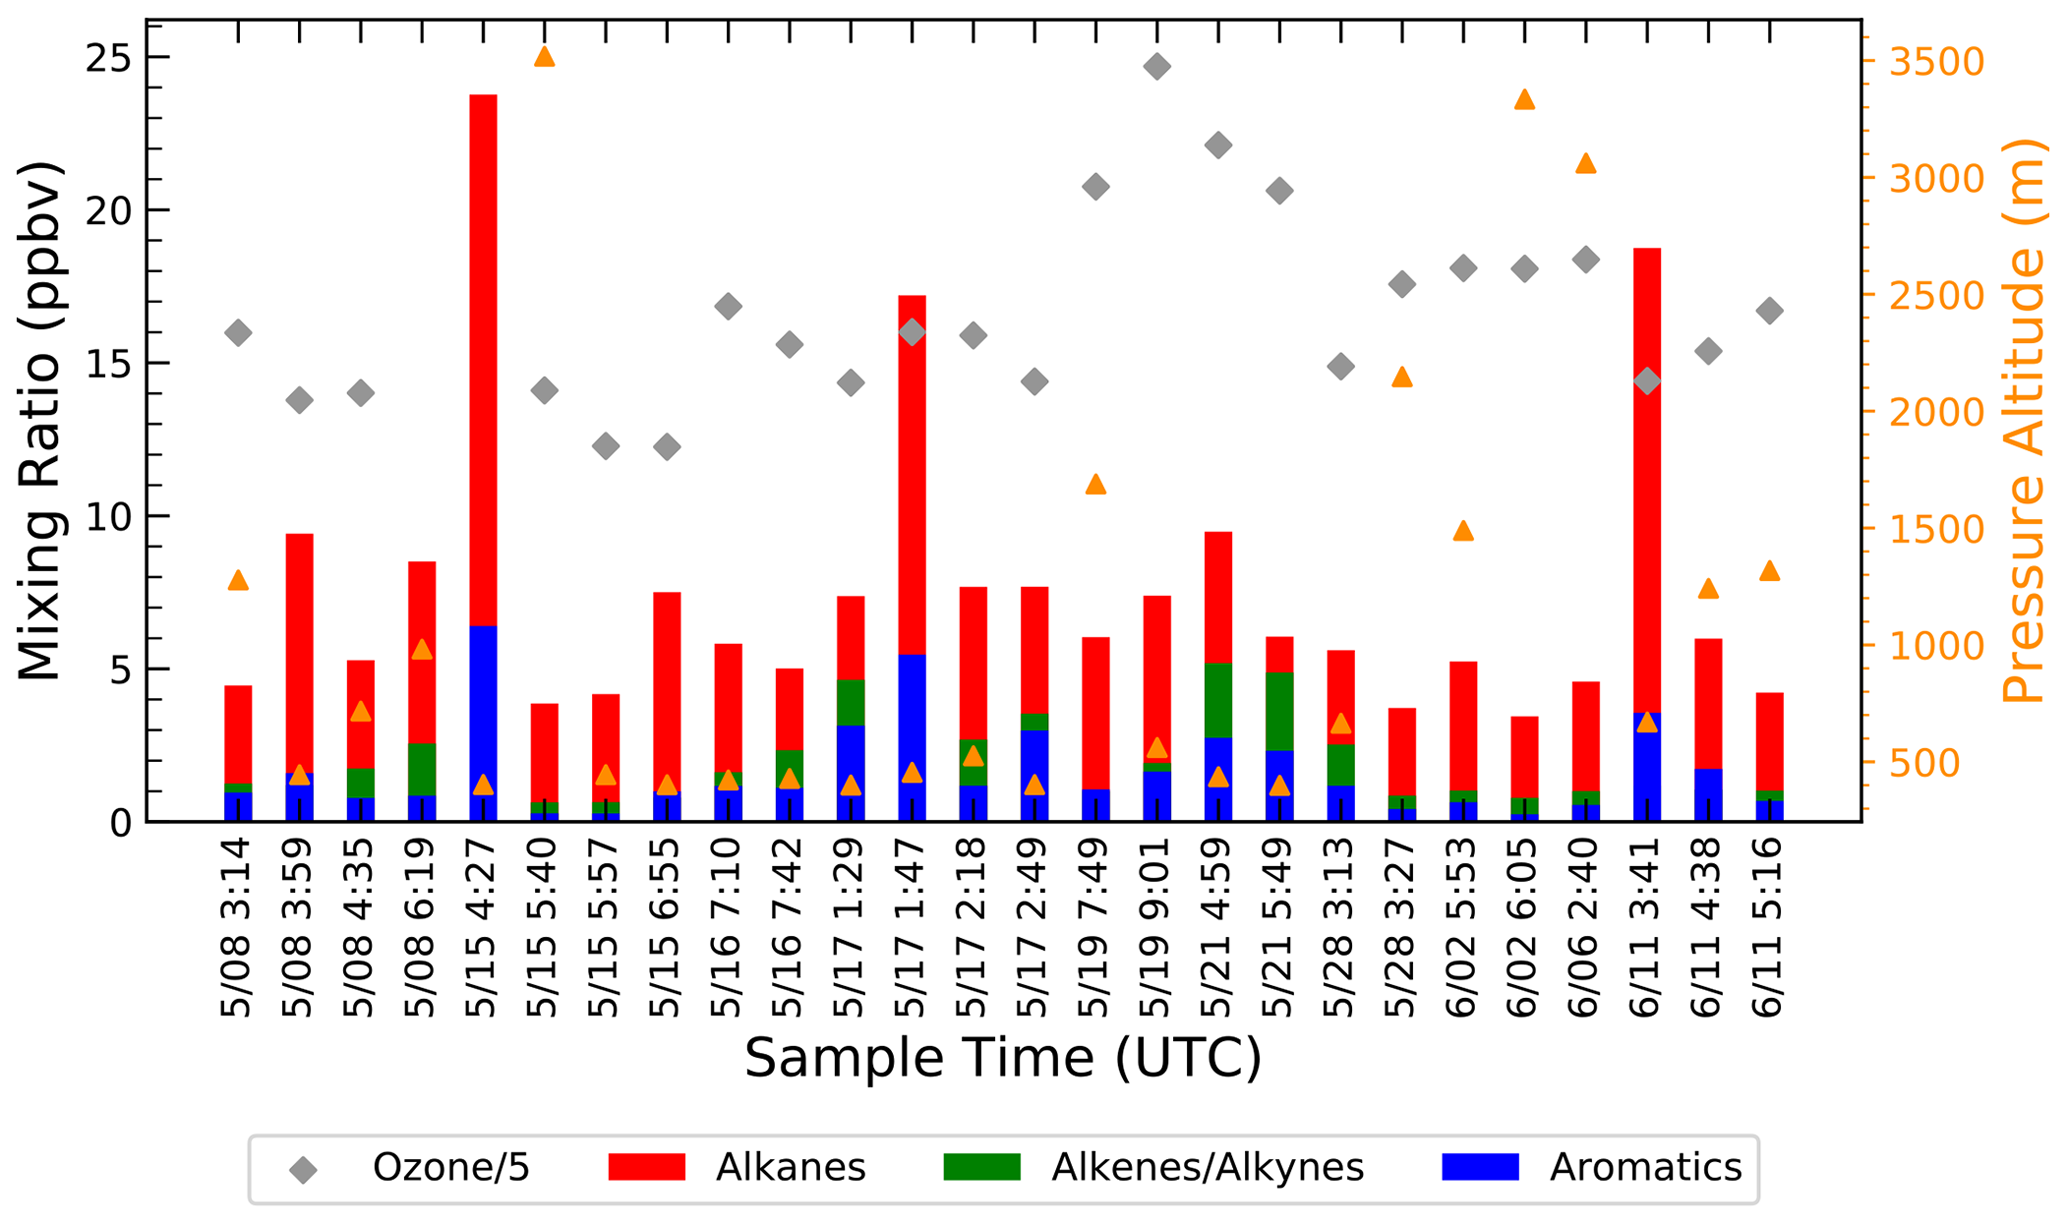
Figure 6Total VOC mixing ratio for each WAS canister during ARIAs colored by alkanes (red), alkenes/alkynes (green), and aromatics (blue). The concurrent O3 mixing ratio, divided by 5, is shown in grey diamonds (using left y axis) and the pressure altitude of the sample is denoted by orange triangles (using right y axis).
Table 4Comparison of the top 10 most abundant species measured in this study with other ground observations in China (units: ppbv).
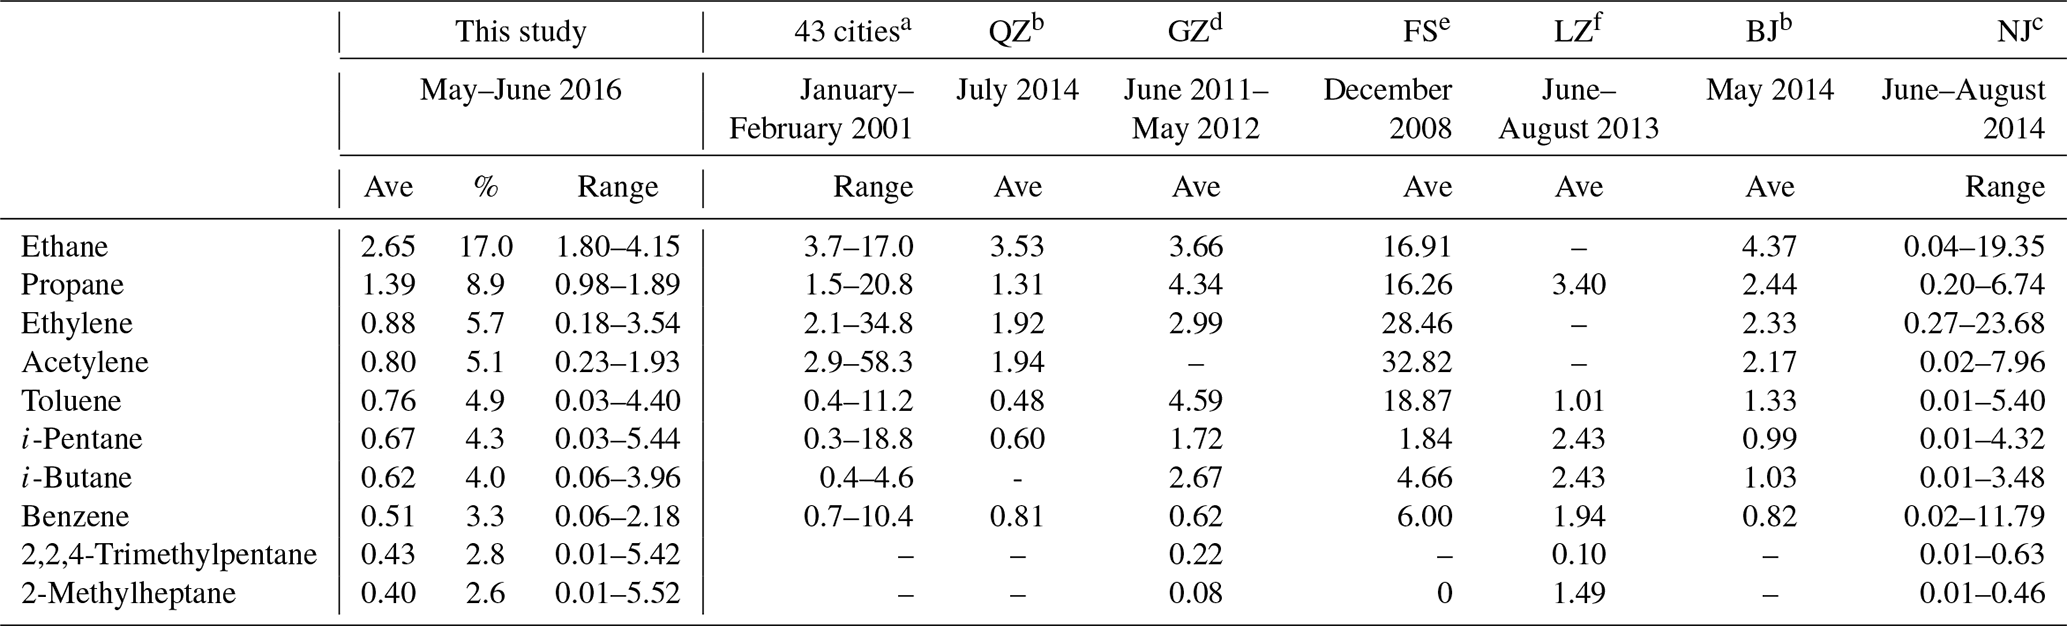
a 43 cities, China (Barletta et al., 2005)
b QZ, Quzhou; BJ, Beijing (Li et al., 2015)
c NJ, Nanjing, Yangtze River Delta (An et al., 2017)
d GZ, Guangzhou, Pearl River Delta (Zou et al., 2015)
e FS, Foshan, Pearl River Delta, haze days (Guo et al., 2011)
f LZ, Lanzhou (Jia et al., 2016).
3.2 Observations and sources of VOCs
The total measured VOC mixing ratios ranged from 4 to 23 ppbv, largely dependent upon the altitude of collection, and were mostly dominated by alkanes (Fig. 6). The samples associated with the largest concentrations of O3 were all collected at altitudes ∼ 500 m during a period with stagnant high pressure. Generally, the samples collected below 500 m showed larger amounts of alkenes/alkynes and aromatics than canisters collected elsewhere in the PBL. The top VOCs ranked by mean volume mixing ratio (Table 4) show that alkanes dominate the total measured VOC mixing ratio during ARIAs (68 %), followed by alkenes/alkynes (17 %) and aromatics (15 %). The top 10 VOC species are C2–C5 alkanes, C2–C3 alkenes/alkynes, benzene, and toluene. The observed mixing ratios of ethane and propane are 2.65 and 1.39 ppbv, respectively, which together accounts for ∼ 52 % of the total alkane mixing ratio.
The levels of ambient VOCs during ARIAs are generally lower than prior surface observations since measurements were taken in the PBL away from primary sources. Prior ground-based studies have similarly found alkanes to contribute the majority (> 50 %) of the total VOC concentration in late spring in the Beijing–Tianjin–Hebei region (Li et al., 2015; Tang et al., 2009; Yuan et al., 2013). The most abundant species during ARIAs are comparable to previous studies finding ethane, propane, and acetylene among the most prevalent but likely have different sources based on the study location (Jia et al., 2016; Li et al., 2015; Mo et al., 2015; Tang et al., 2009). In the Beijing–Tianjin–Hebei region, ambient acetylene, ethylene, and other light alkanes have been attributed to emissions from gasoline vehicles (Li et al., 2015), while in Guangzhou the widespread use of LPG has resulted in high levels of propane (Guo et al., 2011). Additionally, our observations have higher amounts of branched alkanes, such as 2,2,4-trimethylpentane and 2-methylheptane (both components of gasoline), but lower amounts of isoprene due to collection over mostly urban regions with lower ambient temperatures than the summer months. Since isoprene with a lifetime of hours (Seinfeld and Pandis, 2006) in the summer typically exhibits a strong vertical gradient in the PBL (Huang et al., 2017), we find the mean amount of isoprene measured during ARIAs is about 7 times lower than average May 2014 surface measurements in Beijing (Li et al., 2015), as well as ∼ 200 pptv lower than June–July 2007 airborne measurements in the PBL in NE China (Xue et al., 2011). Next, we examine the potential sources contributing to observations of VOCs by comparing with ratios and correlations from known sources.
Since CO can be a marker for anthropogenically emitted hydrocarbons, particularly combustion products, we first use the ratios of various VOCs to CO to reveal insight into changes in emissions in the region. Ratios of VOCs to CO can vary substantially among cities (Baker et al., 2008; Warneke et al., 2007) but in general can provide details about fuel types and combustion efficiency between metropolitan regions. Despite ARIAs measurements sampling in close proximity to local VOCs sources, most VOCs do not correlate strongly with CO, reflective of the lack of common source signatures and some photochemical aging of the sampled air masses. We report slopes of VOCs/CO in Table S2 when R > 0.50. Ethane has the strongest correlation with CO (R = 0.72), and the slope (2.5 pptv ppbv−1) agrees well with ratios from urban areas of the United States in 1999–2005 (2.4 pptv ppbv−1) (Baker et al., 2008) as well as with charcoal-burning emission ratios (Andreae and Merlet, 2001). The ARIAs emission ratio of benzene∕CO (1.8 pptv ppbv−1) is slightly higher than that found in urban regions of the United States (0.7, Baker et al., 2008) and Mexico City (0.93–1.20, Apel et al., 2010), likely due to higher emissions by widespread combustion of coal and agricultural residues (Zhang et al., 2015). By contrast, the ARIAs emission ratios of ethylene and acetylene to CO (2.9. and 1.4 pptv ppbv−1, respectively) are lower than observed in urban areas in the United States (4.1 and 3.4 pptv ppbv−1, respectively) and Mexico City (7.90–8.40 and 8.20–9.60 pptv ppbv−1, respectively), where the dominant source was reported to be transportation-related (Baker et al., 2008). The lower ratio of ethylene∕CO is comparable to emission ratios reported from charcoal burning (2.3 pptv ppbv−1) (Andreae and Merlet, 2001).
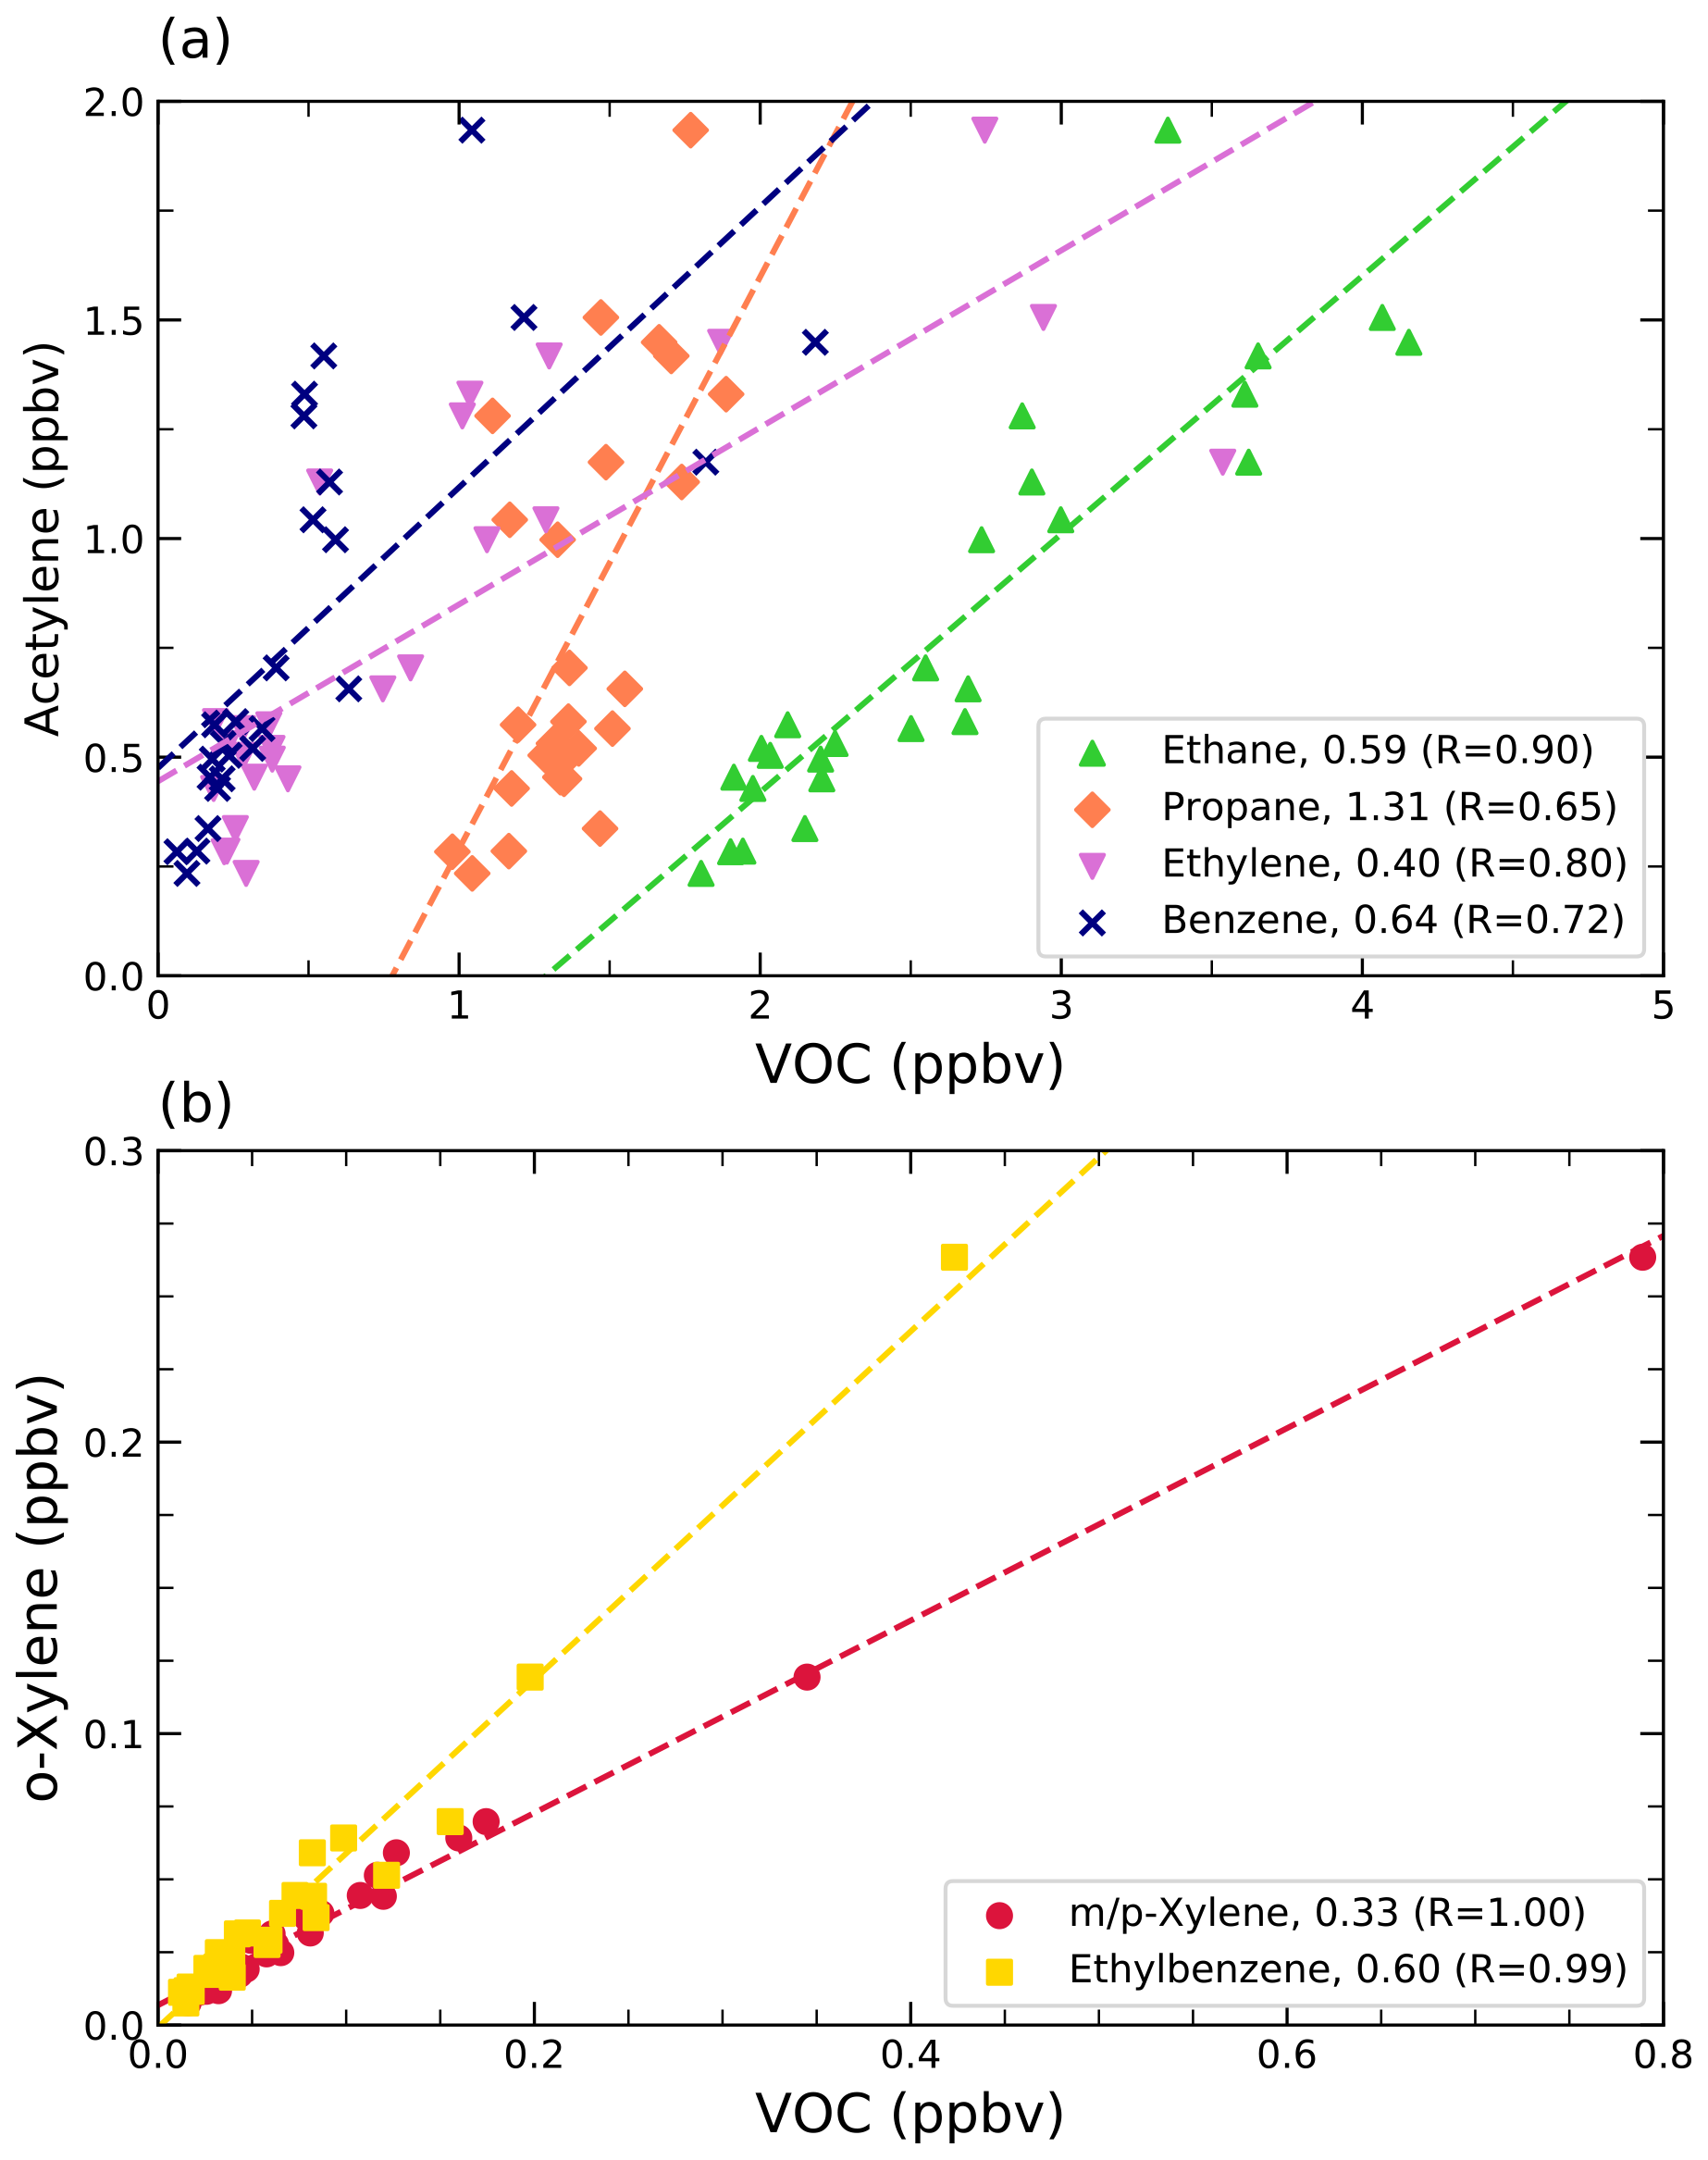
Figure 7(a) Scatterplot of acetylene with ethane (green upward triangles), propane (orange diamonds), ethylene (purple downward triangles), and benzene (navy ×'s) for all WAS canisters during ARIAs. (b) Regression plots of o-xylene with m/p-xylene (red circles) and ethylbenzene (yellow squares). The dashed lines show the results of a linear least squares regression line for all data points.
Ethane is the most abundant VOC in this study and correlates well with indicators for biomass and coal burning (R > 0.81), such as acetylene, ethylene, benzene, and SO2. The ratio of acetylene to ethane (Fig. 7a) during ARIAs is 0.59, which is comparable to the ratio found in a plume of fresh biomass burning in Canada (Blake et al., 1994) and within the range of crop residue burning (∼ 0.2–0.6) found in other studies in China (Chen et al., 2017). High ratios of benzene∕propane (1.12) are comparable to dry grass combustion samples collected in the central Pearl River Delta (PRD) (1.6) (Wang et al., 2005) and further confirm the presence of VOCs due to biomass burning.
The C3 and C4 alkanes, including propane and the butanes, are the three main components of LPG, and their correlation acts as an indicator for LPG leakage. In this study, a moderate correlation (R ∼ 0.50) is found between n-butane and propane and i-butane with n-butane. The ratio of n-butane∕propane during ARIAs is 0.60, which agrees well with ratios from vehicle emissions (Liu et al., 2008a), but is lower than slopes measured in the PRD (2.1) (Lai et al., 2009), where VOCs originated from LPG leakage. Additionally, propane correlates well with acetylene and ethylene (Fig. 7a), two well-known vehicular emission tracers.
Since acetylene and propane have comparable photochemical lifetimes with respect to OH attack, the ratio can be used to assess the relative importance of fossil fuel combustion and LPG leakage (Goldan et al., 2000). LPG contains propane but not acetylene (acetylene∕propane < 1), while combustion of fossil fuels commonly produces small amounts of propane relative to acetylene (acetylene∕propane > 1) (Conner et al., 1995; Gilman et al., 2013; Russo et al., 2010; Watson et al., 2001). In this study, the acetylene∕propane ratio (Fig. 7a) is greater than 1, indicating emissions from vehicles (Fraser et al., 1998). These results suggest vehicles are largely responsible for the C3 and C4 alkanes as well as the C2 alkenes/alkynes observations.
The C5 alkanes and some C6 alkanes like 2,3-dimethylbutane and 2-methylpentane are found in vehicular exhaust and in gasoline vapor (Tsai et al., 2006). The i-pentane to n-pentane ratio is commonly used to identify the contributions of natural gas, vehicular emissions, and fuel evaporation since these alkanes have similar boiling points, vapor pressures, and reaction rate coefficients with OH. In areas heavily dominated by natural gas drilling, ratios lie between 0.82 and 0.89 (Gilman et al., 2013), while higher ratios are associated with vehicle emissions (2.2–3.8) and fuel evaporation (1.8–4.6) (Jobson et al., 2004; McGaughey et al., 2004; Russo et al., 2010; Wang et al., 2013). In this study, i-pentane and n-pentane are highly correlated (R = 0.93), indicating a common source of these compounds. The slope is 10.3, higher than reported in previous studies in China (Li et al., 2019), and the large i-pentane concentrations are likely reflective of gasoline evaporation due to the extremely volatile nature of i-pentane. The influence of fuel evaporative emissions is further identified by strong correlations between C4–C7 alkanes and alkenes typical of fuel evaporative emissions. Strong correlations of many long-chain alkanes (C6–C7 and octane) with i-pentane (R > 0.73 except for cyclohexane) but absence of correlations with acetylene indicate solvent evaporation may be another source of long-chain alkanes.
Typically, the ratio of cis-2-butene∕trans-2-butene is used to determine the source of C4 alkenes (Li et al., 2015; Velasco et al., 2007). However, in this study, all measurements of cis-2-butene and trans-2-butene are below the detection limit, so assessing the ratio and correlation is not possible. Previous studies in this region in China have attributed C4 alkenes to vehicular emissions (Li et al., 2015).
The correlation between the C7 and C8 aromatics is strong (R > 0.76) and revealing of typical signatures from incomplete combustion. The toluene∕ethylbenzene ratio (10.7) is higher than traffic and urban emission ratios (∼ 5–8), but closer to ratios associated with biomass burning (9.41) (Monod et al., 2001; Parrish et al., 1998). Toluene also correlates with all C7–C9 alkanes (R > 0.64) and with i-pentane (R = 0.85), compounds from diesel and gasoline evaporation. High levels of toluene reported in Hong Kong by Ho et al. (2004) were suggested to be emitted from gasoline evaporation, while Chan et al. (2006b) attributed the high toluene levels in different PRD cities to industrial solvent usage.
There is an excellent correlation (R > 0.99) between o-xylene and m/p-xylene (Fig. 7b), and the slope (0.33) is comparable to the emission ratio found in a tunnel study (0.35) (Liu et al., 2008a). The o-xylene∕ethylbenzene (0.60, Fig. 7b) slope is lower than vehicle exhaust emission ratios (1.2–1.8) (Conner et al., 1995; Jobson et al., 2004; Kirchstetter et al., 1996; Rogak et al., 1998; Sagebiel et al., 1996), but the correlation is extremely strong, suggesting the preferential loss of xylenes during transport due to their higher reactivity. These correlations and ratios suggest incomplete combustion from vehicular emissions and biomass burning are an important source of C7 and C8 aromatics.
The ratio between benzene∕toluene (B∕T) is a useful indicator to distinguish between vehicular emissions and other combustion sources. A ratio ∼ 0.5 is often attributed to vehicular sources (Brocco et al., 1997; Perry and Gee, 1995), while ratios larger than 1 have been reported for coal or charcoal burning (Andreae and Merlet, 2001; Moreira Dos Santos et al., 2004). Benzene was observed at high mean ratios over Hebei (0.51 ppbv) and the average B∕T ratio is 1.8 ± 1.6 ppbv ppbv−1. The correlation of some hydrocarbons can highlight the differences between B∕T > 1 (N = 17) and B∕T < 1 (N = 9). The correlation found between benzene and acetylene when all samples are grouped together (Fig. 7a) substantially improves just considering traffic-related samples (B∕T < 1) (R = 0.93), suggesting a contribution of vehicular sources to benzene and acetylene measurements.
3.3 The effect of VOCs on ozone formation
In order to effectively reduce O3 concentrations, it is crucial to understand the relative importance of individual VOCs in terms of the production of O3 because each VOC exhibits different chemical reactivities. In this section, we present results using the loss rate of each VOC species with OH and ozone formation potential (OFP) assuming no influence of aerosols. Since the aerosol effect on O3 formation is dependent upon time of day (solar zenith angle), meteorology, levels of local and neighboring aerosols, and the VOC∕NOx ratio, the calculations presented here are simplified compared to the more complicated chemical composition of the atmosphere, but are still useful to help inform control strategies.
3.3.1 OH loss rate of VOC species
The calculation of the first-order loss rate of OH with different VOCs, termed OH reactivity, provides a measure of the potential to produce HO2 and RO2, key intermediate species in the production of O3 (Stroud et al., 2008). Since the reaction with OH accounts for the majority of loss of most VOCs, the rate constant – obtained from the Master Chemical Mechanism version 3.3.1 (MCM3.3.1) and the National Institute of Standards and Technology (NIST) Chemical Kinetics Database (https://kinetics.nist.gov/kinetics/index.jsp, last access: 20 February 2020) – for the reaction between OH and various hydrocarbons reflects the overall reactivity of that hydrocarbon (Finlayson-Pitts and Pitts, 1999). OH reactivity for each VOC species (VOCi) is defined by Eq. (2):
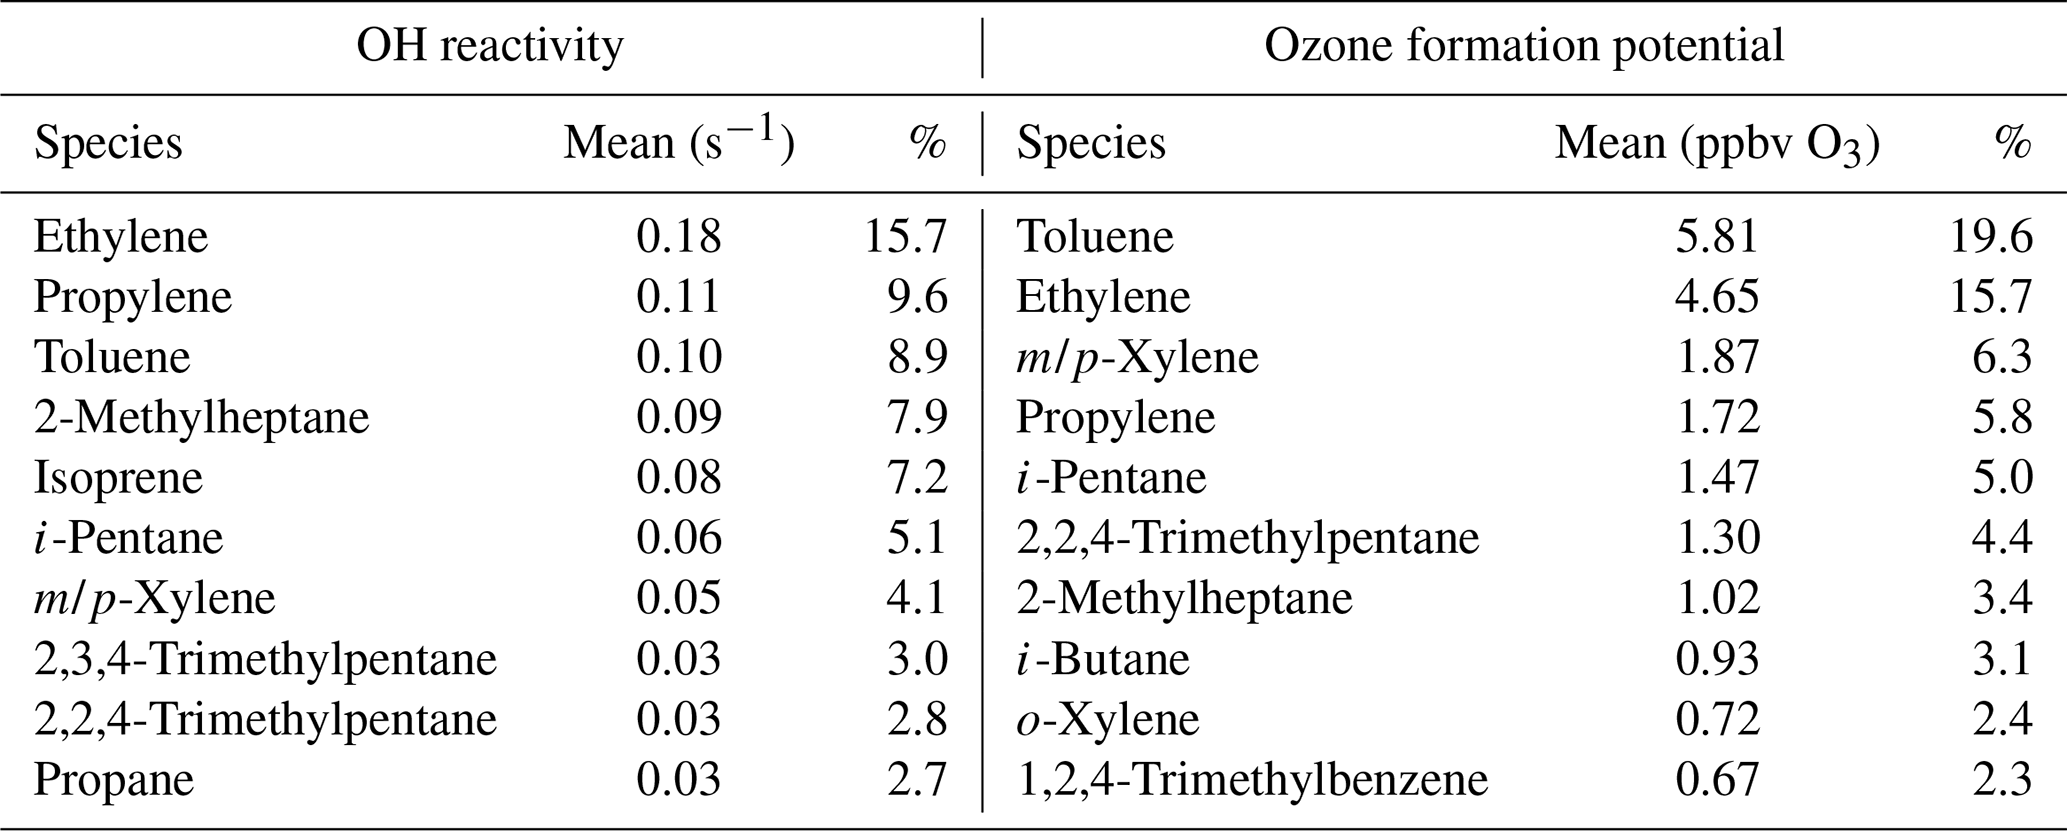
where is the reaction rate constant between OH and VOCi. Among the VOC groups, alkanes and alkenes/alkynes both contribute the most to the total VOC reactivity, accounting for 37 % each. Aromatics accounted for 26 % of the total VOC reactivity. The relative contribution of the top 10 VOCs ranked by mean OH reactivity (Table 5) shows ethylene, propylene, and isoprene among the top measured alkene species, together contributing ∼ 33 % to total OH reactivity. Among the alkanes, 2-methylpentane and i-pentane contribute the most (13 %) to total OH reactivity, followed by the branched pentanes and propane. Aromatic compounds such as toluene and m/p-xylene constitute 13 % of total OH reactivity. Previous ground-based summer studies in China have found larger contributions of isoprene to OH reactivity, ranging from ∼ 10 % to 30 % (Li et al., 2015; Xue et al., 2017), than ARIAs (7.2 %).
Table 5Top 10 VOC species (mean and percentage breakdown) which contribute to ozone formation based on OH reactivity and ozone formation potential during ARIAs.
3.3.2 Ozone formation potential of NMHCs
Since OH reactivity only provides a qualitative identification of the most reactive species and does not reflect products and their production of further free radicals, we next consider the contribution to the formation of O3 using ozone formation potential (OFP). The OFP of a VOC relies on the quantity maximum incremental reactivity (MIR), which represents the amount of O3 formed from the addition of a small amount of the VOC species of interest under high NOx conditions. Values of MIR (unit: g O3/g VOC) have been calculated based on model simulations evaluated with smog chamber measurements (Carter, 2010, 1994). The OFP is calculated according to Eq. (3):
This method gives an estimate of only the first 24 h after initial release. The median measured VOC∕NOx ratio for all WAS canisters was 4.9 ppbv ppbv−1. In comparison, the ratio of reactive organic gas to NOx (ROG∕NOx) in Los Angeles is 7.6 ppbv ppbv−1 (Carter, 1994). VOCs experience photochemical loss from emission sources near the surface to measured aloft concentrations. Estimation of OFP from aircraft observations throughout the PBL indicates how formation of O3 may be different from previous surface studies.
To identify the major contributors to O3 formation in this region, the 10 species with the highest mean OFP are listed in Table 5. Aromatic compounds are the largest contributor to total OFP (43 %), followed by alkanes (30 %) and alkenes/alkynes (27 %). Toluene and ethylene make the largest contributions (19.6 % and 15.7 %, respectively) to total OFP. The high MIR of these compounds (MIR = 4.0 g O3/g VOC and 9.00 g O3/g VOC, respectively) and large mixing ratios (4.9 % and 5.7 % of the total measured VOC volume mixing ratio) drive their important contribution to O3 formation. The relatively short lifetime of ethylene (∼ 1.4 d) combined with the large range of measured mixing ratios (0.18 to 3.54 ppbv) suggests sampling of air masses with little to moderate photochemical processing, indicating the large range of influence on OFP. The most reactive compound in terms of OFP is trans-2-butene (MIR = 15.16 g O3/g VOC), but its low concentration results in only 0.2 % to total OFP. At the other extreme, ethane accounts for a relatively high percentage of total measured VOC volume mixing ratio (17.0 %) yet only contributes 2.1 % to OFP due to its low reactivity (MIR = 0.49 g O3/g VOC).
Previous studies in China report aromatics and alkenes account for the most OFP (Cai et al., 2010; Cheng et al., 2010; Jia et al., 2016; Liang et al., 2017; B. Wang et al., 2010, 2016; Xie et al., 2008; Zheng et al., 2009). At a surface site in Beijing (May 2014), Li et al. (2015) found m/p-xylene, ethylene, toluene, propylene, and o-xylene are most influential to OFP, while at a ground station in Tianjin (August 2018), Han et al. (2020) found that ethylene, isoprene, toluene, m/p-xylene, and propylene were important contributors to OFP. Our study supports a larger contribution of anthropogenic VOCs than biogenic VOCs in spring, although summer studies indicate a major role for isoprene in the formation of O3 in the NCP (Han et al., 2020; Zong et al., 2018). Since isoprene is mostly emitted by biogenic sources during the warmer summer months with strong solar radiation and when soil moisture is sufficient for plant growth, we expect isoprene to have a larger impact on O3 production in the summer than during spring, the time of our study. Tang et al. (2007) concluded ethylene, toluene, and m/p-xylene are the main contributors to OFP during spring 2005 at the surface in the PRD, citing emissions from industry and vehicular exhaust. Our study agrees with past research in urban areas in China identifying the most reactive VOCs in terms of OFP; O3 appears to be formed more slowly above the surface and in nonurban areas, but production is still substantial.
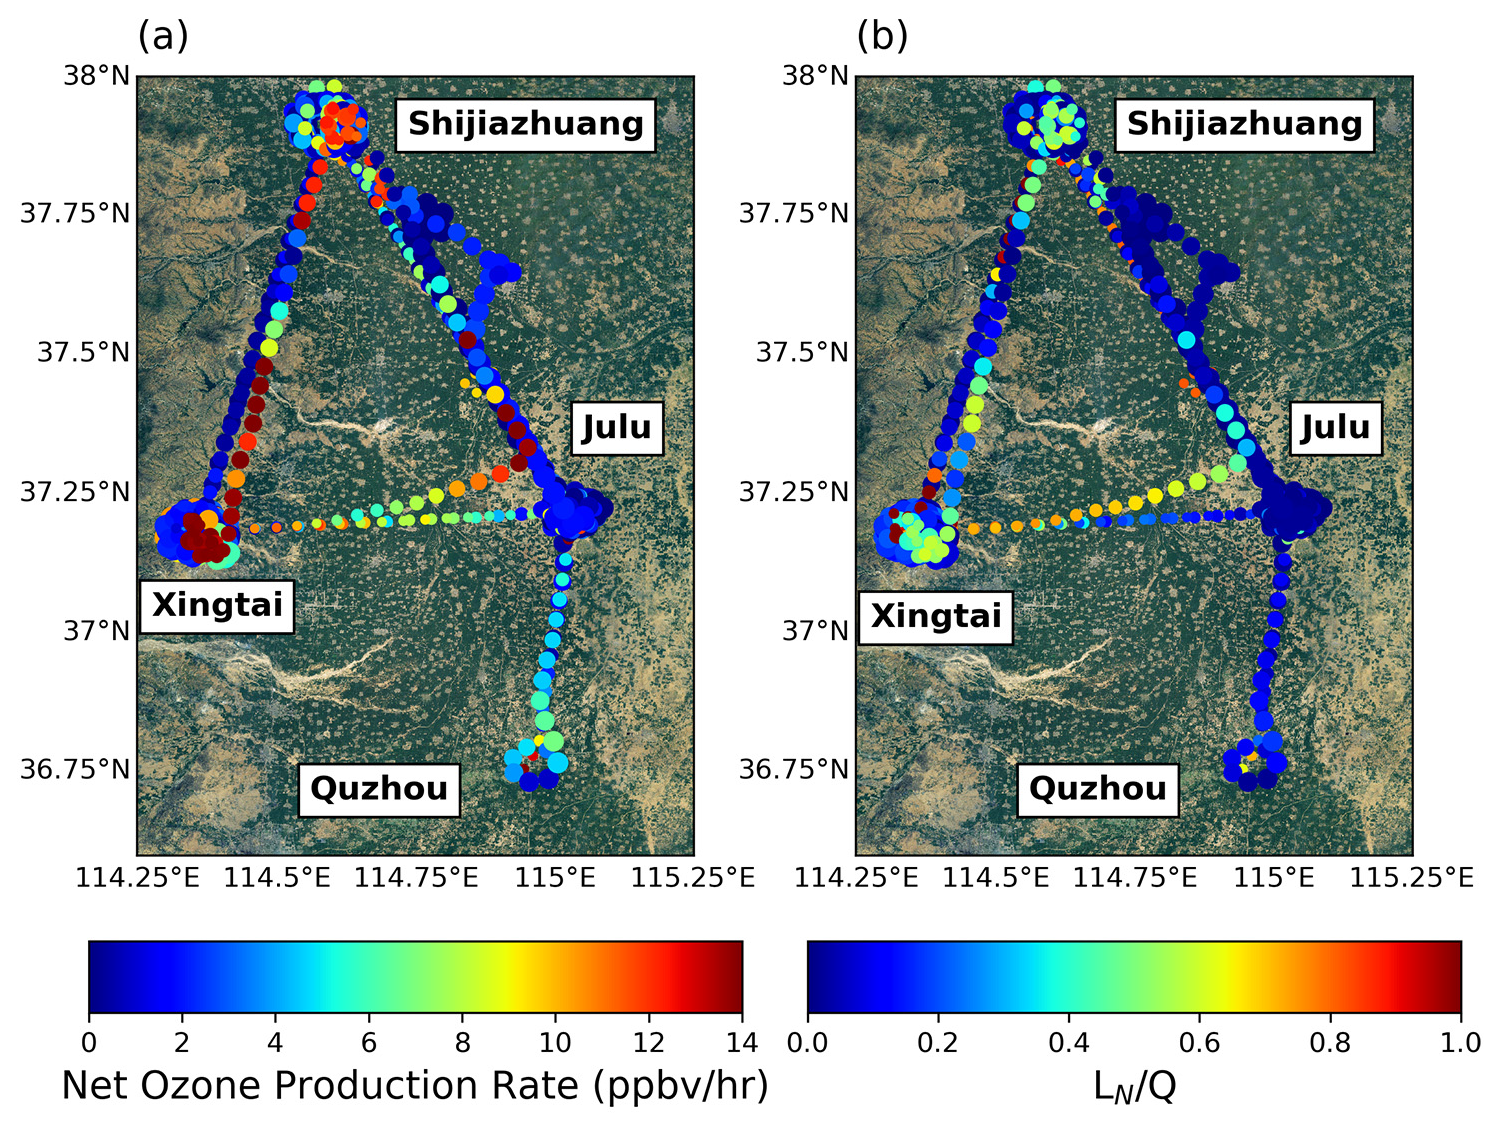
Figure 8(a) Map of the net production rates of O3 calculated using F0AM box model results along the Y-12 flight track during ARIAs. (b) Map of LN∕Q, an O3 sensitivity indicator, along the Y-12 flight path. Ozone production is VOC-sensitive when LN∕Q > 0.5 and NOx-sensitive when LN∕Q < 0.5 (Kleinman, 2005a). The size of the dots in both plots is proportional to the production rate of O3. The background map is provided by Esri © 2009.
National measures for Chinese VOC abatement were released in 2015, mainly focused on the reduction of anthropogenic VOCs from sources in the petrochemical industry, organic chemical industry, packaging printing, and industrial coating, not considering reactivity or chemical speciation (Li et al., 2018). A 2010 VOC emission inventory study concluded the top 15 OFP species (including m/p-xylene, toluene, propylene, o-xylene, and ethylbenzene) contributed 69 % of total OFP but only accounted for 30 % of the total emission of VOCs by mass (Liang et al., 2017). Our analysis of the top 10 species ranked by mean OFP shows these compounds contribute 68 % to total OFP but only represent 37 % of the total volume mixing ratio. Li et al. (2018) classifies industrial coal burning, biomass burning, and motorcycles to the top three VOC emission sources in Shijiazhuang, but OFP is highest for furniture coating, automobile coating, diesel vehicles, fuel evaporation, and gasoline vehicles. These results confirm that reactivity scales and emissions rates should be considered together when formulating control strategies for O3.
3.4 Photochemical ozone production rate and sensitivity
In this section, we describe calculated net photochemical production rates of O3 using the box model constrained by aircraft observations. Ozone production rates calculated from the box model are high in major urban centers, particularly Shijiazhuang and Xingtai, but also between these cities (Fig. 8a). The highest rates (> 10 ppbv h−1) are generally found closer to the surface but in some instances upwards of 2000 m. The largest net production rate of O3 (over 16 ppbv h−1) was located along the Taihang Mountains between Shijiazhuang and Xingtai. This large net production rate occurred ∼ 2000 m on 11 June 2016 when NO, NOy, NO2, and O3 were ∼ 2, ∼ 18, ∼ 3, and ∼ 75 ppbv, respectively.
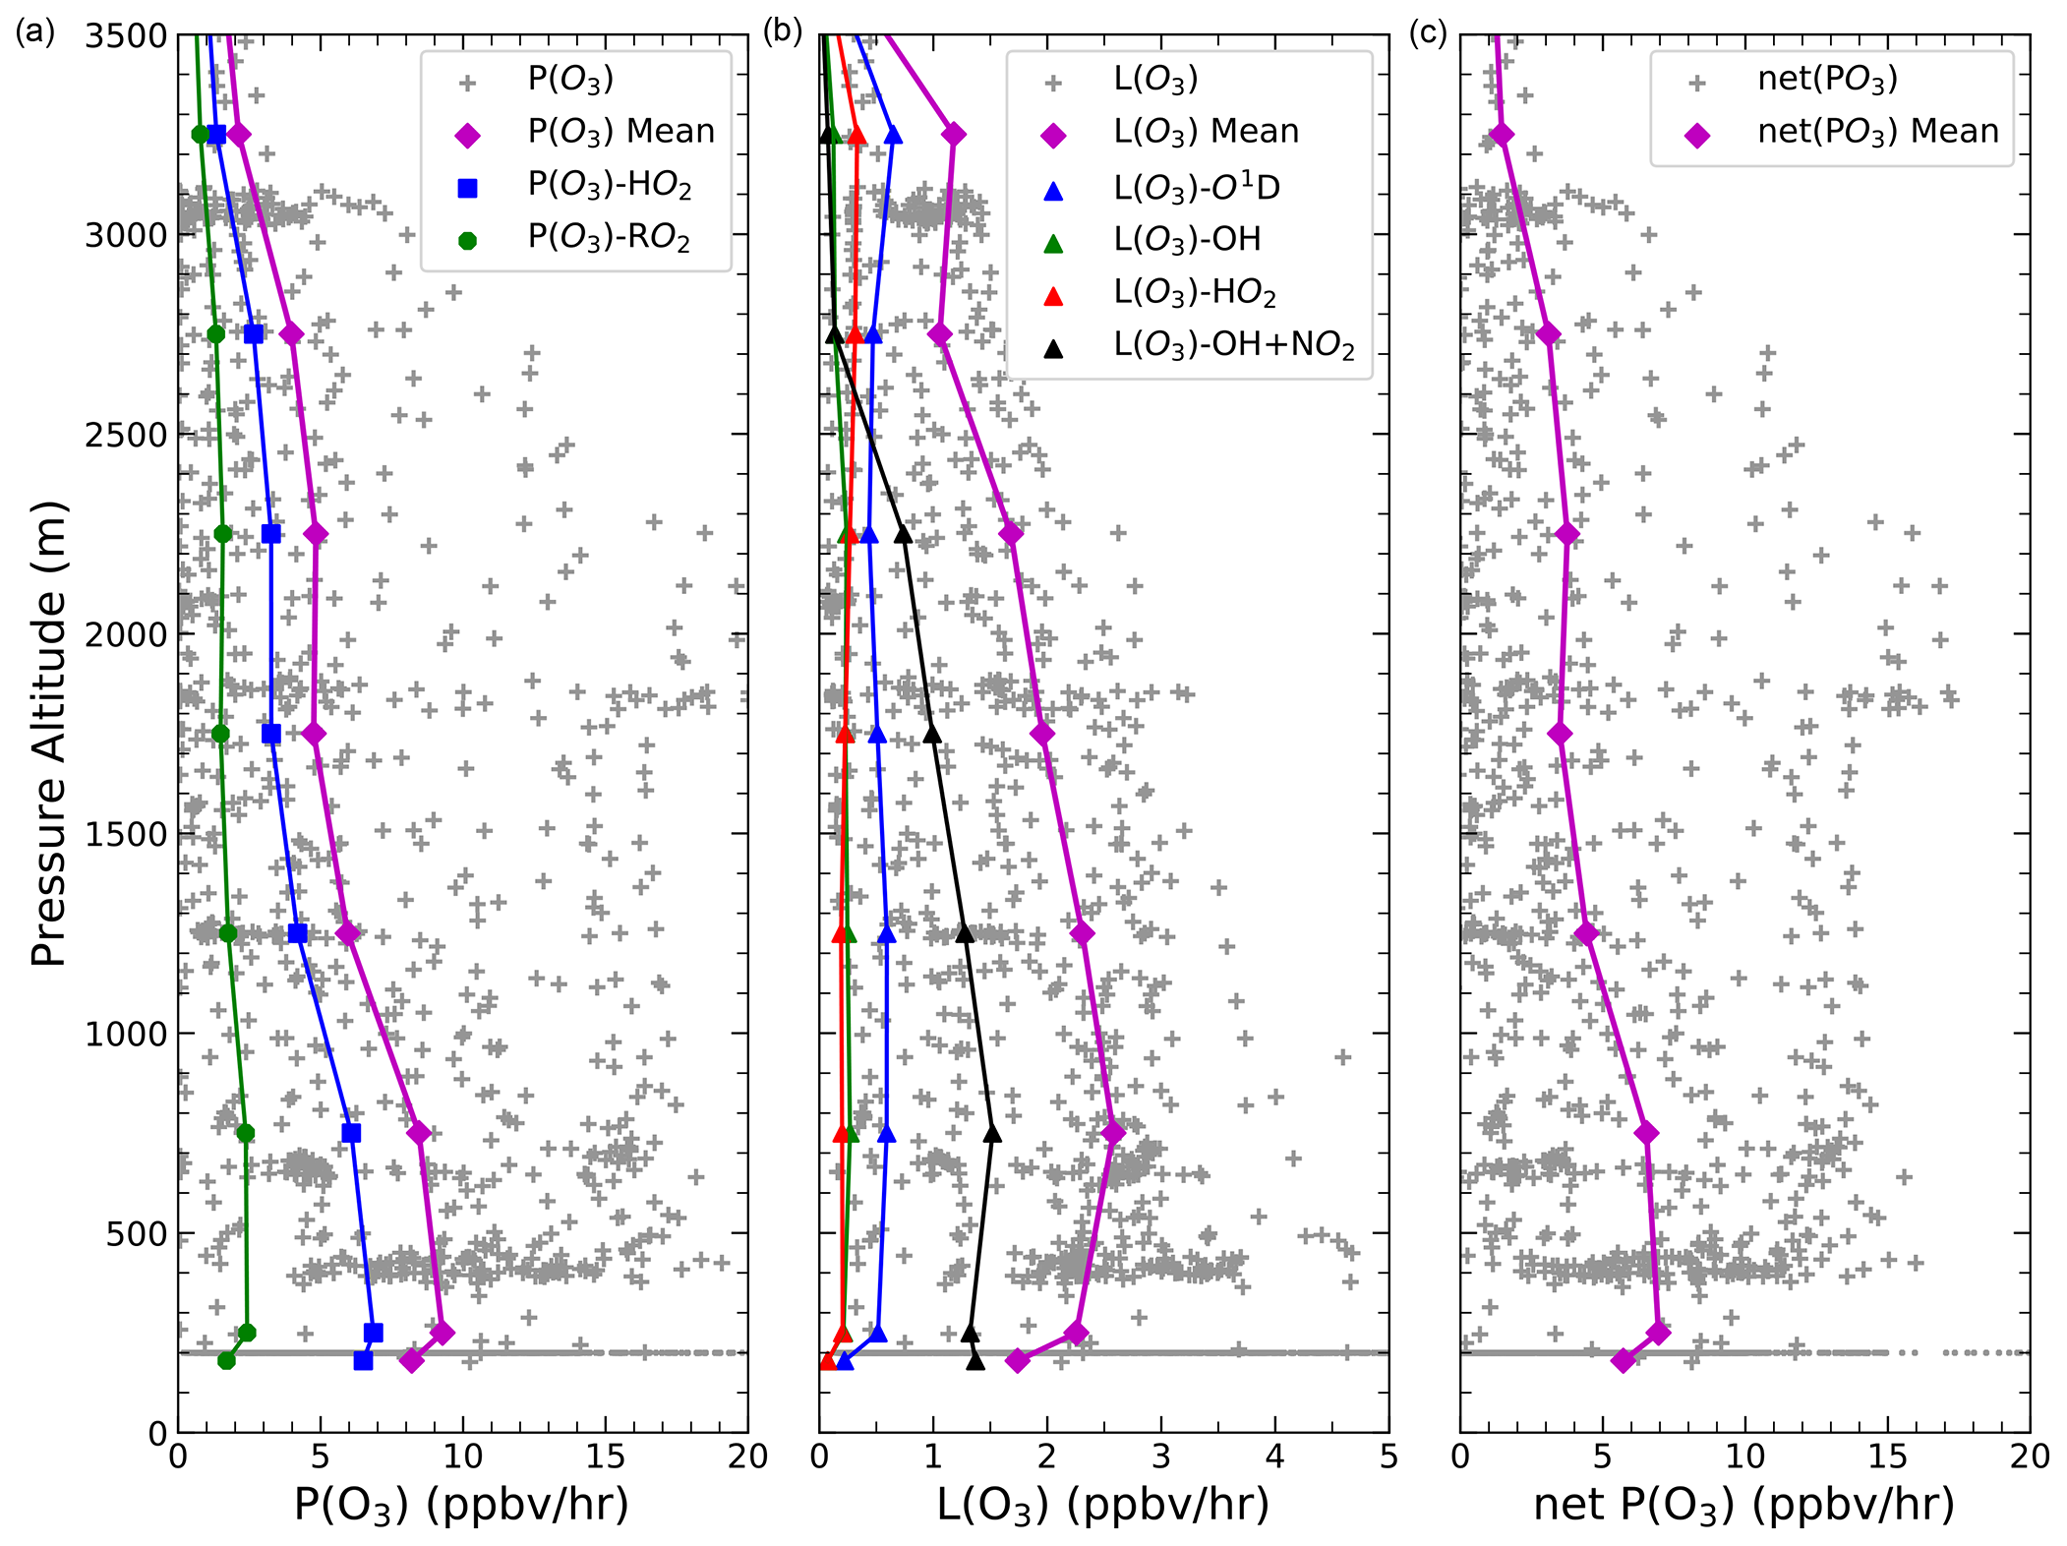
Figure 9Vertical profiles of the rate of production of O3 (a), O3 loss rate (b), and net O3 production rate (c) during ARIAs.
Vertical profiles of production, loss, and net rates of O3 (Fig. 9) show that HO2 + NO made more O3 than RO2 + NO during the campaign. The major loss of O3 was due to the termination of NO2 through its reaction with OH below 2500 m. Reaction with O(1D) is the main loss of O3 above 2500 m. A maximum of net O3 production for the mean profile was observed in the lowest 500 m of ∼ 7 ppbv h−1. In the PBL between 1500 and 2000 m, where median NO and NO2 were 534 and 625 pptv, respectively, O3 production rates were ∼ 4 ppbv h−1. In the lower FT from 2500 to 3000 m, peak net O3 production rates still reached ∼ 3 ppbv h−1 and were conducive to long-range transport.
Values of LN∕Q (Fig. 8b) indicate production rates of O3 are mostly NOx-sensitive (i.e., LN∕Q < 0.5) in the PBL over Hebei, and some of the largest net production rates of O3 are associated with NOx sensitivity. In order to control aloft O3 production that has the potential to be transported downwind, NOx is the most important precursor to control. However, at low altitudes near urban centers, the production rate of O3 tends to be more VOC-sensitive (i.e., LN∕Q > 0.5), particularly during morning flights. In urban regions of China, an O3 formation transition from VOC-limited at the surface to NOx-limited at ∼ 1 km has been documented (Chen et al., 2013; Han et al., 2020). Additionally, many studies conclude O3 production in urban areas of China is VOC-sensitive in spring, while likely more NOx-sensitive in more rural areas (Ran et al., 2011; Xue et al., 2013). Using updated emissions from a nonlinear joint analytical inversion of VOCs and NOx from the Ozone Mapping and Profiler Suite Nadir Mapper (OMPS-NM) formaldehyde and OMI NO2 columns during KORUS-AQ in the WRF-CMAQ (Weather Research and Forecasting Community Multiscale Air Quality) model, Souri et al. (2020) found the maximum daily 8 h average surface O3 over the NCP to increase by 4.56 ppbv, suggesting that emission control strategies on VOCs should be prioritized. Pusede et al. (2014) assessed the temperature dependence of emission control scenarios to lower O3 in the San Joaquin Valley, California, and concluded reducing organic emissions at moderate and high temperatures with co-occurring NOx decreases will further diminish the number of O3 violations. Thus, the control of NOx as well as VOCs may be necessary to control both aloft and near-ground O3 production in the NCP.
High concentrations of O3 and its precursors were pervasive over Hebei Province, China, in spring 2016. In this study, we quantify the composition and photochemical nature of the lower troposphere associated with smog events. Measurements of trace gases including O3, CO, NOx, NOy, and of aerosol optical properties were acquired in May and June 2016. Twenty-six samples analyzed for 54 VOCs were taken aboard a Y-12 research aircraft mostly in the PBL. Our observations confirm heavy loadings of pollution over Hebei.
The major conclusions of our study are the following.
-
We observed high amounts O3, ranging from 45 to 145 ppbv, with the highest values found over Shijiazhuang. The highest NOx concentrations were observed over Xingtai below 500 m. The highest NOx and CO concentrations were 53.2 and 6054 ppbv, respectively. Ratios of CO∕CO2 indicate inefficient combustion from residential coal and biomass burning throughout the region but have decreased in China since the early 2000s, suggesting the implementation of successful pollution control strategies.
-
Concentrations of total measured VOCs reveal alkanes contribute the most by volume mixing ratio (68 %), while alkenes/alkynes and aromatics together supply the most (74 %) to the calculated OH loss rate. Aromatics constitute most (43 %) of the total calculated OFP, and toluene, ethylene, m/p-xylene, propylene, and i-pentane play significant roles in the aloft formation of O3 in this region. In contrast to other surface studies in summer, we find a lower contribution of biogenic sources (e.g., isoprene) to the formation of O3 in the PBL. Sources of VOCs include vehicular emissions, biomass burning, and fuel and solvent evaporation.
-
High amounts of NOx and VOCs throughout the PBL over nonurban parts of Hebei Province were found to generate O3 at a peak mean rate of ∼ 7 ppbv h−1 below 500 m. The lower free troposphere (from ∼ 2500 to ∼ 3000 m) was also frequently polluted, with CO and NO2 averaging ∼ 125 ppbv and ∼ 140 pptv with peak net production rates of O3 ∼ 3 ppbv h−1, allowing for continued formation of O3 as the air mass travels downwind. The O3 production regime is found to be NOx-limited throughout the PBL over Hebei, whereas it is more VOC-limited at low altitudes near urban centers.
Our measurements in spring 2016 over Hebei cannot represent all of China or the seasonal variation of O3 photochemistry, but measurements from an airborne platform make a valuable addition to the understanding of one of the most polluted regions in China, and indeed the world. The photochemistry of O3 production is highly dependent upon the interaction of radiation and aerosols within the PBL, and future work is needed to assess optical properties of aerosols at wavelengths relevant to photolysis of O3 to O(1D) and thus OH. We show that to improve air quality in Hebei Province, both NOx and VOCs from vehicles and fuel evaporation should be targeted. While VOCs are already targeted for emission reduction in China, the substantial concentrations of O3 observed in this study further confirm the formation of a reactivity-oriented control strategy is urgent.
The ARIAs flight data are available at https://doi.org/10.5067/Suborbital/KORUSAQ/DATA01 (KORUS-AQ Science Team, 2018).
The supplement related to this article is available online at: https://doi.org/10.5194/acp-20-14523-2020-supplement.
The ARIAs campaign was supervised by RD, ZQ, and XR. XR, HH, and FW conducted the measurements on board the research aircraft, and VOCs were analyzed by MS and SL. A2BC observations were collected by ZL, FW, YW, and FZ. SR helped set up the box model. SB carried out the scientific analysis of the aircraft data and drafted the manuscript with contributions from all coauthors.
The authors are grateful for the flight crew and the many scientists who helped to collect ARIAs and A2BC observations. The ARIAs flight data are available at https://www-air.larc.nasa.gov/cgi-bin/ArcView/korusaq?OTHER=1#top (last access: 27 January 2020). The background global map is from Esri (available at https://www.arcgis.com/home/item.html?id=21b4ba14d9e5472d97afcbb819f7368e#overview, last access: 6 March 2020). Additionally, we thank Glenn Wolfe of NASA for his support of the F0AM box modeling effort and Gabriele Pfister and Frank Flocke at NCAR for providing helpful discussion during manuscript preparation. The scientific results and conclusions, as well as any views or opinions expressed herein, are those of the authors and do not necessarily reflect the views of NIST, NSF, or NOAA.
This research has been supported by the National Science Foundation, Directorate for Geosciences (grant no. 9188-1524) and the National Institute of Standards and Technology (NIST) (award no. # 70NANB19H037).
This paper was edited by Sally E. Pusede and reviewed by two anonymous referees.
Al-Saadi, J., Carmichael, G., Crawford, J., Emmons, L., Kim, S., Song, C. K., Chang, L. S., Lee, G., Kim, J., and Park, R.: NASA Contributions to KORUS-AQ: An International Cooperative Air Quality Field Study in Korea, available at: https://www-air.larc.nasa.gov/missions/korus-aq/docs/White_paper_NASA_KORUS-AQ.pdf (last access: 27 November 2020), 2015.
An, J., Wang, J., Zhang, Y., and Zhu, B.: Source Apportionment of Volatile Organic Compounds in an Urban Environment at the Yangtze River Delta, China, Arch. Environ. Con. Tox., 72, 335–348, https://doi.org/10.1007/s00244-017-0371-3, 2017.
An, Z., Huang, R. J., Zhang, R., Tie, X., Li, G., Cao, J., Zhou, W., Shi, Z., Han, Y., Gu, Z., and Ji, Y.: Severe haze in northern China: A synergy of anthropogenic emissions and atmospheric processes, P. Natl. Acad. Sci. USA, 116, 8657–8666, https://doi.org/10.1073/pnas.1900125116, 2019.
Andreae, M. O. and Merlet, P.: Emission of trace gases and aerosols from biomass burning, Global Biogeochem. Cy., 15, 955–966, https://doi.org/10.1029/2000GB001382, 2001.
Apel, E. C., Emmons, L. K., Karl, T., Flocke, F., Hills, A. J., Madronich, S., Lee-Taylor, J., Fried, A., Weibring, P., Walega, J., Richter, D., Tie, X., Mauldin, L., Campos, T., Weinheimer, A., Knapp, D., Sive, B., Kleinman, L., Springston, S., Zaveri, R., Ortega, J., Voss, P., Blake, D., Baker, A., Warneke, C., Welsh-Bon, D., de Gouw, J., Zheng, J., Zhang, R., Rudolph, J., Junkermann, W., and Riemer, D. D.: Chemical evolution of volatile organic compounds in the outflow of the Mexico City Metropolitan area, Atmos. Chem. Phys., 10, 2353–2375, https://doi.org/10.5194/acp-10-2353-2010, 2010.
Avnery, S., Mauzerall, D. L., Liu, J., and Horowitz, L. W.: Global crop yield reductions due to surface ozone exposure: 2. Year 2030 potential crop production losses and economic damage under two scenarios of O3 pollution, Atmos. Environ., 45, 2297–2309, https://doi.org/10.1016/j.atmosenv.2011.01.002, 2011.
Baker, A. K., Beyersdorf, A. J., Doezema, L. A., Katzenstein, A., Meinardi, S., Simpson, I. J., Blake, D. R., and Sherwood Rowland, F.: Measurements of nonmethane hydrocarbons in 28 United States cities, Atmos. Environ., 42, 170–182, https://doi.org/10.1016/j.atmosenv.2007.09.007, 2008.
Barletta, B., Meinardi, S., Rowland, F. S., Chan, C. Y., Wang, X., Zou, S., Lo, Y. C., and Blake, D. R.: Volatile organic compounds in 43 Chinese cities, Atmos. Environ., 39, 5979–5990, https://doi.org/10.1016/j.atmosenv.2005.06.029, 2005.
Bell, M. L., Peng, R. D., and Dominici, F.: The Exposure – Response Curve for Ozone and Risk of Mortality and the Adequacy of Current Ozone Regulations, Environ. Health Persp., 114, 532–536, https://doi.org/10.1289/ehp.8816, 2006.
Blake, D. R., Smith, T. W., Chen, T.-Y., Whipple, W. J., and Rowland, F. S.: Effects of biomass burning on summertime nonmethane hydrocarbon concentrations in the Canadian wetlands, J. Geophys. Res., 99, 1699, https://doi.org/10.1029/93jd02598, 1994.
Brocco, D., Fratarcangeli, R., Lepore, L., Petricca, M., and Ventrone, I.: Determination of aromatic hydrocarbons in urban air of Rome, Atmos. Environ., 31, 557–566, https://doi.org/10.1016/S1352-2310(96)00226-9, 1997.
Cai, C. J., Geng, F. H., Tie, X. X., Yu, Q., Peng, L., and Zhou, G. Q.: Characteristics of ambient volatile organic compounds (VOCs) measured in Shanghai, China, Sensors, 10, 7843–7862, https://doi.org/10.3390/s100807843, 2010.
Cao, G., Zhang, X., Gong, S., and Zheng, F.: Investigation on emission factors of particulate matter and gaseous pollutants from crop residue burning, J. Environ. Sci., 20, 50–55, https://doi.org/10.1016/S1001-0742(08)60007-8, 2008.
Carter, W. P. L.: Development of Ozone Reactivity Scales for Volatile Organic Compounds, J. Air Waste Manage. Assoc., 44, 881–899, https://doi.org/10.1080/1073161X.1994.10467290, 1994.
Carter, W. P. L.: Updated Maximum Incremental Reactivity Scale and Hydrocarbon Bin Reactivities for Regulatory Applications, available at: https://intra.engr.ucr.edu/~carter/SAPRC/ (last access: 27 November 2020), 2010.
Chan, L. Y., Chu, K. W., Zou, S. C., Chan, C. Y., Wang, X. M., Barletta, B., Blake, D. R., Guo, H., and Tsai, W. Y.: Characteristics of nonmethane hydrocarbons (NMHCs) in industrial, industrial-urban, and industrial-suburban atmospheres of the Pearl River Delta (PRD) region of south China, J. Geophys. Res.-Atmos., 111, 1–9, https://doi.org/10.1029/2005JD006481, 2006.
Chen, J., Li, C., Ristovski, Z., Milic, A., Gu, Y., Islam, M. S., Wang, S., Hao, J., Zhang, H., He, C., Guo, H., Fu, H., Miljevic, B., Morawska, L., Thai, P., LAM, Y. F., Pereira, G., Ding, A., Huang, X., and Dumka, U. C.: A review of biomass burning: Emissions and impacts on air quality, health and climate in China, Sci. Total Environ., 579, 1000–1034, https://doi.org/10.1016/j.scitotenv.2016.11.025, 2017.
Chen, P., Quan, J., Zhang, Q., Tie, X., Gao, Y., Li, X., and Huang, M.: Measurements of vertical and horizontal distributions of ozone over Beijing from 2007 to 2010, Atmos. Environ., 74, 37–44, https://doi.org/10.1016/j.atmosenv.2013.03.026, 2013.
Cheng, H. R., Guo, H., Saunders, S. M., Lam, S. H. M., Jiang, F., Wang, X. M., Simpson, I. J., Blake, D. R., Louie, P. K. K., and Wang, T. J.: Assessing photochemical ozone formation in the Pearl River Delta with a photochemical trajectory model, Atmos. Environ., 44, 4199–4208, https://doi.org/10.1016/j.atmosenv.2010.07.019, 2010.
Choi, J., Park, R. J., Lee, H., Lee, S., Jo, D. S., Jeong, J. I., Henze, D. K., Woo, J., Ban, S., Lee, M., Lim, C., Park, M., Shin, H. J., Cho, S., Peterson, D., and Song, C.: Impacts of local vs. trans-boundary emissions from different sectors on PM2.5 exposure in South Korea during the KORUS-AQ campaign, Atmos. Environ., 203, 196–205, https://doi.org/10.1016/j.atmosenv.2019.02.008, 2019.
Conner, T. L., Lonneman, W. A., and Seila, R. L.: Transportation-related volatile hydrocarbon source profiles measured in Atlanta, J. Air Waste Manage., 45, 383–394, https://doi.org/10.1080/10473289.1995.10467370, 1995.
Di Carlo, P., Brune, W. H., Martinez, M., Harder, H., Lesher, R., Ren, X., Thornberry, T., Carroll, M. A., Young, V., Shepson, P. B., Riemer, D., Apel, E., and Campbell, C.: Missing OH Reactivity in a Forest: Evidence for Unknown Reactive Biogenic VOCs, Science, 304, 722–725, https://doi.org/10.1126/science.1094392, 2004.
Dickerson, R. R., Kondragunta, S., Stenchikov, G., Civerolo, K. L., Doddridge, B. G., and Holben, B. N.: The Impact of Aerosols on Solar Ultraviolet Radiation and Photochemical Smog, Science, 278, 827–830, https://doi.org/10.1126/science.278.5339.827, 1997.
Dickerson, R. R., Li, C., Li, Z., Marufu, L. T., Stehr, J. W., Mcclure, B., Krotkov, N., Chen, H., Wang, P., Xia, X., Ban, X., Gong, F., Yuan, J., and Yang, J.: Aircraft observations of dust and pollutants over northeast China?: Insight into the meteorological mechanisms of transport, J. Geophys. Res., 112, 1–13, https://doi.org/10.1029/2007JD008999, 2007.
Ding, A. J., Wang, T., Thouret, V., Cammas, J.-P., and Nédélec, P.: Tropospheric ozone climatology over Beijing: analysis of aircraft data from the MOZAIC program, Atmos. Chem. Phys., 8, 1–13, https://doi.org/10.5194/acp-8-1-2008, 2008.
Environmental Protection Agency – Integrated Risk Information System: Benzene?, CASRN 71-43-2, US EPA National Center for Environmental Assessment, 2003.
Fan, H., Zhao, C., and Yang, Y.: A comprehensive analysis of the spatio-temporal variation of urban air pollution in China during 2014–2018, Atmos. Environ., 220, 117066, https://doi.org/10.1016/j.atmosenv.2019.117066, 2020.
Feng, T., Bei, N., Huang, R. J., Cao, J., Zhang, Q., Zhou, W., Tie, X., Liu, S., Zhang, T., Su, X., Lei, W., Molina, L. T., and Li, G.: Summertime ozone formation in Xi'an and surrounding areas, China, Atmos. Chem. Phys., 16, 4323–4342, https://doi.org/10.5194/acp-16-4323-2016, 2016.
Finlayson-Pitts, B. J. and Pitts, J. N.: Chemistry of the Upper and Lower Atmosphere, Academic Press, San Diego, CA, 1999.
Fraser, M. P., Cass, G. R., and Simoneit, B. R. T.: Gas-phase and particle-phase organic compounds emitted from motor vehicle traffic in a Los Angeles roadway tunnel, Environ. Sci. Technol., 32, 2051–2060, https://doi.org/10.1021/es970916e, 1998.
Gaubert, B., Emmons, L. K., Raeder, K., Tilmes, S., Miyazaki, K., Arellano Jr., A. F., Elguindi, N., Granier, C., Tang, W., Barré, J., Worden, H. M., Buchholz, R. R., Edwards, D. P., Franke, P., Anderson, J. L., Saunois, M., Schroeder, J., Woo, J.-H., Simpson, I. J., Blake, D. R., Meinardi, S., Wennberg, P. O., Crounse, J., Teng, A., Kim, M., Dickerson, R. R., He, H., and Ren, X.: Correcting model biases of CO in East Asia: impact on oxidant distributions during KORUS-AQ, Atmos. Chem. Phys. Discuss., https://doi.org/10.5194/acp-2020-599, in review, 2020.
Geng, F., Zhang, Q., Tie, X., Huang, M., Ma, X., and Deng, Z.: Aircraft measurements of O3, NOx, CO, VOCs, and SO2 in the Yangtze River Delta region, Atmos. Environ., 43, 584–593, https://doi.org/10.1016/j.atmosenv.2008.10.021, 2009.
Gilman, J. B., Lerner, B. M., Kuster, W. C., and De Gouw, J. A.: Source signature of volatile organic compounds from oil and natural gas operations in northeastern Colorado, Environ. Sci. Technol., 47, 1297–1305, https://doi.org/10.1021/es304119a, 2013.
Goldan, P. D., Parrish, D. D., Kuster, W. C., Trainer, M., McKeen, S. A., Holloway, J., Jobson, B. T., Sueper, D. T., and Fehsenfeld, F. C.: Airborne measurements of isoprene, CO, and anthropogenic hydrocarbons and their implications, J. Geophys. Res.-Atmos., 105, 9091–9105, https://doi.org/10.1029/1999JD900429, 2000.
Guo, S., Tan, J., Ma, Y., Yang, F., Yu, Y., and Wang, J.: Characteristics of atmospheric non-methane hydrocarbons during high PM10 episodes and normal days in Foshan, China, Atmos. Res., 101, 701–710, https://doi.org/10.1016/j.atmosres.2011.04.022, 2011.
Guo, S., Hu, M., Zamora, M. L., Peng, J., Shang, D., Zheng, J., Du, Z., Wu, Z., Shao, M., Zeng, L., Molina, M. J., and Zhang, R.: Elucidating severe urban haze formation in China, P. Natl. Acad. Sci. USA, 111, 17373–17378, https://doi.org/10.1073/pnas.1419604111, 2014.
Halliday, H. S., Digangi, J. P., Choi, Y., Diskin, G. S., Pusede, S. E., and Rana, M.: Using Short-Term CO∕CO2 Ratios to Assess Air Mass Differences over the Korean Peninsula during KORUS-AQ, J. Geophys. Res.-Atmos., 124, 10951–10972, https://doi.org/10.1029/2018JD029697, 2019.
Han, S., Kondo, Y., Oshima, N., Takegawa, N., Miyazaki, Y., Hu, M., Lin, P., Deng, Z., Zhao, Y., Sugimoto, N., and Wu, Y.: Temporal variations of elemental carbon in Beijing, J. Geophys. Res.-Atmos., 114, 1–16, https://doi.org/10.1029/2009JD012027, 2009.
Han, S., Yao, Q., Tie, X., Zhang, Y., Zhang, M., Li, P., and Cai, Z.: Analysis of surface and vertical measurements of O3 and its chemical production in the NCP region, China, Atmos. Environ., 241, 117759, https://doi.org/10.1016/j.atmosenv.2020.117759, 2020.
Hatakeyama, S., Takami, A., Wang, W., and Tang, D.: Aerial observation of air pollutants and aerosols over Bo Hai, China, Atmos. Environ., 39, 5893–5898, https://doi.org/10.1016/j.atmosenv.2005.06.025, 2005.
He, H., Li, C., Loughner, C. P., Li, Z., Krotkov, N. A., Yang, K., Wang, L., Zheng, Y., Bao, X., Zhao, G., and Dickerson, R. R.: SO2 over central China: Measurements, numerical simulations and the tropospheric sulfur budget, J. Geophys. Res., 117, 1–15, https://doi.org/10.1029/2011JD016473, 2012.
Hembeck, L., He, H., Vinciguerra, T. P., Canty, T. P., Dickerson, R. R., Salawitch, R. J., and Loughner, C. P.: Measured and modeled ozone photochemical production in the Baltimore-Washington Airshed, Atmos. Environ., 2, 100017, https://doi.org/10.1016/j.aeaoa.2019.100017, 2019.
Ho, K. F., Lee, S. C., Guo, H., and Tsai, W. Y.: Seasonal and diurnal variations of volatile organic compounds (VOCs) in the atmosphere of Hong Kong, Sci. Total Environ., 322, 155–166, https://doi.org/10.1016/j.scitotenv.2003.10.004, 2004.
Huang, M., Carmichael, G. R., Crawford, J. H., Wisthaler, A., Zhan, X., Hain, C. R., Lee, P., and Guenther, A. B.: Biogenic isoprene emissions driven by regional weather predictions using different initialization methods: case studies during the SEAC4RS and DISCOVER-AQ airborne campaigns, Geosci. Model Dev., 10, 3085–3104, https://doi.org/10.5194/gmd-10-3085-2017, 2017.
Huang, X., Wang, T., Talbot, R., Xie, M., Mao, H., Li, S., Zhuang, B., Yang, X., Fu, C., Zhu, J., Huang, X., and Xu, R.: Temporal characteristics of atmospheric CO2 in urban Nanjing, China, Atmos. Res., 153, 437–450, https://doi.org/10.1016/j.atmosres.2014.09.007, 2015.
Inomata, Y., Iwasaka, Y., Osada, K., Hayashi, M., Mori, I., Kido, M., Hara, K., and Sakai, T.: Vertical distributions of particles and sulfur gases (volatile sulfur compounds and SO2) over East Asia: Comparison with two aircraft-borne measurements under the Asian continental outflow in spring and winter, Atmos. Environ., 40, 430–444, https://doi.org/10.1016/j.atmosenv.2005.09.055, 2006.
Jerrett, M., Burnett, R. T., Pope, C. A., Ito, K., Thurston, G., Krewski, D., Shi, Y., Calle, E., and Thun, M.: Long-Term Ozone Exposure and Mortality, New Engl. J. Med., 360, 1085–1095, https://doi.org/10.1056/NEJMoa0803894, 2009.
Jia, C., Mao, X., Huang, T., Liang, X., Wang, Y., Shen, Y., Jiang, W., Wang, H., Bai, Z., Ma, M., Yu, Z., Ma, J., and Gao, H.: Non-methane hydrocarbons (NMHCs) and their contribution to ozone formation potential in a petrochemical industrialized city, Northwest China, Atmos. Res., 169, 225–236, https://doi.org/10.1016/j.atmosres.2015.10.006, 2016.
Jobson, B. T., Berkowitz, C. M., Kuster, W. C., Goldan, P. D., Williams, E. J., Fesenfeld, F. C., Apel, E. C., Karl, T., Lonneman, W. A., and Riemer, D.: Hydrocarbon source signatures in Houston, Texas: Influence of the petrochemical industry, J. Geophys. Res.-Atmos., 109, 1–26, https://doi.org/10.1029/2004JD004887, 2004.
Johnson, D., Utembe, S. R., and Jenkin, M. E.: Simulating the detailed chemical composition of secondary organic aerosol formed on a regional scale during the TORCH 2003 campaign in the southern UK, Atmos. Chem. Phys., 6, 419–431, https://doi.org/10.5194/acp-6-419-2006, 2006.
Kelley, P., Dickerson, R. R., Luke, T., and Kok, G. L.: Rate of NO2 photolysis from the surface to 7.6 km altitude in clear-sky and clouds, Geophys. Res. Lett., 22, 2621–2624, 1995.
Kirchstetter, T. W., Singer, B. C., Harley, R. A., Kendall, G. R., and Ghan, W.: Impact of oxygenated gasoline use on California light-duty vehicle emissions, Environ. Sci. Technol., 30, 661–670, https://doi.org/10.1021/es950406p, 1996.
Kleinman, L.: A comparative study of ozone production in five U.S. metropolitan areas, J. Geophys. Res., 110, D02301, https://doi.org/10.1029/2004JD005096, 2005a.
Kleinman, L.: The dependence of tropospheric ozone production rate on ozone precursors, Atmos. Environ., 39, 575–586, https://doi.org/10.1016/j.atmosenv.2004.08.047, 2005b.
KORUS-AQ Science Team: KORUS-AQ Airborne Mission, NASA, https://doi.org/10.5067/Suborbital/KORUSAQ/DATA01, 2018
Krotkov, N. A., McLinden, C. A., Li, C., Lamsal, L. N., Celarier, E. A., Marchenko, S. V., Swartz, W. H., Bucsela, E. J., Joiner, J., Duncan, B. N., Boersma, K. F., Veefkind, J. P., Levelt, P. F., Fioletov, V. E., Dickerson, R. R., He, H., Lu, Z., and Streets, D. G.: Aura OMI observations of regional SO2 and NO2 pollution changes from 2005 to 2015, Atmos. Chem. Phys., 16, 4605–4629, https://doi.org/10.5194/acp-16-4605-2016, 2016.
Lai, C. H., Chang, C. C., Wang, C. H., Shao, M., Zhang, Y., and Wang, J. L.: Emissions of liquefied petroleum gas (LPG) from motor vehicles, Atmos. Environ., 43, 1456–1463, https://doi.org/10.1016/j.atmosenv.2008.11.045, 2009.
Lan, Q., Zhang, L., Li, G., Vermeulen, R., Weinberg, R. S., Dosemeci, M., Rappaport, S. M., Shen, M., Alter, B. P., Wu, Y., Kopp, W., Waidyanatha, S., Rabkin, C., Guo, W., Chanock, S., Hayes, R. B., Linet, M., Kim, S., Yin, S., Rothman, N., and Smith, M. T.: Hematotoxicity in Workers Exposed to Low Levels of Benzene, Science, 306, 1774–1776, https://doi.org/10.1126/science.1102443, 2004.
Li, B., Ho, S. S. H., Gong, S., Ni, J., Li, H., Han, L., Yang, Y., Qi, Y., and Zhao, D.: Characterization of VOCs and their related atmospheric processes in a central Chinese city during severe ozone pollution periods, Atmos. Chem. Phys., 19, 617–638, https://doi.org/10.5194/acp-19-617-2019, 2019.
Li, C., Krotkov, N. A., Dickerson, R. R., Li, Z., Yang, K., and Chin, M.: Transport and evolution of a pollution plume from northern China: A satellite-based case study, J. Geophys. Res., 115, D00K03, https://doi.org/10.1029/2009JD012245, 2010.
Li, C., McLinden, C., Fioletov, V., Krotkov, N., Carn, S., Joiner, J., Streets, D., He, H., Ren, X., Li, Z., and Dickerson, R. R.: India Is Overtaking China as the World's Largest Emitter of Anthropogenic Sulfur Dioxide, Sci. Rep.-UK, 7, 14304, https://doi.org/10.1038/s41598-017-14639-8, 2017.
Li, G., Wei, W., Shao, X., Nie, L., Wang, H., Yan, X., and Zhang, R.: A comprehensive classification method for VOC emission sources to tackle air pollution based on VOC species reactivity and emission amounts, J. Environ. Sci., 67, 78–88, https://doi.org/10.1016/j.jes.2017.08.003, 2018.
Li, L., Xie, S., Zeng, L., Wu, R., and Li, J.: Characteristics of volatile organic compounds and their role in ground-level ozone formation in the Beijing–Tianjin–Hebei region, China, Atmos. Environ., 113, 247–254, https://doi.org/10.1016/j.atmosenv.2015.05.021, 2015.
Li, L. Y., Chen, Y., and Xie, S. D.: Spatio-temporal variation of biogenic volatile organic compounds emissions in China, Environ. Pollut., 182, 157–168, https://doi.org/10.1016/j.envpol.2013.06.042, 2013.
Liang, X., Chen, X., Zhang, J., Shi, T., Sun, X., Fan, L., Wang, L., and Ye, D.: Reactivity-based industrial volatile organic compounds emission inventory and its implications for ozone control strategies in China, Atmos. Environ., 162, 115–126, https://doi.org/10.1016/j.atmosenv.2017.04.036, 2017.
Liu, H., Jacob, D. J., Bey, I., Yantosca, R. M., Duncan, B. N., and Sachse, G. W.: Transport pathways for Asian pollution outflow over the Pacific: Interannual and seasonal variations, J. Geophys. Res.-Atmos., 108, 8786, https://doi.org/10.1029/2002jd003102, 2003.
Liu, J. and Si, W.: Using NDVI and air temperature to monitoring winter-wheat phenology in Xingtai, Hebei, China, in: 2011 Int. Conf. Control. Autom. Syst. Eng. CASE 2011, 30–31 July 2011, Singapore, https://doi.org/10.1109/ICCASE.2011.5997798, 2011.
Liu, Y., Shao, M., Fu, L., Lu, S., Zeng, L., and Tang, D.: Source profiles of volatile organic compounds (VOCs) measured in China: Part I, Atmos. Environ., 42, 6247–6260, https://doi.org/10.1016/j.atmosenv.2008.01.070, 2008a.
Liu, Y., Shao, M., Lu, S., Chang, C.-C., Wang, J.-L., and Chen, G.: Volatile Organic Compound (VOC) measurements in the Pearl River Delta (PRD) region, China, Atmos. Chem. Phys., 8, 1531–1545, https://doi.org/10.5194/acp-8-1531-2008, 2008b.
Long, X., Tie, X., Cao, J., Huang, R., Feng, T., Li, N., Zhao, S., Tian, J., Li, G., and Zhang, Q.: Impact of crop field burning and mountains on heavy haze in the North China Plain: a case study, Atmos. Chem. Phys., 16, 9675–9691, https://doi.org/10.5194/acp-16-9675-2016, 2016.
Ma, M., Gao, Y., Wang, Y., Zhang, S., Leung, L. R., Liu, C., Wang, S., Zhao, B., Chang, X., Su, H., Zhang, T., Sheng, L., Yao, X., and Gao, H.: Substantial ozone enhancement over the North China Plain from increased biogenic emissions due to heat waves and land cover in summer 2017, Atmos. Chem. Phys., 19, 12195–12207, https://doi.org/10.5194/acp-19-12195-2019, 2019.
Mazzuca, G. M., Ren, X., Loughner, C. P., Estes, M., Crawford, J. H., Pickering, K. E., Weinheimer, A. J., and Dickerson, R. R.: Ozone production and its sensitivity to NOx and VOCs: results from the DISCOVER-AQ field experiment, Houston 2013, Atmos. Chem. Phys., 16, 14463–14474, https://doi.org/10.5194/acp-16-14463-2016, 2016.
McGaughey, G. R., Desai, N. R., Allen, D. T., Seila, R. L., Lonneman, W. A., Fraser, M. P., Harley, R. A., Pollack, A. K., Ivy, J. M., and Price, J. H.: Analysis of motor vehicle emissions in a Houston tunnel during the Texas Air Quality Study 2000, Atmos. Environ., 38, 3363–3372, https://doi.org/10.1016/j.atmosenv.2004.03.006, 2004.
Mo, Z., Shao, M., Lu, S., Qu, H., Zhou, M., Sun, J., and Gou, B.: Process-specific emission characteristics of volatile organic compounds (VOCs) from petrochemical facilities in the Yangtze River Delta, China, Sci. Total Environ., 533, 422–431, https://doi.org/10.1016/j.scitotenv.2015.06.089, 2015.
Mo, Z., Shao, M., Wang, W., Liu, Y., Wang, M., and Lu, S.: Evaluation of biogenic isoprene emissions and their contribution to ozone formation by ground-based measurements in Beijing, China, Sci. Total Environ., 627, 1485–1494, https://doi.org/10.1016/j.scitotenv.2018.01.336, 2018.
Monod, A., Sive, B. C., Avino, P., Chen, T., Blake, D. R., and Sherwood Rowland, F.: Monoaromatic compounds in ambient air of various cities: A focus on correlations between the xylenes and ethylbenzene, Atmos. Environ., 35, 135–149, https://doi.org/10.1016/S1352-2310(00)00274-0, 2001.
Moreira Dos Santos, C. Y., De Almeida Azevedo, D., and De Aquino Neto, F. R.: Atmospheric distribution of organic compounds from urban areas near a coal-fired power station, Atmos. Environ., 38, 1247–1257, https://doi.org/10.1016/j.atmosenv.2003.11.026, 2004.
Neuman, J. A., Nowak, J. B., Zheng, W., Flocke, F., Ryerson, T. B., Trainer, M., Holloway, J. S., Parrish, D. D., Frost, G. J., Peischl, J., Atlas, E. L., Bahreini, R., Wollny, A. G., and Fehsenfeld, F. C.: Relationship between photochemical ozone production and NOx oxidation in Houston, Texas, J. Geophys. Res., 114, D00F08, https://doi.org/10.1029/2008JD011688, 2009.
Parrish, D. D., Trainer, M., Young, V., Goldan, P. D., Kuster, W. C., Jobson, B. T., Fehsenfeld, F. C., Lonneman, W. A., Zika, R. D., Farmer, C. T., Riemer, D. D., and Rodgers, M. O.: Internal consistency tests for evaluation of measurements of anthropogenic hydrocarbons in the troposphere, J. Geophys. Res.-Atmos., 103, 22339–22359, https://doi.org/10.1029/98JD01364, 1998.
Perry, R. and Gee, I. L.: Vehicle emissions in relation to fuel composition, Sci. Total Environ., 169, 149–156, https://doi.org/10.1016/0048-9697(95)04643-F, 1995.
Peterson, D. A., Hyer, E. J., Han, S. O., Crawford, J. H., Park, R. J., Holz, R., Kuehn, R. E., Eloranta, E., Knote, C., Jordan, C. E., and Lefer, B. L.: Meteorology influencing springtime air quality, pollution transport, and visibility in Korea, Elementa, 7, 57, https://doi.org/10.1525/elementa.395, 2019.
Pusede, S. E., Gentner, D. R., Wooldridge, P. J., Browne, E. C., Rollins, A. W., Min, K.-E., Russell, A. R., Thomas, J., Zhang, L., Brune, W. H., Henry, S. B., DiGangi, J. P., Keutsch, F. N., Harrold, S. A., Thornton, J. A., Beaver, M. R., St. Clair, J. M., Wennberg, P. O., Sanders, J., Ren, X., VandenBoer, T. C., Markovic, M. Z., Guha, A., Weber, R., Goldstein, A. H., and Cohen, R. C.: On the temperature dependence of organic reactivity, nitrogen oxides, ozone production, and the impact of emission controls in San Joaquin Valley, California, Atmos. Chem. Phys., 14, 3373–3395, https://doi.org/10.5194/acp-14-3373-2014, 2014.
Ran, L., Zhao, C. S., Xu, W. Y., Lu, X. Q., Han, M., Lin, W. L., Yan, P., Xu, X. B., Deng, Z. Z., Ma, N., Liu, P. F., Yu, J., Liang, W. D., and Chen, L. L.: VOC reactivity and its effect on ozone production during the HaChi summer campaign, Atmos. Chem. Phys., 11, 4657–4667, https://doi.org/10.5194/acp-11-4657-2011, 2011.
Reich, P. B. and Amundson, R. G.: Ambient levels of ozone reduce net photosynthesis in tree and crop species, Science, 230, 566–570, https://doi.org/10.1126/science.230.4725.566, 1985.
Ren, X., Salmon, O. E., Hansford, J. R., Ahn, D., Hall, D., Benish, S. E., Stratton, P. R., He, H., Sahu, S., Grimes, C., Heimburger, A. M. F., Martin, C. R., Cohen, M. D., Stunder, B., Salawitch, R. J., Ehrman, S. H., Shepson, P. B., and Dickerson, R. R.: Methane Emissions from the Baltimore–Washington Area Based on Airborne Observations: Comparison to Emissions Inventories, J. Geophys. Res.-Atmos., 123, 8869–8882, https://doi.org/10.1029/2018JD028851, 2018.
Rogak, S. N., Pott, U., Dann, T., and Wang, D.: Gaseous Emissions from Vehicles in a Traffic Tunnel in Vancouver, British Columbia, J. Air Waste Manage., 48, 604–615, https://doi.org/10.1080/10473289.1998.10463713, 1998.
Russo, R. S., Zhou, Y., White, M. L., Mao, H., Talbot, R., and Sive, B. C.: Multi-year (2004–2008) record of nonmethane hydrocarbons and halocarbons in New England: seasonal variations and regional sources, Atmos. Chem. Phys., 10, 4909–4929, https://doi.org/10.5194/acp-10-4909-2010, 2010.
Sagebiel, J. C., Zielinska, B., Pierson, W. R., and Gertler, A. W.: Real-world emissions and calculated reactivities of organic species from motor vehicles, Atmos. Environ., 30, 2287–2296, https://doi.org/10.1016/1352-2310(95)00117-4, 1996.
Seinfeld, J. H. and Pandis, S. N.: Atmospheric Chemsitry and Physics, 2nd edn., John Wiley & Sons, Inc., New Jersey, 2006.
Shao, M., Zhang, Y., Zeng, L., Tang, X., Zhang, J., Zhong, L., and Wang, B.: Ground-level ozone in the Pearl River Delta and the roles of VOC and NOx in its production, J. Environ. Manage., 90, 512–518, https://doi.org/10.1016/j.jenvman.2007.12.008, 2009.
Si, Y., Wang, H., Cai, K., Chen, L., Zhou, Z., and Li, S.: Long-term (2006–2015) variations and relations of multiple atmospheric pollutants based on multi-remote sensing data over the North China Plain, Environ. Pollut., 255, 113323, https://doi.org/10.1016/j.envpol.2019.113323, 2019.
Sillman, S., Logan, A., and Wofsy, C.: The Sensitivity of Ozone to Nitrogen Oxides and Hydrocarbons in Regional Ozone Episodes, J. Geophys. Res., 95, 1837–1851, 1990.
Silva, S. J., Arellano, A. F., and Worden, H. M.: Toward anthropogenic combustion emission constraints from space-based analysis of urban CO2∕CO sensitivity, Geophys. Res. Lett., 40, 4971–4976, https://doi.org/10.1002/grl.50954, 2013.
Souri, A. H., Nowlan, C. R., González Abad, G., Zhu, L., Blake, D. R., Fried, A., Weinheimer, A. J., Wisthaler, A., Woo, J.-H., Zhang, Q., Chan Miller, C. E., Liu, X., and Chance, K.: An inversion of NOx and non-methane volatile organic compound (NMVOC) emissions using satellite observations during the KORUS-AQ campaign and implications for surface ozone over East Asia, Atmos. Chem. Phys., 20, 9837–9854, https://doi.org/10.5194/acp-20-9837-2020, 2020.
Stavrakou, T., Müller, J., Bauwens, M., De Smedt, I., Lerot, C., and Van Roozendael, M.: Substantial Underestimation of Post-Harvest Burning Emissions in the North China Plain Revealed by Multi-Species Space Observations, Scient. Rep., 6, 32307, https://doi.org/10.1038/srep32307, 2016.
Stroud, C. A., Morneau, G., Makar, P. A., Moran, M. D., Gong, W., Pabla, B., Zhang, J., Bouchet, V. S., Fox, D., Venkatesh, S., Wang, D., and Dann, T.: OH-reactivity of volatile organic compounds at urban and rural sites across Canada: Evaluation of air quality model predictions using speciated VOC measurements, Atmos. Environ., 42, 7746–7756, https://doi.org/10.1016/j.atmosenv.2008.05.054, 2008.
Tang, G., Wang, Y., Li, X., Ji, D., Hsu, S., and Gao, X.: Spatial-temporal variations in surface ozone in Northern China as observed during 2009–2010 and possible implications for future air quality control strategies, Atmos. Chem. Phys., 12, 2757–2776, https://doi.org/10.5194/acp-12-2757-2012, 2012.
Tang, J. H., Chan, L. Y., Chan, C. Y., Li, Y. S., Chang, C. C., Liu, S. C., Wu, D., and Li, Y. D.: Characteristics and diurnal variations of NMHCs at urban, suburban, and rural sites in the Pearl River Delta and a remote site in South China, Atmos. Environ., 41, 8620–8632, https://doi.org/10.1016/j.atmosenv.2007.07.029, 2007.
Tang, J. H., Chan, L. Y., Chang, C. C., Liu, S., and Li, Y. S.: Characteristics and sources of non-methane hydrocarbons in background atmospheres of eastern, southwestern, and southern China, J. Geophys. Res.-Atmos., 114, D03304, https://doi.org/10.1029/2008JD010333, 2009.
Tang, W., Arellano, A. F., DiGangi, J. P., Choi, Y., Diskin, G. S., Agustí-Panareda, A., Parrington, M., Massart, S., Gaubert, B., Lee, Y., Kim, D., Jung, J., Hong, J., Hong, J.-W., Kanaya, Y., Lee, M., Stauffer, R. M., Thompson, A. M., Flynn, J. H., and Woo, J.-H.: Evaluating high-resolution forecasts of atmospheric CO and y from a global prediction system during KORUS-AQ field campaign, Atmos. Chem. Phys., 18, 11007–11030, https://doi.org/10.5194/acp-18-11007-2018, 2018.
Tang, W., Worden, H. M., Deeter, M. N., Edwards, D. P., Emmons, L. K., Martínez-Alonso, S., Gaubert, B., Buchholz, R. R., Diskin, G. S., Dickerson, R. R., Ren, X., He, H., and Kondo, Y.: Assessing Measurements of Pollution in the Troposphere (MOPITT) carbon monoxide retrievals over urban versus non-urban regions, Atmos. Meas. Tech., 13, 1337–1356, https://doi.org/10.5194/amt-13-1337-2020, 2020.
Tsai, W. Y., Chan, L. Y., Blake, D. R., and Chu, K. W.: Vehicular fuel composition and atmospheric emissions in South China: Hong Kong, Macau, Guangzhou, and Zhuhai, Atmos. Chem. Phys., 6, 3281–3288, https://doi.org/10.5194/acp-6-3281-2006, 2006.
Velasco, E., Lamb, B., Westberg, H., Allwine, E., Sosa, G., Arriaga-Colina, J. L., Jobson, B. T., Alexander, M. L., Prazeller, P., Knighton, W. B., Rogers, T. M., Grutter, M., Herndon, S. C., Kolb, C. E., Zavala, M., de Foy, B., Volkamer, R., Molina, L. T., and Molina, M. J.: Distribution, magnitudes, reactivities, ratios and diurnal patterns of volatile organic compounds in the Valley of Mexico during the MCMA 2002 & 2003 field campaigns, Atmos. Chem. Phys., 7, 329–353, https://doi.org/10.5194/acp-7-329-2007, 2007.
Wang, B., Shao, M., Lu, S. H., Yuan, B., Zhao, Y., Wang, M., Zhang, S. Q., and Wu, D.: Variation of ambient non-methane hydrocarbons in Beijing city in summer 2008, Atmos. Chem. Phys., 10, 5911–5923, https://doi.org/10.5194/acp-10-5911-2010, 2010.
Wang, F., Li, Z., Ren, X., Jiang, Q., He, H., Dickerson, R. R., Dong, X., and Lv, F.: Vertical distributions of aerosol optical properties during the spring 2016 ARIAs airborne campaign in the North China Plain, Atmos. Chem. Phys., 18, 8995–9010, https://doi.org/10.5194/acp-18-8995-2018, 2018.
Wang, G., Cheng, S., Wei, W., Zhou, Y., Yao, S., and Zhang, H.: Characteristics and source apportionment of VOCs in the suburban area of Beijing, China, Atmos. Pollut. Res., 7, 711–724, https://doi.org/10.1016/j.apr.2016.03.006, 2016.
Wang, M., Shao, M., Lu, S. H., Yang, Y. D., and Chen, W. T.: Evidence of coal combustion contribution to ambient VOCs during winter in Beijing, Chinese Chem. Lett., 24, 829–832, https://doi.org/10.1016/j.cclet.2013.05.029, 2013.
Wang, Q., Han, Z., Wang, T., and Zhang, R.: Impacts of biogenic emissions of VOC and NOx on tropospheric ozone during summertime in eastern China, Sci. Total Environ., 395, 41–49, https://doi.org/10.1016/j.scitotenv.2008.01.059, 2008.
Wang, T., Guo, H., Blake, D. R., Kwok, Y. H., Simpson, I. J., and Li, Y. S.: Measurements of trace gases in the inflow of South China Sea background air and outflow of regional pollution at Tai O, Southern China, J. Atmos. Chem., 52, 295–317, https://doi.org/10.1007/s10874-005-2219-x, 2005.
Wang, W., Ma, J., Hatakeyama, S., Liu, X., Chen, Y., Takami, A., Ren, L., and Geng, C.: Aircraft measurements of vertical ultrafine particles profiles over Northern China coastal areas during dust storms in 2006, Atmos. Environ., 42, 5715–5720, https://doi.org/10.1016/j.atmosenv.2008.03.042, 2008.
Wang, W., Li, X., Shao, M., Hu, M., Zeng, L., Wu, Y., and Tan, T.: The impact of aerosols on photolysis frequencies and ozone production in Beijing during the 4-year period 2012–2015, Atmos. Chem. Phys., 19, 9413–9429, https://doi.org/10.5194/acp-19-9413-2019, 2019.
Wang, Y., Munger, J. W., Xu, S., McElroy, M. B., Hao, J., Nielsen, C. P., and Ma, H.: CO2 and its correlation with CO at a rural site near Beijing: implications for combustion efficiency in China, Atmos. Chem. Phys., 10, 8881–8897, https://doi.org/10.5194/acp-10-8881-2010, 2010.
Wang, Y., Li, Z., Zhang, Y., Du, W., Zhang, F., Tan, H., Xu, H., Fan, T., Jin, X., Fan, X., Dong, Z., Wang, Q., and Sun, Y.: Characterization of aerosol hygroscopicity, mixing state, and CCN activity at a suburban site in the central North China Plain, Atmos. Chem. Phys., 18, 11739–11752, https://doi.org/10.5194/acp-18-11739-2018, 2018.
Wang, Y., Dörner, S., Donner, S., Böhnke, S., De Smedt, I., Dickerson, R. R., Dong, Z., He, H., Li, Z., Li, Z., Li, D., Liu, D., Ren, X., Theys, N., Wang, Y., Wang, Y., Wang, Z., Xu, H., Xu, J., and Wagner, T.: Vertical profiles of NO2, SO2, HONO, HCHO, CHOCHO and aerosols derived from MAX-DOAS measurements at a rural site in the central western North China Plain and their relation to emission sources and effects of regional transport, Atmos. Chem. Phys., 19, 5417–5449, https://doi.org/10.5194/acp-19-5417-2019, 2019.
Warneke, C., McKeen, S. A., de Gouw, J. A., Goldan, P. D., Kuster, W. C., Holloway, J. S., Williams, E. J., Lerner, B. M., Parrish, D. D., Trainer, M., Fehsenfeld, F. C., Kato, S., Atlas, E. L., Baker, A., and Blake, D. R.: Determination of urban volatile organic compound emission ratios and comparison with an emissions database, J. Geophys. Res.-Atmos., 112, D10S47, https://doi.org/10.1029/2006JD007930, 2007.
Watson, J. G., Chow, J. C., and Fujita, E. M.: Review of volatile organic compound source apportionment by chemical mass balance, Atmos. Environ., 35, 1567–1584, https://doi.org/10.1016/S1352-2310(00)00461-1, 2001.
Wolfe, G. M., Marvin, M. R., Roberts, S. J., Travis, K. R., and Liao, J.: The Framework for 0-D Atmospheric Modeling (F0AM) v3.1, Geosci. Model Dev., 9, 3309–3319, https://doi.org/10.5194/gmd-9-3309-2016, 2016.
Wu, J., Bei, N., Hu, B., Liu, S., Wang, Y., Shen, Z., Li, X., Liu, L., Wang, R., Liu, Z., Cao, J., Tie, X., Molina, L. T., and Li, G.: Aerosol–photolysis interaction reduces particulate matter during wintertime haze events, P. Natl. Acad. Sci. USA, 117, 9755–9761, https://doi.org/10.1073/pnas.1916775117, 2020.
Wu, K., Yang, X., Chen, D., Gu, S., Lu, Y., Jiang, Q., Wang, K., Ou, Y., Qian, Y., Shao, P., and Lu, S.: Estimation of biogenic VOC emissions and their corresponding impact on ozone and secondary organic aerosol formation in China, Atmos. Res., 231, 104656, https://doi.org/10.1016/j.atmosres.2019.104656, 2020.
Xia, L., Zhang, G., Liu, L., Li, B., Zhan, M., Kong, P., and Wang, H.: Atmospheric CO2 and CO at Jingdezhen station in central China: Understanding the regional transport and combustion efficiency, Atmos. Environ., 222, 117104, https://doi.org/10.1016/j.atmosenv.2019.117104, 2020.
Xie, X., Shao, M., Liu, Y., Lu, S., Chang, C. C., and Chen, Z. M.: Estimate of initial isoprene contribution to ozone formation potential in Beijing, China, Atmos. Environ., 42, 6000–6010, https://doi.org/10.1016/j.atmosenv.2008.03.035, 2008.
Xue, L., Wang, T., Simpson, I. J., Ding, A., Gao, J., Blake, D. R., Wang, X., Wang, W., Lei, H., and Jin, D.: Vertical distributions of non-methane hydrocarbons and halocarbons in the lower troposphere over northeast China, Atmos. Environ., 45, 6501–6509, https://doi.org/10.1016/j.atmosenv.2011.08.072, 2011.
Xue, L. K., Wang, T., Gao, J., Ding, A. J., Zhou, X. H., Blake, D. R., Wang, X. F., Saunders, S. M., Fan, S. J., Zuo, H. C., Zhang, Q. Z., and Wang, W. X.: Ozone production in four major cities of China: sensitivity to ozone precursors and heterogeneous processes, Atmos. Chem. Phys. Discuss., 13, 27243–27285, https://doi.org/10.5194/acpd-13-27243-2013, 2013.
Xue, Y., Ho, S. S. H., Huang, Y., Li, B., Wang, L., Dai, W., Cao, J., and Lee, S.: Source apportionment of VOCs and their impacts on surface ozone in an industry city of Baoji, Northwestern China, Sci. Rep.-UK, 7, 9979, https://doi.org/10.1038/s41598-017-10631-4, 2017.
Yang, X., Wang, X., Yang, W., Xu, J., Ren, L., He, Y., Liu, B., Bai, Z., Meng, F., and Hu, M.: Aircraft measurements of SO2, NOx, CO, and O3 over the coastal and offshore area of Yellow Sea of China, Environ. Monit. Assess., 188, https://doi.org/10.1007/s10661-016-5533-7, 2016.
Yuan, B., Hu, W. W., Shao, M., Wang, M., Chen, W. T., Lu, S. H., Zeng, L. M., and Hu, M.: VOC emissions, evolutions and contributions to SOA formation at a receptor site in eastern China, Atmos. Chem. Phys., 13, 8815–8832, https://doi.org/10.5194/acp-13-8815-2013, 2013.
Zhang, F., Wang, Y., Peng, J., Chen, L., Sun, Y., Duan, L., Ge, X., Li, Y., Zhao, J., Liu, C., Zhang, X., Zhang, G., Pan, Y., Wang, Y., Zhang, A. L., Ji, Y., Wang, G., Hu, M., Molina, M. J., and Zhang, R.: An unexpected catalyst dominates formation and radiative forcing of regional haze, P. Natl. Acad. Sci. USA, 117, 3960–3966, https://doi.org/10.1073/pnas.1919343117, 2020.
Zhang, Q., Yuan, B., Shao, M., Wang, X., Lu, S., Lu, K., Wang, M., Chen, L., Chang, C.-C., and Liu, S. C.: Variations of ground-level O3 and its precursors in Beijing in summertime between 2005 and 2011, Atmos. Chem. Phys., 14, 6089–6101, https://doi.org/10.5194/acp-14-6089-2014, 2014.
Zhang, Z., Wang, X., Zhang, Y., Lü, S., and Huang, Z.: Ambient air benzene at background sites in China's most developed coastal regions: Exposure levels, source implications and health risks, Sci. Total Environ., 511, 792–800, https://doi.org/10.1016/j.scitotenv.2015.01.003, 2015.
Zheng, J., Shao, M., Che, W., Zhang, L., Zhong, L., Zhang, Y., and Streets, D.: Speciated VOC Emission Inventory and Spatial Patterns of Ozone Formation Potential in the Pearl River Delta, China, Environ. Sci. Technol., 43, 8580–8586, 2009.
Zong, R., Yang, X., Wen, L., Xu, C., Zhu, Y., Chen, T., Yao, L., Wang, L., Zhang, J., Yang, L., Wang, X., Shao, M., Zhu, T., Xue, L., and Wang, W.: Strong ozone production at a rural site in the North China Plain: Mixed effects of urban plumes and biogenic emissions, J. Environ. Sci., 71, 261–270, https://doi.org/10.1016/j.jes.2018.05.003, 2018.
Zou, Y., Deng, X. J., Zhu, D., Gong, D. C., Wang, H., Li, F., Tan, H. B., Deng, T., Mai, B. R., Liu, X. T., and Wang, B. G.: Characteristics of 1 year of observational data of VOCs, NOx and O3 at a suburban site in Guangzhou, China, Atmos. Chem. Phys., 15, 6625–6636, https://doi.org/10.5194/acp-15-6625-2015, 2015.