the Creative Commons Attribution 4.0 License.
the Creative Commons Attribution 4.0 License.
 | 28 Nov 2020
Quantifying bioaerosol concentrations in dust clouds through online UV-LIF and mass spectrometry measurements at the Cape Verde Atmospheric Observatory
Douglas Morrison
Ian Crawford
Nicholas Marsden
Michael Flynn
Katie Read
Luis Neves
Virginia Foot
Paul Kaye
Warren Stanley
David Topping
Martin Gallagher
Observations of the long-range transport of biological particles in the tropics via dust vectors are now seen as fundamental to the understanding of many global atmosphere–ocean biogeochemical cycles, changes in air quality, human health, ecosystem impacts, and climate. However, there is a lack of long-term measurements quantifying their presence in such conditions. Here, we present annual observations of bioaerosol concentrations based on online ultraviolet laser-induced fluorescence (UV-LIF) spectrometry from the World Meteorological Organization – Global Atmospheric Watch (WMO-GAW) Cape Verde Atmospheric Observatory on São Vicente. We observe the expected strong seasonal changes in absolute concentrations of bioaerosols with significant enhancements during winter due to the strong island inflow of air mass, originating from the African continent. Monthly median bioaerosol concentrations as high as 45 L−1 were found with 95th percentile values exceeding 130 L−1 during strong dust events. However, in contrast, the relative fraction of bioaerosol numbers compared to total dust number concentration shows little seasonal variation. Mean bioaerosol contributions accounted for 0.4 ± 0.2 % of total coarse aerosol concentrations, only rarely exceeding 1 % during particularly strong events under appropriate conditions. Although enhancements in the median bioaerosol fraction do occur in winter, they also occur at other times of the year, likely due to the enhanced Aeolian activity driving dust events at this time from different sources. We hypothesise that this indicates the relative contribution of bioaerosol material in dust transported across the tropical Atlantic throughout the year is relatively uniform, comprised mainly of mixtures of dust and bacteria and/or bacterial fragments. We argue that this hypothesis is supported from analysis of measurements also at Cabo Verde just prior to the long-term monitoring experiment where UV-LIF single particle measurements were compared with laser ablation aerosol particle time-of-flight mass spectrometer (LAAP-ToF) measurements. These clearly show a very high correlation between particles with mixed biosilicate mass spectral signatures and UV-LIF biofluorescent signatures suggesting the bioaerosol concentrations are dominated by these mixtures. These observations should assist with constraining bioaerosol concentrations for tropical global climate model (GCM) simulations. Note that here we use the term “bioaerosol” to include mixtures of dust and bacterial material.
- Article
(1482 KB) - Full-text XML
-
Supplement
(519 KB) - BibTeX
- EndNote


Aerosols play a key role in the global climate. Their suspension in the air can scatter incoming solar radiation, reducing the warming effect of the Sun. Rather than scatter light directly, aerosols can also serve as nuclei for cloud droplets, ice crystals and precipitation. This can promote further changes in the climate, with cloud cover increasing local albedo effects. Although most cloud condensation nuclei (CCN) are inorganic, there has been increasing evidence to suggest that biological particles play an important role too. This is because despite existing in relatively low concentrations, bioaerosols are more effective CCN than alternative particle types. Bacteria such as Pseudomonas syringae are thought to promote rainfall (Sands et al., 1982), while strains such as Erwinia carotovora carotovora and Erwinia carotovora atroseptica have been shown to be CCN active, with 25 %–30 % activable at supersaturations larger than 1 % (Franc and DeMott, 1998). Bauer et al. (2003) collected cultivable bacteria from cloud water samples in Austria and found all samples to be activable at supersaturations where insoluble wettable particles of comparable size would not have been. Other biogenic aerosols such as pollen have also been shown to have CCN properties (Pope, 2010). This is also true for fragmented pollen grains, significantly raising the number of potential activation sites (Steiner et al., 2015).
Homogeneous ice nucleation occurs in liquid particles at temperatures of −36 ∘C and below. However, heterogeneous ice nucleation can occur at significantly warmer temperatures, with ice nuclei (IN) reducing the energy required for crystallisation to begin. The effectiveness of IN in this regard depends on their composition, size, surface area and more (Hoose and Möhler, 2012). They also encompass a broad range of particles, including mineral dust, metals, soot, and biological particles. Of these particle types, mineral dust has been one of the most closely investigated, with multiple studies observing a range of conditions at which it can act as effective nuclei. Over the dust belt as outlined by Liu et al. (2008), Zhang et al. (2012) found dust to initiate freezing in midlevel supercooled stratiform clouds (MSSCs) at temperatures of −10 ∘C and below. This is warmer than findings from Ansmann et al. (2008), who did not find evidence of ice formation in supercooled stratiform clouds with cloud-top temperatures warmer than −18 ∘C, but colder than findings by Sassen et al. (2003), who attributed African dust to the glaciation of altocumulus clouds at −5 ∘C.
More recent focus has been placed on biological particles, with many identified as more efficient IN. For example, strains of Pseudomonas syringae have been found to initiate freezing at temperatures as high as −2 ∘C (Yankofsky et al., 1981). They are also capable of influencing clouds across a range of altitudes, with fungal spores as large as 15 µm reaching altitudes of 30 km in a matter of days (Haga et al., 2013). Dispute over bioaerosol's contributions to these meteorological processes focus on their low concentrations, with bioaerosols often accounting for less than 1 % of total particle concentrations. Some estimates are even lower, with Bauer et al. (2002) finding bacterial average mass concentrations accounted for just 0.01 % of organic carbon (OC) in cloud water and precipitation samples. However, in pristine environments, bioaerosol concentrations can be significantly amplified. For example, bioaerosols have been shown to account for 46 % of total coarse aerosol mass concentration in the central Amazon rainforest (Huffman et al., 2012). In these instances, it is thought that bioaerosols are part of a self-sustaining cycle, promoting rainfall that in turn drives vegetative growth (Fröhlich-Nowoisky et al., 2016). Furthermore, Pratt et al. (2009) identified 33 % of the ice crystal residual particles sampled in a wave cloud over Wyoming as biogenic.
Bioaerosols are also capable of global dispersion (McTainsh, 1996). This is because although some are freely suspended in the air, others can utilise mineral dust to act as a vector for their transport. It is perhaps because of this that dust clouds often contain significant concentrations of micro-organisms (Griffin et al., 2001). Furthermore, Yamaguchi et al. (2012) investigated the bacteria's ability to grow and reproduce when attached to dust and found many to remain physiologically active. This can have important implications for cloud formation but also ecological and health impacts too. Asian dust particles and their corresponding microbial concentrations have been found to positively correlate with levels of ice nucleation in snow samples atop Tateyama (Maki et al., 2018). Meanwhile, there is a known association between dust storms and meningitis. Outbreaks often occur in the Sahelian region of northern Africa between February and May, affecting as many as 200 000 individuals annually (Sultan et al., 2005). During this period, conditions are usually dry and dust storms are frequent. Meningitis outbreaks persist up until the wet season begins, when dust events cease (Molesworth et al., 2003).
Trade winds are an important aspect of Aeolian events in Africa, with the point of their convergence known as the Intertropical Convergence Zone (ITCZ). Within this zone, air is made to rise, forming the ascending part of the Hadley cell. The ITCZ is also subject to latitudinal movement, following the progression of the annual solar maximum (Folland et al., 1991). This results in a cycle of atmospheric loading, with dust readily taken to high altitudes during summer. This material is consequently often transported significant distances across the Atlantic, where it is deposited in the ocean along the way. As such, trade winds and dust events can act as major contributors for nutrient deposition. Although the chemical content of what is deposited depends on the source of the dust, most dust particles originate from arid or semi-arid regions and contain large amounts of biogeochemically significant elements. The role of organic components in affecting ocean life is coming under increased scrutiny.
For example, the decline in Caribbean coral reefs has been partially attributed to transatlantic dust events (Rypien, 2008). Aspergillus sydowii is a fungal spore implicated in a Caribbean-wide sea-fan disease that has been cultured from Caribbean air samples. It is believed that dust is acting as a substrate for said spores. With Yamaguchi et al. (2012) having analysed the bacterial community structure for Asian dust particles, it was found that more than 20 bacterial classes were present, with Actinobacteria, Bacilli and Sphingobacteria dominating. These findings are similar to previous studies on African dust (Griffin et al., 2001), suggesting that the diversity of such communities is largely similar across arid regions.
Research has shown how bioaerosols can influence the world around them and has also observed their presence during dust events. However, their concentrations have not been readily quantified in such conditions. This study aimed to capture long-term trends in bioaerosol concentrations within a region of the world where dust events are both common and pronounced.
To do this, online measurements using a wideband integrated bioaerosol sensor (WIBS-4M) were taken for 11 months off the west coast of continental Africa. This was preceded by an intensive campaign that paired another ultraviolet laser-induced fluorescence (UV-LIF) spectrometer known as a WIBS-4A (e.g. Gabey et al., 2010; Savage et al., 2017), with a laser ablation aerosol particle time-of-flight mass spectrometer (LAAP-ToF-MS) (Marsden et al., 2018). The latter was used to provide detailed contemporary particle composition analysis and to identify biosilicate particle classes. This biosilicate classification was then used to validate the WIBS-4A biofluorescent classification schemes, e.g. Ruske et al. (2017), to subsequently interpret the long-term ambient datasets collected by a WIBS-4M at the CVAO site. With an estimated 50 % of global annual dust originating from northern Africa (Engelstaedter et al., 2006), the African continent is a high-priority region that is often overlooked for such studies.
2.1 Site and long-term sampling details
From September 2015 to August 2016, a WIBS-4M was continuously sampling at the Cape Verde Atmospheric Observatory (CVAO), off the west coast of continental Africa (16∘51′49′′ N, 24∘52′02′′ W). The observatory is located 50 m from the coastline and is subject to persistent northeasterly trade winds. During this period, the observatory recorded a mean temperature of 23.3 ∘C and median wind speeds of 6.2 ms−1, which are similar to the long-term trends reported by Carpenter et al. (2010). Given the placement of the observatory on the island, as well as the lack of major coastal features, this site is well suited for observations of unpolluted marine air. Air was drawn vertically down a 10 m stainless steel pipe with an inner diameter of 1 in at a rate of 16.7 L min−1, from which an isokinetic inlet was used to draw a subsample of air at a rate of 0.3 L min−1. The sample line was heated to minimise condensation build up, and a Thermo PM10 inlet was used at the top of the pipe. Meteorological data were recorded atop a 30 m tower located at the observatory, with dominant wind direction recorded as one of 16 compass points. This was funded as part of the Ice in Cloud Experiment – Dust (ICE-D) campaign, which had the aim of taking measurements of Saharan dust concentrations to better understand aerosol–cloud interactions and reduce uncertainty in numerical models. Details of the ICE-D surface experiments and accompanying aircraft sampling campaigns are described by Liu et al. (2018). The WIBS-4M was used to observe long-term trends in bioaerosol concentrations and was regularly calibrated using National Institute of Standards and Technology (NIST) calibration polystyrene latex (PSL) spheres.
2.1.1 Intensive campaign and dust samples
The monitoring component of the project was prefaced by a shorter-term but highly intensive campaign, the results from which are used to inform the interpretation of the long-term data. During the shorter campaign, a WIBS-4A was used alongside a LAAP-ToF (Marsden et al., 2018). Ground-based measurements using the LAAP-ToF and WIBS-4A were conducted over a 20 d period in August 2015 located near Praia International Airport, Cabo Verde (14∘570′ N, 23∘290′ W; 100 m a.s.l.). A full description of the site and experimental setup is provided by Liu et al. (2018) and Marsden et al. (2019), but a brief summary is now given. Ground-based ambient aerosol measurements were made by the LAAP-ToF and WIBS-4A which were installed in the mobile Manchester Aerosol Laboratory, located 1500 m from the airport. Aerosols were sampled via a pumped inlet mounted on a 10 m tower. The total flow down the inlet was 1000 L min−1 and a series of aerosol instruments subsampled isokinetically downstream of a common manifold, which subsampled at 186 L min−1 from the main inlet. The inlet characterisation and losses are described in Liu et al. (2018) and in the associated references. The LAAP-ToF measured aerosol in the size range of 0.5–2.5 µm, whilst the WIBS-4A measured particles in the size range of 0.5–20 µm; however, the nominal cut-off of the inlet system was approximately 10 µm. When considering size measurements, it should be noted that the LAAP-ToF measures a particle's vacuum aerodynamic diameter (Dva), while the WIBS-4A measures a particle's optical diameter (Do). A more detailed description of the WIBS and LAAP-ToF instruments is provided in Sect. 2.2. The sampling tower was located upwind of the main airport terminal and the city of Praia (400 m and 2.5 km, respectively) in the prevailing northeasterly winds so potential contamination sources were minimal. A full analysis and classification of the back-trajectory wind fields during this intensive experiment period was performed by Liu et al. (2018). They reported that dust plumes from the Sahara and Sub-Saharan Africa were more frequently observed after a synoptic shift on 15 August, when winds became more easterly. They also noted that more efficient transport of dust via stronger easterly winds led to larger advected dust loadings with shorter dust transport times. These different dust advection pathways were reflected in different size and compositions of mineral dust recorded by the LAAP-ToF during the intensive experiment (Marsden et al., 2016).
Calibration of the LAAP-ToF was performed with pure hematite samples (Liu et al., 2018), whilst both the WIBS-4A and WIBS-4M were calibrated using NIST latex calibration beads and fluorescent glass beads, e.g. Crawford et al. (2015). It should be emphasised here that the WIBS-4A and 4M are almost identical instruments, with the only differences being the trigger levels and flow rates used. A detailed description of the WIBS-4A can be found in Savage et al. (2017) and of the WIBS-4M in Forde et al. (2019). As such, the fluorescence data for each instrument are comparable, although we acknowledge there can be issues even when comparing measurements from two identical models. An intercomparison of the fluorescent responses between instruments when using the NIST calibration particles help affirm the instrument's similarities. This is the same methodology as has been described by Forde et al. (2019), Savage et al. (2017) and Crawford et al. (2014).
In addition, subsequent to the ambient experiments, Moroccan dust samples, hereby referred to as Moroccan dust, were provided that were collected in the M'Hamid region (29∘51′43′′ N, 6∘09′24′′ W), which is thought to be representative of the dust material often observed in the continental outflow sampled here. These samples were dispersed through the WIBS-4M in a controlled laboratory experiment alongside additional collected samples of illite. Subsets of these samples were gamma irradiated to remove potential storage and transport contaminants. The UV-LIF response of the pure and irradiated samples were intercompared and are described in the results section. Their respective fluorescent properties, as well as size and shape factors were also compared to the intensive and long-term ambient observations. The negative ion spectra of the pure samples were also analysed using the LAAP-ToF in the laboratory for comparison. These sample properties were used to help contextualise the campaign results and the classification scheme used to identify biosilicate particle concentrations.
2.2 Instrumentation
2.2.1 WIBS
Recent developments in UV-LIF technology have allowed real-time detection of bioaerosols, whereby spectral patterns correlate with specific particle characteristics (Huffman et al., 2019). This technology utilises the intrinsic fluorescent properties found within organic molecules, including proteins, co-enzymes, cell wall compounds and certain pigments to differentiate between biological and non-biological particles. Each organic molecule has its own fluorescent emissions that are dependent on the incoming wavelength of the light that excites it. As such, it is possible for UV-LIF technology to discriminate between organic molecules and help to identify the types of aerosols being observed. The WIBS-4M is a three-channel UV-LIF spectrometer that uses Xenon flash lamps to excite particles with either 280 nm (Xe1) or 370 nm (Xe2) light. The resulting emissions from excited fluorophores are then recorded by one of the instrument's two detection channels (De1 and De2), creating a 2×2 matrix. However, with the Xe1 ∕ De1 channel becoming supersaturated from elastically scattered UV light, only the other three resulting channels are considered. These are called Fl 1, 2 and 3, and are the product of Xe1 ∕ De2, Xe2 ∕ De1 and Xe2 ∕ De2, respectively. De1 is sensitive to 310–400 nm UV light, while De2 covers a broader range from 420 to 650 nm.
Common fluorophores considered in particle analysis include the amino acid tryptophan, the co-enzyme NAD(P)H and the vitamin riboflavin. Each fluorophore excites at 280 nm, 270–400 and 450 nm, respectively, and fluoresces at 300–400, 400–600 and 520–565 nm (Hill et al., 2009), (Lakowicz, 2013). The specificity of a biological compound's fluorescent properties enables particles to be classified into one of seven types, depending on whether they exhibit fluorescence in one, two or three channels (Perring et al., 2015). Particle shape and symmetry is also measured through the use of a 635 nm diode laser that is initially involved in triggering the Xenon flash lamps to fire. The forward scattering light from a particle that passes through the laser hits a quadrant scattering detector. By applying a Mie scattering model, the distribution of the light on each quadrant can be used to estimate diameter, as well as an asymmetry factor between 0 and 100 (Gabey et al., 2010). This has been discussed in detail by Kaye et al. (2007), with values of 0 representing perfectly spherical particles and higher asymmetry factors describing more fibrous and linear shapes. When applying this range in the context of our observations, asymmetry factor (AF) values of 10–20 reflect fairly spherical particles, with values of 30 or more beginning to represent ellipsoidal shapes.
2.2.2 LAAP-ToF
In single particle mass spectrometry (SPMS), an online measurement of aerodynamic size and composition is obtained with high temporal resolution. Several instrument designs have been described (Murphy, 2007), but a typical instrument features an aerodynamic lens inlet for particle beam creation and a high-powered UV pulsed laser for laser desorption ionisation (LDI) of single particles arriving in the ion source. Particle composition is analysed by time-of-flight mass spectrometry (ToF-MS).
Optical particle detection is used for the effective temporal alignment of the UV laser pulse with the arrival of a particle in the LDI source region, and the determination of aerodynamic particle diameter by laser velocimetry.
The LAAP-ToF instrument (AeroMegt GmbH) used for this study featured a PM2.5 aerodynamic lens and continuous wave (CW) fibre-coupled optical detection lasers at 532 nm, and LDI was performed by an argon fluoride (ArF) excimer laser (model EX5, GAM Laser Inc.), set to deliver 3–5 mJ per pulse of 193 nm radiation. Bipolar ToF-MS (TofWerks AG) was implemented for compositional analysis of positive and negative ions. As a technique, SPMS is considered qualitative or semi-quantitative. The ablation and ionisation process of particles is incomplete so that competitive ionisation and charge transfer in the vapour plume results in a strong matrix effect (Reinard and Johnston, 2008). In addition, the reported particle number concentration is affected by optical particle detection efficiency and the frequency of particles “missed” by the pulsed UV laser. A full description of how these issues affected the instrument performance in this study can be found in Marsden et al. (2016), which estimates that the instrument was obtaining composition for 1 % of dust particles in the size range of 0.5–2.5 µm.
Despite the limitations in quantitative analysis, the SPMS has proven useful for the online identification of particle composition types, internal mixing state and their temporal trends in terms of particle number concentrations (Pratt and Prather, 2012). This typically proceeds using cluster analysis to differentiate particles classes and peak marker analysis to track changes in internal mixing state. In recent work, Shen et al. (2018) demonstrated the capability of the LAAP-ToF instrument to differentiate particle composition in a continental environment by a combination of cluster analysis and peak marker analysis.
2.3 Data analysis methods
A 9σ threshold was applied when setting fluorescent baselines for each WIBS model to remove weakly fluorescent inorganic particles that could otherwise act as interferents. This is a substantial increase in the threshold used from previously published work but has been shown to significantly reduce the interference from mineral dust while maintaining the concentration of biological content (Savage et al., 2017). As such, all fluorescent particles observed should contain significant amounts of biological material and are subsequently considered to be a bioaerosol. It should be noted that these are not likely to all be single particles but could instead be agglomerates, including biological particles attached to non-biological ones. The minimum cut-off diameter at 50 % detection efficiency (Dp50) for this particular WIBS-4M is 0.8 µm. As such, only particles between 0.8 and 10 µm have been included in the analysis.
Agglomerative hierarchical cluster analysis was performed using Ward linkage with Euclidean distance for the fluorescent particles, using the method described in Crawford et al. (2015). This has been successfully tested in the past when applying a controlled set of fluorescent PSL spheres through the same instrument model (Crawford et al., 2015; Robinson et al., 2013) and has also been shown to accurately capture bioaerosol mixtures within a semi-arid forest (Gosselin et al., 2016). This process begins with individual data points being treated as their own cluster, which are sequentially combined into larger clusters based on the “distance” between data point values. Ward linkage identifies which pair of clusters would yield the minimum increase in total within-cluster variance after merging and consequently merges them next. A Calinski–Harabasz score is then calculated, suggesting an optimum number of clusters. This cluster analysis was performed separately for both the WIBS-4A and WIBS-4M datasets. The transmission efficiency of the inlet as a function of size has also been accounted when considering size distributions for particles up to 10 µm. Inlet penetration as a function of size has also been considered based on the Andersen 321A PM10 inlet (McFarland, 1984).
Analysis of the LAAP-ToF data acquired during the ICE-D intensive campaign has been presented by Marsden et al. (2019), in which the mineralogy and mixing state of north African dust transported to the Cabo Verde islands is described in detail with reference to dust samples collected on the ground from potential source areas in northern Africa. Using a combination of cluster analysis and subcompositional analysis, that work showed that differences in mineralogical composition of ground samples can be detected on a regional scale, whilst variations in internal mixing state are much more localised. In transported dust, however, the mixing state was much less varied, suggesting that local sources become well mixed during transport.
In the present study, we used the compositional classes already identified in the above work by cluster analysis and compared the temporal trends in particle number concentrations with that of the biological particles detected by the WIBS. In addition, we used mass spectra of the previously identified mineral dust class to examine internal mixing of dust with biological material using peak marker analysis. More specifically, biological markers CN- (m∕z 26) and CNO- (m∕z 42) were used to identify those mineral dust particles which had a significant marker of internal mixing with biological material and also compared the temporal trends in those particle number concentrations to the biological particles detected by WIBS.
This approach is similar to that used by Zawadowicz et al. (2019), who examined the biological content of dust particles in North America by comparing temporal trends in particle number of a WIBS with SPMS, in that case the PALMS instrument. However, in our study, we have used different criteria for biomarkers in the mass spectra, using chlorine to normalise the biomarker signals rather than phosphorous. Chlorine is a ubiquitous signal in transported mineral dust and is easily ionised because of its high electro affinity. This reduces the temporal incoherence in biomarker ion signals caused by the matrix effect.
3.1 Long-term observations
A clear seasonal trend for fluorescent and total particle concentrations can be seen in Fig. 1a, with both being highest during winter and lowest in summer. Monthly median bioaerosol concentrations as high as 45 L−1 were found with 95th percentile values exceeding 130 L−1 during strong dust events. Such peaks in concentrations are short lived and regular. Figure 1b suggests that bioaerosols are a minority particle type, with non-fluorescent concentrations consistently dominating particle contributions. The fraction of fluorescent particles compared to total particle concentrations was a mean value of 0.4 ± 0.2 %. The 99th percentile value was a fraction of 1.1 %, with some high-fraction events exceeding 1.5 % in October and May. These will be discussed in greater detail further on. Figure 1c highlights how larger particles are observed during winter. Note that there is no relationship between the total particle concentration and fraction of fluorescent particles (r2=0.02), but a strong correlation exists between fluorescent and non-fluorescent particle concentrations (r2=0.79).

Figure 1Panel (a) represents a box-and-whisker plot of both average fluorescent (red) and total (blue) particle concentrations from 0.8 to 10 µm. Whiskers represent the 5th and 95th percentile values. Boxes represent 14 d average values, with the mean shown as a black dot. Grey dots indicate 15 min data. Panel (b) shows the ratio of fluorescent particle concentrations relative to total particle observations, while panel (c) shows the trend for the effective diameter (Deff) of fluorescent particles.
3.2 Cluster products
Agglomerative hierarchical cluster analysis was performed using Ward linkage with Euclidean distance for all fluorescent particles. A four-cluster solution produced the greatest Calinski–Harabasz score, with information regarding their fluorescence in each channel, size and asymmetry shown in Table 1.
Table 1Characteristics of individual clusters when using a four-cluster solution for exclusively fluorescent particles ± represents 1 standard deviation, calculated using raw, non-zero particle data. AF represents asymmetry factor as given by the WIBS-4M and % reflects the contribution each cluster makes to the total fluorescent particle observations. The “no.” column represents the number of particles classified within a given cluster.
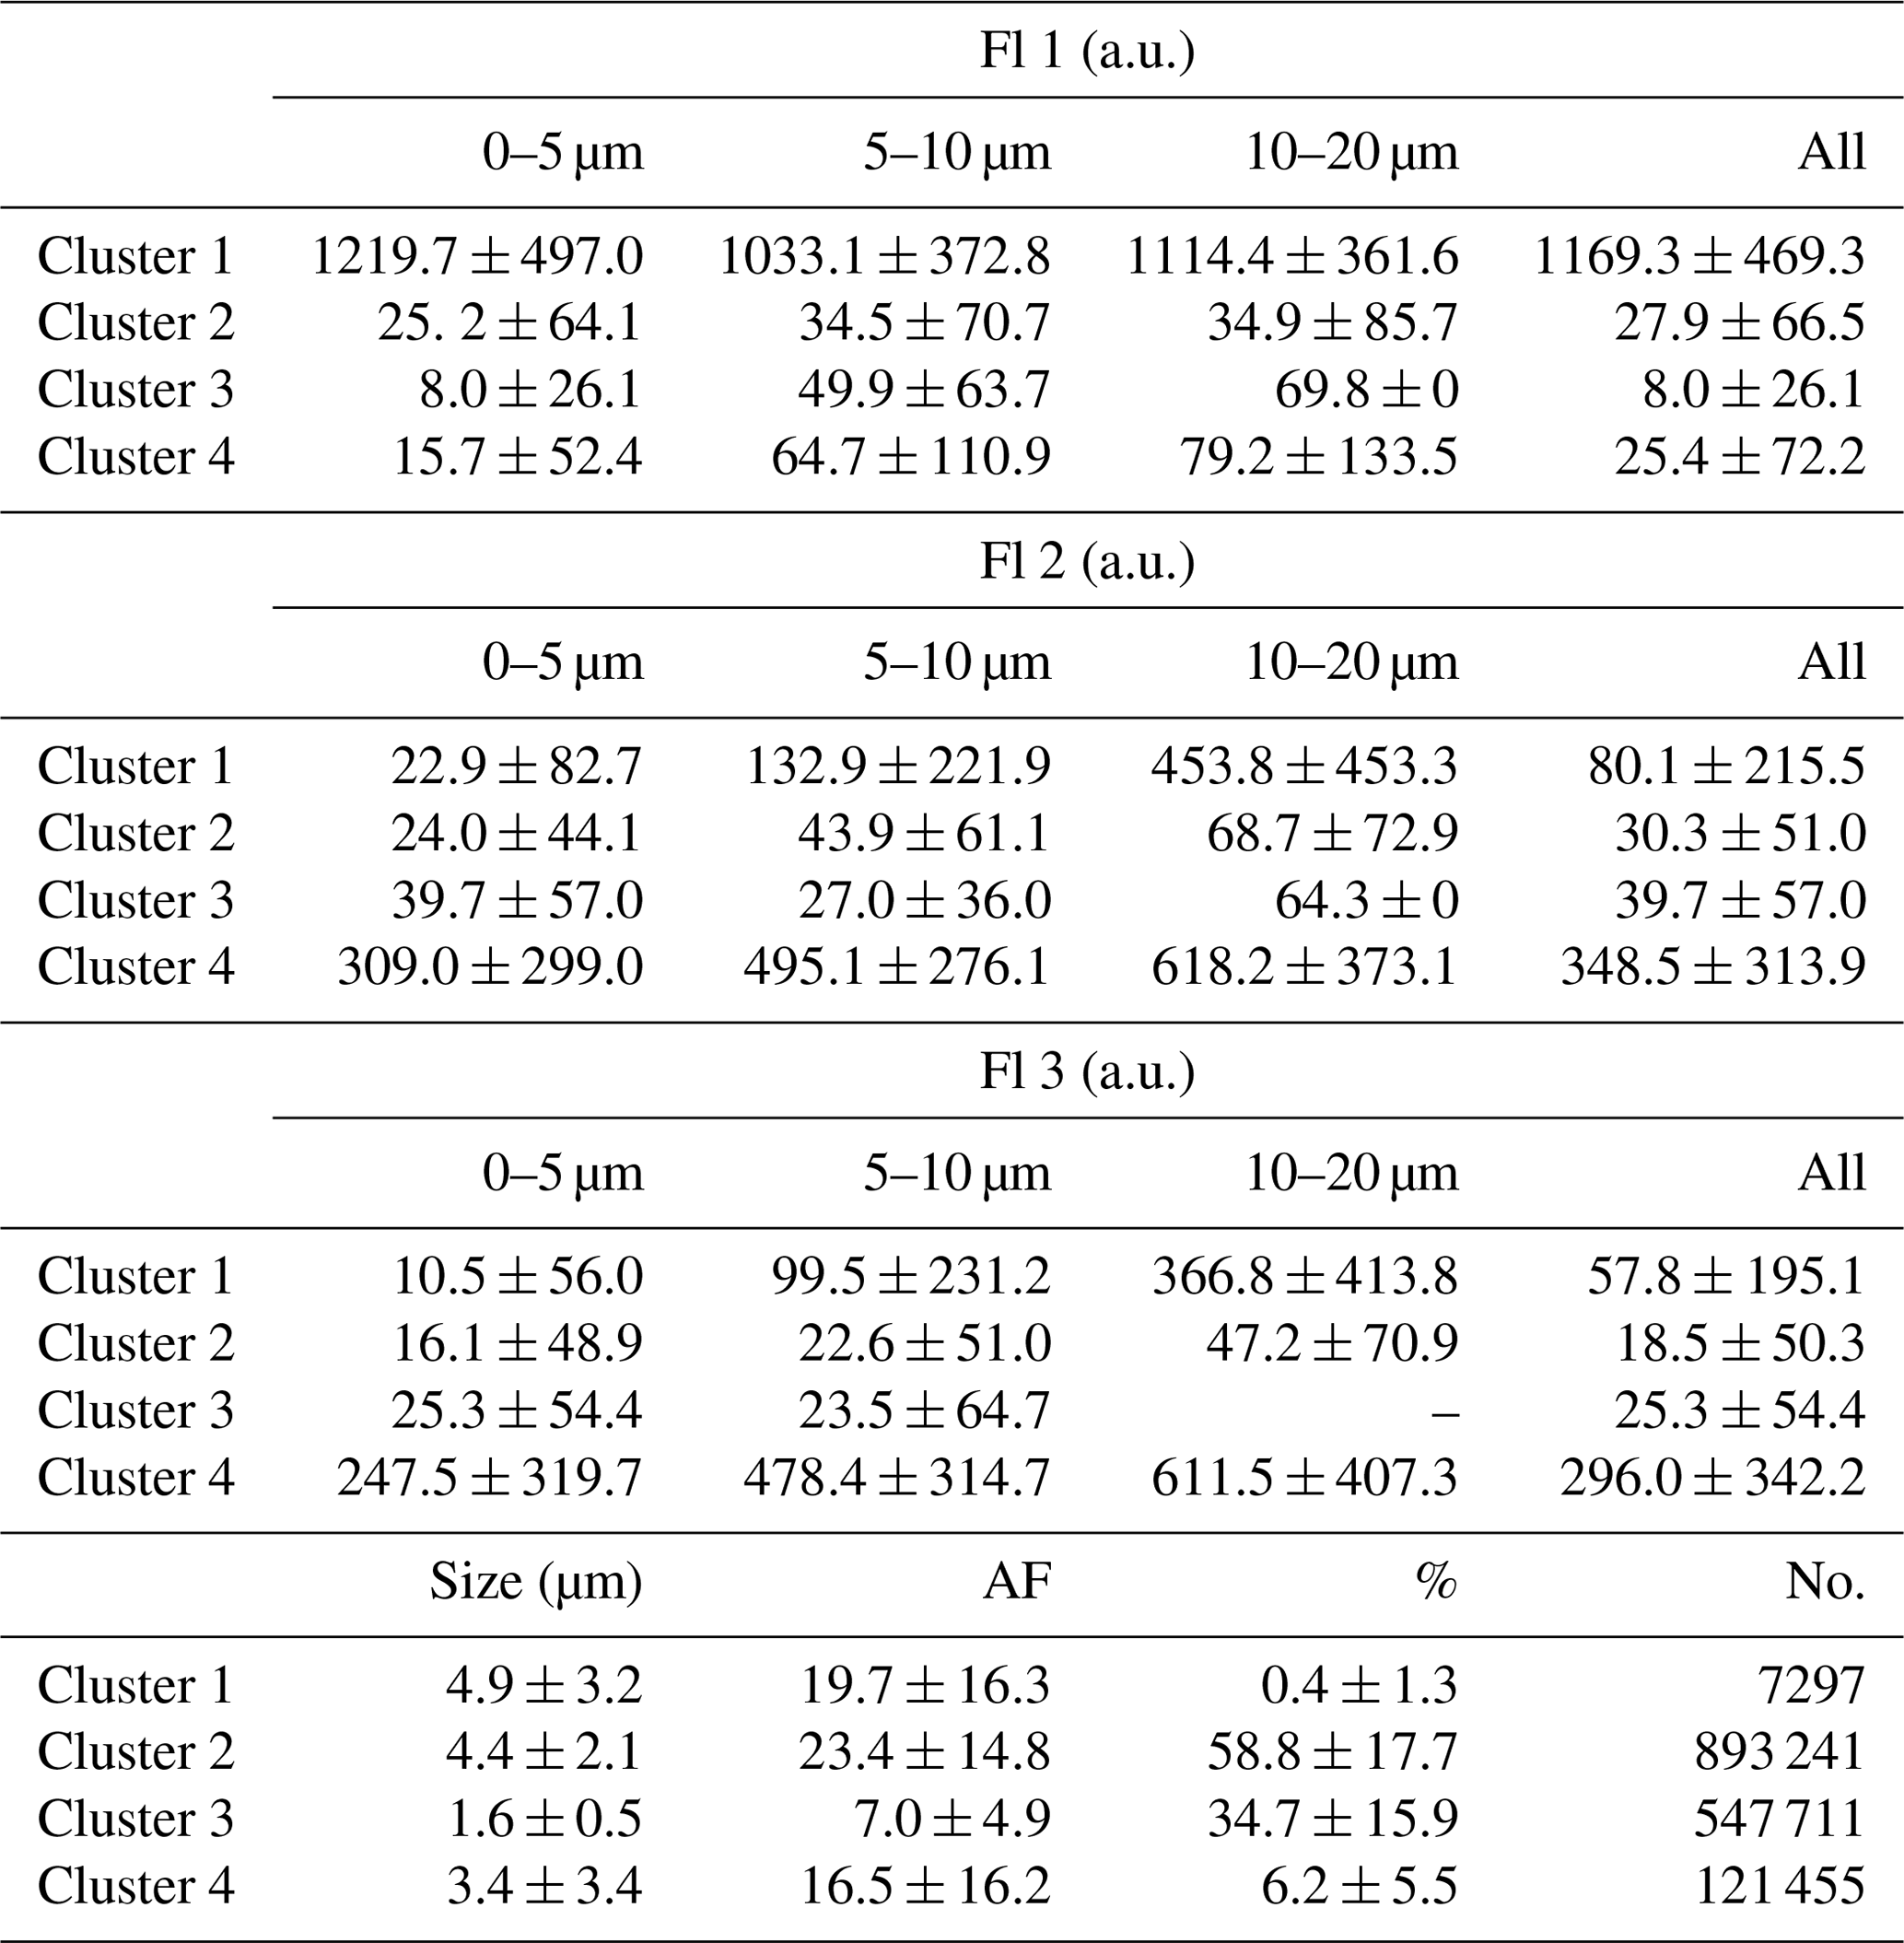
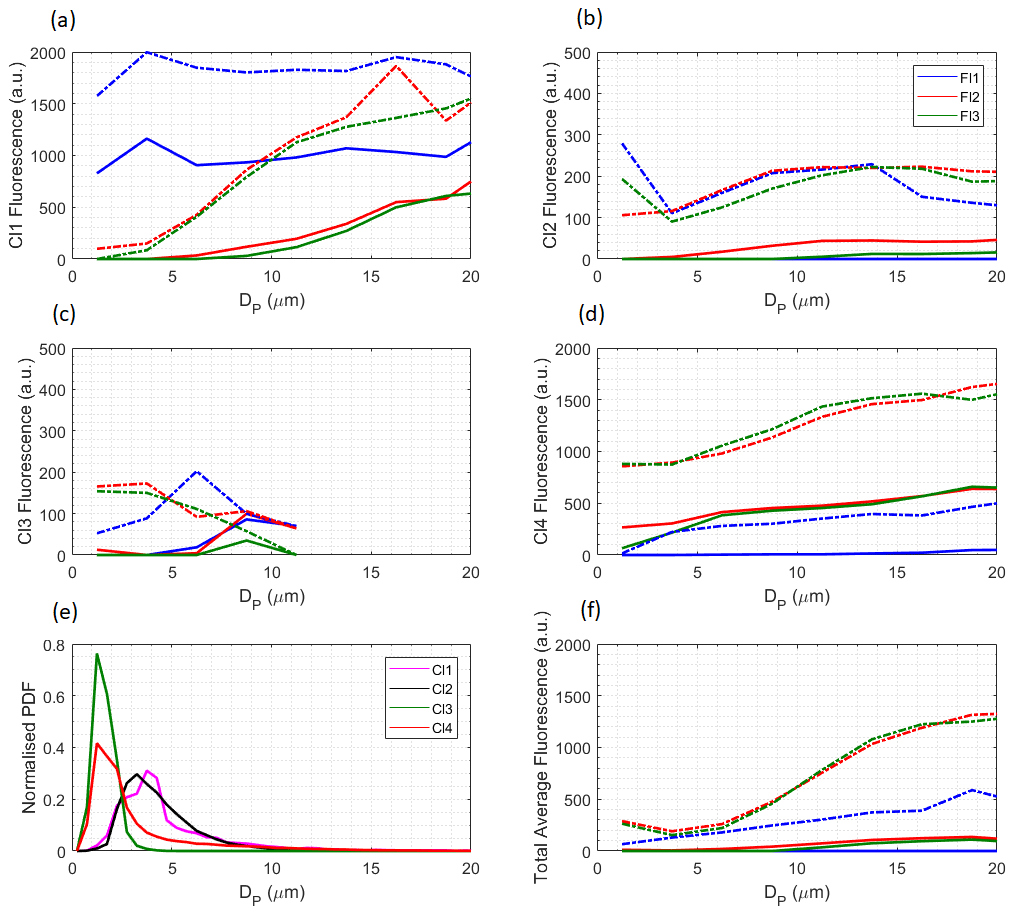
Figure 2Solid lines represent the median fluorescence of particles as a function of size, instrument channel and cluster. Dotted lines represent 95th percentile values. The 2.5 µm bins have been used for all fluorescence traces. Panels (a–d) represent Clusters 1–4, respectively, while panel (e) represents the normalised size distribution of fluorescent particles across all clusters, using 0.5 µm bins. Panel (f) represents the average across all fluorescent particles.

Figure 3The proportion of the total fluorescent material that each cluster contributes over the 11-month monitoring campaign. Values are taken using 1 d integrations of cluster concentrations between 0.8 and 10 µm. Any gaps reflect missing data.
All fluorescent particles seen across the long-term campaign were included in Fig. 2. Fluorescence generally increases with size, but this trend is not equal across all channels and clusters. It is strongest for Clusters 1 and 4, which are also more fluorescent across most size ranges. Figure 2e shows the small size of observed particles, with Clusters 3 and 4 being much smaller than Clusters 1 and 2. Figure 2f shows the median fluorescence in each channel across all fluorescent particles combined.
The relative proportion that each cluster contributes to the total fluorescent concentration shows some variability but no clear trend. This would suggest that Cabo Verde is generally exposed to the same particles year round. Clusters 2 and 3 are clearly the two dominant clusters, accounting for a combined total of approximately 90 % of fluorescent particles. When compared to the average fluorescence values in Fig. 2, these two clusters notably have the weakest fluorescence.
3.3 Back-trajectory analysis
The 120 h back trajectories using National Oceanic and Atmospheric Administration (NOAA)'s Hybrid Single-Particle Lagrangian Integrated Trajectory (HYSPLIT) merged with the Openair package (Carslaw, 2012) were calculated from the observatory, with a starting height set at 10 m. These trajectories were run every 3 h for all 11 months of the campaign, using monthly meteorological data files downloaded from NOAA. Figure 4 captures the enhanced fluorescent particle concentrations seen during periods of continental outflow as compared to Atlantic or coastal back trajectories. Furthermore, it appears that continental trajectories predominantly occur during the same months that the increase in fluorescent and total particles is seen (October–February). Back trajectories were also calculated for periods where the fluorescent fraction was greatest. Particularly high ratio events can be identified during October, May and August in Fig. 1b. These events all show coastal back trajectories, suggesting coastal sites have higher relative biological content.
Fluorescent particle properties were investigated as a function of trajectory direction. Three week-long periods were chosen, where the trajectories were consistently coming from a specific region. These regions were oceanic, coastal and continental. Oceanic regions were defined by trajectories that spent the previous 120 h passing across the Atlantic Ocean, never passing landmass. Coastal regions were defined by northeasterly trajectories passing along the edge of the African continent, and continental regions were described by more easterly trajectories passing through the Sahara. As it was important to have an entire week of trajectories coming from one source, each of these regions was picked out at different times of the year. The continental period took place from 25/01/2016 to 31/01/2016, the coastal from 20/06/2016 to 27/06/2016 and the marine from 20/04/2016 to 26/04/2016. Average fluorescence across the four clusters and three channels has been compared for particles from each region, as shown in Fig. 5. It does not appear that there are significant differences in the fluorescent properties of particles depending on their source region.
3.4 Comparison to laboratory samples
It can be seen in Fig. 6 that all of the dust samples dispersed through the WIBS-4M show relatively weak fluorescence across all three channels but are on average more fluorescent than Clusters 2 and 3. This is particularly true for Moroccan dust in Fl 1. Exposing these samples to gamma irradiation produced little effect, marginally reducing the fluorescent properties of Moroccan dust while increasing the fluorescence of the illite sample. The size and asymmetry values are quite similar across all samples and compare most closely with those of Cluster 2.
3.5 Comparison to ICE-D LAAP-ToF measurements
Analysis of the negative ion spectra revealed that sea-spray aerosol was the dominant aerosol detected at the site by the LAAP-ToF, accounting for approximately 87 % by number. The remainder was comprised of silicate mineral dust (∼ 5 %), calcium chloride (∼ 3 %) and secondary material (∼ 4 %). Cluster analysis of the WIBS-4A data produced a four-cluster solution which was similar to the long-term CVAO cluster solution, featuring two weakly fluorescent dominant clusters and two highly fluorescent, likely primary biological aerosol particle (PBAP) clusters. A number concentration time series of select LAAP-ToF and WIBS-4A data products are shown in Fig. 7, where similarities in the trends of silicate dust and WIBS-4A Cluster 3 can be observed during a dust event (10/08 onwards), suggesting that this cluster may represent a biodust mixture which will now be examined further.
Deeper analysis of the LAAP-ToF silicate dust class was performed to screen for potential biomarkers. Figure 8 shows example negative ion spectra from laboratory samples of bacteria (top panel) and c-means fuzzy cluster products from ICE-D representative of pure dust and dust containing biomarkers (middle and bottom panels, respectively). It can be seen that the biosilicate spectrogram contains silicate m∕z peaks (e.g. SiO2–SiO3) and also bacterial biomarkers (e.g. CN−CNO−) which are not present in the pure dust spectra, suggesting that a subset of the observed dust is mixed with biological material.
The LAAP-ToF silicate dust is then filtered for biomarkers using the ratio of biomarkers to chlorine (CN + CNO ∕ Cl).
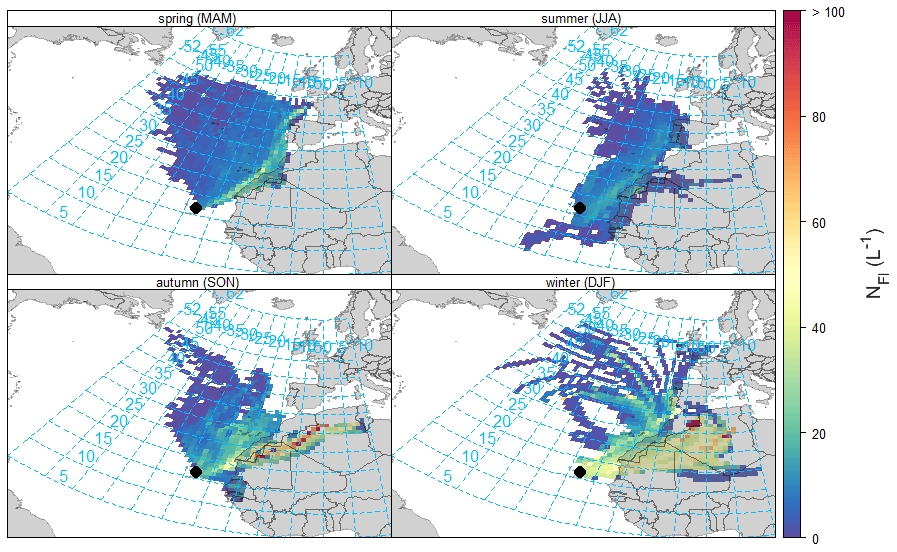
Figure 4The 120 h back-trajectory analysis for fluorescent particle concentrations using HYSPLIT integrated with the Openair package. Note that autumn is using 2015 data, as is the month of December during winter. Spring and summer are using 2016 data. The colour scale has been capped at 100 L−1 for visual purposes and only particles between 0.8 and 10 µm have been included.

Figure 5Mean fluorescence and size properties for each cluster, depending on the pathway of the previous 120 h trajectory. Each region (marine, coastal and continental) have taken 1 week's worth of data, from 20/04/2016 to 26/04/2016, 20/06/2016 to 27/06/2016 and 25/01/2016 to 31/01/2016, respectively. Columns represent Fl channels 1–3, with the final column representing size in µm.
A time series of the LAAP-ToF biosilicate and WIBS-4A Cluster 3 products are shown in Fig. 9. Here, it can be seen that the general trends are in good agreement (r2=0.63). This suggests that the WIBS is sensitive to dust particles which are mixed with bacteria, and that these particles can be segregated from the general fluorescent aerosol population and classified using the cluster analysis method described in Sect. 2.3. There is also a moderate correlation between the WIBS-4A Cluster 3 and pure silicate (r2=0.49) as expected, since the biosilicate will be a subset of the pure silicate. The correlation between Cluster 3 and sea spray is poor (r2=0.20), affirming that our observations of fluorescent particles are genuine and are not being skewed by known interferents.
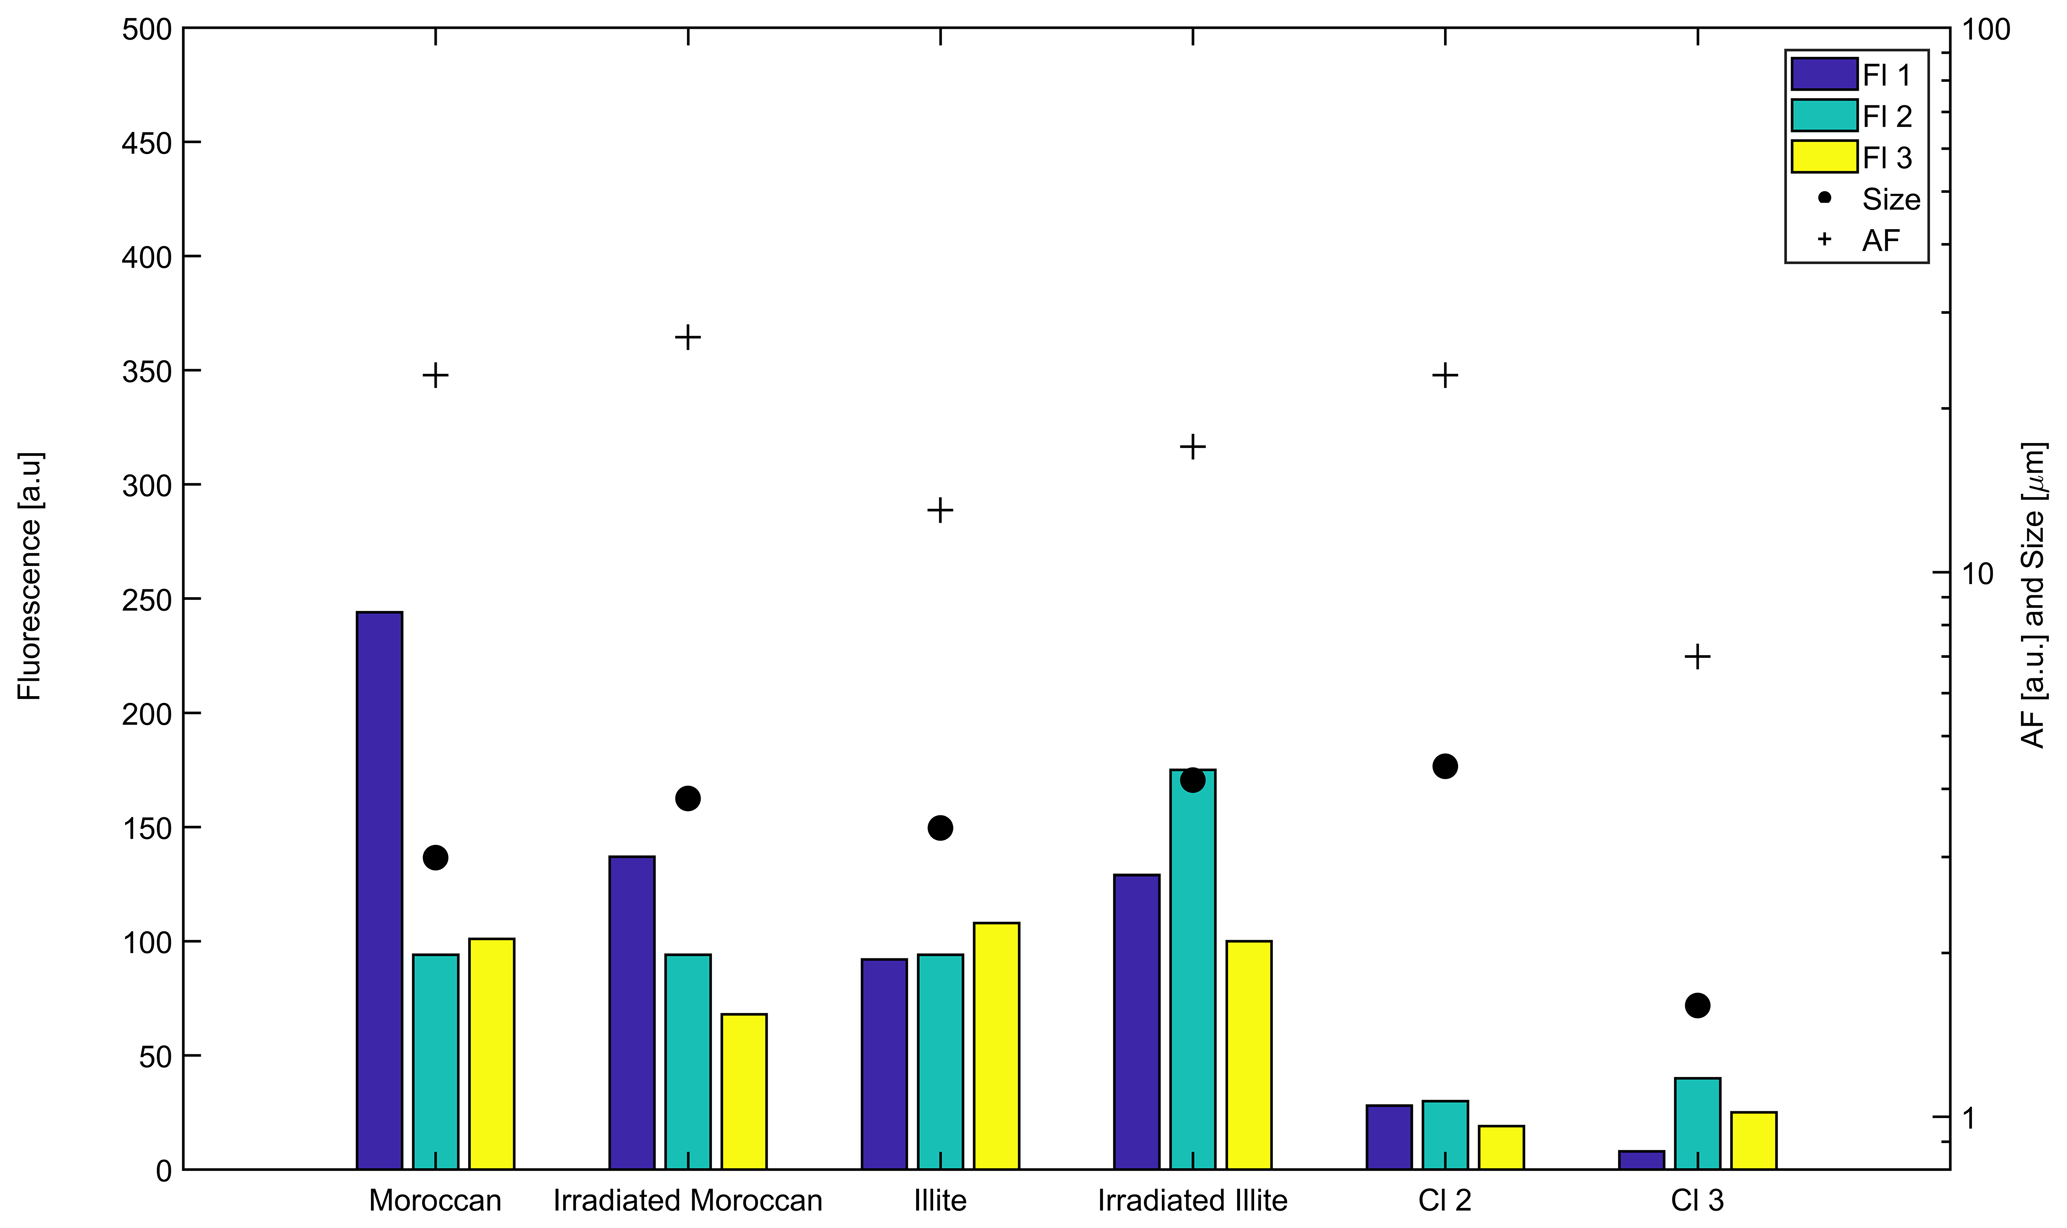
Figure 6Mean fluorescence, size and shape properties of the four dust samples put through the WIBS-4M in a laboratory environment and their comparison to the two dominant long-term campaign clusters – Clusters 2 and 3.
4.1 Long-range transport and trade winds
The identified peaks in particle concentration are consistent with back-trajectory analysis showing the sources to be Saharan. Strong Aeolian generating mechanisms mean that potentially significant concentrations of soil bacteria could have attached themselves to dust particles, which are acting as an agent for their distribution and transport. More specifically, it is likely to be the Harmattan wind that is driving these events. This is a north-easterly trade wind that blows across Africa from approximately November to March, although high concentrations of dust are already present almost all year round (Prospero, 1999). Source regions in Tunisia and northern Algeria have been identified before, as well as dust that has been transported from the Chad Basin in the Bodélé Depression (Herrmann et al., 1999). Such Harmattan dust clouds have often been found to affect the coastal regions of the Gulf of Guinea. These clouds are a major annual event, noted for exacerbating cardiovascular health issues and increasing daily mortality by 8.4 % (Perez et al., 2008). Previous studies by Enete et al. (2012) found this dust to contain high quantities of silicon, which is consistent with the LAAP-ToF results presented here.
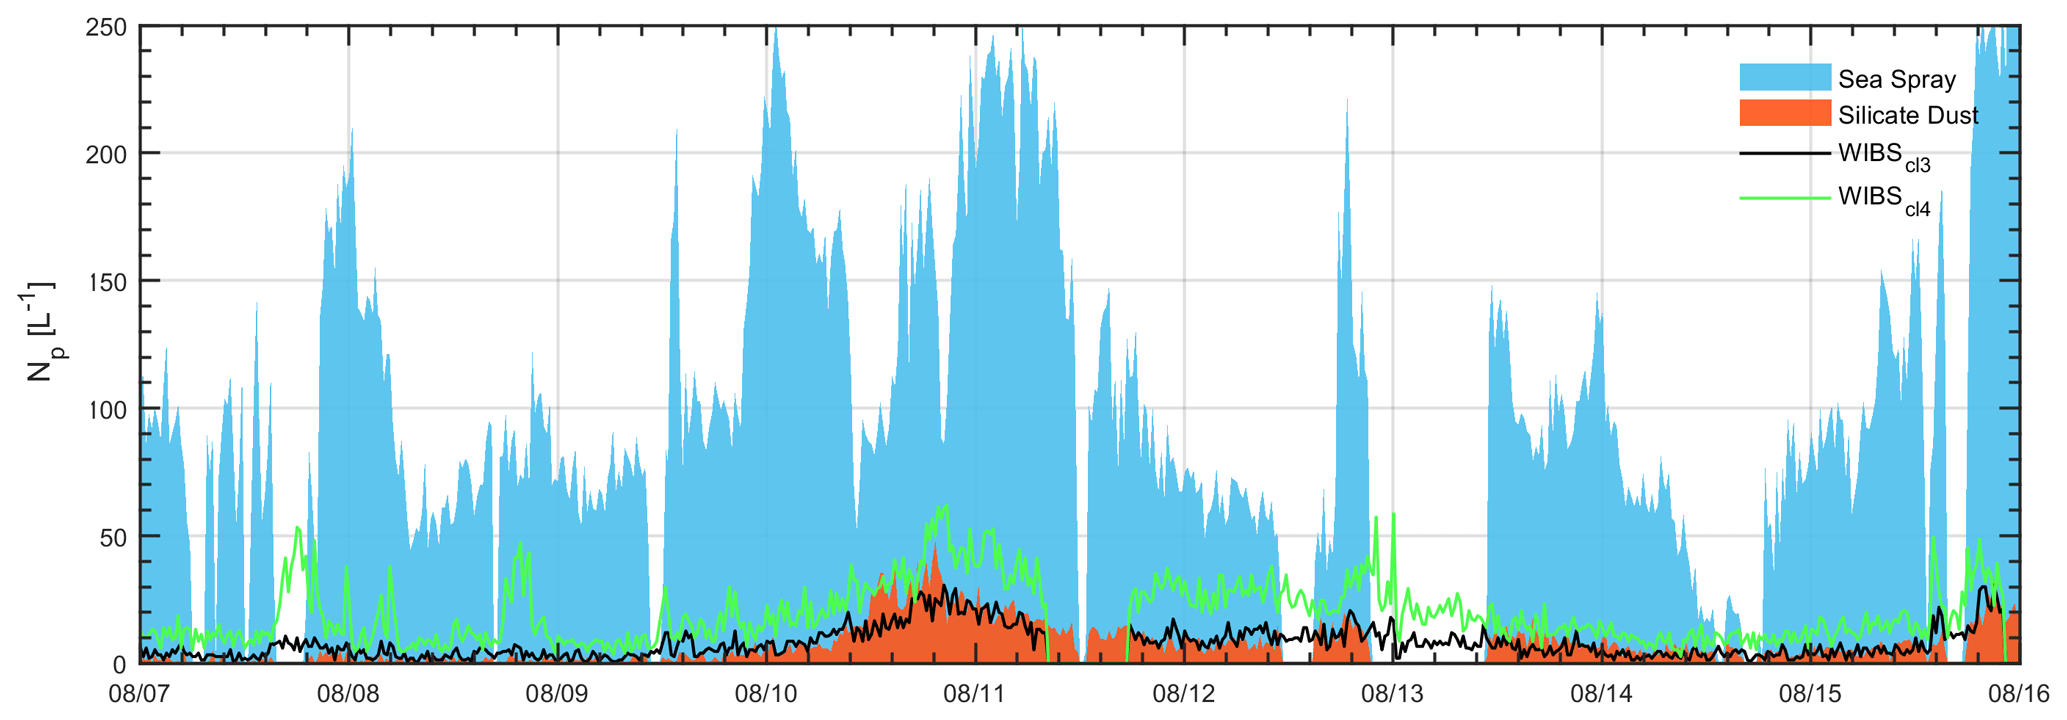
Figure 7Time series of sea spray aerosol and silicate dust particle numbers concentrations determined by LAAP-ToF and WIBS-4A Clusters 3 and 4; 20 min averages have been used here.
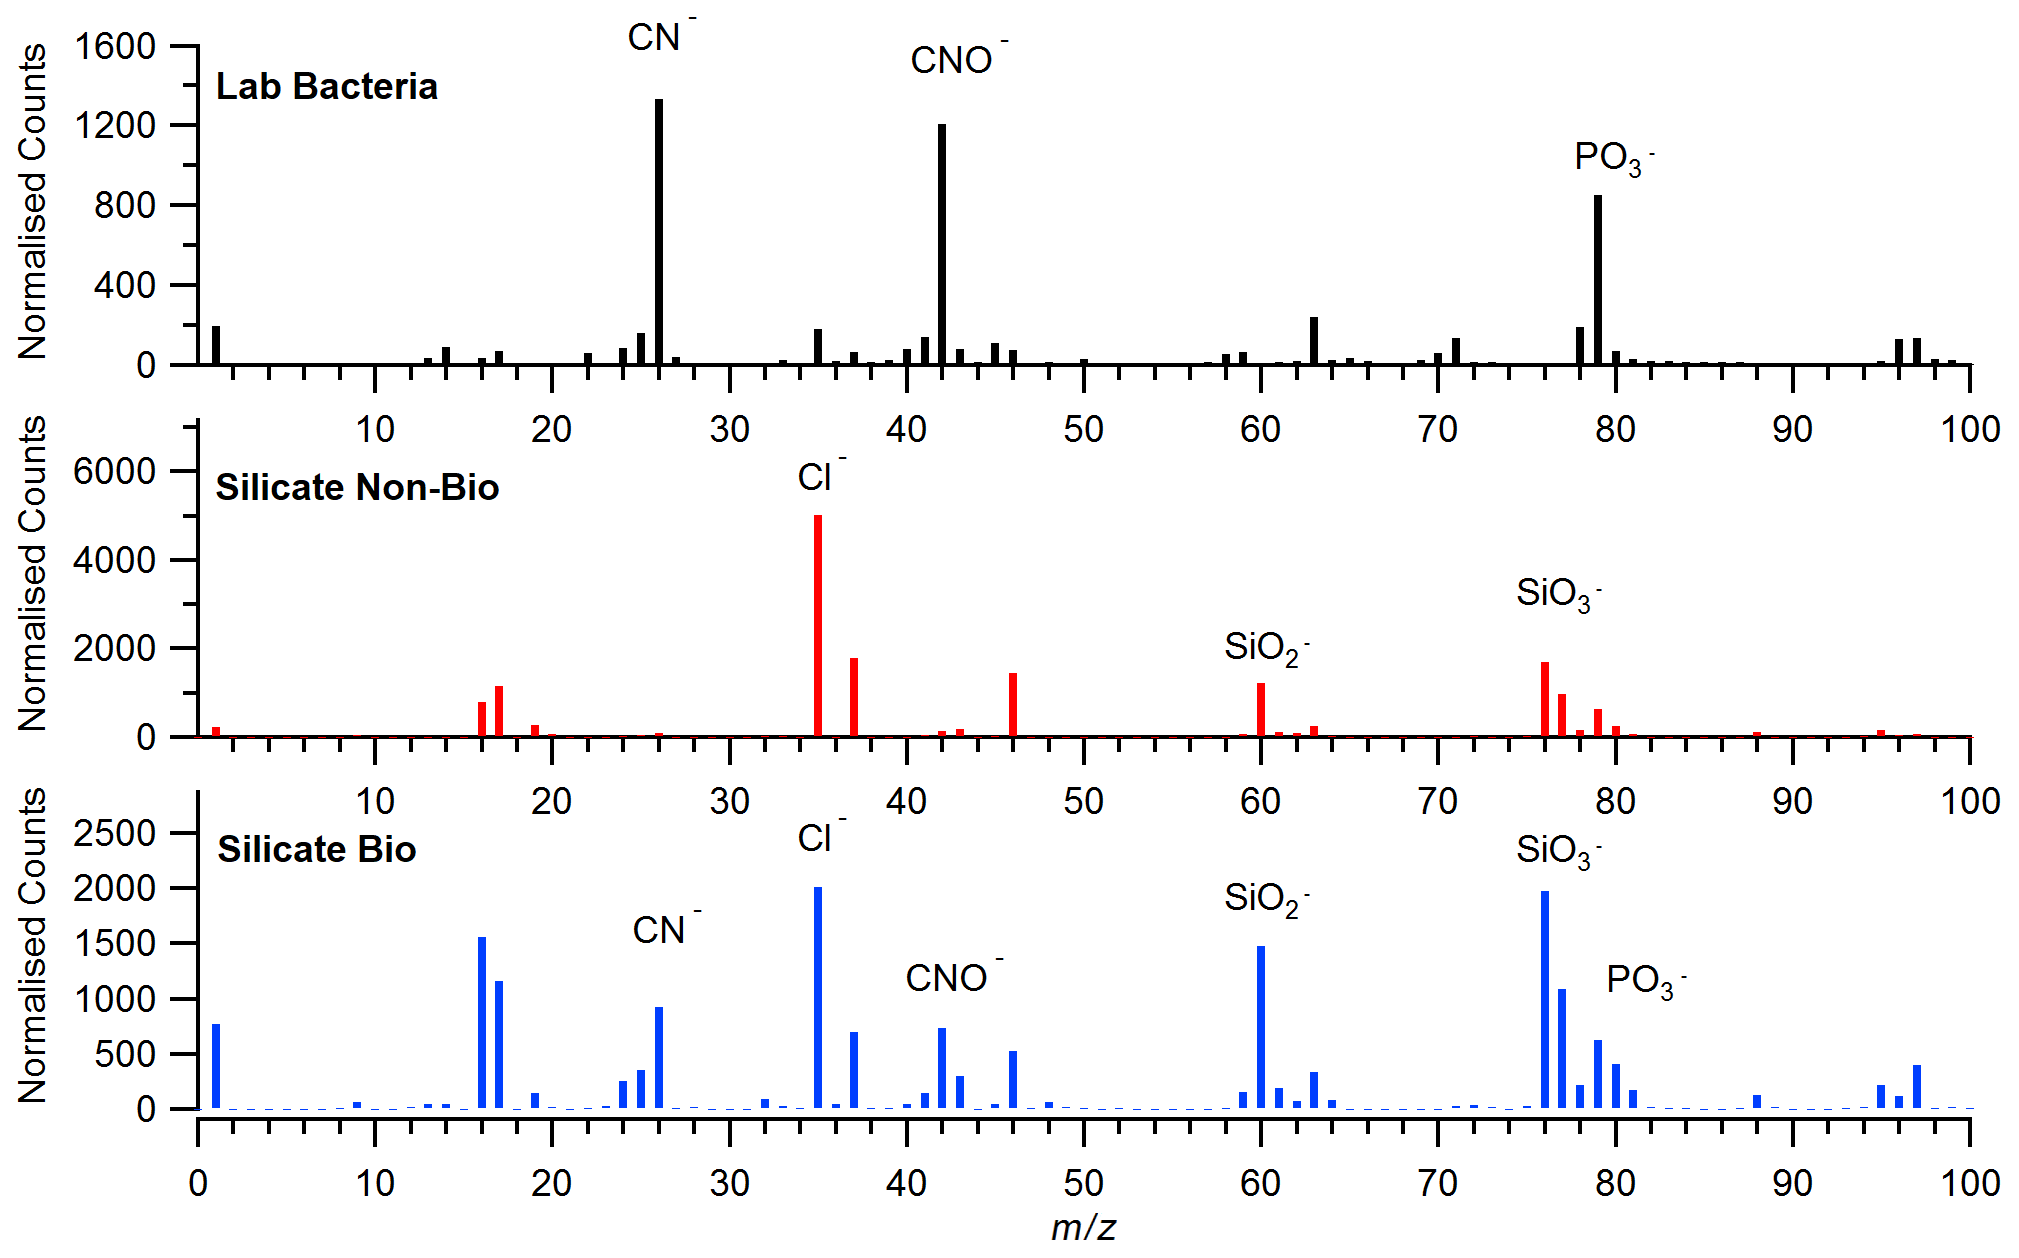
Figure 8Average negative ion spectra of laboratory-generated bacteria and the ICE-D silicate dust products.
It is interesting that continental back trajectories during summer do not contain similar concentrations of fluorescent material, despite a similar fluorescent ratio and wind speeds to those seen in winter. This is likely due to the seasonal shift in the ITCZ, as outlined by Chiapello et al. (1995). During summer, the ITCZ is located between 6 and 10∘ N, and dust gets transported into the Saharan Air Layer (SAL) at a maximum altitude of 7000 m. At this height, there is little opportunity for the dust to mix with trade winds, and it is instead transported significant distances across the Atlantic. However, during winter, the ITCZ shifts south and the dust is no longer able to get taken into the SAL. This constrains the dust into lower altitudes, where they are subject to mixing with trade winds, including the Harmattan wind. Dust consequently gets deposited much sooner and often blankets Cabo Verde. The ecological consequences of this have been investigated by Korte et al. (2017), who placed sediment traps across the Atlantic to measure fluxes in biogenic constituents, including biogenic silica. They observed higher biogenic fluxes during winter, due to Saharan dust getting deposited during the previously discussed trade wind events. They also observed a seasonal maxima of biogenic silica towards the west, suggesting that the bioaerosols we observe are not as readily deposited into the ocean as some other particle types.
It is also interesting to consider potential differences in dust from the various source regions. This has been investigated by Patey et al. (2015), who also monitored dust concentrations at the CVAO. By looking at specific elemental ratios within dust samples, they were able to identify where the dust was thought to have come from, as well as what it was comprised of. They found during summer months that 92.5 % of samples contained a contribution from the Sahel, compared to just 52.3 % of samples collected during winter. These observations are supported by previous work from Prospero and Lamb (2003), who found that it was Sahelian dust that was predominantly transported across the Atlantic via the SAL during summer.
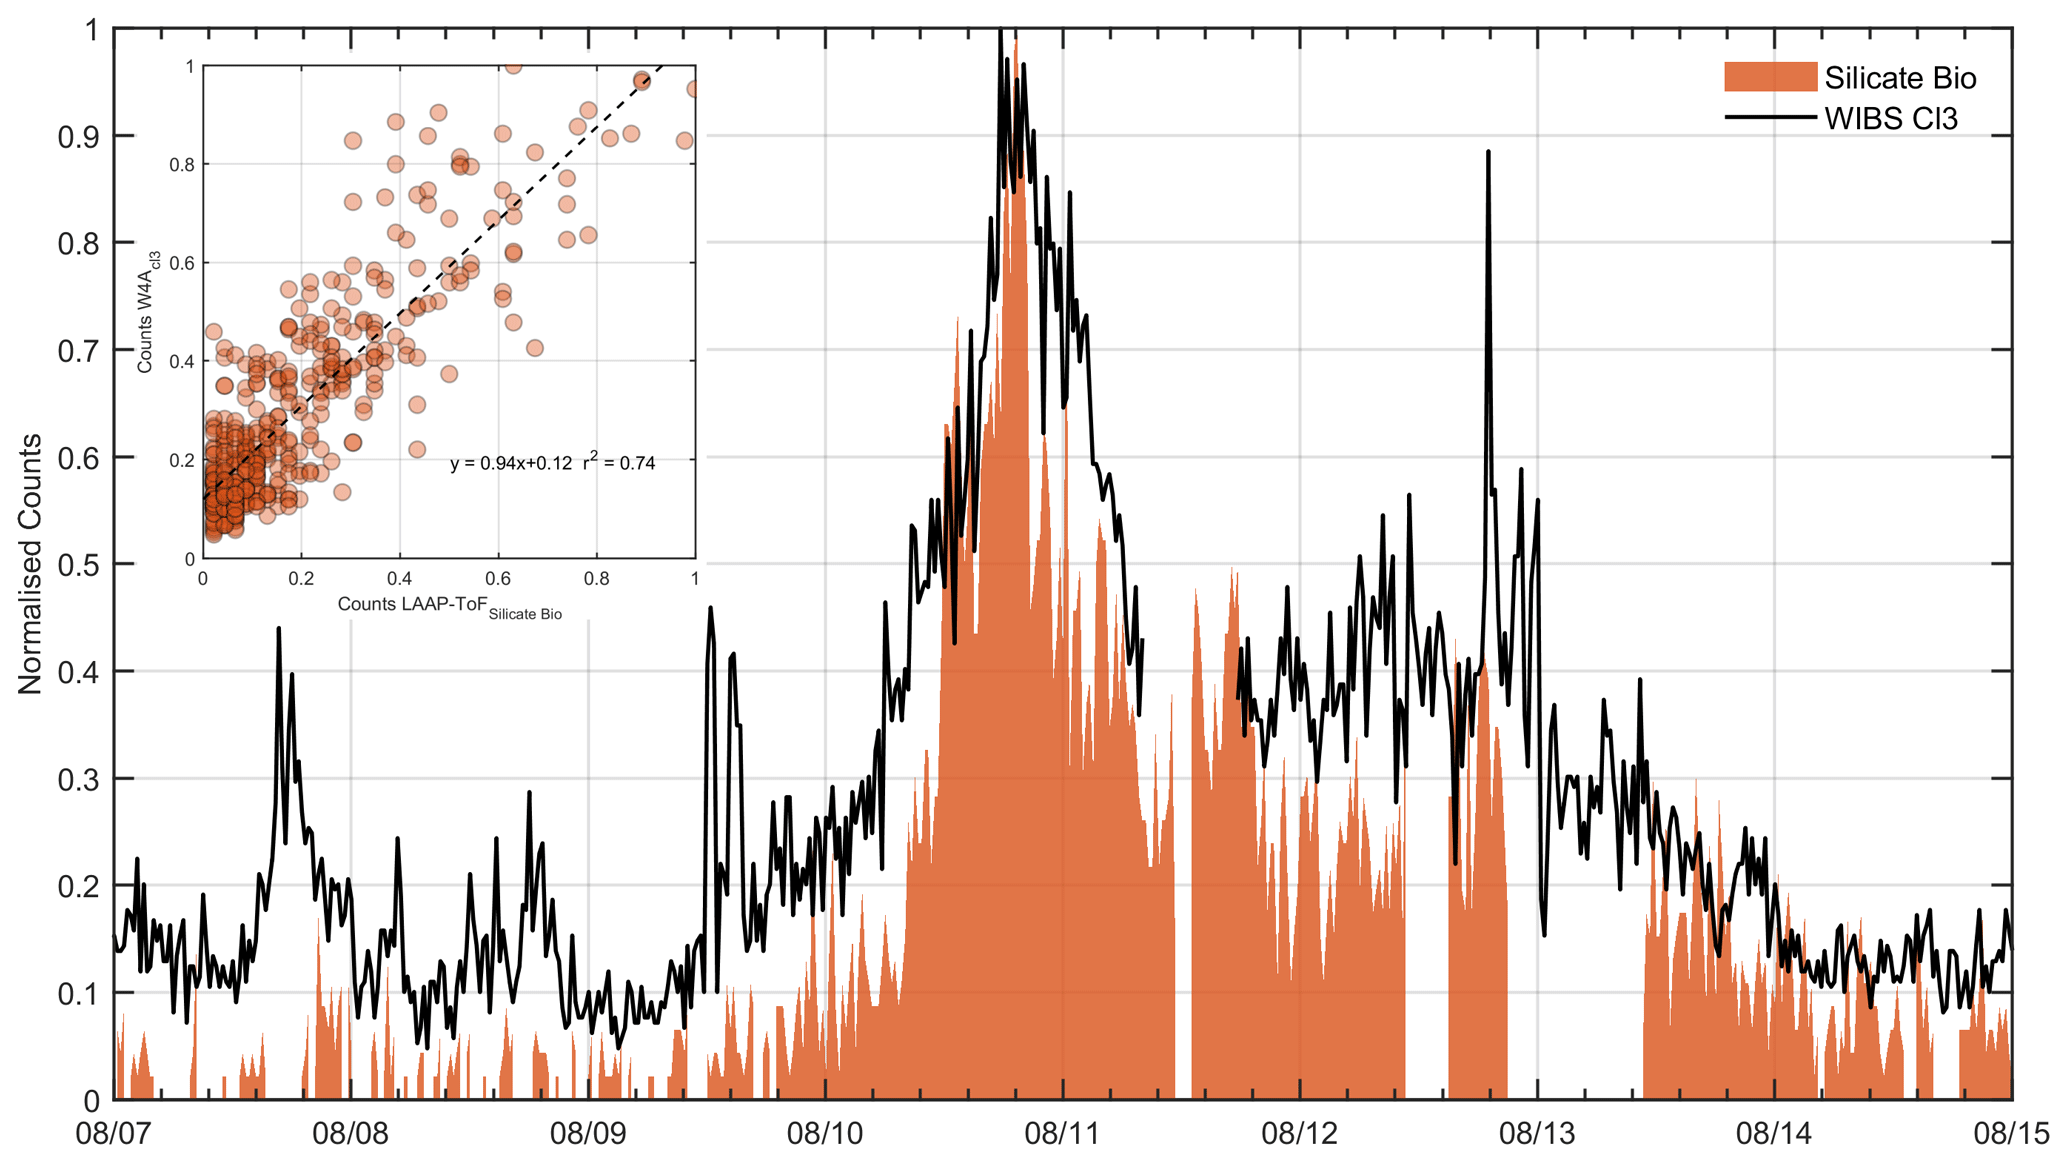
Figure 9Time series of WIBS Cluster 3 and silicate dust filtered for biomarkers using 20 min averaged number counts normalised by the maximum observed concentration for each instrument. Values for the inset plot are also normalised to the maximum observed concentration.
4.2 Identification of fluorescent material
The relative contributions of each cluster in Fig. 3 highlight the importance of Clusters 2 and 3. Furthermore, it shows that the mixture of bioaerosols have no clear pattern, with each cluster present all year round. The intensive measurements from the LAAP-ToF and WIBS-4A have provided supporting evidence to suggest that most of the fluorescent particles observed are mixtures of biological and non-biological material, i.e. bacteria attached to dust. It is likely because of this that fluorescence intensity is correlated with particle size. Larger particles may carry greater numbers of bacteria due to increased surface area and as a result should carry more fluorophores for detection by the instrument. The relationship between fluorescence and particle size has been investigated extensively by Hill et al. (2015), who have shown a generally positive correlation.
Concluding that Clusters 2 and 3 are at least partially bacterial in nature is in contrast to findings by Savage et al. (2017), whose laboratory tests on Bacillus atrophaeus, Escherichia coli and Pseudomonas stutzeri have produced different fluorescent spectra to those observed here. In their tests, bacteria have been shown to fluoresce strongly in Fl 1 and weakly in Fl 2 and 3, while our results show little increase in Fl 1 concentrations during winter but substantial increases in Fl 2 and 3. However, it must be emphasised that they used “pure” bacterial samples, potentially unrepresentative of the mixed aggregates we observed.
Furthermore, they outline previous work by Agranovski et al. (2004), who found that an ultraviolet aerodynamic particle sizer (UV-APS) was effective in identifying fluorophores at similar wavelengths that a WIBS-4A was unsuccessful in doing so. They hypothesise reasons for this, including potential differences in gain voltages applied in the instrument, and weaker excitation intensity in Xe2 with respect to Xe1. With that considered, it must also be noted that there are high levels of agreement between the WIBS-4A used in the intensive measurements and the WIBS-4M for 11 months. As such, the more likely explanation may simply be differences between the samples used in the laboratory and those measured at the observatory. Without proper characterisation of a bacteria–dust aggregate in a controlled setting it is difficult to interpret how this could impact the emissions spectra. Internal reabsorption of fluorescence is known to occur when emitted fluorescent wavelengths overlap with a particle's absorption spectrum. In this instance, it is possible that the dust absorbs certain wavelengths emitted from the bacteria, skewing what is detected by the instrument. It must be emphasised that applying a 9σ threshold to the fluorescent baseline of the WIBS-4M means that our observations are unlikely to be interferents.
Clusters 1 and 4 are interesting because of their high fluorescence intensity. It is possible that these clusters represent “pure” bioaerosols, that have not mixed with non-fluorescent material or are relatively more exposed due to, for example, larger bacterial aggregates present. Cluster 1's spectral profile matches closely with laboratory experiments using bacteria (Savage et al., 2017), with a strong fluorescence in Fl 1 seen across all size ranges. However, Cluster 4 remains difficult to identify. It shows similarly high-intensity fluorescence to Cluster 1 but only in Fl 2 and 3. Its relative contribution to the total bioaerosol count is significant, yet given the location of the observatory seems unlikely to be other common terrestrial bioaerosols such as pollen fragments. Although it may therefore seem likely to have a marine source, its concentrations follow similar seasonal trends to the other clusters which are more easily explained by Aeolian events. With potential differences in their capacity to act as ice nucleators when compared to bacteria and dust aggregates, it is useful to quantify their concentrations.
The dust samples dispersed into the WIBS-4M also support our argument that bacteria–dust aggregates are our dominant bioaerosol type. Many of the sampled particles shared similar spectral profiles to those for Clusters 2 and 3, being weakly fluorescent in all three channels. Each sample also predominantly consisted of non-fluorescent particles, sharing a similarly low fluorescent particle ratio to our campaign observations.
Although the 9σ threshold we have used should eliminate weakly fluorescent non-biological particles, the potential for more highly fluorescent particles to act as interferents should be discussed. Soot is one example, with previous studies having observed higher fluorescence than is typically seen for non-biological particles. Despite this, there are multiple reasons that we do not believe interferents are contributing to particle concentrations. Firstly, studies that found soot to fluoresce above their thresholds had usually only done so when using 3σ thresholding. Toprak and Schnaiter (2013) found propane flame soot to only weakly fluoresce in Fl1 at this threshold, and so we would not expect it to be fluorescent at a more conservative 9σ thresholding. Secondly, the sizes of the observed fluorescent particles are larger than we would expect for soot. Toprak and Schnaiter (2013) found generated soot to only be 0.8 µm after significant coagulation time in the NAUA chamber, while Savage et al. (2017) used a mechanically dispersed dry diesel soot powder to investigate potential interferent aerosol fluorescence. They noted that this powder fluoresced above a conservative 9σ threshold, but this sample aerosol was much larger than soot typically observed in the atmosphere when aerosolised (∼ 1.1 µm). Savage et al. (2017) also acknowledged that fluorescence intensity is a strong function of particle size due to surface area/volume effects and that this test soot was likely to be significantly more fluorescent than ambient diesel soot as a result. Furthermore, Savage and Huffman (2018) acknowledge that more highly fluorescent soot is representative of freshly generated soot close to source and is not representative of aged or processed soot. Ambient soot at CVAO should not be fluorescent at 9σ. While it is possible that soot could have internally mixed with dust and therefore become larger, this would still represent aged soot and would be less fluorescent.
We also acknowledge the fraction identified as biological is small (< 1 %) and that concentrations would consequently be significantly affected by even minor errors in the classification of particle types. However, if a fraction of non-biological particles were “bleeding” through and influencing our concentrations, their mass spectral signatures would differ from our “biosilicate” class. As there is a close correlation between the biosilicate particle counts and our fluorescent fraction, we do not believe that bleeding is significantly changing our observations. More studies comparing such a technique may elucidate the degree to which bleeding occurs, but we believe our study provides a good first estimate of bioaerosol concentrations in this region. As discussed by Savage et al. (2017), UV-LIF results should be considered uniquely in all situations with appreciation of possible influences. We are confident that many common interferent particles such as soot can be further discounted when evaluating properties such as particle size, as well as an appreciation for modelled back trajectories and identified source regions.
4.3 Comparison to previous studies
The results presented here are broadly consistent with previous studies demonstrating that mineral dust is often observed to be mixed with biological material, e.g. Yamaguchi et al. (2012), Griffin et al. (2001) and Maki et al. (2018). Similar to the approach used here, a recent study by Zawadowicz et al. (2019) assessed the prevalence of biological material over the continental United States using single particle mass spectrometry and UV-LIF, finding that 30 % to 80 % of biological particles were mixed with mineral dust. While they provide evidence for biomineral mixtures in their study, the fluorescent number concentration derived from the WIBS is likely an overestimate of the true bioaerosol concentration due to the choice of 3σ thresholding including pure mineral dust interferents in their assumed bioaerosol population, as a small but significant subset of mineral dust naturally exhibits weak fluorescence (Huffman et al., 2019; Savage et al., 2017; Crawford et al., 2016; Pöhlker et al., 2012). The conservative 9σ threshold used in our study excludes these non-biological interferents from the presented PBAP classes (Savage et al., 2017). Furthermore, the use of only negative ion spectra makes resolving biominerals from pure minerals challenging. The use of both positive and negative ion spectra in our study provides greater particle information and consequently improves our ability to classify biological and pure minerals as distinct groups (Shen et al., 2018).
This study has utilised UV-LIF technology to provide long-term measurements of bioaerosol concentrations within an important but often overlooked region of the world. Seasonal variations in both fluorescent and total particle concentrations are clearly observed, likely as a result of the annual patterns of the ITCZ and subsequent mixing with trade winds. This can be readily seen from the HYSPLIT back trajectories, with the highest particle concentrations coming from mainland Africa during winter months.
When considering the source regions in the Sahara and significant correlation between fluorescent and non-fluorescent particle concentrations, it is presumed we are observing high mineral dust concentrations with some associated bacteria. This is supported through the LAAP-ToF and WIBS-4A intensive measurements, with a significant correlation between the LAAP-ToF's biosilicate counts and the concentrations of a clustered subset from the WIBS-4A.
Cluster analysis results from the WIBS-4A compare favourably with those from the WIBS-4M, with both suggesting four-cluster solutions that share similar fluorescent profiles. For the long-term campaign, Clusters 2 and 3 dominate fluorescent particle contributions, accounting for approximately 90 % of all bioaerosols. Both are weakly fluorescent, but with a 9σ threshold having been applied they are unlikely to be interferents. A laboratory experiment using representative dust samples has shown similar fluorescent properties to these clusters, helping to contextualise our observations. These presumed bacteria and dust aggregates are still a minority particle type, accounting for a mean 0.4 ± 0.2 % of total coarse aerosol concentrations. Although this ratio is relatively low, it should be noted that the raw number of bioaerosols present is still quite high, with monthly median concentrations as high as 45 L−1 and 95th percentile values exceeding 130 L−1. Highly fluorescent and likely primary bioaerosols have also been identified in Clusters 1 and 4, accounting for an average 6.6 % of total fluorescent particles. These have not been conclusively identified, but it should be stated that Cluster 1 most closely resembles the spectral profile of pure bacteria outlined by Savage et al. (2017), while Cluster 4 remains unidentified.
Our long-term measurements are consistent with the observations of Korte et al. (2017), who made an association between the deposition of biogenic silica along the Atlantic and high levels of dust from the African continent. It would be interesting for future work to determine whether there are microbial differences within this dust when compared to other regions, following the approach described by Maki et al. (2018). Either the presence of more efficiently ice-nucleating bacteria strains or simply greater concentrations could potentially explain why Sassen et al. (2003) found dust in African outflow to ice nucleate at significantly warmer temperatures than similar studies by Ansmann et al. (2008) and Zhang et al. (2012). Such work would have the capacity to improve global climate model (GCM) simulations.
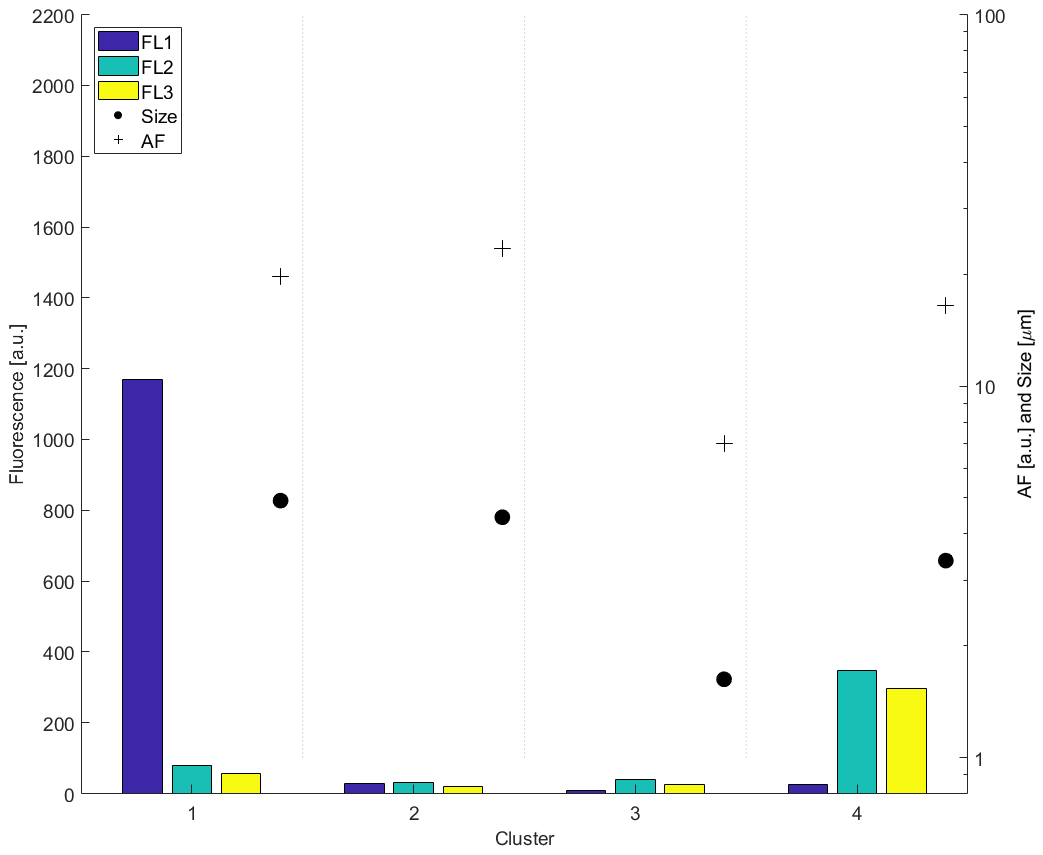
Figure A1Summary of the average fluorescence, size and AF of each cluster from the long-term campaign.
Due to the large file sizes for the dataset, it is available upon request to the lead author.
The supplement related to this article is available online at: https://doi.org/10.5194/acp-20-14473-2020-supplement.
DM is a PhD student and primary author for this paper, responsible for most written components. IC processed the data, contributed to the analysis and provided guidance on the paper's contents. NM was involved in operating and analysing the data from the LAAP-ToF and has collaborated with IC to write the sections pertaining to the LAAP-ToF. NM has also sourced the dust samples for the lab experiments. MF was involved in the planning and execution of both the short-term and long-term components of the project, as well as providing an estimate of the transmission efficiency of the sampling line. KR manages the CVAO World Meteorological Organization – Global Atmospheric Watch (WMO-GAW) station and provided support and access to facilities for this experiment as part of ICE-D, including meteorological data which are archived at the WMO-GAW and British Atmospheric Data Centre (BADC). NL was responsible for instrument operation and maintenance during the long-term campaign. VF is part of DSTL and provided technical support and loan of UV-LIF instrumentation. PK and WS helped in maintenance and repair of the instrument. HC was involved in the short-term component of the project, while DT has provided guidance on the direction and written components of the paper. MG has overseen the entire project, acting as the primary lead. MG is the supervisor of DM and has offered guidance at every stage.
The authors declare that they have no conflict of interest.
This project was funded by NERC as part of the ICE-D campaign (NE/M001954/1). Douglas Morrison's PhD studentship was funded by the NERC Doctoral Training Program (DTP). Ian Crawford has been funded as part of the BIOARC campaign (NE/S002049/1). We thank DMT for the loan of the WIBS-4A used in the LAAP-ToF comparison.
This research has been supported by NERC (grant nos. NE/M001954/1 and NE/S002049/1).
This paper was edited by Anne Perring and reviewed by two anonymous referees.
Agranovski, V., Ristovski, Z. D., Ayoko, G. A., and Morawska, L.: Performance evaluation of the UVAPS in measuring biological aerosols: fluorescence spectra from NAD (P) H coenzymes and riboflavin, Aerosol Sci. Tech., 38, 354–364, 2004.
Ansmann, A., Tesche, M., Althausen, D., Müller, D., Seifert, P., Freudenthaler, V., Heese, B., Wiegner, M., Pisani, G., Knippertz, P., and Dubovik, O.: Influence of Saharan dust on cloud glaciation in southern Morocco during the Saharan Mineral Dust Experiment, J. Geophys. Res.-Atmos., 113, https://doi.org/10.1029/2007JD008785, 2008.
Bauer, H., Kasper-Giebl, A., Löflund, M., Giebl, H., Hitzenberger, R., Zibuschka, F., and Puxbaum, H.: The contribution of bacteria and fungal spores to the organic carbon content of cloud water, precipitation and aerosols, Atmos. Res., 64, 109–119, 2002.
Bauer, H., Giebl, H., Hitzenberger, R., Kasper-Giebl, A., Reischl, G., Zibuschka, F., and Puxbaum, H.: Airborne bacteria as cloud condensation nuclei, J. Geophys. Res.-Atmos., 108, https://doi.org/10.1029/2003JD003545, 2003.
Carpenter, L., Fleming, Z., Read, K., Lee, J., Moller, S., Hopkins, J., Purvis, R., Lewis, A., Müller, K., Heinold, B., Herrmann, H., Wadinga Fomba, K., van Pinxteren, D., Müller, C., Tegen, I., Wiedensohler, A., Müller, T., Niedermeier, N., Achterberg, E. P., Patey, M. D., Kozlova, E. A., Heimann, M., Heard, D. E., Plane, J. M. C., Mahajan, A., Oetjen, H., Ingham, T., Stone, D., Whalley, L. K., Evans, M. J., Pilling, M. J., Leigh, R. J., Monks, P. S., Karunaharan, A., Vaughan, S., Arnold, S. R., Tschritter, J., Pöhler, D., Frieß, U., Holla, R., Mendes, L. M., Lopez, H., Faria, B., Manning, A. J., and Wallace, D. W. R.: Seasonal characteristics of tropical marine boundary layer air measured at the Cape Verde Atmospheric Observatory, J. Atmos. Chem., 67, 87–140, 2010.
Carslaw, R.: An R package for air quality data analysis, Environmental Modelling and Software, 27, 52–61, 2012.
Chiapello, I., Bergametti, G., Gomes, L., Chatenet, B., Dulac, F., Pimenta, J., and Suares, E. S.: An additional low layer transport of Sahelian and Saharan dust over the north-eastern tropical Atlantic, Geophys. Res. Lett., 22, 3191–3194, 1995.
Crawford, I., Robinson, N. H., Flynn, M. J., Foot, V. E., Gallagher, M. W., Huffman, J. A., Stanley, W. R., and Kaye, P. H.: Characterisation of bioaerosol emissions from a Colorado pine forest: results from the BEACHON-RoMBAS experiment, Atmos. Chem. Phys., 14, 8559–8578, https://doi.org/10.5194/acp-14-8559-2014, 2014.
Crawford, I., Ruske, S., Topping, D. O., and Gallagher, M. W.: Evaluation of hierarchical agglomerative cluster analysis methods for discrimination of primary biological aerosol, Atmos. Meas. Tech., 8, 4979–4991, https://doi.org/10.5194/amt-8-4979-2015, 2015.
Crawford, I., Lloyd, G., Herrmann, E., Hoyle, C. R., Bower, K. N., Connolly, P. J., Flynn, M. J., Kaye, P. H., Choularton, T. W., and Gallagher, M. W.: Observations of fluorescent aerosol-cloud interactions in the free troposphere at the High-Altitude Research Station Jungfraujoch, Atmos. Chem. Phys., 16, 2273–2284, https://doi.org/10.5194/acp-16-2273-2016, 2016.
Enete, I. C., Igu, I., Ayadiulo, R., Ifeanyi, C., Enete, E., Obienusi, A., Igu, I. N. and Ayadiulo, R.: Harmattan dust: composition, characteristics and effects on soil fertility in Enugu, Nigeria, British J. Appl. Sci. Technol., 2, 72–81, 2012.
Engelstaedter, S., Tegen, I., and Washington, R.: North African dust emissions and transport, Earth-Sci. Rev., 79, 73–100, 2006.
Folland, C., Owen, J., Ward, M. N., and Colman, A.: Prediction of seasonal rainfall in the Sahel region using empirical and dynamical methods, J. Forecast., 10, 21–56, 1991.
Forde, E., Gallagher, M., Walker, M., Foot, V., Attwood, A., Granger, G., Sarda-Estève, R., Stanley, W., Kaye, P., and Topping, D.: Intercomparison of Multiple UV-LIF Spectrometers Using the Aerosol Challenge Simulator, Atmosphere, 10, 797, https://doi.org/10.3390/atmos10120797, 2019.
Franc, G. D. and DeMott, P. J.: Cloud activation characteristics of airborne Erwinia carotovora cells, J. Appl. Meteorol., 37, 1293–1300, 1998.
Fröhlich-Nowoisky, J., Kampf, C. J., Weber, B., Huffman, J. A., Pöhlker, C., Andreae, M. O., Lang-Yona, N., Burrows, S. M., Gunthe, S. S., Elbert, W., et al.: Bioaerosols in the Earth system: Climate, health, and ecosystem interactions, Atmos. Res., 182, 346–376, 2016.
Gabey, A. M., Gallagher, M. W., Whitehead, J., Dorsey, J. R., Kaye, P. H., and Stanley, W. R.: Measurements and comparison of primary biological aerosol above and below a tropical forest canopy using a dual channel fluorescence spectrometer, Atmos. Chem. Phys., 10, 4453–4466, https://doi.org/10.5194/acp-10-4453-2010, 2010.
Gosselin, M. I., Rathnayake, C. M., Crawford, I., Pöhlker, C., Fröhlich-Nowoisky, J., Schmer, B., Després, V. R., Engling, G., Gallagher, M., Stone, E., Pöschl, U., and Huffman, J. A.: Fluorescent bioaerosol particle, molecular tracer, and fungal spore concentrations during dry and rainy periods in a semi-arid forest, Atmos. Chem. Phys., 16, 15165–15184, https://doi.org/10.5194/acp-16-15165-2016, 2016.
Griffin, D. W., Garrison, V. H., Herman, J. R., and Shinn, E. A.: African desert dust in the Caribbean atmosphere: microbiology and public health, Aerobiologia, 17, 203–213, 2001.
Haga, D., Iannone, R., Wheeler, M., Mason, R., Polishchuk, E., Fetch Jr, T., Van Der Kamp, B., McKendry, I., and Bertram, A.: Ice nucleation properties of rust and bunt fungal spores and their transport to high altitudes, where they can cause heterogeneous freezing, J. Geophys. Res.-Atmos., 118, 7260–7272, 2013.
Herrmann, L., Stahr, K., and Jahn, R.: The importance of source region identification and their properties for soil-derived dust: the case of Harmattan dust sources for eastern West Africa, Beitrage zur Physik der Atmosphare-Contributions to Atmospheric Physics, 72, 141–150, 1999.
Hill, S. C., Mayo, M. W., and Chang, R. K.: Fluorescence of bacteria, pollens, and naturally occurring airborne particles: excitation/emission spectra, Tech. Rep., Army research lab adelphi md computational and information sciences directorate, 50 pp., 2009.
Hill, S. C., Williamson, C. C., Doughty, D. C., Pan, Y.-L., Santarpia, J. L., and Hill, H. H.: Size-dependent fluorescence of bioaerosols: Mathematical model using fluorescing and absorbing molecules in bacteria, J. Quant. Spectrosc. Ra., 157, 54–70, 2015.
Hoose, C. and Möhler, O.: Heterogeneous ice nucleation on atmospheric aerosols: a review of results from laboratory experiments, Atmos. Chem. Phys., 12, 9817–9854, https://doi.org/10.5194/acp-12-9817-2012, 2012.
Huffman, J. A., Sinha, B., Garland, R. M., Snee-Pollmann, A., Gunthe, S. S., Artaxo, P., Martin, S. T., Andreae, M. O., and Pöschl, U.: Size distributions and temporal variations of biological aerosol particles in the Amazon rainforest characterized by microscopy and real-time UV-APS fluorescence techniques during AMAZE-08, Atmos. Chem. Phys., 12, 11997–12019, https://doi.org/10.5194/acp-12-11997-2012, 2012.
Huffman, J. A., Perring, A. E., Savage, N. J., Clot, B., Crouzy, B., Tummon, F., Shoshanim, O., Damit, B., Schneider, J., Sivaprakasam, V., et al.: Real-time sensing of bioaerosols: Review and current perspectives, Aerosol Sci. Tech., 54, 1–31, https://doi.org/10.1080/02786826.2019.1664724, 2019.
Kaye, P. H., Aptowicz, K., Chang, R. K., Foot, V., and Videen, G.: Angularly resolved elastic scattering from airborne particles, in: Optics of Biological Particles, Springer, 31–61, 2007.
Korte, L. F., Brummer, G.-J. A., van der Does, M., Guerreiro, C. V., Hennekam, R., van Hateren, J. A., Jong, D., Munday, C. I., Schouten, S., and Stuut, J.-B. W.: Downward particle fluxes of biogenic matter and Saharan dust across the equatorial North Atlantic, Atmos. Chem. Phys., 17, 6023–6040, https://doi.org/10.5194/acp-17-6023-2017, 2017.
Lakowicz, J. R.: Principles of fluorescence spectroscopy, Springer Science & Business Media, 2013.
Liu, D., Wang, Z., Liu, Z., Winker, D., and Trepte, C.: A height resolved global view of dust aerosols from the first year CALIPSO lidar measurements, J. Geophys. Res.-Atmos., 113, https://doi.org/10.1029/2007JD009776, 2008.
Liu, D., Taylor, J. W., Crosier, J., Marsden, N., Bower, K. N., Lloyd, G., Ryder, C. L., Brooke, J. K., Cotton, R., Marenco, F., Blyth, A., Cui, Z., Estelles, V., Gallagher, M., Coe, H., and Choularton, T. W.: Aircraft and ground measurements of dust aerosols over the west African coast in summer 2015 during ICE-D and AER-D, Atmos. Chem. Phys., 18, 3817–3838, https://doi.org/10.5194/acp-18-3817-2018, 2018.
Maki, T., Furumoto, S., Asahi, Y., Lee, K. C., Watanabe, K., Aoki, K., Murakami, M., Tajiri, T., Hasegawa, H., Mashio, A., and Iwasaka, Y.: Long-range-transported bioaerosols captured in snow cover on Mount Tateyama, Japan: impacts of Asian-dust events on airborne bacterial dynamics relating to ice-nucleation activities, Atmos. Chem. Phys., 18, 8155–8171, https://doi.org/10.5194/acp-18-8155-2018, 2018.
Marsden, N., Flynn, M. J., Taylor, J. W., Allan, J. D., and Coe, H.: Evaluating the influence of laser wavelength and detection stage geometry on optical detection efficiency in a single-particle mass spectrometer, Atmos. Meas. Tech., 9, 6051–6068, https://doi.org/10.5194/amt-9-6051-2016, 2016.
Marsden, N. A., Flynn, M. J., Allan, J. D., and Coe, H.: Online differentiation of mineral phase in aerosol particles by ion formation mechanism using a LAAP-TOF single-particle mass spectrometer, Atmos. Meas. Tech., 11, 195–213, https://doi.org/10.5194/amt-11-195-2018, 2018.
Marsden, N. A., Ullrich, R., Möhler, O., Eriksen Hammer, S., Kandler, K., Cui, Z., Williams, P. I., Flynn, M. J., Liu, D., Allan, J. D., and Coe, H.: Mineralogy and mixing state of north African mineral dust by online single-particle mass spectrometry, Atmos. Chem. Phys., 19, 2259–2281, https://doi.org/10.5194/acp-19-2259-2019, 2019.
McFarland, A., O. C.: Characterization of Sierra-Anderson Model 321a mm Size Selective Inlet for Hi-Vol Samplers, Air Quality Laboratory, 1984.
McTainsh, G.: Dust concentrations and particle-size characteristics of an intense dust haze event: inland delta region, Mali, West Africa, Atmos. Environ., 30, 1081–1090, 1996.
Murphy, D. M.: The design of single particle laser mass spectrometers, Mass Spec. Rev., 26, 150–165, 2007.
Patey, M. D., Achterberg, E. P., Rijkenberg, M. J., and Pearce, R.: Aerosol time-series measurements over the tropical Northeast Atlantic Ocean: dust sources, elemental composition and mineralogy, Mar. Chem., 174, 103–119, 2015.
Perez, L., Tobias, A., Querol, X., Künzli, N., Pey, J., Alastuey, A., Viana, M., Valero, N., González-Cabré, M., and Sunyer, J.: Coarse particles from Saharan dust and daily mortality, Epidemiology, 19, 800–807, 2008.
Perring, A., Schwarz, J., Baumgardner, D., Hernandez, M., Spracklen, D., Heald, C., Gao, R., Kok, G., McMeeking, G., McQuaid, J., and Fahey, D. W.: Airborne observations of regional variation in fluorescent aerosol across the United States, J. Geophys. Res.-Atmos., 120, 1153–1170, 2015.
Pöhlker, C., Huffman, J. A., and Pöschl, U.: Autofluorescence of atmospheric bioaerosols – fluorescent biomolecules and potential interferences, Atmos. Meas. Tech., 5, 37–71, https://doi.org/10.5194/amt-5-37-2012, 2012.
Pope, F.: Pollen grains are efficient cloud condensation nuclei, Environ. Res. Lett., 5, 044015, https://doi.org/10.1088/1748-9326/5/4/044015, 2010.
Pratt, K. A. and Prather, K. A.: Mass spectrometry of atmospheric aerosols – Recent developments and applications. Part II: On-line mass spectrometry techniques, Mass Spec. Rev., 31, 17–48, 2012.
Pratt, K. A., DeMott, P. J., French, J. R., Wang, Z., Westphal, D. L., Heymsfield, A. J., Twohy, C. H., Prenni, A. J., and Prather, K. A.: In situ detection of biological particles in cloud ice-crystals, Nat. Geosci., 2, 398–401, 2009.
Prospero, J. M.: Long-term measurements of the transport of African mineral dust to the southeastern United States: Implications for regional air quality, J. Geophys. Res.-Atmos., 104, 15917–15927, 1999.
Prospero, J. M. and Lamb, P. J.: African droughts and dust transport to the Caribbean: Climate change implications, Science, 302, 1024–1027, 2003.
Reinard, M. S. and Johnston, M. V.: Ion formation mechanism in laser desorption ionization of individual nanoparticles, Journal of the American Society for Mass Spectrometry, 19, 389–399, 2008.
Robinson, N. H., Allan, J. D., Huffman, J. A., Kaye, P. H., Foot, V. E., and Gallagher, M.: Cluster analysis of WIBS single-particle bioaerosol data, Atmos. Meas. Tech., 6, 337–347, https://doi.org/10.5194/amt-6-337-2013, 2013.
Ruske, S., Topping, D. O., Foot, V. E., Kaye, P. H., Stanley, W. R., Crawford, I., Morse, A. P., and Gallagher, M. W.: Evaluation of machine learning algorithms for classification of primary biological aerosol using a new UV-LIF spectrometer, Atmos. Meas. Tech., 10, 695–708, https://doi.org/10.5194/amt-10-695-2017, 2017.
Rypien, K. L.: African dust is an unlikely source of Aspergillus sydowii, the causative agent of sea fan disease, Mar. Ecol. Prog. Ser., 367, 125–131, 2008.
Sands, D. C., Langhans, V. E., Scharen, A. L., and De Smet, G.: The association between bacteria and rain and possible resultant meteorological implications, 148–152, 1982.
Sassen, K., DeMott, P. J., Prospero, J. M., and Poellot, M. R.: Saharan dust storms and indirect aerosol effects on clouds: CRYSTAL-FACE results, Geophys. Res. Lett., 30, https://doi.org/10.1029/2003GL017371, 2003.
Savage, N. J., Krentz, C. E., Könemann, T., Han, T. T., Mainelis, G., Pöhlker, C., and Huffman, J. A.: Systematic characterization and fluorescence threshold strategies for the wideband integrated bioaerosol sensor (WIBS) using size-resolved biological and interfering particles, Atmos. Meas. Tech., 10, 4279–4302, https://doi.org/10.5194/amt-10-4279-2017, 2017.
Shen, X., Ramisetty, R., Mohr, C., Huang, W., Leisner, T., and Saathoff, H.: Laser ablation aerosol particle time-of-flight mass spectrometer (LAAPTOF): performance, reference spectra and classification of atmospheric samples, Atmos. Meas. Tech., 11, 2325–2343, https://doi.org/10.5194/amt-11-2325-2018, 2018.
Steiner, A. L., Brooks, S. D., Deng, C., Thornton, D. C., Pendleton, M. W., and Bryant, V.: Pollen as atmospheric cloud condensation nuclei, Geophys. Res. Lett., 42, 3596–3602, 2015.
Sultan, B., Labadi, K., Guégan, J.-F., and Janicot, S.: Climate drives the meningitis epidemics onset in West Africa, PLoS Medicine, 2, https://doi.org/10.1371/journal.pmed.0020006, 2005.
Toprak, E. and Schnaiter, M.: Fluorescent biological aerosol particles measured with the Waveband Integrated Bioaerosol Sensor WIBS-4: laboratory tests combined with a one year field study, Atmos. Chem. Phys., 13, 225–243, https://doi.org/10.5194/acp-13-225-2013, 2013.
Yamaguchi, N., Ichijo, T., Sakotani, A., Baba, T., and Nasu, M.: Global dispersion of bacterial cells on Asian dust, Sci. Rep., 2, 525, https://doi.org/10.1038/srep00525, 2012.
Yankofsky, S., Levin, Z., Bertold, T., and Sandlerman, N.: Some basic characteristics of bacterial freezing nuclei, J. Appl. Meteorol., 20, 1013–1019, 1981.
Zawadowicz, M. A., Froyd, K. D., Perring, A. E., Murphy, D. M., Spracklen, D. V., Heald, C. L., Buseck, P. R., and Cziczo, D. J.: Model-measurement consistency and limits of bioaerosol abundance over the continental United States, Atmos. Chem. Phys., 19, 13859–13870, https://doi.org/10.5194/acp-19-13859-2019, 2019.
Zhang, D., Wang, Z., Heymsfield, A., Fan, J., Liu, D., and Zhao, M.: Quantifying the impact of dust on heterogeneous ice generation in midlevel supercooled stratiform clouds, Geophys. Res. Lett., 39, https://doi.org/10.1029/2012GL052831, 2012.