the Creative Commons Attribution 4.0 License.
the Creative Commons Attribution 4.0 License.
 | 26 Nov 2020
A measurement and model study on ozone characteristics in marine air at a remote island station and its interaction with urban ozone air quality in Shanghai, China
Yixuan Gu
Fengxia Yan
Jianming Xu
Yuanhao Qu
Wei Gao
Fangfang He
Hong Liao
To understand the characteristics and changes of baseline ozone (O3) in oceanic air in eastern China, a 6-year measurement of O3 concentration was conducted from 1 January 2012 to 15 September 2017 at a remote offshore station located on Sheshan Island (SSI) near the megacity of Shanghai. The observed monthly mean O3 concentrations at SSI ranged from 33.4 to 61.4 ppbv during the study period, which were about 80 % and 12 % higher, respectively, than those measured at downtown and rural sites in Shanghai. Compared to the remarkable O3 increases observed at urban and rural sites in Shanghai, observed O3 concentrations at SSI exhibited statistically insignificant increasing changes (1.12 ppbv yr−1, α>0.10) during the observation period, suggesting less impacts of anthropogenic emissions on O3 levels in oceanic air. In addition, an insignificant decreasing change (−0.72 ppbv yr−1, α>0.10) was detected in O3 concentrations at SSI in September and October when the influence of regional transport was minimum throughout the year, providing a good proxy to study the baseline oxidation capacity of the oceanic atmosphere. City plumes from Shanghai usually carried higher levels of NOx, resulting in decreased O3 concentrations at SSI during southwesterly and westerly winds. However, In MAM (March–May) and JJA (June–August), due to the enhanced production of oxygenated volatile organic compounds, O3 could be continuously produced during daytime in aged city plumes, resulting in elevated O3 concentrations transported to SSI. The impacts of the offshore O3 on O3 levels in Shanghai are quantified during an easterly wind dominant episode (1–30 September 2014) using the WRF-Chem model (Weather Research and Forecasting model coupled with Chemistry). Sensitivity results suggest that O3 in the oceanic air inflows can lead to 20 %–30 % increases in urban O3 concentrations, which should be crucially considered in dealing with urban O3 pollution in large coastal cities like Shanghai.
- Article
(6044 KB) - Full-text XML
-
Supplement
(296 KB) - BibTeX
- EndNote


Ground-level ozone (O3) is a harmful photochemical oxidant detrimental to air quality, human health and land ecosystems (Yue and Unger, 2014; Monks et al., 2015; Li et al., 2019a). High ambient O3 has been proved to increase the risks of respiratory and cardiovascular mortality (Goodman et al., 2015) and enhance the greenhouse effect (IPCC, 2013). In recent years, O3 pollution has drawn increasing attention in China, since O3 pollution is getting worse in spite of the implementation of the Chinese Clean Air Action Plan. In contrast to the 28 %–40 % decreases in PM2.5 (fine particulate matter, diameter ≤2.5 µm) levels, the observed daily maximum 8 h average (MDA8) O3 concentrations show increasing rates of 1–3 ppb yr−1 in summer in megacities over eastern China from 2013 to 2017 (Li et al., 2019b). To address the underlying causes of the increasing O3 pollution has become an urgent issue that triggers lots of discussions based on observational and model studies worldwide (Yang et al., 2014; Lou et al., 2015; Fu et al., 2019).
Observational and model studies indicated that the elevated O3 levels in urban and rural areas in eastern China were strongly related to the changes in anthropogenic emissions of O3 precursors (Ma et al., 2016; Lu et al., 2018; Li et al., 2019b; Gu et al., 2020). Since the O3 formation was reported to be under a volatile-organic-compound-limited (VOC-limited) regime in most Chinese megacities (e.g., Beijing, Shanghai and Guangzhou), the sharp decreases in nitrogen oxides (NOx= NO + NO2) emissions combined with slight increases in VOC levels were suggested to be main causes of the observed enhancement of O3 concentrations in eastern China (Gao et al., 2017; Xu et al., 2019). In remote areas, changes of baseline O3 also exhibit sensitive responses to human activities (Vingarzan, 2004; Meng et al., 2009; Wang et al., 2009; Lin et al., 2015). Based on 14-year observations at a coastal site in Hong Kong SAR, Wang et al. (2009) pointed out that enhanced pollution flow from the upwind coastal regions contributed to most of the observed O3 increases in the background atmosphere of South China from 1994 to 2007. And the increase in background O3, in turn, made a strong contribution of 81 % to the increasing rate of O3 in urban Hong Kong SAR. It is thus necessary to understand the background O3 changes and their responses to different sources when developing long-term strategies to mitigate local O3 pollution. However, compared to the intensive field studies in polluted cities and surrounding rural regions, continuous observations of O3 at representative background sites in China are relatively limited (Wang et al., 2017).
To better understand the characteristics of the background O3 changes in mainland China, the China Meteorological Administration (CMA) started to conduct continuous measurements of surface O3 at several regional background stations (e.g., Shangdianzi, Lin'an and Longfengshan) in 2005. Based on 10-year records from those sites and Waliguan, a baseline Global Atmospheric Watch (GAW) station in Tibetan Plateau region, different increases in background continental O3 concentrations were exhibited, especially during daytime in China (Lin et al., 2008; Xu et al., 2008; Meng et al., 2009; Ma et al., 2016; Xu et al., 2016). The detected positive trends of O3 were in a range of 0.24–1.13 ppbv yr−1, suggesting enhanced atmospheric oxidation capacity of continental air responding to the rapid development of urbanization and industrialization in the past decades. In addition to the changes at background O3 in terrestrial stations mentioned above, the characteristics of baseline O3 at remote marine sites are also important. This is because large amounts of O3 pollution events occurred in coastal urban agglomerations in eastern China (Lu et al., 2018; Li et al., 2019a, b), affected by both city plumes and oceanic air inflows (Tie et al., 2009; Shan et al., 2016). For example, model work of Tie et al. (2009) suggested that sea air masses carried by oceanic inshore air flows aggravated urban O3 pollution in Shanghai under convergence conditions. Understanding the O3 characteristics in offshore oceanic regions is therefore an important prerequisite for understanding the land–sea O3 interactions and its impacts on O3 pollution in coastal cities. However, to our knowledge, studies on the characteristics and changes of O3 in marine air are quite limited in mainland China, since it is very difficult to conduct systematic and continuous observations under remote oceanic air conditions.
In this report, we present the first relatively long and continuous measurements of O3 conducted on a remote offshore island (Sheshan Island, SSI) from January 2012 to September 2017 in eastern China. The SSI is located at the confluence of the Yellow Sea and the East China Sea, covering an area of about 0.4 km2. Since there are no inhabitants on the island, the observed O3 is seldom affected by local anthropogenic emissions. The collected O3 data are used to understand the levels and variabilities of O3 in the offshore regions and their impacts on the O3 concentrations in coastal city areas. First shown are the general impacts of regional transport on the remote atmosphere over the SSI region. Then the diurnal patterns of O3 at SSI are investigated by comparing them with those observed at a downtown site (Xujiahui, XJH) in Shanghai. Multiyear changes of O3 concentrations at SSI are analyzed to examine the overall changes of baseline O3 in marine air and possible causes. Also analyzed are the impacts of urban plumes on O3 levels in oceanic air in offshore regions. Finally, the influence of O3 carried by oceanic air inflows on urban O3 air quality in Shanghai is assessed using the Weather Research and Forecasting model coupled with Chemistry (WRF-Chem).
2.1 The SSI site and ozone observations
To investigate the characteristics and variabilities of O3 in marine air and their interactions with urban air quality in coastal areas, ground O3 concentrations were continuously measured at the SSI site (31.4∘ N, 122.3∘ E, 73.5 m a.s.l.), which is approximately 75 km away from the eastern edge of Shanghai. Figure 1 shows the location of SSI and the surrounding environment. As mentioned in Sect. 1, there are no residents and tourists on the island. The observed O3 at the SSI site can represent the background O3 conditions in oceanic air, which are seldom contaminated by anthropogenic emissions. Hourly O3 data were collected from 1 January 2012 to 15 September 2017, with a capture rate of 89.7 %. O3 was measured using an analyzer from Ecotech, Australia (model EC9810), which combined microprocessor control with ultraviolet photometry. The instrument met the technical specifications for the United States Environmental Protection Agency, with a quality control check every 3 d, filer replaced every 2 weeks and calibration every month.
2.2 Observational data at urban and rural sites in Shanghai
To better understand the characteristics of the offshore O3 in oceanic air at SSI, O3 observations obtained from a downtown site, Xujiahui (XJH) are used for comparisons. The XJH site is located in downtown Shanghai, approximately 80 km west of SSI. Since measurements of NOx, carbon monoxide (CO) and meteorological parameters (e.g., wind direction and wind speed) were unavailable at SSI, observations obtained at an adjacent site, Dongtan (DT), are substituted for the investigation. The DT site was set up in a national nature reserve near the coast of Shanghai, where the observed pollutant levels have been reported to well reflect the impacts of megacities in the Yangtze River Delta (YRD) region on the remote atmosphere during the MIRAGE-Shanghai (Megacities Impact on Regional and Global Environment at Shanghai) field campaign (Tie et al., 2013). Similar to SSI, the DT site is also little affected by human activities. The obtained observations of meteorology and pollutants are therefore applied for analyzing the impacts of regional transport on observed O3 concentrations at SSI. NOx concentrations were measured with a chemiluminescent trace level analyzer (Thermo Environmental Instruments Model 42i-TL), with a detection limit of 0.025 ppb. CO concentrations were measured by a Model 48i-TLE CO analyzer, based on gas filter correlation technology. The wind speed and wind direction were measured by using a DZZ4 Automatic Weather Station certificated by the China Meteorological Administration. The geographical locations and surrounding environment of XJH, DT and SSI are displayed in Fig. 1.
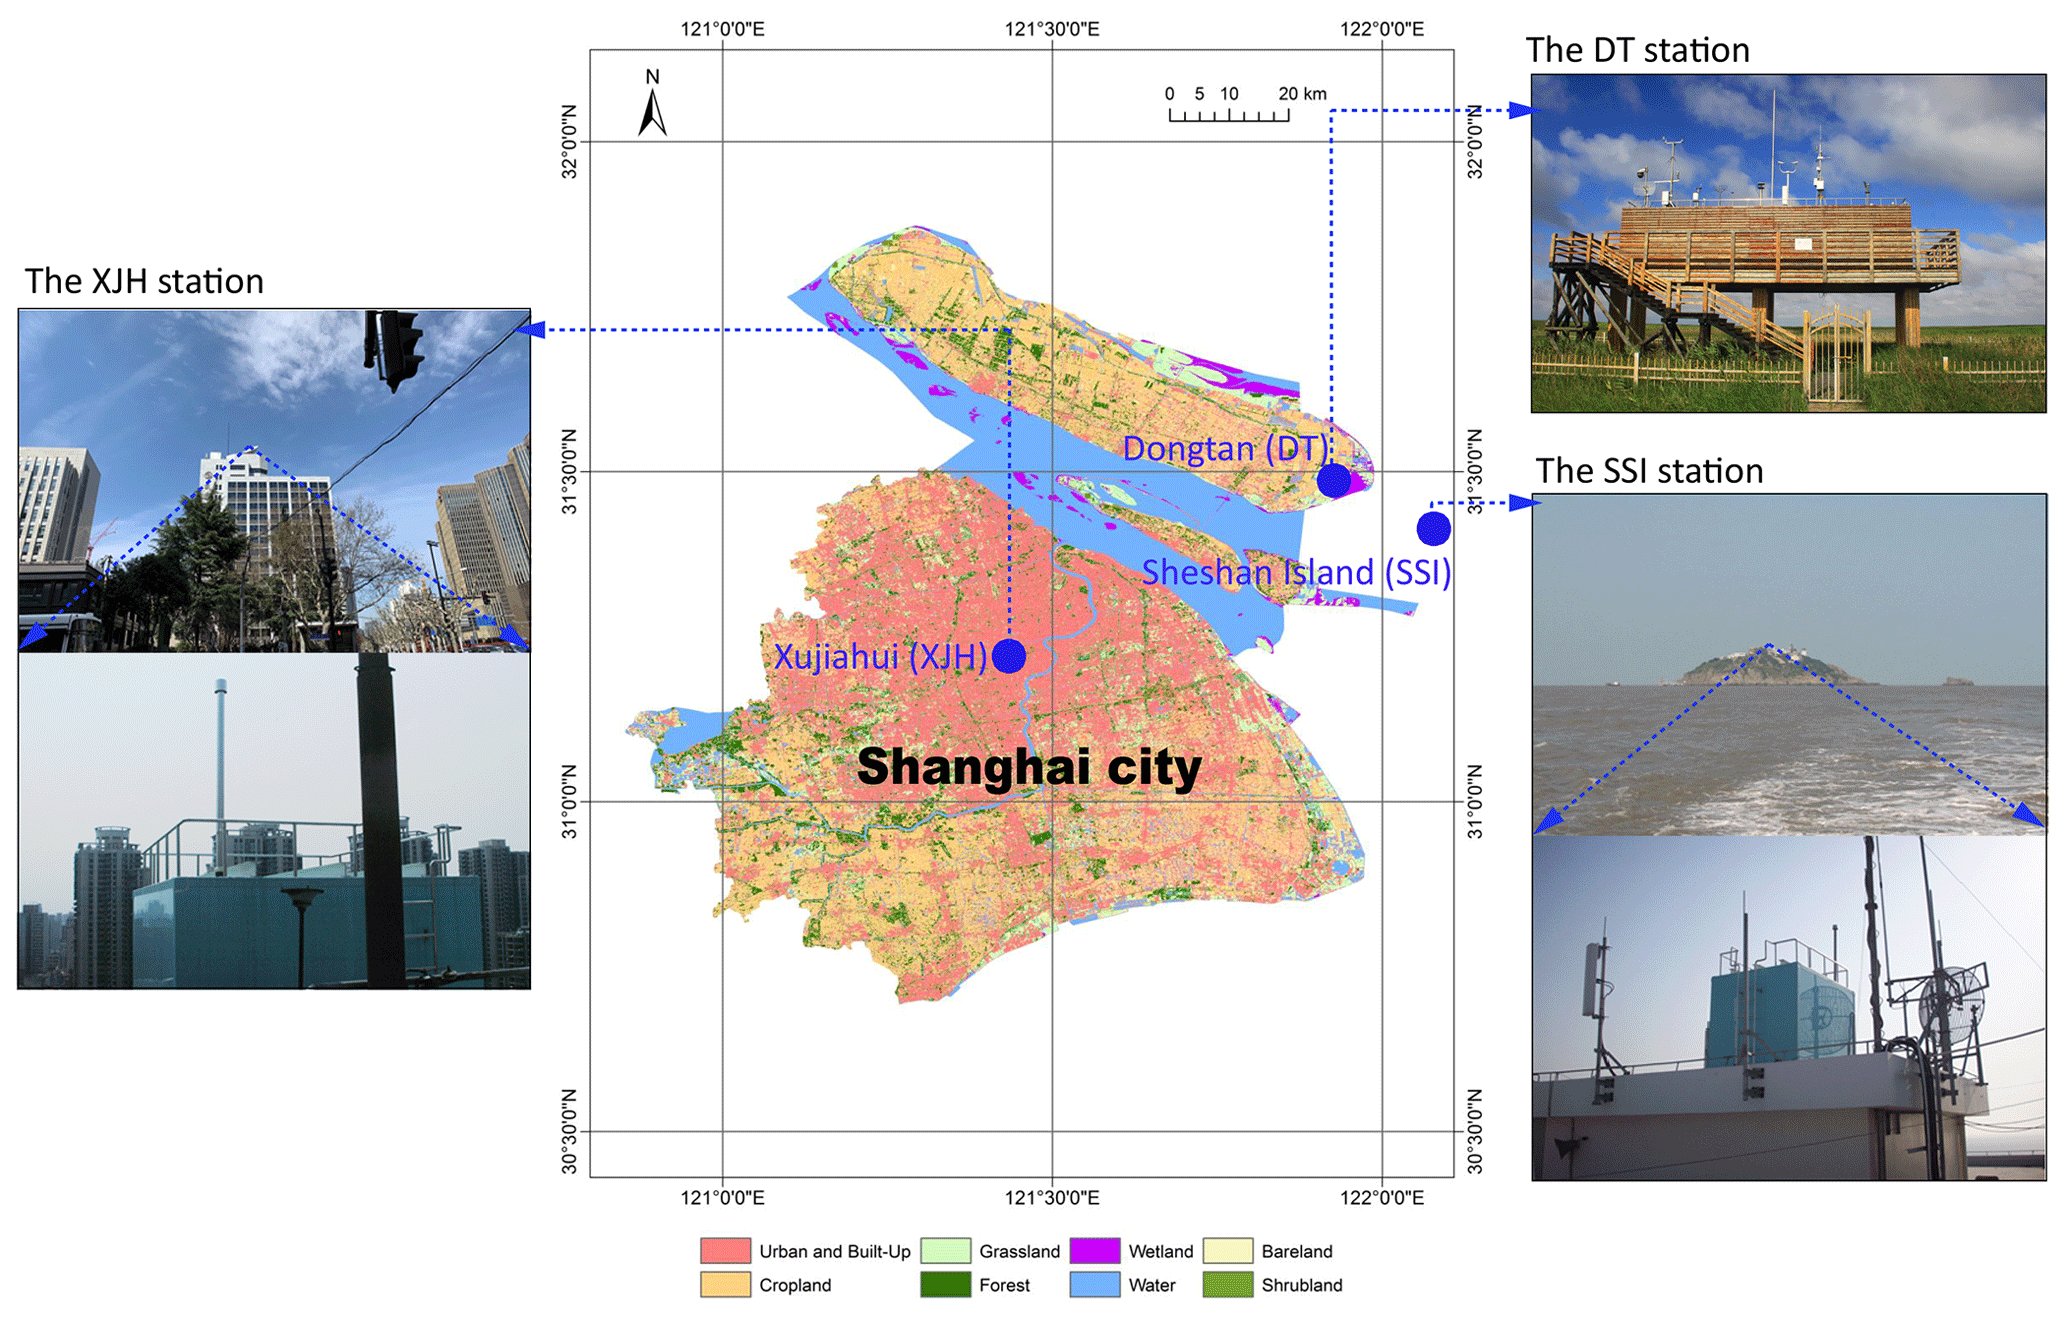
Figure 1Land cover of Shanghai and corresponding locations and landscapes of the Xujiahui (XJH, urban), Dongtan (DT, rural) and Sheshan Island (SSI, remote and oceanic) stations.
2.3 The WRF-Chem model
We simulate O3 using the regional chemical transport model WRF-Chem (version 3.8, https://www2.acom.ucar.edu/wrf-chem, last access: 19 July 2019), collaboratively developed through efforts of the National Center for Atmospheric Research (NCAR), the National Oceanic and Atmospheric Administration, the National Centers for Environmental Prediction (NCEP), the Forecast Systems Laboratory (FSL), the Air Force Weather Agency (AFWA), the Naval Research Laboratory, the University of Oklahoma, and the Federal Aviation Administration (FAA). The model includes online calculation of meteorological parameters, transport, mixing, emission, and chemical transformation of trace gases and aerosols (Grell et al., 2005). The Regional Acid Deposition Model version 2 (RADM2; Stockwell et al., 1990) gas-phase chemical mechanism is used for the O3 formation chemistry. Photolysis rates are calculated by using the fast radiation transfer module (FTUV) following those in Madronich and Flocke (1999) and Tie et al. (2003). The aerosol chemistry is calculated using the ISORROPIA II thermodynamic equilibrium model for inorganic aerosols (Fountoukis and Nenes, 2007) and the Secondary ORGanic Aerosol Model (SORGAM; Schell et al., 2001) for organic aerosols. Dry deposition follows the standard resistance-in-series model of Wesely (1989). The major physical processes employed in the model follow the Lin microphysics scheme (Lin et al., 1983), the Yonsei University (YSU) planetary boundary layer (PBL) scheme (Hong and Lim, 2006), the Noah Land Surface Model (Chen and Dudhia, 2001) and the longwave radiation parameterization (Dudhia, 1989).
The model used in this study has a horizontal resolution of 6 km × 6 km, including 150 unstaggered grids in an west–east orientation, 150 unstaggered grids in a south–north orientation and 35 vertical layers extending from the surface to 50 hPa. The domain encompasses Shanghai and its surrounding region, centered at 31.3∘ N, 121.4∘ E. The NCEP FNL (Final) Operational Global Analysis data are used for meteorological initial and boundary conditions, with the lateral meteorological boundary updated every 6 h. Basic chemical lateral boundary conditions are constrained by a global chemical transport model (MOZART-4, Model for OZone And Related chemical Tracers, version 4; Tie et al., 2001; Emmons et al., 2010). Anthropogenic emissions are derived from the Multi-resolution Emission Inventory for China (MEIC inventory, http://www.meicmodel.org/, last access: 11 December 2018; Li et al., 2014) for the year 2010. Biogenic emissions are calculated online using model of emissions of gases and aerosols from nature (MEGAN2, Model of Emissions of Gases and Aerosols from Nature; Guenther et al., 2006).
2.4 Methods for assessing the trend of ozone
The daily mean O3 concentrations are used to examine the overall changes in O3 concentrations during the period 2012–2017, including all times of day with qualified measurements. The trends are assessed using two nonparametric methods, which are commonly used to detect trends of non-normally distributed data with seasonality (Xu et al., 2016). The Mann–Kendall (MK) trend test (Mann, 1945; Kendall, 1975; Gilbert, 1987) is used to examine the trend significance, and the Theil–Sen trend estimate method (Sen, 1968) is used to estimate the slope of the trend, which could also be considered as the rate of change, during the 6-year period. Compared to the linear fitting analysis which requires data to be independent and follow a Gaussian distribution, the nonparametric trend test methods only need the data to be independent (Gocic and Trajkovic, 2013). To determine if the calculated rate of change is statistically significant, the confidence level of at least 95 % is adopted in the MK trend test, with an α value of less than 0.05 being considered a statistically significant trend. The trend significance is examined by comparing the value of a standardized test statistic Z to that of a standard normal variate at a given significance level (Zα, α=0.05). If , then the dataset is nonstationary, exhibiting either an increasing or a declining trend. If , then the dataset is stationary with no significant trend. A detailed calculation of Z can be found in Xu et al. (2016).
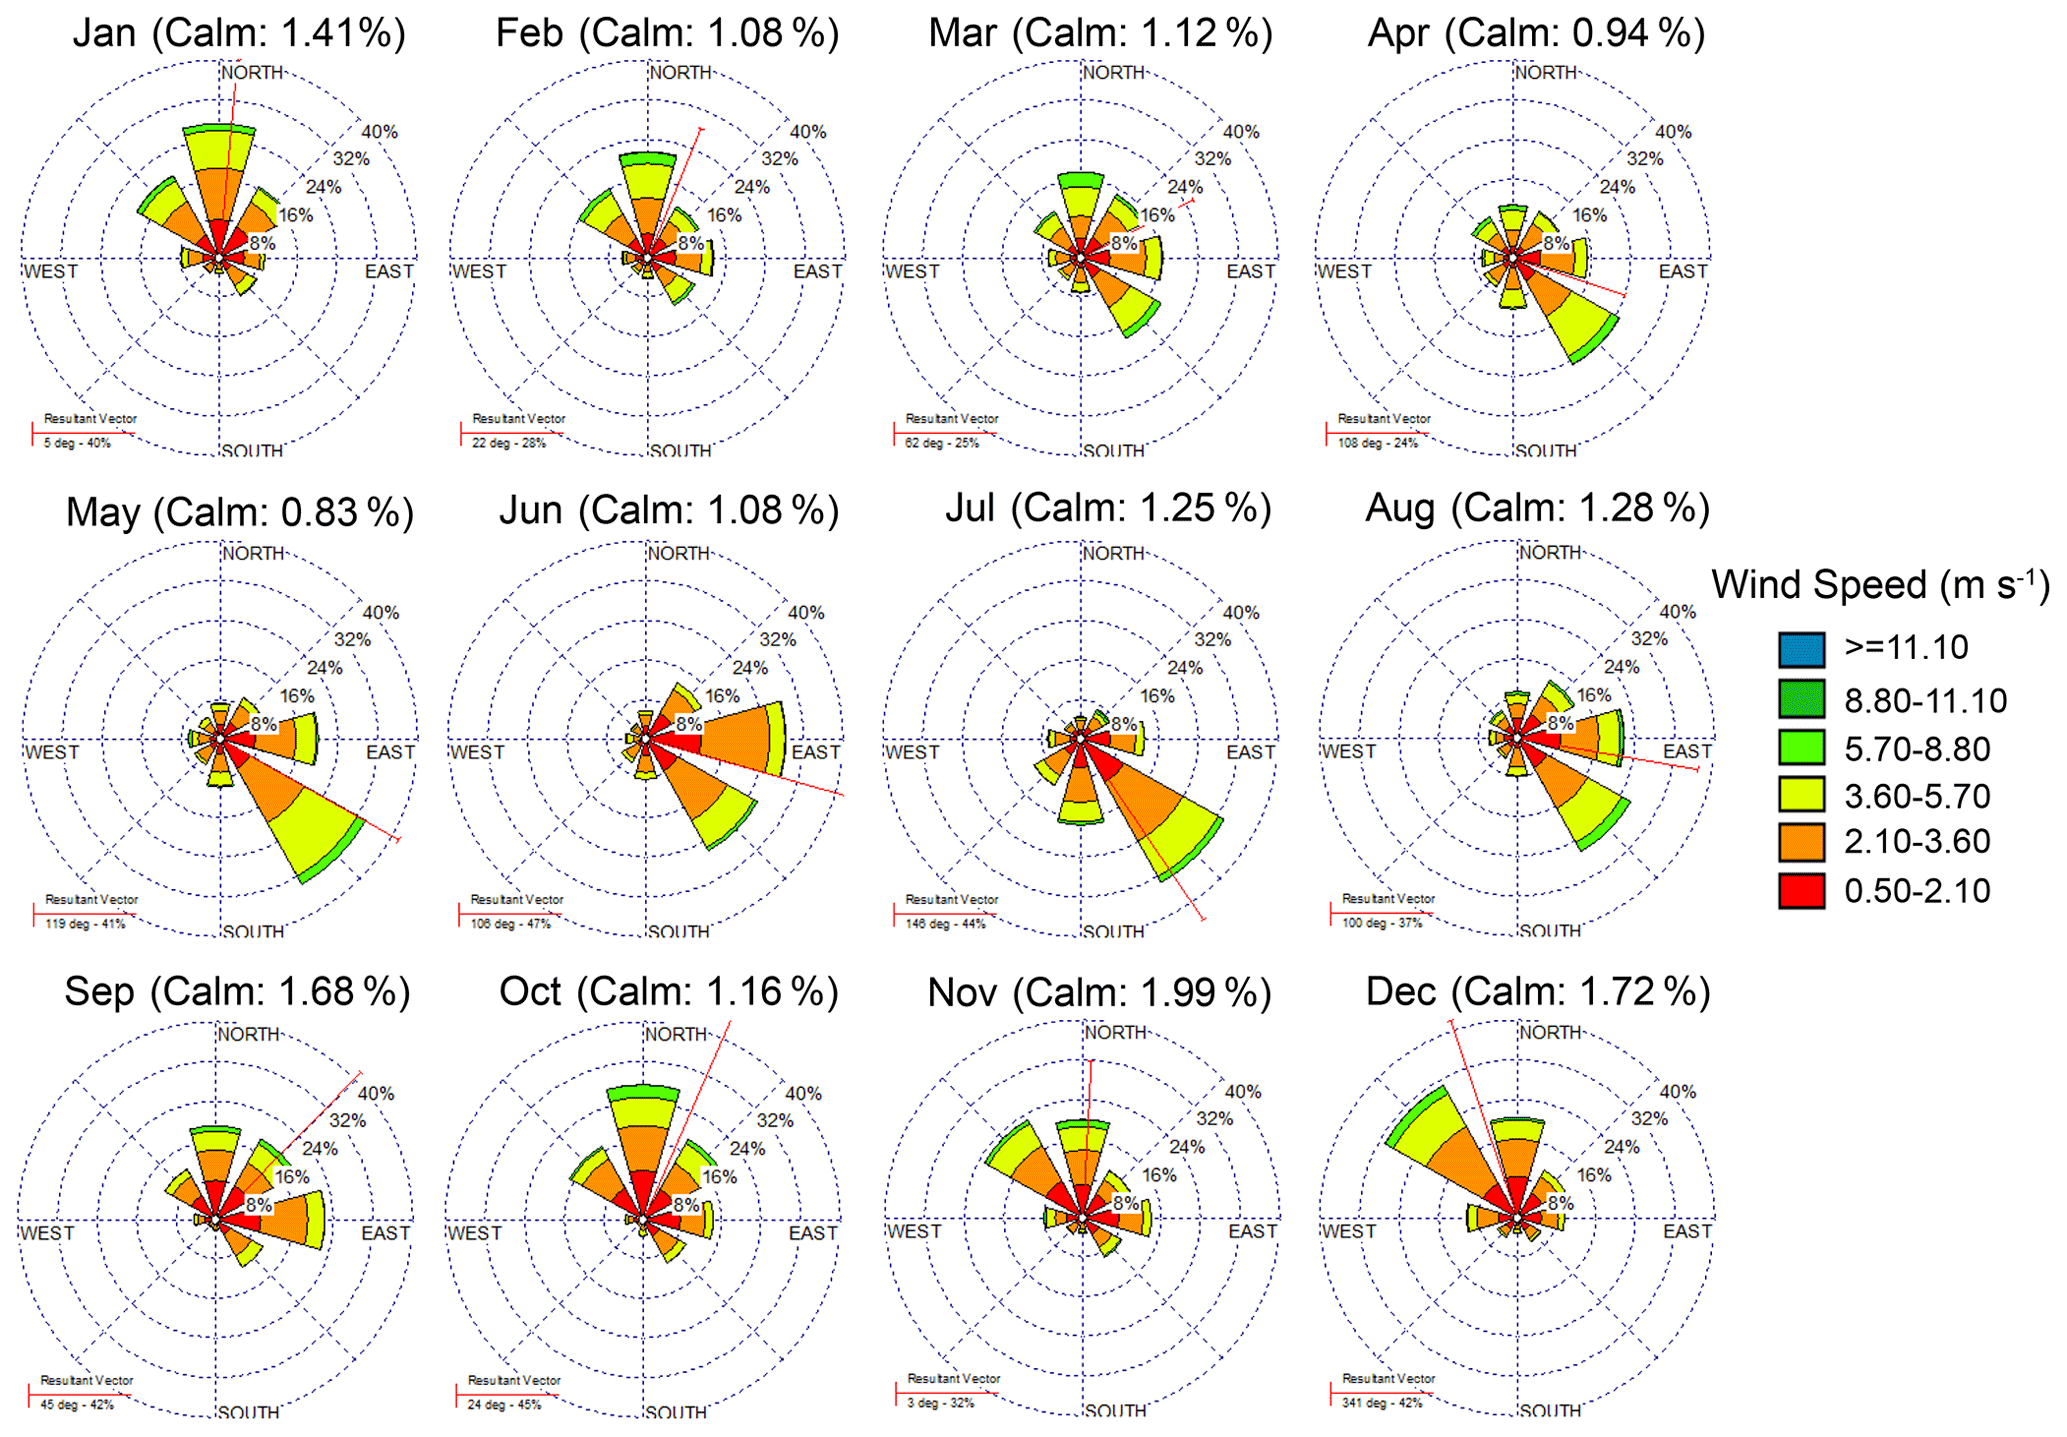
Figure 2Monthly wind rose diagrams averaged over the period of 2012 to 2017 at Dongtan (DT) site, a remote rural site near Sheshan Island (SSI).
3.1 Regional transport characteristics at SSI
The observed O3 concentrations at SSI were inevitably influenced by regional transport depending on the prevailing winds in various seasons. Figure 2 displays the monthly wind rose diagrams averaged over the period of 2012–2017 at DT. As mentioned in Sect. 2.2, the DT site is a rural site located quite close to SSI. The observed wind speeds and wind directions could then be applied to deduce the origins of the air mass arriving at SSI in an adjacent region. Generally, observed prevailing winds exhibited distinct seasonal variabilities which were greatly affected by the East Asian monsoon. In warm seasons (May–August), the site was predominately influenced by easterly and southeasterly winds, accounting for 40 %–50 % of the total winds. While in cold seasons (November–February), the northwesterly and northerly winds became the predominant flows that affected SSI, accounting for about 45 % of total winds. During transitional months (e.g., March, April, September and October), the dominant winds presented more diversities, with wind directions dispersedly distributed in all directions. The observed seasonal variations of prevailing winds are typical at coastal cities at the mid-latitude region (Shan et al., 2016; Xu et al., 2019), suggesting that air masses arriving at SSI originated from various regions and could result in different impacts on the offshore atmospheric composition in different months.
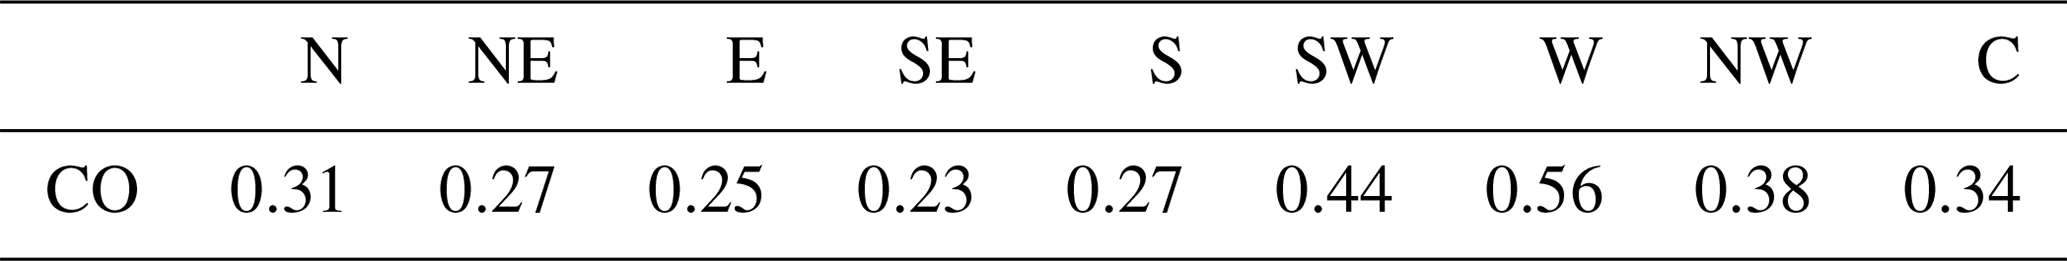
Since CO has a relatively long chemical lifetime of a few months, the observed CO concentrations at DT could be regarded as a consequence of regional transport from polluted regions (Tie et al., 2009). Figure 3 displays the observed monthly mean CO mixing ratios under wind directions of north (N), northeast (NE), east (E), southeast (SE), south (S), southwest (SW), west (W) and northwest (NW) at DT during the 2012–2017 period. Observed CO exhibited relatively higher concentrations under SW and W winds in all months, with mean mixing ratios of 0.44 and 0.56 ppmv, respectively, from 2012 to 2017 (Table 1). The observed high CO mixing ratios suggested that the atmosphere constituents at SSI could be more affected by regional transport of air pollutants under SW and W wind conditions. As SSI is located to the northeast of Shanghai (Fig. 1), air masses carried by the SW and W flows usually contain more urban pollutants from upwind city areas, and those carried by E, SE and NE flows mostly come from the ocean. The oceanic air masses are less polluted compared to those from the cities, leading to a lower CO mixing ratio at SSI. For example, observed CO exhibited a mean concentration of 0.23 ppmv under SE wind conditions, which was about 50 % lower than that influenced by W winds. To further examine the impacts of the SW and W winds on the atmosphere constituents at SSI, Table 2 lists the calculated monthly mean occurrence frequency of the SW and W winds in separate months during the studied period. The SW and S winds were most infrequent in September (6.1 %) and October (5.2 %), suggesting that the atmosphere at SSI during the 2 months could be less contaminated by pollutants transported from the city and might be closer to the baseline oceanic air conditions.
Table 1Mean CO mixing ratios (ppmv) under north (N), northeast (NE), east (E), southeast (SE), south (S), southwest (SW), west (W), northwest (NW) and calm (C) wind conditions at the Dongtan (DT) site, a remote rural site near Sheshan Island (SSI), from 2012 to 2017.
3.2 The diurnal pattern of ozone at SSI
Figure 4 displays the monthly mean diurnal variations of O3 at SSI and XJH in different months from 2012 to 2017. The observed O3 concentrations at the two sites exhibited similar seasonal variations, with monthly mean values highest (61.4 ppbv for SSI and 35.9 ppbv for XJH) in May and lowest (33.4 ppbv for SSI and 12.5 ppbv for XJH) in December. Since the O3 formation in urban Shanghai is VOC-limited, observed O3 could be significantly depressed by large NOx emissions at the downtown site (XJH) (Gu et al., 2020). In Fig. 4, observed O3 levels at XJH were quite lower than those at SSI in all months, with mean concentrations of 27.8 and 50.1 ppbv, respectively, at XJH and SSI during the observation period. The observed mean daily maximum 8 h average (MAD8) O3 concentrations exhibited the same differences between the two sites, which were 40.1 and 62.0 ppbv, respectively, at XJH and SSI. The observed mean O3 concentration at SSI was also higher than that at DT (44.7 ppbv, Fig. S1), which is closer to the city, suggesting that O3 levels in marine air could be higher than those at continental urban and rural sites. The observed diurnal patterns of O3 at SSI and XJH in Fig. 4 were similar to those reported for other sites in eastern China (Xu et al., 2008; Geng et al., 2015; Gao et al., 2017), exhibiting minimums in early morning (06:00–08:00 LST) and maximums in the afternoon (13:00–15:00 LST). However, compared to those at the urban site (XJH), observed amplitudes of O3 diurnal variations were much smaller at SSI. The diurnal variations of surface O3 can be mainly attributed to the O3 production through photochemical reactions in the daytime and O3 depression via NO titration at nighttime (Sillman, 2003). Due to few emissions of O3 precursors (NOx and VOCs), the O3 production and depression could be weaker at the remote site, resulting in flatter diurnal cycle of O3 compared to that at the polluted urban site.
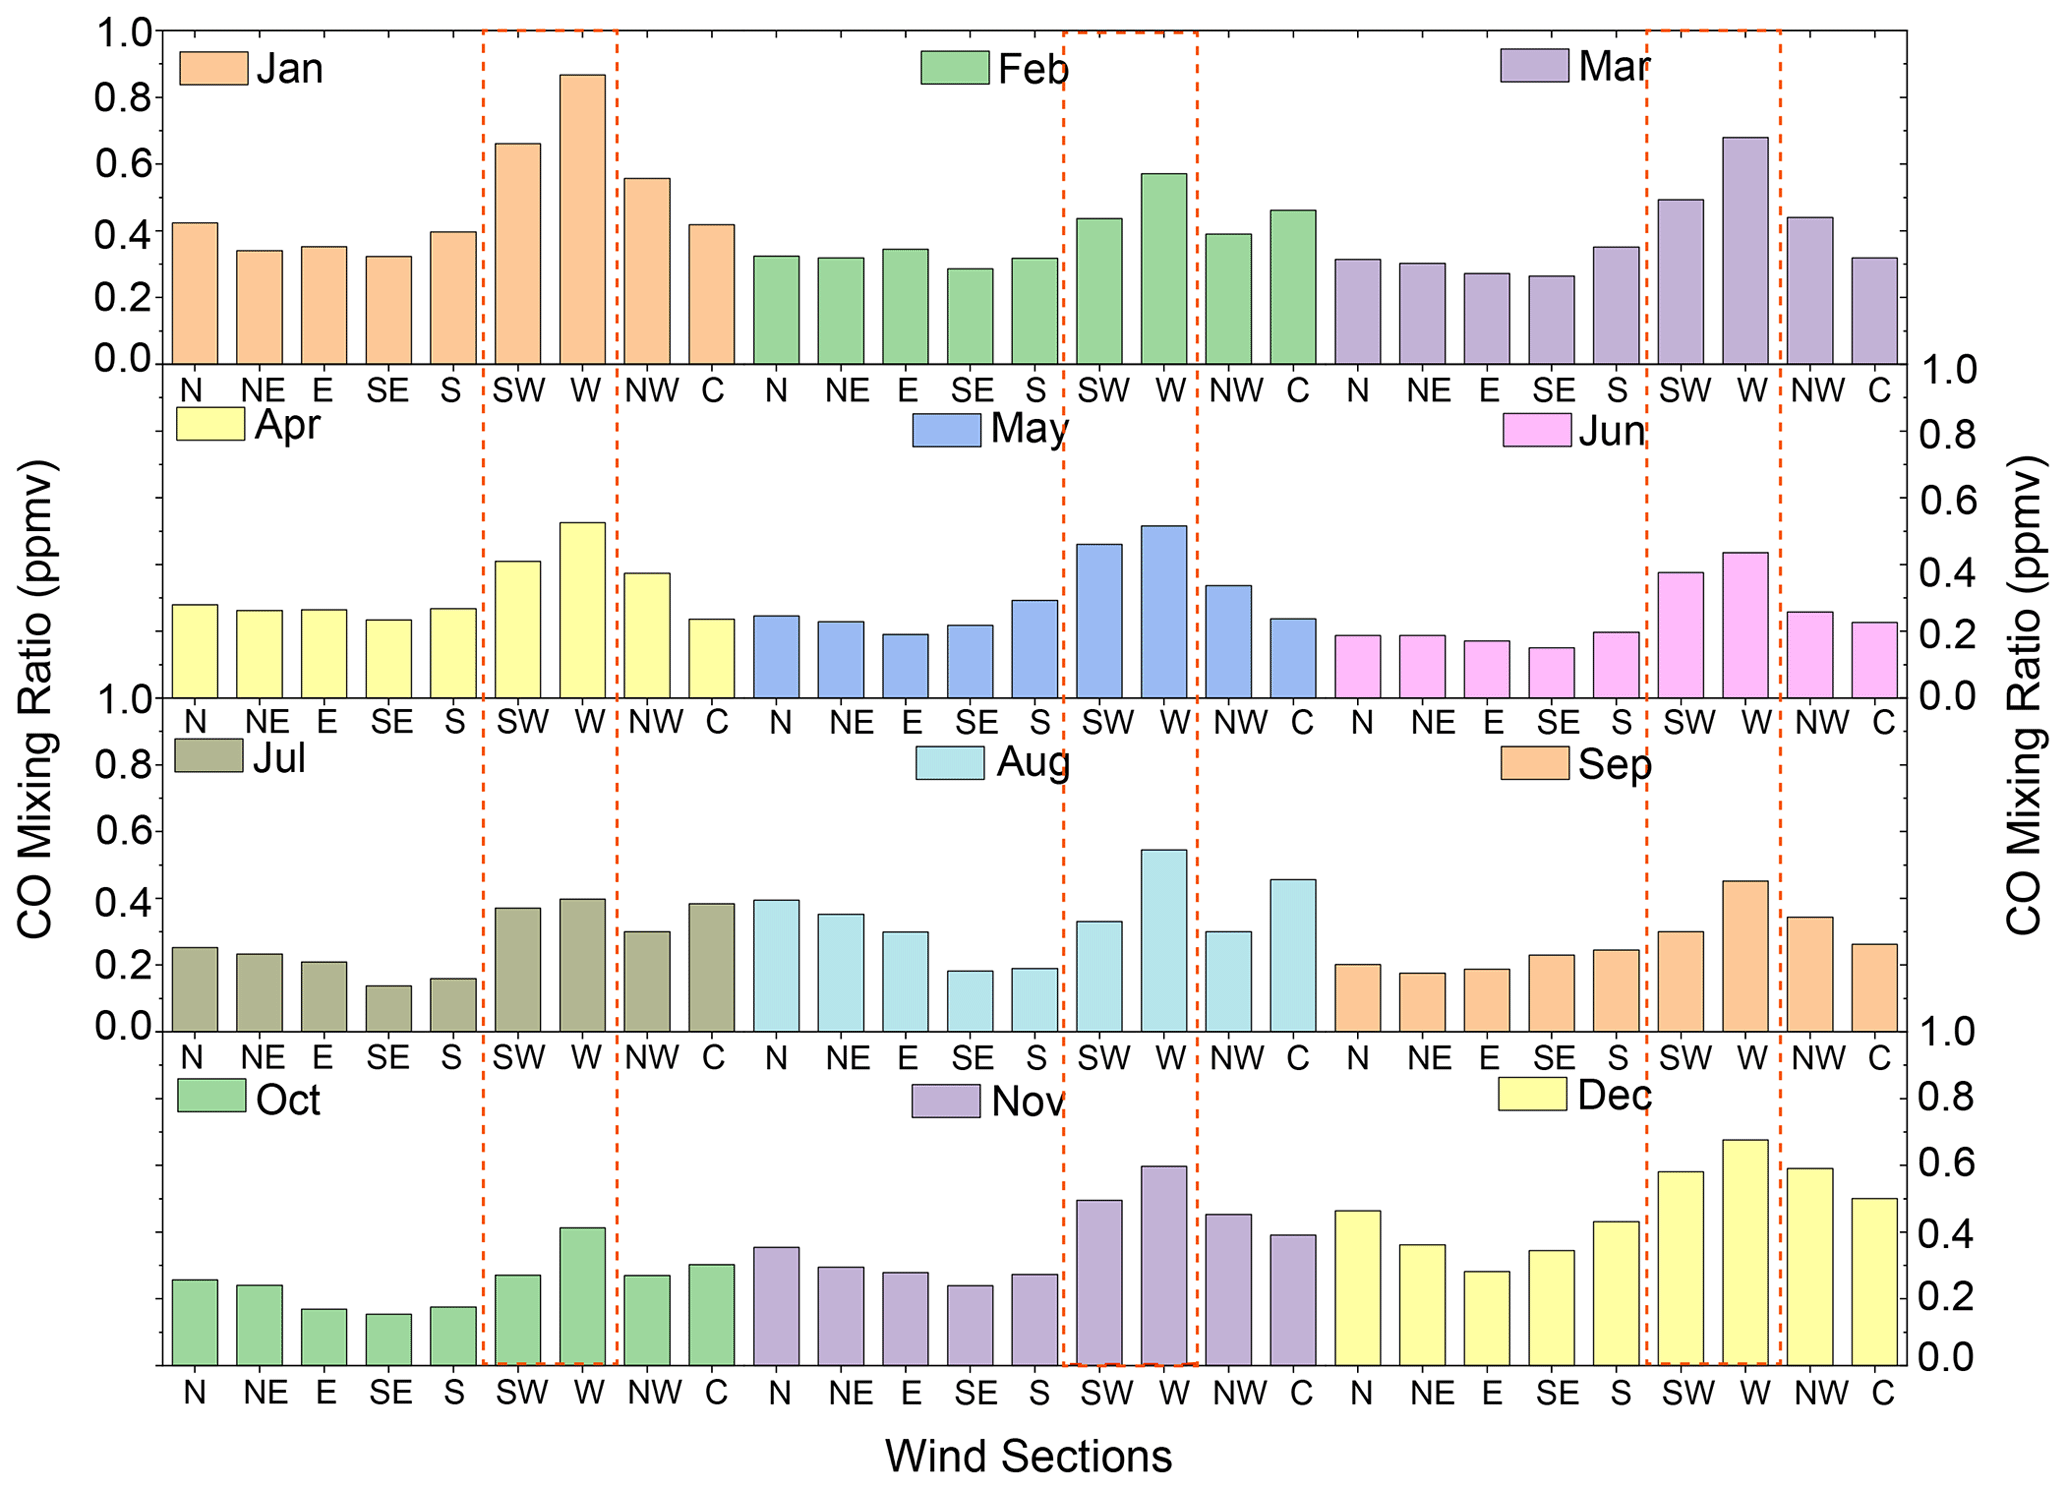
Figure 3Monthly mean CO mixing ratios under north (N), northeast (NE), east (E), southeast (SE), south (S), southwest (SW), west (W), northwest (NW) and calm (C) wind conditions at the Dongtan (DT) site, a remote rural site near Sheshan Island (SSI), from 2012 to 2017.
Since the amplitudes of O3 diurnal variations usually exhibited much smaller values in background areas compared to those in polluted urban regions, the ratio of daily maximum O3 concentration (O3−max) to minimum O3 concentration (O3−min) was regarded as an indicator to identify if the local O3 pollution was significantly influenced by anthropogenic emissions (Cvitas and Klasinc 1993; Vingarzan, 2004). The O3−max ∕ O3−min ratio displayed larger values in polluted regions (Cvitas et al., 1995) and lower values in less contaminated rural regions. A ratio of about 1.4 suggested that the site could be regarded as a typical background site (Scheel et al., 1997). For regional background sites in China, the typical values of O3−max ∕ O3−min were usually in the range of 2–3 (Xu et al., 2008; Meng et al., 2009; Gu et al., 2020). In Lin'an, a continental background site in the YRD region, the ratio was reported to increase as a result of NOx emission changes during past decades, which could reach above 6 during summertime (Xu et al., 2008). In Fig. 4, observed O3 displayed different diurnal variabilities in various months at SSI. The variations of the O3−max / O3−min ratio suggested a different influence of regional transport on O3 levels in the marine atmosphere.
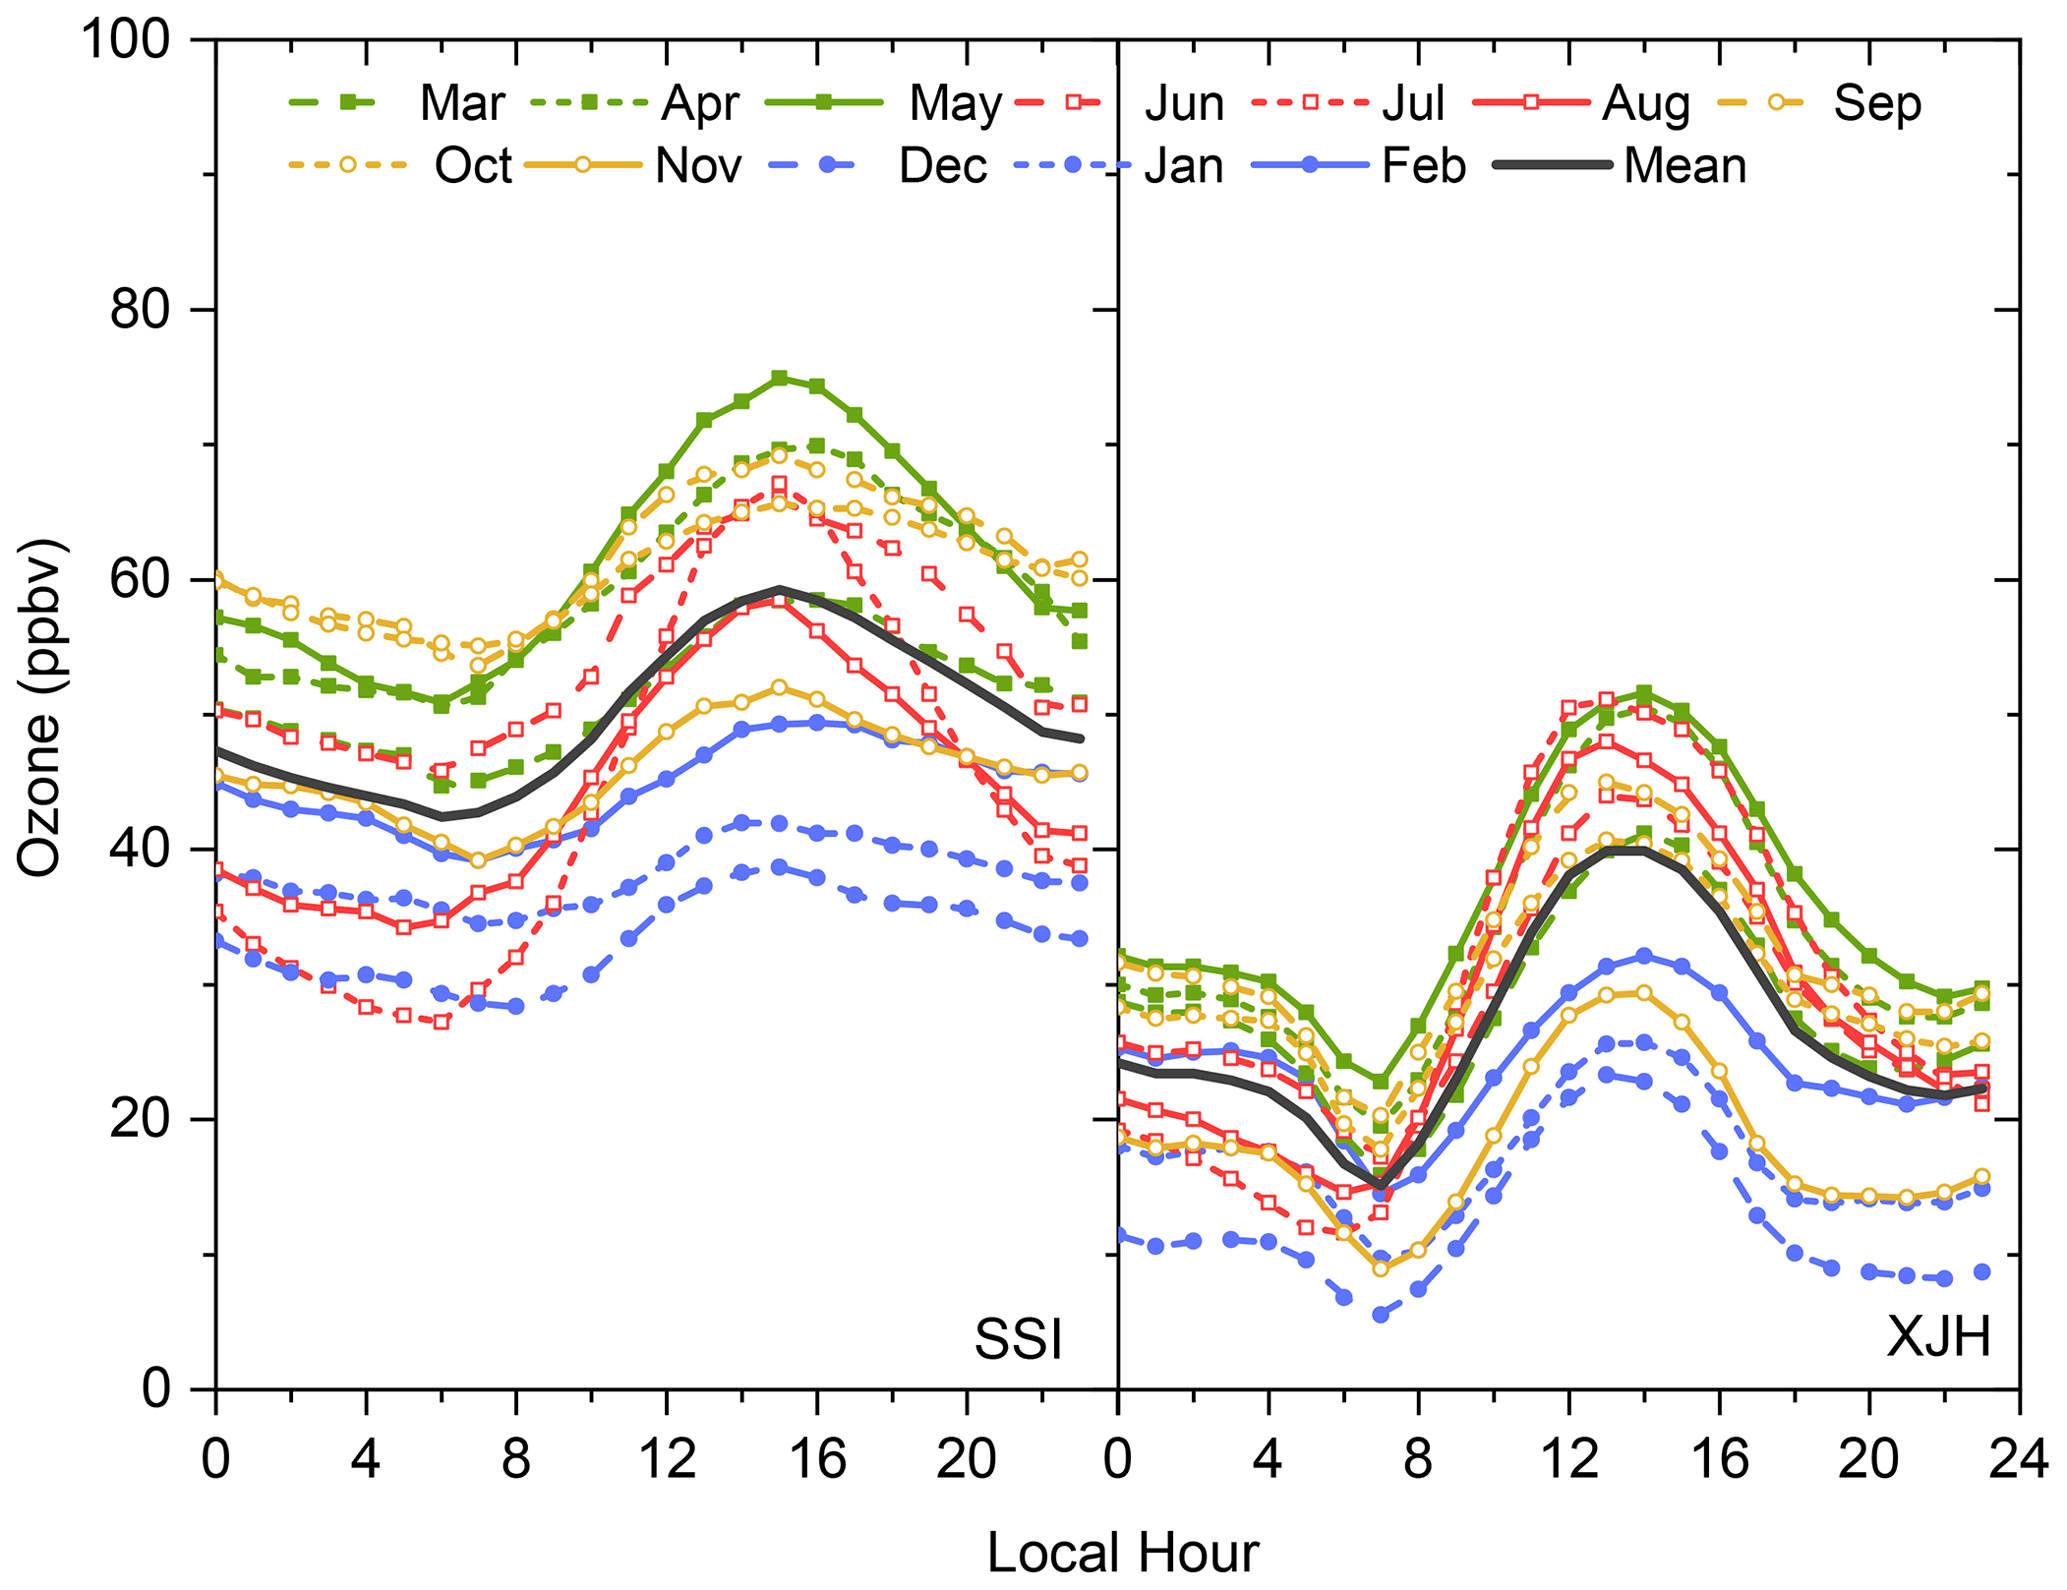
Figure 4Monthly and year-round mean diurnal variations of O3 (ppbv) at the Sheshan Island (SSI, remote and oceanic) and Xujiahui (XJH, urban) sites from 2012 to 2017.
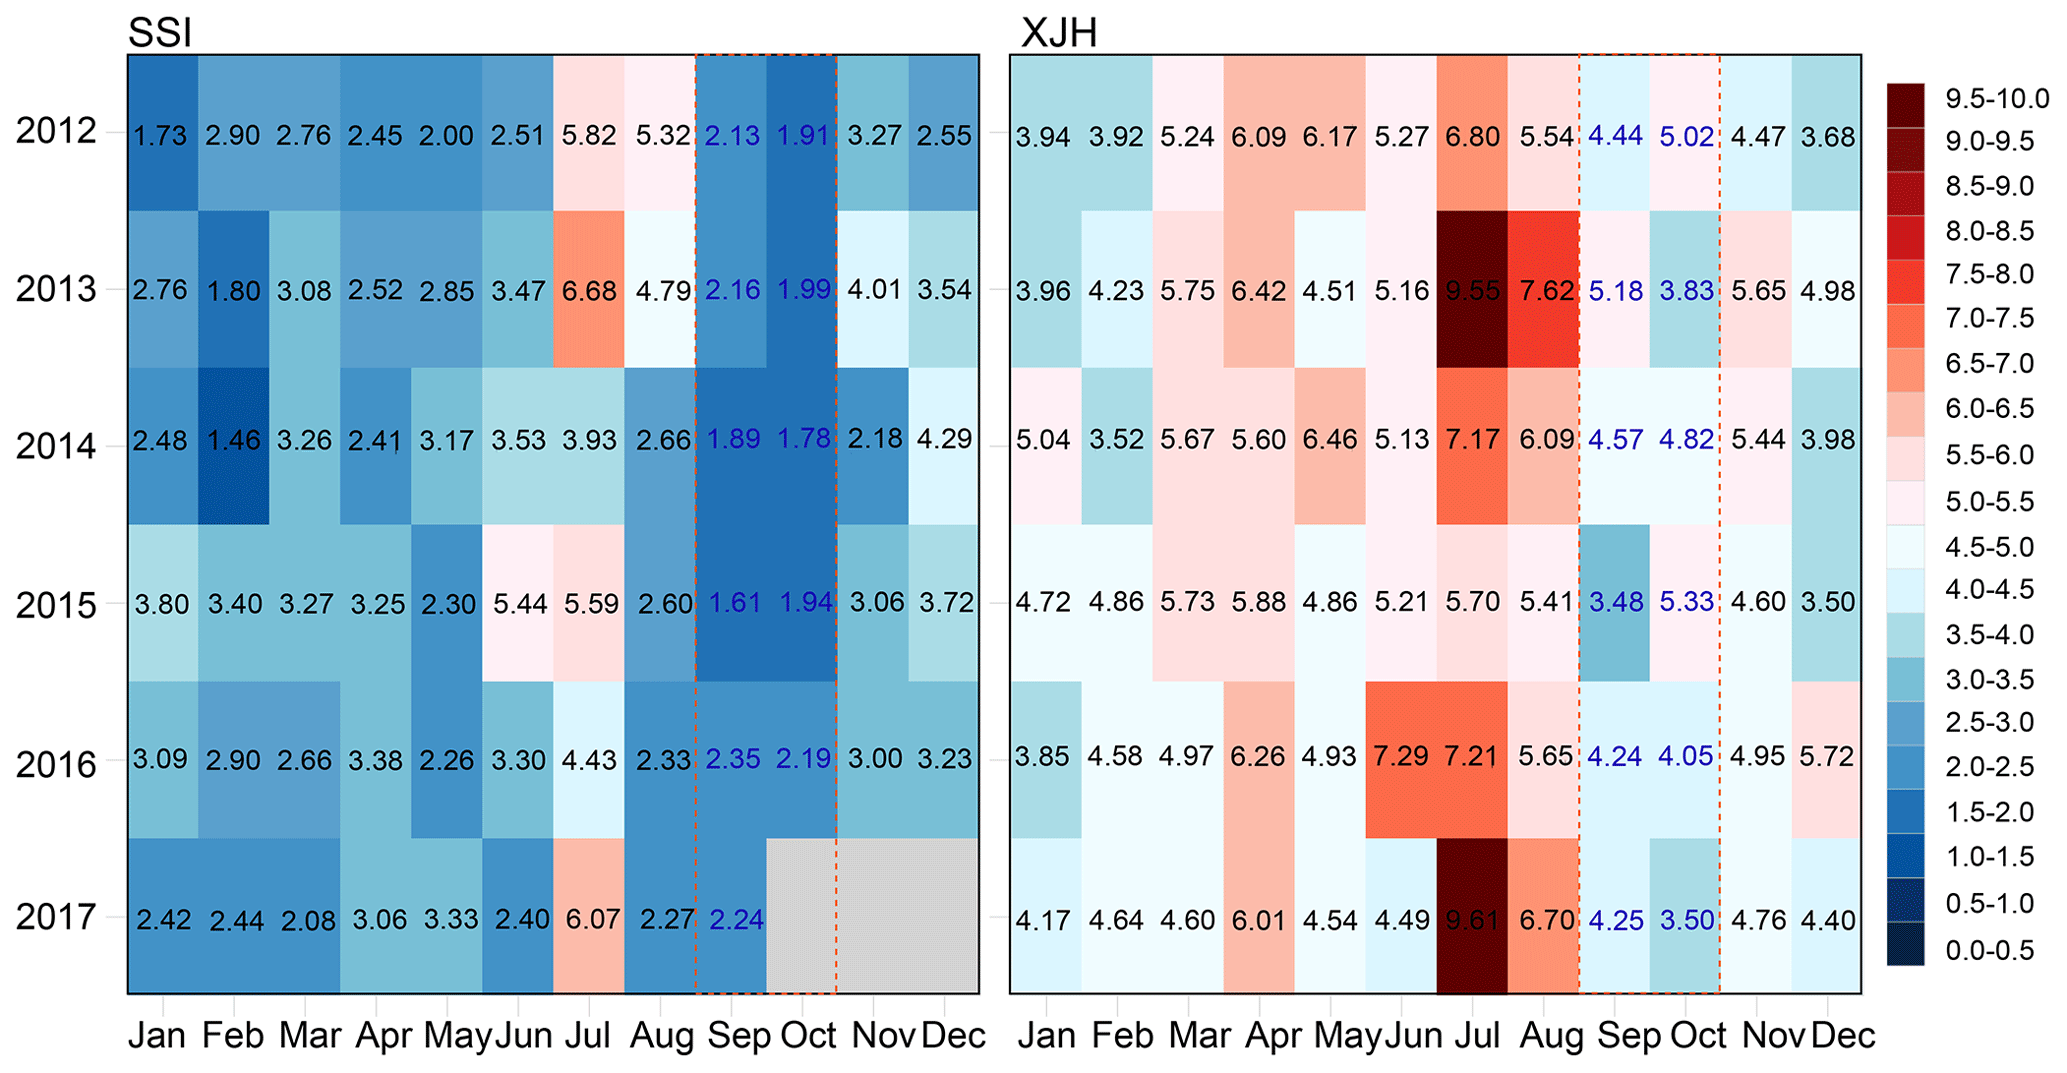
Figure 5Calculated monthly mean ratios of daily maximum O3 concentrations (O3−max) to minimum O3 concentrations (O3−min) at the Sheshan Island (SSI, remote and oceanic) and Xujiahui (XJH, urban) sites, respectively, from 2012 to 2017.
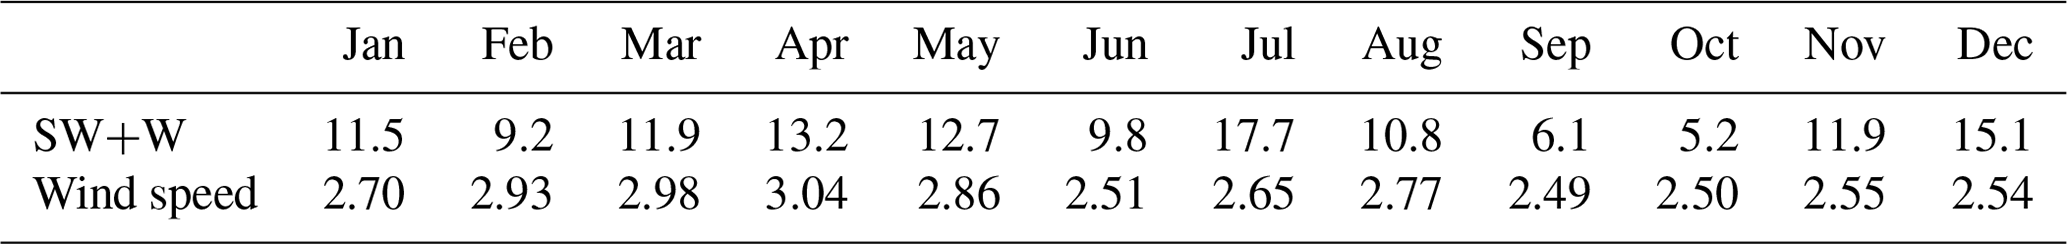
Figure 5 displays the calculated monthly mean O3−max ∕ O3−min ratios at SSI and XJH, respectively, from 2012 to 2017. Generally, the observed ratios of O3−max ∕ O3−min at SSI were much lower than those at XJH in all months, suggesting less of an impact of anthropogenic emissions on O3 levels. The calculated mean ratios were 3.03 and 5.20, respectively, at SSI and XJH, and most of the calculated values were larger than 4.50 at the urban site. Besides, the ratios presented distinct seasonal differences at the XJH and SSI sites. Higher values were observed in summer, indicating stronger photochemical production of daytime O3 from June to August. At SSI, the O3−max ∕ O3−min ratio exhibited relatively low values in September and October, ranging from 1.61 to 2.35 during the studied period. The values were consistent with the typical values of O3−max ∕ O3−min observed at continental background sites in China (Xu et al., 2008; Meng et al., 2009; Gu et al., 2020). Since the observed temperature and solar radiation still exhibited higher values during the 2 months in Shanghai (Gao et al., 2017), the observed low O3 diurnal amplitudes should not be attributed to the weakened photochemical formation of O3 as with those in winter. Due to the persistent control of an anticyclone, Shanghai and its neighboring areas are usually dominated by stable weather conditions in September and October, resulting in more gentle and diversified wind conditions. During the 2 months, the occurrences of more polluted SW and W winds were lowest (6.1 % and 5.2 %) throughout the year. The corresponding wind speed (2.49 and 2.50 m s−1) also exhibited values 20 % lower than those in other months (Table 2). The transport conditions led to fewer pollutants transported to the SSI region, which could explain the observed weak diurnal variabilities of O3 in September and October. The transport conditions together with an O3 response further confirmed that the transport of city pollutants had minimum impacts on the offshore O3 levels in oceanic air at SSI in September and October, providing a good proxy to study the baseline oceanic O3 and oxidation capacity of background atmosphere in eastern China.
Table 2Monthly mean wind speeds (m s−1) and occurrence frequencies (%) of the southwest (SW) and west (W) winds at the Dongtan (DT) site, a remote rural site near Sheshan Island (SSI), from 2012 to 2017.
3.3 Overall changes of ozone in oceanic air at SSI
Several studies have observed increasing trends of ground-level O3 in metropolitan areas over eastern China since 2013, suggesting that the O3 increases were mostly attributed to the NOx emission reductions (Ma et al., 2016; Gao et al., 2017; Lu et al., 2018; Li et al., 2019b). However, the O3 changes at remote sites were relatively not well elucidated during past years. Figure 6a presents the monthly variations of O3 concentrations at SSI and XJH during the 2012–2017 period. The statistical results of the MK test and Theil–Sen trend estimate method indicated that observed monthly mean O3 mixing ratios (O3−ave) exhibited increasing changes at both urban (XJH) and remote sites (SSI) in Shanghai, with a calculated increasing rate of 1.97 and 1.12 ppbv yr−1, respectively, in XJH and SSI. Though an overall upward trend of O3 was detected at SSI, the changes were not as remarkable as those observed at XJH, which could not even pass the MK trend test at the 90 % confidence level. The monthly mean MDA8 and daily extreme values of O3 exhibited similar differences between the two sites. The calculated increasing rates of MDA8 O3, O3−max and O3−min were 2.73, 2.77 and 1.35 ppbv yr−1 (α<0.05), respectively, at XJH and 1.01, 1.35 and 1.27 ppbv yr−1 (α>0.10), respectively, at SSI. Compared to the rapid O3 increases in urban Shanghai, which was suggested to mostly result from the significant NOx emission reductions in the past decade (Gao et al., 2017; Xu et al., 2019), the statistically insignificant changes of O3 detected at SSI indicated that O3 in the oceanic air remained at a relatively constant level during the study period and was less influenced by the decreases of NOx emissions.
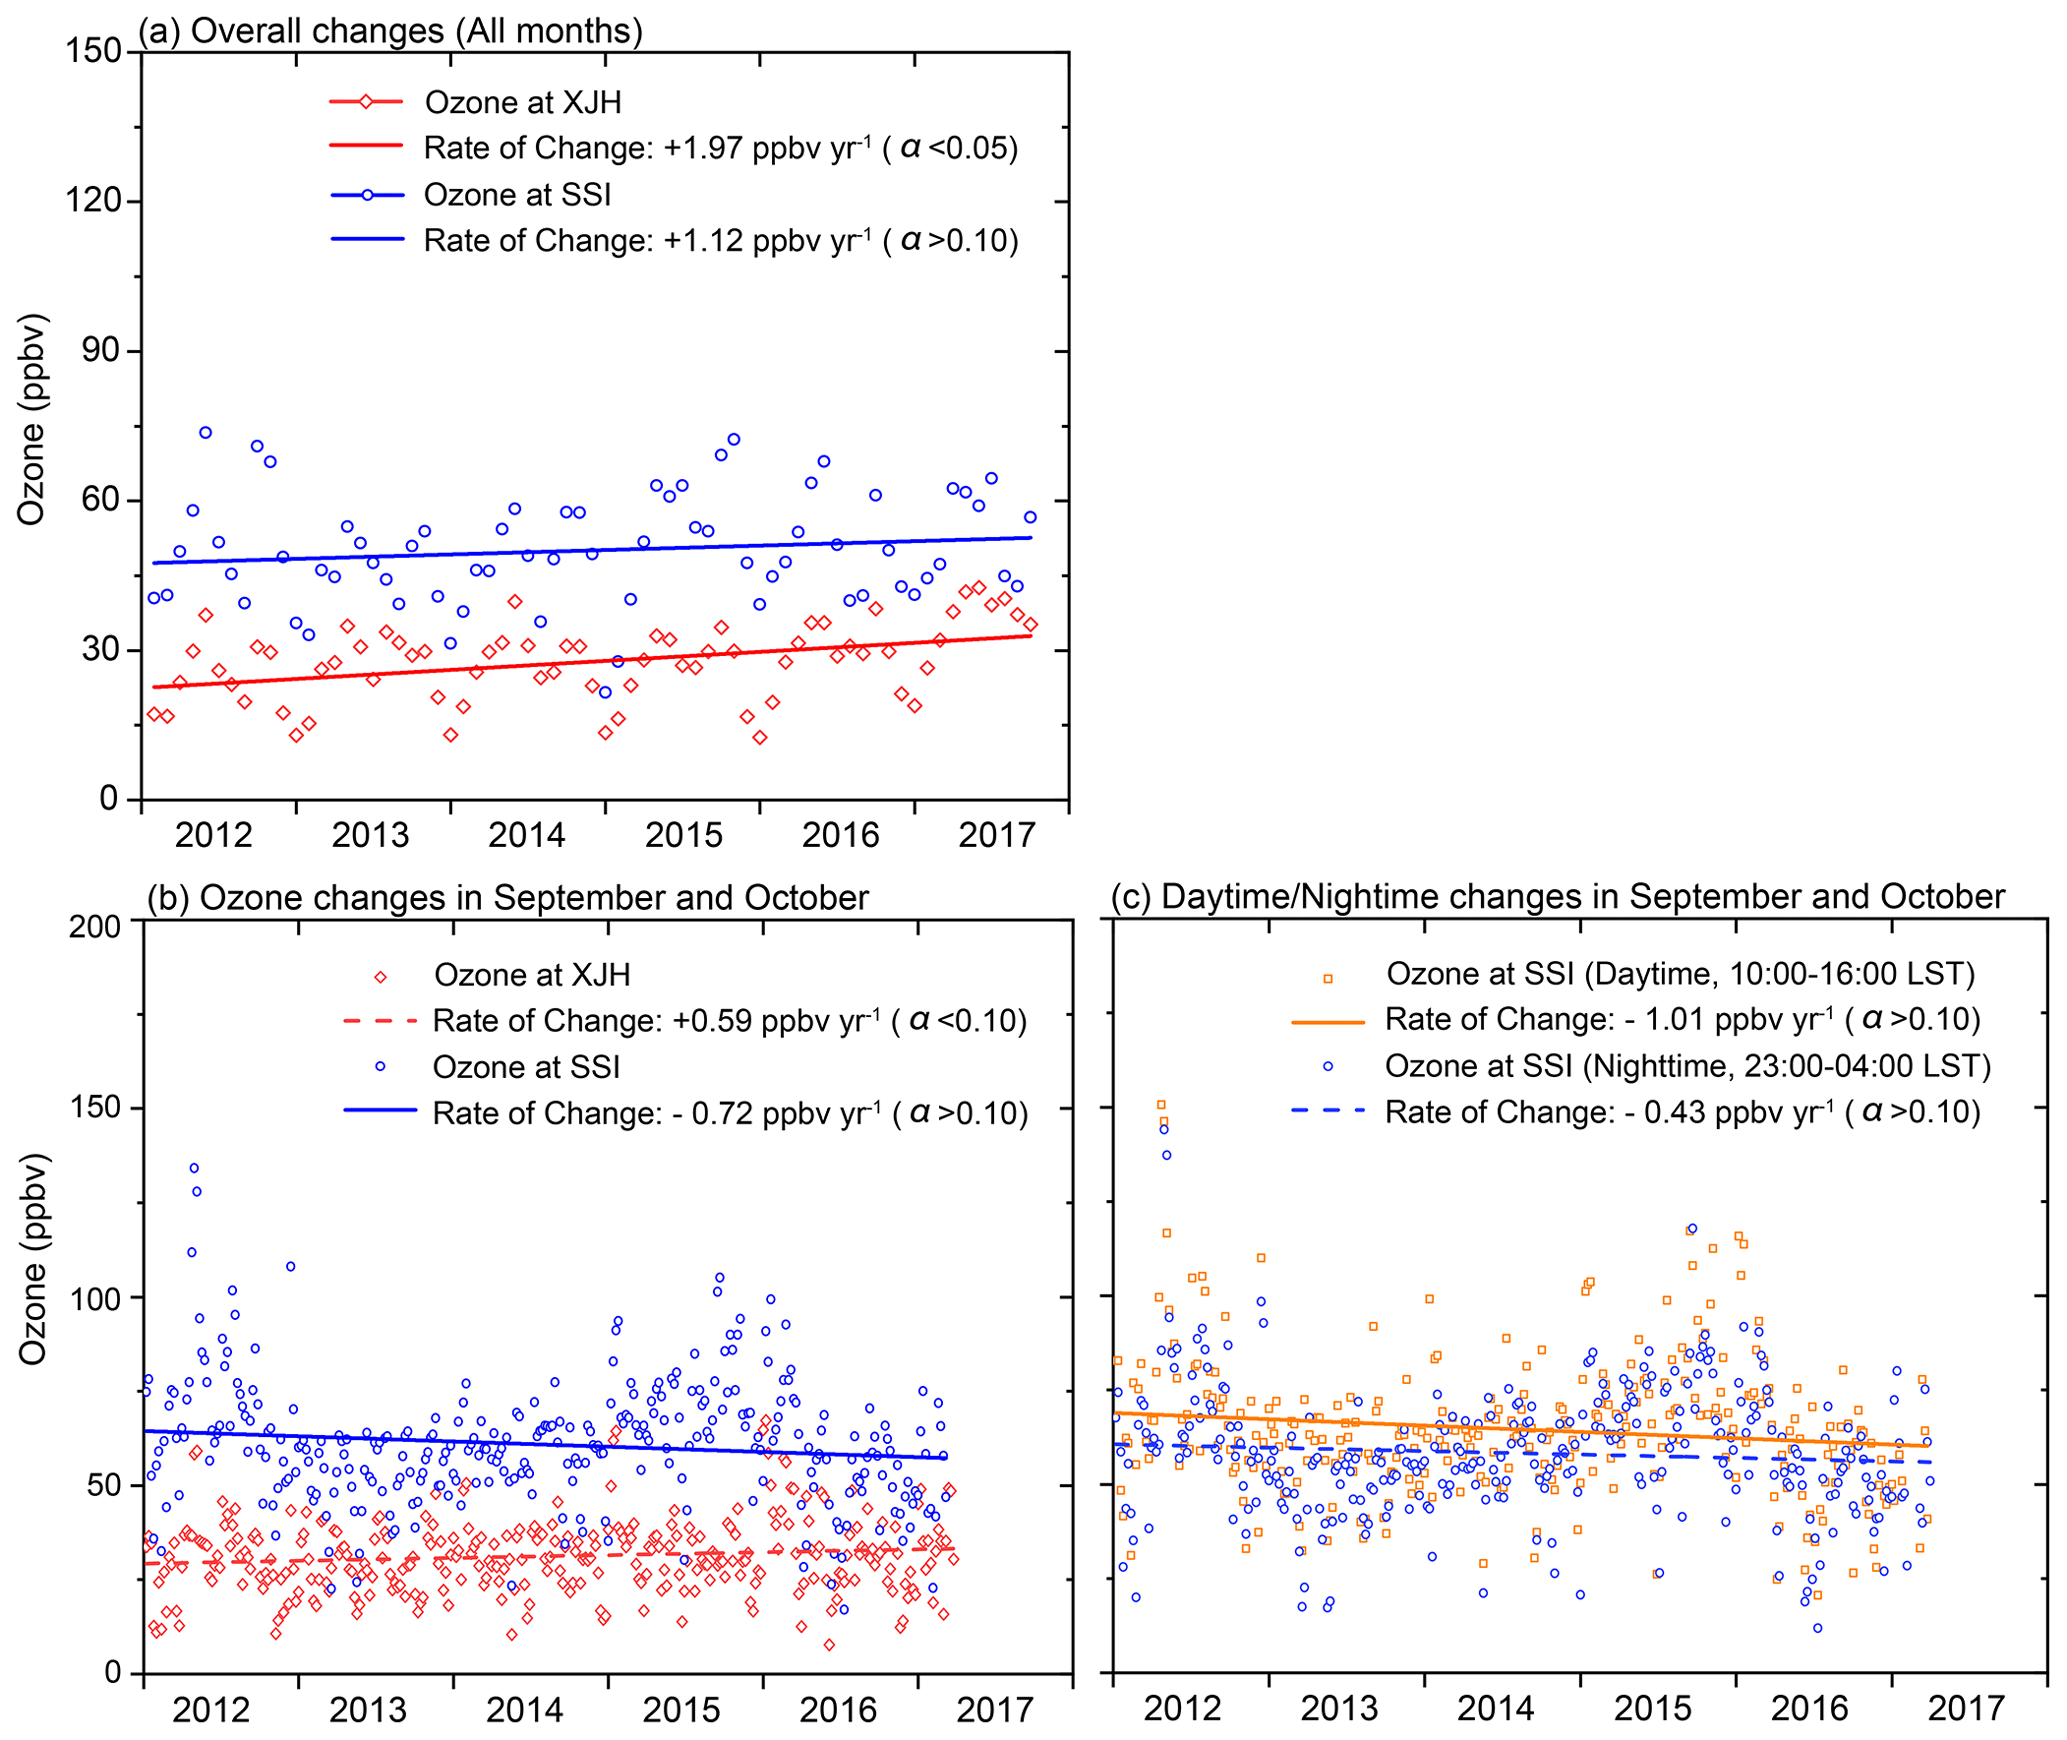
Figure 6Variations of (a) monthly mean O3 concentrations at the Sheshan Island (SSI, remote and oceanic) and Xujiahui (XJH, urban) sites during the period 2012–2017. (b) Corresponding variations of daily mean O3 concentrations at SSI and XJH in September and October. (c) Variations of mean O3 concentrations during daytime (10:00–16:00 LST) and nighttime (23:00–04:00 LST) at SSI.
As discussed in Sect. 3.1, the prevailing winds carried different levels of pollutants to SSI, resulting in different impacts on the O3 levels in different months. In September and October, the frequencies of SW and W winds that carried high levels of pollutants were lowest (Tables 1–2), exerting the least amount of influence on the atmospheric composition at SSI. Therefore, the variations of surface O3 concentrations in September and October at SSI were examined to further assess the changes of the least contaminated O3 in the oceanic air. Figure 6b presents the overall changes of daily mean surface O3 concentrations in September and October at SSI and XJH, respectively, during the 6-year period. The corresponding mean O3 mixing ratios during the 2 months were 60.9 and 31.3 ppbv, respectively, at SSI and XJH. Compared to the significant elevated O3 concentrations at XJH (0.59 ppbv yr−1, α<0.10) in September and October, observed O3 at SSI during the same months exhibited insignificant decreasing changes from 2017 to 2017. The changes (−0.72 ppbv yr−1, α>0.10) were somewhat different from the overall O3 changes (+1.12 ppbv yr−1, α>0.10) at SSI, suggesting different causes of the observed O3 changes in the oceanic air during September and October.
Table 3Statistical results of the Mann–Kendall test and Theil–Sen trend estimate for daily mean values of NOx, CO mixing ratios, temperature (T) and wind speed (WS) in September and October at the Dongtan (DT) site, a remote rural site near Sheshan Island (SSI), during the 2012–2017 period. The units of the calculated slopes are ppbv yr−1 for NOx and CO, ∘C yr−1 for T and m s−1 yr−1 for WS.

a The result is significant at the 95 % confidence level. b The result cannot pass the Mann–Kendall trend test at the 90 % confidence level.
To investigate possible drivers of the observed changes in the least contaminated O3 in September and October at SSI, Table 3 displays the statistical results of the MK test and Theil–Sen trend estimate for NOx and CO mixing ratios, temperature and wind speed during the 2012–2017 period. Statistically significant upward trends were detected in wind speed, with estimated increasing rates of 0.21 m s−1 yr−1 during the observation period (α<0.05). The significantly enhanced surface wind speeds were conducive to the diffusion of O3, which might be an important meteorological driver of the observed decreasing changes in O3 levels at SSI from 2012 to 2017. Observed NOx and CO levels exhibited increases of 0.48 ppbv yr−1 (α<0.05) and 2.67 ppbv yr−1 (α>0.10), respectively, in September and October during the 6-year period, indicating enhanced transport of pollutants to the oceanic area. Tie et al. (2013) suggested that the VOC-limited regime of O3 formation was not only confined to urban Shanghai but also extended to a broader regional area surrounding Shanghai. Thus, the elevated NOx concentrations might not only retard daytime O3 production but also enhance nighttime O3 depression at SSI. Figure 6c further presents corresponding variations of daytime (10:00–16:00 LST) and nighttime (23:00–04:00 LST) mean O3 concentrations at SSI. Both daytime and nighttime O3 concentrations exhibited downward changes, reflecting the O3 response to the enhanced O3 diffusion and depression in September and October. Therefore, the enhanced diffusion and depression of O3 induced by the elevated wind speed and NOx concentrations might be important causes of the observed O3 changes in September and October at SSI. It should be noted that the influence of radiation cannot be analyzed since observations of solar radiation were not available during the study period. Therefore, more measurements are still needed to further understand the O3 changes and corresponding drivers in the oceanic air.
3.4 Impacts of urban plumes on ozone in oceanic air at SSI
Due to the relatively long residence lifetime (about 1 month), O3 produced at urban regions could be transported several hundred kilometers away to downwind areas. Meanwhile, the urban plumes become more aged with continuous production and depletion of O3 and its precursors, resulting in nonlinear changes in O3 in downwind areas (Geng et al., 2011; Tie et al., 2009, 2013). Several studies suggested that there tended to be considerable O3 formations in aged urban plumes in the downwind region of Shanghai (Geng et al., 2011; Tie et al., 2013). To investigate the impacts of urban plumes on the O3 levels in oceanic air at SSI, the relationships between observed O3 and NOx under different wind conditions at SSI and DT are investigated in this section.
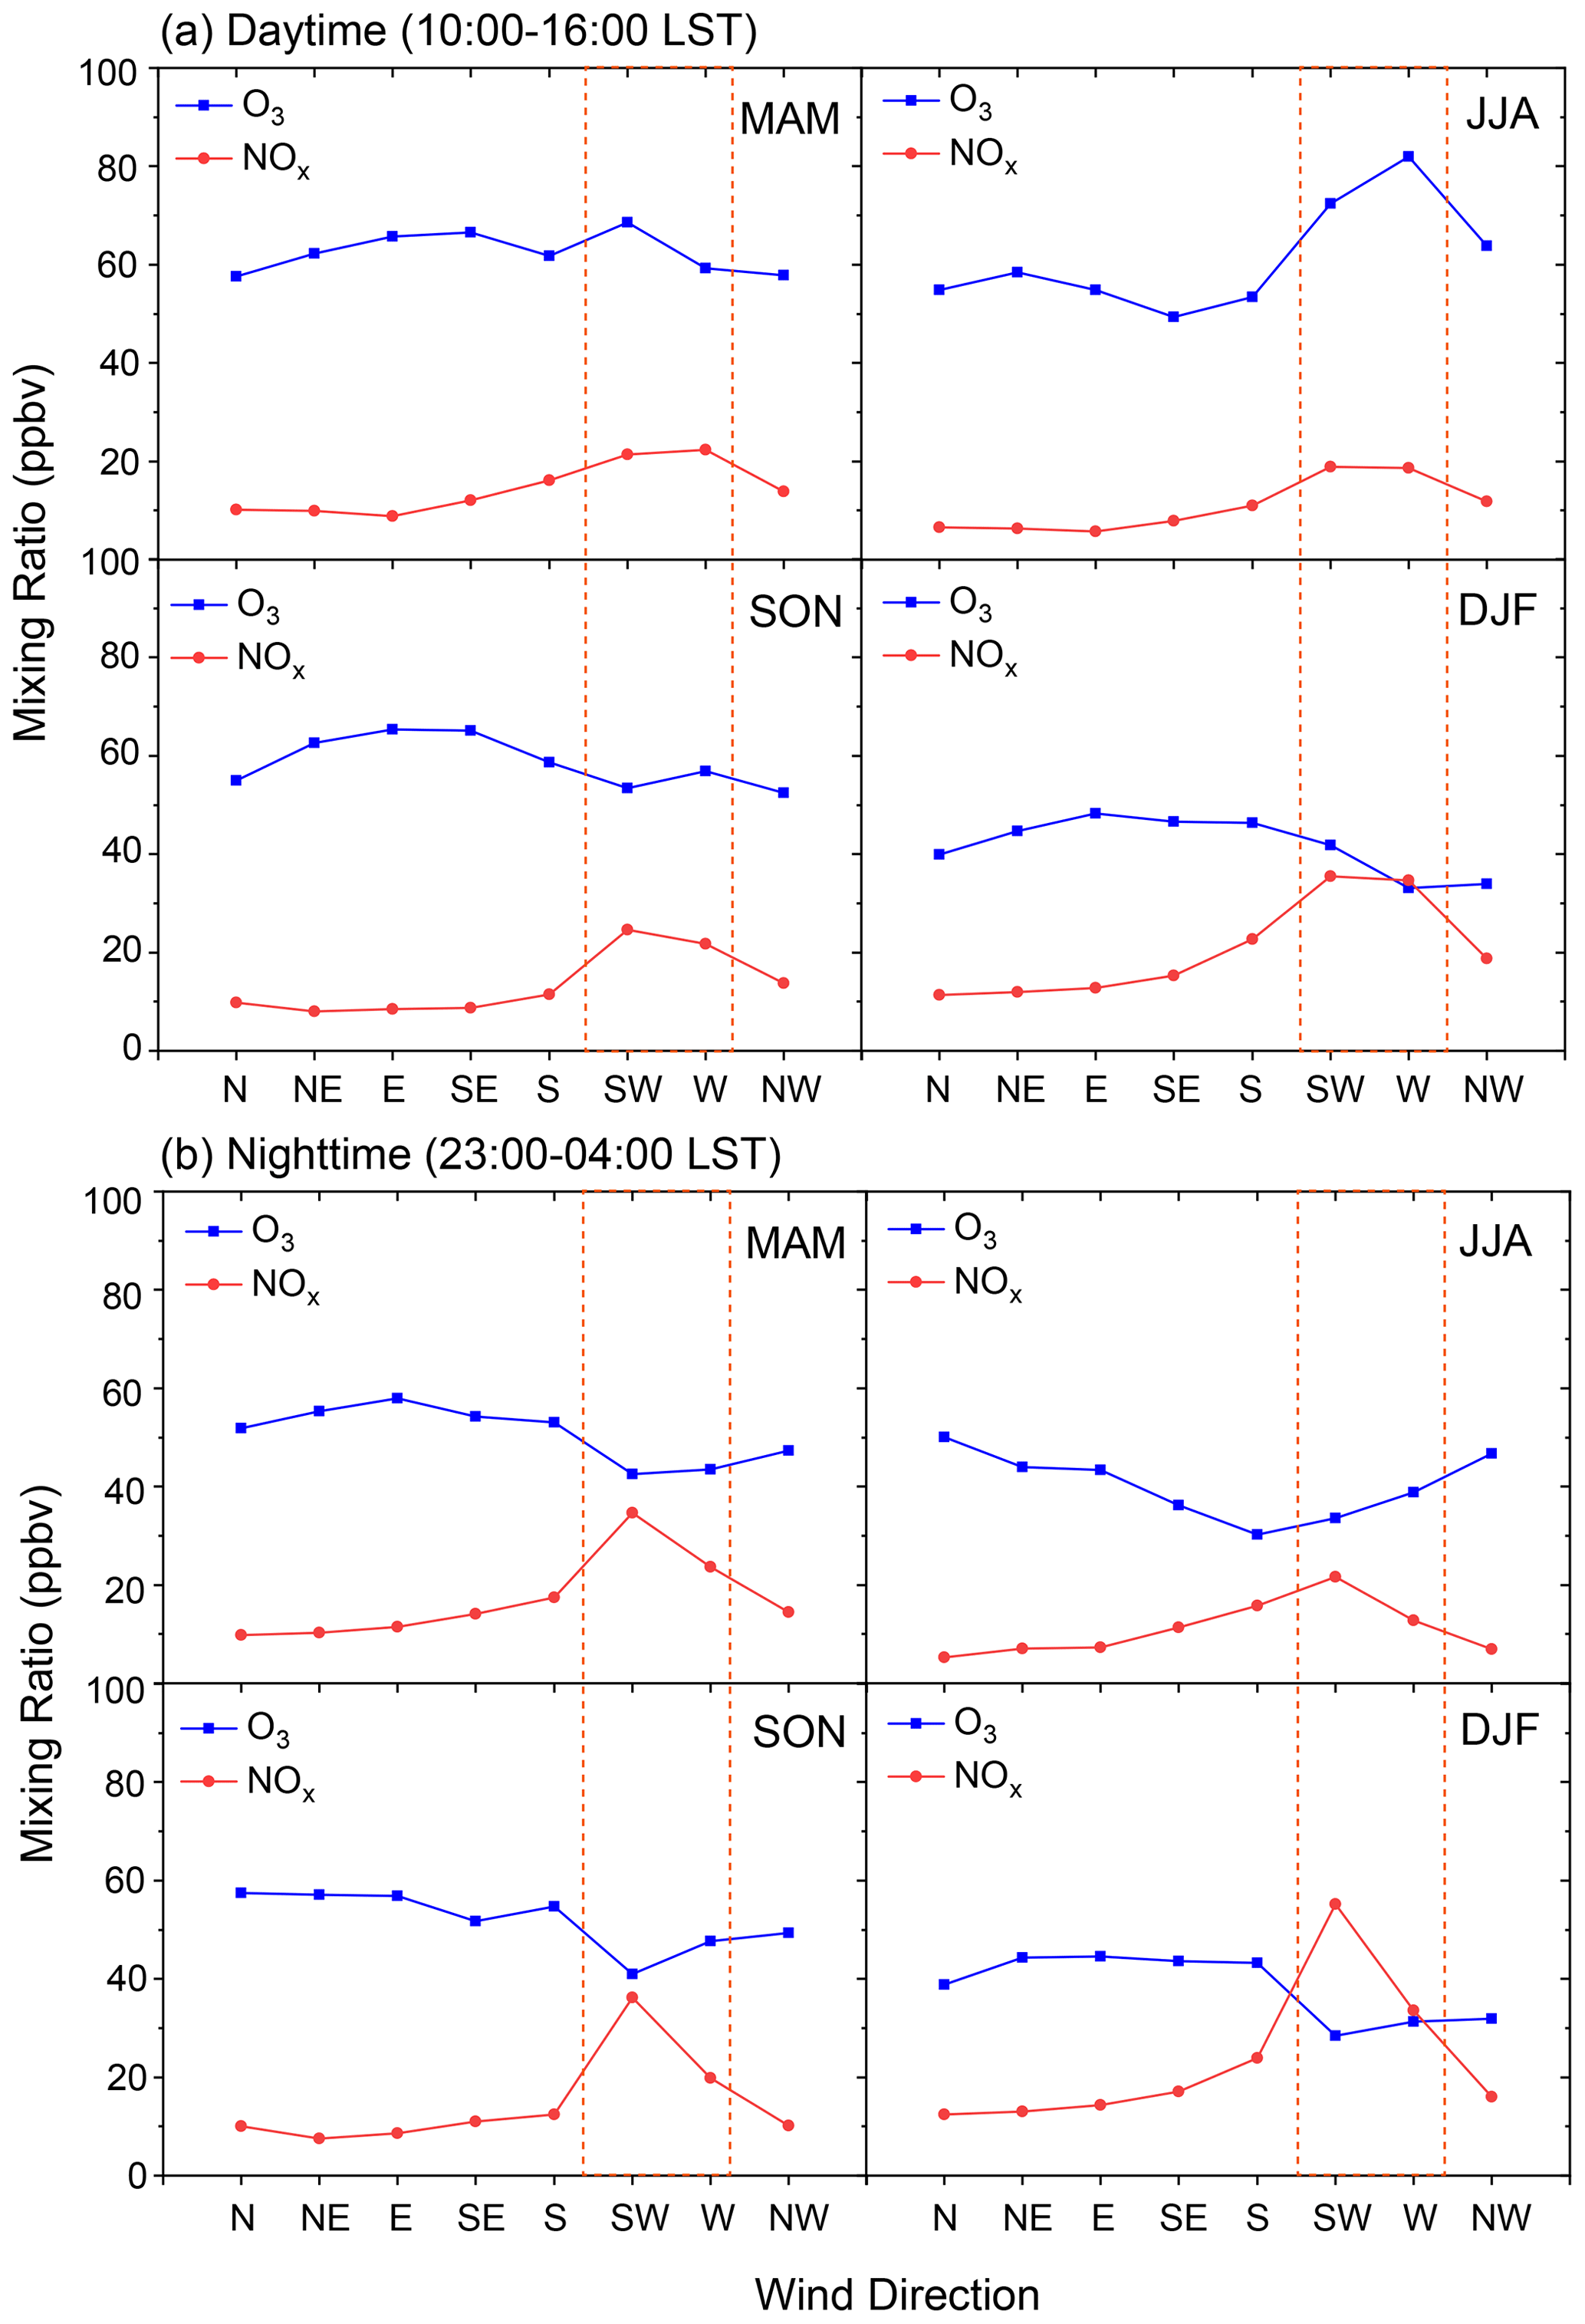
Figure 7Daytime and nighttime mean O3 mixing ratios (ppbv) at Sheshan Island (SSI) and NOx mixing ratios (ppbv) at the Dongtan (DT) site, a remote rural site near SSI, under north (N), northeast (NE), east (E), southeast (SE), south (S), southwest (SW), west (W) and northwest (NW) wind conditions in MAM (March–May), JJA (June–August), SON (September–November) and DJF (December–February), respectively, from 2012 to 2017.
Figure 7 presents the daytime and nighttime O3–NOx wind relationships in MAM (March–May), JJA (June–August), SON (September–November) and DJF (December–February), respectively, from 2012 to 2017. The SW and W winds were associated with higher NOx concentrations in both daytime and nighttime. The result was consistent with the observed CO changes in Sect. 3.1. Since there is no local anthropogenic emission at SSI, the higher levels of NOx and CO mainly resulted from the transport of more polluted urban plumes by the SW and W winds. Generally, observed daytime O3 and NOx concentrations presented opposite variations with the wind direction changes (Fig. 7a). In SON and DJF, the correlation coefficients (Rs) between daytime O3 and NOx were −0.72 and −0.75, respectively, indicating that the O3 formation was inhibited by increased NOx concentrations. The results are in accordance with Tie et al. (2013) and Xu et al. (2019), who suggested that Shanghai and a broader regional area surrounding the city were all in the VOC-limited O3 formation regime during the study period. However, in MAM and JJA, the daytime O3–NOx variations presented totally different patterns under SW and W wind conditions. As wind directions turned from E–SE to SW–W, observed mean NOx concentrations increased from about 10–20 ppbv, while observed mean O3 concentrations increased from 50–60 to 70–80 ppbv. The enhancements in daytime O3 levels suggested that there should be persistent production of O3 in the polluted air masses carried by the SW and W winds in MAM and JJA.
Based on observations and WRF-Chem simulations, Tie et al. (2013) suggested considerable O3 production in aged city plumes in the downwind area of Shanghai. Since air masses the affecting SSI site were directly originated from Shanghai under the SW and W wind conditions (Fig. 1), the observed O3 enhancements should be mainly attributed to the O3 production in the city plumes carried by SW and W winds. Studies during the MIRAGE-Shanghai campaign suggested several factors that contributed to the O3 enhancements in aged city plumes downwind of Shanghai. First, as there is a large area of forest located in the south of Shanghai, Geng et al. (2011) suggested that continuous oxidation of isoprene emitted by the biogenic sources could result in enhanced production of hydrogen radicals (HO2) especially in warm seasons. Once the air massed were transported north and mixed with high NOx emissions, O3 would be quickly produced. However, the impacts of biogenic emissions on O3 production were mainly limited in the southern part of Shanghai, which can hardly influence the atmosphere in the SSI region. Then, Tie et al. (2013) further illustrated that the OH reactivity of alkane, alkene, aromatics and oxygenated VOCs (OVOCs) contributed to the O3 formation in city plumes. Among them, the influence of alkane, alkene and aromatics mostly occurred within or near the city, while the OVOCs could be produced or emitted during the transport of the city plumes, resulting in substantial O3 enhancements in aged city plumes 100–200 km downwind of Shanghai.
SSI is located approximately 100 km northeast from the downtown area of Shanghai. In MAM and JJA, the SW and W winds carried air masses with enhanced OVOC oxidation and O3 production, resulting in elevated daytime O3 levels on the island, while in SON and DJF, the observed O3 decreases at SSI during SW and W winds suggested lower efficiency of O3 productivity in the city plumes. That might be because fewer OVOCs were released or produced downwind of the city due to the lower temperature and weaker solar radiation (Cai et al., 2009). In addition, in SON and DJF, the SW and W winds were usually related to a low-pressure system with large cloud cover and rich water vapor in Shanghai, which could also lead to depressed photochemical reactions and decreased O3 levels. At night, observed O3 and NOx displayed totally opposite changes with wind directions (Fig. 7b), indicating O3 depression by nighttime NOx titration in all the seasons. High O3 levels were observed under northeasterly, easterly and southeasterly oceanic wind conditions, ranging from 50–60, 30–55, 55–60 and 40–50 ppbv, respectively, at night in MAM, JJA, SON and DJF.
3.5 Impacts of offshore ozone on urban ozone air quality in Shanghai
As is presented in Sects. 3.2 and 3.3, observed O3 concentrations at SSI were much higher than those at the urban site (XJH), suggesting higher levels of O3 in oceanic air than those on the continent. Therefore, sea breezes tend to bring more O3 to the continent, aggravating O3 pollution in coastal cities. Shanghai is one of the largest cities located on the eastern coast of China, experiencing severe O3 pollution in recent years (Xu et al., 2019; Gu et al., 2020). According to the cluster analysis results (Fig. S2), easterly winds from the ocean greatly affected the Shanghai region, accounting for 64 %–78 % of the total flows in non-winter months during the period 2012–2017. To understand the impacts of higher O3 in oceanic air on the urban air quality, numerical experiments are conducted using the WRF-Chem model to examine the response of O3 levels in Shanghai to various oceanic air inflow conditions in this section.
Simulations were performed from 1 to 30 September 2014 when the prevailing winds were mostly northeasterly and easterly in the Shanghai region. The occurrence frequencies of the northeasterly and easterly winds were 23 % and 27 %, respectively, during the simulation period, suggesting the dominant influence of the oceanic air inflows to Shanghai. Consistent with the above analysis, observed air O3 concentrations were much higher in oceanic regions than those in city areas, with monthly mean values of 30.9 and 57.7 ppbv, respectively, at XJH and SSI in September 2014. The chemical boundary conditions (BCs) of the regional model can represent the inflows conditions to explore their impacts on surface concentrations of air pollutants over a certain continent region. Using this method, Pfiter et al. (2011) proposed that chemical inflows taken from different observational and model datasets could result in differences of ± 15 ppbv in O3 levels on the US west coast. Therefore, three sets of numerical experiments are conducted as follows to assess the impacts of oceanic O3 air inflows on the urban O3 air quality in Shanghai. All the simulations are driven by the same emissions, initial conditions, and physical and chemical schemes.
-
BC_40. O3 concentrations at the eastern lateral boundary of the domain on the ocean are assigned to 40 ppbv, which is provided by the MOZART-4 model, close to the observed urban O3 levels (29.0–38.4 ppbv) in Shanghai in September. The chemical BCs are updated every 6 h.
-
BC_50. Same as BC_40 but with O3 concentrations setting to 50 ppbv at the eastern lateral boundary of the domain.
-
BC_60. Same as BC_40 but with O3 concentrations at the eastern lateral boundary of the domain setting to 60 ppbv according to the observed O3 levels at SSI (50.9–71.0 ppbv) in September.
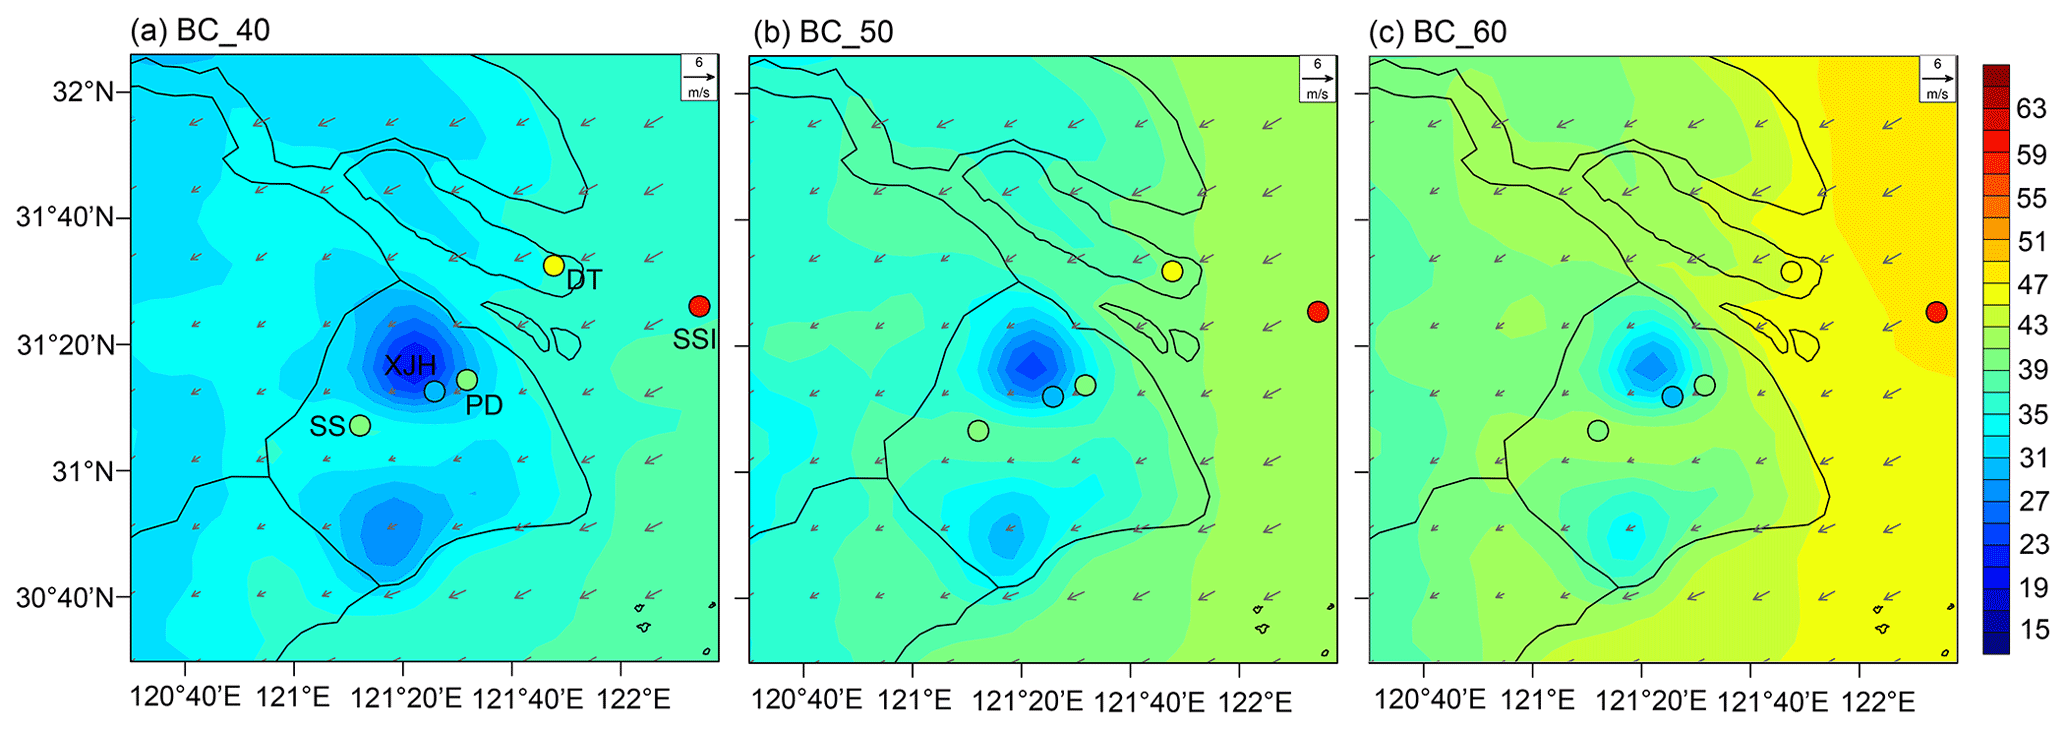
Figure 8Calculated distributions of monthly mean O3 concentrations (shades, ppbv) from BC_40, BC_50 and BC_60 simulations, respectively, in September 2014. Model results are compared with observed mean O3 concentrations (circles, ppbv) obtained from the Sheshan (SS), Xujiahui (XJH), Pudong (PD), DT (Dongtan) and Sheshan Island (SSI) sites. Also shown is the calculated wind field (m s−1) averaged over the same period.
Figure 8 displays the simulated and observed monthly mean distributions of surface O3 concentrations in the BC_40, BC_50 and BC_60 scenarios, respectively. In addition to the observations at XJH and SSI, O3 measurements obtained from other three sites, Pudong (PD, suburban), Sheshan (SS, rural) and Dongtan (DT, rural), during the same period were introduced to evaluate the model's performance in simulating O3 in Shanghai. The O3 concentrations at all the sites were measured using the same method as described in Sect. 2.1. The calculated distributions of O3 agree with observations, which exhibit lower values in urban regions compared to those in rural and ocean areas, indicating strong O3 depressions in Shanghai due to the VOC-limited O3 formation regime. The R values between the simulated and observed O3 concentrations are all larger than 0.50 at continental sites (XJH, PD, SS and DT), suggesting good prediction of O3 variations by the model.
Table 4Statistical results of the comparisons between the simulated and observed surface O3 concentrations at the Sheshan (SS), Xujiahui (XJH), Pudong (PD), DT (Dongtan) and Sheshan Island (SSI) sites during September 2014. The calculated O3 levels are obtained from BC_40, BC_50 and BC_60 simulations, respectively. Values of the average surface O3 concentrations (Mean) and normalized mean bias (NMB) are displayed. The NMB is defined as NMB , where Pi and Oi are predicted and observed ozone mixing ratios for sample i, n is the number of total samples (numbers in parentheses).
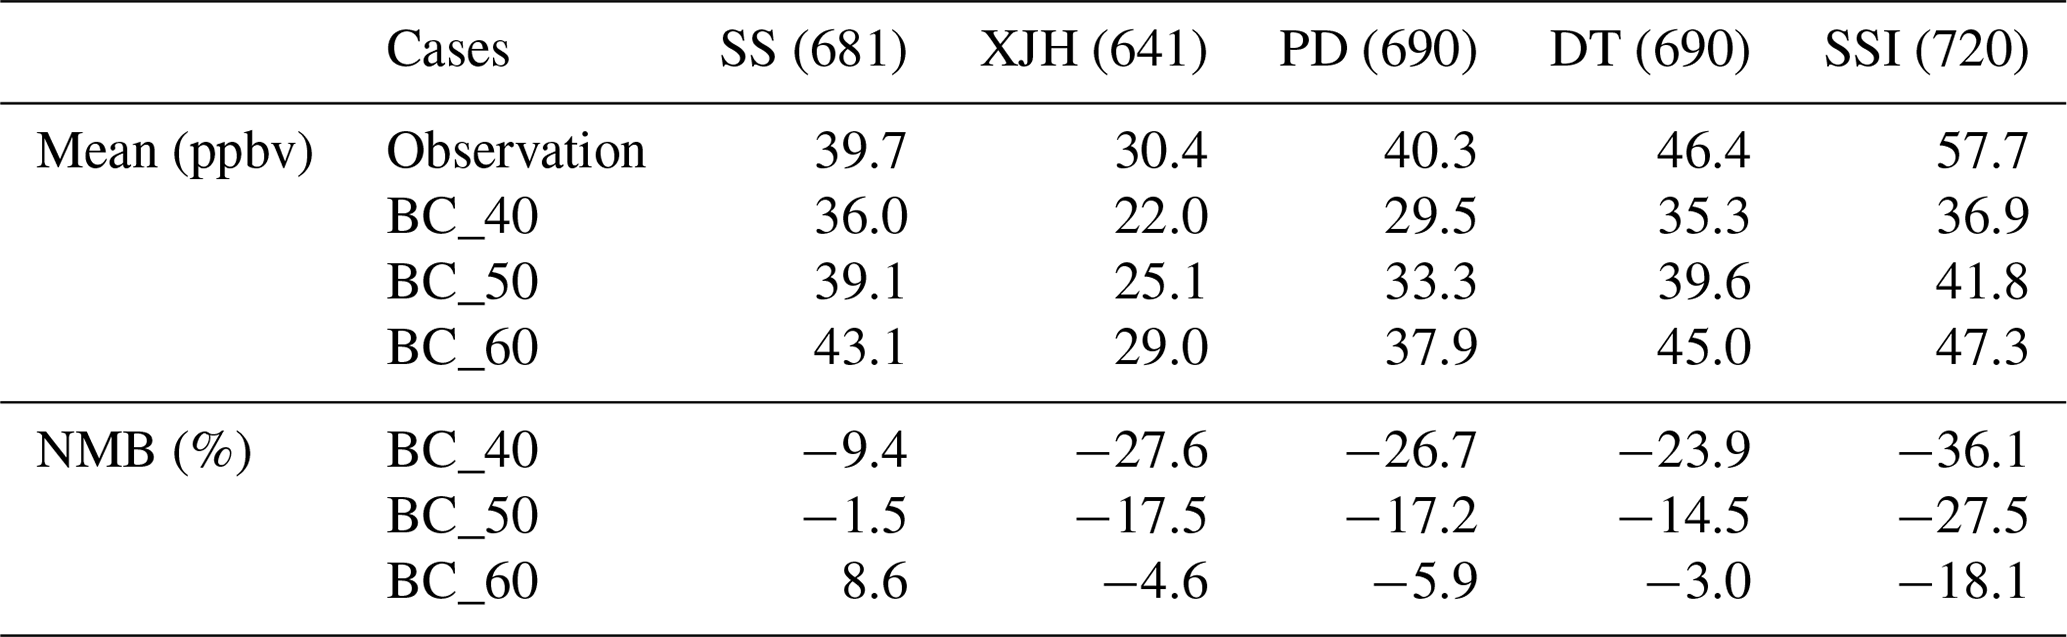
Table 4 displays the statistical results of the comparisons between the simulated and observed surface O3 concentrations at different sites in Shanghai. Generally, the WRF-Chem model underestimates O3 concentrations at all the sites in most cases. Taking the BC_40 scenario, for example, the O3 concentrations are underestimated by 9.4 %–27.6 % at continental sites and 36.1 % at SSI, suggesting a larger underestimation of O3 concentrations in oceanic regions. Model results further suggest that elevated O3 levels in the eastern chemical BCs would lead to increases in O3 concentrations at both urban and remote sites when the prevailing winds are mostly easterly in Shanghai. With O3 concentrations increasing from 40 to 60 ppbv in the easterly oceanic air inflows, the simulated monthly mean O3 concentrations increase by 7.0 to 9.7 ppbv at continental sites and 10.4 ppbv at SSI. The underestimation of O3 levels by the model is also greatly improved in the BC_60 scenario, when the chemical BCs of O3 are closer to the observations. Compared to those in the BC_40 scenario, the normalized mean bias (NMB) of the predicted O3 concentrations reduced at most sites in the BC_60 scenario, for example from −36.1 % to −18.1 % at SSI and −27.6 % to −4.6 % at XJH, suggesting a crucial role of the eastern oceanic air inflows in influencing O3 air quality in Shanghai.

Figure 9Mean differences in surface O3 concentrations (ppbv) simulated with different chemical boundaries: (a) BC_50 minus BC_40, (b) BC_60 minus BC_40 and (c) BC_60 minus BC_50 in September 2014. Also shown is the calculated wind field (m s−1) averaged over the simulation period.
The calculated monthly mean differences in surface O3 concentrations between simulations in different scenarios are further presented in Fig. 9. Since the dominant winds are easterly during the simulation period, distinct changes in surface O3 concentrations throughout Shanghai are generated, exhibiting generally gradient increases from the ocean to the continent as O3 increases in the oceanic air inflows. With every 10 ppbv increase in O3 levels in oceanic air, the simulated surface mean O3 concentrations increase by 3–6 ppbv in the land area and 4–7 ppbv in the offshore region. Due to the strong O3 depressions associated with high anthropogenic emissions, the simulated O3 enhancements are relatively lower in the central urban region compared to those in surrounding areas. Even so, simulated mean O3 concentrations still exhibit 6–8 ppbv increases in downtown Shanghai in the BC_60 scenario, accounting for approximately 30 % of the simulated O3 concentrations in the BC_40 case. During the period 2012–2017, most of the measured O3 concentrations ranged between 50 and 60 ppbv at SSI in non-winter seasons. Carried by the easterly inflows, these oceanic air masses with higher O3 levels (50–60 ppbv) could be transported to the coastal regions, resulting in approximately 20 %–30 % increases in urban O3 concentrations in Shanghai according to the sensitivity results.
In this paper, we present the first relatively long and continuous measurements of oceanic air O3 conducted at an offshore monitoring station on Sheshan Island from 1 January 2012 to 15 September 2017.The southwesterly and westerly winds proved to carry more pollutants to the SSI site, exerting greater influence of human activities on the oceanic atmosphere over the offshore region of the East China Sea. Since the two kinds of winds exhibited minimum occurrence frequencies and wind speeds in September and October, atmosphere at SSI during the 2 months are considered to be less affected by the transport of regional pollution.
Compared to those in urban (XJH) and rural (DT) sites, the observed O3 levels were higher at SSI, with a mean value of 50.1 ppbv during the observation period. Similar seasonal and diurnal patterns of O3 were observed at SSI and XJH; however, the amplitudes of O3 variations were much smaller at the offshore site (SSI). Since O3 formation in Shanghai and its surrounding regions were VOC-limited, the observational results suggested that the production and depression of O3 could be weaker in the ocean regions due to the weak influence of the anthropogenic emissions. Observed mean O3−max ∕ O3−min ratios also exhibited lower values at SSI (3.03) than those at XJH (5.20), with minimum values ranging from 1.61 to 2.35 in September and October. The result further illustrated that SSI was seldom affected by the anthropogenic emissions, especially in September and October.
The multiyear changes of the oceanic O3 at SSI are investigated using the Mann–Kendall trend test and the Theil–Sen trend estimate method from 2012 to 2017. Different from the significant O3 increases detected at XJH and other rural sites reported in previous studies, the observed mean O3 concentrations at SSI exhibited statistically insignificant increasing changes (1.12 ppbv yr−1, α>0.10) during the observation period and insignificant decreasing changes (−0.72 ppbv yr−1, α>0.10) in September and October when the transport of city pollutants had minimum impacts on the island. Due to fewer impacts of anthropogenic emissions, most of the observed changes in O3 at SSI could be attributed to the changes of meteorological conditions. Observed wind speed exhibited significant increases (0.21 m s−1 yr−1, α<0.05) in September and October during the observation period, suggesting that enhanced diffusion conditions could be an important meteorological factor in determining the decreases in O3 concentrations during the observation period.
The impacts of urban plumes on O3 levels in oceanic air at SSI are evaluated by studying the relationships between observed O3 and NOx under different wind conditions. The SW and W winds usually carried air masses with higher NOx concentrations in both daytime and nighttime to the island. Generally, observed daytime and nighttime O3 concentration decreased as NOx concentration increased in SW and W winds, exhibiting typical VOC-limited characteristics of O3 formation. The pattern was more typical in SON and DJF, with R values of −0.72 and −0.75, respectively, between O3 and NOx concentrations. In MAM and JJA, the daytime O3–NOx variations presented a kind of a positive relationship under SW and W wind conditions, suggesting continuous O3 production in aged city plumes from Shanghai. As reported in previous studies during the MIRAGE-Shanghai campaign, enhanced OVOCs oxidation should be the most important driver of the observed O3 enhancements in the city plumes transported by the SW and W winds.
The influence of the oceanic O3 air inflows on urban O3 air quality in Shanghai are quantified during an easterly wind dominant episode (1–30 September 2014). Numerical experiments are conducted with chemical BCs of O3 assigned according to different inflow conditions using the WRF-Chem model. Model results suggest that increases of O3 in the easterly oceanic air inflows will lead to gradient increases from the ocean to the continent. With every 10 ppbv O3 increase, the calculated surface mean O3 concentrations can increase by 3–6 ppbv in the land and 4–7 ppbv in the offshore region. Compared to those in surrounding regions, O3 in central Shanghai exhibited lower enhancements in response to the O3 increases in oceanic air inflows due to strong O3 depression processes. Even so, the impacts of the oceanic air inflows can still lead to 20 %–30 % increases in urban O3 concentrations which should be crucially considered in dealing with O3 pollution in large coastal cities like Shanghai.
The data used in this paper can be provided upon request from Dr. Jianming Xu (metxujm@163.com).
The supplement related to this article is available online at: https://doi.org/10.5194/acp-20-14361-2020-supplement.
YG and JX came up with the original idea, designed the analysis methods, developed the model code and performed the simulations. WG provided the observational data. YG and YQ conducted the analysis of the observations and model results. YG prepared the paper with contributions from all coauthors.
The authors declare that they have no conflict of interest.
The authors appreciate the efforts of NCEP and NCAR to provide the global reanalysis data. The authors thank the editor and two anonymous reviewers for their advice on the paper revision.
This research has been supported by the Ministry of Science and Technology of the People's Republic of China (grant no. 2019YFC0214605), Shanghai Sailing Program (grant no. 18YF1421200), and the Science and Technology Commission of Shanghai Municipality (grant no. 19DZ1205003).
This paper was edited by Andreas Hofzumahaus and reviewed by two anonymous referees.
Cai, C., Geng, F., Tie, X. X., Yu, Q., and An, J.: Characteristics and source apportionment of VOCs measured in Shanghai, China, Atmos. Environ., 44, 5005–5014, 2010.
Chen, F. and Dudhia, J.: Coupling an advanced land surface hydrology model with the Penn State-NCAR MM5 modeling system, Part I: Model implementation and sensitivity, Mon. Weather Rev., 129, 569–585, 2001.
Cvitas, T. and Klasinc, L.: Measurement of tropospheric ozone in the Eastern Mediterranean, Boll. Geofisico, 16, 521–527, 1993.
Cvitas, T., Kezele, N., Klasinc, L., and Lisac, J.: Tropospheric ozone measurements in Croatia, Pure Appl. Chem., 67, 1450–1453,1995.
Draxler, R. R. and Hess, G. D.: An overview of the HYSPLIT 4 modelling system for trajectories, despersion, and deposition, Austral. Meterol. Mag., 47, 295–308, 1998.
Dudhia, J.: Numerical study of convection observed during the winter monsoon experiment using a mesoscale two-dimensional model, J. Atmos. Sci., 46, 3077–3107, 1989.
Emmons, L. K., Walters, S., Hess, P. G., Lamarque, J.-F., Pfister, G. G., Fillmore, D., Granier, C., Guenther, A., Kinnison, D., Laepple, T., Orlando, J., Tie, X., Tyndall, G., Wiedinmyer, C., Baughcum, S. L., and Kloster, S.: Description and evaluation of the Model for Ozone and Related chemical Tracers, version 4 (MOZART-4), Geosci. Model Dev., 3, 43–67, https://doi.org/10.5194/gmd-3-43-2010, 2010.
Fountoukis, C. and Nenes, A.: ISORROPIA II: a computationally efficient aerosol thermodynamic equilibrium model for K+, Ca2+, Mg2+, NH, Na+, SO, NO , Cl−,H2O aerosols, Atmos. Chem. Phys., 7, 4639–4659, https://doi.org/10.5194/acp-7-4639-2007, 2007.
Fu, Y., Liao, H., and Yang Y.: Interannual and Decadal Changes in Tropospheric Ozone in China and the Associated Chemistry-Climate Interactions: A Review, Adv. Atmos. Sci., 46, 452–460, 2019.
Gao, W., Tie, X., Xu, J., Huang, R., Mao, X., Zhou, G., and Chang, L.: Long-term trend of O3, in a mega city (Shanghai), China: characteristics, causes, and interactions with precursors, Sci. Total Environ., 603/604, 425–433, 2017.
Geng, F., Mao, X., Zhou, M., Zhong, S., and Lenschow, D.: Multi-year ozone concentration and its spectra in Shanghai, China, Sci. Total Environ., 521/522, 135–143, 2015.
Geng, F., Tie, X., Guenther, A., Li, G., Cao, J., and Harley, P.: Effect of isoprene emissions from major forests on ozone formation in the city of Shanghai, China, Atmos. Chem. Phys., 11, 10449–10459, https://doi.org/10.5194/acp-11-10449-2011, 2011.
Gilbert, R. O.: Statistical Methods for Environmental Pollution Monitoring. John Wiley & Sons, New York, USA, 320 pp., 1987.
Gocic, M. and Trajkovic, S.: Analysis of changes in meteorological variables using Mann-Kendall and Sen's slope estimator statistical tests in Serbia, Glob. Planet. Change, 100, 172–182, 2013.
Goodman, J. E., Prueitt, R. L., Sax, S. N., Pizzurro, D. M., Lynch, H. N., Zu, K., and Venditti, F. J.: Ozone exposure and systemic biomarkers: evaluation of evidence for adverse cardiovascular health impacts, Crit. Rev. Toxicol., 45, 412–452, 2015.
Grell, G. A., Peckham, S. E., Schmitz, R., McKeen, S. A., Frost, G., Skamarock, W. C., and Eder, B.: Fully coupled “online” chemistry within the WRF model, Atmos. Environ., 39, 6957–6975, 2005.
Gu, Y., Li, K., Xu, J., Liao, H., and Zhou, G.: Observed dependence of surface ozone on increasing temperature in Shanghai, China, Atmos. Environ., 221, 117108, https://doi.org/10.1016/j.atmosenv.2019.117108, 2020.
Guenther, A., Karl, T., Harley, P., Wiedinmyer, C., Palmer, P. I., and Geron, C.: Estimates of global terrestrial isoprene emissions using MEGAN (Model of Emissions of Gases and Aerosols from Nature), Atmos. Chem. Phys., 6, 3181–3210, https://doi.org/10.5194/acp-6-3181-2006, 2006.
Hong, S. Y. and Lim, J. O. J.: The WRF Single-Moment 6-Class Microphysics Scheme (WSM6), J. Korean Meteor. Soc., 42, 129–151, 2006.
IPCC: Climate Change 2013: The Physical Science Basis, Contribution of Working Group I to the Fifth Assessment Report of the Intergovernmental Panel on Climate Change, edited by: Stocker, T. F., Qin, D., Plattner, G. K., Tignor, M., Allen, S. K., Boschung, J., Nauels, A., Xia, Y., Bex, V., and Midgley, P. M., Cambridge University Press, United Kingdom and New York, USA, 2013.
Kendall, M. G.: Rank Correlation Methods, 4th Edn., Charles Griffin, London, 202 pp., 1975.
Li, K., Jacob, D.J., Liao, H., Zhu, J., Shah, V., Shen, L., Bates, K.H., Zhang, Q., and Zhai, S.: A two-pollutant strategy for improving ozone and particulate air quality in China, Nat. Geosci., 12, 906–910, https://doi.org/10.1038/s41561-019-0464-x, 2019a.
Li, K., Jacob, D. J., Liao, H., Shen, L., Zhang, Q., and Bates, K. H.: Anthropogenic drivers of 2013–2017 trends in summer surface ozone in China, P. Natl. Acad. Sci. USA, 116, 422–427, 2019b.
Li, M., Zhang, Q., Streets, D. G., He, K. B., Cheng, Y. F., Emmons, L. K., Huo, H., Kang, S. C., Lu, Z., Shao, M., Su, H., Yu, X., and Zhang, Y.: Mapping Asian anthropogenic emissions of non-methane volatile organic compounds to multiple chemical mechanisms, Atmos. Chem. Phys., 14, 5617–5638, https://doi.org/10.5194/acp-14-5617-2014, 2014.
Lin, M., Horowitz, L. W., Cooper, O. R., Tarasick, D., Conley, S., Iraci, L. T., Johnson, B., Leblanc, T., Petropavlovskikh, I., and Yates, E. L: Revisiting the evidence of increasing springtime ozone mixing ratios in the free troposphere over western North America, Geophys. Res. Lett., 42, 8719–8728, https://doi.org/10.1002/2015GL065311, 2015.
Lin, W., Xu, X., Zhang, X., and Tang, J.: Contributions of pollutants from North China Plain to surface ozone at the Shangdianzi GAW Station, Atmos. Chem. Phys., 8, 5889–5898, https://doi.org/10.5194/acp-8-5889-2008, 2008.
Lin, Y. L., Farley, R. D., and Orville, H. D.: Bulk parameterization of the snowfield in a cloud model, J. Clim. Appl. Meteorol., 22, 1065–1092, 1983.
Lou, S., Liao, H., Yang, Y., and Mu, Q., Simulation of the interannual variations of tropospheric ozone over China: Roles of variations in meteorological parameters and anthropogenic emissions, Atmos. Environ., 122, 839–851, 2015.
Lu, X., Hong, J., Zhang, L., Cooper, O.R., Schults, M. G., Xu, X., Wang, T., Gao, M., Zhao, Y., and Zhang, Y.: Severe surface ozone pollution in China: a global perspective, Environ. Sci. Technol. Lett., 5, 487–494, 2018.
Ma, Z., Xu, J., Quan, W., Zhang, Z., Lin, W., and Xu, X.: Significant increase of surface ozone at a rural site, north of eastern China, Atmos. Chem. Phys., 16, 3969–3977, https://doi.org/10.5194/acp-16-3969-2016, 2016.
Madronich, S. and Flocke, S.: The role of solar radiation in atmospheric chemistry, in: Handbook of Environmental Chemistry, edited by: Boule, P.. Springer, Heidelberg, 1–26, https://doi.org/10.1007/978-3-540-69044-3_1, 1999.
Mann, H. B.: Non-parametric tests against trend, Econometrica, 13, 163–171, 1945.
Meng, Z. Y., Xu, X. B., Yan, P., Ding, G. A., Tang, J., Lin, W. L., Xu, X. D., and Wang, S. F.: Characteristics of trace gaseous pollutants at a regional background station in Northern China, Atmos. Chem. Phys., 9, 927–936, https://doi.org/10.5194/acp-9-927-2009, 2009.
Monks, P. S., Archibald, A. T., Colette, A., Cooper, O., Coyle, M., Derwent, R., Fowler, D., Granier, C., Law, K. S., Mills, G. E., Stevenson, D. S., Tarasova, O., Thouret, V., von Schneidemesser, E., Sommariva, R., Wild, O., and Williams, M. L.: Tropospheric ozone and its precursors from the urban to the global scale from air quality to short-lived climate forcer, Atmos. Chem. Phys., 15, 8889–8973, https://doi.org/10.5194/acp-15-8889-2015, 2015.
Pfister, G. G., Parrish, D. D., Worden, H., Emmons, L. K., Edwards, D. P., Wiedinmyer, C., Diskin, G. S., Huey, G., Oltmans, S. J., Thouret, V., Weinheimer, A., and Wisthaler, A.: Characterizing summertime chemical boundary conditions for airmasses entering the US West Coast, Atmos. Chem. Phys., 11, 1769–1790, https://doi.org/10.5194/acp-11-1769-2011, 2011.
Scheel, H. E., Aresbough, H., Geiss, H., Gormiscek, B., Granby, K., Haszpra, L., Klasinc, L., Kley, D., Laurila, T., Lindskog, A., Roemer, M., Schmitt, R., Simmond, P., Solberg, S., and Toupande, G.: On the spatial distribution and seasonal variation of lower tropospheric ozone over Europe, J. Atmos. Chem., 28, 11–28,1997.
Schell, B., Ackermann, I., Hass, H., Binkowski, F. S., and Ebel, A.: Modeling the formation of secondary organic aerosol within a comprehensive air quality model system, J. Geophys. Res., 106, 28275–28293, https://doi.org/10.1029/2001JD000384, 2001.
Sen, P. K.: Estimates of the regression coefficient based on Kendall's tau, J. Am. Stat. Assoc., 63, 1379–1389, 1968.
Shan, W., Yang, P., Lu, H., Ma, K., and Huang, Z.: Influence of Coastal Wind on Surface Ozone and Nitrogen Oxides in Suburban Shanghai, Asia-Pacific, J. Atmos. Sci., 52, 451–458, 2016.
Sillman, S.: Photochemical Smog: Ozone and its Precursors, in: Handbook of Weather, Climate, and Water, edited by: Potter, T. and Bradley, R. R., John Wiley & Sons, New York, USA, 227–242, 2003.
Stockwell, W. R., Middleton, P., Chang, J. S., and Tang, X.: The second generation regional acid deposition model chemical mechanism for regional air quality modeling, J. Geophys. Res.-Atmos., 95, 16343–16367, 1990.
Tie, X., Brasseur, G., Emmons, L., Horowitz, I., and Kinnison, D.: Effects of aerosols on tropospheric oxidants: a global model study, J. Geophys. Res.-Atmos., 106, 22931–22964, 2001.
Tie, X., Madronich, S., Walters, S., Rasch, P., and Collins, W.: Effect of clouds on photolysis and oxidants in the troposphere, J. Geophys. Res., 108, 4642, https://doi.org/10.1029/2003JD003659, 2003.
Tie, X., Geng, F., Peng, L., Gao, W., and Zhao, C.: Measurement and modeling of O3 variability in Shanghai, China: Application of the WRF-Chem model, Atmos. Environ., 43, 4289–4302, 2009.
Tie, X., Geng, F., Guenther, A., Cao, J., Greenberg, J., Zhang, R., Apel, E., Li, G., Weinheimer, A., Chen, J., and Cai, C.: Megacity impacts on regional ozone formation: observations and WRF-Chem modeling for the MIRAGE-Shanghai field campaign, Atmos. Chem. Phys., 13, 5655–5669, https://doi.org/10.5194/acp-13-5655-2013, 2013.
Vingarzan, R.: A review of surface ozone background levels and trends, Atmos. Environ., 38, 3431–3442, 2004.
Wang, T., Wei, X. L., Ding, A. J., Poon, C. N., Lam, K. S., Li, Y. S., Chan, L. Y., and Anson, M.: Increasing surface ozone concentrations in the background atmosphere of Southern China, 1994–2007, Atmos. Chem. Phys., 9, 6217–6227, https://doi.org/10.5194/acp-9-6217-2009, 2009.
Wang, T., Xue, L., Brimblecombe, P., Lam, Y.-F., Li, L., and Zhang, L.: Ozone pollution in China: A review of concentrations, meteorological influences, chemical precursors, and effects, Sci. Total Environ., 575, 1582–1596, 2017.
Wesely, M. L.: Parameterization of surface resistances to gaseous dry deposition in regional-scale numerical models, Atmos. Environ., 23, 1293–1304, 1989.
Xu, J., Tie, X., Gao, W., Lin, Y., and Fu, Q.: Measurement and model analyses of the ozone variation during 2006 to 2015 and its response to emission change in megacity Shanghai, China, Atmos. Chem. Phys., 19, 9017–9035, https://doi.org/10.5194/acp-19-9017-2019, 2019.
Xu, X., Lin, W., Wang, T., Yan, P., Tang, J., Meng, Z., and Wang, Y.: Long-term trend of surface ozone at a regional background station in eastern China 1991–2006: enhanced variability, Atmos. Chem. Phys., 8, 2595–2607, https://doi.org/10.5194/acp-8-2595-2008, 2008.
Xu, W., Lin, W., Xu, X., Tang, J., Huang, J., Wu, H., and Zhang, X.: Long-term trends of surface ozone and its influencing factors at the Mt Waliguan GAW station, China – Part 1: overall trends and characteristics, Atmos. Chem. Phys., 16, 6191–6205, https://doi.org/10.5194/acp-16-6191-2016, 2016.
Yang, Y., Liao, H., and Li, J.: Impacts of the East Asian summer monsoon on interannual variations of summertime surface-layer ozone concentrations over China, Atmos. Chem. Phys., 14, 6867–6879, https://doi.org/10.5194/acp-14-6867-2014, 2014.
Yue, X. and Unger, N.: Ozone vegetation damage effects on gross primary productivity in the United States, Atmos. Chem. Phys., 14, 9137–9153, https://doi.org/10.5194/acp-14-9137-2014, 2014.