the Creative Commons Attribution 4.0 License.
the Creative Commons Attribution 4.0 License.
 | 24 Nov 2020
Strong day-to-day variability of the Asian Tropopause Aerosol Layer (ATAL) in August 2016 at the Himalayan foothills
Sreeharsha Hanumanthu
Rolf Müller
Simone Brunamonti
Suvarna Fadnavis
Peter Ölsner
Manish Naja
Bhupendra Bahadur Singh
Kunchala Ravi Kumar
Sunil Sonbawne
Hannu Jauhiainen
Holger Vömel
Beiping Luo
Teresa Jorge
Frank G. Wienhold
Ruud Dirkson
Thomas Peter
The South Asian summer monsoon is associated with a large-scale anticyclonic circulation in the upper troposphere and lower stratosphere (UTLS), which confines the air mass inside. During boreal summer, the confinement of this air mass leads to an accumulation of aerosol between about 13 and 18 km (360 and 440 K potential temperature); this accumulation of aerosol constitutes the Asian Tropopause Aerosol Layer (ATAL). We present balloon-borne aerosol backscatter measurements of the ATAL performed by the Compact Optical Backscatter Aerosol Detector (COBALD) instrument in Nainital in northern India in August 2016, and compare these with COBALD measurements in the post-monsoon time in November 2016. The measurements demonstrate a strong variability of the ATAL's altitude, vertical extent, aerosol backscatter intensity and cirrus cloud occurrence frequency. Such a variability cannot be deduced from climatological means of the ATAL as they are derived from satellite measurements. To explain this observed variability we performed a Lagrangian back-trajectory analysis using the Chemical Lagrangian Model of the Stratosphere (CLaMS). We identify the transport pathways as well as the source regions of air parcels contributing to the ATAL over Nainital in August 2016. Our analysis reveals a variety of factors contributing to the observed day-to-day variability of the ATAL: continental convection, tropical cyclones (maritime convection), dynamics of the anticyclone and stratospheric intrusions. Thus, the air in the ATAL is a mixture of air masses coming from different atmospheric altitude layers. In addition, contributions from the model boundary layer originate in different geographic source regions. The location of the strongest updraft along the backward trajectories reveals a cluster of strong upward transport at the southern edge of the Himalayan foothills. From the top of the convective outflow level (about 13 km; 360 K) the air parcels ascend slowly to ATAL altitudes within a large-scale upward spiral driven by the diabatic heating in the anticyclonic flow of the South Asian summer monsoon at UTLS altitudes. Cases with a strong ATAL typically show boundary layer contributions from the Tibetan Plateau, the foothills of the Himalayas and other continental regions below the Asian monsoon. Weaker ATAL cases show higher contributions from the maritime boundary layer, often related to tropical cyclones, indicating a mixing of clean maritime and polluted continental air. On the one hand increasing anthropogenic emissions in the future are expected due to the strong growth of Asian economies; on the other hand the implementation of new emission control measures (in particular in China) has reduced the anthropogenic emissions of some pollutants contributing to the ATAL substantially. It needs to be monitored in the future whether the thickness and intensity of the ATAL will further increase, which will likely impact the surface climate.
- Article
(8170 KB) - Full-text XML
- BibTeX
- EndNote


The existence of an Asian Tropopause Aerosol Layer (ATAL) in Northern Hemisphere summer (June, July and August) was first discovered in lidar measurements of aerosol particles in the upper troposphere and lower stratosphere (UTLS) by the Cloud-Aerosol Lidar and Infrared Pathfinder Satellite Observation (CALIPSO) mission (Vernier et al., 2011, 2015). CALIPSO measures the total attenuated backscatter through the Cloud–Aerosol Lidar with Orthogonal Polarization (CALIOP). The ATAL occurs between about 360 and 440 K potential temperature (between about 13 and 18 km); based on CALIOP measurements, the thickness of the ATAL is estimated to be 3–4 km between 30 and 40∘ N and is thinner near the Equator (Vernier et al., 2011, 2015, 2018; Bian et al., 2020). Although the large horizontal extent of the ATAL was first seen in the CALIOP measurements (Vernier et al., 2011, 2015), first observations of enhanced number concentrations of submicron aerosol particles between 130–70 hPa in the Asian summer monsoon were made during a balloon ascent from Lhasa (29.7∘ N, 91.1∘ E) already in August 1999 (Kim et al., 2003; Tobo et al., 2007). The existence of the ATAL is further confirmed by in situ balloon-borne backscatter measurements (Vernier et al., 2015, 2018; Brunamonti et al., 2018) in Lhasa (August 2013), Saudi Arabia (August 2015) and India (August 2016, 2017). Solar occultation observations by the Stratospheric Aerosol and Gas Experiment (SAGE) II also confirmed the existence of the ATAL but indicated the absence of the ATAL prior to 1999 (Thomason and Vernier, 2013). However, Höpfner et al. (2019) reported that as early as 1997, during the Asian monsoon period, enhanced concentrations of solid ammonium nitrate particles were present throughout the Asian monsoon anticyclone.
The existence of the ATAL is related to the presence of the Asian summer monsoon circulation and, in particular, to the Asian monsoon anticyclonic circulation at UTLS altitudes from about June to September. The dynamics and thermodynamics of the Asian monsoon are caused by the land–sea contrast and are influenced by the orography of the Himalayas and the adjacent mountain ranges (e.g. Turner and Annamalai, 2012, and references therein). The Asian monsoon anticyclone is linked to deep convection in summer over South Asia and the associated diabatic heating (Hoskins and Rodwell, 1995; Randel and Park, 2006). Deep convection occurs primarily just south of and over the lower elevations of the Himalayan barrier; isolated deep convective events occur over the Tibetan Plateau (Houze Jr. et al., 2007). This deep convection in the region of the Asian monsoon anticyclone transports pollutants (e.g. CO, HCN, C2H6, SO2, NH3, HCFC-22) emitted at the surface in South Asia to UTLS altitudes, where they are confined in the anticyclonic circulation in summer to a certain extent (e.g. Park et al., 2008; Randel et al., 2010; Chen et al., 2012; Ploeger et al., 2015; Chirkov et al., 2016; Garny and Randel, 2016; Santee et al., 2017; Höpfner et al., 2019; Bian et al., 2020).
The source regions of ATAL aerosols and their chemical precursors on the Earth's surface (origin) as well as the transport pathways from the surface to ATAL altitudes are poorly understood. The contributions of different boundary source regions in Asia to the chemical composition of the Asian monsoon anticyclone are discussed in a variety of studies (e.g. Li et al., 2005; Park et al., 2009; Chen et al., 2012; Bergman et al., 2013; Fadnavis et al., 2014; Vogel et al., 2015; Pan et al., 2016; Li et al., 2017; Fairlie et al., 2020), identifying sources in India, the Tibetan Plateau, south-west China and south-east Asia, as well as from the western Pacific. In addition, there is an intraseasonal change in boundary layer source regions contributing to the composition of the anticyclone that depends on the variability of convection and the spatial coverage of the anticyclone itself (Vogel et al., 2015). Further, in model simulations, it was found that during the monsoon peak season large quantities of dust are transported from the Middle East deserts to the upper troposphere and accumulate over the southern and eastern foothills of the Tibetan Plateau (Fadnavis et al., 2013; Lau et al., 2018). Lau et al. (2018) highlighted two key pathways lofting carbonaceous aerosols and dust by orographically forced deep convection, one over the Himalayas–Gangetic Plain (India) and another one over the Sichuan Basin (China). Further, based on aircraft measurements in summer 2017, Höpfner et al. (2019) concluded that enhanced NH3 concentrations (precursor of solid ammonium nitrate particles) over India were injected by strong convection into the upper troposphere over north-west India and north-east Pakistan. Source apportionment of the model simulations by Fairlie et al. (2020) indicated the dominance of the contribution of regional anthropogenic emissions from China and the Indian subcontinent (both ∼30 % attributable to regional SO2 sources) to aerosol concentrations in the ATAL in August 2013.
Only limited information on the chemical composition of the ATAL particles is available from measurements so far. From simulations, there is evidence that desert dust is lifted to UTLS altitudes and is entrained into the ATAL (Fadnavis et al., 2013; Lau et al., 2018; Yuan et al., 2019). Further, simulations show elevated aerosol concentrations of sulfate, nitrate, ammonium, black carbon and organic carbon within the ATAL, with contributions of nitrate dominating (Gu et al., 2016; Fairlie et al., 2020). Moreover, Fairlie et al. (2020) found in model simulations for summer 2013 different chemical compositions of the ATAL depending on the location within the Asian monsoon anticyclone, with nitrate aerosol as the dominant component at the southern flank of the anticyclone. Aircraft in situ measurements suggest that at lower altitudes the chemical composition of ATAL particles is dominated by carbonaceous and sulfate materials, consistent with the expectation that aerosol trends in the UTLS in the past decades are under the increasing influence of sulfur emissions in Asia (Martinsson et al., 2014; Vernier et al., 2015; Fadnavis et al., 2019a). However, the first offline (balloon-borne filter samples) chemical analysis of ATAL particles suggested the presence of nitrate aerosol but undetectable concentrations of sulfate ions (Vernier et al., 2018). Also, the evaluation of a variety of remote sensing measurements indicates a strong contribution of solid ammonium nitrate particles to the ATAL (Höpfner et al., 2019).
The deep convection in summer over the Indian subcontinent also causes lower concentrations of stratospheric tracers, in particular ozone, in the Asian monsoon anticyclone, whereas water vapour shows a local maximum in the monsoon anticyclone (e.g. Park et al., 2007; Bian et al., 2012; Randel et al., 2015; Brunamonti et al., 2018). The tropospheric signature inside the anticyclone at potential temperatures between ∼360 and ∼440 K (corresponding to about 13 to 18 km) stems from convective transport typically up to the lower end of this range, followed by slow diabatic uplift superimposed on the anticyclonic motion, which Vogel et al. (2019) referred to as an “upward spiralling range”. Brunamonti et al. (2018) denote the altitude range between maximum convective outflow and the cold point tropopause as the Asian tropopause transition layer (ATTL). Above the ATTL, based on H2O measurements and trajectory calculations, Brunamonti et al. (2018) found a layer of a confined air mass in the lower stratosphere, which is consistent with the concept of an upward spiralling range. Pan et al. (2014) identified the tropical tropopause transition layer (TTL) using chemical tracer–tracer relationships in the tropics and over the Asian monsoon. Their comparison shows that the tracer-identified transition layer over the Asian monsoon is similar to the TTL, although the ATTL is located at higher potential temperature levels. However, during the monsoon season the vertical upward transport caused by radiative heating at the top the Asian monsoon anticyclone is faster than elsewhere in the tropics (Vogel et al., 2019).
Particularly strong emissions of NOx, SO2, NH3 and particulate matter occur in northern India and China (van der A et al., 2017; van Damme et al., 2018; Zheng et al., 2018), which impact ozone and aerosol in the upper troposphere. Ozone and aerosol changes in the upper troposphere in turn have radiative impacts over the region (Roy et al., 2017; Fadnavis et al., 2018, 2019a; Bian et al., 2020). However, after the year 2013, because of the implementation of new emission control measures in China, China's anthropogenic emission of some pollutants decreased substantially (e.g. SO2, NOx, CO), while emissions of NH3 and non-methane volatile organic compounds did not change much during 2010–2017 (Zheng et al., 2018).
The confinement of air masses of tropospheric origin in the monsoon anticyclone also affects the aerosol particles constituting the ATAL (Yu et al., 2017; Vernier et al., 2018; Höpfner et al., 2019). Particles in the ATAL originate from ground sources (both gas-phase precursors and aerosol particles), which are lifted to UTLS altitudes by convection. The formation mechanism of the aerosol particles constituting the ATAL is not well characterised, but there is evidence that the formation of secondary aerosol in the upper troposphere within the Asian monsoon anticyclone at high relative humidity and low temperature is important (Vernier et al., 2015, 2018; Yu et al., 2017).
Only few measurements of the size distributions of particles in the ATAL are available. Early size-resolved measurements using a balloon-borne optical particle counter (OPC) in August 1999 showed high number concentrations (0.7–0.8 particles cm−3) of aerosol particles with radii of 0.15–0.6 µm between about 130 and 70 hPa in the Asian summer monsoon (Kim et al., 2003; Tobo et al., 2007). Recent measurements with an OPC (Deshler et al., 2003) from Hyderabad, India, and with a Printed Optical Particle Spectrometer (POPS) (Gao et al., 2016) from Kunming, China (both in 2015), also confirm the presence of the ATAL (Yu et al., 2017; Vernier et al., 2018). The OPC measurements indicate that the concentration of ATAL particles is highest close to the cold point tropopause and declines towards greater altitudes; concentrations (up to about 25 particles per cm−3) are dominated by particles in the r>0.094 µm channel, whereas particle number concentrations for the r>0.15 µm channel and the r>0.30 µm channel are lower by a factor of 30 and 300, respectively (Vernier et al., 2018, Fig. 9).
Based on CALIOP measurements, the summertime aerosol optical depth over Asia associated with the ATAL has increased from ≈0.002 to 0.006 between 1995 and 2013, resulting in a short-term regional forcing at the top of the atmosphere of −0.1 W m2 – compensating for about one-third of the comparable radiative forcing associated with the global increase in CO2 (Vernier et al., 2015). The regional radiative forcing caused by the ATAL, differs for clear- and total-sky conditions; total-sky calculations show less shortwave radiative forcing over the monsoon region because of cloudiness (Vernier et al., 2015). It is likely that, over Asia in the past ∼20 years, the altered radiative forcing has led to summertime reductions in surface temperature, although this effect has not been quantified yet. However, the radiative forcing caused by the ATAL could be compared with the global aerosol forcing caused by moderate volcanic eruptions since 2000, which translates into a surface cooling of 0.05 to 0.12 K (Ridley et al., 2014).
The co-occurrence of the ATAL with volcanic eruptions in the region further enhances the radiative forcing by the ATAL; Fairlie et al. (2014, Fig. 8), based on monthly accumulations of CALIOP aerosol data between 14 and 40 km altitude, reported a top-of-the-atmosphere radiative forcing locally over Asia and Europe during July 2011 in response to the Nabro volcanic eruption of about −0.8 to −1.5 W m2. Therefore, periods of volcanic eruptions are removed in some ATAL studies; because the volcanic signal is much stronger than the ATAL signal itself, a volcanic signal will mask the ATAL (e.g. Thomason and Vernier, 2013; Vernier et al., 2015).
The impact of the ATAL is furthermore modulated by El Niño. During El Niño, the ATAL is thicker and broader over the Indian region, resulting in a reduction of the solar flux and a surface cooling of about 1 K over northern India. An elevated ATAL over South Asia exacerbates the severity of Indian droughts (Fadnavis et al., 2019b).
The chemical signature of air masses within the monsoon anticyclone (e.g. tropospheric pollutants, water vapour) is exported to the Northern Hemisphere during summer and fall through quasi-isentropic transport from low latitudes (e.g. Ploeger et al., 2013; Vogel et al., 2014, 2016, 2019; Spang et al., 2015; Garny and Randel, 2016; Müller et al., 2016; Fadnavis et al., 2018; Rolf et al., 2018; Yan et al., 2019). Because of this export of air from the Asian monsoon circulation to the Northern Hemisphere, the ATAL particles contribute significantly (∼15 %) to the Northern Hemisphere stratospheric column aerosol surface area on an annual basis (Yu et al., 2017).
The Asian monsoon in the UTLS does not constitute a stable, persistent unimodal anticyclonic circulation (as it sometimes appears in climatologies) but can be bimodal (with an Iranian and a Tibetan mode) and moreover shows a strong day-to-day variability (Zhang et al., 2002; Yan et al., 2011; Vogel et al., 2015; Nützel et al., 2016). There is also a substantial interannual variability of the monsoon circulation with impact on the concentrations of tracers confined in the monsoon circulation (Santee et al., 2017; Yuan et al., 2019). This variability of the monsoon circulation impacts the variability of trace gas (Luo et al., 2018) and aerosol distributions (Lau et al., 2018; Yuan et al., 2019).
The strong convective activity in the Asian summer monsoon region also impacts the temperature in the monsoon region and the formation of cirrus clouds. Enhanced convection is linked to cold anomalies in the subtropical lower stratosphere (Park et al., 2007; Randel et al., 2015). Further, the occurrence fractions of cirrus in the middle to upper (16–18 km) tropical tropopause layer (TTL) (e.g. Fueglistaler et al., 2009) exhibit a pronounced maximum over the Asian monsoon region, both in observations and in model simulations (Ueyama et al., 2018). Convection is likely the dominant driver of localised upper tropospheric H2O and cloud maxima in the region (Park et al., 2007; Ueyama et al., 2018). Ice clouds in the tropical deep convective regions are important as they exert a considerable net warming effect (Pandit et al., 2015; Hong et al., 2016).
To address fundamental open questions and uncertainties regarding the anticyclone and the ATAL, a number of balloon-borne campaigns have been conducted in summer in the Asian monsoon region employing the Compact Optical Backscatter Aerosol Detector (COBALD) instrument (Bian et al., 2012, 2020; Vernier et al., 2018; Brunamonti et al., 2018). Here we present an analysis of the COBALD measurements in Nainital in northern India in August and November 2016. The signature of the ATAL is clearly visible in most of the soundings in August (but not in every single one), but we find a substantial day-to-day variability of the ATAL, both in backscatter intensity and in altitude range of the ATAL. A Lagrangian back-trajectory analysis is performed in order to identify the air mass origin in the model boundary layer and the transport pathways of air parcels contributing to the ATAL over Nainital in August 2016. The paper is organised as follows: Sect. 2 describes the soundings in Nainital and the CLaMS trajectory calculations, Sect. 3 presents the results of aerosol backscatter measurements, and Sect. 4 discusses detailed trajectory calculations for 3 selected days as well as the simulation results for all balloon flights from Nainital in 2016. Finally, our results are discussed in Sect. 5, and the conclusions are given in Sect. 6.
The findings presented here are based on a set of balloon measurements performed in Nainital, Uttarakhand, India (29.35∘ N, 79.46∘ E); Nainital is located at an elevation of 1820 m above sea level. The Aryabhatta Research Institute of Observational Sciences (ARIES) provided the campaign base to perform the launches. These measurements were conducted in August and November 2016 and are described in detail by Brunamonti et al. (2018) and Brunamonti et al. (2019). A brief summary is given here.
2.1 Balloon-borne instrumentation
The aerosol and cirrus measurements analysed here are based on balloon-borne backscatter measurements by the Compact Optical Backscatter Aerosol Detector (COBALD). COBALD operates at optical wavelengths of 455 nm (blue visible) and 940 nm (infrared) and was developed at the ETH Zürich (e.g. Wienhold, 2008; Brabec et al., 2012). It was hosted by a standard RS41-SGP meteorological radiosonde and the DigiCORA MW41 sounding system (Vaisala, Finland). In addition, the balloon payload included an electrochemical concentration cell (ECC; manufacturer: EN-SCI, USA) (Komhyr, 1969; Komhyr et al., 1995) for measuring the ozone mixing ratio and a cryogenic frost-point hygrometer (CFH, EN-SCI, USA) (Vömel et al., 2007, 2016) for measuring the water vapour mixing ratio (Brunamonti et al., 2019; Jorge et al., 2020). We use the pressure measured by the RS41 as the main vertical coordinate for all instruments. The ATAL analysis is mainly based on the COBALD 455 nm measurements (see Appendix A2). The COBALD data are expressed as a backscatter ratio (BSR), i.e. the ratio of the total-to-molecular backscatter coefficient. This is calculated by dividing the total measured signal by its molecular contribution, which is computed from the atmospheric extinction according to Bucholtz (1995), and using the air density derived from the RS41 temperature and pressure measurements. The colour index (CI), defined as the 940-to-455 nm ratio of the aerosol component of the BSR, i.e. CI = (BSR940−1)∕(BSR455−1), is a useful indicator of particle size and can thus be employed to discriminate aerosol and cirrus measurements (Cirisan et al., 2014; Vernier et al., 2015; Brunamonti et al., 2018). The CI for all balloon flights over Nainital in August 2016 is shown in Fig. A1 in Appendix A1. For the detection of aerosol particles, we consider the short wavelength channel (455 nm), which provides a smaller value for the maximum uncertainty (1 % and 5 % for the shortwave and longwave channel, respectively) and is thus less noisy (Brabec et al., 2012; see Appendix A2 for details).
2.2 Campaign description
Table 1Table of all night-time balloon launches analysed here. Listed are number, date, top and bottom of the ATAL noted in both pressure and potential temperature, the mean value of the backscatter ratio ( excluding cirrus contributions) and its standard deviation (σ) (see Sects. 2.2 and 3.1 for details). Top of the ATAL is defined as the pressure level, where either the BSR455 profile has the strongest gradient or where BSR455 merges to the November background. The bottom is defined using the same criteria, except for cases in which the ATAL is limited below by a cirrus cloud (3, 11, 19 and 26 August). On 12 August, the UTLS is filled by a 5 km thick cirrus cloud; hence the ATAL cannot be diagnosed. On 15 August 2016, the UTLS was largely cloud-free but without any indication of the ATAL. The November soundings are post-monsoon without the ATAL. For soundings without the ATAL, a reference pressure (140–92 hPa) and potential temperature (calculated from the measured temperature and pressure) range is given. This reference range allows comparisons with the ATAL observations to be made (for details, see Sect. 4). Measurements for which the ATAL is limited below by a cirrus cloud and for which a thick cirrus cloud or no ATAL was detected in the UTLS as well as the post-monsoon flights are indicated in the last column of the table (under “Note”) in contrast to the normal ATAL measurements.
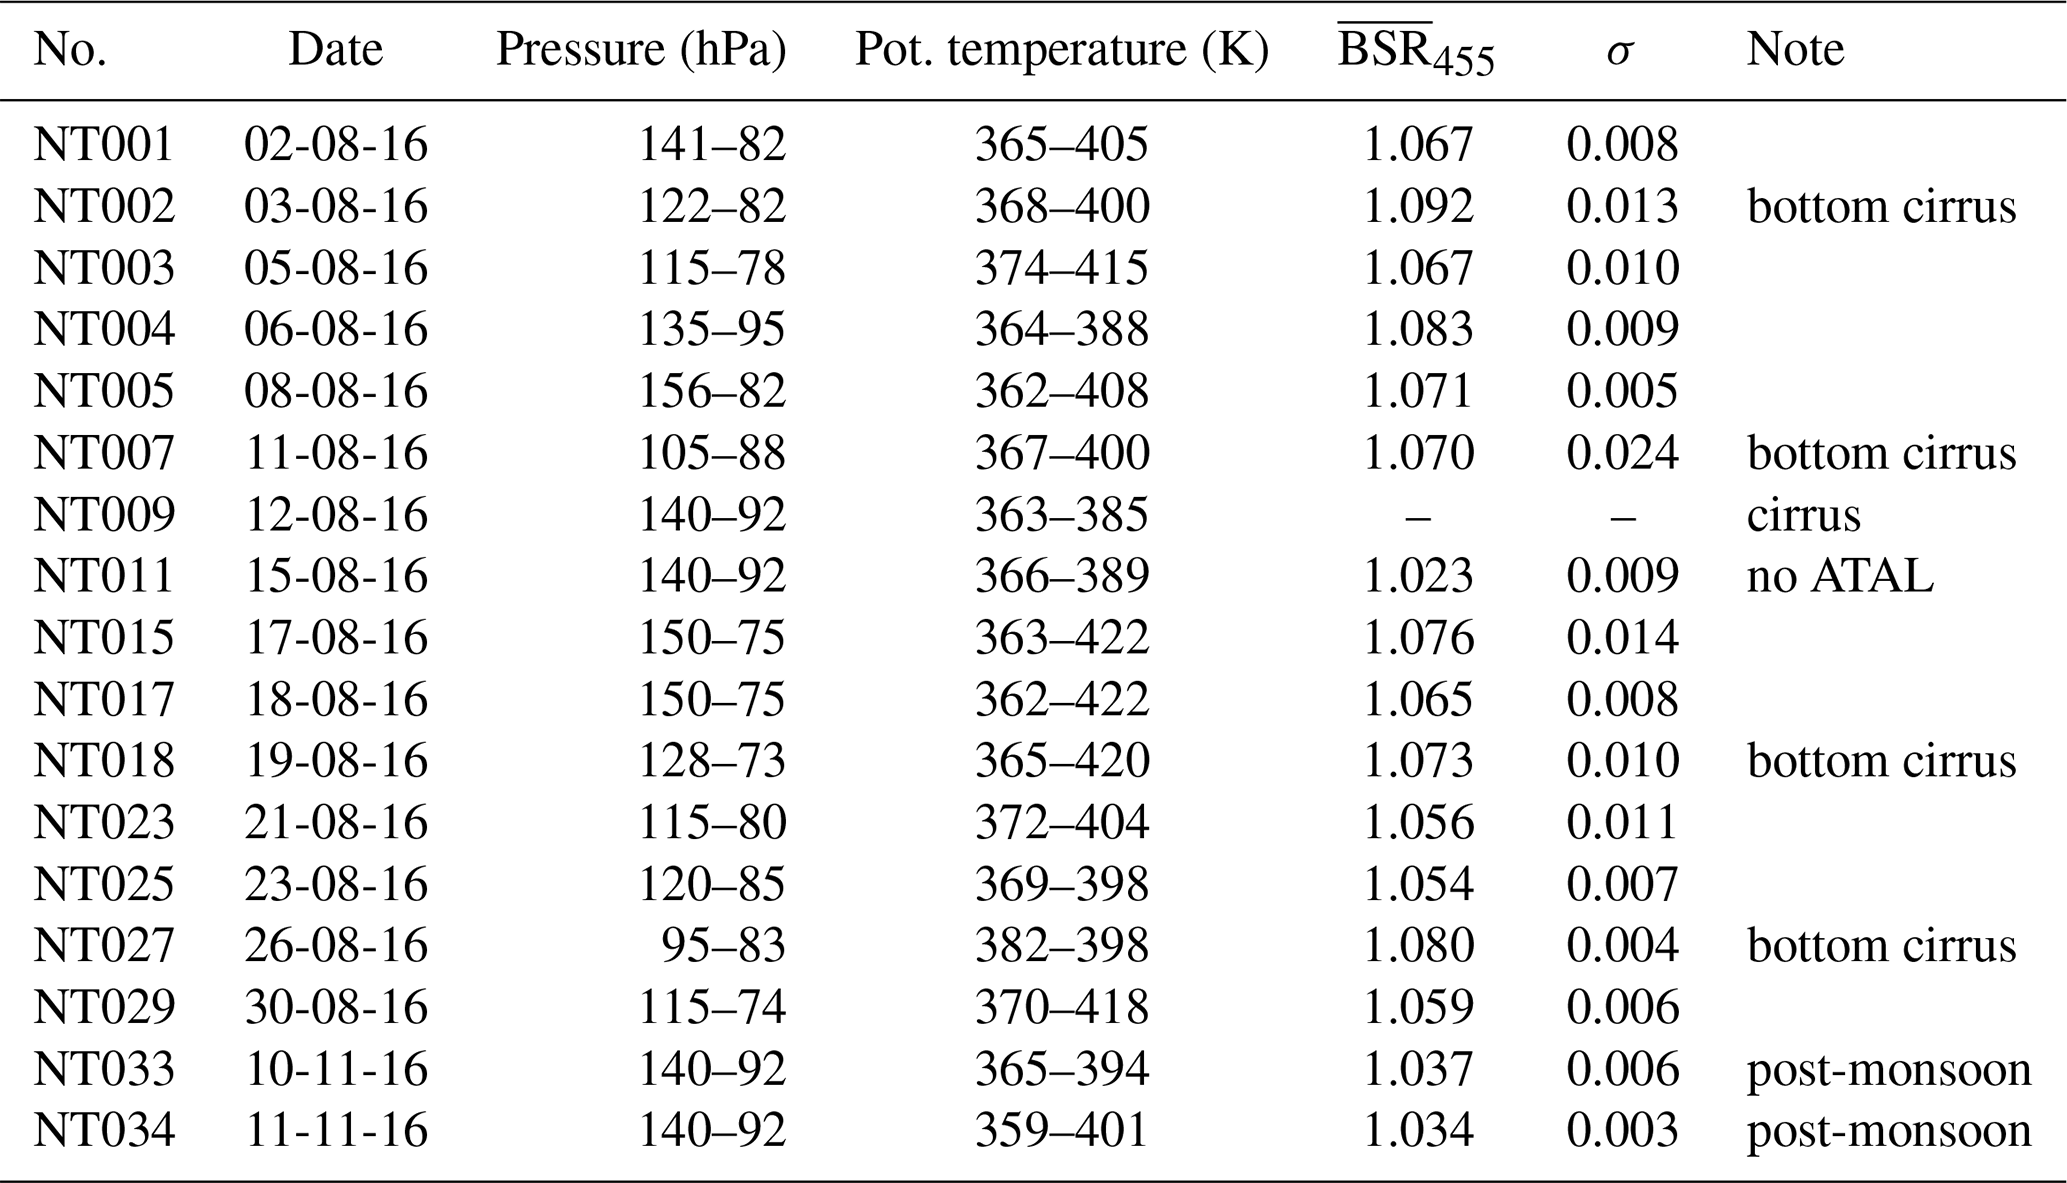
From Nainital, at the foothills of the Himalayas, 15 successful night-time balloon launches were conducted during the peak of the monsoon season in August 2016 (Table 1). All balloon soundings with a COBALD instrument were launched at night-time between 23:00 Indian standard time (IST) (corresponding to coordinated universal time (UTC) +5:30 h) and the next day at 03:00 IST. Due to the high sensitivity of its photodiode detector, COBALD can only be deployed during the night-time. The frequency of soundings was adjusted depending on the meteorological conditions. Out of a total of 35 balloon soundings in 2016 (Brunamonti et al., 2018), here we present 17 launches (15 in August, 2 in November) which were performed with a COBALD instrument (Table 1). Four launches in August 2016 were excluded in our analysis. The 16 August launch burst below 3 km altitude due to harsh weather conditions, and on 28 August the data showed very low signal-to-noise ratio in the stratosphere, likely caused by optical contamination. The post-processing of the COBALD data requires the normalisation of the raw signal to a reference value, which is typically based on the measurements from above 30 km altitude (i.e. above the stratospheric aerosol layer). Due to the low absolute BSR signal of the ATAL, a careful calibration of all profiles is critical here. Since no stratospheric data are available on 5 and 12 August due to early bursts (below 20 km altitude), for the sake of consistency, we excluded these two profiles from our analysis.
2.3 Data analysis and processing
In order to identify the ATAL, it is necessary to discriminate between aerosol particles and cirrus clouds (ice particles) in the backscatter measurements. For this purpose, we used the ice saturation (Sice) from the CFH instrument and the CI from the COBALD measurements (Cirisan et al., 2014). We define clear-sky (i.e. cloud-free) conditions: only layers are used in the ATAL analysis where the criteria CI <7, BSR940<2 and Sice<70 % are simultaneously fulfilled. All other measurements are rejected from the ATAL analysis. The 70 % threshold for Sice is low enough on purpose to ensure that no cirrus cloud measurements are misinterpreted as aerosol measurements (Vernier et al., 2015; Li et al., 2018; Brunamonti et al., 2018). Other sections of the profiles measured during the August soundings, which show substantially elevated values of BSR455 between ∼140 and 70 hPa (≈14–18 km), are classified as ATAL. As we will see below, the classification is considerably simplified by the fact that the COBALD profiles reveal the fingerprints of the ATAL clearly; i.e. the top and bottom of the aerosol layer can be identified with reasonable accuracy. We quantify the elevated values of BSR455 by comparing the August profiles with the mean of the November measurements, when there is no ATAL during post-monsoon (Brunamonti et al., 2018). The enhancement of BSR455 for the ATAL remains below 1.12 (and the CI below 7). Conditions with cirrus clouds embedded within the ATAL can also be easily identified, as the cirrus clouds have 10–100 times larger BSR455 than ATAL particles. As cirrus clouds completely mask these ATAL particles, they cannot be detected and quantified under such conditions (see Sect. 3 below).
Following earlier work (Brabec et al., 2012; Brunamonti et al., 2018), here we use vertically binned data for the CFH and COBALD instrument. BSR455, BSR940, CI and Sice are binned in pressure intervals of 1 hPa for pressure greater than 300 and 0.5 hPa for pressure less than 300 hPa, which yields an improved signal-to-noise ratio. This binning corresponds to a vertical resolution of approximately 25 m in the UTLS. All data were carefully quality-checked, and measurements showing evidence of anomalous instrumental behaviour were rejected, as described by Brunamonti et al. (2018). The processing of COBALD includes the rejection of “moon spikes” that may arise due to the oscillatory motion of the payload 60 m below the balloon, when the detector happens to be pointing towards the moon. Moon spikes affect only a tiny fraction of the COBALD data, and care is taken not to confuse them with thin cirrus clouds (for details, see Appendix A3).
2.4 Trajectory calculations
For the model analysis, we employ the trajectory module of the three-dimensional Lagrangian chemistry transport model CLaMS (McKenna et al., 2002; Pommrich et al., 2014), driven by dynamic fields from the European Centre of Medium-Range Weather Forecasts (ECMWF) Interim reanalysis (ERA-Interim) and employing a horizontal resolution of (Dee et al., 2011). In ERA-Interim changes are implemented to improve deep and mid-level convection compared to previous reanalysis data (Dee et al., 2011). However, small-scale rapid uplift in convective cores is not included. Therefore convection over Asia is most likely underestimated in ERA-Interim. Nevertheless, upward transport in larger convective systems such as tropical cyclones is well represented in CLaMS trajectory calculations driven by ERA-Interim as shown by Li et al. (2017, 2020) as compared to brightness and cloud top temperature derived from satellite observations. CLaMS back trajectory calculations are very well suited to analyse the detailed transport pathway of an air parcel, although they consider only the advective transport, neglecting mixing processes entirely. Earlier, CLaMS trajectories were applied to a variety of problems such as polar chlorine chemistry as well as transport in the tropics, in particular in the region of the Asian monsoon and in tropical cyclones (e.g. Vogel et al., 2003; Ploeger et al., 2010, 2012; Vogel et al., 2014, 2019; Li et al., 2017, 2018, 2020). To analyse the transport pathways and the origin of air masses contributing to the ATAL in August 2016 over Nainital, CLaMS 40-day backward trajectory calculations were performed. As the starting point for backward trajectory calculation, we use the pressure levels of the measurements recorded every second (i.e. no binned data). The same trajectory model set-up is used as in several previous publications (Vogel et al., 2014; Li et al., 2017, 2018, 2020). In the CLaMS model, potential temperature is used as the vertical coordinate when the pressure is less than about 300 hPa, (i.e. in the upper troposphere and in the stratosphere); when the pressure is greater than about 300 hPa (more accurately, for pressure p exceeding a reference level of ), a pressure-based orography-following hybrid coordinate (in units of K) is used (Ploeger et al., 2010; Pommrich et al., 2014). When the back trajectory dives into the CLaMS model boundary layer, we consider the air mass origin to be reached. The model boundary layer is defined as the vertical hybrid pressure–potential–temperature coordinate ζ<120 K (Pommrich et al., 2014; Vogel et al., 2019), which corresponds to a layer ≈2–3 km above the surface of the Earth considering orography.
In general, trajectory calculations have limitations due to trajectory dispersion depending on the trajectory length. However, the frequently employed trajectory length to study transport processes in the Asian monsoon region ranges from a couple of weeks to a few months depending on the transport times from Earth's surface to atmospheric altitudes (e.g. Chen et al., 2012; Bergman et al., 2013; Vogel et al., 2014; Garny and Randel, 2016; Müller et al., 2016; Li et al., 2017, 2018). The CLaMS backward calculations to analyse the balloon measurements in Nainital show that the shortest transport times from Earth's boundary layer to ATAL altitudes (∼360–420 K; see Table 1) is about 10–15 d (see Sect. 4). Only a few trajectories are shorter. However, most of the trajectories show longer transport times than 2 weeks to reach ATAL altitudes (up to ∼420 K or ∼75 hPa). The vertical upward transport of air parcels above the maximum level of convective outflow (∼360 K) is determined by diabatic heating rates which are up to ∼1–1.5 K per day over the region of the Asian monsoon anticyclone during summer using ERA-Interim (Vogel et al., 2019). Convection occurs on short timescales of hours to a few days, whereby the transport from 360 up to 420 K needs 40 to 60 d based on ERA-Interim. Therefore we performed 40-day backward trajectory calculations here as well as trajectories with a length of 60 and 80 d to test the sensitivity to the trajectory length.
3.1 Aerosol backscatter measurements in August 2016
An overview of the Nainital aerosol backscatter observations in August (blue) and November (green) 2016 with pressure as the vertical coordinate is provided in Fig. 1a. Like for other years and locations (Vernier et al., 2015, 2018), the ATAL is clearly visible as an enhancement in backscatter ratio (BSR455) in August compared to the November measurements, with the averaged backscatter (BSR455) values in August reaching about 1.08 (Fig. 1). In Brunamonti et al. (2018), the ATAL is defined between the mean potential temperature lapse-rate minimum and the top of the “confined lower stratosphere” (Fig. 1, dashed lines). The potential temperature lapse-rate minimum coincides approximately with the top of the convective outflow level (≈180 hPa) (e.g. Gettelman and de Forster, 2002; Brunamonti et al., 2018).
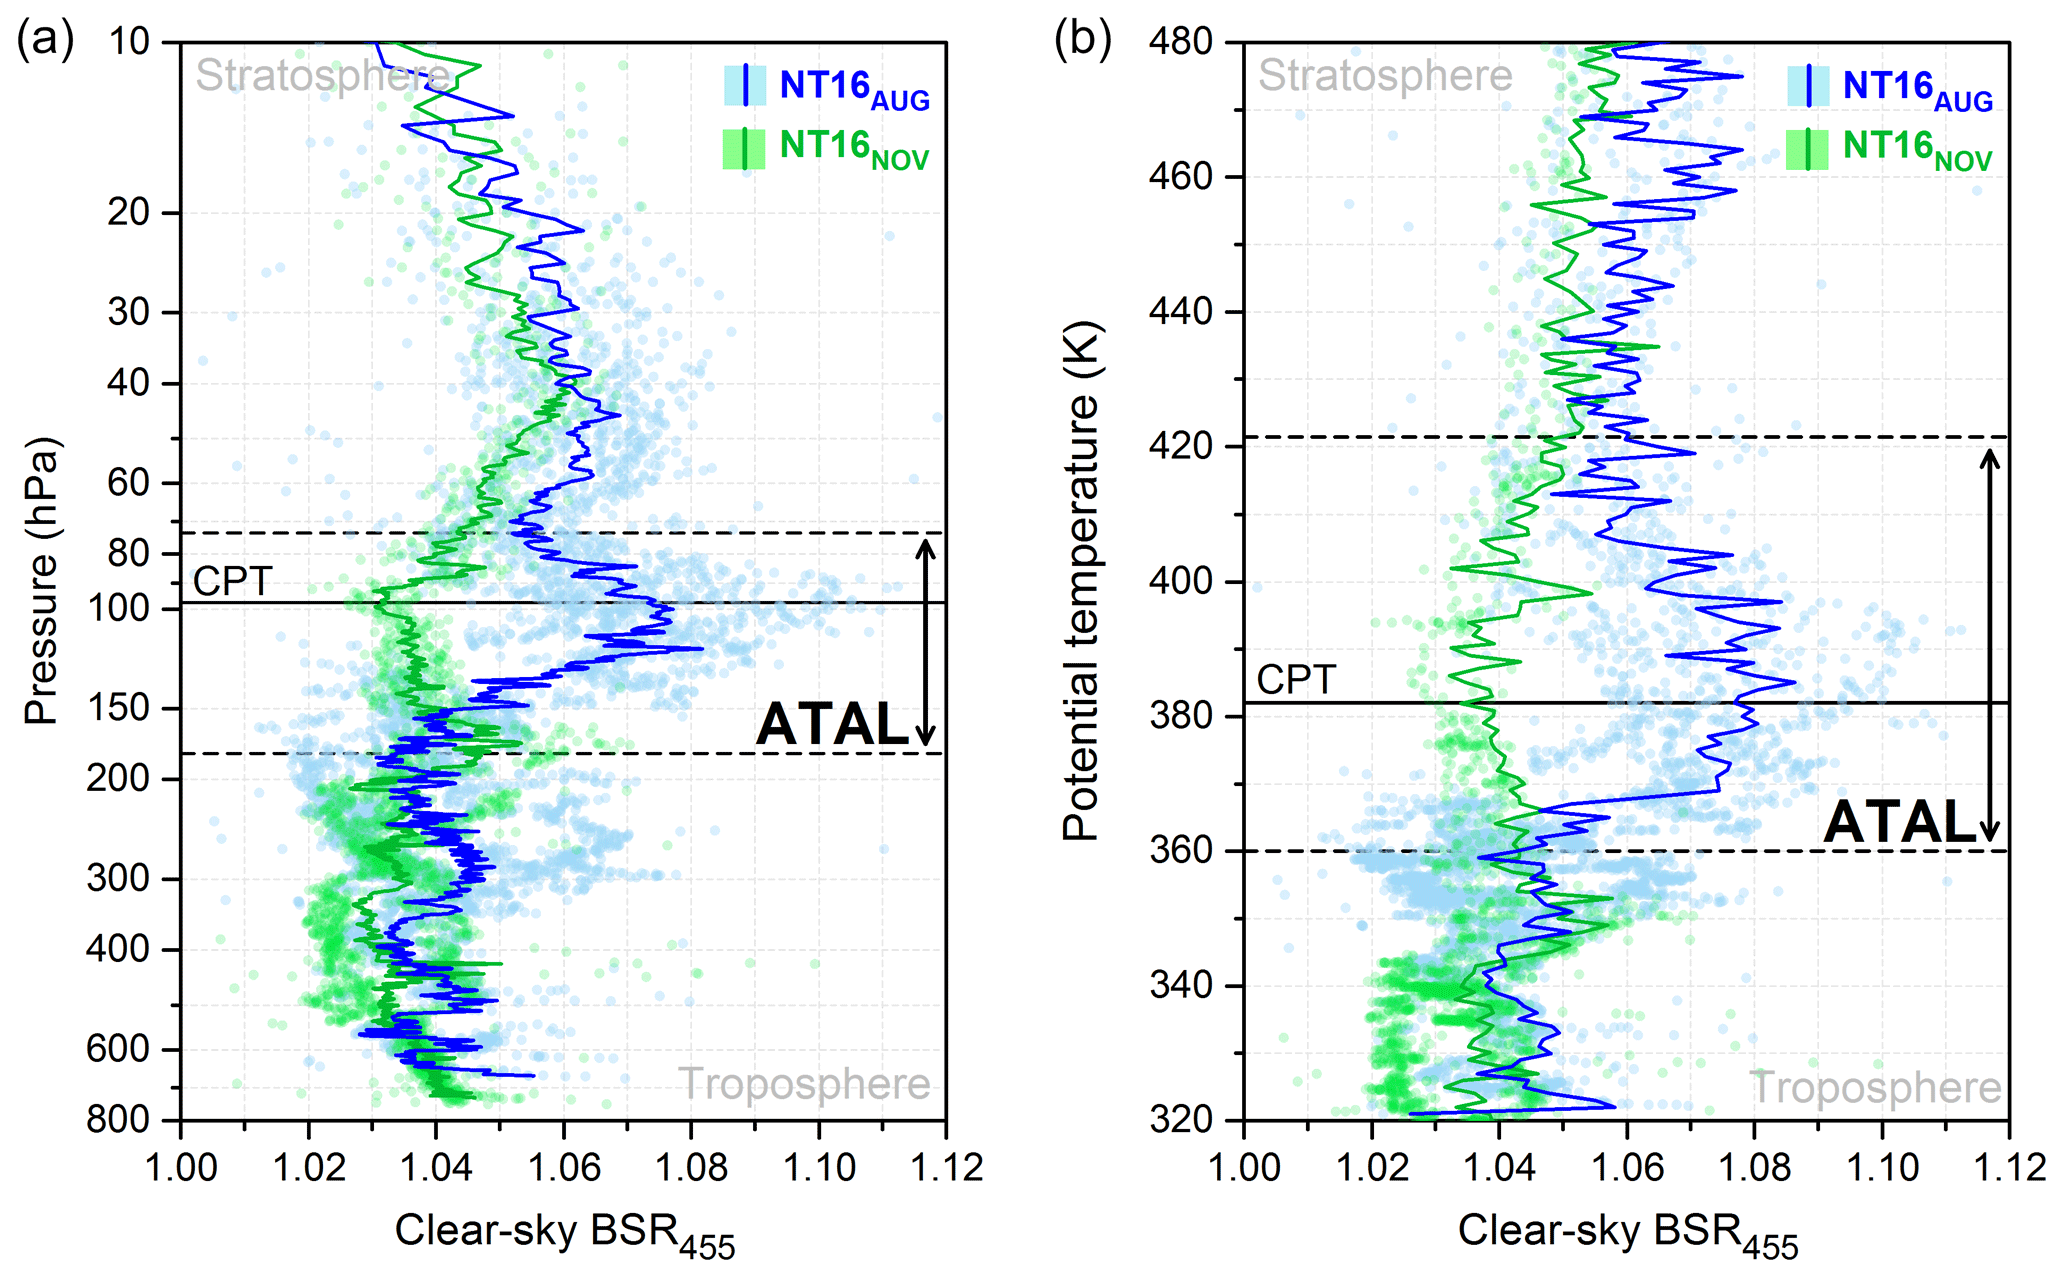
Figure 1Backscatter measurements (BSR455) in Nainital, India, in August 2016 versus pressure (a) and versus potential temperature (b). Shown are BSR455 values for aerosol (dots) and averaged aerosol profiles (solid lines), both without cirrus contributions for August (blue) and November (green). Black lines show the mean temperature lapse-rate minimum (lower dashed), cold point tropopause (CPT, solid) and top of confinement (upper dashed). The vertical black arrows indicate the ATAL region. (a adapted from Fig. 11 of Brunamonti et al. (2018); b the ATAL boundaries and CPT are from Table 3 in Brunamonti et al. (2018).)
Figure. 1b shows the same BSR455 values but with potential temperature as the vertical coordinate. Using the backscatter measurements with potential temperature as the altitude scale, a somewhat different picture emerges than when using pressure as the altitude scale because the potential temperature has a large vertical gradient in this altitude region. In particular, a sharp increase in the averaged BSR455 in August around 360–365 K is clearly noticeable. This steep gradient represents the top of the convective outflow region (e.g. Gettelman and de Forster, 2002); i.e. below this level aerosols are more frequently scavenged and removed by precipitation. An enhancement of the averaged BSR455 in August compared to November is noticeable up to potential temperatures of about 420 K (∼75 hPa), but especially when considering potential temperature as the vertical coordinate, a top of the ATAL is not clearly defined. Only a slow decrease in averaged BSR455 with altitude is observed (Fig. 1b). This observation is consistent with a decreasing confinement of the air mass within the Asian monsoon anticyclone with increasing potential temperature (Brunamonti et al., 2018; Vogel et al., 2019).
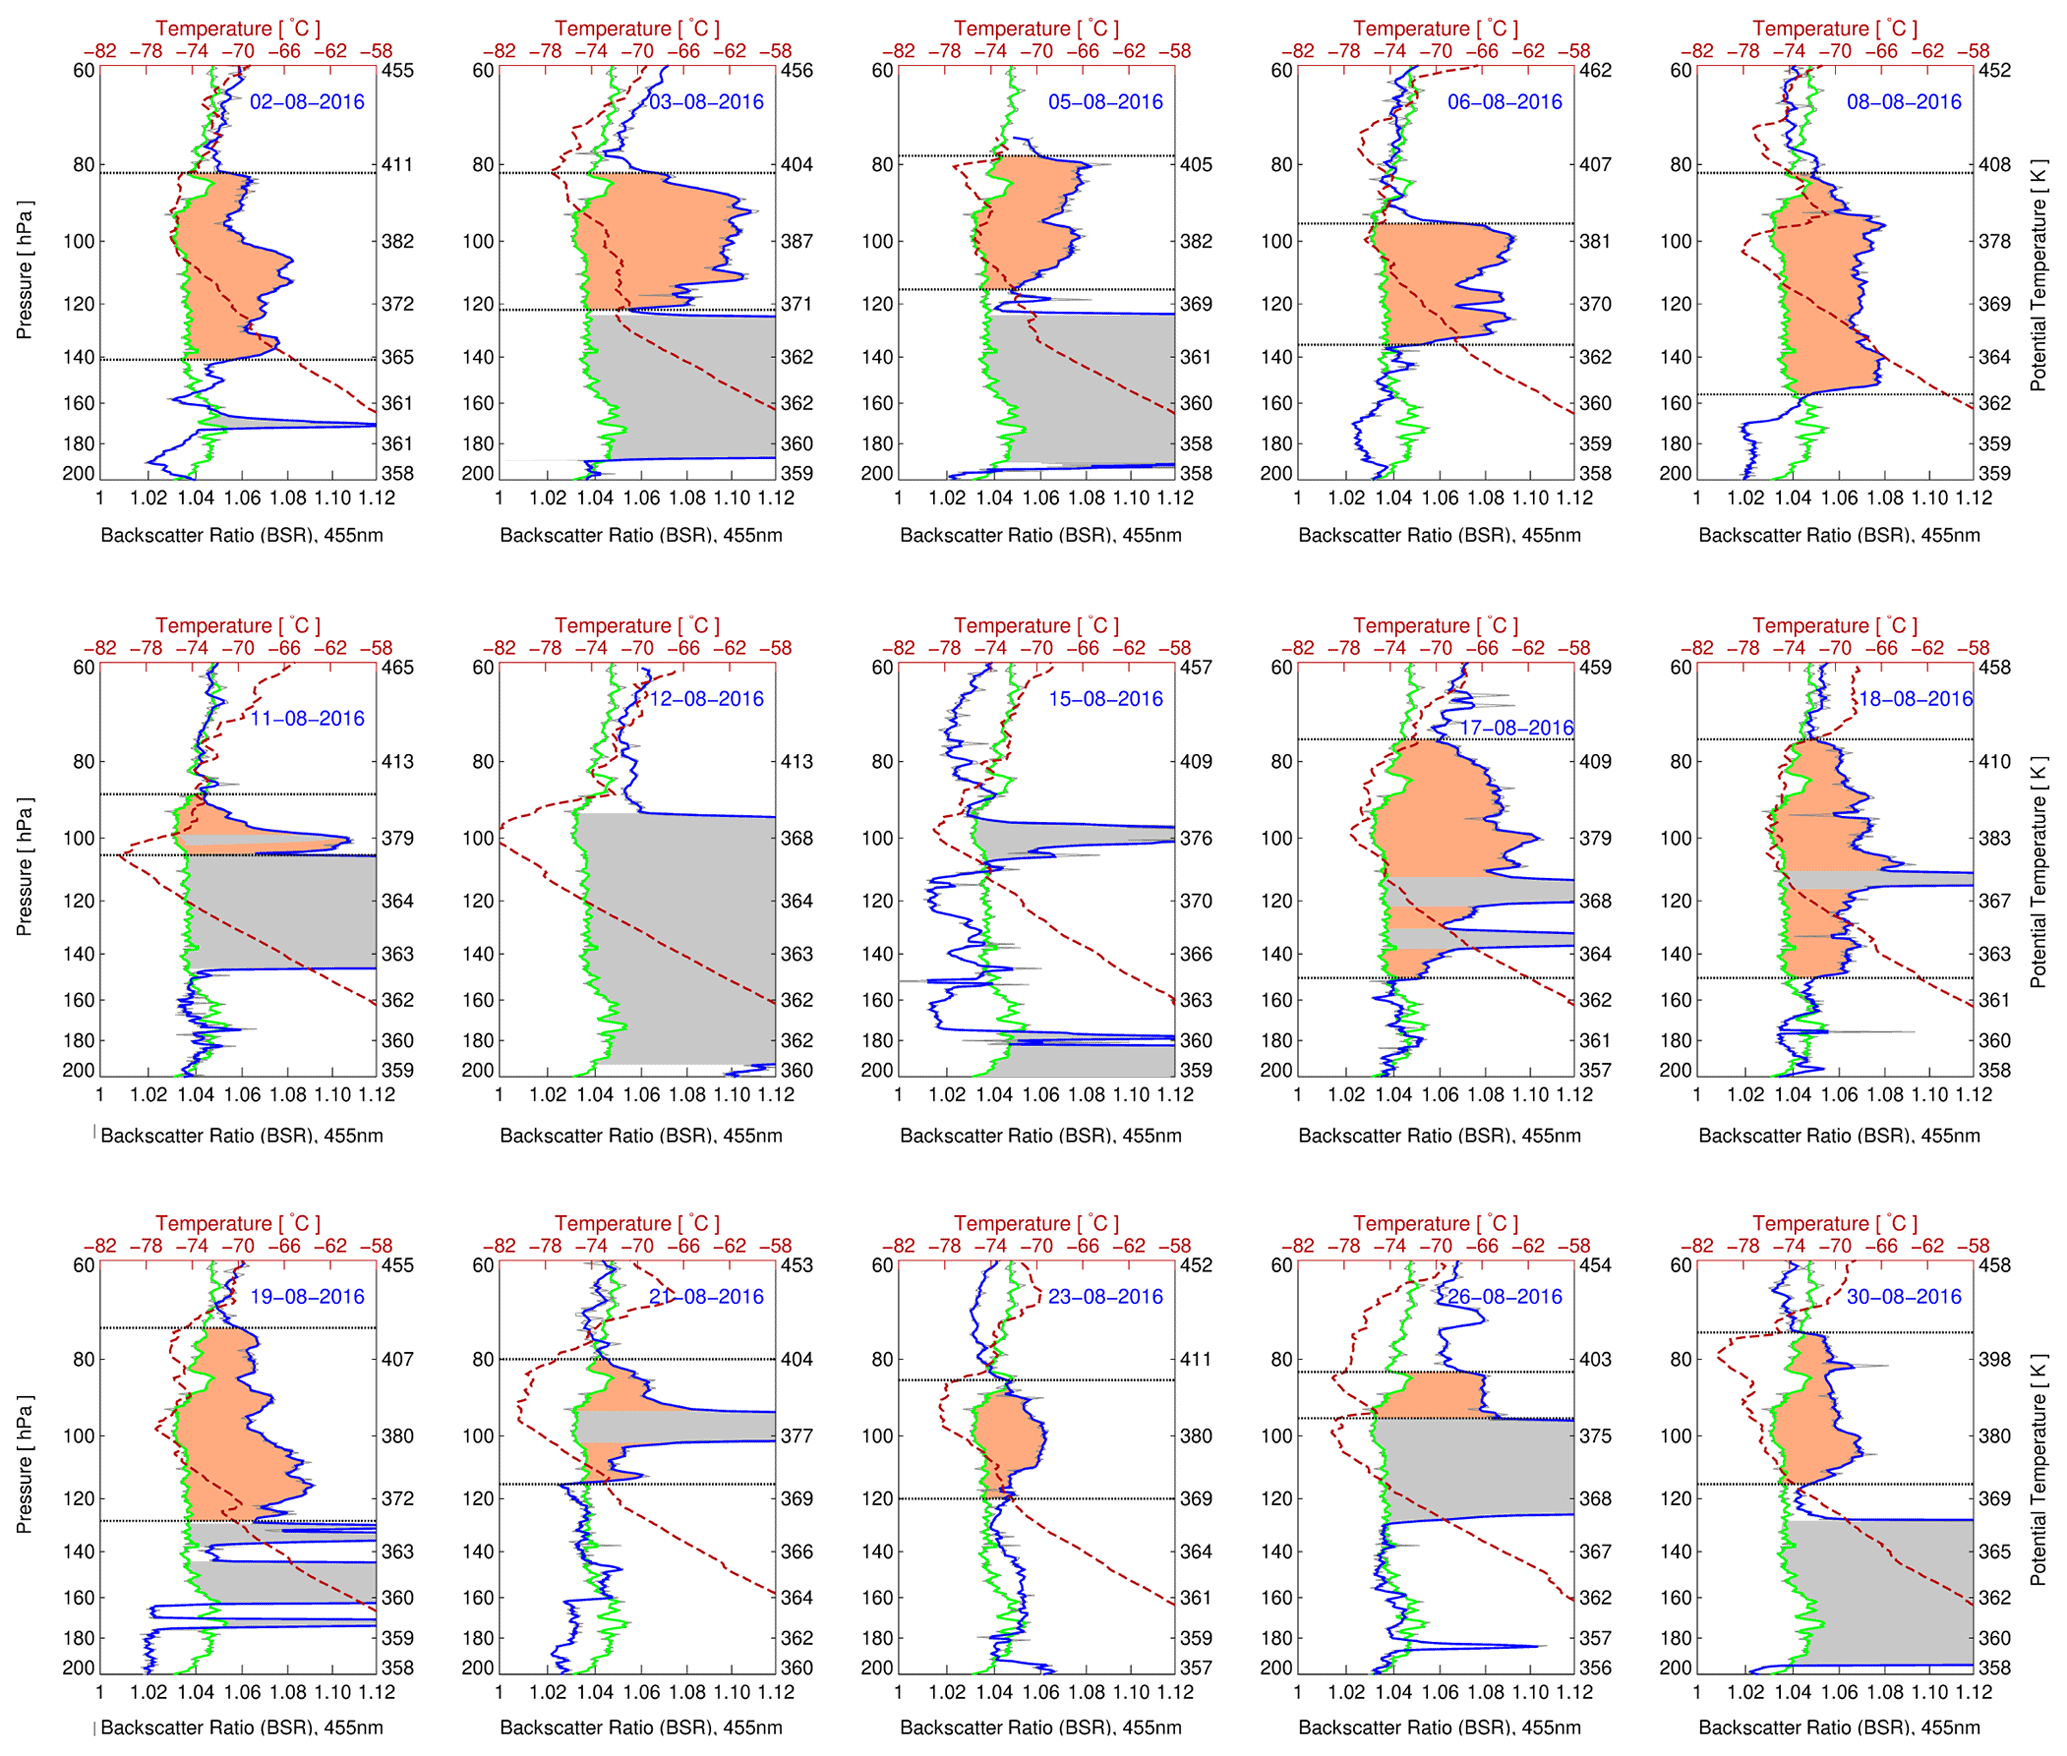
Figure 2COBALD BSR455 measurements in the UTLS region versus pressure (60–200 hPa) for each flight in August 2016 (blue line). Corresponding potential temperature calculated using both measured pressure and temperature is also given for orientation (see right-hand y axis). The averaged BSR455 profile of the two November measurements is shown in green. The blue and the green lines show a slightly smoothed representation (three-point smoothing) of the original 0.5 hPa binned data (light grey lines; see Sect. 2.3 for details). The measured temperature for each day in August 2016 is shown in red. The ATAL is highlighted by the orange shading, and cirrus clouds are indicated by the grey shading. The top and bottom boundaries of the ATAL (see Table 1) are marked by horizontal dashed black lines, except for 12 and 15 August, as no ATAL was detected on these days.
In Fig. 2, all 15 investigated COBALD balloon profiles in August 2016 (see also Table 1) are shown individually (blue lines) in comparison to the average of the two November measurements (green lines) used as a background signal. The top and bottom of the ATAL were determined for each balloon profile individually (quantified in Table 1), and these levels are shown in Fig. 2 as horizontal dashed black lines. Here we approximate the top and bottom of the ATAL by the pressure level at which the BSR455 profile has the strongest gradients or at which the BSR455 merges with the November background. The bottom is set using the same criteria as for the top of the ATAL, except for cases in which a cirrus cloud was detected directly below the ATAL. In these cases the top of the cirrus cloud is set as the bottom of the ATAL which is hidden by the cirrus cloud (3, 11, 19, 26 August).
The mean value of the backscatter intensity () between the bottom and top is individually calculated for each balloon sounding using the binned data (see Table 1). Cirrus clouds between the top and bottom are excluded in the calculation of and its standard deviation. Therefore, no value is shown in Table 1 for the “no ATAL flight” on 12 August, because over the entire altitude range where the ATAL is expected, cirrus was detected.
3.2 Day-to-day variability of the ATAL
The enhancement of BSR455 for the individual measurements in August 2016 compared to the mean of the two November measurements is shown in Fig. 2 (orange shading). There is a strong variability of the altitude, the vertical extent and the BSR455 intensity within the ATAL. There are even days when no ATAL is observed over Nainital (12 and 15 August 2016). In addition, on many balloon flights, a cirrus cloud is observed (e.g. as a very strong enhancement of BSR455; see also Sect. 2.3 above); cirrus clouds are marked in grey in Fig. 2. These cirrus clouds can occur below the ATAL, but there are also cases when cirrus clouds (ice particles) of a moderate vertical extent (∼10 K) are measured within the ATAL (17, 18 and 21 August 2016). From the measurements alone we can not exclude that the ATAL and cirrus clouds can coexist in this region (see Sect. 2.3 and discussion in Sect. 5).

Figure 3Location of the Asian monsoon anticyclone measured by the geopotential height at 110 hPa for 6, 15 and 18 August 2016 at 18:00 UTC (corresponding to 23:30 IST (Indian standard time) in Nainital). The GPH of 16.22, 16.26 and 16.30 km is shown as white contour lines. The location of Nainital is marked by a black star symbol.
From a seasonal average perspective, the ATAL extends in the longitudinal direction from the Middle East to East Asia and meridionally between ∼15 and 45∘ N (e.g. Vernier et al., 2015; Fairlie et al., 2020). This climatological picture is also true for the Asian monsoon anticyclone itself (e.g. Park et al., 2008; Vogel et al., 2016). Likewise, for the Asian monsoon anticyclone, there is a large variability from day to day in spatial extent, strength and location, manifesting in an oscillation between a state with one anticyclone and two separated anticyclones (two modes) (e.g. Zhang et al., 2002; Yan et al., 2011; Vogel et al., 2015; Nützel et al., 2016).
In the following, we consider 3 specific days more closely which are examples of particular cases (see also Sect. 4). We consider the case of an established ATAL (6 August 2016), a case in which no ATAL was observed (15 August 2016) and a case influenced by a typhoon (18 August 2016). We selected 6 August because the mean value of the backscatter intensity () is the highest out of all ATAL cases and because the measurement is not influenced by cirrus. From the two “no ATAL” cases (12 and 15 August), 15 August is chosen because the cirrus cloud is thinner than on 12 August.
The measurement in Nainital on 18 August 2016 was partially influenced by air uplifted in a tropical typhoon (this case will be discussed in detail in Sect. 4.3). On 18 August the ATAL occurs over a broader altitude range compared to 6 August; however the intensity of the ATAL is lower () than on 6 August.
The location of the Asian monsoon anticyclone for these 3 different days in August 2016 is shown in Fig. 3. The Asian monsoon anticyclone is indicated here by geopotential height at 110 hPa with geopotential Φ (m2 s−2) and g=9.81 (m s−2)) using ERA-Interim reanalyses for 6, 15, and 18 August 2016. The 110 hPa pressure level is selected because this level is located within the ATAL for most balloon flights in August 2016.
For the case of an established ATAL (6 August 2016), a single-modal anticyclone is found. For the case with no observation of an ATAL (15 August 2016), a bi-modal structure of the anticyclone is found, and Nainital is located between the eastern and western mode of the Asian monsoon anticyclone. For the ATAL case impacted by a tropical cyclone (18 August 2016), a single-modal anticyclone is found with pronounced eddy shedding events (outflow from the anticyclone) towards both the east and the west (e.g. Vogel et al., 2015, 2016).
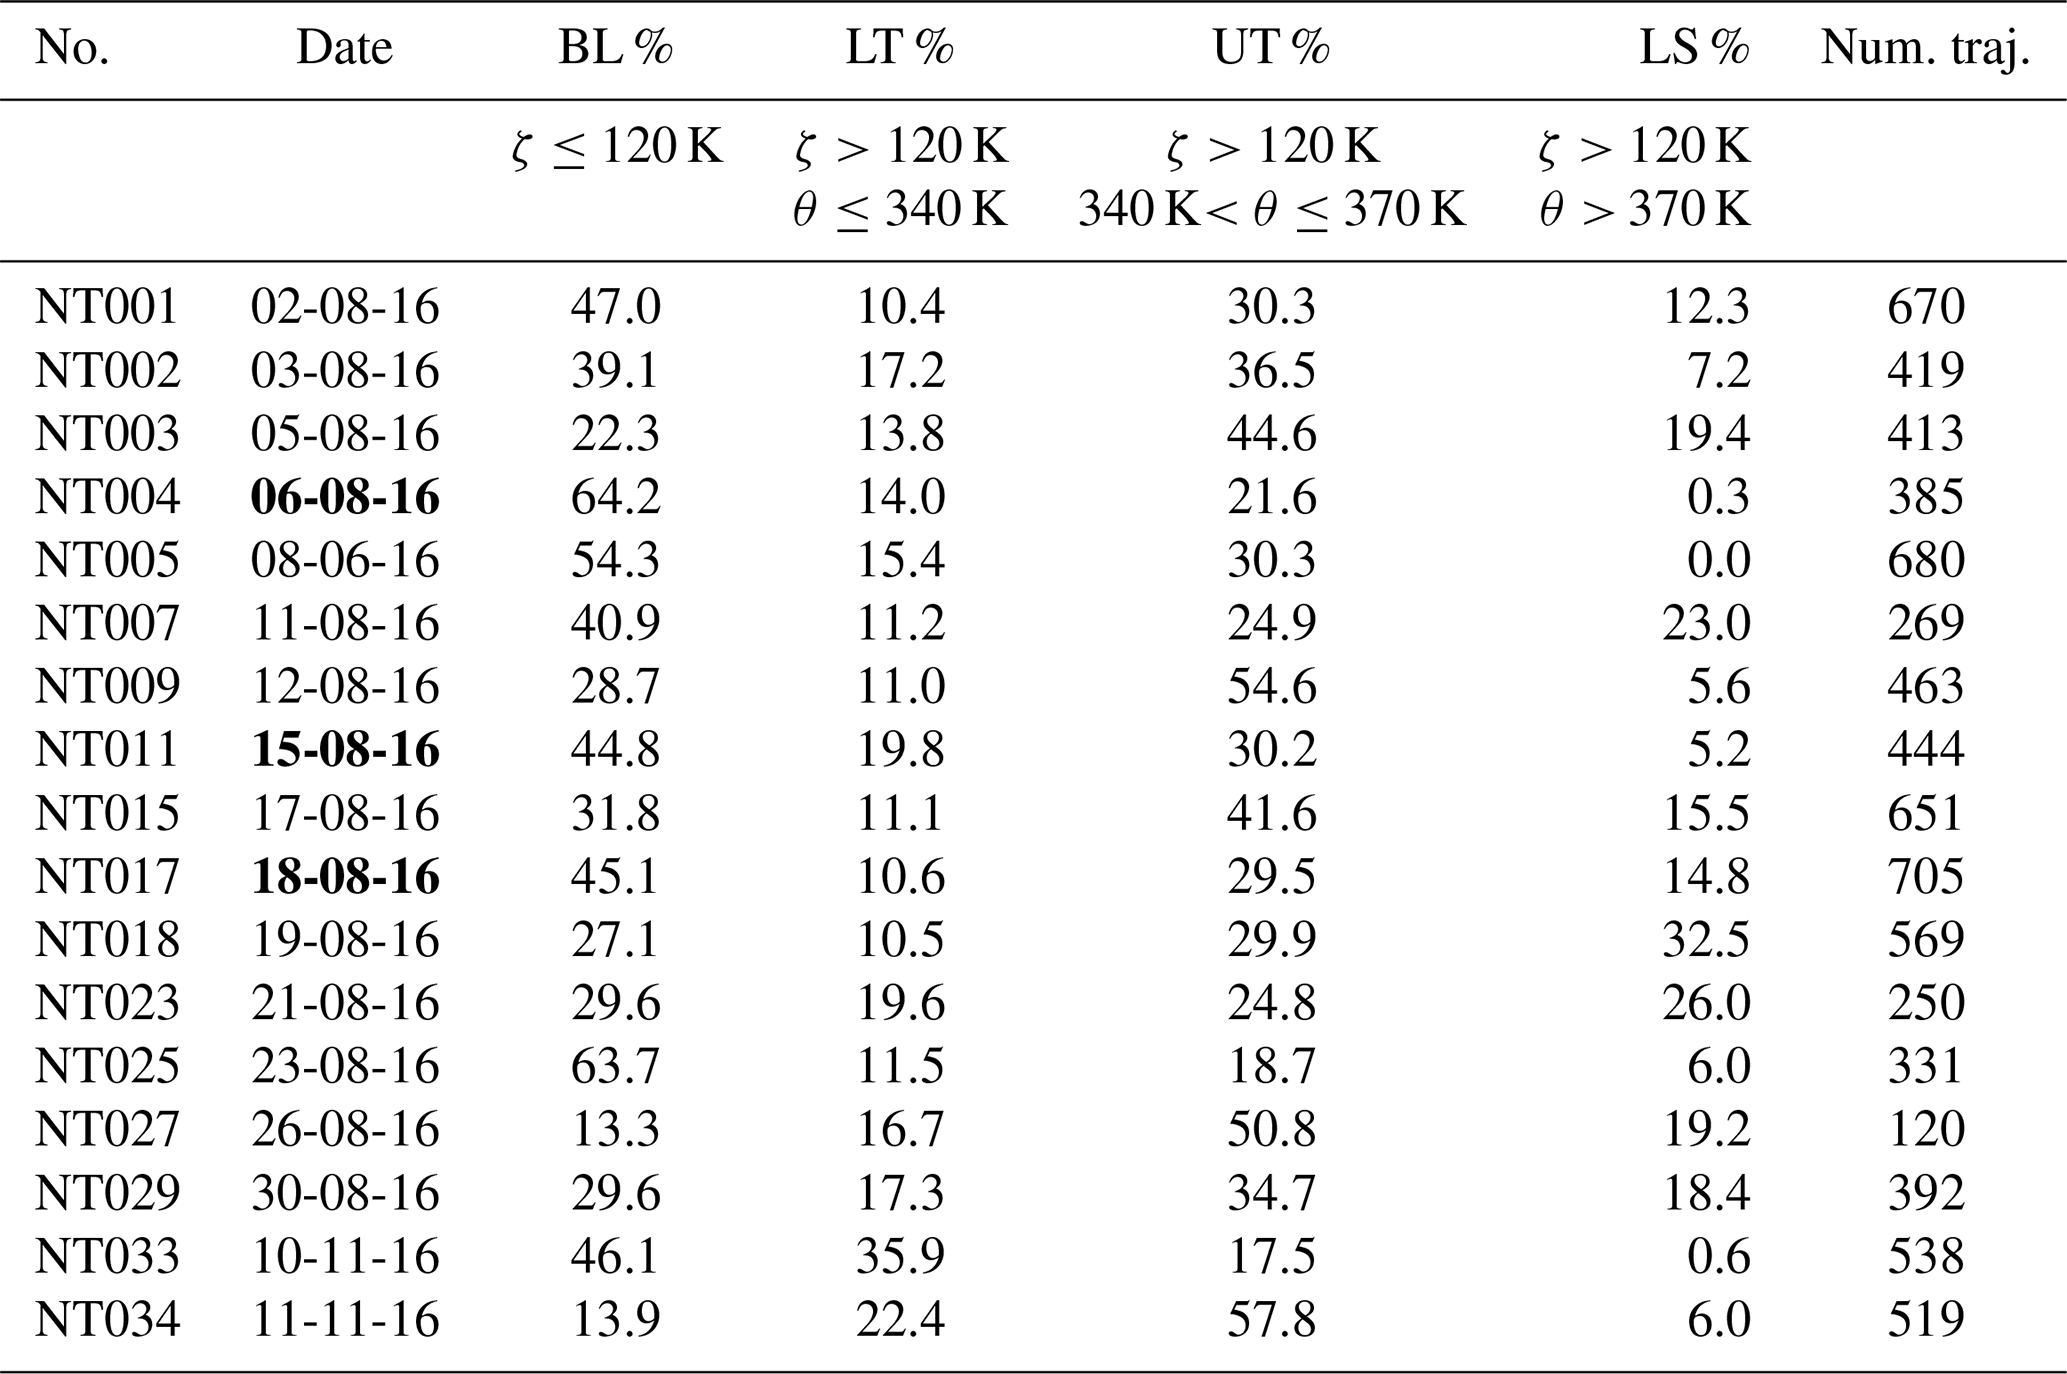
Table 2Contributions of the origin of the air masses found in the ATAL using 40-day backward trajectories according to sources in the boundary layer (BL), in the lower troposphere (LT), in the upper troposphere (UT) and in the lower stratosphere (LS). The number of backward trajectories (starting within the ATAL layer) calculated along each balloon profile is given in the last column. In the second and third row, the selection criteria for BL, LT, UT and LS are listed. Trajectories are considered to end in the BL when they are located for the first time below about 2–3 km (i.e. vertical hybrid coordinate ζ≤120 K). The location of this point is referred to as the “end point” of the trajectory in the model boundary layer. For the remaining trajectories ending at atmospheric altitudes (ζ>120 K), a potential temperature criterion (Θ) is employed to discriminate between origins in LT, UT and LS. The dates of three balloon flights representing typical situations encountered during the measurements in August 2016 are marked in bold type: the case of an established ATAL (6 August 2016), a case without the observation of an ATAL (15 August 2016) and a case in which the measurements are heavily influenced by air masses uplifted in a tropical cyclone (18 August 2016).
As shown in Fig. 2, there is a strong day-to-day variability in the ATAL altitude range, vertical extent and the BSR455 intensity. To analyse the transport pathway and the origin of the air masses contributing to the ATAL, for each sounding in August 2016 backward trajectories were calculated over a time period of 40 d. The dependence of the results of the trajectory calculations on the trajectory length (40, 60 and 80 d) will be discussed in detail below (Sect. 4.4).
The backward trajectories were started every second along the measured balloon profile where ATAL particles were detected during the flight (see Table 1 and Fig. 2, in orange). The back-trajectory calculations are based on 1 s data with a higher vertical resolution than the BSR455 values in Fig. 2 (binned data in pressure intervals of 0.5 hPa). In cases with a thin cirrus cloud embedded in the ATAL (17, 18 and 21 August 2016), the region of the cirrus cloud is included in the backward trajectory calculation because it is likely that ATAL and ice particles coexisted in this region (see Sect. 2.3 and discussion in Sect. 5). For the two no ATAL cases (12 and 15 August 2016) as well as the two post-monsoon measurements (10 and 11 November 2016), backward trajectories were started in a pressure range between 140 and 92 hPa to allow a comparison with the ATAL observations.
We classify the origin of the air masses found in the ATAL according to sources in the model boundary layer, in the lower troposphere (LT), in the upper troposphere (UT) and in the lower stratosphere (LS) (Table 2). Trajectories are considered to end in the model boundary layer (BL) when they are located for the first time below about 2–3 km (i.e. vertical hybrid coordinate ζ≤120 K). The location of this point is referred to as the “end point” of the trajectory in the model boundary layer. The trajectory length for these trajectories ending in the BL is shorter than 40 d because they reach the BL before 40 d. Within 40-day ≈14 %–64 % of the trajectories reach the model boundary layer. For the remaining trajectories ending at atmospheric altitudes, a potential temperature criterion is employed to discriminate between origins in the lower troposphere (LT), in the upper troposphere (UT) and in the lower stratosphere (LS) (see Table 2).
There is a strong variability of the contributions of different atmospheric altitude layers (BL, LT, UT and LS) to the air masses in the ATAL (Table 2), demonstrating that within the ATAL a mixture of air masses of different origin exists. Before we discuss the results of the back-trajectory calculations for all balloon-flights in Nainital, 3 different days representing typical situations encountered during the measurements in August 2016 are presented in detail: the case of an established ATAL (6 August 2016), a case without the observation of an ATAL (15 August 2016) and a case in which the measurements are heavily influenced by air masses uplifted in a tropical cyclone (18 August 2016).
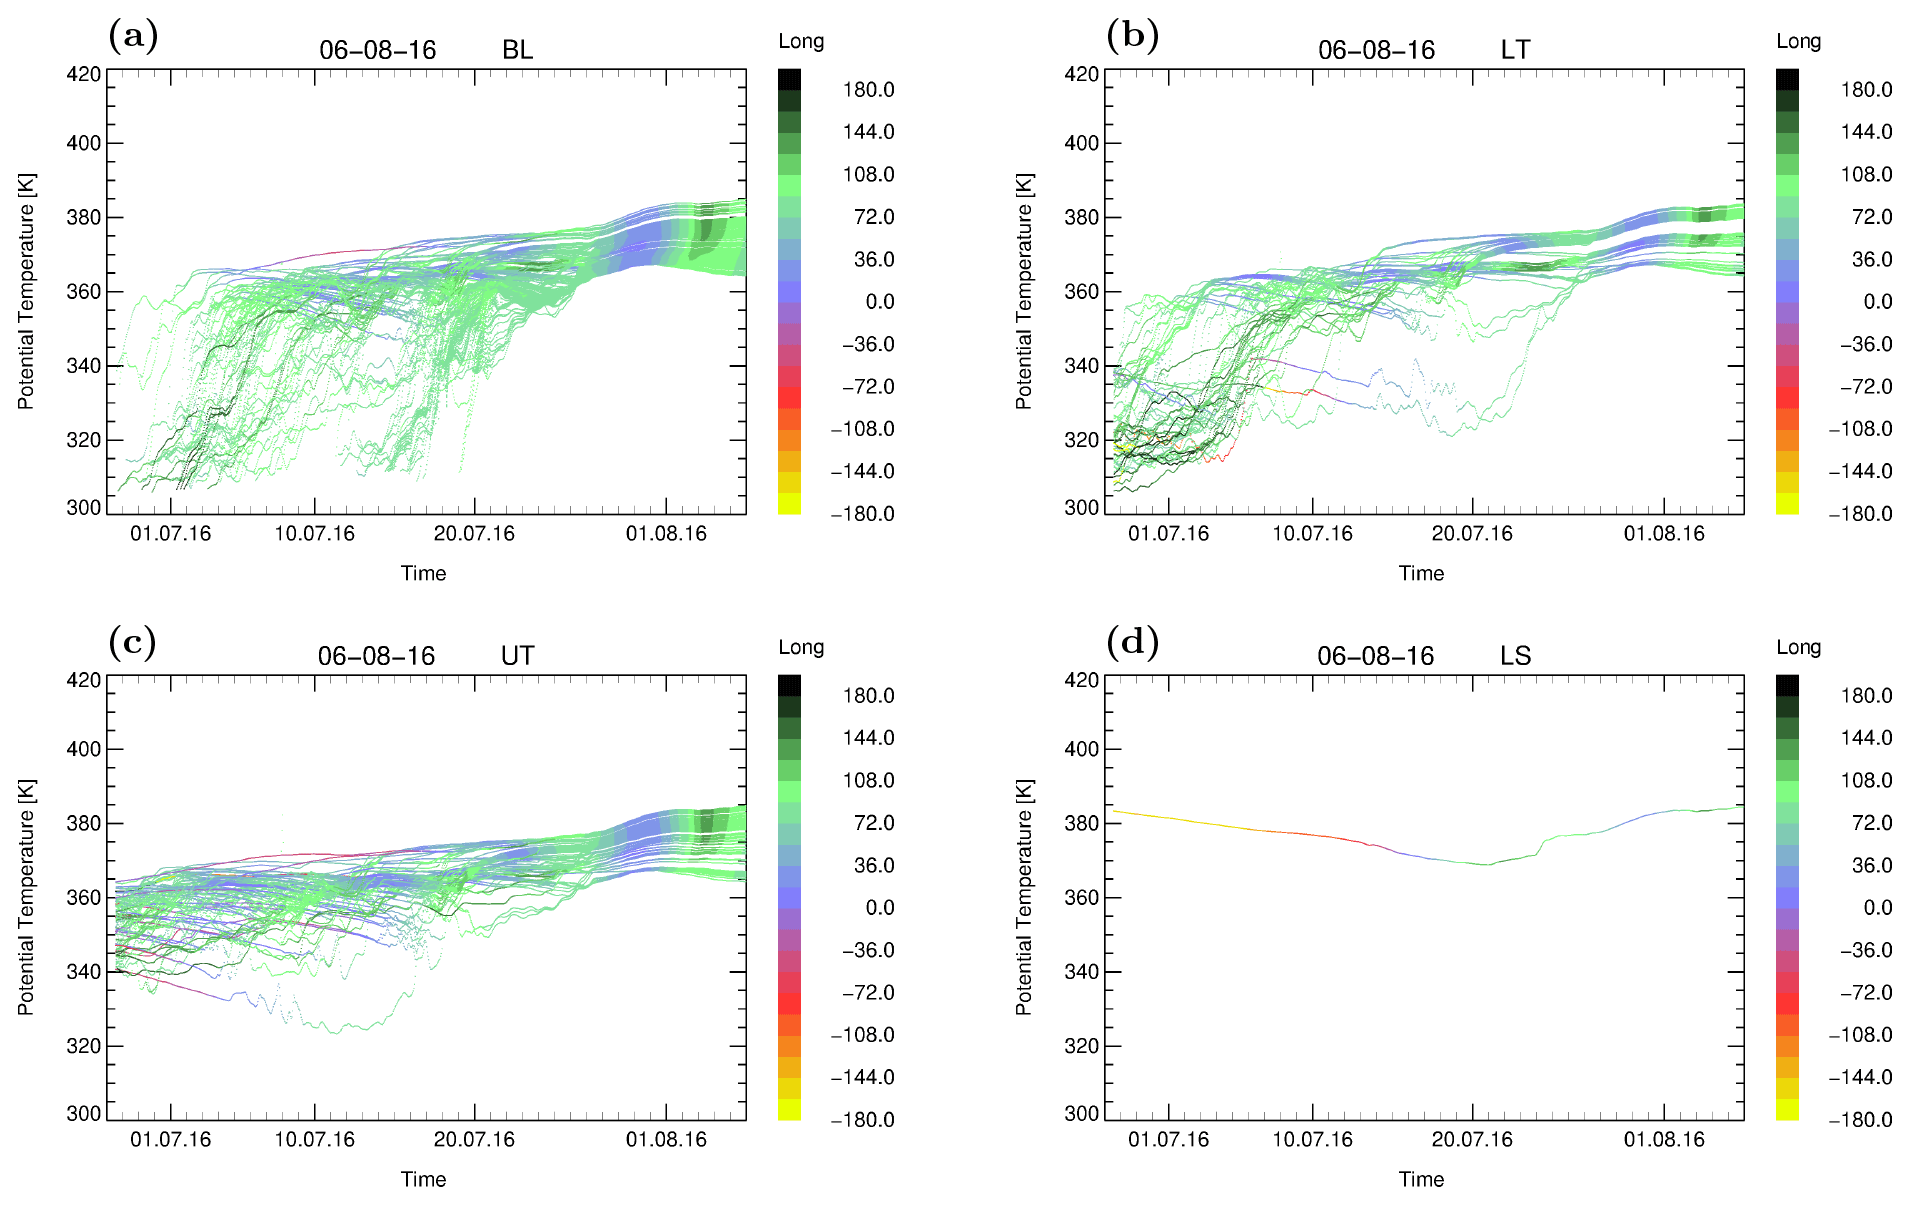
Figure 4Forty-day backward trajectories initialised on 6 August 2016 at the location of the ATAL measurement (see Table 1). The trajectories are sorted by air mass origin in the boundary layer (a), in the lower troposphere (b), in the upper troposphere (c) and in the lower stratosphere (d). The fractions of the different atmospheric altitude layers (BL, LT, UT, LS) of the composition of the ATAL are shown in Table 2. The colour indicates the location of the trajectory in longitude.
4.1 Case 1: Established ATAL on 6 August 2016
On 6 August 2016 the ATAL was observed between 364 and 388 K (135–95 hPa). The back-trajectory analysis of 40 d (Table 2) shows that 64 % of the trajectories are from the boundary layer (BL), 14 % from the lower troposphere (LT), 22 % from the upper troposphere (UT) and only 0.3 % from the lower stratosphere (LS). The 40-day backward trajectories (potential temperature versus time) classified by the location of the trajectory end points at different atmospheric altitude layers are shown in Fig. 4.
Air masses from the BL are mainly uplifted very fast by individual convective events within short time periods of 1–2 d up to ≈360 K. Subsequently, a slower updraft above 360 K occurs within the Asian monsoon anticyclone (at longitudes between 0 and 140∘ E) where the air masses follow the anticyclonic flow (see Fig. 5). This region is referred to as the upward spiralling range by Vogel et al. (2019). Trajectories from the LT are very similar to those from the BL; however there are more trajectories originating outside of the Asian monsoon region from western longitudes. Most trajectories from the UT experienced radiatively driven updraft within the upward spiralling range. In contrast, the trajectory originating in the LS descends in the stratosphere (coming from North America) and subsequently ascends within the anticyclone.
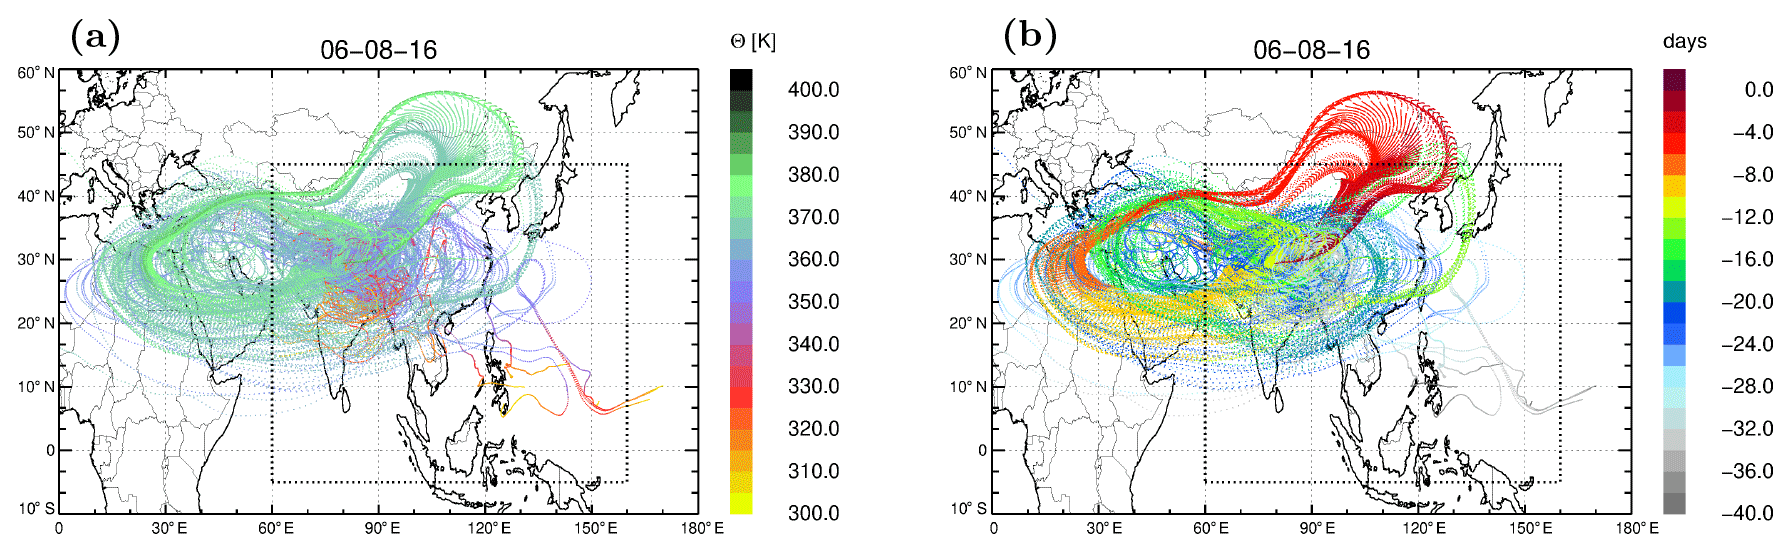
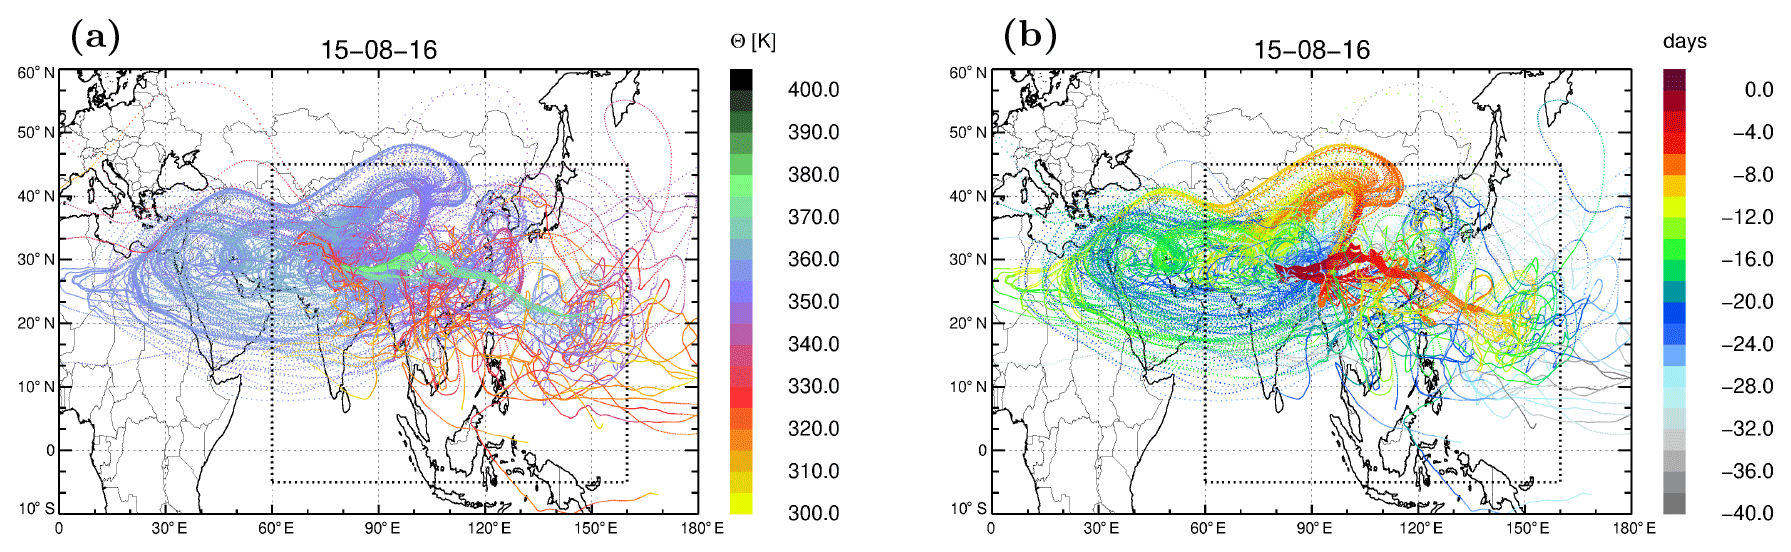
Figure 5Forty-day backward trajectories initialised within the ATAL on 6 August 2016 originating in the BL (same trajectories as shown in Fig. 4a), colour-coded by potential temperature (a) and by days back from 6 August 2016 (b). In a latitude–longitude box from 60 to 160∘ E and from 5∘ S to 45∘ N, indicated by dashed lines, the air mass origin in the BL is further analysed (see Fig. 6, Table 3)
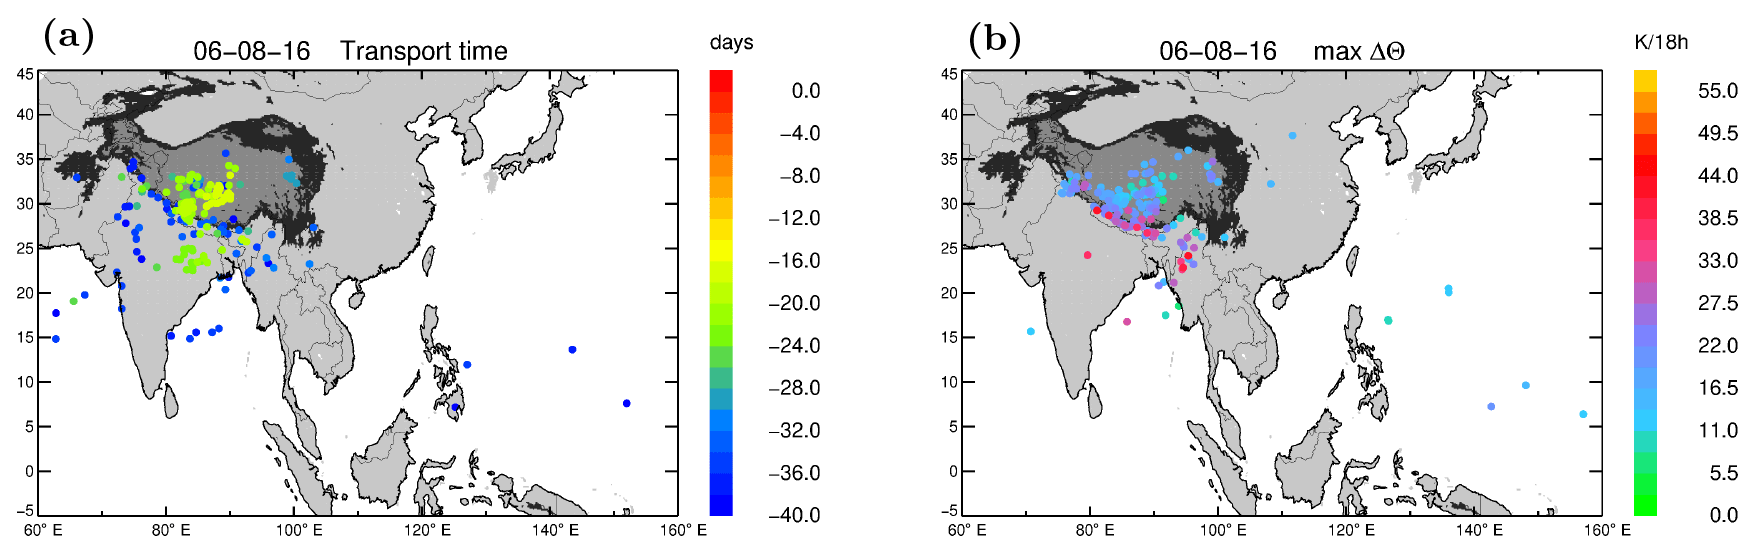
Figure 6(a) Location of end points of the trajectories, initialised on 6 August within the ATAL, where they reach the model boundary layer (BL) within 40 d. The end points are colour-coded by the transport time between the BL and measurement. (b) Location of the strongest updraft along the 40-day backward trajectories, colour-coded by the strongest change in potential temperature within 18 h (in kelvin per 18 hours, K 18 h−1). The Tibetan Plateau (“Tibet”; dark grey), the Himalayan foothills (“Foothills”; black), the remaining continental area (“Land”; light grey) and the maritime area (“Ocean”; white) are indicated (see Table 3).
The trajectories originating from the BL are from the region of the Asian monsoon anticyclone and from the western Pacific (Fig. 5). To obtain a deeper insight into the origin of air masses contributing to the ATAL, trajectories originating in the BL are further separated. In a latitude–longitude box from 60 to 160∘ E and from 5∘ S to 45∘ N (Fig. 6, Table 3), we distinguish between Tibetan Plateau (Tibet), foothills (Foothills), including the Himalayan foothills, the remaining continental area (Land) and maritime area (Ocean). The continental areas were separated according to geopotential (Φ) or GPH (Φ g−1). The Tibetan Plateau is defined as the altitude above a geopotential Φ of 40 000 m2 s−2 (above GPH ≈4000 m), the Foothills as m2 s−2 (GPH ≈2000–4000 m) and the remaining continental area as Φ<20 000 m2 s−2 (below GPH ≈2000 m). Trajectories originating outside the latitude–longitude box are classified as Residual. Figure 6a shows the locations of the end points of all trajectories ending in the BL for 6 August 2016, colour-coded by the transport time from the boundary layer to the location of the measurements. The shortest transport times of about 15–20 d are found for trajectories originating on the Tibetan Plateau. In addition there is a cluster of trajectories from northeast India with transport times of about 25 d. In addition, the location of the maximum updraft within a time period of 18 h along these 40-day backward trajectories is calculated. It is first determined where the maximum change in potential temperature occurs (ΔΘmax) along the 40-day backward trajectories (calculated as a running mean over the change in potential temperature within 18 h). The location of the maximum updraft within these 18 h is then calculated as the mean location of the trajectory within a time period of 18 h for ΔΘmax (Fig. 6b). It is evident that the location of the end points (Fig. 6a) and of the strongest updraft (Fig. 6b) differ substantially. Our calculations show a cluster of locations with an updraft larger then 25 K 18 h−1 within a belt along the southern edge of the Himalayas and over Myanmar. The area of the Foothills (GPH ≈2000–4000 m) is very small because the gradient of the GPH is very steep at the southern slope of the Himalayas; therefore it is difficult to highlight this belt using only the GPH as a criterion to discriminate the Foothills. The number of trajectories with the location of strongest updraft on the Tibetan Plateau (44 %) is enhanced compared to the end points of these trajectories (34 %) (Tables 3 and 4). The location of ΔΘmax depends strongly on the time interval over which the change in potential temperature is calculated. If a very short time interval is chosen, the deduced region of strongest updraft depends only on one input data set at one particular time step. However, the longer the time interval, the higher the uncertainty of the location of maximum updraft along the trajectories. This is because the vertical updraft by convection in CLaMS trajectories is driven by vertical velocities deduced from ERA-Interim and is not restricted to very narrow regions (e.g. see Fig. 4). Therefore, the locations of ΔΘmax are spread out increasingly over the region of the southern slope of the Himalayas with an increasing time interval. To avoid the uncertainty caused by a larger time interval, and because of the fact that convection occurs on a timescale of a few hours, we decided to use a time interval of 18 h. This choice also ensures that at least three input data sets from ERA-Interim (with a time resolution of 6 h) are included to localise the preferred regions of strongest updraft in the region of the Asian monsoon.
Table 3Fraction of 40-day backward trajectories (for all soundings in August 2016) which end in the boundary layer (BL), separated into the Tibetan Plateau (“Tibet”), the Himalayan foothills (“Foothills”), the remaining continental area (“Land”) and the maritime area (“Ocean”) in a latitude–longitude box from 60 to 160∘ E and from 5∘ S to 45∘ N shown in Fig. 6 and finally all remaining trajectories that reach the BL outside the latitude–longitude box (Residual). The fraction of trajectories which are from the LT, UT and LS (i.e. do not reach the BL within a time period of 40 d as shown in Table 2) is the difference between 100 % and the fraction of the BL in %. Tibet is defined as the altitude above a geopotential Φ of 40 000 m2 s−2 (about 4000 m), the Foothills as m2 s−2 (about 2000–4000 m) and Land as Φ<21 000 m2 s−2 (below about 2000 m). The dates of three balloon flights representing typical situations encountered during the measurements in August 2016 are marked in bold type (see Table 2).
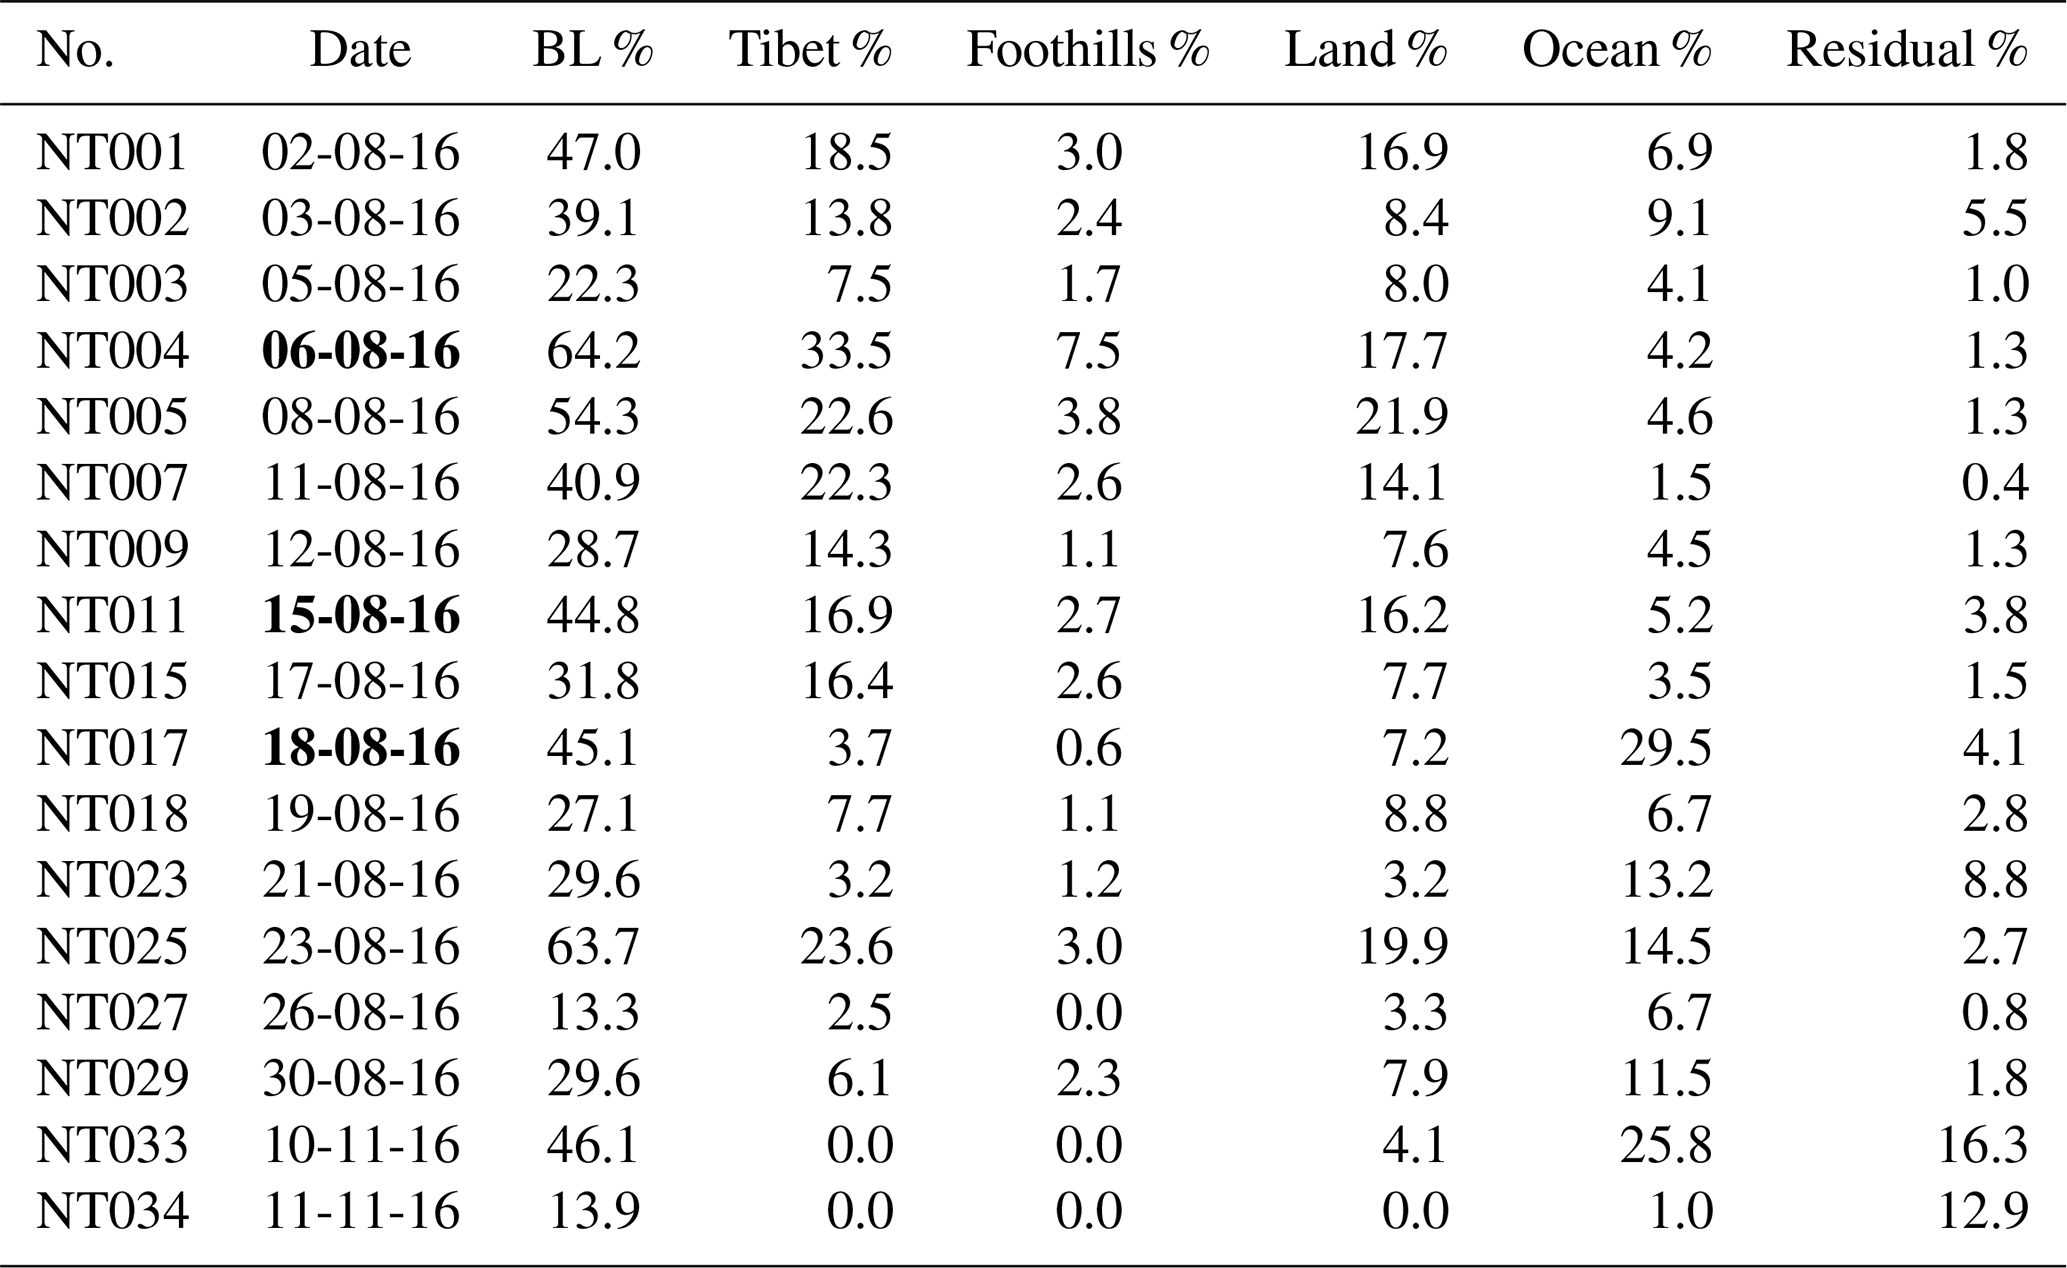
Table 4Same as Table 3 but for the location of the strongest updraft along the 40-day backward trajectories ending in the BL. The strongest updraft is calculated by the maximum change in potential temperature within a time period of 18 h along the trajectories. The location of the maximum updraft within 18 h is then calculated as the mean location of the trajectory within 18 h. The dates of three balloon flights representing typical situations encountered during the measurements in August 2016 are marked in bold type (see Table 2).
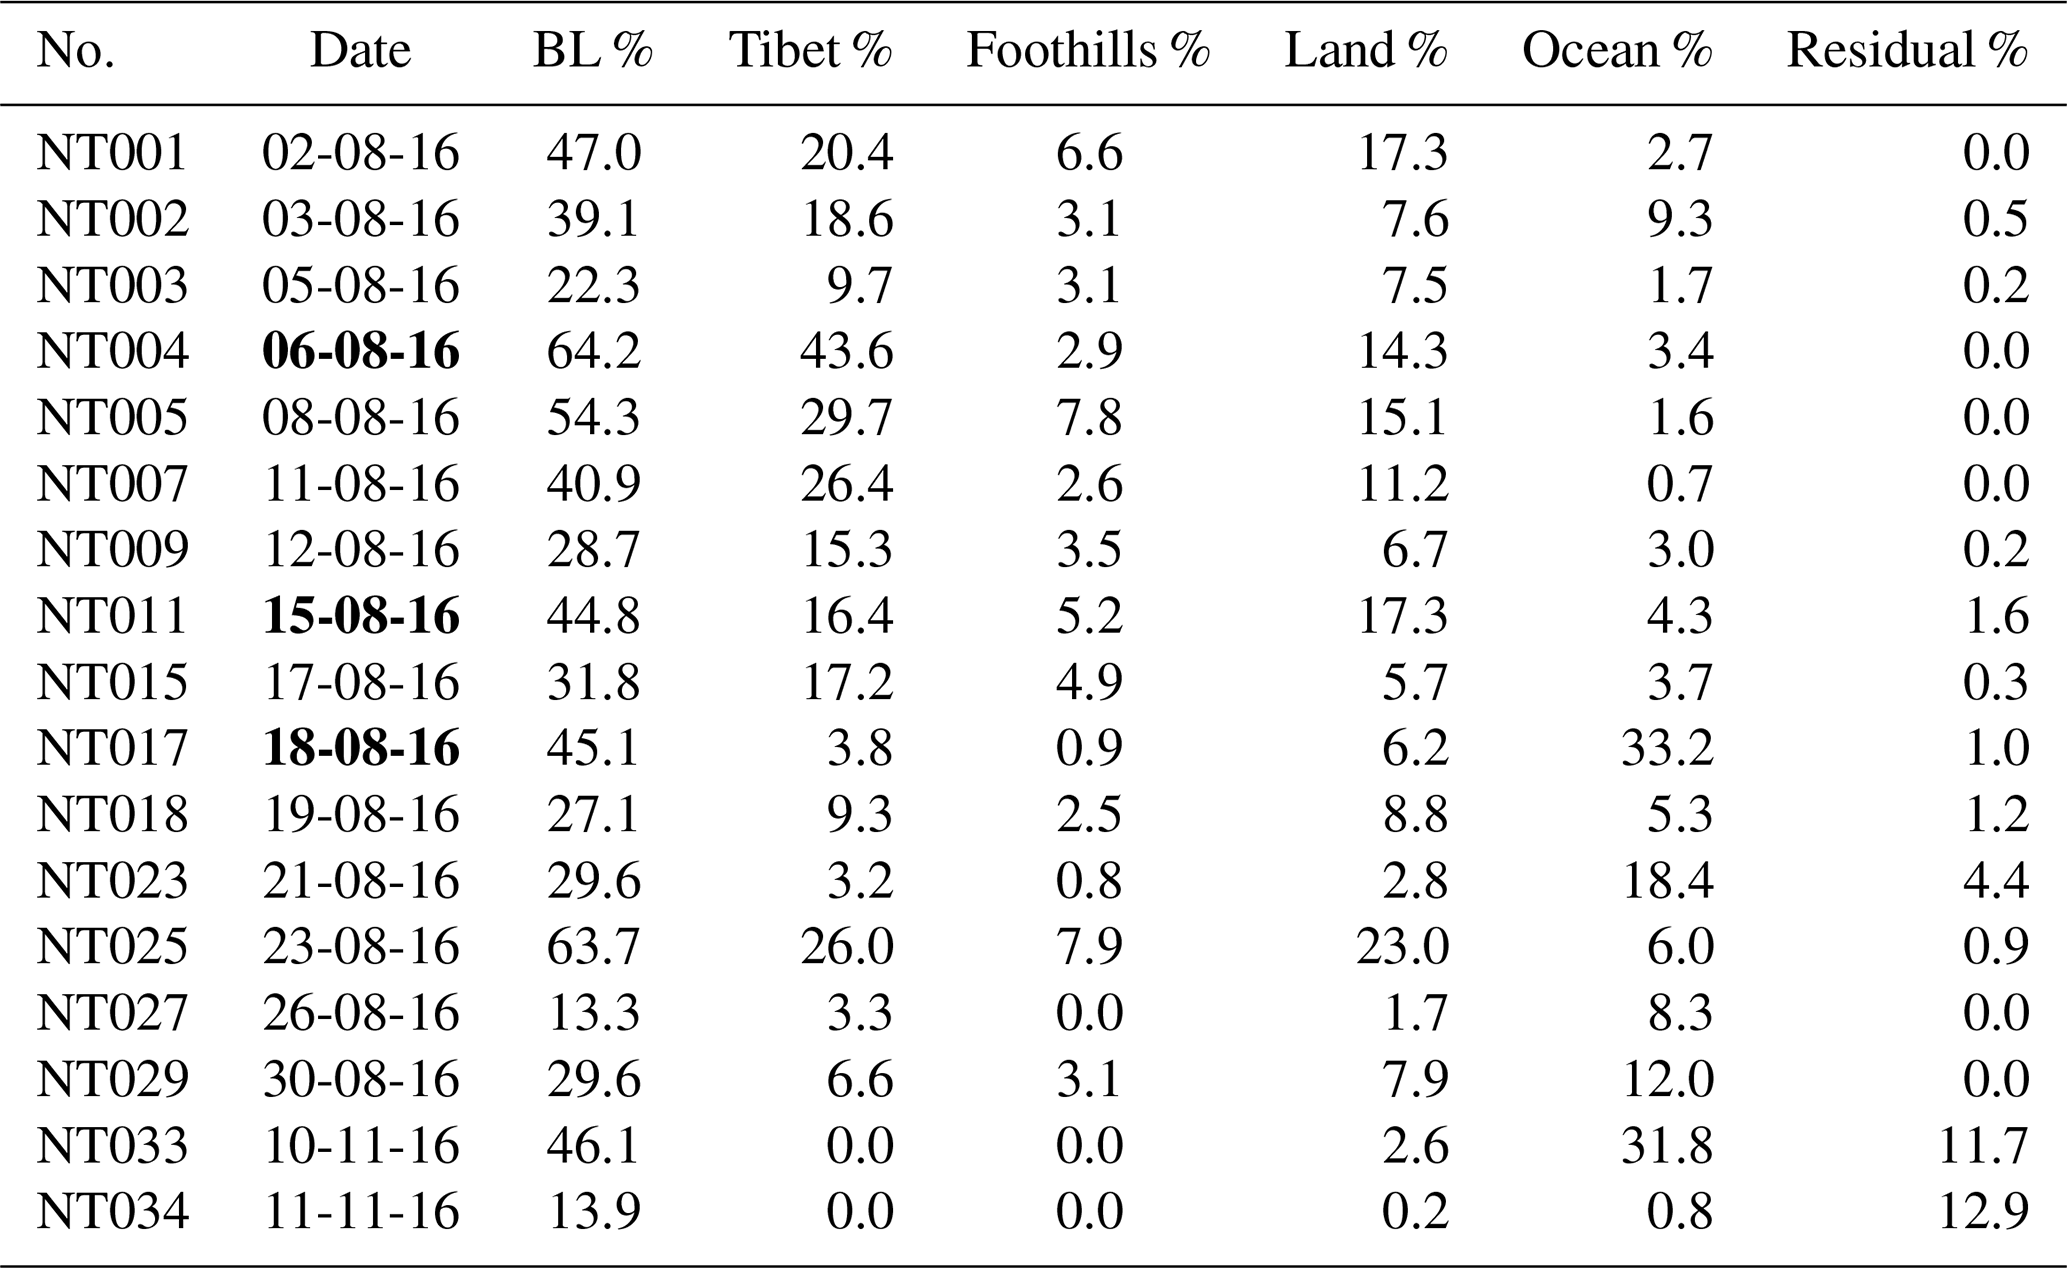
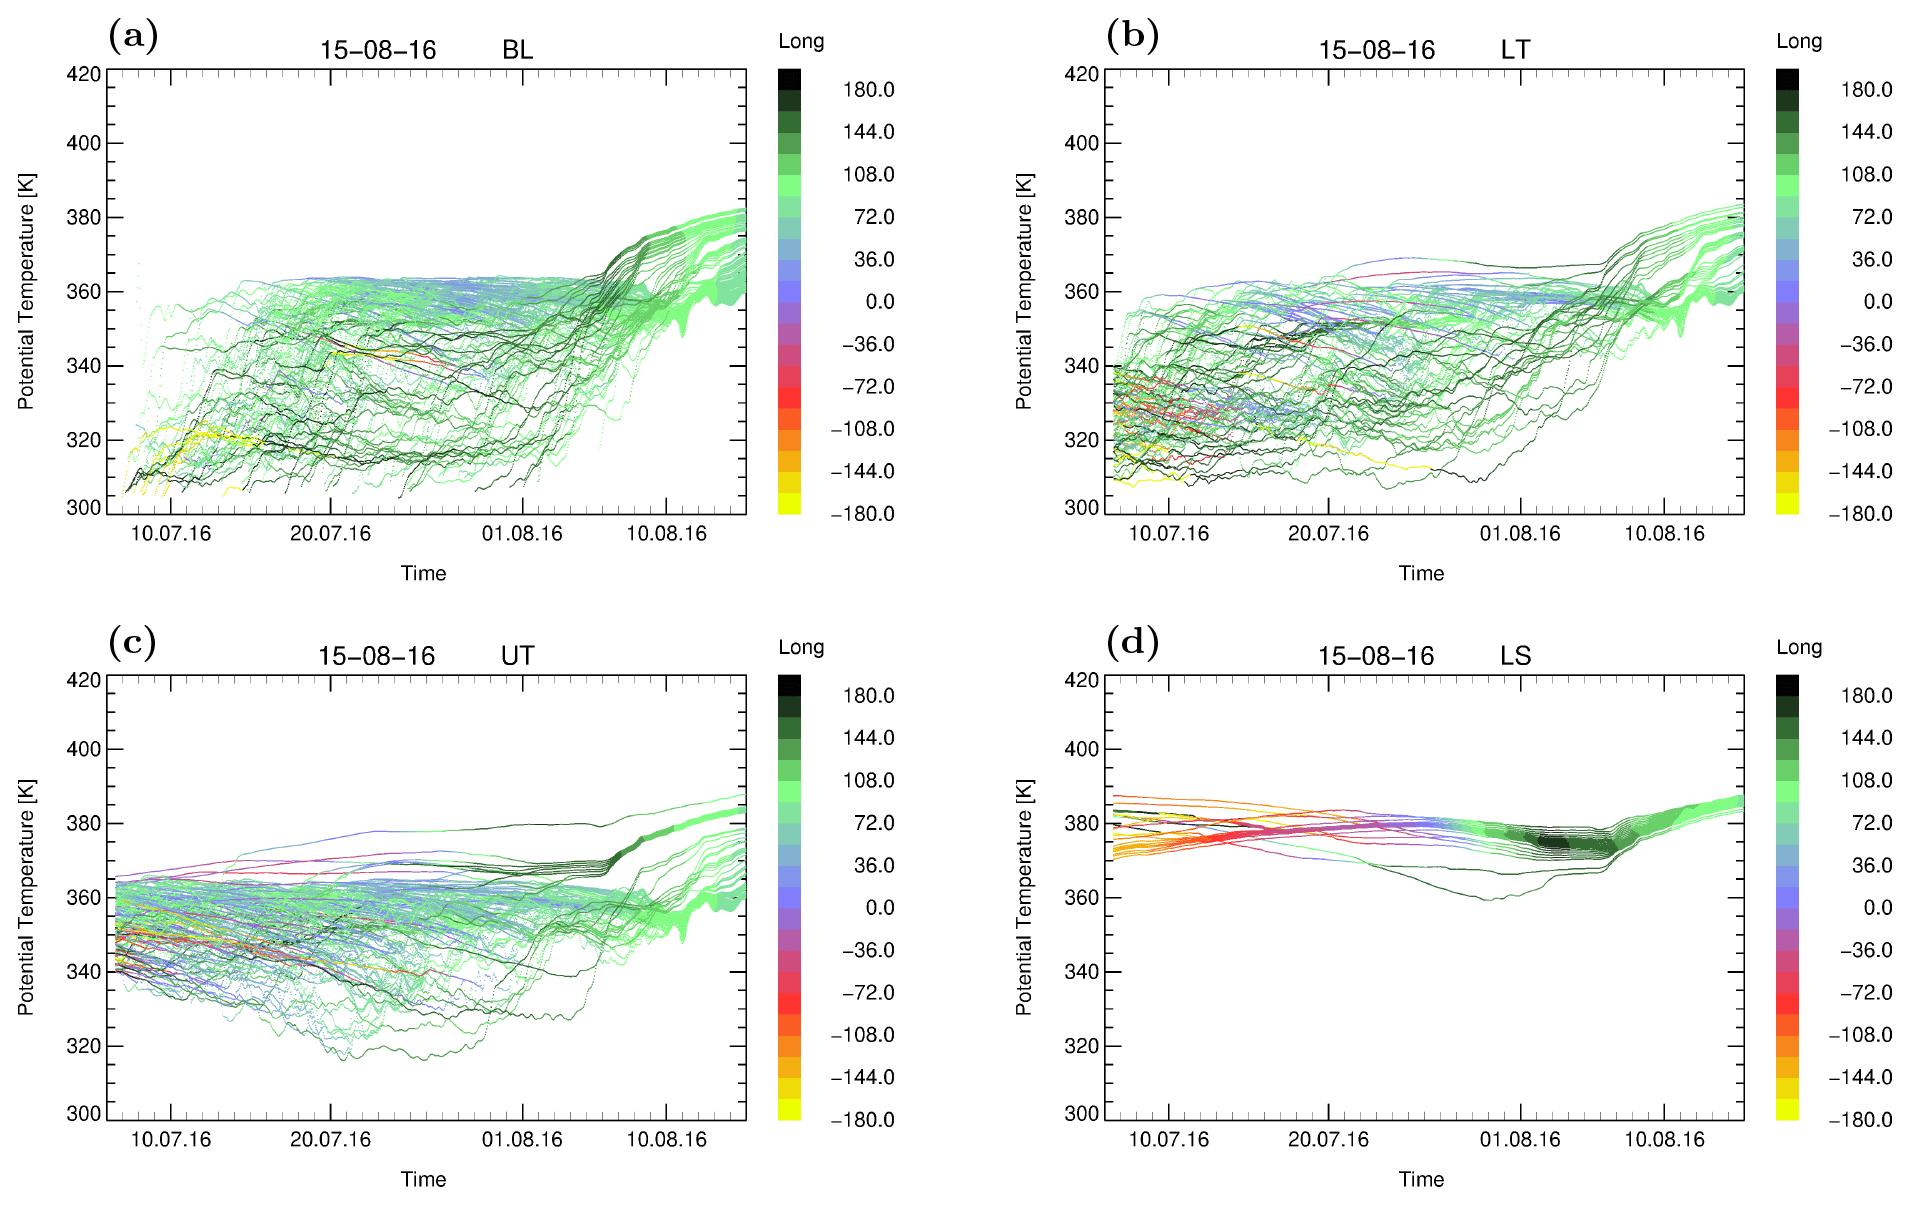
Figure 7As Fig. 4 but for the no ATAL case on 15 August 2016 (Case 2). The trajectories are calculated in a pressure range between 140 and 92 hPa (365 to 389 K).
4.2 Case 2: No ATAL on 15 August
On 15 August 2016 no ATAL was detected by the COBALD measurements. To compare this flight with the other cases in which an ATAL was probed during August 2016, CLaMS backward trajectories are initialised in a pressure range between 140 and 92 hPa (365 to 389 K). In this pressure range 45 % of the trajectories are from the BL, that is, 20 % less than the BL contribution of Case 1 (64 %). Therefore, much higher contributions of the UT (30 %) and LT (20 %) as well as from the LS (5 %) are found on 15 August in contrast to Case 1 (22 %, 14 %, 0.3 %) (see Table 2). The lesser contribution of the BL can be explained by the location of the anticyclone related to the location of the measurements. On 6 August 2016 the Asian monsoon anticyclone was over Nainital, while on 15 August Nainital was located between the western and the eastern mode of the anticyclone (see Fig. 3). The 40-day backward trajectories for 15 August 2016 are shown in Fig. 7. In contrast to Case 1 no pronounced individual convection events are noticeable in the trajectories from BL and LT on 15 August. Here, an alternating up- and downward transport is found along most of the trajectories below 360 K, and only a few trajectories show a strong upward transport (convection) up to 360 K within a time period of 1–2 d.
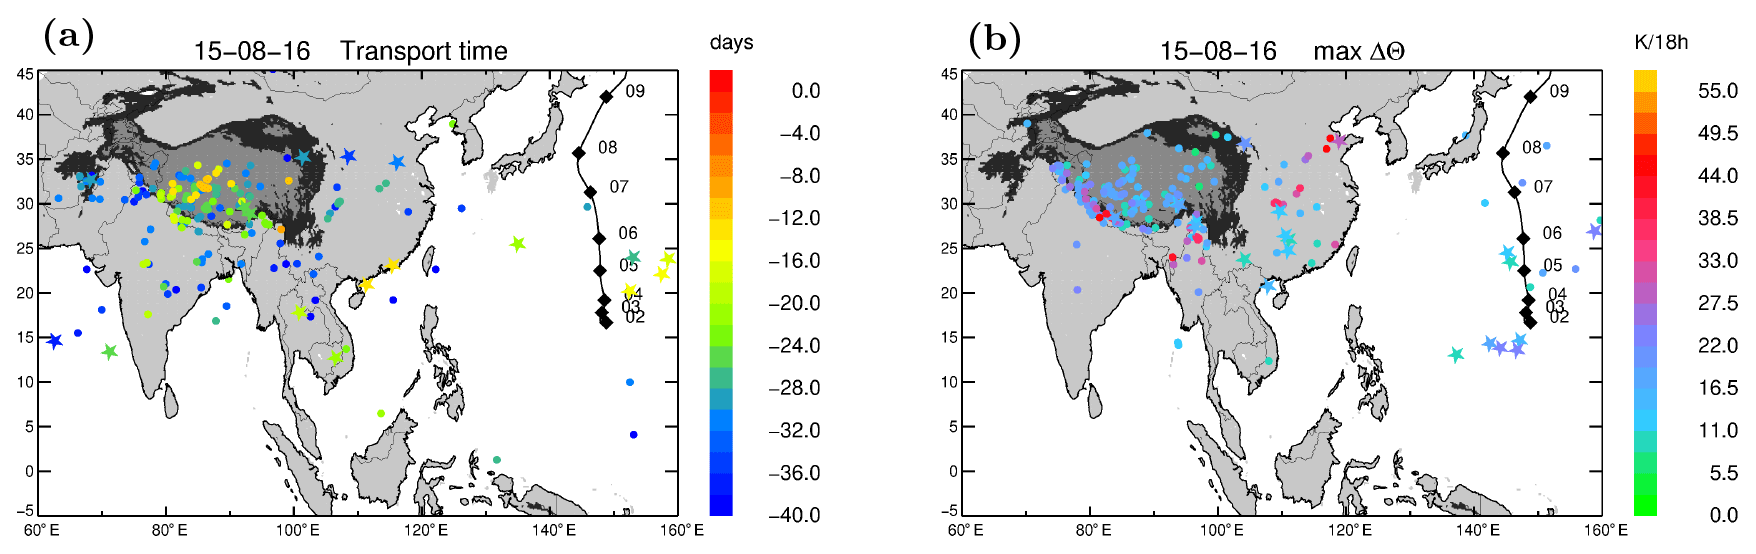
Figure 9As Fig. 6 but for the no ATAL case on 15 August 2016. Locations of end points and locations of the strongest updraft of trajectories initialised within the cirrus cloud are indicated by star symbols. The 40-day backward trajectories are impacted by Typhoon Omais. Its storm track is shown (black line), and the location at noontime is additionally marked (black diamonds); the numbers indicate the day in August 2016.
Focusing on the trajectories from the BL (Fig. 8), two branches, a western and eastern branch, of trajectories are found depending on the altitude of the measurements (Fig. 7a); trajectories from above 370 K are from eastern longitudes, and trajectories from below 370 K are from western longitudes. In the western branch of the trajectories the air masses are transported around the western mode of the Asian monsoon anticyclone, while air masses from the eastern branch come from the Pacific Ocean and are transported along the southern edge of the eastern mode of the anticyclone to the measurement location in Nainital. During the first half of August several tropical storms occurred in the western Pacific. Typhoon Omais was active between 2 and 12 August 2016 (https://www.jma.go.jp/jma/jma-eng/jma-center/rsmc-hp-pub-eg/besttrack.html; storm ID: 1605, last access: 26 May 2020 and https://en.wikipedia.org/wiki/2016_Pacific_typhoon_season, last access: 26 May 2020) and impacted the sounding on 15 August (see Fig. 9). Figure 9a shows the location of the end points of back-trajectories in the BL, colour-coded by the transport time from the BL to the location of the measurement. Lesser contributions from the Tibetan Plateau (17 %) and the Foothills (3 %) are found compared to Case 1 (34 %, 8 %). Due to the dynamics of the bi-modal anticyclone, the locations of the end points in the BL are much more widely spread over Asia (e.g. Pakistan, Afghanistan, China), the western Pacific and the residual surface of the Earth (≈5 %; see Table 3) as compared to Case 1. In Case 1, the end points are more clustered, demonstrating the more frequent occurrence of individual convective events. A few trajectories ending on the Tibetan Plateau have short transport times of about 10 to 12 d; these are shorter times than found for Case 1 (Fig. 6) and are caused by convection between 2 and 5 August.
Similar as for Case 1, in Case 2 the location of the end points in the model BL (Fig. 9a) and of the strongest updraft (Fig. 9b) differ substantially. A cluster of locations with an updraft larger than 25 K 18 h−1 is found at the southern edge of the Himalayas, over Myanmar and east of the Tibetan Plateau.
In Fig. 9, the locations of the end points in the model BL of the strongest updraft for trajectories that started in the cirrus cloud, found between 376 and 381 K potential temperature on 15 August (see Fig. 2), are marked by star symbols. End points in the BL of the cirrus cloud are found in different regions, demonstrating that the air masses in the cirrus cloud have a mixture of different origins. Thus the locations of the strongest updraft for trajectories initialised within the cirrus cloud are found over the Pacific as well as over continental areas. Cirrus formation and the details of the transport pathways that lead to cirrus formation are not represented in our trajectory calculations based on ERA-Interim reanalysis.
4.3 Case 3: Typhoon influence on 18 August
On 18 August the ATAL occurs over a broader potential temperature range from 362 to 422 K compared to 6 August (364 to 388 K, Case 1); however the ATAL intensity () is lower compared to Case 1 () (Fig. 2 and Table 1). The contributions from the BL are 45 % and similar to Case 2 but much lower than for Case 1 (64 %, Table 2). For Case 3, a stratospheric contribution of 15 % is found, which is much higher than for Case 1 (0.3 %) and Case 2 (5 %) because of the considered top level of potential temperature (Case 1 up to 388 K, Case 2 up to 389 K and Case 3 up to 422 K) (see Figs. 4d, 7d and 10d). The stratospheric contributions are air masses from the northern extratropical lower stratosphere. These air masses are transported along the subtropical jet and subsequently were slowly uplifted in the anticyclonic large-scale upward spiral around the Asian monsoon anticyclone by diabatic heating. In general, the higher within the upward spiralling range at the top of the Asian monsoon anticyclone, the more contributions from the stratospheric background are found (Vogel et al., 2019).
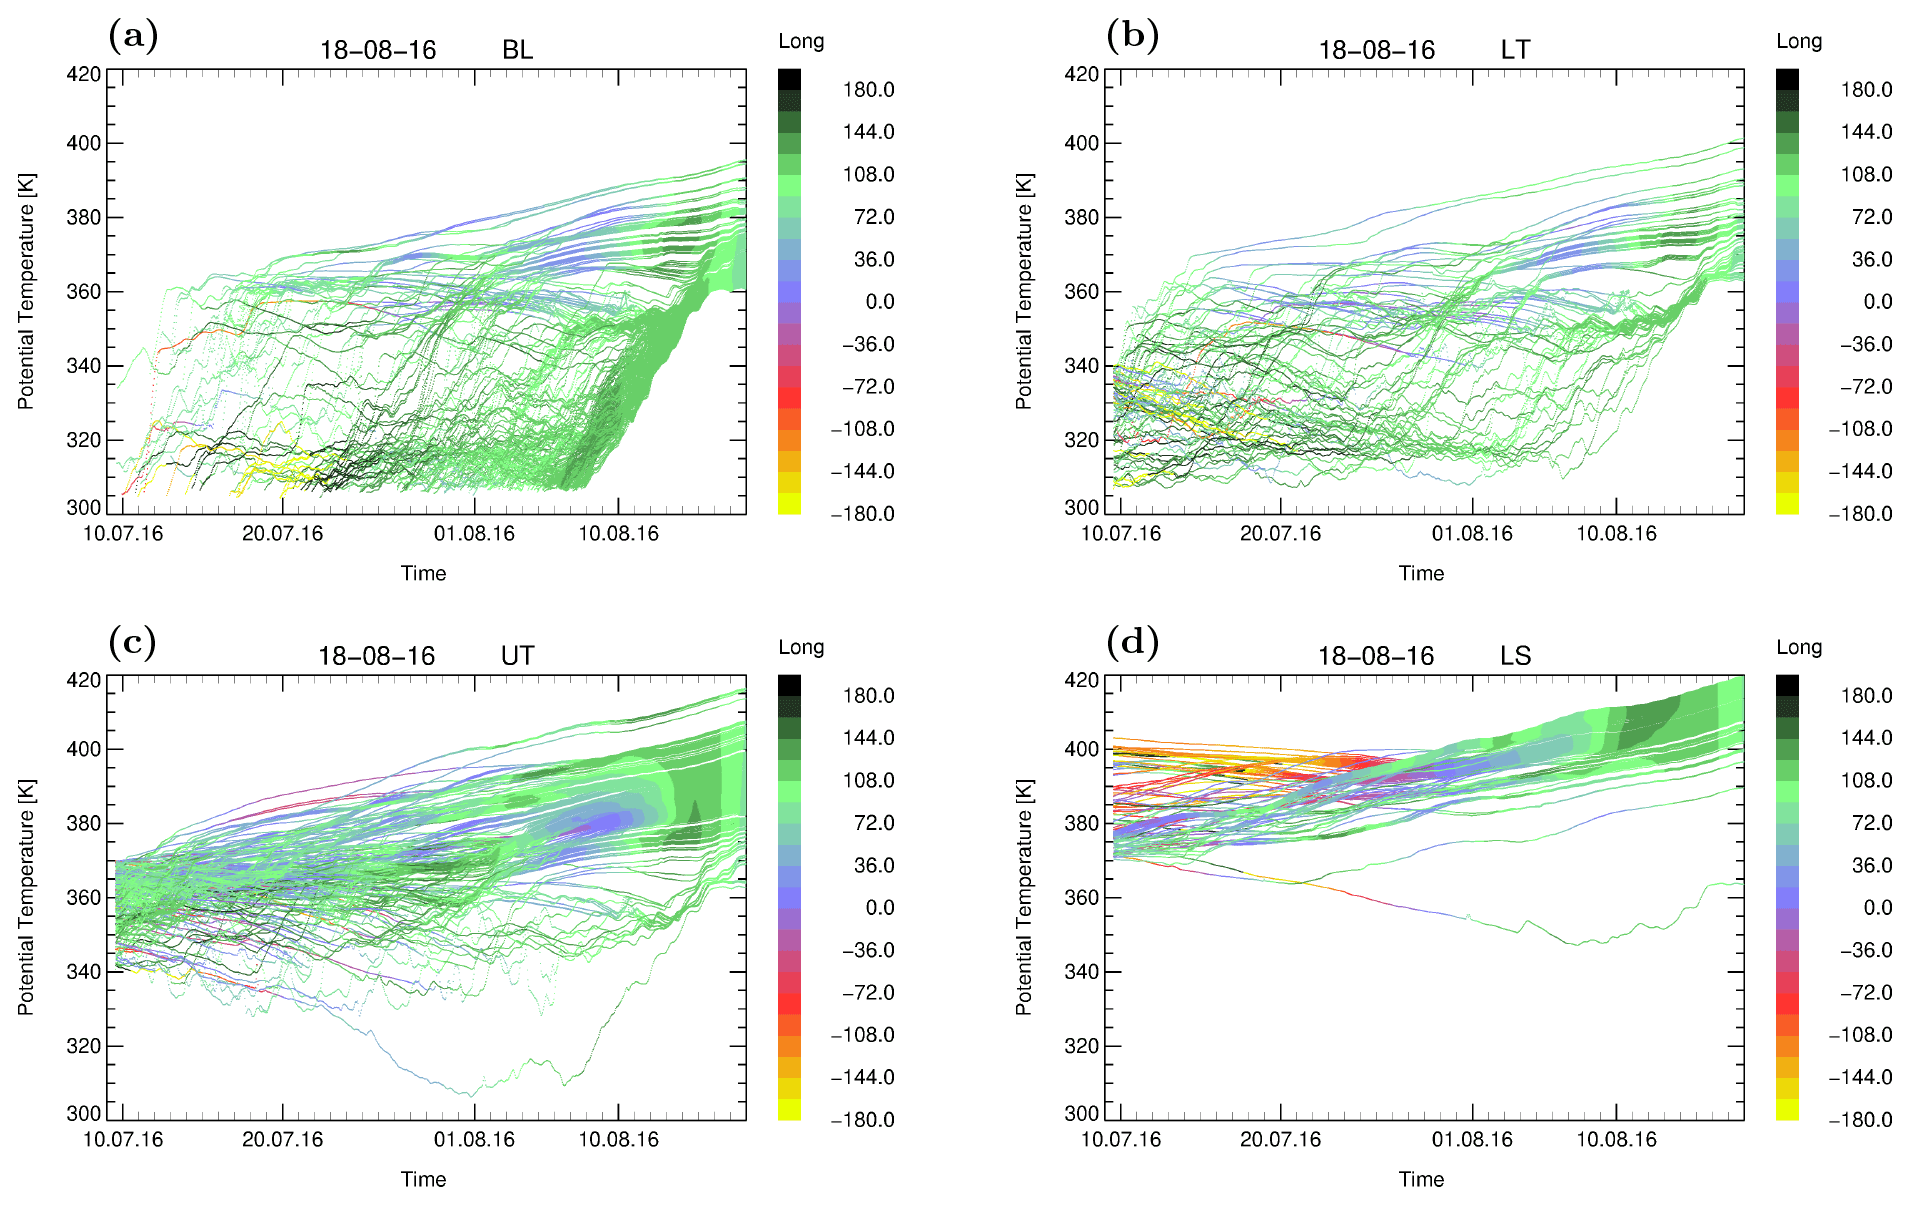
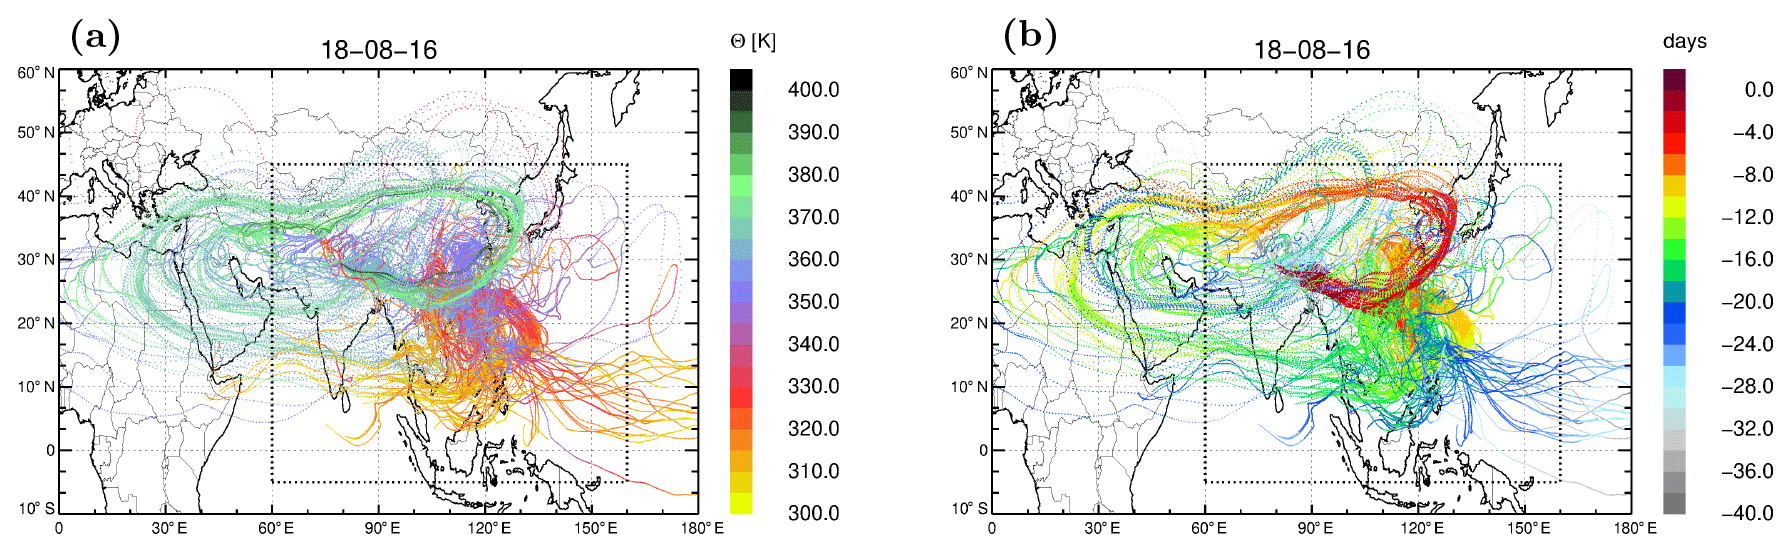

Figure 12As Figs. 6 and 9 but for the typhoon-influenced case on 18 August 2016 (Case 3). Locations of end points and locations of the strongest updraft of trajectories initialised within the cirrus cloud which was found within the ATAL are indicated by star symbols. The 40-day backward trajectories are impacted by Typhoon Nida. Its storm track is shown (black line), and the location at noontime is additionally marked (black diamonds); the numbers indicate the day in July and August 2016.
Figure 10a shows very strong convection between 6 and 15 August with a strong updraft within a few days of up to 360 K. These air masses originate from the western Pacific and the Bay of Bengal and are transported from the western Pacific directly to Nainital (Fig. 11). Another branch of BL air from the western Pacific is transported around the outer edge of the Asian monsoon anticyclone to Nainital (Fig. 11).
The location of the end points in the BL for Case 3 are shown in more detail in Fig. 12. The major fraction of the BL contribution is from Ocean (30 %) in contrast to Case 1 (4 %) and Case 2 (5 %). Also the location of ΔΘmax is found in the western Pacific, however at slightly different locations to the end points. The strong updraft over the Pacific is caused by tropical cyclone activity. Typhoon Nida was active between 29 July and 3 August over the western Pacific (https://www.jma.go.jp/jma/jma-eng/jma-center/rsmc-hp-pub-eg/besttrack.html; storm ID: 1604, last access: 26 May 2020 and https://en.wikipedia.org/wiki/2016_Pacific_typhoon_season, last access: 26 May 2020) and impacted the balloon sounding on 18 August 2016. Thus, in Case 3 polluted air masses within the ATAL measured below 400 K are diluted by air from the maritime boundary layer. At higher potential temperature levels (above 400 K) mixing with air masses from the stratosphere occurs.
In Fig. 12, the locations of the end points in the model BL of the strongest updraft for trajectories that started in the cirrus cloud, found between 370 and 373 K potential temperature on 18 August (see Fig. 2), are marked by star symbols. End points in the BL and points of strongest updraft for the cirrus cloud observations are found in different regions, similar as for the cirrus on 15 August, demonstrating that the air masses in the cirrus have a mixture of different origins as found in the ATAL itself. As mentioned in Sect. 4.2, cirrus formation as well as likely the details of transport pathways that lead to cirrus formation are not represented in our CLaMS trajectory calculations.
4.4 Results for all flights
In Sects. 4.1, 4.2 and 4.3, the fractions of the different atmospheric altitude layers (BL, LT, UT, LS) contributing to the composition of air masses within the ATAL were discussed in detail for 3 specific days, namely 6, 15 and 18 August 2016. In Fig. 13a, the fractions of the different atmospheric altitude layers for all flights in August and November 2016 are shown as a bar chart (see Tables 1 and 2) for 40-day backward trajectories. Due to the strong variability of the vertical extent of the ATAL and the variability of cirrus clouds marking the bottom of the ATAL for certain days, the number of back-trajectories calculated for a particular day varies strongly from 119 up to 704. For better comparison the fractions of the different atmospheric altitude layers are normalised by the total number of trajectories for each day (Fig. 13a). The fractions from the BL are between 14 % and 64 % and from the LS between 0 % and 33 %. Thus there is a strong variability of the fractions of the different atmospheric altitude layers contributing to the ATAL as well as for the no ATAL cases in August and post-monsoon cases in November within the pressure levels between 140 and 92 hPa. However, from the analysis of different atmospheric altitude layers, no clear relation between these altitude layers and the occurrence of ATAL was found, which may explain the difference between the ATAL and no ATAL cases as well as between ATAL and post-monsoon soundings in November.
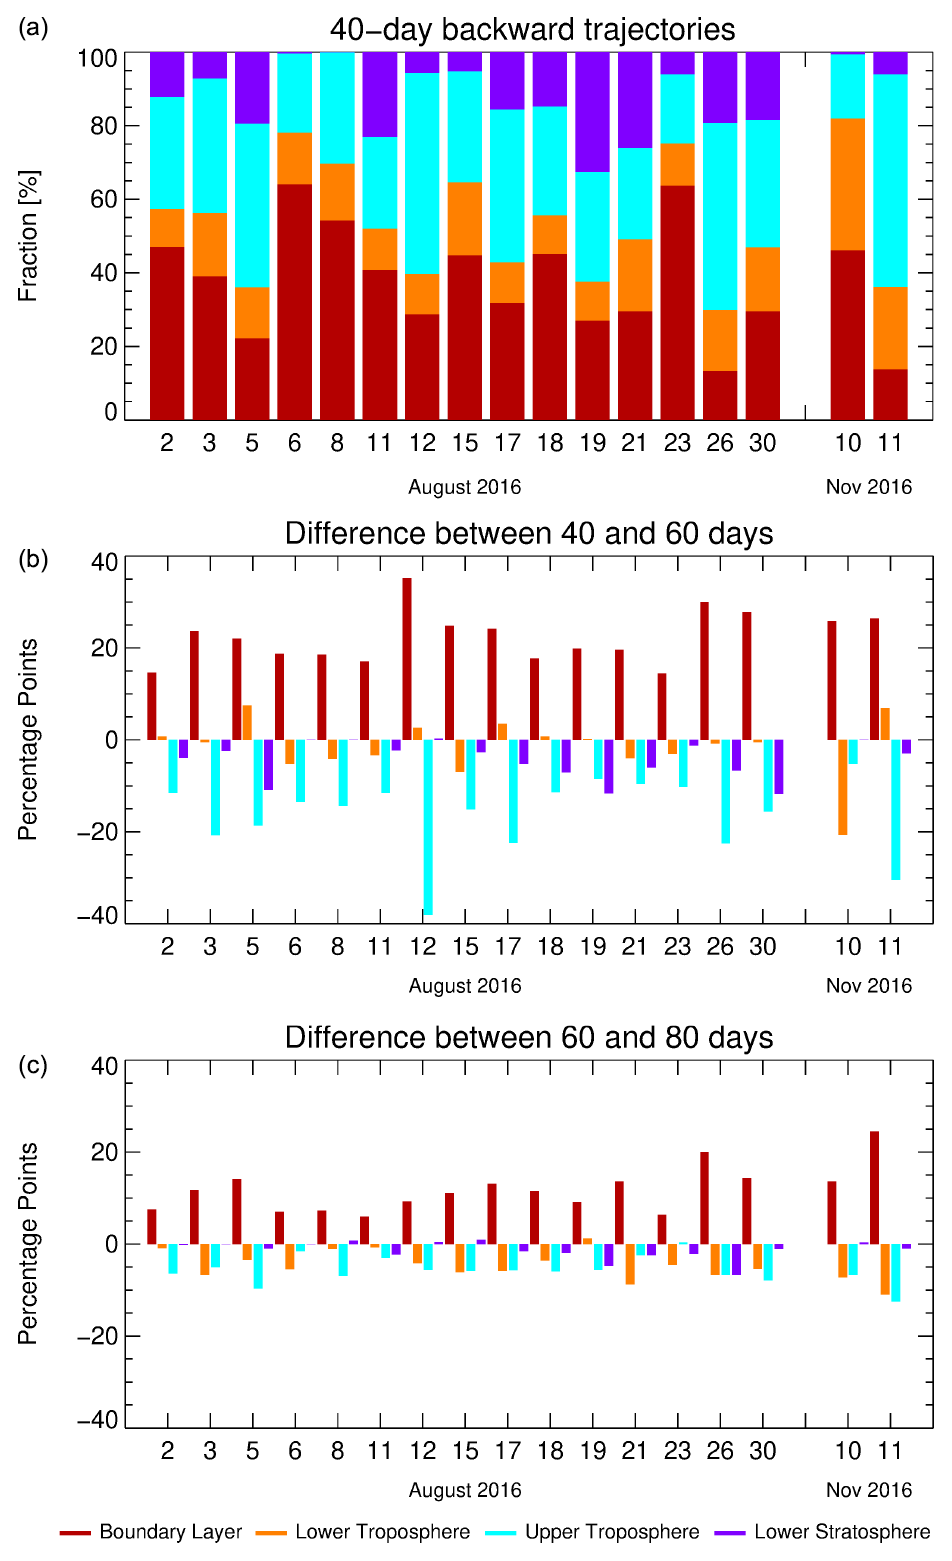
Figure 13(a) The fractions of the different atmospheric altitude layers (BL, LT, UT, LS) for all flights in August and November 2016 normalised by the total number of trajectories of each day calculated from 40-day backward trajectories (see Table 2), (b) the difference between 40- and 60-day backward trajectory calculations and (c) between 60 and 80 d.
During the monsoon season air masses from the BL accumulate within the Asian monsoon anticyclone, thus in the altitude range of the ATAL. Therefore, back-trajectory calculations with a length of 60 and 80 d were also performed to consider the sensitivity of our results to the trajectory length. In general the fractions from the BL contributing to the ATAL increase with trajectory length (i.e. with the time calculated backward). The fractions from the BL range between 14 % and 64 % for 40 d (Fig. 13a), from 40 % to 83 % for 60 d and from 56 % to 90 % for 80 d. There is an increase in the fractions from the BL between 14 and 36 percentage points between 40 and 60 d (Fig. 13b) and between 6 and 25 percentage points between 60 and 80 d (Fig. 13b). Simultaneously the fractions from the UT decrease with time. They range between 17 % and 58 % for 40 d, from 8 % to 28 % for 60 d and from 6 % to 21 % for 80 d (see Fig. 13). A decrease is found of the fractions from the UT between 5 and 38 percentage points between 40 and 60 d (Fig. 13b) and between 0 and 12 percentage points between 60 and 80 d (Fig. 13c). The fractions from the LT do not change significantly with increasing trajectory length. They vary between −7 and 8 percentage points between 40 and 60 d (except for 10 November 2016; here the difference is −21 percentage points) and between −11 and 1 percentage points between 60 and 80 d. The fractions from the LS decrease by up to −11 percentage points between 40 and 60 d and up to −7 points between 60 and 80 d.
To deduce a possible relation between the ATAL intensity and the air mass origin within the boundary layer, Fig. 14a shows a bar chart with the contributions of Tibet, Foothills, Land, Ocean and Residual, whereby the individual measurements are sorted by increasing mean backscatter ratio (() ×100) (see Tables 1 and 3). The contributions are normalised by the total number of trajectories within the boundary layer for each day for better comparison. The balloon flight on 12 August is excluded because a cirrus cloud was detected between 140 and 92 hPa, and therefore no aerosol backscatter ratio could be measured in this pressure range. Because of the low statistics we exclude all flights (11, 21, 23 and 26 August) in Fig. 14a for which the trajectory number is lower than 50 % of the maximum number of trajectories (704) calculated on 18 August 2016 (however these cases are included in Fig. 15).
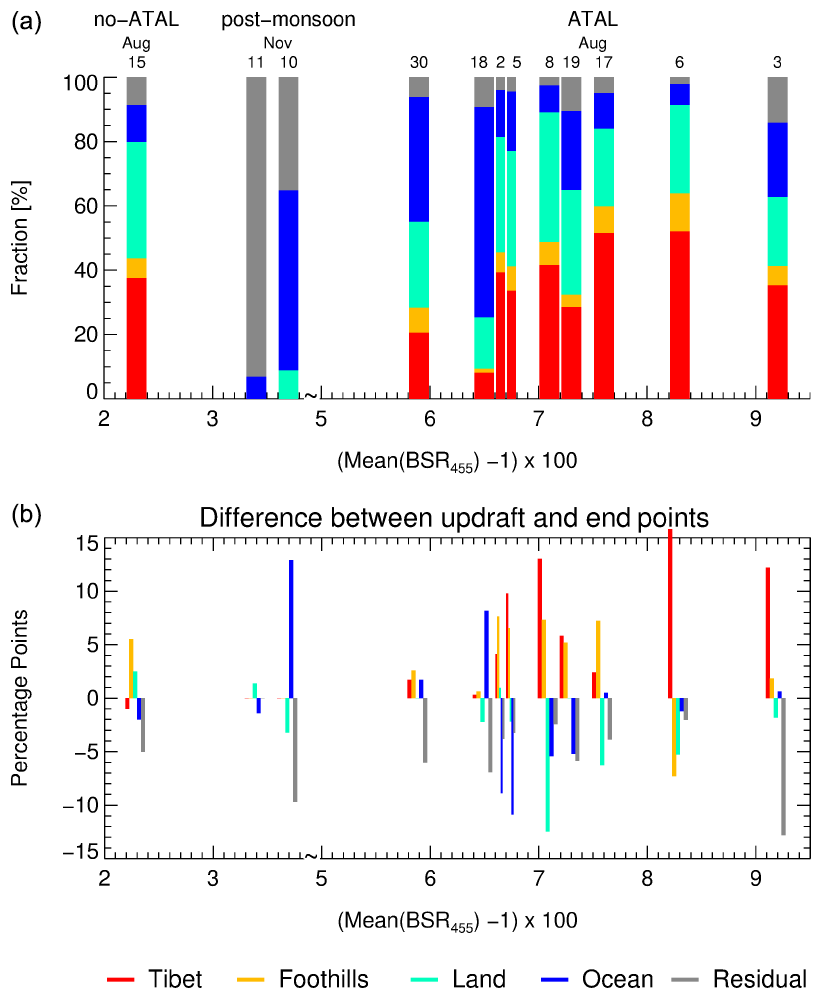
Figure 14Contributions of Tibet, Foothills, Land, Ocean and Residual to the boundary layer (BL) sorted by increasing backscatter ratio (() ×100) (see Tables 1 and 3) for 40-day backward trajectories (a). The contributions are normalised by the total number of trajectories within the boundary layer for each day. The days of the soundings in August and November are indicated above the top of the bars. For better representation, the range between 4.0 and 5.0 is removed from the x axis. The flights (11, 21, 23 and 26 August) for which the trajectory number is lower than 50 % of the maximum number of trajectories (704) calculated on 18 August 2016 are not shown as well as the 12 August, when the UTLS is filled by a 5 km thick cirrus cloud. The difference between the location of the end points and the location of strongest updraft (b) for 40-day backward calculations is also shown.
There is a lot of variability of the air mass origin within the boundary layer, contributing to ATAL cases characterised by a backscatter ratio larger than 1.058 (Fig. 14a, top). Strong ATAL cases with values larger than 1.067 show fractions of air mass origin in the boundary layer from continental outflow (Tibet, Foothills and Land) higher than 70 % and in particular higher than 30 % from Tibet (Fig. 14a, top). For weak ATAL cases (18 and 30 August), the values are lower (1.059–1.065), and the fraction from continental outflow is below 70 %. For these cases high fractions from maritime boundary layer sources (Ocean >12 %–30 %) are found, which are caused by the impact of tropical cyclones on the composition of the ATAL as discussed in Sect. 4.3.
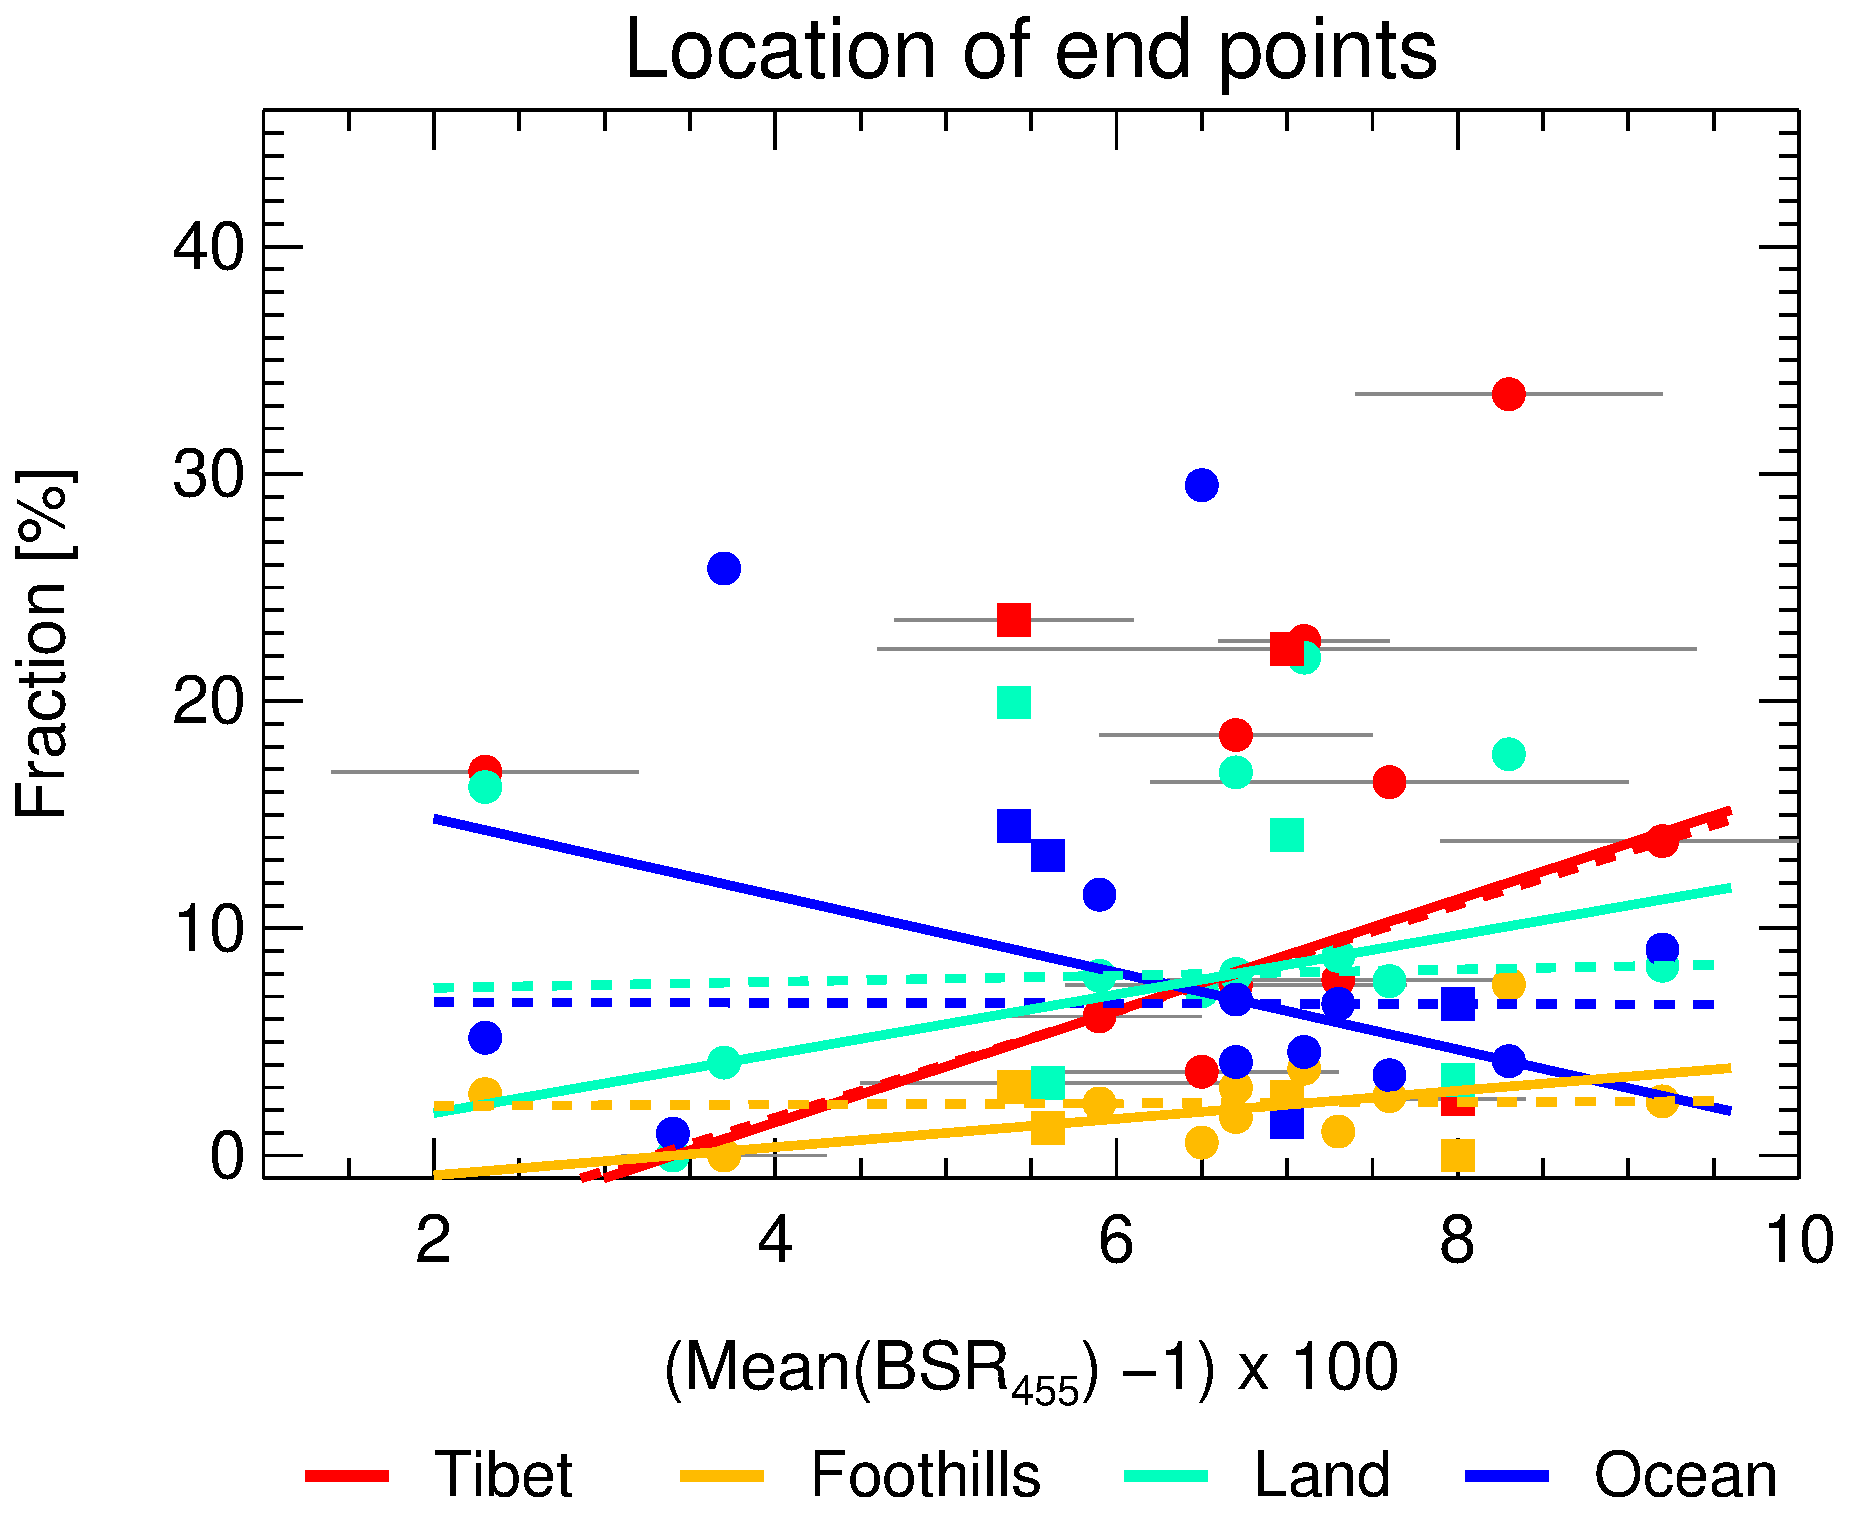
Figure 15Fractions of Tibet, Foothills, Land and Ocean versus (-1) ×100 (see Table 1) for the location of the end points of the trajectories (see Table 3). is the backscatter intensity averaged over the ATAL altitude range listed in Table 1 for each flight (for details, see Sect. 3.1). The standard deviation (σ) of the backscatter ratio is indicated for each sounding (grey lines). The flights (11, 21, 23 and 26 August) for which the trajectory number is lower than 50 % of the maximum number of trajectories (704) calculated on 18 August 2016 are also shown (indicated by squares instead of circles). For each region a linear fit (using the least absolute deviation method) was calculated using all measurements except the one on 12 August (Table 1), when the UTLS is filled by a 5 km thick cirrus cloud (dashed lines). Further, a linear fit excluding in addition the flights on 11, 21, 23 and 26 August as well as the no ATAL flight (15 August) is shown (lines). An increase in the fractions from Tibet, Foothills and Land is found for increasing ATAL intensity, while the contributions from Ocean decrease for the locations of end points.
For both post-monsoon cases in November 2016 low values of 1.034 and 1.037 are measured; these measurements are used as background signal for aerosols in the UTLS during August 2016 (Fig. 1 shows that no ATAL has been observed during winter). For these cases the air mass origin is very different compared to the ATAL cases. In 40-day back-trajectory calculations, no contributions from Tibet and Foothills are found for both flights; only a contribution from Land of 4 % is found for the balloon flight on 11 November 2016. The origins of air masses in the boundary layer are found in Ocean and in the residual surface (here mainly from south of 5∘ S). It is known that during boreal winter, efficient transport into the stratosphere is found over the western Pacific and maritime continent, caused by strong convection and, in addition, by the ascending branch of the Walker circulation located over the maritime continent (e.g. Bergman et al., 2012; Hosking et al., 2012).
Case 2, the no ATAL case from 15 August 2016, has a value of 1.023 lower than both November cases; however an air mass origin in the boundary layer is found of around 80 % from continental sources (Tibet, Foothills and Land). This BL fraction is similar to fractions from the BL as for the ATAL cases. Case 2 is discussed in detail in Sect. 4.2, and it was shown that on 15 August a bi-modal structure of the anticyclone is found, and Nainital is located between the eastern and western part of the anticyclone (Fig. 3). This bi-modal structure is found between 11 and 16 August (not shown here). Thus also the no ATAL case on 12 August and the balloon flight on 11 August are impacted by this dynamical situation in the UTLS. Therefore, the dynamics in the UTLS seems to be the reason that on 15 August 2016 no ATAL was measured over Nainital, although a similar air mass origin was found on 15 August as for the ATAL cases. Unfortunately, during August 2016 we only have one no ATAL measurement which is not completely masked by a cirrus cloud; therefore we can not deduce a more general result regarding no ATAL measurements during the peak monsoon season in India in our study. During August 2016, a second period with a bi-modal structure of the anticyclone is found between 27 and 28 August, but here Nainital is located more in the centre of the eastern mode (not shown here). However, we can not exclude that also aerosol removal processes depending on temperature and Sice such as in situ cirrus formation contribute to the existence of the no ATAL measurement on 15 August 2016 (for details, see Sect. 5).
Figures 6, 9 and 12 show that on 6, 15 and 18 August the strongest updraft locations differ from the endpoint locations of the trajectories. A cluster of strongest updraft locations is found at the southern edge of the Himalayan foothills. Table 4 shows the fractions of Tibet, Foothills, Land, Ocean and Residual of the strongest updraft locations within 18 h for all flights. Our definition of the Foothills at the southern edge of the Himalaya by the orography results in this region being only a small belt. Thus not all trajectories with their strongest updraft at the southern edge of the Himalayan foothills are captured by our definition of the Foothills, and therefore these trajectories are also counted as fractions of Land or Tibet. Figure 14b shows the difference between the location of the end points and the location of strongest updraft for 40-day backward calculations. For all ATAL soundings the fractions from Foothills (except on 6 August) and Tibet for the location of strongest updraft are greater than for the location of the end points, indicating strong convective activity at the southern edge of the Himalayan foothills during early August 2016. On 3, 6 and 8 August, the fractions from Tibet are more than 10 percentage points larger for the location of strongest updraft than for the location of the end points.
Figure 15 shows the fractions of Tibet, Foothills, Land and Ocean versus () ×100 (see Table 1) for the location of the end points of the trajectories (see Table 3). The fractions are not normalised to the number of trajectories within the BL as was done in Fig. 14. Therefore, in Fig. 15 the contribution from the other atmospheric layers (LT, UT and LS) to the ATAL is also taken into account. Further, the flights with a relatively low absolute number of trajectories (11, 21, 23 and 26 August) are also considered. There is a lot of variability between individual soundings. However, in general an increase in the fractions from Tibet, Foothills and Land is found for increasing ATAL intensity, while the contributions from the Ocean are decreasing for the location of end points.
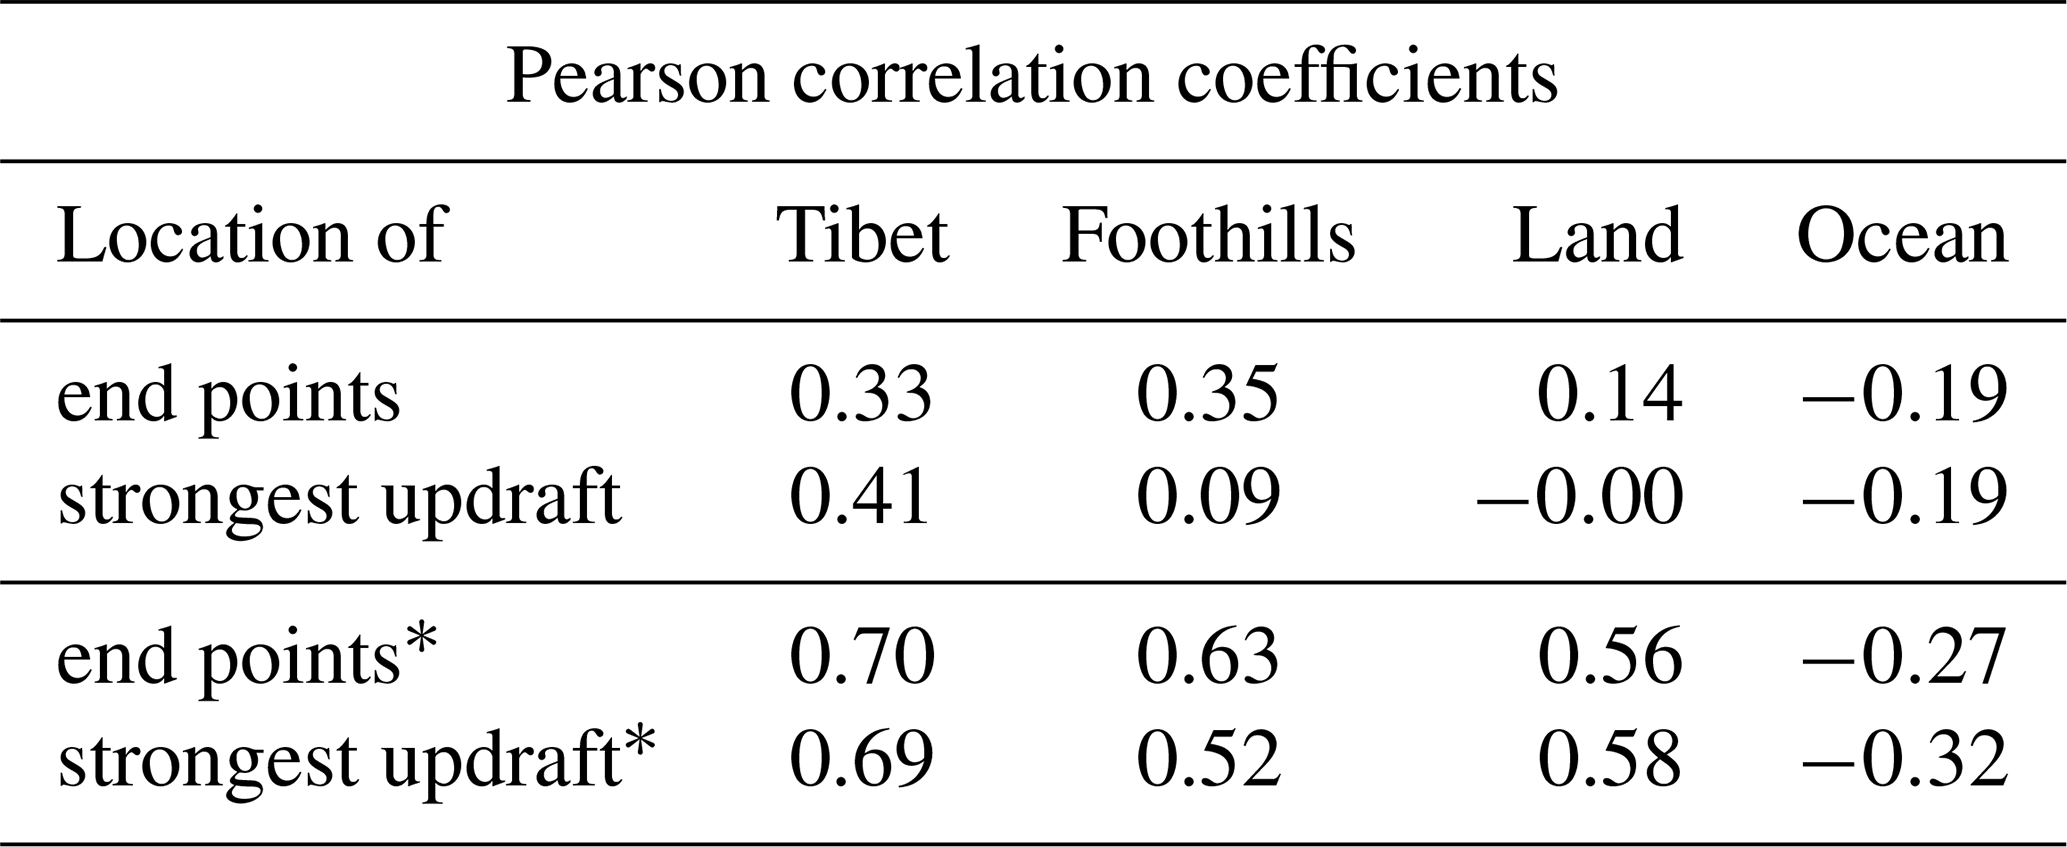
Further, the Pearson correlation coefficients between the different regions (Tibet, Foothills, Land and Ocean) and the backscatter intensity averaged over the ATAL altitude range ((-1) ×100) for the location of the end points of the trajectories as well as for the location of the strongest updraft along the trajectories are calculated (see Table 5). Low positive correlations (i.e. values from 0.3 to 0.5) are found for the location of the end points of Tibet and Foothills as well as for the location of the strongest updraft of Tibet.
Moreover, the Pearson correlation coefficients are calculated, also excluding the flights with a relatively low absolute number of trajectories (11, 21, 23 and 26 August) and the no ATAL case on 15 August. The no ATAL case is excluded because the low backscatter intensity is not completely explained through the backward trajectory analysis presented here. Moderate positive correlations (i.e. values from 0.5 to 0.7) are found for Tibet, Foothills and Land, with the largest correlation coefficient of 0.7 for the location of endpoints in Tibet. Low negative correlations (i.e. values from −0.3 to −0.5) are found for contributions from the Ocean. Overall, our findings show that the stronger the backscatter intensity averaged over the ATAL altitude range, the higher the continental contributions from Tibet, Foothills and Land. The weaker the ATAL is during August 2016, the higher the maritime contributions (Ocean) are.
Table 5Pearson correlation coefficients between the different regions (Tibet, Foothills, Land and Ocean) and the backscatter intensity averaged over the ATAL altitude range (() ×100) for the location of the end points of the trajectories (see Fig. 15) and for the location of the strongest updraft. For each region the Pearson correlation coefficient was calculated using all measurements except the one on 12 August, when the UTLS is filled by a 5 km thick cirrus cloud. Further, the Pearson correlation coefficients are also calculated, excluding in addition low statistics flights (11, 21, 23 and 26 August) for which the trajectory number is lower than 50 % of the maximum number of trajectories (704) calculated on 18 August 2016 (see Fig. 14) as well as the no ATAL case on 15 August (marked by *).
COBALD measurements using the CI, the 940-to-455 nm ratio of the aerosol component of the BSR, can be used to discriminate aerosol and cirrus measurements (see Sect. 2.1). However, in the case of a cirrus cloud, the dominant ice particle backscatter does not allow the COBALD sonde to detect whether aerosol particles coexist with ice particles or not. Krämer et al. (2016) describe two types of cirrus: (1) in situ origin cirrus observed at the altitudes at which they are formed on soluble solution aerosol particles or on solid ice nucleating particles; and (2) liquid origin cirrus, which are glaciated liquid clouds lifted from below to the cirrus temperature region. The formation mechanism of the cirrus cloud will have implications for the aerosol concentration in the cirrus layers within the ATAL.
For our back-trajectory calculations, thin cirrus clouds within the ATAL are included to infer the origin of air masses contributing to the ATAL. If we assume that these cirrus clouds are of cirrus type (2), the aerosol concentration within the ATAL would not be affected by the formation process of the cirrus particles; however the uplift (convection) of air masses from the lower troposphere could transport enhanced concentrations of aerosol particles from close to the ground to ATAL altitudes without much influence of aerosol in the middle troposphere (see Fig. 2). This concept is consistent with the results of Vernier et al. (2018), who found in OPC balloon-borne measurements of the ATAL from Hyderabad, India, in summer 2015 that aerosol concentrations in the boundary layer and in the ATAL are of the same magnitude, while much lower aerosol concentrations prevail in the middle troposphere. In their balloon measurements Vernier et al. (2018) further found that the presence of cirrus is associated with a reduction or a minimum in aerosol concentration, possibly caused by aerosol removal processes through the formation of cirrus particles of type (1). Therefore, for both cirrus types, it is important to include the back-trajectory calculations of thin cirrus clouds found within the ATAL to identify the air mass origin. Further, depending on the lifetime of the cirrus clouds within the ATAL, the occurrence of cirrus particles (e.g. through sedimentation or uptake on the ice surface) could have implications on the ATAL, even when the cirrus particles are no longer present.
We would like to emphasise that the calculation of (see Table 1) is based on binned data (with an altitude resolution of ∼25 m in the UTLS). Thin cirrus clouds found within the ATAL are excluded for the calculation of the mean value of because here the BSR455 value for cirrus is much higher than for aerosol (Sect. 3.1). However, the calculation of the fraction of air masses uses the high-resolution measurement data (with a resolution of 1 s) for back-trajectories, including the altitude ranges in which thin cirrus clouds within the ATAL were detected. In the altitude range of thin cirrus clouds, the aerosol concentration could be enhanced by convection or reduced by aerosol removal processes such as in situ cirrus formation. In both cases it is important to include the air masses in the altitude range in which thin cirrus clouds were detected to identify the origin of air masses contributing to the ATAL. However, cirrus clouds detected directly below the ATAL are excluded in our trajectory analysis; even if aerosol and cirrus coexisted here, the bottom of the ATAL is highly uncertain. Therefore, in our analysis there is an uncertainty in the vertical altitude range of the ATAL. To solve this uncertainty, balloon-borne measurements in addition to COBALD are required, such as the measurements of the particle size distribution (e.g. using a Printed Optical Particle Spectrometer, POPS; Gao et al., 2016).
We presented a series of balloon-borne measurements performed by the COBALD instrument conducted in Nainital, northern India, during August and November 2016. The BSR455 measurements show a strong day-to-day variability of the altitude, the vertical extent and the backscatter intensity of the ATAL at UTLS altitudes over Nainital in August 2016. In contrast to high-resolution in situ measurements, space-borne observations often do not allow the day-to-day variability of ATAL profiles to be studied; therefore mean values of the ATAL profiles were frequently used in previous studies based on satellite observations (e.g. Vernier et al., 2011, 2015). Further, there are frequent observations of cirrus layers embedded in the ATAL; depending on the duration and formation mechanism of the cirrus layers, there will be an impact of cirrus on the properties of the aerosol particles constituting the ATAL. In general the BSR455 values measured in August are higher than values measured during post-monsoon in November, which represent the aerosol background during winter. However, there is one observation on 15 August showing no ATAL (here the BSR455 is lower than in November). Lagrangian back-trajectory calculations were performed using the CLaMS model driven by ERA-Interim reanalysis to identify the air mass origin in the model boundary layer and the transport pathways of air parcels contributing to the ATAL over Nainital in August 2016. In this work, we show that there is a variety of factors impacting the variability of the ATAL: continental convection, tropical cyclones (maritime convection), dynamics of the anticyclone and stratospheric intrusions. All these factors contribute to the observed day-to-day variability of the ATAL found over Nainital in August 2016. Clearly the details of the vertical transport would differ if a higher resolution, more recent reanalysis data set were used; however the general transport patterns would likely remain unaltered. For example, the convective upward transport by tropical cyclones is found consistently for ERA-Interim and ERA5 in diabatic calculations (Li et al., 2020). Further, the ATAL is also impacted by other processes related to the formation and growth of aerosol as well as by aerosol removal processes such as in situ cirrus formation.
We found that air masses contributing to the ATAL are a mixture of air masses from different origins and not exclusively from the BL. The trajectories originating from the BL are separated according to geopotential height and, further, for low geopotential heights, between continental and maritime sources. Strong ATAL cases have high contributions from the Tibetan Plateau (Tibet), the remaining continental area (Land) and the foothills of the Himalayas (Foothills). Weaker ATAL cases have higher contributions from the maritime area (Ocean) caused by the impact of tropical cyclones. Here, mixing with unpolluted air masses from the maritime boundary layer yields a dilution of the ATAL. The no ATAL case of 15 August 2016 has similar contributions from the Tibetan Plateau (Tibet), the remaining continental (Land) area and the foothills of the Himalayas (Foothills) to the strong ATAL cases; however on this day there is a bi-modal structure of the anticyclone, and Nainital is located between the western and eastern mode of the Asian monsoon anticyclone. We hypothesise that the main driver for no ATAL cases during the monsoon season is the dynamics of the Asian monsoon anticyclone. However, we only have one no ATAL measurement in August 2016 (partly influenced by cirrus); therefore we can not exclude that aerosol removal processes such as in situ cirrus formation also contribute to the existence of no ATAL measurements. More balloon-borne measurements are required to validate this hypothesis. Moreover, we calculated the locations of strongest updraft along the backward trajectories within a time period of 18 h and found a cluster of such locations at the southern edge of the Himalayan foothills over northern India, Nepal and Bhutan. Further, for balloon-measurements impacted by tropical cyclones, locations of the strongest updraft are also found over the western Pacific Ocean. Within the ATAL, a mixture of air parcels with different transport times is found. The transport times from the Earth's surface to ATAL altitudes vary strongly. The shortest transport times found for 6, 15, and 18 August are between 10 and 15 d. These trajectories originate either on the Tibetan Plateau or at the location of tropical cyclones in the western Pacific. Shorter transport times below 10 d are only found for 12 August (when the UTLS is filled by a 5 km thick cirrus cloud) and 17 August for air masses originating on the Tibetan Plateau.
Finally, CLaMS backward trajectory calculations allow the transport pathways from the Earth's surface to ATAL altitudes to be identified. Very fast uplift in a convective range transports air masses up to the top of the convective outflow level (∼360 K) within a few days. Subsequently, the air parcels are slowly uplifted by diabatic heating within a large-scale upward spiral driven by the anticyclonic flow in the UTLS over the Asian monsoon region from about 360 K up to ATAL altitudes. Over Nainital in summer 2016, a maximum ATAL altitude of 422 K (75 hPa) was measured. This slow uplift caused by diabatic heating in a large-scale upward spiral is consistent with concepts referred to as an upward spiralling range (Vogel et al., 2016) or a layer of a confined air mass in the lower stratosphere (Brunamonti et al., 2018).
Our study contributes to the deduction of the source regions of emissions of precursors of ATAL particles at the Earth’s surface and their transport pathways to the UTLS, which is important to develop recommendations for regulations of anthropogenic surface emissions of ATAL precursors. In a recent study, Fadnavis et al. (2019b) argue that further increasing industrial emissions in Asia will lead to a wider and thicker ATAL, with the potential to amplify the severity of droughts in India. Severe droughts would have fatal consequences for agriculture on the Indian subcontinent and therefore would result in strong socio-economic impacts in one of the most densely populated parts of the world. On the other hand, the ATAL impacts the radiative balance of the Earth's atmosphere and could have positive side effects in terms of reducing Earth's surface temperatures (Fadnavis et al., 2019b); therefore more future research about the ATAL and its impacts is required.
A1 Colour index (CI)
During the balloon ascents from Nainital in August and November 2016 measurements were performed of backscatter at wavelengths of 455 nm (blue visible) and 940 nm (infrared) (Wienhold, 2008; Brabec et al., 2012) and of water vapour mixing ratio using a cryogenic frost-point hygrometer (Vömel et al., 2007, 2016) (see Sect. 2.1 in the main paper). These measurements allow the definition of a colour index (CI) (Cirisan et al., 2014) and the calculation of the ice saturation (Sice) during the balloon ascent. These quantities are considered in the analysis presented here to discriminate aerosol and cirrus clouds (ice particles) in the backscatter measurements and are shown in Fig. A1.
A2 Using the shortwave and longwave channel to detect the ATAL
The aerosol measurements analysed here are based on balloon-borne backscatter measurements employing the COBALD detector, which operates at optical wavelengths of 455 nm (blue visible) and 940 nm (infrared) (Brabec et al., 2012). Commonly, the colour index (CI) is defined as the 940-to-455 nm ratio of the aerosol component of the BSR (Cirisan et al., 2014; Brunamonti et al., 2018, see also main paper) and provides some estimate of particle size. The BSR for both wavelengths will give an indication of the presence of the ATAL. The same is true for cirrus particles; i.e. they can be detected by both the blue and the red channel, individually. But only by using the CI is a clear discrimination of ice (CI >7) and aerosol (CI <7) possible (see main paper), which is the advantage of measuring at two wavelengths.
Here and in previous works (Vernier et al., 2015, 2018; Brunamonti et al., 2018), the ATAL analysis is based on the COBALD 455 nm BSR measurements. Indeed, the 455 nm BSR measurement is the preferred channel for the detection of the ATAL. The main reason is that the 455 nm COBALD BSR measurement has a better precision and has a higher signal-to-noise ratio (although BSR is lower at 455 nm than 940 nm, the raw signal is higher at 455 nm). Further, the accuracy is better for 455 nm, as the scale parameter in the data processing is taken directly from the sonde profile. The 940 nm channel builds on that, and the BSR values are restricted by the assumption that the CI has to remain in a certain range.
In Fig. A2 we show the measured BSR455 (blue line) and BSR940 (red line) profiles from the COBALD measurements in Nainital in 2016 for 2 different days in August (with no interference from cirrus layers or spike artefacts). The discussed features are clearly visible; although the ATAL can be detected using both the BSR455 and BSR940 measurements, the 455 nm channel is less noisy, so it constitutes the preferred channel for the detection of the ATAL in COBALD balloon measurements.
A3 Removal of “moon spikes”
The processing of COBALD includes the rejection of moon spikes that may arise during the night flights because of the oscillatory motion of the payload 60 m below the balloon, when the detector happens to be pointing towards the moon. Moon spikes affect only a tiny fraction of the COBALD data, and care is taken not to confuse them with thin cirrus clouds. To identify these anomalous “spikes”, we used a simple criterion; we consider the signal to be an anomalous spike when BSR455 nm >1.12 and CI <7. These spikes are then removed from the data set, where the condition CI <7 ensures that cirrus clouds will be retained. Finally, some specific cases with spikes in the BSR455 measurements of a very small vertical extent still remained in the binned data, where BSR455 <1.12 and 7< CI <10. These specific cases occurred for 3, 15, 21, 23 and 30 August; the corresponding data points were also removed from the data set used here.
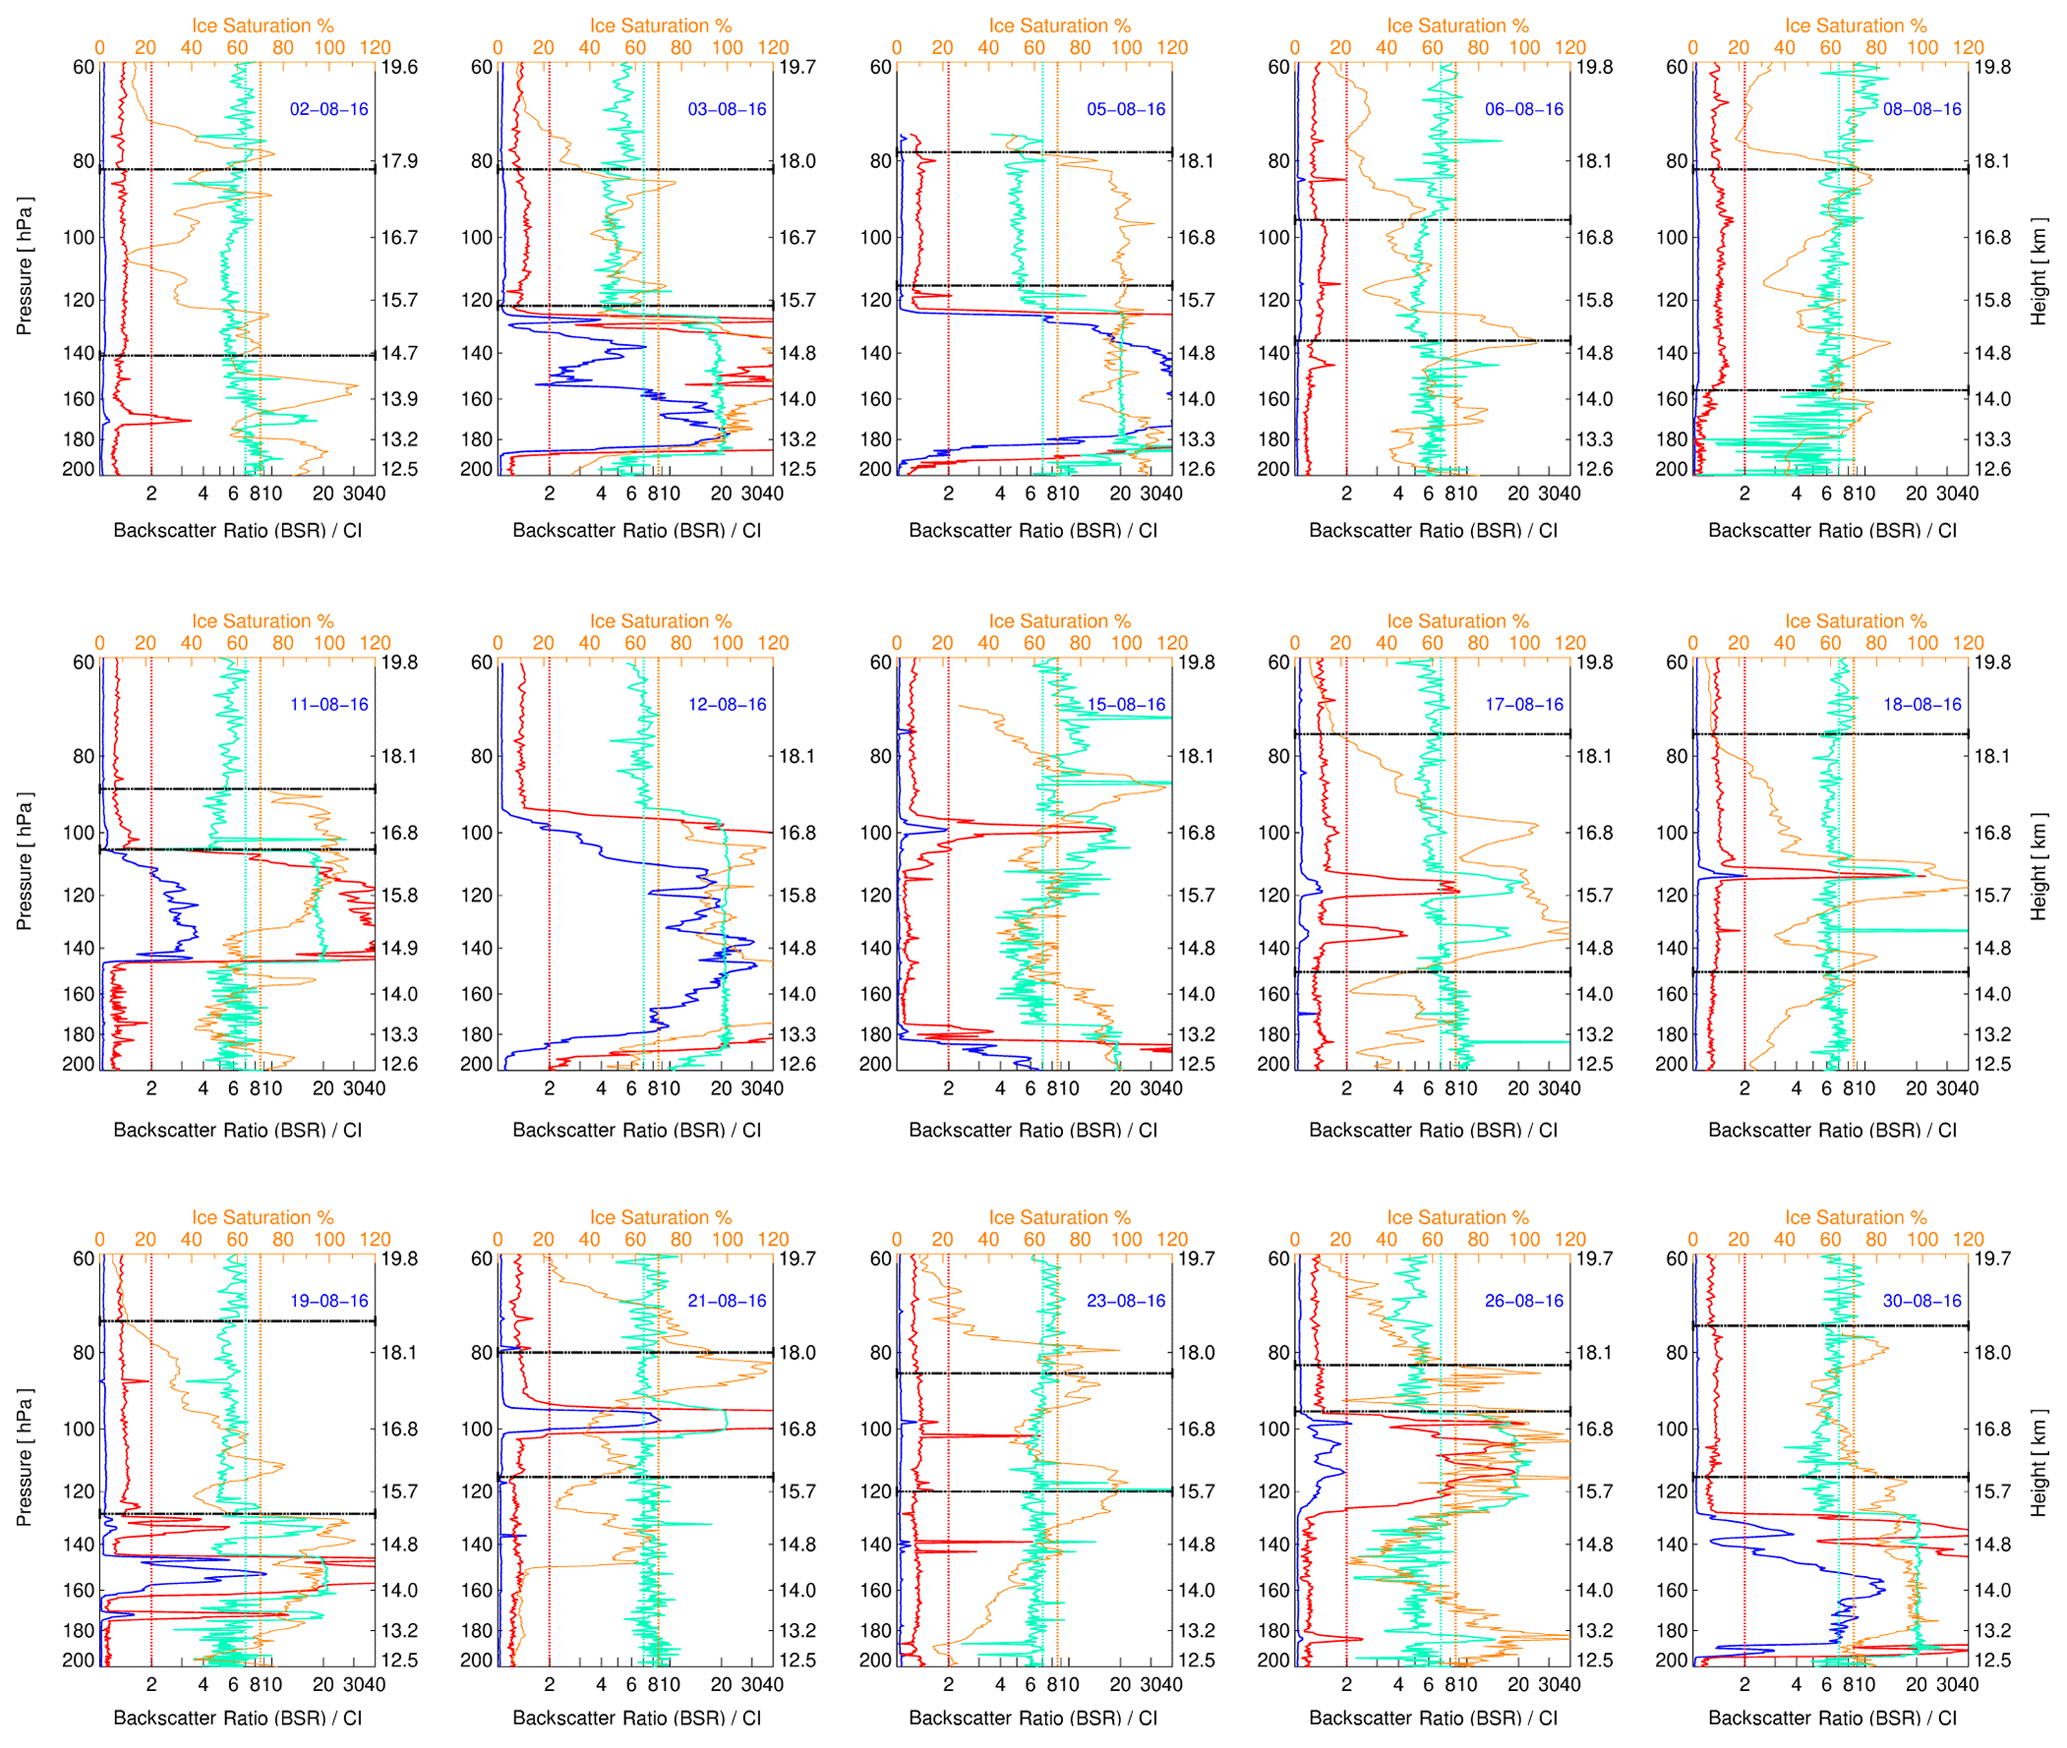
Figure A1COBALD BSR455 (blue) and BSR940 (red) soundings in the UTLS region versus pressure (60–200 hPa) for each flight in August 2016. In addition, the colour index (CI ; green) and the ice saturation (Sice, orange) are shown. Corresponding height calculated using both measured pressure and temperature is also given for orientation (see right-hand y axis). In our analysis, layers with CI >7.0 (CI =7; dotted green line), BSR940 ≥2 (BSR940=2; dotted red line) and Sice>70 % (Sice=0.7; dotted orange line) were rejected as cirrus clouds. The top and bottom boundaries of the ATAL (see Table 1) are marked by horizontal dashed black lines, except for 12 and 15 August, as no ATAL was detected on these days (as in Fig. 2).
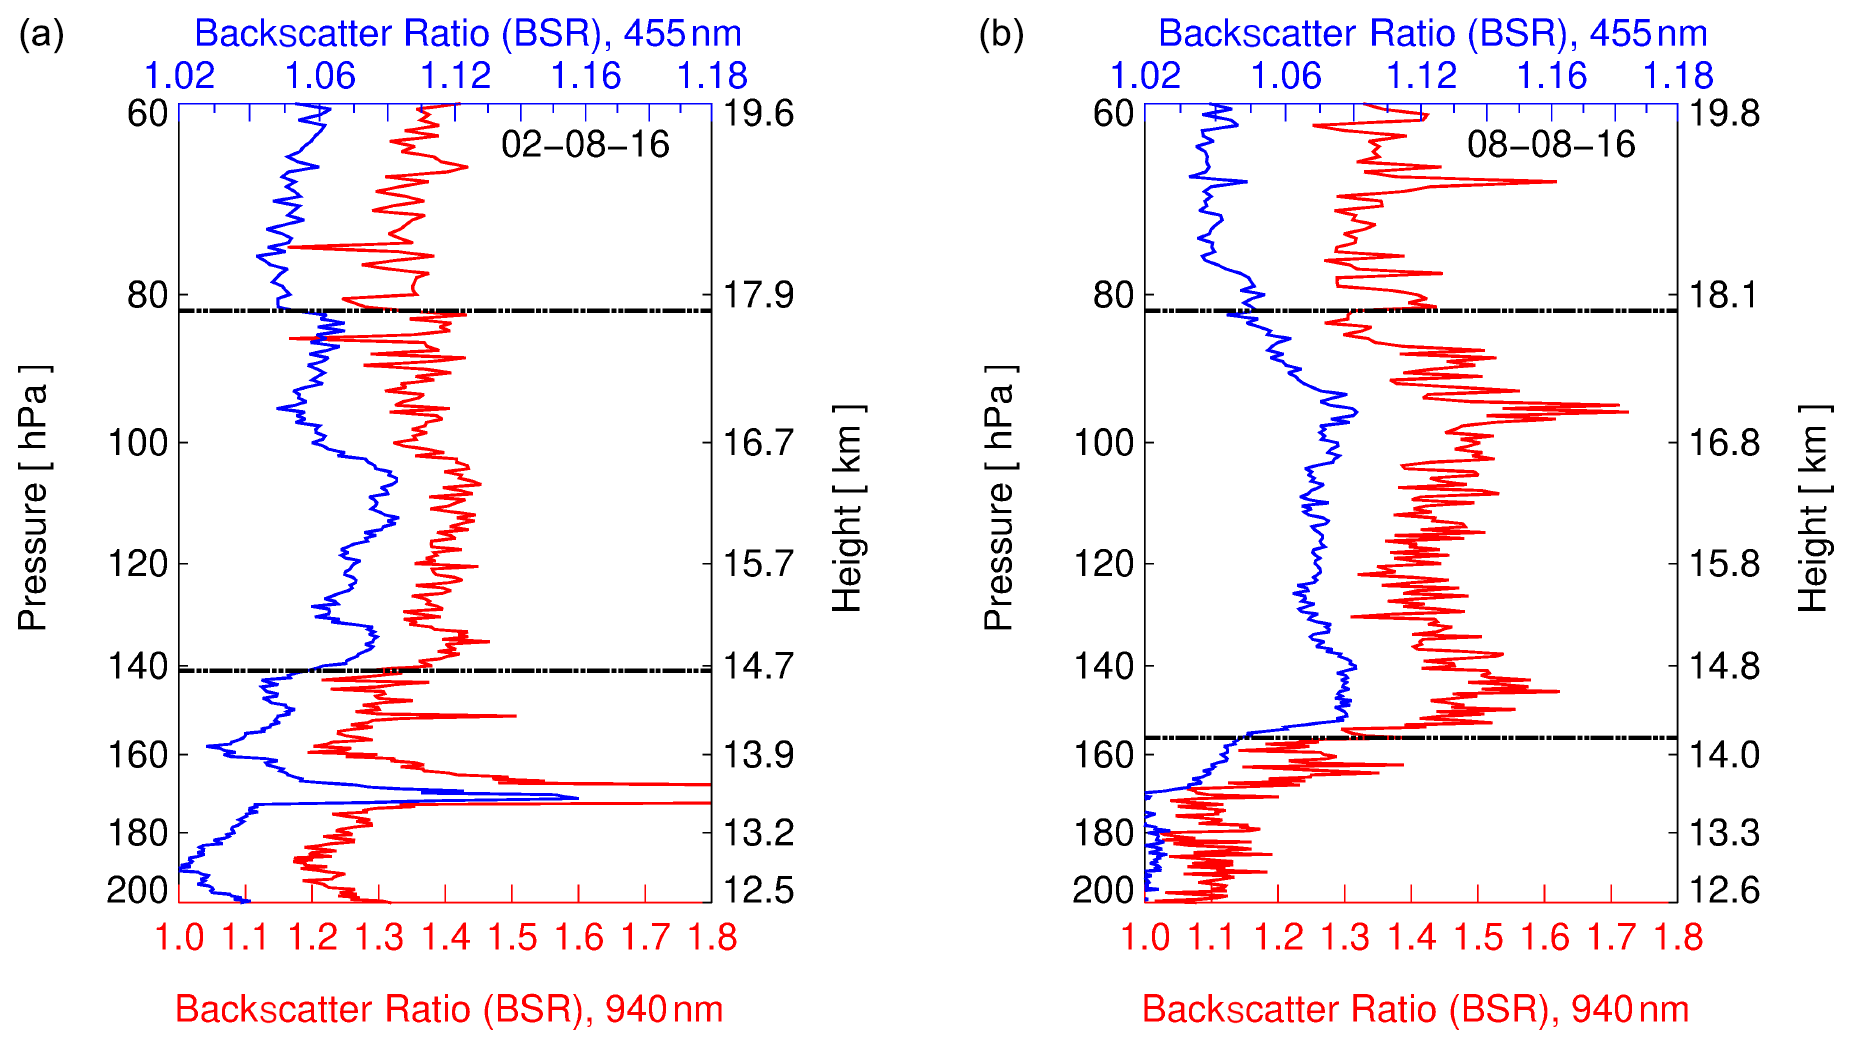
Figure A2COBALD BSR455 (blue) and BSR940 (red) measurements in the UTLS region versus pressure (60–200 hPa) for two flights in August 2016, (a) 2 August and (b) 8 August. The right-hand axis in both panels shows log-pressure height. Shown are the measured data in pressure bins without further processing (see main paper). The top and bottom boundaries of the ATAL (see Table 1 in the main paper) are marked by horizontal dashed–dotted black lines. (Note the different scaling for BSR455 and BSR940.)
The CLaMS code is available on the GitLab server: https://jugit.fz-juelich.de/ clams/CLaMS (last access: 5 October 2020) (CLaMS, 2020). The typhoon tracks can be obtained at https://www.jma.go.jp/jma/jma-eng/jma-center/rsmc-hp-pub-eg/besttrack.html (last access: 5 October 2020) (JMA, 2020). The data of the balloon sounding in Nainital 2016 used in this paper are available upon request from Sreeharsha Hanumanthu (s.hanumanthu@fz-juelich.de).
SB, TJ and TP coordinated all measurements. The study was conceived by BV, SH and RM. The measurements in Nainital were conducted by SH, SB, TJ, PÖ, MN, BBS, KK, SS and TP. BBS, MN, SS and SF provided logistic support for the measurements in Nainital. The trajectory calculations and the associated analysis were conducted by SH and BV, with contributions by DL. The results of the study were discussed by all the co-authors, with particular contributions by SB, BL, TP, SH, BV and RM. The paper was written by BV, SH and RM, with contributions from all the co-authors.
The authors declare that they have no conflict of interest.
This article is part of the special issue “StratoClim stratospheric and upper tropospheric processes for better climate predictions (ACP/AMT inter-journal SI)”. It is not associated with a conference.
The authors thank Martina Krämer (Research Centre Jülich) for helpful discussions on cirrus formation. The research presented here received funding from the Seventh Framework Programme (FP7/2007–2013) of the European Commission as part of the StratoClim project and the Swiss National Science Foundation. The use of the ECMWF ERA-Interim data is gratefully acknowledged. Support from the director of ARIES and the ISRO ATCTM project is highly acknowledged regarding the observations at Nainital. Sreeharsha Hanumanthu was partly funded by a HITEC (Helmholtz Interdisciplinary Doctoral Training in Energy and Climate Research) fellowship by the Forschungszentrum Jülich and by the German Science Foundation (Deutsche Forschungsgemeinschaft, DFG) under the DFG project AMOS (HALO-SPP 1294/VO 1276/5-1). Further, the authors thank two anonymous reviewers for their very helpful comments.
This research has been supported by the European Community (grant no. 603557) and the Swiss National Science Foundation (grant no. 200021-147127).
The article processing charges for this open-access
publication were covered by a Research
Centre of the Helmholtz Association.
This paper was edited by Gabriele Stiller and reviewed by two anonymous referees.
Bergman, J. W., Jensen, E. J., Pfister, L., and Yang, Q.: Seasonal differences of vertical-transport efficiency in the tropical tropopause layer: On the interplay between tropical deep convection, large-scale vertical ascent, and horizontal circulations, J. Geophys. Res., 117, D05302, https://doi.org/10.1029/2011JD016992, 2012. a
Bergman, J. W., Fierli, F., Jensen, E. J., Honomichl, S., and Pan, L. L.: Boundary layer sources for the Asian anticyclone: Regional contributions to a vertical conduit, J. Geophys. Res., 118, 2560–2575, https://doi.org/10.1002/jgrd.50142, 2013. a, b
Bian, J., Pan, L. L., Paulik, L., Vömel, H., and Chen, H.: In situ water vapor and ozone measurements in Lhasa and Kunmin during the Asian summer monsoon, Geophys. Res. Lett., 39, L19808, https://doi.org/10.1029/2012GL052996, 2012. a, b
Bian, J., Li, D., Bai, Z., Li, Q., Lyu, D., and Zhou, X.: Transport of Asian surface pollutants to the global stratosphere from the Tibetan Plateau region during the Asian summer monsoon, Natl. Sci. Rev., 7, 516–533, https://doi.org/10.1093/nsr/nwaa005, 2020. a, b, c, d
Brabec, M., Wienhold, F. G., Luo, B. P., Vömel, H., Immler, F., Steiner, P., Hausammann, E., Weers, U., and Peter, T.: Particle backscatter and relative humidity measured across cirrus clouds and comparison with microphysical cirrus modelling, Atmos. Chem. Phys., 12, 9135–9148, https://doi.org/10.5194/acp-12-9135-2012, 2012. a, b, c, d, e
Brunamonti, S., Jorge, T., Oelsner, P., Hanumanthu, S., Singh, B. B., Kumar, K. R., Sonbawne, S., Meier, S., Singh, D., Wienhold, F. G., Luo, B. P., Boettcher, M., Poltera, Y., Jauhiainen, H., Kayastha, R., Karmacharya, J., Dirksen, R., Naja, M., Rex, M., Fadnavis, S., and Peter, T.: Balloon-borne measurements of temperature, water vapor, ozone and aerosol backscatter on the southern slopes of the Himalayas during StratoClim 2016–2017, Atmos. Chem. Phys., 18, 15937–15957, https://doi.org/10.5194/acp-18-15937-2018, 2018. a, b, c, d, e, f, g, h, i, j, k, l, m, n, o, p, q, r, s, t
Brunamonti, S., Füzér, L., Jorge, T., Poltera, Y., Oelsner, P., Meier, S., Dirksen, R., Naja, M., Fadnavis, S., Karmacharya, J., Wienhold, F. G., Luo, B. P., Wernli, H., and Peter, T.: Water Vapor in the Asian Summer Monsoon Anticyclone: Comparison of Balloon-Borne Measurements and ECMWF Data, J. Geophys. Res., 124, 7053–7068, https://doi.org/10.1029/2018JD030000, 2019. a, b
Bucholtz, A.: Rayleigh-scattering calculations for the terrestrial atmosphere, Appl. Optics, 34, 2765–2773, 1995. a
Chen, B., Xu, X. D., Yang, S., and Zhao, T. L.: Climatological perspectives of air transport from atmospheric boundary layer to tropopause layer over Asian monsoon regions during boreal summer inferred from Lagrangian approach, Atmos. Chem. Phys., 12, 5827–5839, https://doi.org/10.5194/acp-12-5827-2012, 2012. a, b, c
Chirkov, M., Stiller, G. P., Laeng, A., Kellmann, S., von Clarmann, T., Boone, C. D., Elkins, J. W., Engel, A., Glatthor, N., Grabowski, U., Harth, C. M., Kiefer, M., Kolonjari, F., Krummel, P. B., Linden, A., Lunder, C. R., Miller, B. R., Montzka, S. A., Mühle, J., O'Doherty, S., Orphal, J., Prinn, R. G., Toon, G., Vollmer, M. K., Walker, K. A., Weiss, R. F., Wiegele, A., and Young, D.: Global HCFC-22 measurements with MIPAS: retrieval, validation, global distribution and its evolution over 2005–2012, Atmos. Chem. Phys., 16, 3345–3368, https://doi.org/10.5194/acp-16-3345-2016, 2016. a
Cirisan, A., Luo, B. P., Engel, I., Wienhold, F. G., Sprenger, M., Krieger, U. K., Weers, U., Romanens, G., Levrat, G., Jeannet, P., Ruffieux, D., Philipona, R., Calpini, B., Spichtinger, P., and Peter, T.: Balloon-borne match measurements of midlatitude cirrus clouds, Atmos. Chem. Phys., 14, 7341–7365, https://doi.org/10.5194/acp-14-7341-2014, 2014. a, b, c, d
CLaMS: GitLab archive, available at: https://jugit.fz-juelich.de/clams/, last access: 5 October 2020. a
Dee, D. P., Uppala, S. M., Simmons, A. J., Berrisford, P., Poli, P., Kobayashi, S., Andrae, U., Balmaseda, M. A., Balsamo, G., Bauer, P., Bechtold, P., Beljaars, A. C. M., van de Berg, L., Bidlot, J., Bormann, N., Delsol, C., Dragani, R., Fuentes, M., Geer, A. J., Haimberger, L., Healy, S. B., Hersbach, H., Hólm, E. V., Isaksen, L., Kållberg, P., Köhler, M., Matricardi, M., McNally, A. P., Monge-Sanz, B. M., Morcrette, J.-J., Park, B.-K., Peubey, C., de Rosnay, P., Tavolato, C., Thépaut, J.-N., and Vitart, F.: The ERA-Interim reanalysis: configuration and performance of the data assimilation system, Q. J. R. Meteorol. Soc., 137, 553–597, https://doi.org/10.1002/qj.828, 2011. a, b
Deshler, T., Hervig, M. E., Hofmann, D. J., Rosen, J. M., and Liley, J. B.: Thirty years of in situ stratospheric aerosol size distribution measurements from Laramie, Wyoming (41∘ N), using balloon-borne instruments, J. Geophys. Res., 108, 4167, https://doi.org/10.1029/2002JD002514, 2003. a
Fadnavis, S., Semeniuk, K., Pozzoli, L., Schultz, M. G., Ghude, S. D., Das, S., and Kakatkar, R.: Transport of aerosols into the UTLS and their impact on the Asian monsoon region as seen in a global model simulation, Atmos. Chem. Phys., 13, 8771–8786, https://doi.org/10.5194/acp-13-8771-2013, 2013. a, b
Fadnavis, S., Schultz, M. G., Semeniuk, K., Mahajan, A. S., Pozzoli, L., Sonbawne, S., Ghude, S. D., Kiefer, M., and Eckert, E.: Trends in peroxyacetyl nitrate (PAN) in the upper troposphere and lower stratosphere over southern Asia during the summer monsoon season: regional impacts, Atmos. Chem. Phys., 14, 12725–12743, https://doi.org/10.5194/acp-14-12725-2014, 2014. a
Fadnavis, S., Roy, C., Chattopadhyay, R., Sioris, C. E., Rap, A., Müller, R., Kumar, K. R., and Krishnan, R.: Transport of trace gases via eddy shedding from the Asian summer monsoon anticyclone and associated impacts on ozone heating rates, Atmos. Chem. Phys., 18, 11493–11506, https://doi.org/10.5194/acp-18-11493-2018, 2018. a, b
Fadnavis, S., Müller, R., Kalita, G., Rowlinson, M., Rap, A., Li, J.-L. F., Gasparini, B., and Laakso, A.: The impact of recent changes in Asian anthropogenic emissions of SO2 on sulfate loading in the upper troposphere and lower stratosphere and the associated radiative changes, Atmos. Chem. Phys., 19, 9989–10008, https://doi.org/10.5194/acp-19-9989-2019, 2019a. a, b
Fadnavis, S., Sabin, T. P., Roy, C., Rowlinson, M., Rap, A., Vernier, J.-P., and Sioris, C. E.: Elevated aerosol layer over South Asia worsens the Indian drought, Sci. Rep., 9, 10268, https://doi.org/10.1038/s41598-019-46704-9, 2019b. a, b, c
Fairlie, T. D., Vernier, J.-P., Natarajan, M., and Bedka, K. M.: Dispersion of the Nabro volcanic plume and its relation to the Asian summer monsoon, Atmos. Chem. Phys., 14, 7045–7057, https://doi.org/10.5194/acp-14-7045-2014, 2014. a
Fairlie, T. D., Liu, H., Vernier, J.-P., Campuzano-Jost, P., Jimenez, J. L., Jo, D. S., Zhang, B., Natarajan, M., Avery, M. A., and Huey, G.: Estimates of Regional Source Contributions to the Asian Tropopause Aerosol Layer Using a Chemical Transport Model, J. Geophys. Res., 125, e2019JD031506, https://doi.org/10.1029/2019JD031506, 2020. a, b, c, d, e
Fueglistaler, S., Dessler, A. E., Dunkerton, T. J., Folkins, I., Fu, Q., and Mote, P. W.: Tropical tropopause layer, Rev. Geophys., 47, RG1004, https://doi.org/10.1029/2008RG000267, 2009. a
Gao, R. S., Telg, H., McLaughlin, R. J., Ciciora, S. J., Watts, L. A., Richardson, M. S., Schwarz, J. P., Perring, A. E., Thornberry, T. D., Rollins, A. W., Markovic, M. Z., Bates, T. S., Johnson, J. E., and Fahey, D. W.: A light-weight, high-sensitivity particle spectrometer for PM2.5 aerosol measurements, Aerosol Sci. Tech., 50, 88–99, https://doi.org/10.1080/02786826.2015.1131809, 2016. a, b
Garny, H. and Randel, W. J.: Transport pathways from the Asian monsoon anticyclone to the stratosphere, Atmos. Chem. Phys., 16, 2703–2718, https://doi.org/10.5194/acp-16-2703-2016, 2016. a, b, c
Gettelman, A. and de Forster, P. M.: Definition and climatology of the tropical tropopause layer, J. Meteorol. Soc. Jpn., 80, 911–924, 2002. a, b
Gu, Y., Liao, H., and Bian, J.: Summertime nitrate aerosol in the upper troposphere and lower stratosphere over the Tibetan Plateau and the South Asian summer monsoon region, Atmos. Chem. Phys., 16, 6641–6663, https://doi.org/10.5194/acp-16-6641-2016, 2016. a
Hong, Y., Liu, G., and Li, J.-L. F.: Assessing the Radiative Effects of Global Ice Clouds Based on CloudSat and CALIPSO Measurements, J. Climate, 29, 7651–7674, https://doi.org/10.1175/JCLI-D-15-0799.1, 2016. a
Höpfner, M., Ungermann, J., Borrmann, S., Wagner, R., Spang, R., Riese, M., Stiller, G., Appel, O., Batenburg, A. M., Bucci, S., Cairo, F., Dragoneas, A., Friedl-Vallon, F., Hünig, A., Johansson, S., Krasauskas, L., Legras, B., Leisner, T., Mahnke, C., Möhler, O., Molleker, S., Müller, R., Neubert, T., Orphal, J., Preusse, P., Rex, M., Saathoff, H., Stroh, F., Weigel, R., and Wohltmann, I.: Ammonium nitrate particles formed in upper troposphere from ground ammonia sources during Asian monsoons, Nat. Geosci., 12, 608–612, https://doi.org/10.1038/s41561-019-0385-8, 2019. a, b, c, d, e
Hosking, J. S., Russo, M. R., Braesicke, P., and Pyle, J. A.: Tropical convective transport and the Walker circulation, Atmos. Chem. Phys., 12, 9791–9797, https://doi.org/10.5194/acp-12-9791-2012, 2012. a
Hoskins, B. J. and Rodwell, M. J.: A model of the Asian summer monsoon, I, The global scale, J. Atmos. Sci., 52, 1329–1340, 1995. a
Houze Jr., R. A., Wilton, D. C., and Smull, B. F.: Monsoon convection in the Himalayan region as seen by the TRMM Precipitation Radar, Q. J. Roy. Meteor. Soc., 133, 1389–1411, https://doi.org/10.1002/qj.106, 2007. a
JMA – Japan Meteorological Agency: Typhoon tracks, available at: https://www.jma.go.jp/jma/jma-eng/jma-center/rsmc-hp-pub-eg/besttrack.html, last access: 5 October 2020. a
Jorge, T., Brunamonti, S., Poltera, Y., Wienhold, F. G., Luo, B. P., Oelsner, P., Hanumanthu, S., Sing, B. B., Körner, S., Dirksen, R., Naja, M., Fadnavis, S., and Peter, T.: Understanding cryogenic frost point hygrometer measurements after contamination by mixed-phase clouds, Atmos. Meas. Tech. Discuss., https://doi.org/10.5194/amt-2020-176, in review, 2020. a
Kim, Y.-S., Shibata, T., Iwasaka, Y., Shi, G., Zhou, X., Tamura, K., and Ohashi, T.: Enhancement of aerosols near the cold tropopause in summer over Tibetan Plateau: lidar and balloonborne measurements in 1999 at Lhasa, Tibet, China, in: Lidar Remote Sensing for Industry and Environment Monitoring III, edited by: Singh, U. N., Itabe, T., and Liu, Z., vol. 4893, 496–503, International Society for Optics and Photonics, SPIE, https://doi.org/10.1117/12.466090, 2003. a, b
Komhyr, W. D.: Electrocemical concentration cells for gas analysis, Ann. Geophys., 25, 203–210, 1969. a
Komhyr, W. D., Barnes, R. A., Brothers, G. B., Lathrop, J. A., and Opperman, D. P.: Electrochemical concentration cell ozonesonde performance evaluation during STOIC 1989, J. Geophys. Res., 100, 9231–9244, https://doi.org/10.1029/94JD02175, 1995. a
Krämer, M., Rolf, C., Luebke, A., Afchine, A., Spelten, N., Costa, A., Meyer, J., Zöger, M., Smith, J., Herman, R. L., Buchholz, B., Ebert, V., Baumgardner, D., Borrmann, S., Klingebiel, M., and Avallone, L.: A microphysics guide to cirrus clouds – Part 1: Cirrus types, Atmos. Chem. Phys., 16, 3463–3483, https://doi.org/10.5194/acp-16-3463-2016, 2016. a
Lau, W. K. M., Yuan, C., and Li, Z.: Origin, Maintenance and Variability of the Asian Tropopause Aerosol Layer (ATAL): The Roles of Monsoon Dynamics, Sci. Rep., 8, 3960, https://doi.org/10.1038/s41598-018-22267-z, 2018. a, b, c, d
Li, Q., Jiang, J. H., Wu, D. L., Read, W. G., Livesey, N. J., Waters, J. W., Zhang, Y., Wang, B., Filipiak, M. J., Davis, C. P., Turquety, S., Wu, S., Park, R. J., Yantosca, R. M., and Jacob, D. J.: Convective outflow of South Asian pollution: A global CTM simulation compared with EOS MLS observations, Geophys. Res. Lett., 32, L14826, https://doi.org/10.1029/2005GL022762, 2005. a
Li, D., Vogel, B., Bian, J., Müller, R., Pan, L. L., Günther, G., Bai, Z., Li, Q., Zhang, J., Fan, Q., and Vömel, H.: Impact of typhoons on the composition of the upper troposphere within the Asian summer monsoon anticyclone: the SWOP campaign in Lhasa 2013, Atmos. Chem. Phys., 17, 4657–4672, https://doi.org/10.5194/acp-17-4657-2017, 2017. a, b, c, d, e
Li, D., Vogel, B., Müller, R., Bian, J., Günther, G., Li, Q., Zhang, J., Bai, Z., Vömel, H., and Riese, M.: High tropospheric ozone in Lhasa within the Asian summer monsoon anticyclone in 2013: influence of convective transport and stratospheric intrusions, Atmos. Chem. Phys., 18, 17979–17994, https://doi.org/10.5194/acp-18-17979-2018, 2018. a, b, c, d
Li, D., Vogel, B., Müller, R., Bian, J., Günther, G., Ploeger, F., Li, Q., Zhang, J., Bai, Z., Vömel, H., and Riese, M.: Dehydration and low ozone in the tropopause layer over the Asian monsoon caused by tropical cyclones: Lagrangian transport calculations using ERA-Interim and ERA5 reanalysis data, Atmos. Chem. Phys., 20, 4133–4152, https://doi.org/10.5194/acp-20-4133-2020, 2020. a, b, c, d
Luo, J., Pan, L. L., Honomichl, S. B., Bergman, J. W., Randel, W. J., Francis, G., Clerbaux, C., George, M., Liu, X., and Tian, W.: Space–time variability in UTLS chemical distribution in the Asian summer monsoon viewed by limb and nadir satellite sensors, Atmos. Chem. Phys., 18, 12511–12530, https://doi.org/10.5194/acp-18-12511-2018, 2018. a
Martinsson, B. G., Friberg, J., Andersson, S. M., Weigelt, A., Hermann, M., Assmann, D., Voigtländer, J., Brenninkmeijer, C. A. M., van Velthoven, P. J. F., and Zahn, A.: Comparison between CARIBIC Aerosol Samples Analysed by Accelerator-Based Methods and Optical Particle Counter Measurements, Atmos. Meas. Tech., 7, 2581–2596, https://doi.org/10.5194/amt-7-2581-2014, 2014. a
McKenna, D. S., Konopka, P., Grooß, J.-U., Günther, G., Müller, R., Spang, R., Offermann, D., and Orsolini, Y.: A new Chemical Lagrangian Model of the Stratosphere (CLaMS): 1. Formulation of advection and mixing, J. Geophys. Res., 107, 4309, https://doi.org/10.1029/2000JD000114, 2002. a
Müller, S., Hoor, P., Bozem, H., Gute, E., Vogel, B., Zahn, A., Bönisch, H., Keber, T., Krämer, M., Rolf, C., Riese, M., Schlager, H., and Engel, A.: Impact of the Asian monsoon on the extratropical lower stratosphere: trace gas observations during TACTS over Europe 2012, Atmos. Chem. Phys., 16, 10573–10589, https://doi.org/10.5194/acp-16-10573-2016, 2016. a, b
Nützel, M., Dameris, M., and Garny, H.: Movement, drivers and bimodality of the South Asian High, Atmos. Chem. Phys., 16, 14755–14774, https://doi.org/10.5194/acp-16-14755-2016, 2016. a, b
Pan, L. L., Paulik, L. C., Honomichl, S. B., Munchak, L. A., Bian, J., Selkirk, H. B., and Vömel, H.: Identification of the tropical tropopause transition layer using the ozone-water vapor relationship, J. Geophys. Res.-Atmos., 119, 3586–3599, https://doi.org/10.1002/2013JD020558, 2014. a
Pan, L. L., Honomichl, S. B., Kinnison, D. E., Abalos, M., Randel, W. J., Bergman, J. W., and Bian, J.: Transport of chemical tracers from the boundary layer to stratosphere associated with the dynamics of the Asian summer monsoon, J. Geophys. Res., 121, 14159–14174, https://doi.org/10.1002/2016JD025616, 2016. a
Pandit, A. K., Gadhavi, H. S., Venkat Ratnam, M., Raghunath, K., Rao, S. V. B., and Jayaraman, A.: Long-term trend analysis and climatology of tropical cirrus clouds using 16 years of lidar data set over Southern India, Atmos. Chem. Phys., 15, 13833–13848, https://doi.org/10.5194/acp-15-13833-2015, 2015. a
Park, M., Randel, W. J., Gettleman, A., Massie, S. T., and Jiang, J. H.: Transport above the Asian summer monsoon anticyclone inferred from Aura Microwave Limb Sounder tracers, J. Geophys. Res., 112, D16309, https://doi.org/10.1029/2006JD008294, 2007. a, b, c
Park, M., Randel, W. J., Emmons, L. K., Bernath, P. F., Walker, K. A., and Boone, C. D.: Chemical isolation in the Asian monsoon anticyclone observed in Atmospheric Chemistry Experiment (ACE-FTS) data, Atmos. Chem. Phys., 8, 757–764, https://doi.org/10.5194/acp-8-757-2008, 2008. a, b
Park, M., Randel, W. J., Emmons, L. K., and Livesey, N. J.: Transport pathways of carbon monoxide in the Asian summer monsoon diagnosed from Model of Ozone and Related Tracers (MOZART), J. Geophys. Res., 114, D08303, https://doi.org/10.1029/2008JD010621, 2009. a
Ploeger, F., Konopka, P., Günther, G., Grooß, J.-U., and Müller, R.: Impact of the vertical velocity scheme on modeling transport across the tropical tropopause layer, J. Geophys. Res., 115, D03301, https://doi.org/10.1029/2009JD012023, 2010. a, b
Ploeger, F., Konopka, P., Müller, R., Günther, G., Grooß, J.-U., Schiller, C., Ravegnani, F., Ulanovski, A., and Riese, M.: Backtrajectory reconstruction of water vapour and ozone in-situ observations in the TTL, Meteorol. Z., 21, 239–244, 2012. a
Ploeger, F., Günther, G., Konopka, P., Fueglistaler, S., Müller, R., Hoppe, C., Kunz, A., Spang, R., Grooß, J.-U., and Riese, M.: Horizontal water vapor transport in the lower stratosphere from subtropics to high latitudes during boreal summer, J. Geophys. Res., 118, 8111–8127, https://doi.org/10.1002/jgrd.50636, 2013. a
Ploeger, F., Gottschling, C., Griessbach, S., Grooß, J.-U., Guenther, G., Konopka, P., Müller, R., Riese, M., Stroh, F., Tao, M., Ungermann, J., Vogel, B., and von Hobe, M.: A potential vorticity-based determination of the transport barrier in the Asian summer monsoon anticyclone, Atmos. Chem. Phys., 15, 13145–13159, https://doi.org/10.5194/acp-15-13145-2015, 2015. a
Pommrich, R., Müller, R., Grooß, J.-U., Konopka, P., Ploeger, F., Pommrich, R., Müller, R., Grooß, J.-U., Konopka, P., Ploeger, F., Vogel, B., Tao, M., Hoppe, C. M., Günther, G., Spelten, N., Hoffmann, L., Pumphrey, H.-C., Viciani, S., D'Amato, F., Volk, C. M., Hoor, P., Schlager, H., and Riese, M.: Tropical troposphere to stratosphere transport of carbon monoxide and long-lived trace species in the Chemical Lagrangian Model of the Stratosphere (CLaMS), Geosci. Model Dev., 7, 2895–2916, https://doi.org/10.5194/gmd-7-2895-2014, 2014. a, b, c
Randel, W. J. and Park, M.: Deep convective influence on the Asian summer monsoon anticyclone and associated tracer variability observed with Atmospheric Infrared Sounder (AIRS), J. Geophys. Res., 111, D12314, https://doi.org/10.1029/2005JD006490, 2006. a
Randel, W. J., Park, M., Emmons, L., Kinnison, D., Bernath, P., Walker, K. A., Boone, C., and Pumphrey, H.: Asian Monsoon Transport of Pollution to the Stratosphere, Science, 328, 611–613, https://doi.org/10.1126/science.1182274, 2010. a
Randel, W. J., Zhang, K., and Fu, R.: What controls stratospheric water vapor in the NH summer monsoon regions?, J. Geophys. Res., 120, 7988–8001, https://doi.org/10.1002/2015JD023622, 2015. a, b
Ridley, D. A., Solomon, S., Barnes, J. E., Burlakov, V. D., Deshler, T., Dolgii, S. I., Herber, A. B., Nagai, T., Neely III, R. R., Nevzorov, A. V., Ritter, C., Sakai, T., Santer, B. D., Sato, M., Schmidt, A., Uchino, O., and Vernier, J. P.: Total volcanic stratospheric aerosol optical depths and implications for global climate change, Geophys. Res. Lett., 41, 7763–7769, https://doi.org/10.1002/2014GL061541, 2014. a
Rolf, C., Vogel, B., Hoor, P., Afchine, A., Günther, G., Krämer, M., Müller, R., Müller, S., Spelten, N., and Riese, M.: Water vapor increase in the lower stratosphere of the Northern Hemisphere due to the Asian monsoon anticyclone observed during the TACTS/ESMVal campaigns, Atmos. Chem. Phys., 18, 2973–2983, https://doi.org/10.5194/acp-18-2973-2018, 2018. a
Roy, C., Fadnavis, S., Müller, R., Ayantika, D. C., Ploeger, F., and Rap, A.: Influence of enhanced Asian NOx emissions on ozone in the upper troposphere and lower stratosphere in chemistry–climate model simulations, Atmos. Chem. Phys., 17, 1297–1311, https://doi.org/10.5194/acp-17-1297-2017, 2017. a
Santee, M. L., Manney, G. L., Livesey, N. J., Schwartz, M. J., Neu, J. L., and Read, W. G.: A comprehensive overview of the climatological composition of the Asian summer monsoon anticyclone based on 10 years of Aura Microwave Limb Sounder measurements, J. Geophys. Res., 122, 5491–5514, https://doi.org/10.1002/2016JD026408, 2017. a, b
Spang, R., Günther, G., Riese, M., Hoffmann, L., Müller, R., and Griessbach, S.: Satellite observations of cirrus clouds in the Northern Hemisphere lowermost stratosphere, Atmos. Chem. Phys., 15, 927–950, https://doi.org/10.5194/acp-15-927-2015, 2015. a
Thomason, L. W. and Vernier, J.-P.: Improved SAGE II cloud/aerosol categorization and observations of the Asian tropopause aerosol layer: 1989–2005, Atmos. Chem. Phys., 13, 4605–4616, https://doi.org/10.5194/acp-13-4605-2013, 2013. a, b
Tobo, Y., Iwasaka, Y., Shi, G.-Y., Kim, Y.-S., Ohashi, T., Tamura, K., and Zhang, D.: Balloon-borne observations of high aerosol concentrations near the summertime tropopause over the Tibetan Plateau, Atmos. Res., 84, 233–241, https://doi.org/10.1016/j.atmosres.2006.08.003, 2007. a, b
Turner, A. G. and Annamalai, H.: Climate change and the South Asian summer monsoon, Nat. Clim. Change, 2, 587–595, https://doi.org/10.1038/nclimate1495, 2012. a
Ueyama, R., Jensen, E. J., and Pfister, L.: Convective Influence on the Humidity and Clouds in the Tropical Tropopause Layer During Boreal Summer, J. Geophys. Res., 123, 7576–7593, https://doi.org/10.1029/2018JD028674, 2018. a, b
van Damme, M., Clarisse, L., Whitburn, S., Hadji-Lazaro, J., Hurtmans, D., Clerbaux, C., and Coheur, P.-F.: Industrial and agricultural ammonia point sources exposed, Nature, 564, 99–103, https://doi.org/10.1038/s41586-018-0747-1, 2018. a
van der A, R. J., Mijling, B., Ding, J., Koukouli, M. E., Liu, F., Li, Q., Mao, H., and Theys, N.: Cleaning up the air: effectiveness of air quality policy for SO2 and NOx emissions in China, Atmos. Chem. Phys., 17, 1775–1789, https://doi.org/10.5194/acp-17-1775-2017, 2017. a
Vernier, J.-P., Thomason, L. W., and Kar, J.: CALIPSO detection of an Asian tropopause aerosol layer, Geophys. Res. Lett., 38, L07804, https://doi.org/10.1029/2010GL046614, 2011. a, b, c, d
Vernier, J. P., Fairlie, T. D., Natarajan, M., Wienhold, F. G., Bian, J., Martinsson, B. G., Crumeyrolle, S., Thomason, L. W., and Bedka, K. M.: Increase in upper tropospheric and lower stratospheric aerosol levels and its potential connection with Asian pollution, J. Geophys. Res., 120, 1608–1619, https://doi.org/10.1002/2014JD022372, 2015. a, b, c, d, e, f, g, h, i, j, k, l, m, n, o
Vernier, J.-P., Fairlie, T. D., Deshler, T., Ratnam, M. V., Gadhavi, H., Kumar, B. S., Natarajan, M., Pandit, A. K., Raj, S. T. A., Kumar, A. H., Jayaraman, A., Singh, A. K., Rastogi, N., Sinha, P. R., Kumar, S., Tiwari, S., Wegner, T., Baker, N., Vignelles, D., Stenchikov, G., Shevchenko, I., Smith, J., Bedka, K., Kesarkar, A., Singh, V., Bhate, J., Ravikiran, V., Rao, M. D., Ravindrababu, S., Patel, A., Vernier, H., Wienhold, F. G., Liu, H., Knepp, T. N., Thomason, L., Crawford, J., Ziemba, L., Moore, J., Crumeyrolle, S., Williamson, M., Berthet, G., Jégou, F., and Renard, J.-B.: BATAL: The Balloon Measurement Campaigns of the Asian Tropopause Aerosol Layer, B. Am. Meteorol. Soc., 99, 955–973, https://doi.org/10.1175/BAMS-D-17-0014.1, 2018. a, b, c, d, e, f, g, h, i, j, k, l
Vogel, B., Müller, R., Deshler, T., Grooß, J.-U., Karhu, J., McKenna, D. S., Müller, M., Toohey, D., Toon, G. C., and Stroh, F.: Vertical profiles of activated ClO and ozone loss in the Arctic vortex in January and March 2000: In situ observations and model simulations, J. Geophys. Res., 108, 8334, https://doi.org/10.1029/2002JD002564, 2003. a
Vogel, B., Günther, G., Müller, R., Grooß, J.-U., Hoor, P., Krämer, M., Müller, S., Zahn, A., and Riese, M.: Fast transport from Southeast Asia boundary layer sources to northern Europe: rapid uplift in typhoons and eastward eddy shedding of the Asian monsoon anticyclone, Atmos. Chem. Phys., 14, 12745–12762, https://doi.org/10.5194/acp-14-12745-2014, 2014. a, b, c, d
Vogel, B., Günther, G., Müller, R., Grooß, J.-U., and Riese, M.: Impact of different Asian source regions on the composition of the Asian monsoon anticyclone and of the extratropical lowermost stratosphere, Atmos. Chem. Phys., 15, 13699–13716, https://doi.org/10.5194/acp-15-13699-2015, 2015. a, b, c, d, e
Vogel, B., Günther, G., Müller, R., Grooß, J.-U., Afchine, A., Bozem, H., Hoor, P., Krämer, M., Müller, S., Riese, M., Rolf, C., Spelten, N., Stiller, G. P., Ungermann, J., and Zahn, A.: Long-range transport pathways of tropospheric source gases originating in Asia into the northern lower stratosphere during the Asian monsoon season 2012, Atmos. Chem. Phys., 16, 15301–15325, https://doi.org/10.5194/acp-16-15301-2016, 2016. a, b, c, d
Vogel, B., Müller, R., Günther, G., Spang, R., Hanumanthu, S., Li, D., Riese, M., and Stiller, G. P.: Lagrangian simulations of the transport of young air masses to the top of the Asian monsoon anticyclone and into the tropical pipe, Atmos. Chem. Phys., 19, 6007–6034, https://doi.org/10.5194/acp-19-6007-2019, 2019. a, b, c, d, e, f, g, h, i
Vömel, H., David, D. E., and Smith, K.: Accuracy of tropospheric and stratospheric water vapor measurements by the cryogenic frost point hygrometer: Instrumental details and observations, J. Geophys. Res., 112, D08305, https://doi.org/10.1029/2006JD007224, 2007. a, b
Vömel, H., Naebert, T., Dirksen, R., and Sommer, M.: An update on the uncertainties of water vapor measurements using cryogenic frost point hygrometers, Atmos. Meas. Tech., 9, 3755–3768, https://doi.org/10.5194/amt-9-3755-2016, 2016. a, b
Wienhold, F. G.: Compact Backscatter AerosoL Detector (COBALD) Datasheet and Deployment Overview, Tech. rep., Swiss Federal Institute of Technology (ETH), Zürich, Switzerland, https://iac.ethz.ch/group/atmospheric-chemistry/research/ballon-soundings.html (last access: 25 April 2020), 2008. a, b
Yan, R.-C., Bian, J.-C., and Fan, Q.-J.: The impact of the South Asia High Bimodality on the chemical composition of the upper troposphere and lower stratosphere, Atmos. Ocean. Sci. Lett., 4, 229–234, 2011. a, b
Yan, X., Konopka, P., Ploeger, F., Podglajen, A., Wright, J. S., Müller, R., and Riese, M.: The efficiency of transport into the stratosphere via the Asian and North American summer monsoon circulations, Atmos. Chem. Phys., 19, 15629–15649, https://doi.org/10.5194/acp-19-15629-2019, 2019. a
Yu, P., Rosenlof, K. H., Liu, S., Telg, H., Thornberry, T. D., Rollins, A. W. Portmann, R. W., Bai, Z., Ray, E. A., Duan, Y., Pan, L. L., Toon, O. B., Bian, J., and Gao, R.-S.: Efficient transport of tropospheric aerosol into the stratosphere via the Asian summer monsoon anticyclone, P. Natl. Acad. Sci. USA, 114, 6972–6977, https://doi.org/10.1073/pnas.1701170114, 2017. a, b, c, d
Yuan, C., Lau, W. K. M., Li, Z., and Cribb, M.: Relationship between Asian monsoon strength and transport of surface aerosols to the Asian Tropopause Aerosol Layer (ATAL): interannual variability and decadal changes, Atmos. Chem. Phys., 19, 1901–1913, https://doi.org/10.5194/acp-19-1901-2019, 2019. a, b, c
Zhang, Q., Wu, G., and Qian, Y.: The Bimodality of the 100 hPa South Asia High and its Relationship to the Climate Anomaly over East Asia in Summer, J. Meteorol. Soc. Jpn., 80, 733–744, 2002. a, b
Zheng, B., Tong, D., Li, M., Liu, F., Hong, C., Geng, G., Li, H., Li, X., Peng, L., Qi, J., Yan, L., Zhang, Y., Zhao, H., Zheng, Y., He, K., and Zhang, Q.: Trends in China's anthropogenic emissions since 2010 as the consequence of clean air actions, Atmos. Chem. Phys., 18, 14095–14111, https://doi.org/10.5194/acp-18-14095-2018, 2018. a, b
- Abstract
- Introduction
- Methods
- The observations in Nainital in 2016
- Results of the back-trajectory analysis
- Discussion
- Conclusions
- Appendix A: Details to COBALD measurements
- Code and data availability
- Author contributions
- Competing interests
- Special issue statement
- Acknowledgements
- Financial support
- Review statement
- References