the Creative Commons Attribution 4.0 License.
the Creative Commons Attribution 4.0 License.
 | 23 Nov 2020
Urbanization-induced land and aerosol impacts on sea-breeze circulation and convective precipitation
Zhanqing Li
Jiaxi Hu
Daniel Rosenfeld
Changes in land cover and aerosols resulting from urbanization may impact convective clouds and precipitation. Here we investigate how Houston urbanization can modify sea-breeze-induced convective cloud and precipitation through the urban land effect and anthropogenic aerosol effect. The simulations are carried out with the Chemistry version of the Weather Research and Forecasting model (WRF-Chem), which is coupled with spectral-bin microphysics (SBM) and the multilayer urban model with a building energy model (BEM-BEP). We find that Houston urbanization (the joint effect of both urban land and anthropogenic aerosols) notably enhances storm intensity (by ∼ 75 % in maximum vertical velocity) and precipitation intensity (up to 45 %), with the anthropogenic aerosol effect more significant than the urban land effect. Urban land effect modifies convective evolution: speed up the transition from the warm cloud to mixed-phase cloud, thus initiating surface rain earlier but slowing down the convective cell dissipation, all of which result from urban heating-induced stronger sea-breeze circulation. The anthropogenic aerosol effect becomes evident after the cloud evolves into the mixed-phase cloud, accelerating the development of storm from the mixed-phase cloud to deep cloud by ∼ 40 min. Through aerosol–cloud interaction (ACI), aerosols boost convective intensity and precipitation mainly by activating numerous ultrafine particles at the mixed-phase and deep cloud stages. This work shows the importance of considering both the urban land and anthropogenic aerosol effects for understanding urbanization effects on convective clouds and precipitation.
- Article
(18450 KB) - Full-text XML
- BibTeX
- EndNote


Urbanization has been a significant change in the earth's environment since industrialization and is expected to further expand during the coming decades (Alig et al., 2004). Many modeling and observational studies have shown that urbanization can impact weather and climate (e.g., Shepherd et al., 2010; Ashley et al., 2012).
Urbanization could impact storm properties through two major pathways. The first major pathway is through the changes in land cover types. For urban land, the most typical and extensively studied effect is the increase in surface temperature compared to the surrounding rural area, known as the urban heat island (UHI) effect (e.g., Bornstein and Lin, 2000; Shepherd, 2005; Hubbart et al., 2014). Convective storms may be initiated at the UHI convergence zone, created through a combination of increased temperature and mechanical turbulence resulting from complex urban surface geometry and roughness (Bornstein and Lin, 2000; Shepherd, 2005; Hubbart et al., 2014). Urban landscapes impact sensible and latent heat flux, soil moisture, etc., affecting thunderstorm initiation (Haberlie et al., 2015) and changing the location and amount of precipitation compared to the pre-urbanization period (Shepherd et al., 2002; Niyogi et al., 2011).
The second major pathway of the urbanization impacts is through pollutant aerosols associated with industrial and population growth in cities. Previous studies have shown that urban aerosols invigorate precipitation in urban downwind regions through aerosol–cloud interaction (ACI; Van den Heever and Cotton 2007; Carrió et al., 2010; Fan et al., 2018). A recent study showed aerosol spatial variability in the Seoul area played an important role in a torrential rain event (Lee et al., 2018). Many compelling pieces of evidence have emerged showing the joint influences of aerosols and urban land on clouds and precipitation, especially in China, where both effects are strong and complex (Li et al., 2019, and references therein).
The majority of the past studies focused on one of the abovementioned pathways. Recently, a few studies examined the combined effects of both pathways on lightning and precipitation. A new observational study (Kar and Liou, 2019) indicated that both the land and aerosol effects should be considered to explain the cloud-to-ground lightning enhancements over the urban areas. Kingfield et al. (2017) also found that cloud-to-ground lightning enhancements can also be caused by the presence of tall towers. A modeling study showed urban land cover changes increased precipitation over the upstream region but decreased precipitation over the downstream region, while aerosols had the opposite effect by serving as cloud condensation nuclei (Zhong et al., 2015). A long-period (5-year) modeling study in the Yangtze River Delta (YRD) region confirmed the opposite effects on precipitation, but the aerosol radiative effect was the dominant reason for the reduced convective intensity and precipitation (Zhong et al., 2017). Sarangi et al. (2018) also showed the enhanced precipitation over the urban core by the urban land effect and at the downwind region by the aerosol effect, consistent with Zhong et al. (2015). Schmid and Niyogi (2017) showed that urban precipitation rate enhancement is due to a combination of land-heterogeneity-induced dynamical lifting effects and aerosol indirect effects. For coastal cities, studies indicated that anthropogenic aerosol effects on precipitation may be more important than the urban land effect (Liu and Niyogi, 2019; Ganeshan et al., 2013; Ochoa et al., 2015).
Houston is the largest city in the southern United States. It is one of the most polluted areas in the nation based on the most recent “State of the Air” report by the American Lung Association (http://www.stateoftheair.org/about/, last access: 14 November 2020). The Houston urbanization causes both land cover change and anthropogenic emission enhancement, which have been a fertile region for air quality studies (i.e., high ozone) (e.g., Chen et al., 2011; Fast et al., 2006). The sea-breeze circulation over the region plays a key role not only in convection and precipitation, but also in local air quality (Fan et al., 2007; Banta et al., 2005; Caicedo et al., 2019). The strength and inland propagation of sea-breeze circulation can be influenced by land–sea surface temperature contrast, land use/land cover, and the synoptic flow (e.g., Angevine et al., 2006; Bao et al., 2005; Chen et al., 2011). Chen et al. (2011) indicated that the existence of Houston favored stagnation because the inland penetration of the sea breeze counteracted the synoptic flow in a case study. On the other hand, Ryu et al. (2016) showed the urban heating of the Baltimore–Washington metropolitan area strengthened the bay breeze and thus promoted intense convection and heavy rainfall. In Shanghai, however, the sea–land breeze has exhibited a weakening trend over the past 21 years, which was hypothesized to result from the joint influences of aerosol, UHI, and greenhouse effects (Shen et al., 2019). While sorting out the various factors is a daunting task especially by means of observation analysis, it is essential to enhance our understanding of both overall effects by human activity and individual ones for which far fewer have been done.
In this study, we aim to understand how the changes in Houston land cover and anthropogenic aerosols as a result of urbanization modify the sea-breeze-induced convective storm and precipitation jointly and respectively. To answer the science question, we employ the Chemistry version of the Weather Research and Forecast (WRF) model coupled with the spectral-bin microphysics (WRF-Chem-SBM) scheme, a model we previously developed and applied to warm stratocumulus clouds (Gao et al., 2016), to simulate a deep convective storm case that occurred over the Houston region and produced heavy precipitation. Sensitivity tests are performed to look into the joint and respective effects of urban land and anthropogenic aerosol on storm development and precipitation.
2.1 Case description
The deep convective cloud event we simulate in this study occurred on 19–20 June 2013 near Houston, Texas. The case was also selected for the ACPC Model Intercomparison Project (Rosenfeld et al., 2014; http://www.acpcinitiative.org, last access: 14 November 2020). In another companion study (Zhang et al., 2020), this case was simulated to study the impact of cloud microphysics parameterizations on ACI. As shown in Fig. 1a and c, along a trailing front extended zonally across the southeastern United States, the isolated weak convective clouds formed in the late morning. Deep convective cells over the Houston and Galveston bay areas developed in the afternoon with the increased solar heating and strengthened sea-breeze circulation (Fig. 1b, d). The sea-breeze circulation will be shown in detail in the result section, and it was among the typical summer day sea-breeze conditions (Kocen, 2013). A strong convective cell observed in Houston that we focused on was initiated at 21:45 UTC (16:45 local time) and developed to its peak precipitation at 22:17 UTC.

Figure 1(a–b) 2 m temperature (shaded) and 10 m wind (arrows) from the North American Regional Reanalysis (NARR) data (32 km grid spacing), and the stationary front; (c–d) composite reflectivity observed at KHGX (Houston NEXRAD) at 15:00 UTC (a, c) and 18:00 UTC (b, d) 19 June 2013.
The simulated case was evaluated extensively in aerosol and cloud properties in the companion paper mentioned above. The observations of radar reflectivity and precipitation are also used in the evaluation. The radar reflectivity is obtained from the Next-Generation Weather Radar (NEXRAD) network for the KHGX site at https://www.ncdc.noaa.gov/data-access/radar-data/nexrad-products (last access: 14 November 2020), with a temporal frequency of every ∼ 5 min and a spatial resolution of 1 km. The high temporal and spatial precipitation data retrieved based on radar reflectivity are used for simulation evaluation.
2.2 Model description and experiment design
The WRF-Chem–SBM model used in this study is based on Gao et al. (2016), with updates in both WRF-Chem (Grell et al., 2005; Skamarock et al., 2008) and the SBM (Khain et al., 2004; Fan et al., 2012). The SBM version coupled with WRF-Chem is a fast version with only four sets of 33 bins for representing size distribution of cloud condensation nuclei (CCN), drop, ice/snow, and graupel/hail, respectively. It is currently coupled with the four-sector version of the Model for Simulating Aerosol Interactions and Chemistry (MOSAIC) (Fast et al., 2006; Zaveri et al., 2008). Compared with the original WRF-Chem model which uses two-moment bulk microphysics schemes, besides the advancements in cloud microphysical process calculations in SBM, the aerosol–cloud interaction processes which impact both cloud and aerosol properties are physically improved. These processes are aerosol activation, resuspension, and in-cloud wet removal (Gao et al., 2016). Theoretically, both aerosol and cloud processes can be more realistically simulated compared with the original WRF-Chem, particularly under the conditions of complicated aerosol compositions and aerosol spatial heterogeneity. This would result in improved simulations of both ACI and aerosol–radiation interaction (ARI). Following on from Gao et al. (2016), where the model was applied to a warm stratocumulus cloud case, we apply the model to the deep convective storm case in this study.
The dynamic core of WRF-Chem-SBM is the Advanced Research WRF model that is fully compressible and non-hydrostatic with a terrain-following hydrostatic pressure vertical coordinate (Skamarock et al., 2008). The grid staggering is the Arakawa C-grid. The model uses the Runge–Kutta third-order time integration schemes, and the third- and fifth-order advection schemes are selected for the vertical and horizontal directions, respectively. The positive-definite option is employed for the advection of moist and scalar variables.
The model domains are shown in Fig. 2. Two nested domains have horizontal grid spacings of 2 and 0.5 km and horizontal grid points of 450 × 350 and 500 × 400, respectively, with 51 vertical levels up to 50 hPa. Domain 1 simulations are run with WRF-Chem using the Morrison double-moment scheme (Morrison et al., 2005) to produce realistic aerosol fields for Domain 2 simulations. Two simulations were run over Domain 1 with anthropogenic emissions turned on and off, respectively, starting from 00:00 UTC 14 June and ending at 12:00 UTC 20 June with about 5 d for chemical spinup. The chemical lateral boundary and initial conditions for Domain 1 simulations were from a quasi-global WRF-Chem simulation at 1∘ grid spacing, and meteorological lateral boundary and initial conditions were created from MERRA-2 (Gelaro et al., 2017). Domain 2 simulations use WRF-Chem-SBM, driven with the initial and lateral boundary aerosol and chemical fields from Domain 1 outputs, but the initial and lateral boundary conditions for meteorological fields are from MERRA-2. The reason for not using the meteorological fields from Domain 1 simulations is that the meteorological fields are different between the two Domain 1 simulations with and without anthropogenic emissions. To use the same meteorological fields to drive all simulations carried out over Domain 2 (including those with and without anthropogenic emissions), also to avoid using the forcing that already accounted for small-scale urban land and aerosol effects, we choose MERRA-2 for the initial and lateral boundary conditions for meteorological fields. Domain 2 simulations are initiated at 06:00 UTC 19 June (∼ 5 d later from the initial time of Domain 1 simulations) and run for 30 h. The analysis period is ∼ 12 h after the initial time of Domain 2. The modeled dynamic time step was 6 s for Domain 1 simulations and 3 s for Domain 2 simulations.
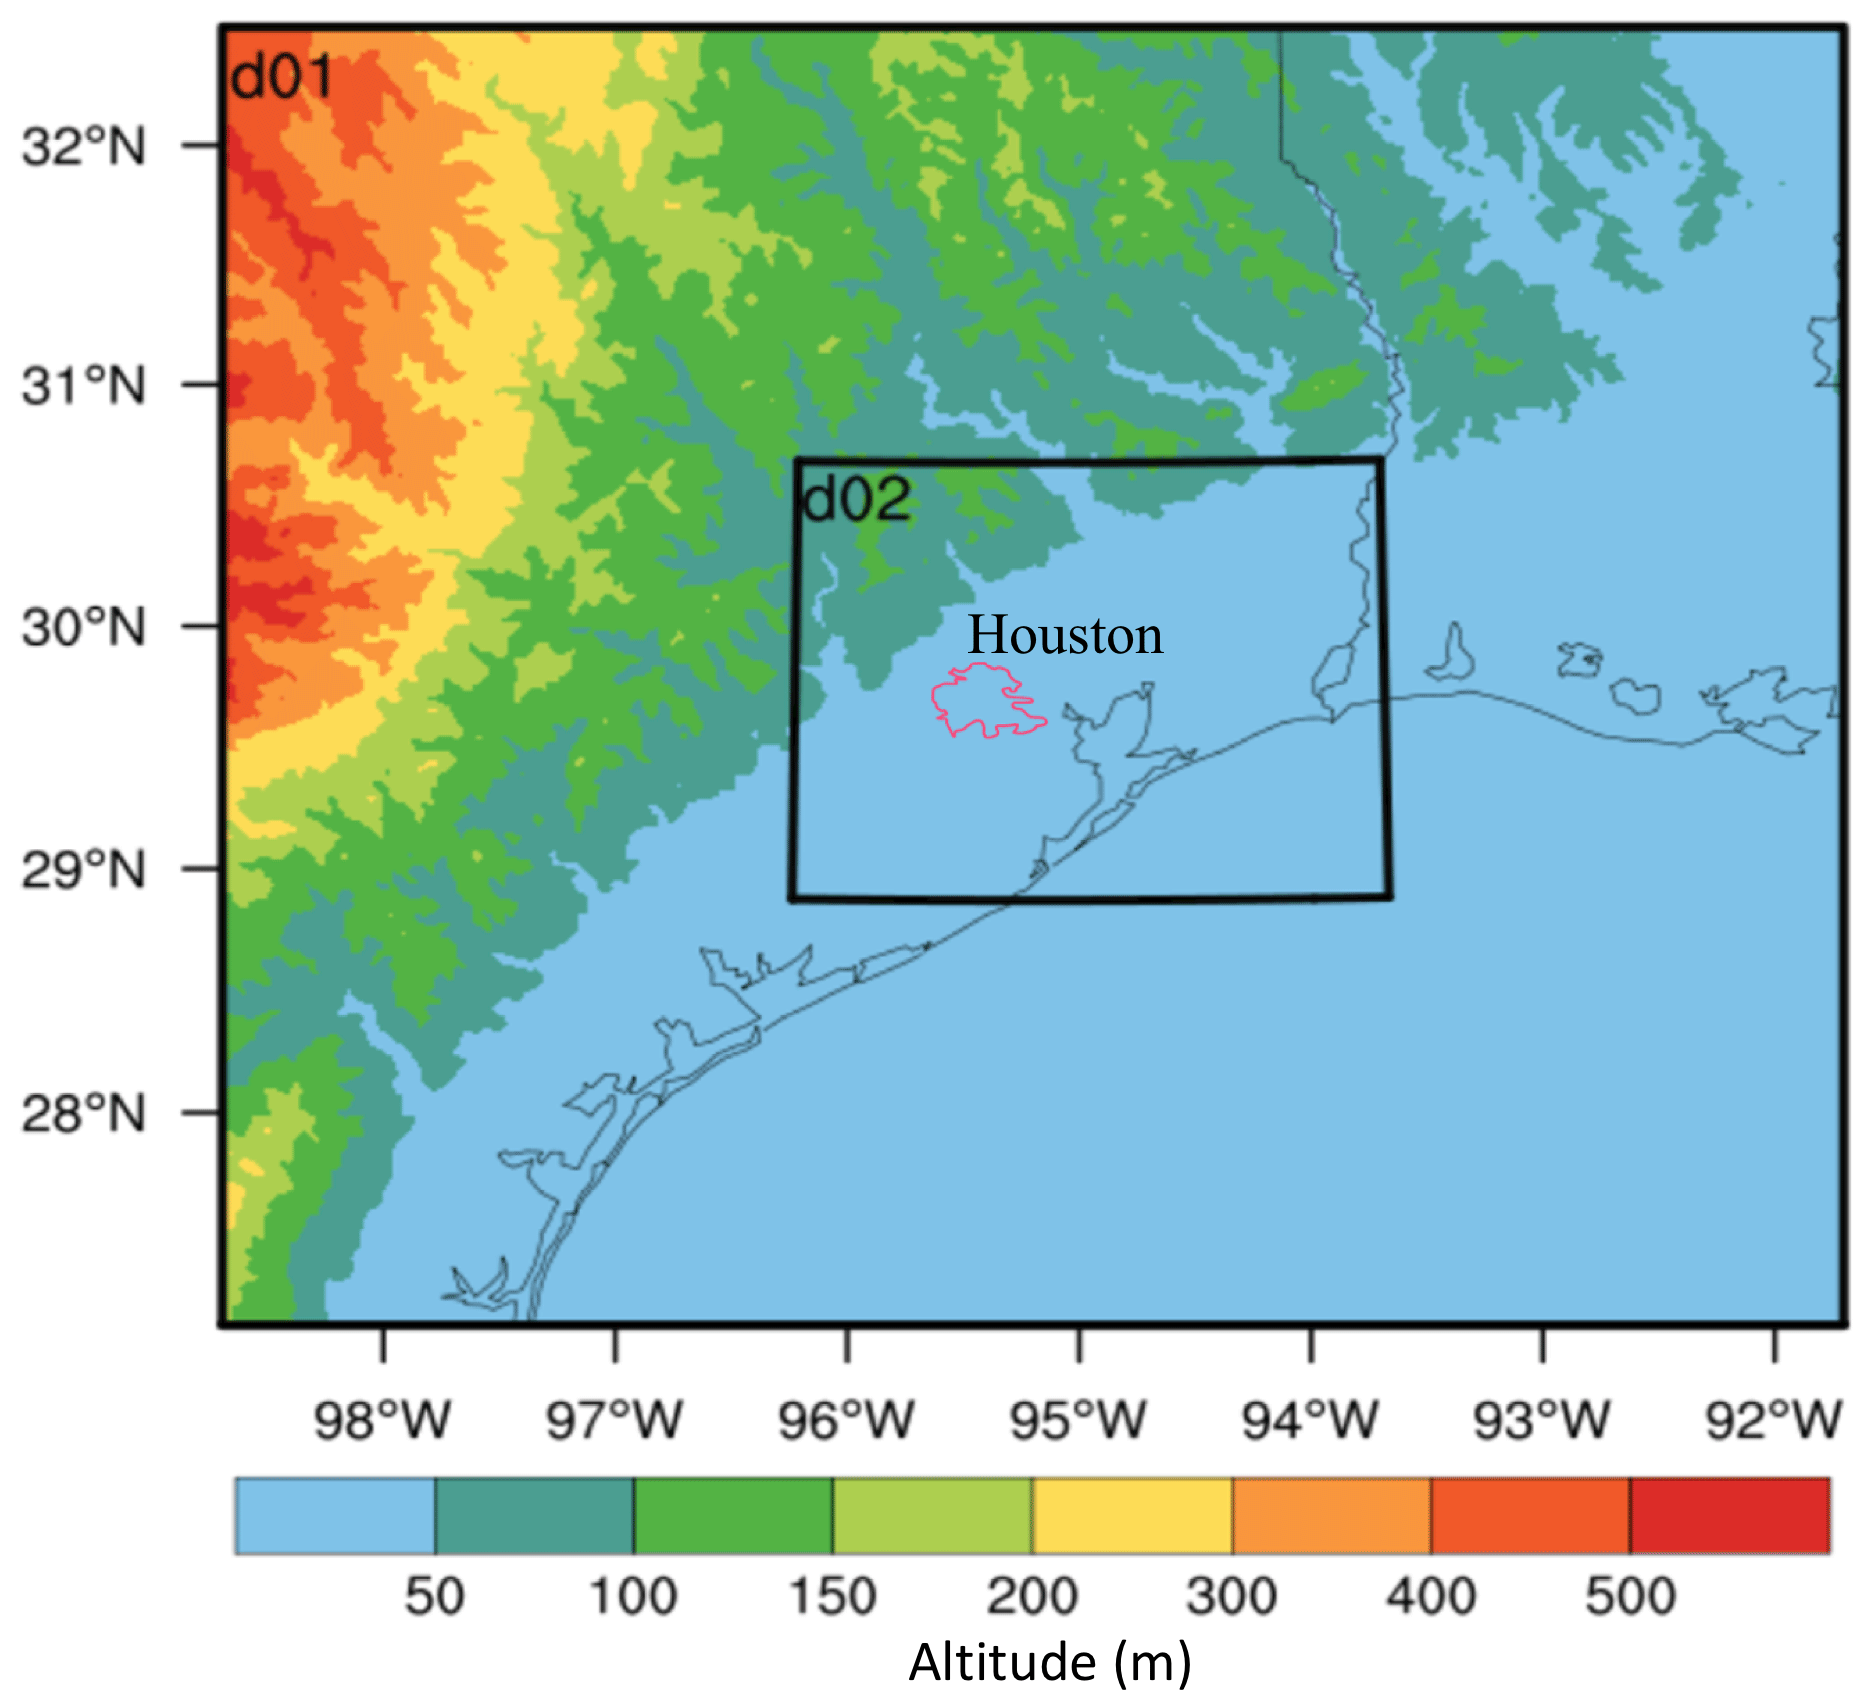
Figure 2The model domain setup. Domain 1 (d01) and Domain 2 (d02) are marked with black boxes. Terrain heights (meters) are in color contours. The Houston urban area is denoted by a pink contoured line.
For all simulations over both domains, the anthropogenic emission was from NEI-2011 emissions. The biogenic emission came from the Model of Emissions of Gases and Aerosols from Nature (MEGAN) product (Guenther et al., 2006). The biomass burning emission was from the Fire Inventory from NCAR (FINN) model (Wiedinmyer et al., 2011).
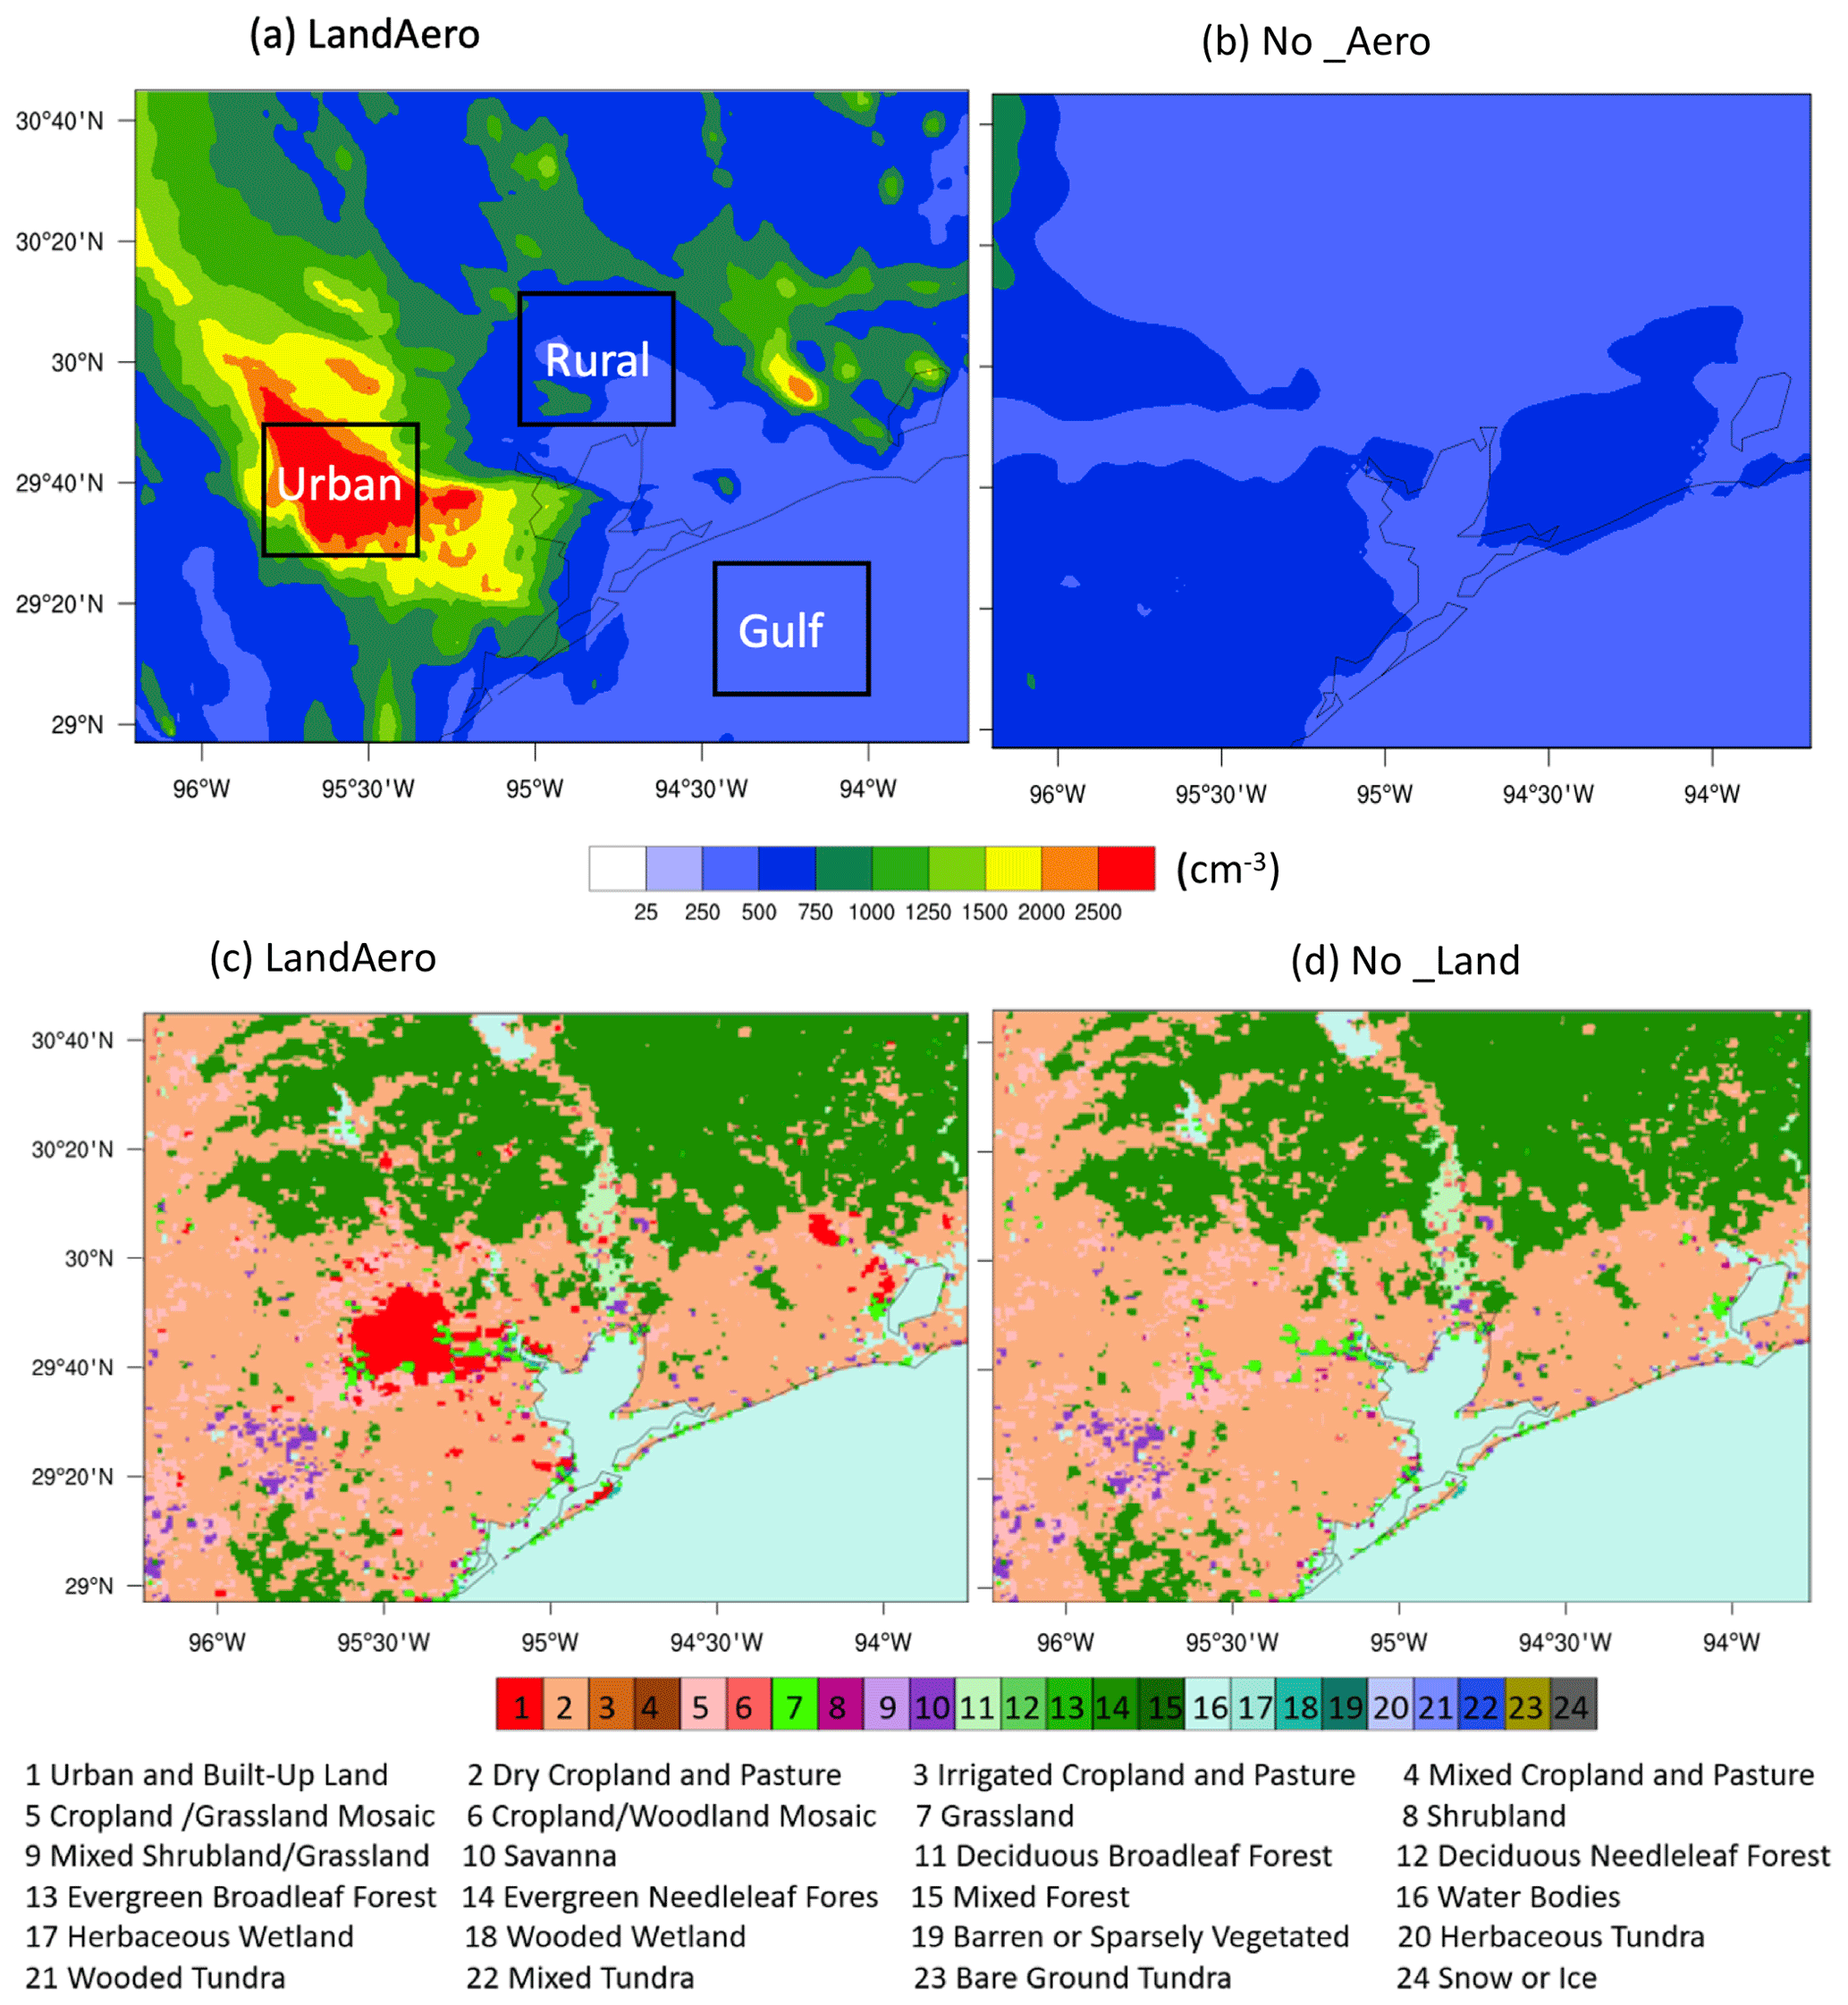
Figure 3Aerosol number concentration (cm−3) from (a) LandAero (with anthropogenic emission) and (b) No_Aero (with anthropogenic emission turned off) at 12:00 UTC 19 June 2013 (6 h before the convection initiation) and land cover types in (c) LandAero and (d) No_Land.
The baseline simulation over Domain 2 uses the initial and boundary chemical and aerosol conditions from the Domain 1 simulation with anthropogenic emissions turned on. This simulation uses all available emissions as mentioned above, including anthropogenic emissions. It is the same simulation as “SBM_anth” in Zhang et al. (2020). Here we renamed it “LandAero”, in which the effects of urban land and anthropogenic aerosols are considered (Fig. 3a, c). Based on LandAero, sensitivity tests are conducted to investigate the combined and individual effects of urban land and anthropogenic aerosols. No_Aero is the simulation based on LandAero, except that anthropogenic emissions are turned off and the initial and boundary chemical and aerosol conditions are from the Domain 1 simulation without anthropogenic aerosols considered (Fig. 3b). No_Land is also based on LandAero, except that the Houston urban land is replaced by the surrounding cropland and pasture (Fig. 3d). The aerosols used in No_Land include the anthropogenic sources (Fig. 3a), which is analogous to the scenario of downwind a big city (i.e., rural area with pollution particles transported from the city). We also run a simulation with both the urban land cover replaced by the surrounding cropland and the anthropogenic aerosols excluded (Fig. 3b, d), which is referred to as “No_LandAero”. That is, both effects of urban land and anthropogenic aerosol are not considered in this simulation. By comparing LandAero with No_LandAero, the joint effect of urban land and anthropogenic aerosols can be obtained. The individual urban land and anthropogenic aerosol effects can be obtained by comparing LandAero with No_Land and LandAero with No_Aero, respectively.
The simulated aerosol and CCN properties are evaluated with observations in Zhang et al. (2020), which shows that the model captures aerosol mass and CCN number concentrations reasonably well. Aerosol number concentration is not evaluated because the measurements are not available at the Texas Commission for Environmental Quality (TCEQ) sites. A snapshot of simulated aerosol number concentrations in LandAero and No_Aero at the time of 6 h before the initiation of the Houston cell is shown in Fig. 3a–b. Houston anthropogenic emissions produce about 10 times more aerosol concentrations over the Houston area than those in the Gulf of Mexico and ∼ 5 times than those in the rural area shown in Fig. 3a. The background aerosol concentrations are relatively low (around 250 cm−3) in this region. Aerosols over the Houston urban area are mainly contributed by organic aerosols, which are highly related to the oil refinery industry and ship channel emissions. The aerosol compositions are mainly sulfate in the rural area and sea salt over the Gulf of Mexico in our simulations. Therefore, aerosol properties are extremely heterogenous in this region. Fig. 4 shows the mean aerosol size distributions from the three areas as marked up in Fig. 3a in LandAero. In the Houston area, the majority of aerosols (75 %) have a size (diameter) smaller than 100 nm, and 51 % of the aerosols are ultrafine aerosol particles (smaller than 60 nm). Those small particles are substantially reduced in the rural area and the Gulf of Mexico (Fig. 4).
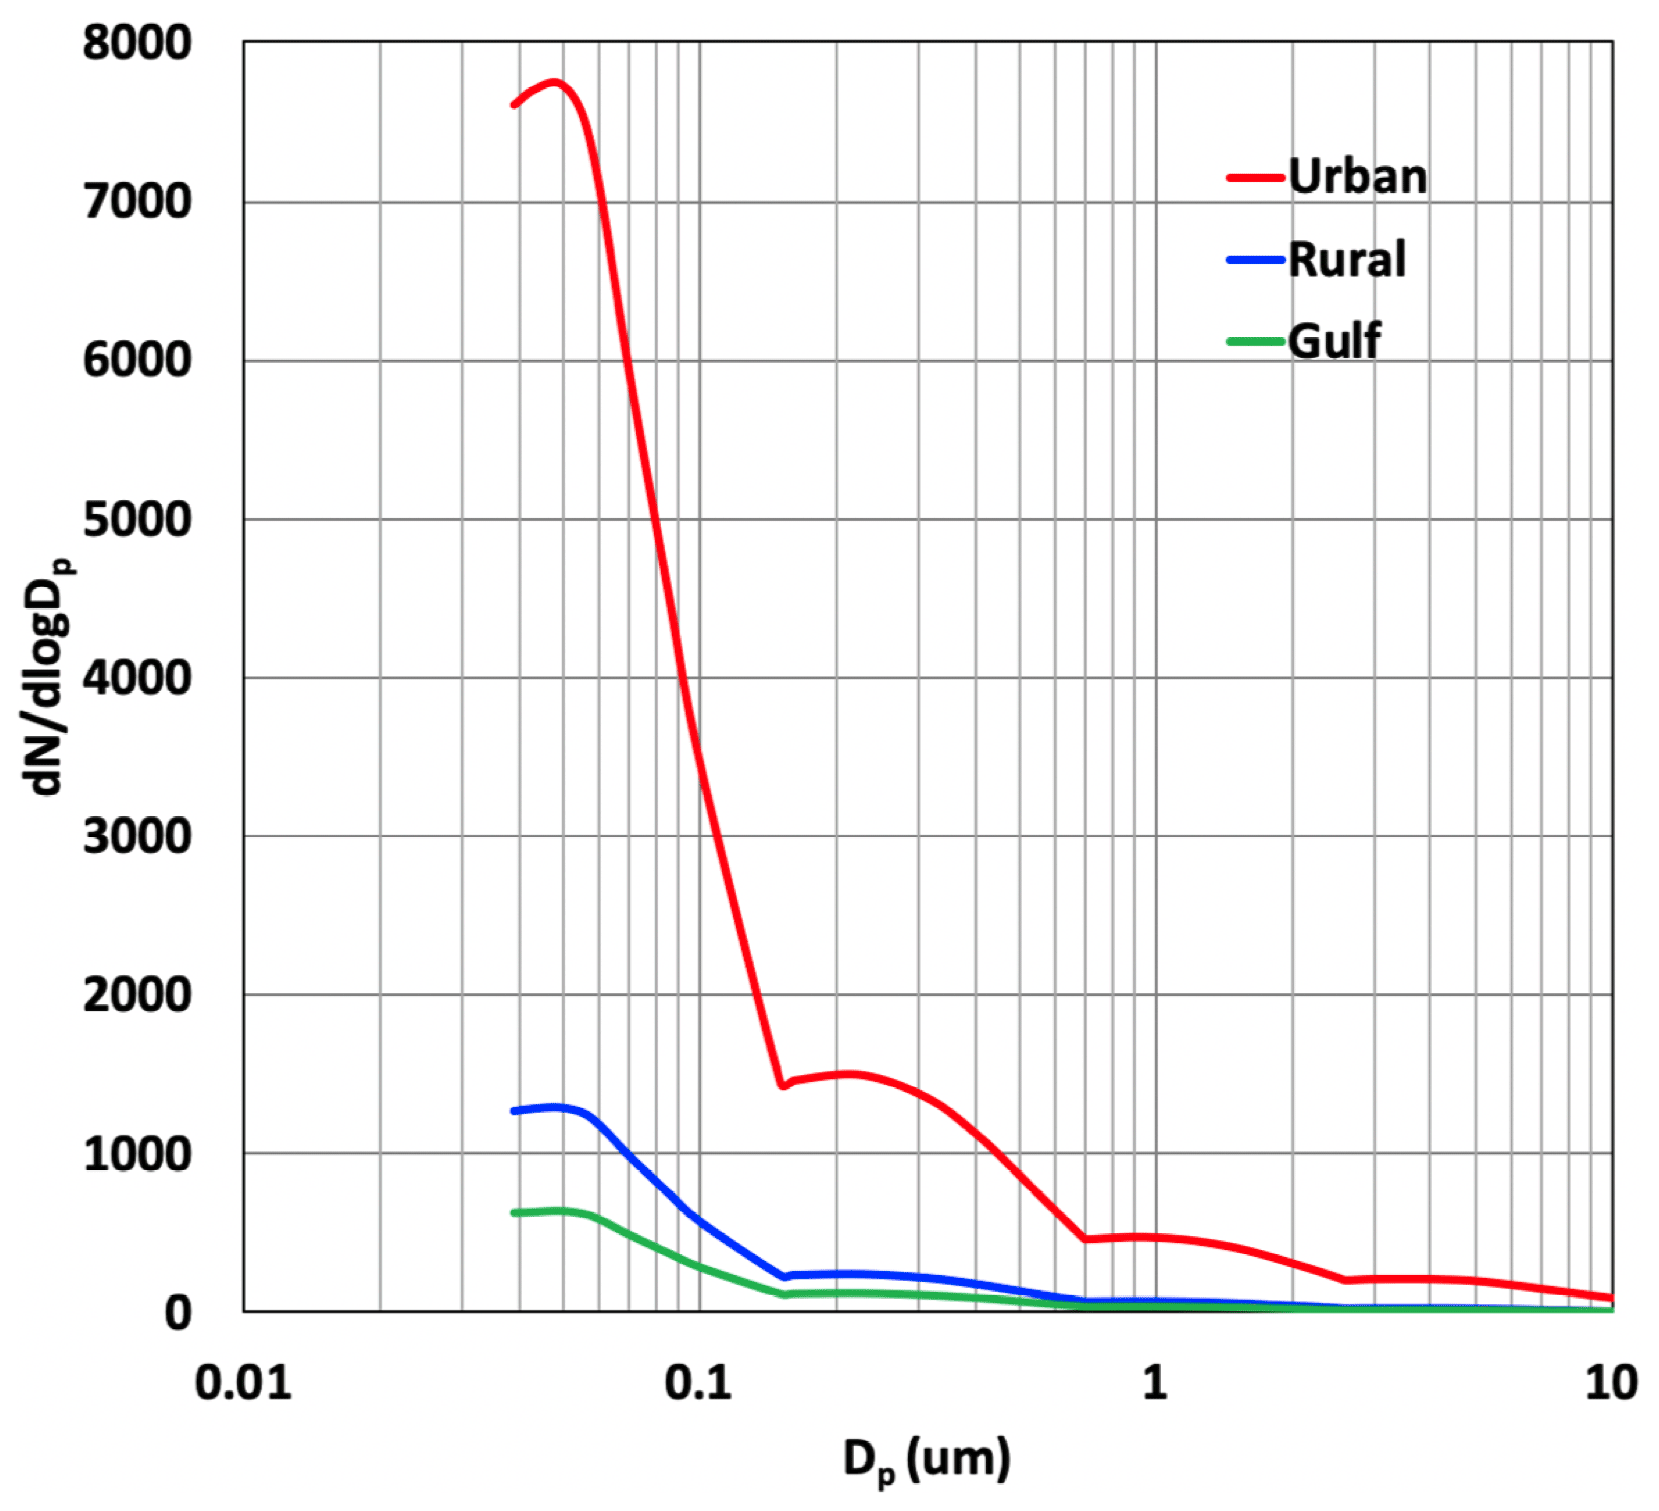
Figure 4Aerosol size distribution over “Urban”, “Rural”, and the Gulf of Mexico as marked by three black boxes in Fig. 3a from LandAero at 12:00 UTC 19 June 2016.

Figure 5Differences of (a) 2 m temperature (∘C) and (b) surface sensible heat flux (W m−2) between LandAero and No_Land at 16:00 UTC 19 June 2013. Line UO is where the cross section of sea-breeze circulation is examined.
To see how the land cover type change affects temperature, Fig. 5 shows the differences in 2 m temperature and surface sensible heat fluxes between LandAero and No_Land at 16:00 UTC when the sea breeze begins to show differences. The urban land increases near-surface temperature over Houston and its downwind area by about 1–2 ∘C (Fig. 5a), corresponding to the increase in surface sensible heat fluxes (Fig. 5b). More information about the temporal evolution and vertical distribution of the urban heating will be discussed in the result section.
2.3 Analysis method
To quantify the convective cell properties occurring over Houston, we employ the Multi-Cell Identification and Tracking (MCIT) algorithm from Hu et al. (2019a) to track the convective storms. MCIT is a watershed-based algorithm and shows better tracking capabilities compared with traditional centroid-based tracking algorithms. MCIT identifies cells by local maxima of vertically integrated liquid (VIL) based on watershed principles and performs tracking of multiple cells based on maximum common VIL between the consecutive scans. In this way, convective storm life cycles from initiation to dissipation can be better tracked than the traditional methods as detailed in Hu et al. (2019a). VIL was shown to be an effective indicator of strong precipitation cells (Greene and Clark, 1972; Hu et al., 2019a).
To apply the algorithm to both model simulation and NEXRAD observations consistently in this study, we calculated liquid water path (LWP), a variable of model output accounting for the column-integrated liquid to replace VIL in MCIT for model simulation. We track local maxima of LWP by identifying the two cells in consecutive radar scans that have a maximum common LWP. A cell is identified and tracked when the local maxima LWP exceeds 50 g m−2. This value is selected because it allows us to start recognizing the deep convective cell by filtering a lot of shallow clouds surrounding it. The storm area of the tracked cell is defined as the grid area with LWP > 50 g m−2.
To examine sea-breeze circulation over the Houston region, the sea-breeze wind intensity at a specific time is calculated by averaging the horizontal wind speeds below 1 km altitude along the black line UO in Fig. 5a. The cross section of the winds along this line is also analyzed in the result section.
3.1 Radar reflectivity, precipitation, and convective intensity
We first discuss the evaluation of the baseline simulation LandAero. The simulation is comprehensively evaluated in Zhang et al. (2020). Here the comparisons with observed radar reflectivity and precipitation are included. The composite radar reflectivity at the time of the peak reflectivity of the storm in Houston shows that LandAero captures the convective cell in Houston, with the maximal radar reflectivity of 58 dBZ, very close to the observed 57 dBZ (Fig. 6a, b). The modeled convective cell in LandAero has a larger size compared with the radar observations. The contoured frequency-by-altitude diagram (CFAD) over the major storm period (18:00 UTC 19 June to 00:00 UTC 20 June) shows that the model overestimates the frequencies of moderate reflectivity (i.e., 15–35 dBZ) over the entire vertical profile (Fig. 7a–b) but captures the occurrence frequencies of high reflectivity (larger than 45 dBZ) reasonably well. At the upper levels (> 10 km), the model underestimates the large reflectivities (> 35 dBZ), suggesting the model does not get enough snow. The magnitude of the surface rain rate averaged over the study area defined by the red box in Fig. 6 from LandAero agrees with the retrieved value from the NEXRAD reflectivity, with a peak time about 40 min earlier than the observation (Fig. 8a). The probability density function (PDF) of rain rates shows that LandAero reproduces the occurrence frequencies of low and mediate rain rates well (left two columns in Fig. 8b) and overestimates the occurrence frequencies of high rain rates (> 10 mm h−1; right two columns in Fig. 8b). The accumulated precipitation over the time period shown in Fig. 8a is about 7.2 mm from LandAero and 5.5 mm from observations, with a model overestimation of ∼ 30 % because of the overestimation of occurrences of high rain rates and a longer precipitation period.
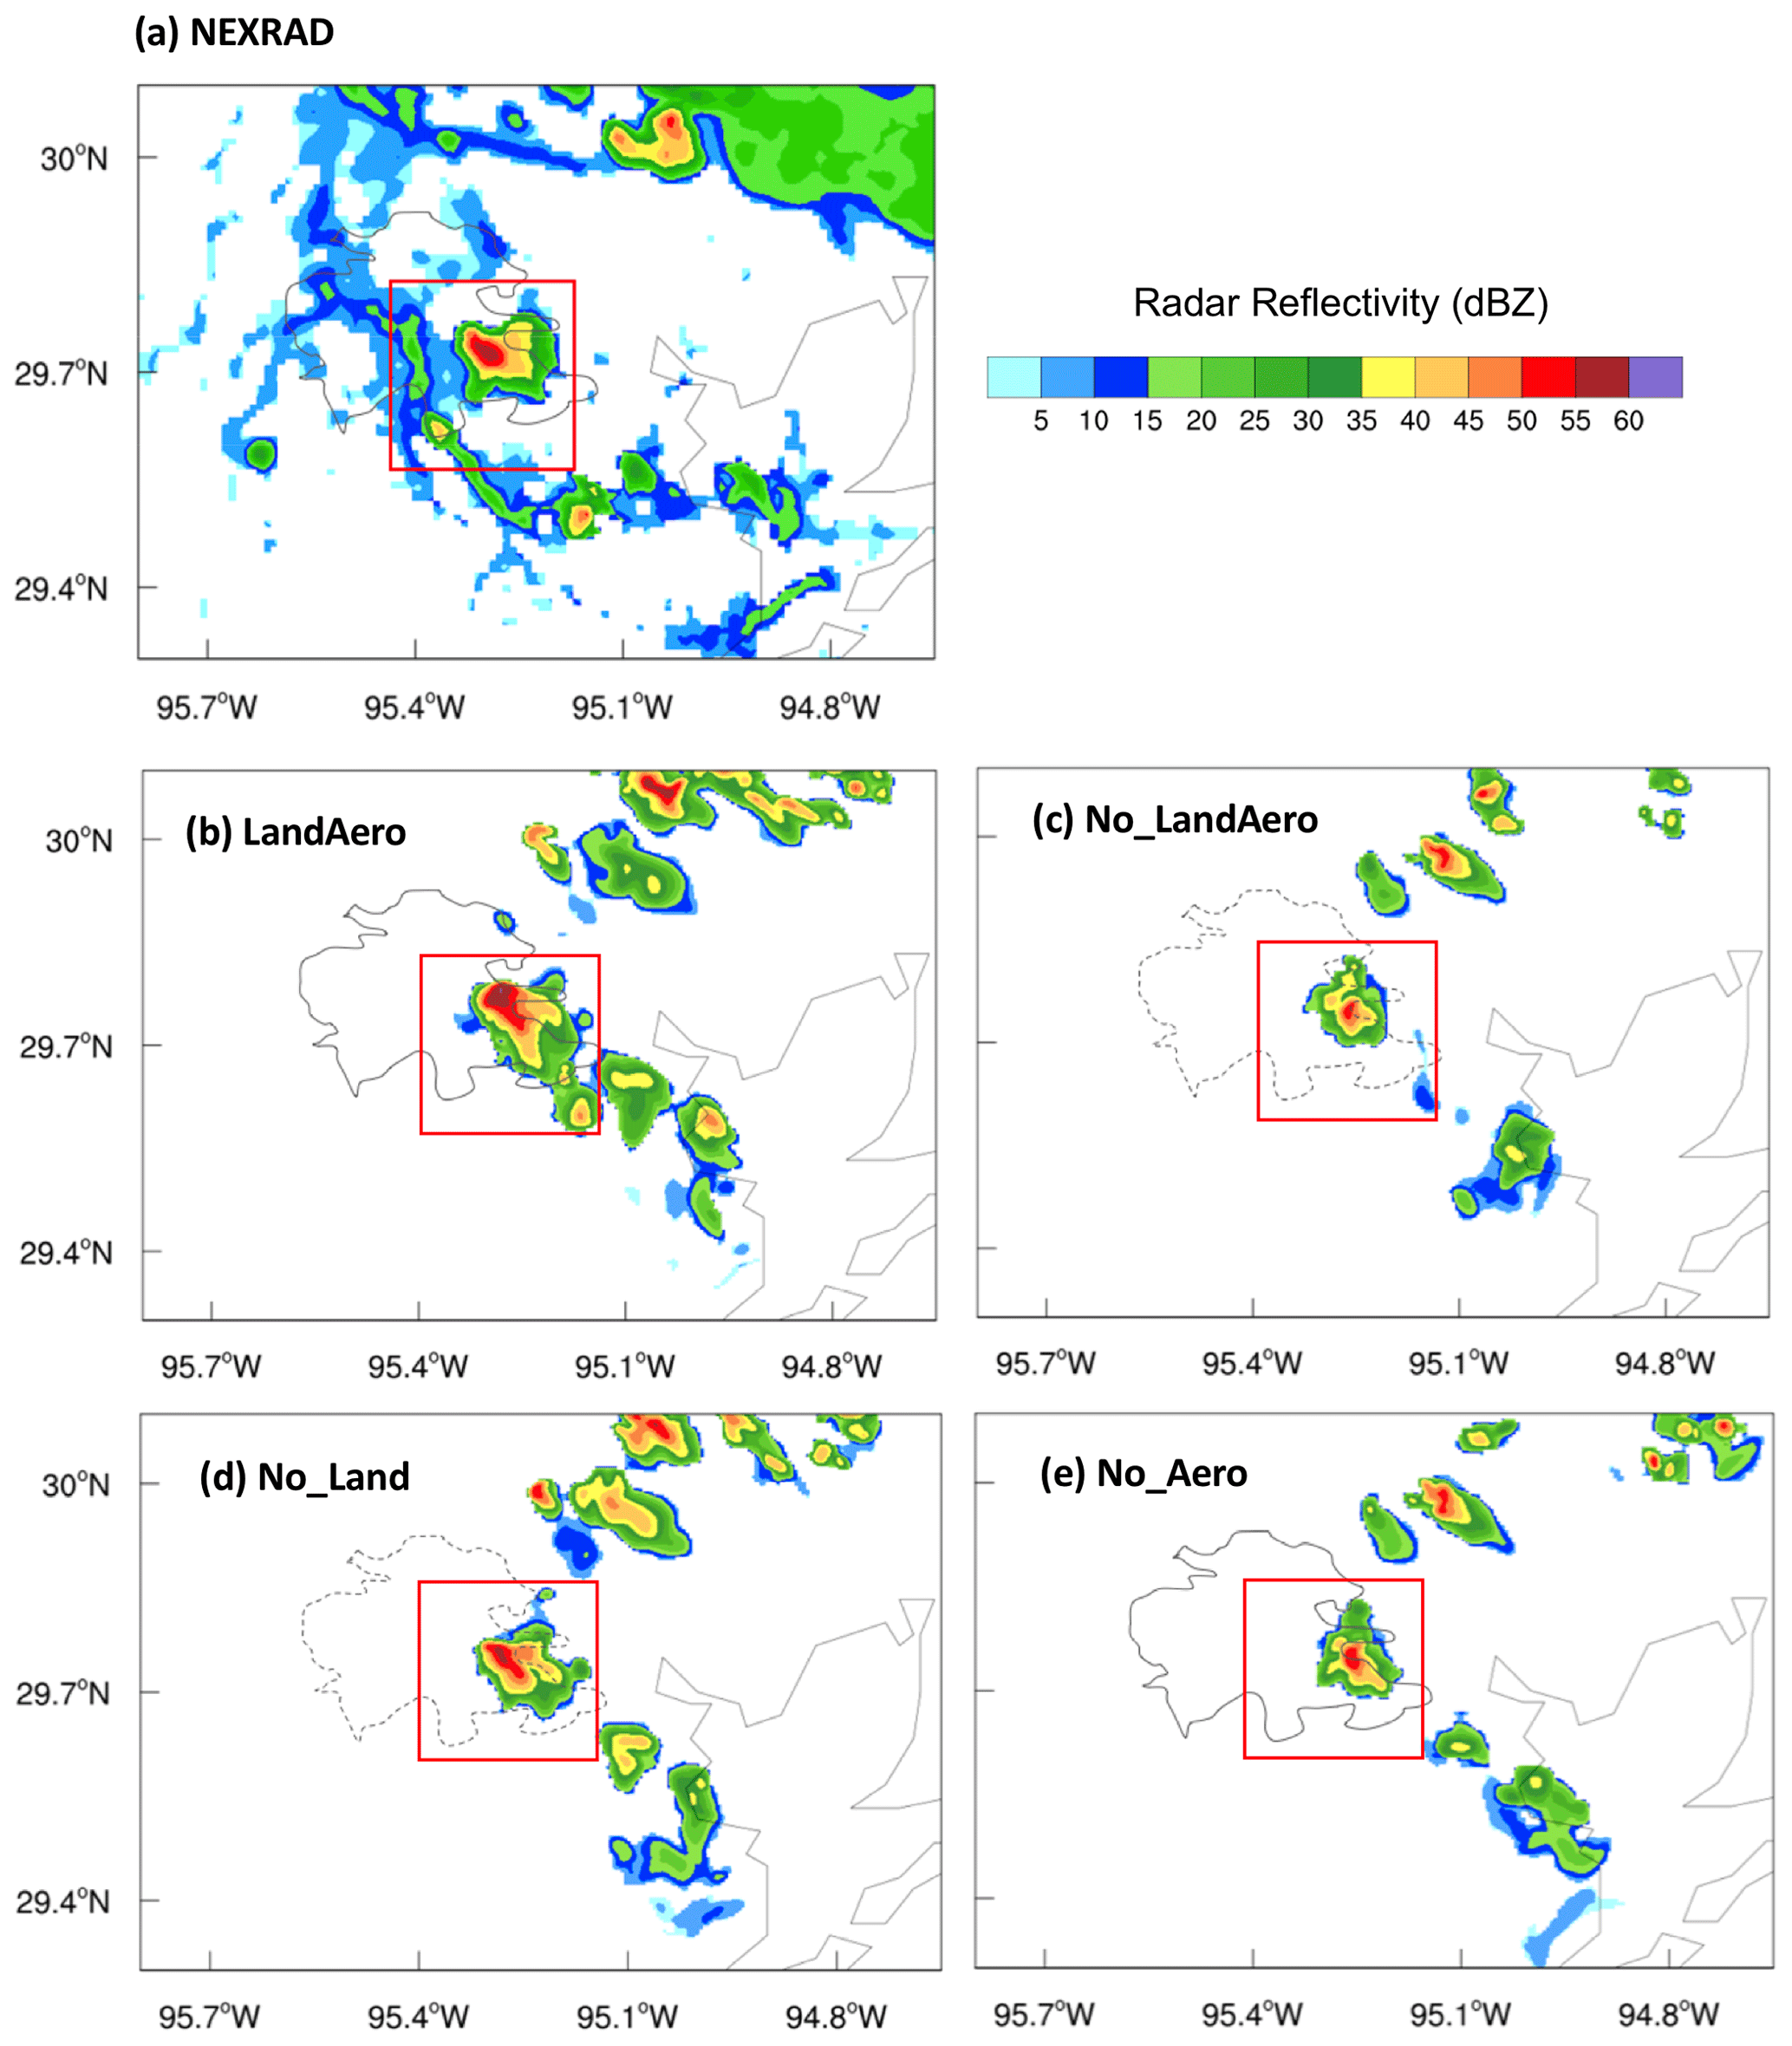
Figure 6Composite reflectivity (dBZ) from (a) NEXRAD (22:17 UTC), (b) LandAero (21:40 UTC), (c) No_LandAero (21:20 UTC), (d) No_Land (21:35 UTC), and (e) No_Aero (21:25 UTC) at the time when the maximal reflectivity of the storm in Houston is reached. Houston is marked as dark grey solid contour based on the land cover data shown in Fig. 3c. The red box is the study area for the Houston convective cell.
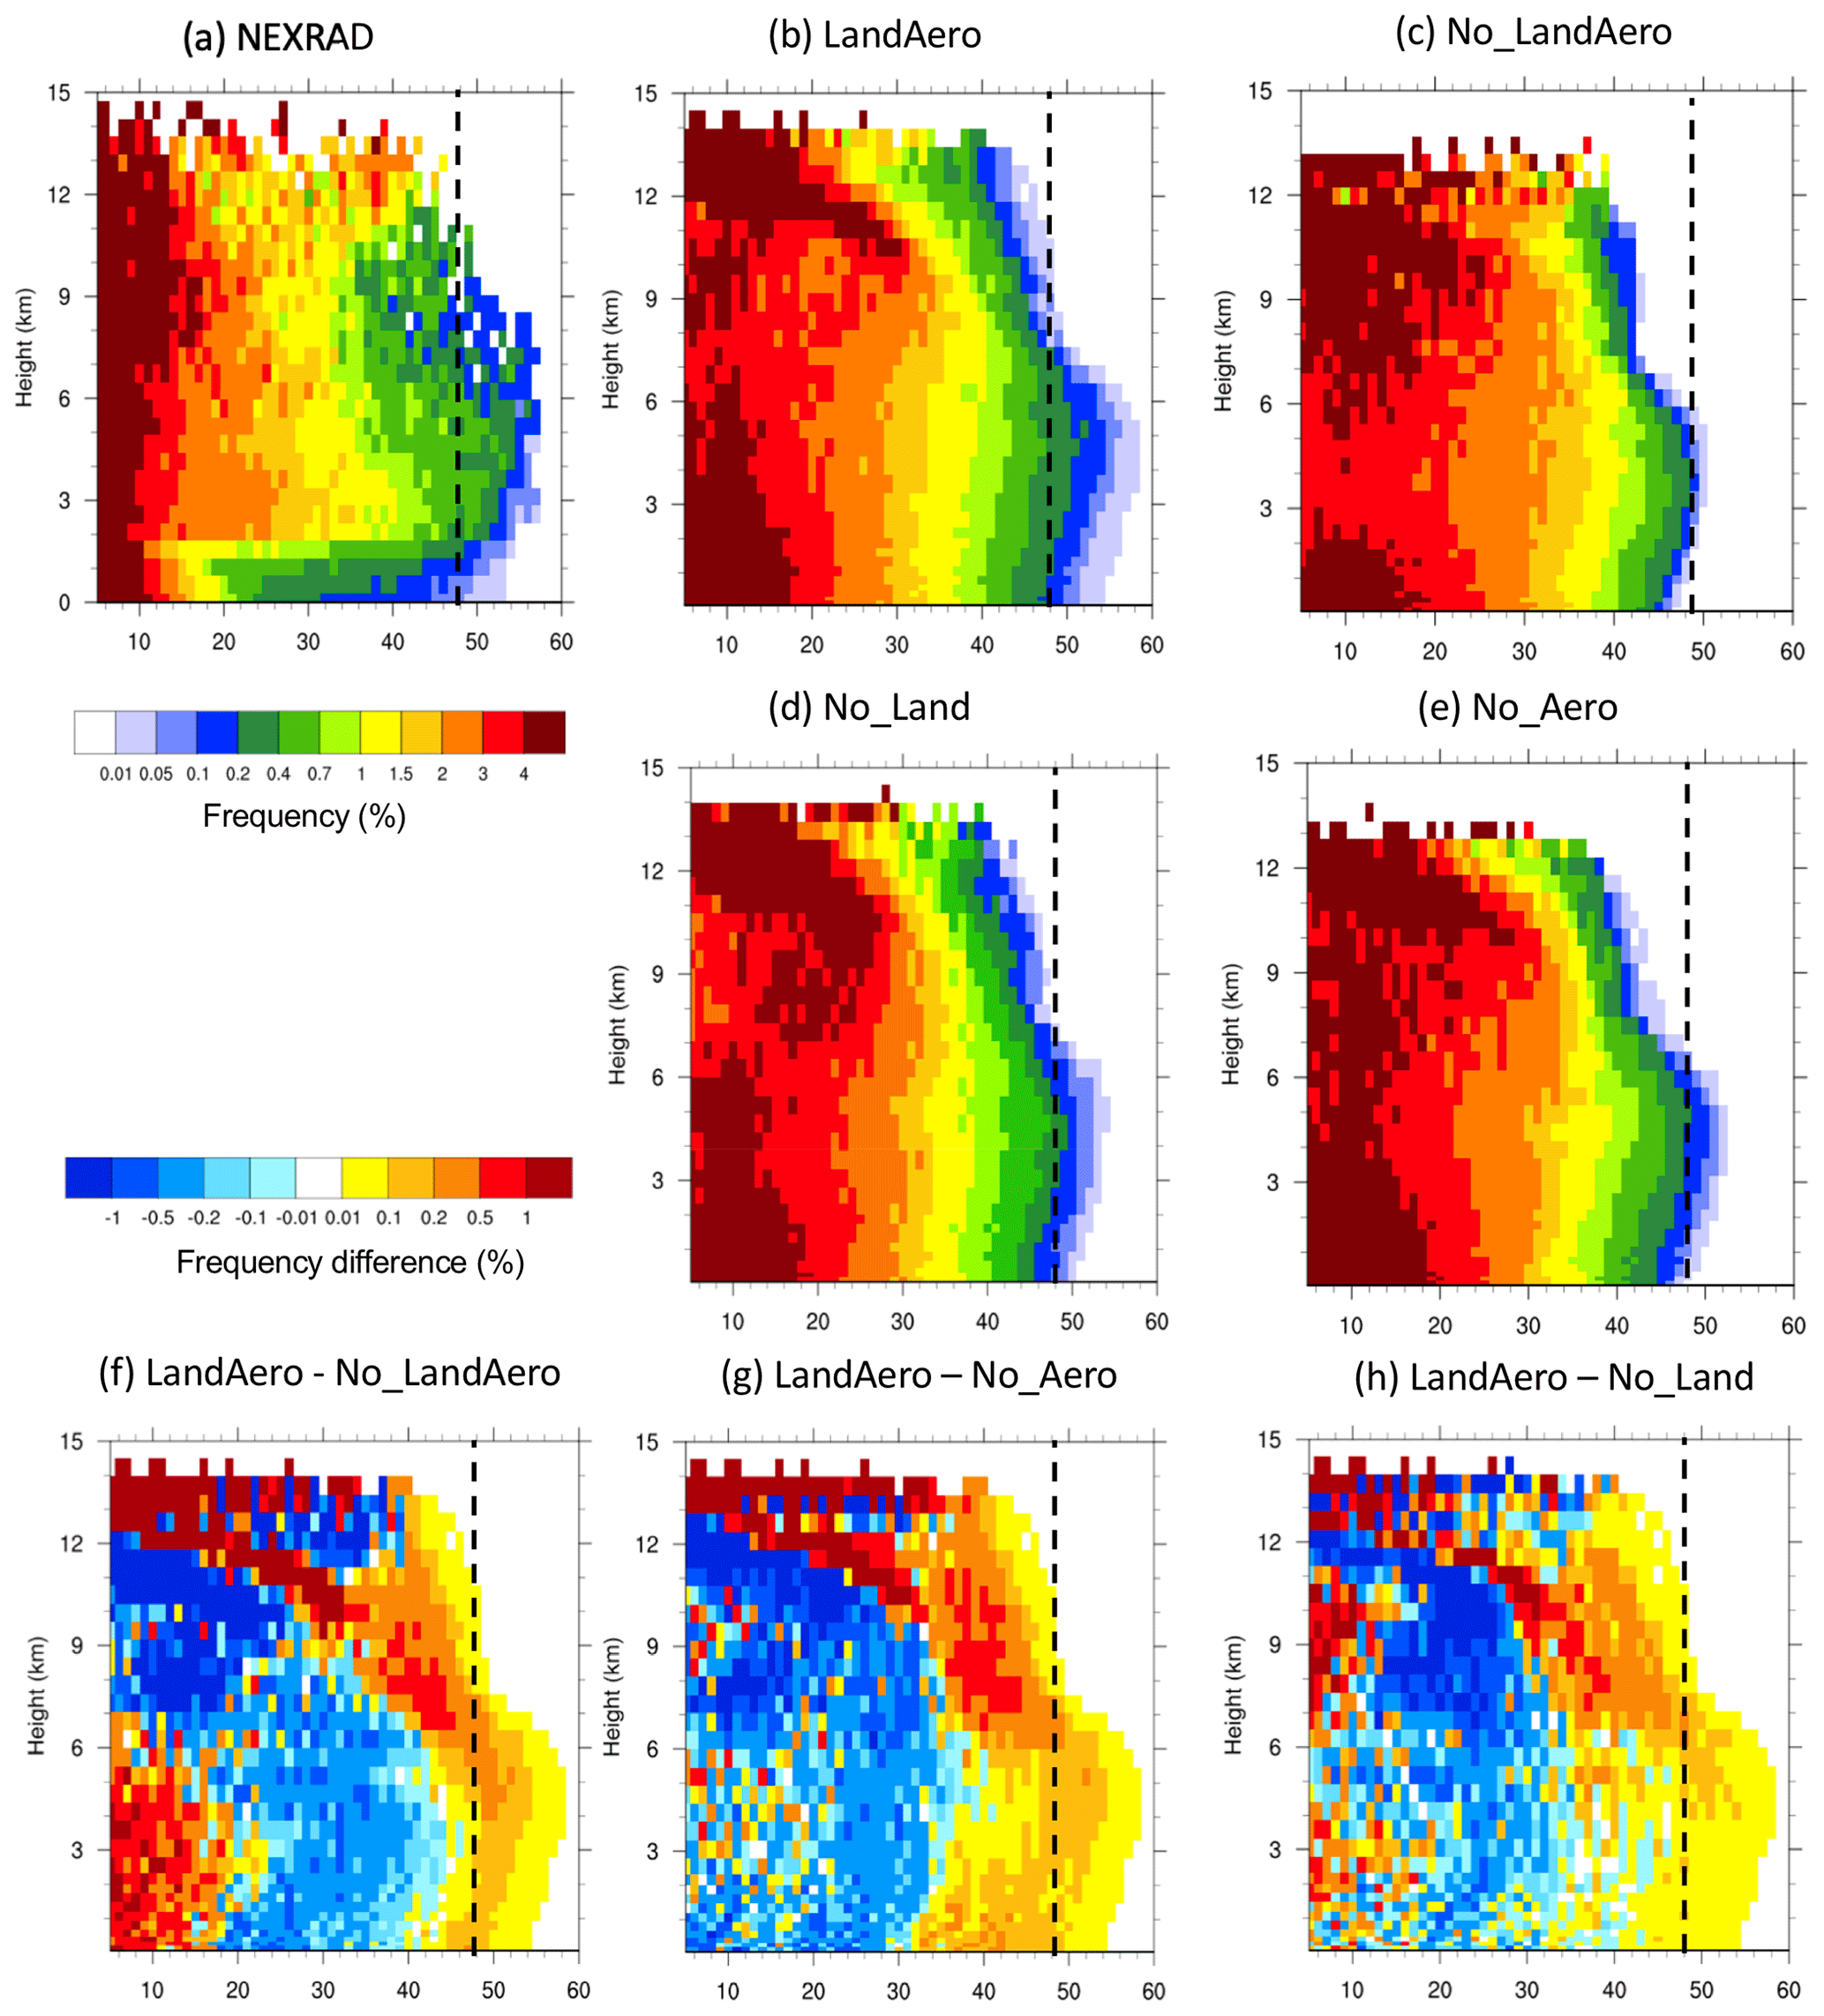
Figure 7Contoured frequency-by-altitude diagram (CFAD; %) of reflectivity for values larger than 0 dBZ from (a) NEXRAD, (b) LandAero, (c) No_LandAero, (d) No_Land, and (e) No_Aero. Panels (f)–(h) present the differences of CFAD (%) of reflectivity for (f) LandAero – No_LandAero, (g) LandAero – No_Aero, and (h) LandAero – No_Land. Data are from the study area (red box in Fig. 6) over 18:00 UTC 19 June to 00:00 UTC 20 June. The vertical dashed line marks the value for the reflectivity of 48 dBZ.
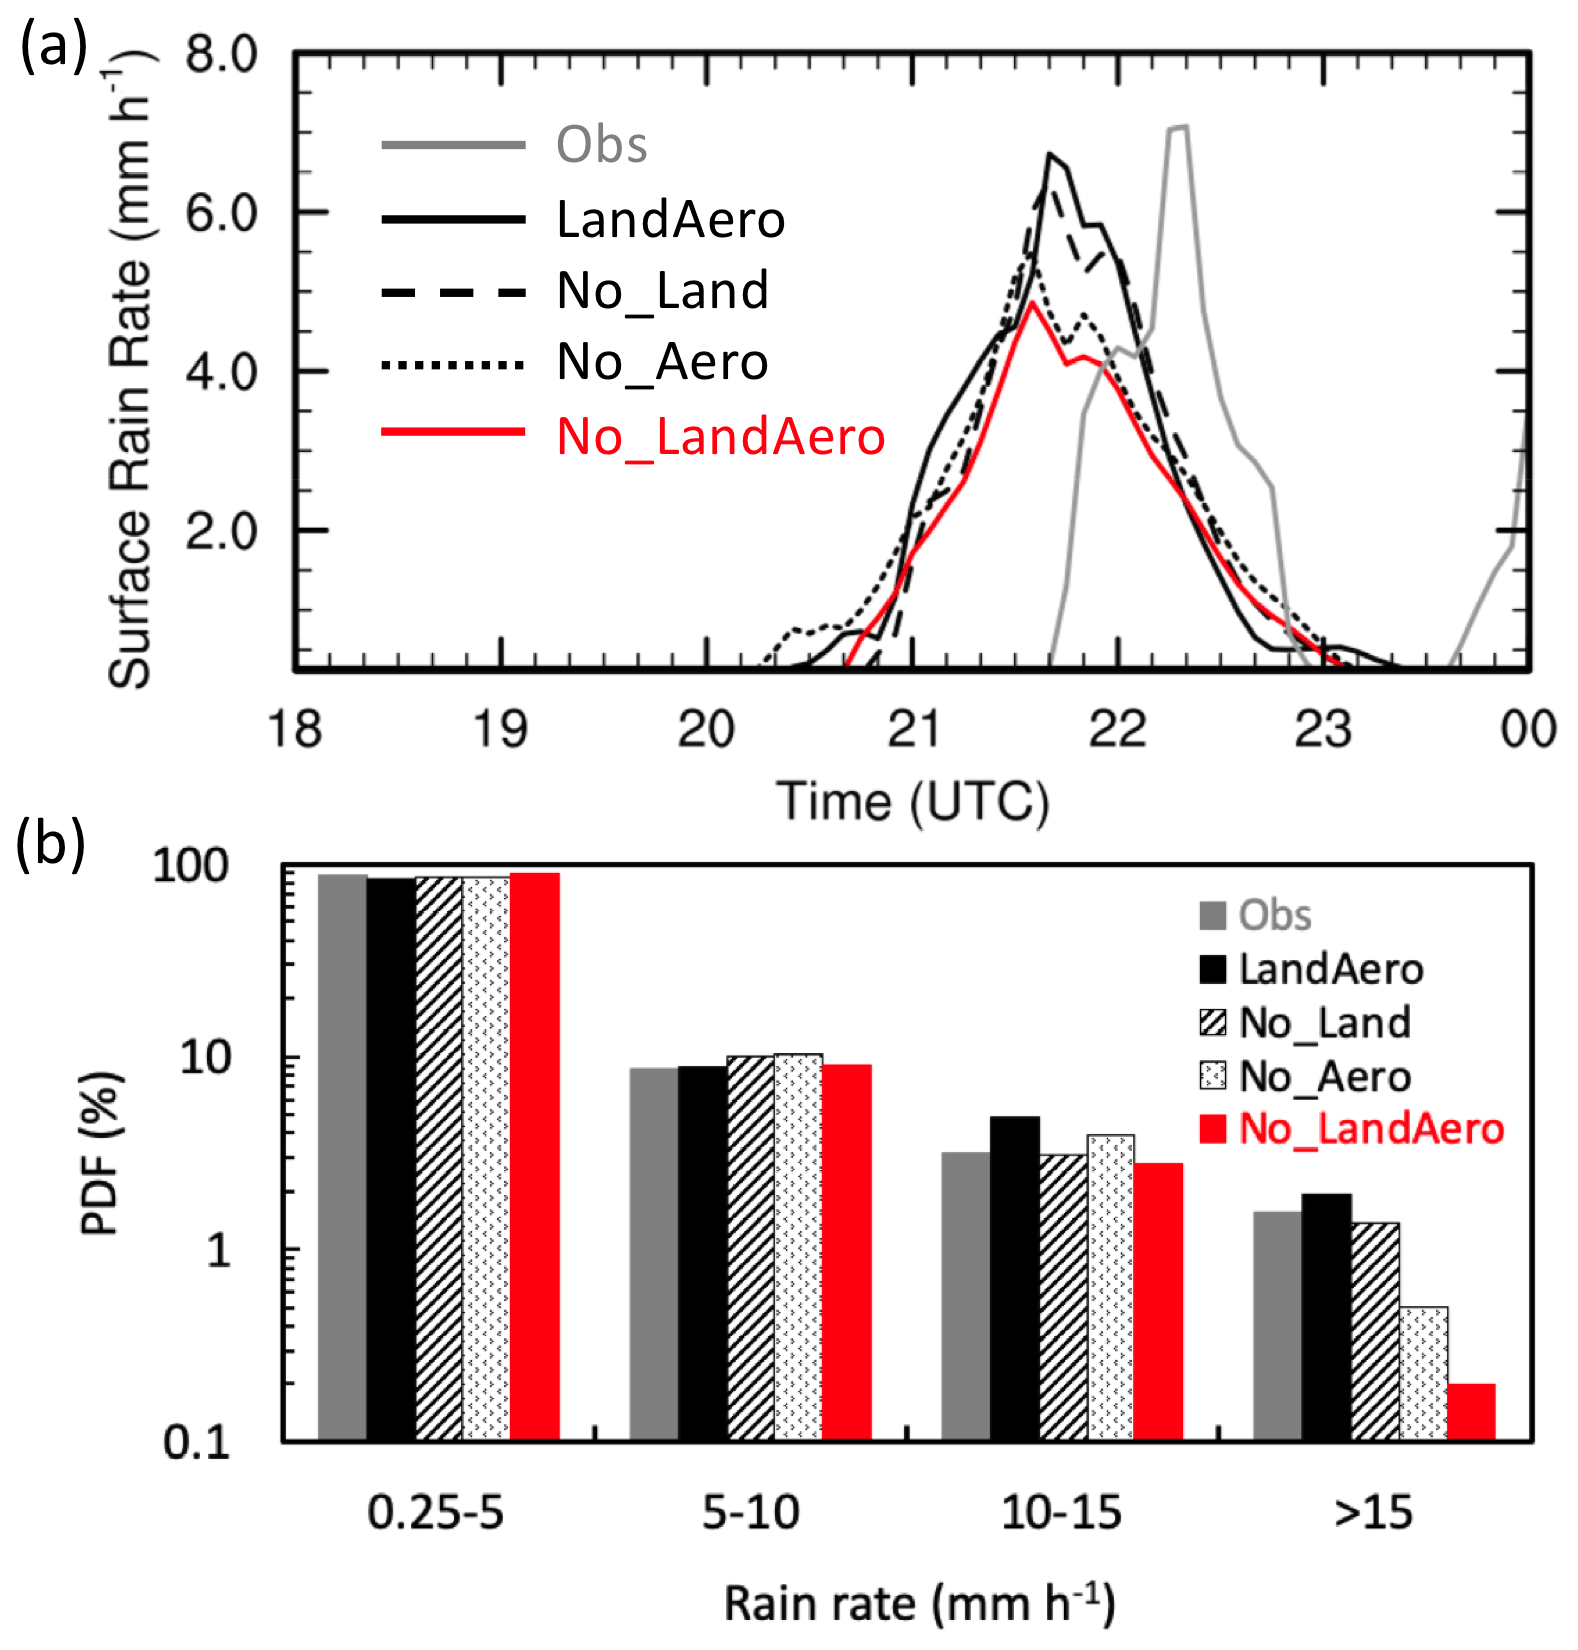
Figure 8(a) Time series of surface rain rate (mm h−1) averaged over the values larger than 0.25 mm h−1 for the Houston convective cell (red box in Fig. 6) and (b) PDFs (%) of rain rates (> 0.25 mm h−1) from 18:00 UTC 19 June to 00:00 UTC 20 June 2013, from observations, LandAero, No_LandAero, No_Land, and No_ Aero. The observation is the NEXRAD retrieved rain rate. Both observation and model data are in every 5 min frequency.
Without Houston urbanization (i.e., both effects of urban land and anthropogenic aerosol are removed), the Houston convective cell is a lot smaller in the area and has reflectivity values of ∼ 7 dBZ lower in general compared with LandAero and the NEXRAD observation (Fig. 6c vs. 5a–b). There is almost no radar reflectivity larger than 50 dBZ in No_LandAero (Fig. 7c), in contrast with the significant occurrences of reflectivity larger than 50 dBZ in LandAero and the NEXRAD observation. Those differences are more clearly shown in Fig. 7f. The peak surface rain rate in No_LandAero is reduced by ∼ 45 % compared with LandAero and observations (Fig. 8a; black vs. red line), with the occurrences of large rain rates (> 15 mm h−1) reduced by nearly an order of magnitude (Fig. 8b). In terms of updraft intensity, the CFAD plots in Fig. 9a–b show that there is extremely low or no occurrence for updraft velocity larger than 15 m s−1 in No_LandAero, while the occurrences of 30 m s−1 still exist in LandAero. There are fewer occurrences of weak updraft velocities and more occurrences of relatively strong updraft velocities over the vertical profile (Fig. 9e). These results indicate the urbanization (i.e., the joint urban land and aerosol effects) drastically enhances the convective intensity and precipitation.
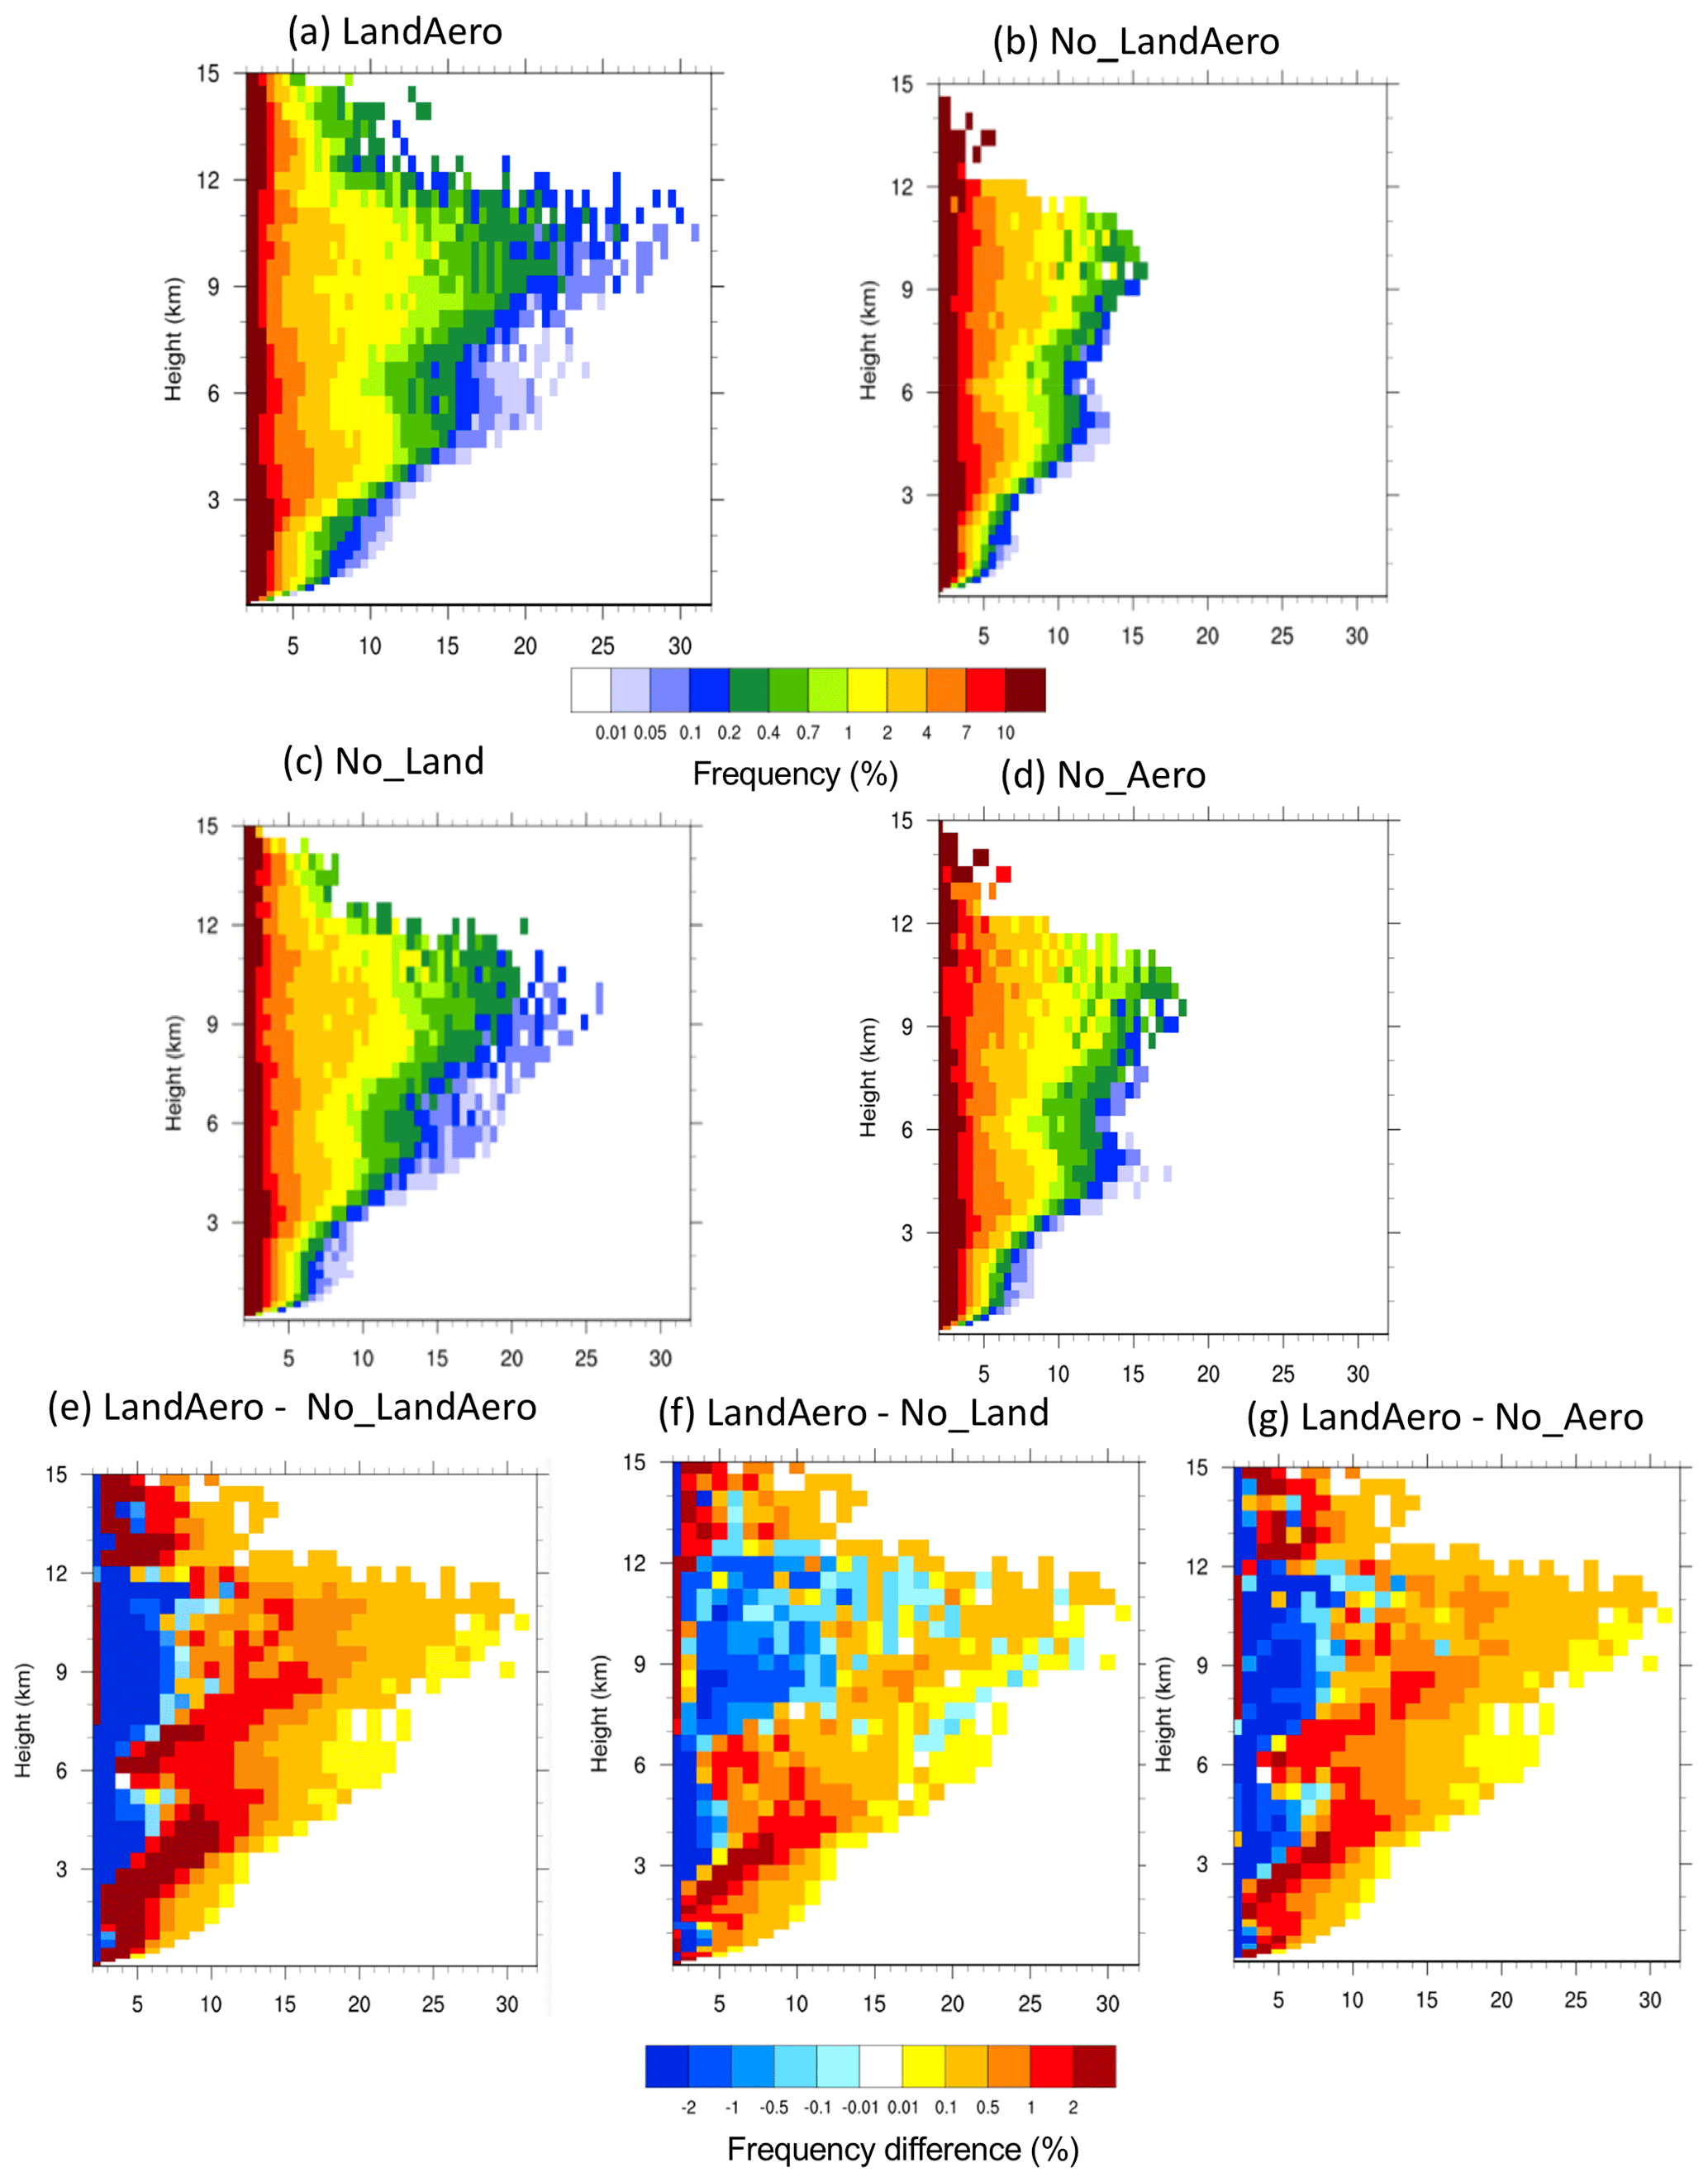
Figure 9CFAD (%) of updraft velocity for values larger than 2 m s−1 from (a) LandAero, (b) LandAero – No_LandAero, (c) LandAero – No_Land, and (d) LandAero – No_Aero over the study area as shown in the red box in Fig. 6 during the strong convection periods (60 min duration with 30 min before and after the strongest convection). Panels (e)–(g) present the differences of CFAD (%) of reflectivity for (e) LandAero – No_LandAero, (f) LandAero – No_Land, and (g) LandAero – No_Aero.
Now let us look at the individual effect from the Houston urban land and anthropogenic aerosols. Fig. 6 shows that the urban land effect enlarges the storm area (Fig. 6d vs. 5b), but the aerosol effect is more significant (Fig. 6e vs. 5b). The CFAD of radar reflectivity in Fig. 7 also shows that changes in the PDF by the urban land effect are notably smaller than the anthropogenic aerosol effect. For the occurrence frequencies of high reflectivity larger than 48 dBZ, the change is mainly from the anthropogenic aerosol effect (Fig. 7f–h).
For precipitation, we do not see an important effect of urban land on the magnitudes of precipitation rate and the PDF of rain rate (Fig. 8a–b; No_Land vs. LandAero). The accumulated rain is about 6.9 mm, which is also not much different from 7.2 mm in LandAero. By contrast, the anthropogenic aerosol effect increases the peak rate by ∼ 30 %. The frequency of large rain rates (> 15 mm h−1) is increased by about 5 times (Fig. 8b; No_Aero vs. LandAero). The joint effect of both urban land and aerosol increases the accumulated rain by ∼ 26 %, the peak rain rates by 45 %, and the frequency of large rain rates by an order of magnitude (from No_LandAero to LandAero), suggesting the interactions between the two factors amplify the effect on precipitation, particularly on the large rain rates. Although the Houston urban land alone does not much affect the magnitude of precipitation, the initial time of the rain is advanced by ∼ 30 min from No_Land to LandAero (Fig. 8a), indicating that the urban land effect speeds up the rain formation. The aerosol effect delays the initial and peaks rain by ∼ 10 min (from No_Aero to LandAero). This will be further discussed in Sect. 3.2 on convective evolution.
On convective intensity, the large increases in occurrence frequencies of the updraft speed greater than 10 m s−1 in the upper levels by the joint effect are mainly contributed by the anthropogenic aerosol effect (Fig. 9e, g). Below 6 km, both the urban land and aerosol effects play evident roles in increasing the occurrences of relatively large updraft speeds (Fig. 9e–g). The larger anthropogenic aerosol effect is also clearly seen from the occurrences of maximal vertical velocity: ∼ 30 m s−1 in LandAero but only ∼ 19 m s−1 in No_Aero when the anthropogenic aerosol effect is removed, whereas the value is 27 m s−1 in No_Land when the urban land effect is turned off (Fig. 9a, c–d). The large effect of anthropogenic aerosols on convective intensity supports the significant aerosol effects on large precipitation rates as shown in Fig. 8. With both effects removed (No_LandAero), there is almost a 100 % reduction for the vertical velocity greater than ∼ 15 m s−1, showing a quite strong enhancement of convective intensity as a result of urbanization, mainly through the anthropogenic aerosol effects.
3.2 Convective evolution
The urban land effect initiates surface rain about 30 min earlier as discussed above, suggesting that convective cloud development is affected when the urban land effect is considered. We examine the convective evolution for the cell over Houston using the cell-tracking method described in Sect. 2. The time evolution of the tracked cell properties is shown in Fig. 10a–b. Clearly, the urban land effect enhances the reflectivity and area for the tracked cell over the lifetime (from the black dashed line to black solid line), and it also accelerates the development to the peak reflectivity but slows down the dissipation after the peak radar reflectivity is reached (Fig. 10a–b). The anthropogenic aerosols also enhance the convective cell reflectivity and area throughout the cell life cycle (from the black dotted line to black solid line), with a much larger effect compared with the urban land effect. The anthropogenic aerosol effect does not affect the timing of peak reflectivity (dotted vs. solid black in Fig. 10a–b). The overall reflectivity and cell area properties are shown in Fig. 10c–d, which present a consistent story with Fig. 10a–b. The baseline simulation LandAero tends to overestimate the frequency of big cell sizes (200–300 km2) and underpredict the frequency of small cell sizes (Fig. 10d). Since LandAero predicts a similar rain intensity and rain rate PDF to observations as discussed above, this means that a larger storm cell than observations is needed to predict a similar precipitation intensity to observations. For this reason, No_LandAero which predicts much smaller cell size agrees better with the observations compared with the other simulations purely based on cell size (Fig. 10b, d). However, as discussed above, other metrics such as peak precipitation rate and PDF do not support it. It also should be noted that radar reflectivity in model calculation has a large uncertainty, and the model's overestimation can be partly the result of crude Rayleigh scattering assumptions applied to the model fields. The model overestimation of radar reflectivity has been commonly found in previous studies at cloud-resolving scales (Varble et al., 2011, 2014; Fan et al., 2015, 2017).
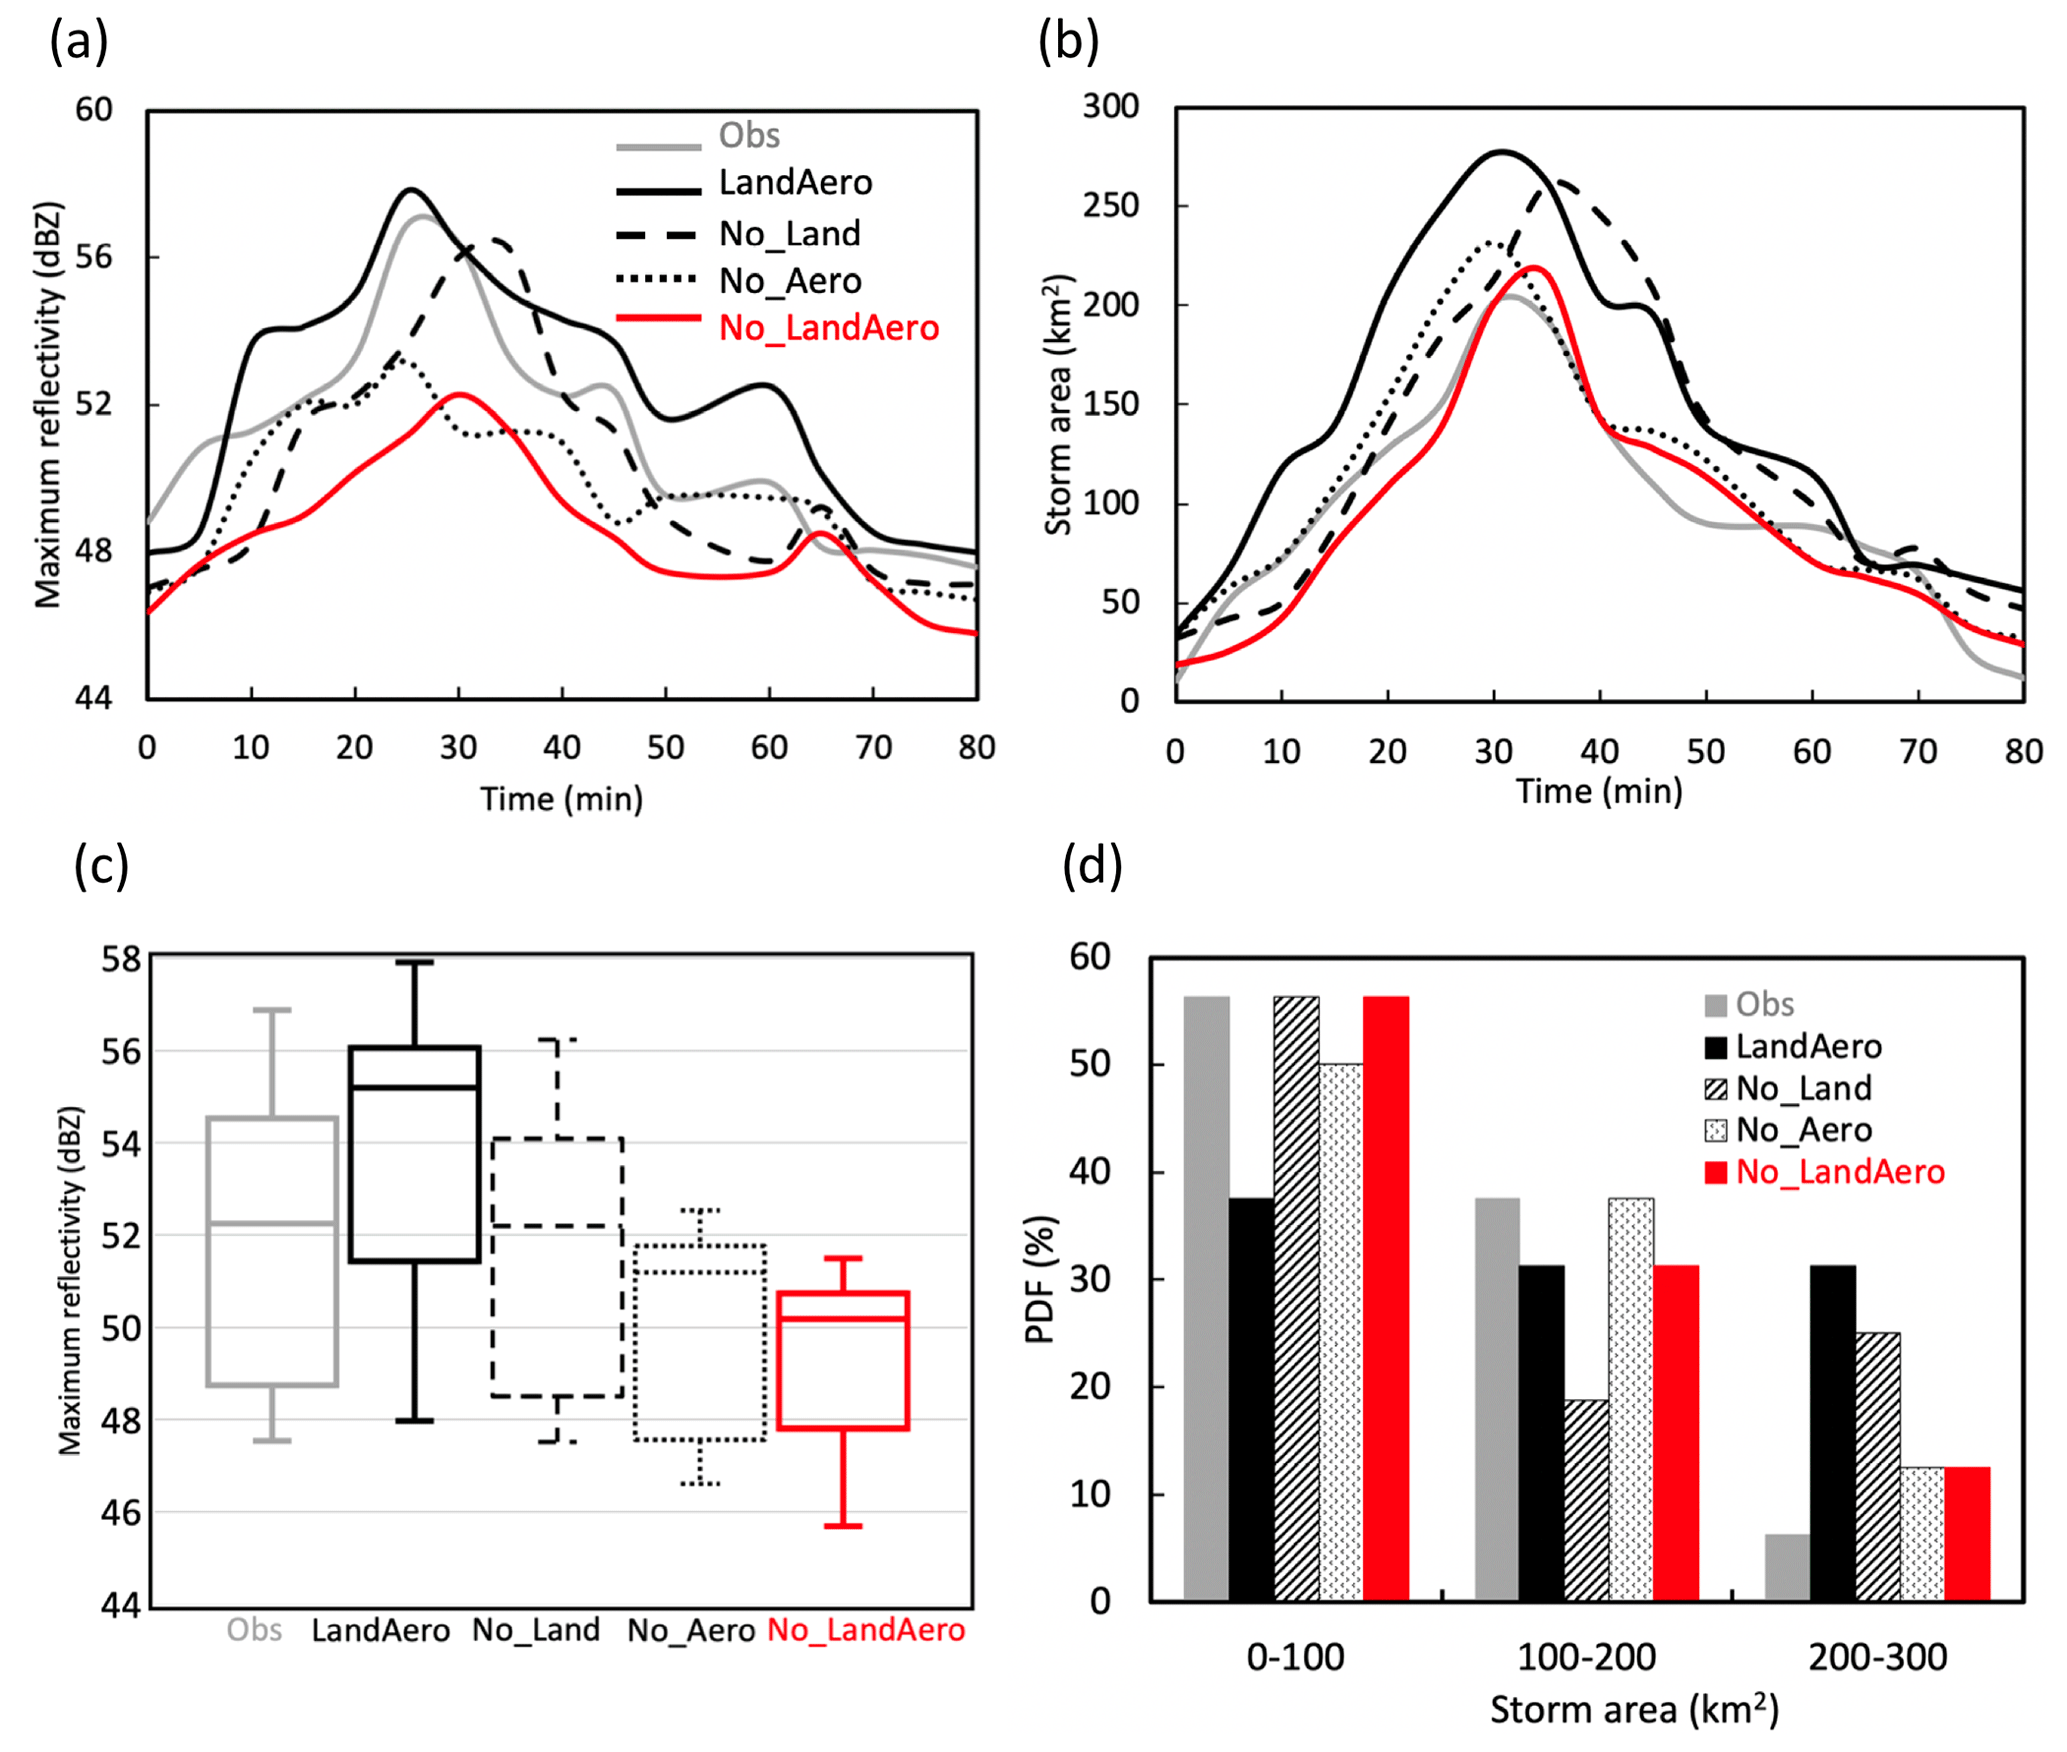
Figure 10Time series of (a) maximum reflectivity (dBZ) and (b) storm area (km2) for the tracked convective cell from NEXRAD, LandAero, No_LandAero, No_Land, and No_Aero. The time window is from 21:40 to 23:00 UTC for observations and from 21:00 to 22:20 UTC for model simulations. (c) Box–whisker plots of maximum reflectivity and (d) PDFs of averaged storm areas for the Houston cell from NEXRAD, LandAero, No_LandAero, No_Land, and No_Aero over the respective 80 min time windows as described above. The center line of the box indicates the median value, and the lower (upper) edge of the box indicates the 25th (75th) percentiles. The whiskers indicate the minimum and maximum values. The storm area of the tracked cell is defined as the number of grid points with LWP > 50 g m−2 multiplied by the grid box area (0.5 km × 0.5 km).
Since the small and numerous shallow cumulus clouds are difficult to track with the cell-tracking algorithm and they are excluded from the above tracking to examine how the convective storm evolves from the initial shallow cumulus period, we chose the red box shown in Fig. 6 which contains the Houston cell as the study area. Since the convective storm does not spatially move much with time in this study, this is a valid way to look at the temporal evolution. Figure 11 shows the temporal evolution of the maximal total water content (TWC; color contours) at each level and the maximal vertical velocity in the study area (black line). The convective storm has three distinct periods: warm cloud, mixed-phase cloud, and deep cloud. The mixed-phase and deep clouds are defined with a cloud top temperature (cloud top is defined with TWC > 0.01 g kg−1 at the topmost level) between 0 and −40 ∘C and below −40 ∘C, respectively. The purple and black dashed lines in Fig. 11 mark the initiation of mixed-phase and deep clouds, respectively.
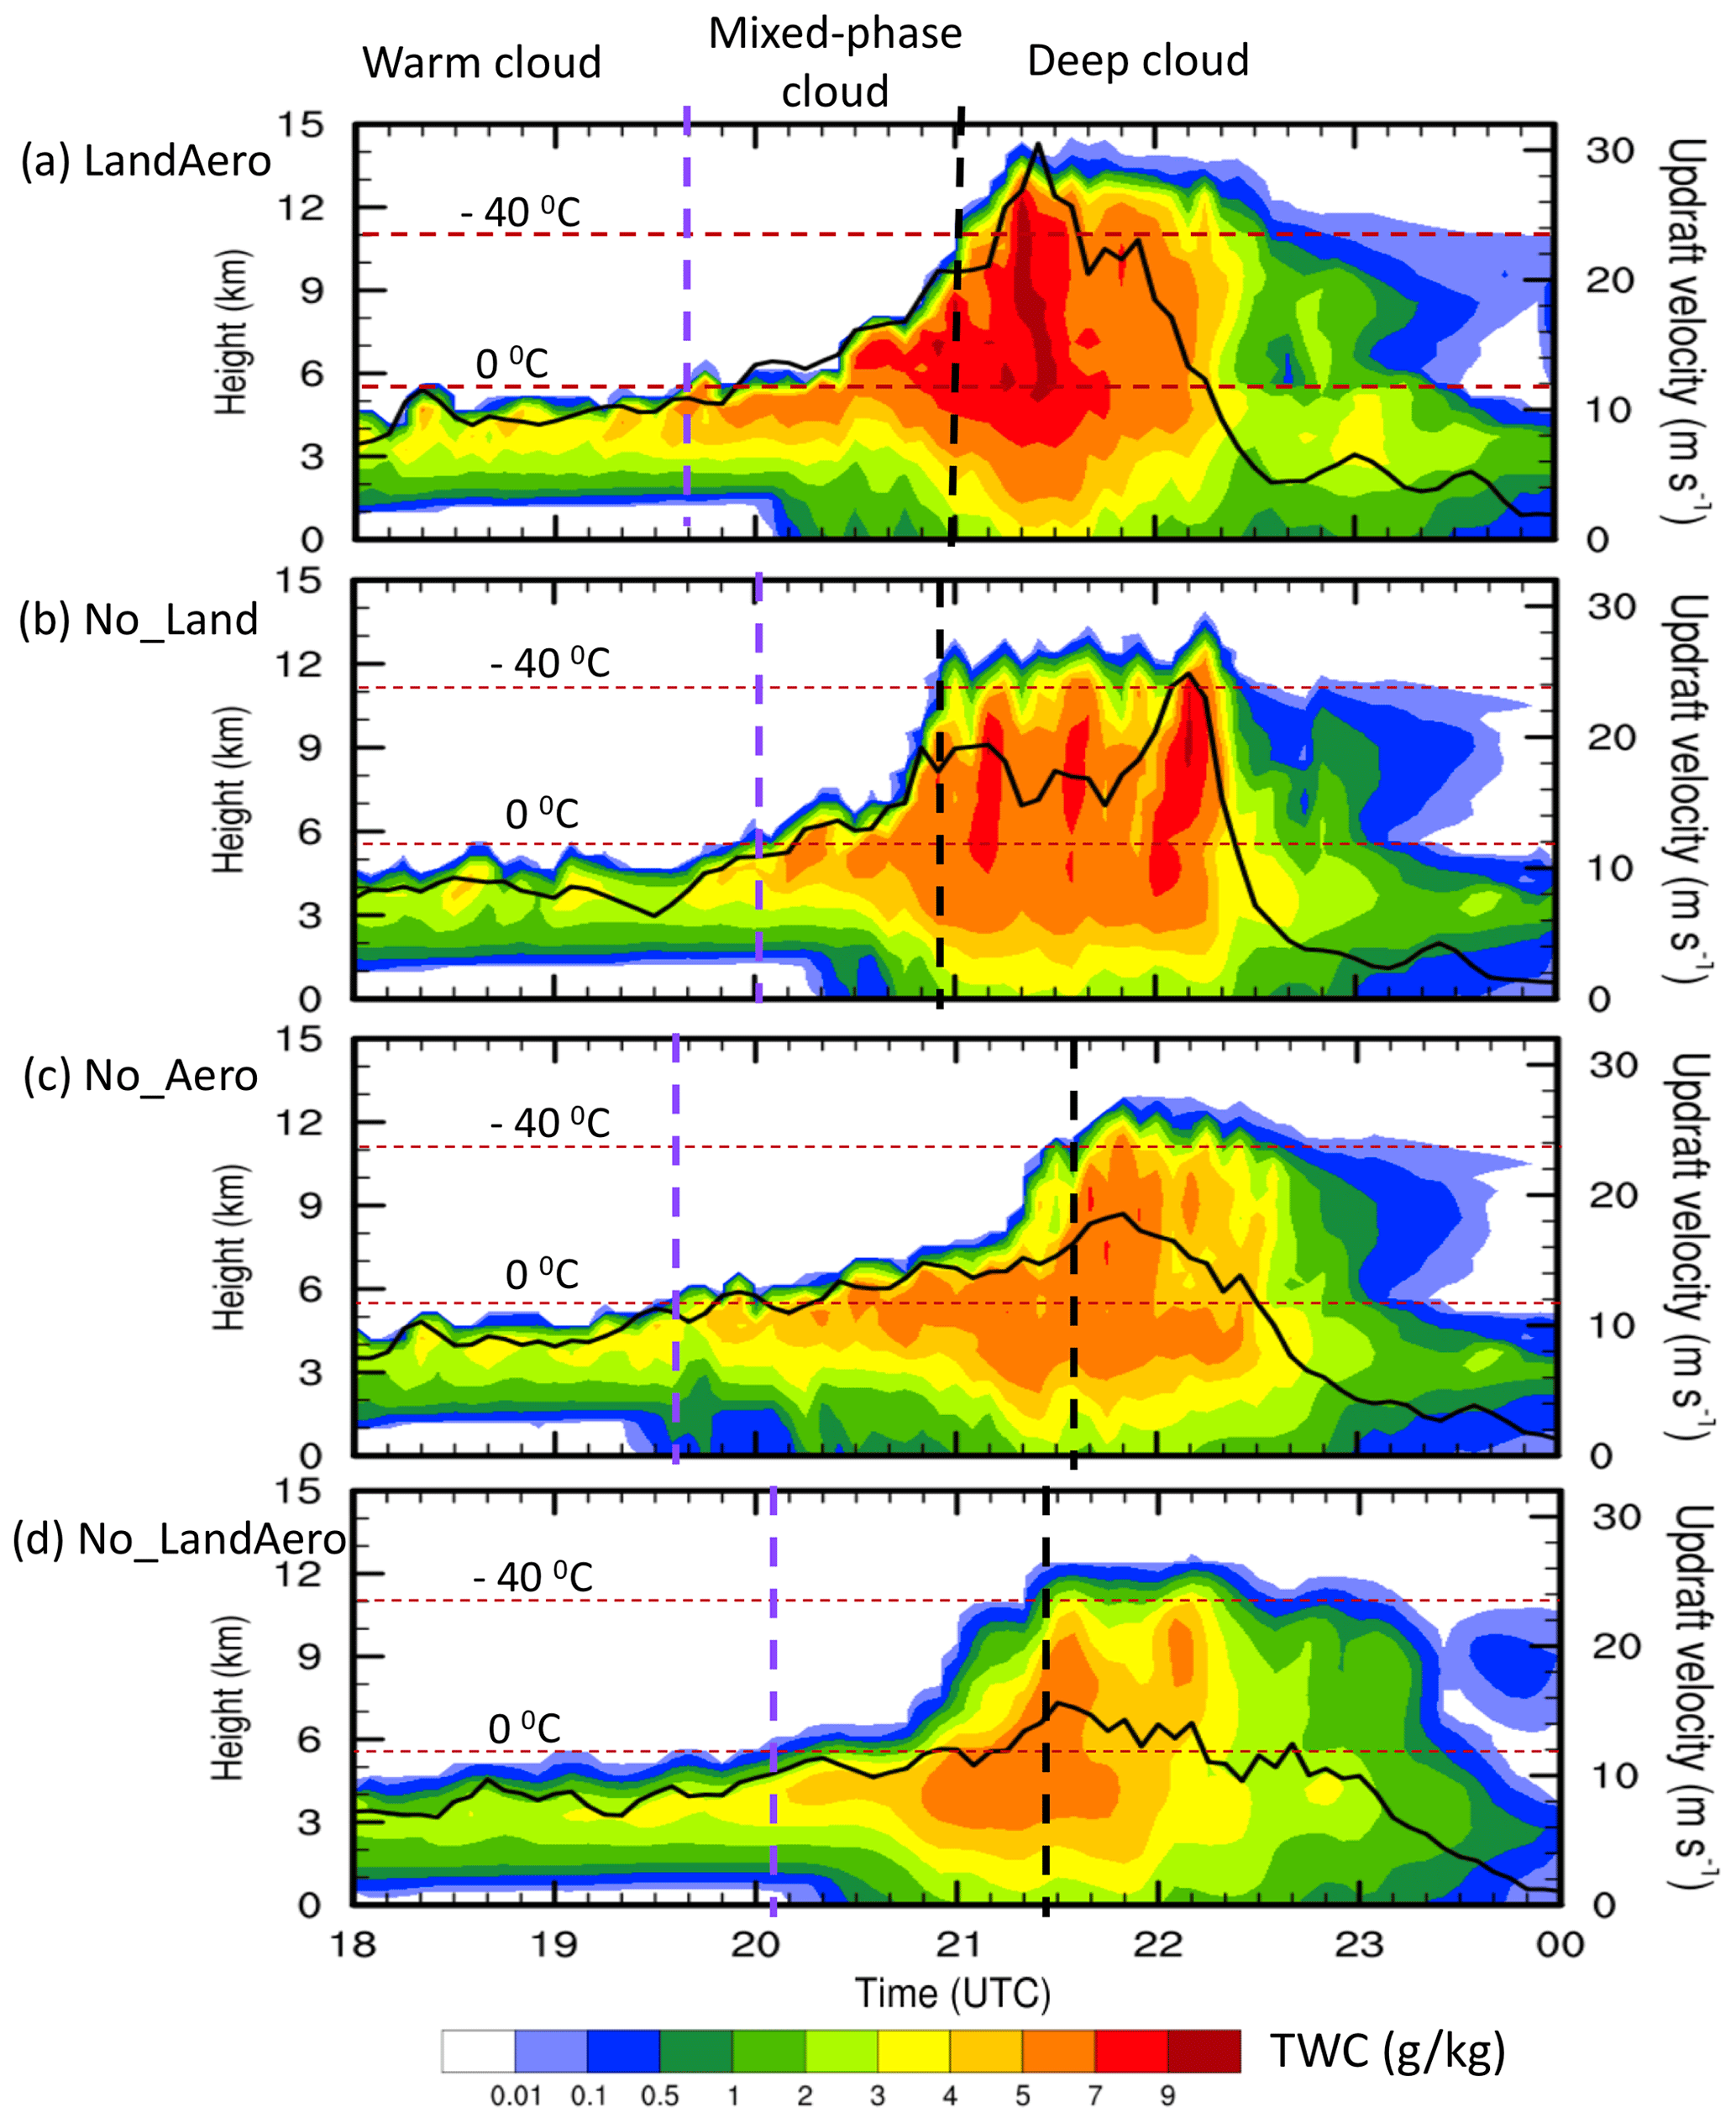
Figure 11Time series of maximal total water content (shaded; water vapor is not included) and maximal updraft velocity (black line, second y axis) over the study area as shown in the red box in Fig. 6 from LandAero, No_LandAero, No_Land, and No_Aero. Brown horizontal dashed lines denote the freezing level (0 ∘C) and homogeneous freezing level (−40 ∘C). The initiation of the mix-phase cloud and deep cloud is denoted by the purple and black vertical dashed lines, respectively.
As we can see, there is a relatively long warm cloud period for this case (Fig. 11a). With both the urban land and anthropogenic aerosol effects removed, the cloud development from the warm cloud to mixed-phase cloud is delayed by ∼ 30 min (Fig. 11d vs. 10a), and so is the development from the mixed-phase cloud to deep cloud. Comparing Fig. 11a with Fig. 10b and c, we see that it is mainly the urban land effect that enhances the development of warm cloud to the mixed-phase cloud by nearly 30 min, while the aerosol effect does not affect it (Fig. 11a vs. 10c). However, it is mainly the aerosol effect that accelerates the development from the mixed-phase cloud to deep cloud by about 35 min. In the case of the urban land effect removed (i.e., No_Land; Fig. 11b), the anthropogenic aerosol effect makes the duration of the mixed-phase cloud very short – about 35 min shorter relative to LandAero in which both effects are considered and 75 min shorter relative to No_Aero in which the aerosol effect is removed but the urban land effect is considered. This is due to the aerosol invigoration effect in the mixed-phase cloud stage which will be elaborated on later.

Figure 12Vertical profiles of updraft velocity averaged over the top 25 percentiles (i.e., 75th to 100th) of the updrafts with a value greater than 2 m s−1 from the simulations LandAero, No_LandAero, No_Land, and No_Aero over the study area at the (a) warm cloud, (b) mixed-phase cloud, and (c) deep cloud stages. The dotted line denotes the freezing level (0 ∘C).
Accompanying the faster development of warm cloud to mixed-phase cloud by the urban land effect are the stronger updraft speeds in the warm cloud stage (shown from the maximal updraft velocity in Fig. 11 and the mean of the top 25th percentile updraft speeds in Fig. 12a). Similarly, for the simulations with the aerosol effect considered (i.e., LandAero and No_Land), the convection is stronger in the mixed-phase cloud stage (Fig. 12b), which accelerates the development into the deep cloud.
Now the questions are (1) how the urban land effect enhances convective intensity at the warm cloud stage and speeds up the cloud development from the warm to mixed-phase cloud but slows down the storm dissipation and (2) how the anthropogenic aerosols increase convective intensity at the mixed-phase cloud stage and accelerate the development of mixed phase into the deep cloud.
For Question (1), Figs. 11a and 13a show that the development of the warm cloud to mixed-phase cloud occurs when the sea-breeze circulation reaches its peak. Also, the development corresponds to the fastest and largest increase in sea-breeze intensity by the urban land effect (Fig. 13a). Anthropogenic aerosol does not seem to affect sea-breeze circulation. The enhanced sea-breeze circulation in the simulations with the urban land effect considered (i.e., LandAero and No_Aero) compared with No_Land and No_LandAero corresponds to the increases in surface sensible heat flux and air temperature at low levels (Fig. 13b, d), which is the so-called “urban heat island”. The urban heating effect on temperature is significant up to 0.8 km altitude at its strongest time that also corresponds to the strongest sea-breeze time (Fig. 14b). The urban heating enhances convergence in Houston and at the same time increases the temperature differences between Houston and the Gulf of Mexico, both of which would contribute to a stronger sea-breeze circulation. Past studies showed that urban roughness could also enhance low-level convergence (e.g., Niyogi et al., 2006). However, the majority of the studies indicated that increased surface sensible heat flux is the main reason for the enhanced convergence (Liu and Niyogi, 2019; Shimadera et al., 2015).
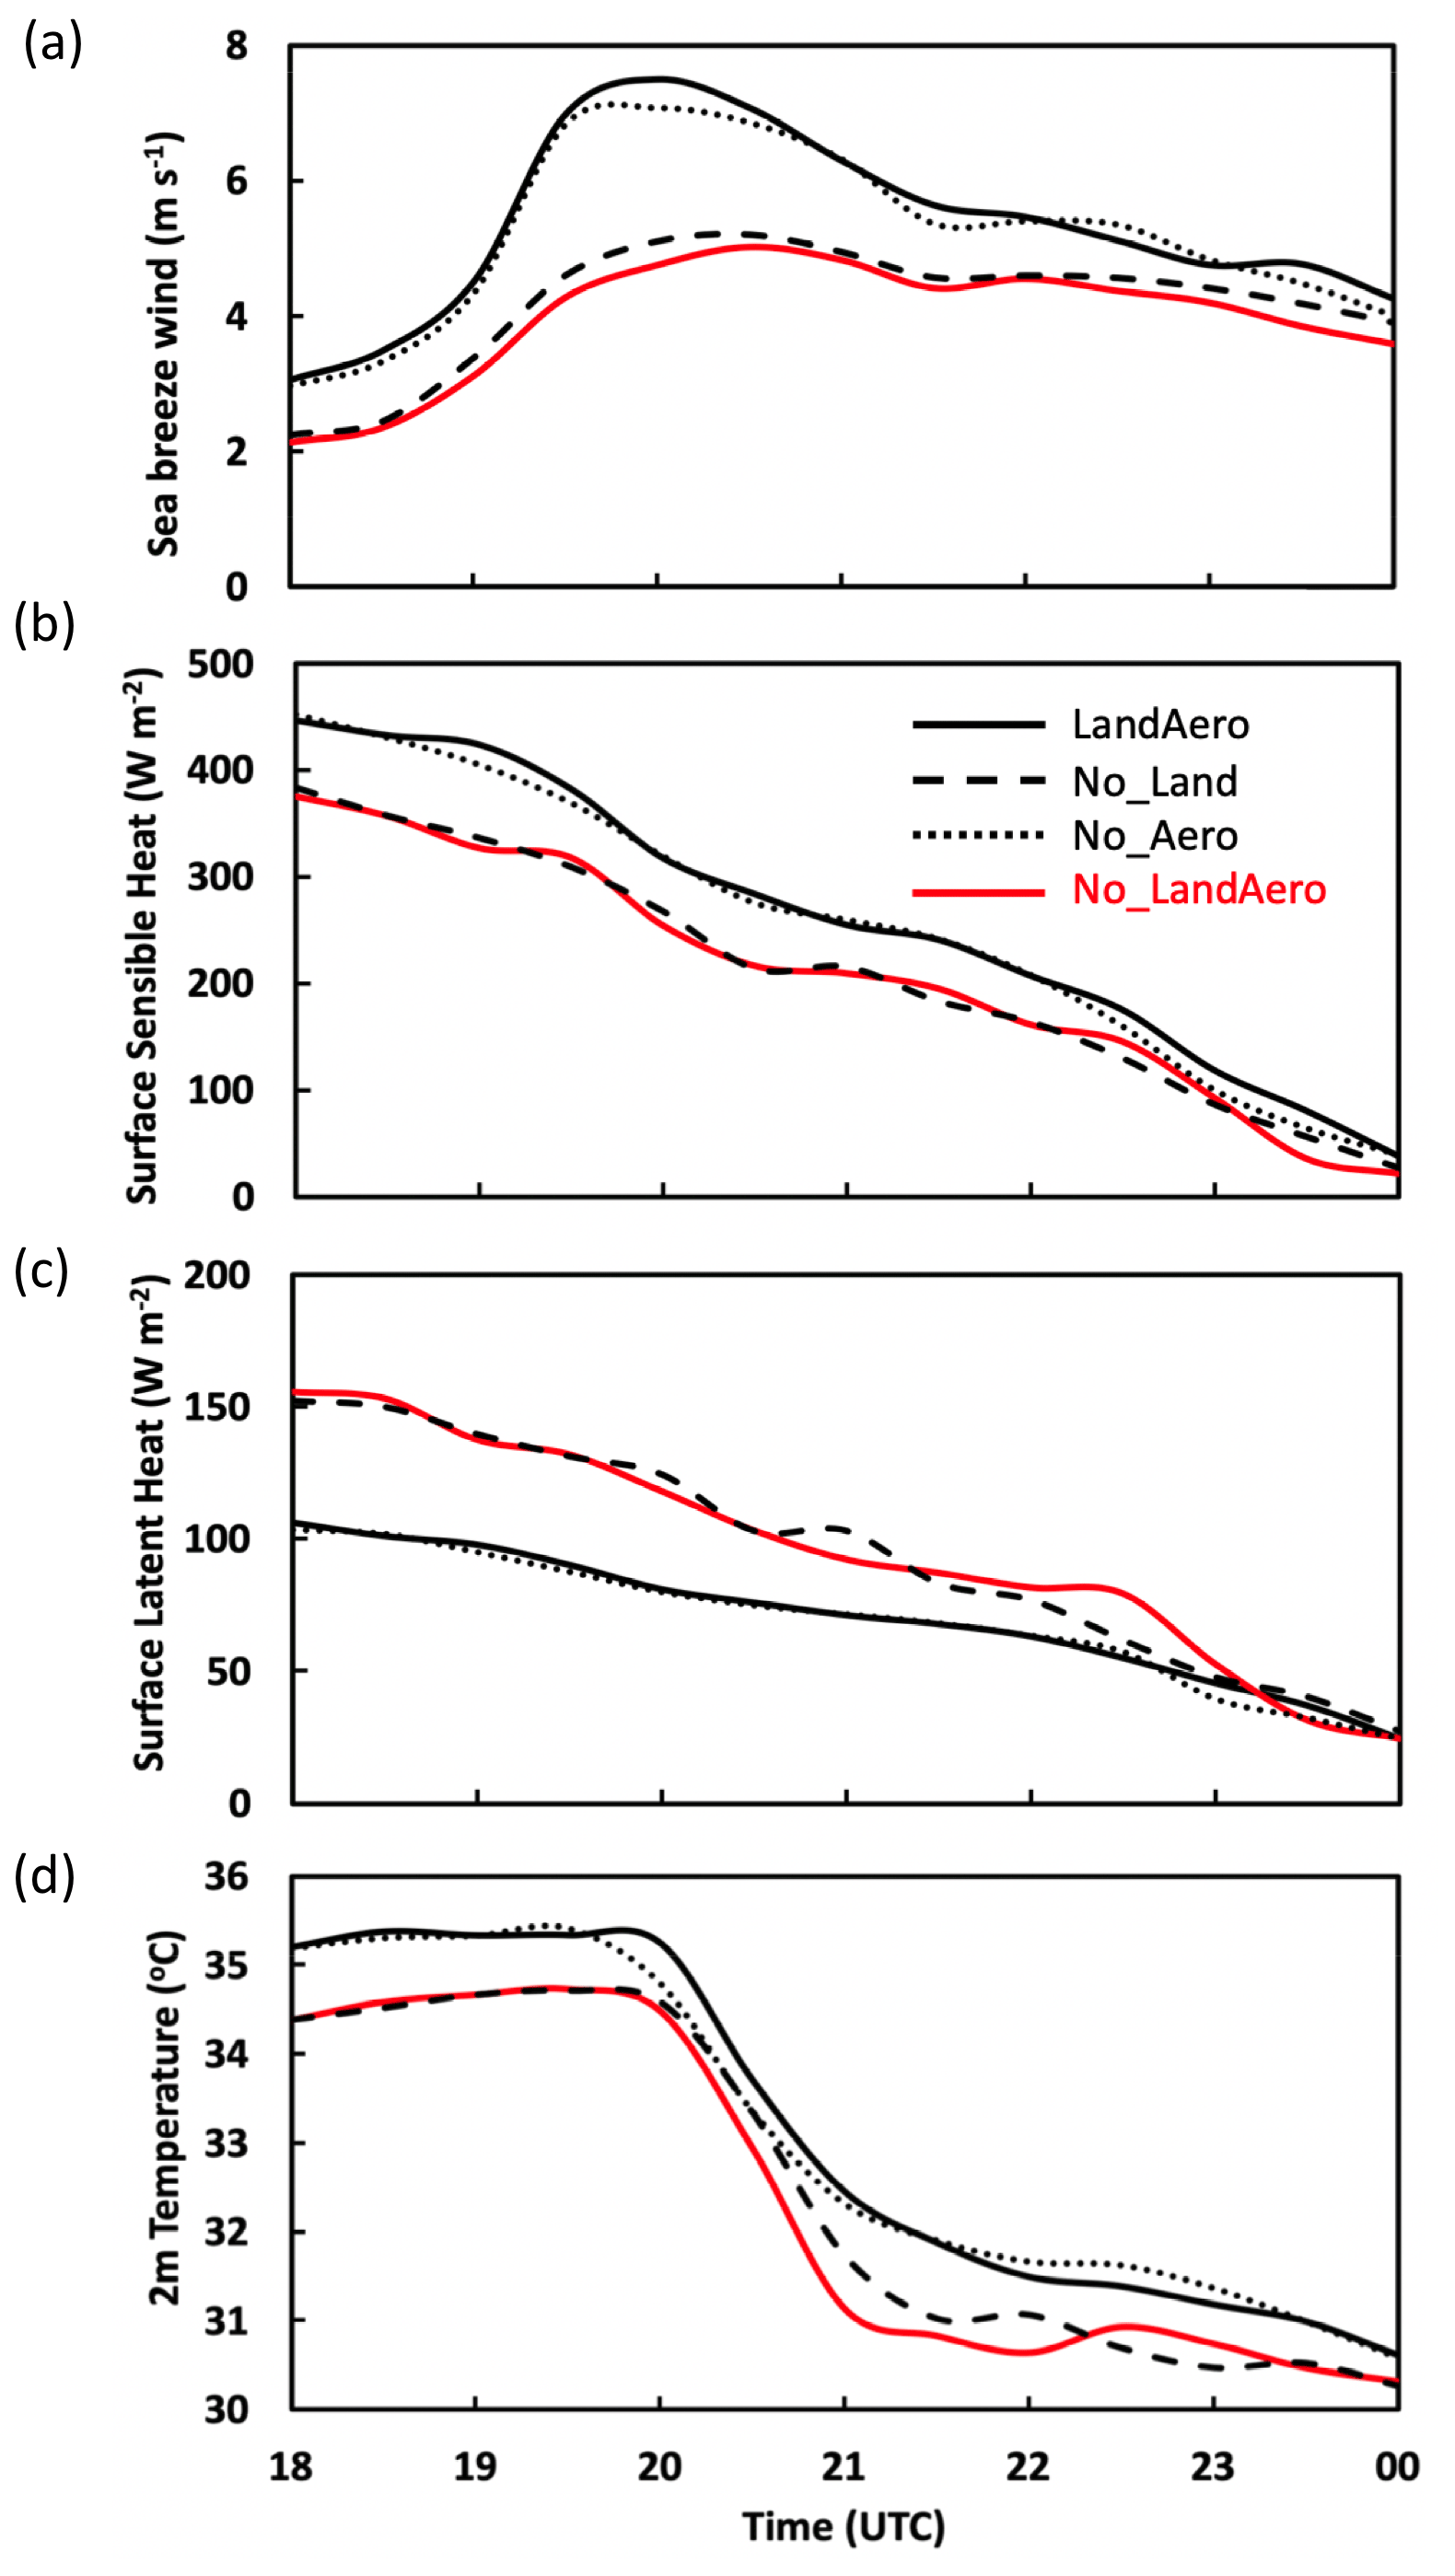
Figure 13Time series of (a) sea-breeze wind speed (m s−1), (b) surface sensible heat flux (W m−2), (c) surface latent heat flux (W m−2), and (d) 2 m temperature (∘C) from LandAero, No_Land, No_Aero, and No_LandAero. Sea-breeze winds are averaged over the horizontal winds along line UO (Fig. 5a) from O to U below 1 km. Heat fluxes and temperature are averaged over the study area.
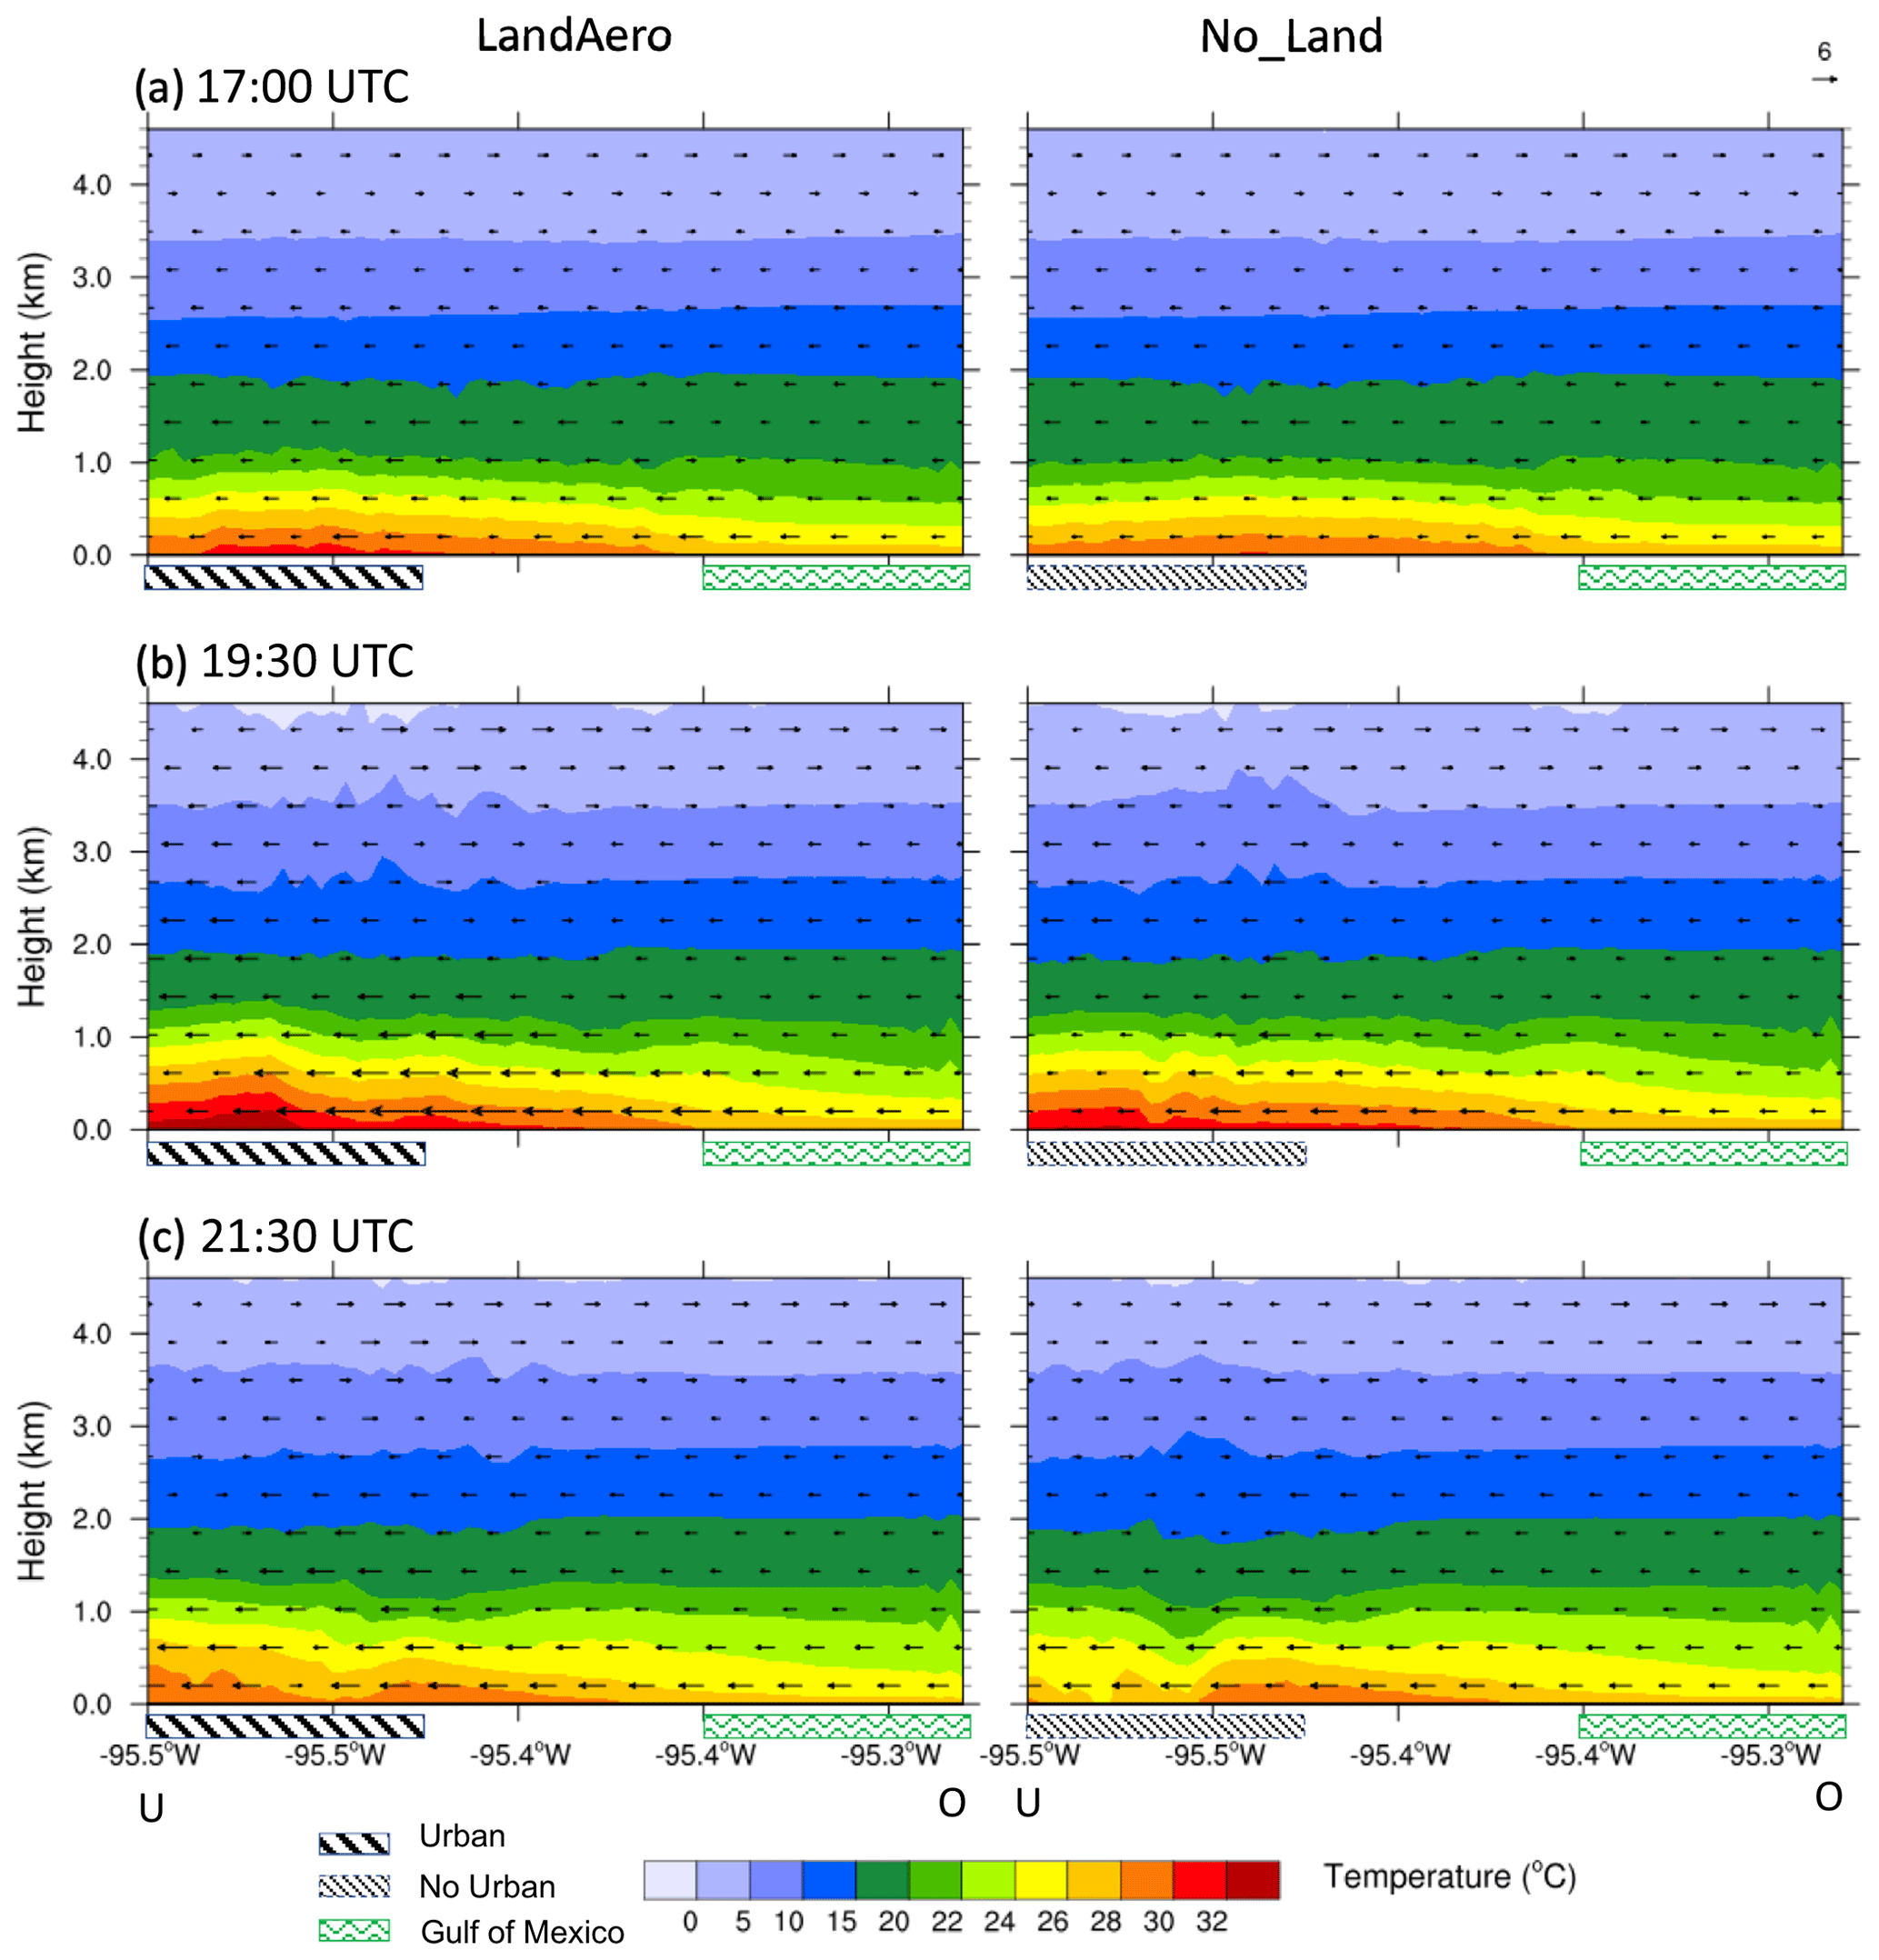
Figure 14Vertical cross sections of temperature (∘C; shaded) and wind vectors (m s−1) along the line UO in Fig. 5a for LandAero (left) and No_Land (right) at (a) 17:00, (b) 19:30, and (c) 21:30 UTC. The bars with stripes and waves on the x axis represent the urban land and water body in the Gulf of Mexico, respectively.
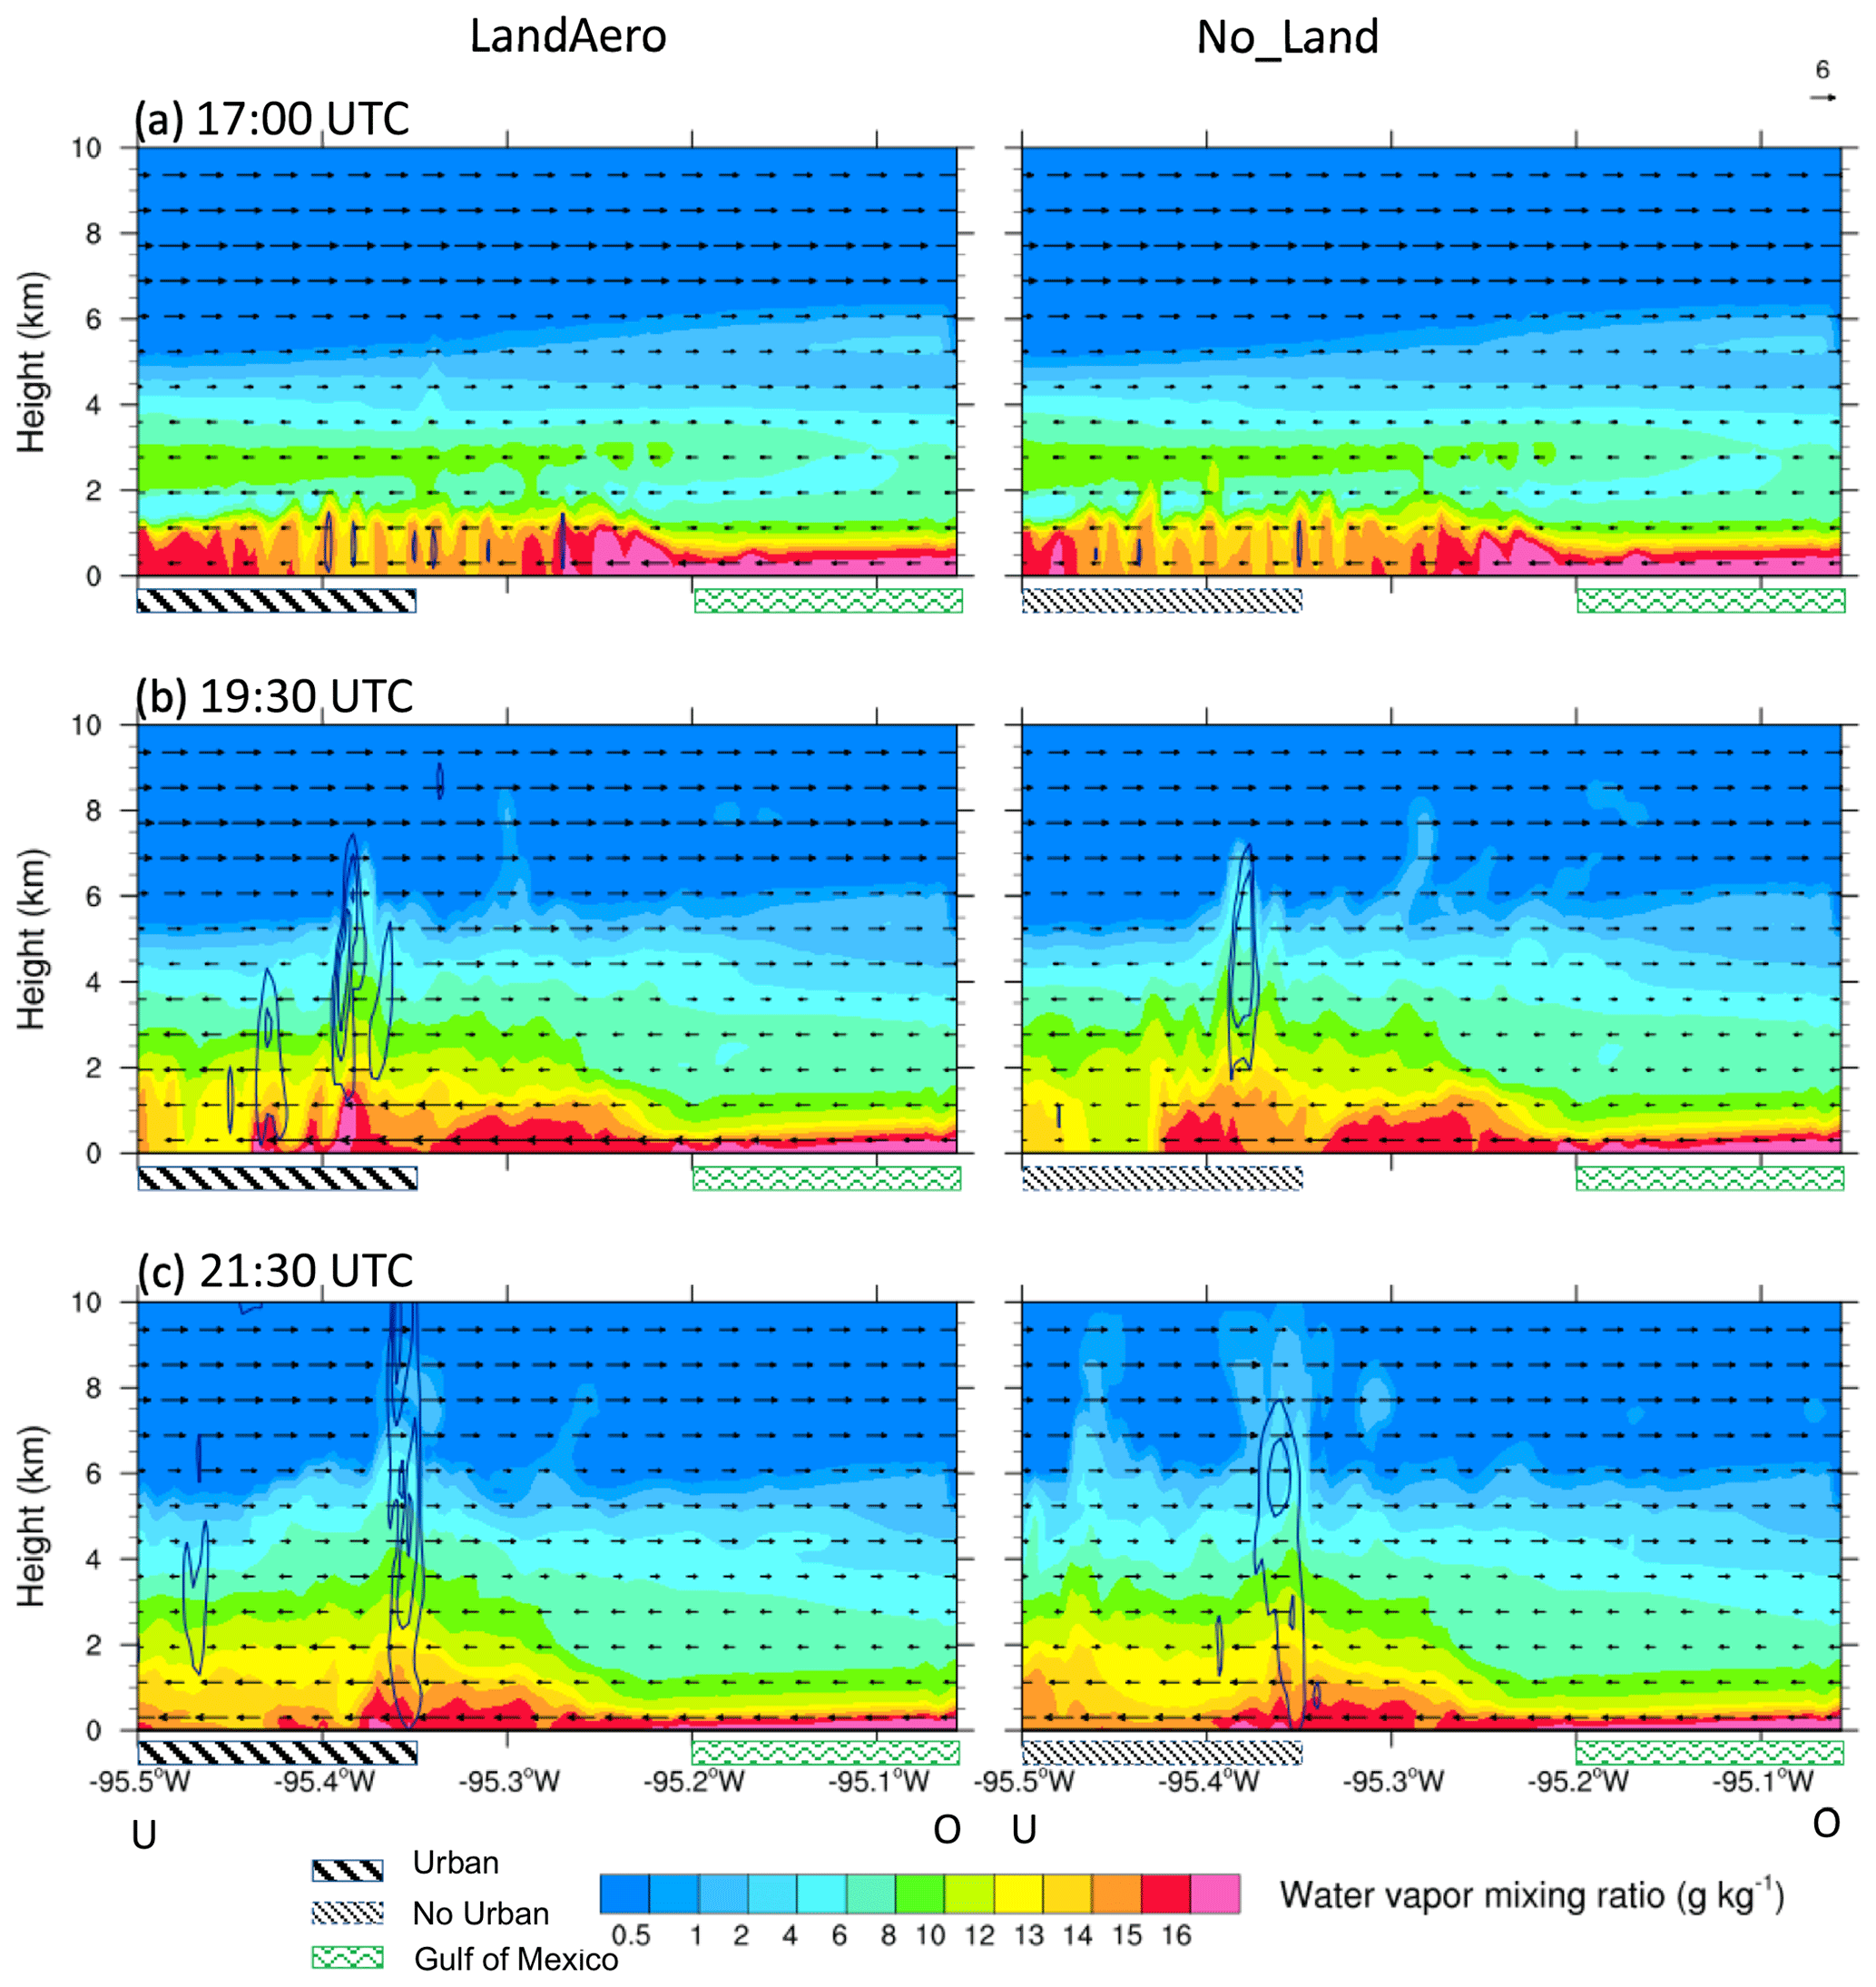
Figure 15Vertical cross sections of water vapor mixing ratio (g kg−1; shaded), updraft velocity (contour lines are 2, 6, and 11 m s−1), and wind vectors along the line UO in Fig. 5a for LandAero and No_Land at (a) 17:00, (b) 19:30, and (c) 21:30 UTC.
The stronger sea-breeze circulation transports more water vapor to Houston (Fig. 15). At the time 19:30 UTC when the sea breeze is strongest, the enhancement is largest (Fig. 13a), and the temperature contrast between the Houston urban area and the Gulf of Mexico is largest (Fig. 14b), the low-level moisture in the urban area is clearly higher in LandAero compared with No_Land (Fig. 15b, color contour), which would help enhance convection. As a result, the updraft speed of the Houston convective cell is much larger in LandAero compared with No_Land (Fig. 15b, contoured line). The stronger convection continues even when sea breeze dissipates (Fig. 15c) because the heating effect in the urban area extends to the nighttime until 23:00 UTC (18:00 LT; Fig. 13c–d). This explains the slower dissipation of the tracked Houston cell by the urban land effect as shown in Fig. 10a–b. In a word, the urban heating along with the strengthened sea-breeze circulation induced by the urban heating enhances convection at the warm cloud stage and speeds up the development from the warm to mixed-phase cloud, and the temporally extended urban heating effect leads to a slower dissipation of the convective cell.
For Question (2), which is about how anthropogenic aerosols increase convective intensity at the mixed-phase cloud stage and accelerate the development of mixed-phase cloud into deep cloud, Fig. 12b shows that the anthropogenic aerosol effect on updraft speeds becomes notable at the mixed-phase cloud stage, and the effect is doubled compared with the urban land effect in the mixed-phase regime (6–9 km altitudes). This corresponds to the increased net buoyancy (Fig. 16a, black lines) at those levels from No_Aero to LandAero, which is mainly because of the increased thermal buoyancy as a result of enhanced condensational heating since the offset effect of condensate loading is small (Fig. 16a) (Fig. 16c, blue lines). The condensational heating increase is most significant at the 3–5 and 6–9 km altitudes, corresponding to notably increased secondary droplet nucleation of small aerosol particles which are not able to be activated at the cloud base (Fig. 16e). In this case, aerosols with a diameter smaller than 80 nm but larger than 39 nm (the smallest size in the four-sectional MOSAIC), which account for about two-thirds of the total simulated aerosols, are not activated around cloud bases. All of them can be activated in the strong updrafts (Fan et al., 2018). This strong secondary nucleation leads to increased droplet number and mass by the anthropogenic aerosol effects (from No_Aero to LandAero; Fig. 17a, c). To recap, the anthropogenic aerosols enhance updraft velocity at the mixed-phase cloud stage mainly through enhanced condensation heating (i.e., “warm-phase invigoration”) as a result of nucleating small aerosol particles below 60 nm which are transported to higher levels. Enhanced secondary nucleation promotes condensation because of a larger integrated droplet surface area associated with a higher number of small droplets (Fan et al., 2007, 2013, 2018; Khain et al., 2012; Sheffield et al., 2015; Lebo, 2018). Thus, the stronger convection speeds up the development of mixed-phase cloud into deep cloud from No_Aero to LandAero. For the same reason, a similar acceleration is seen in No_Land compared with No_Aero and No_LandAero because the anthropogenic aerosol effect is considered in No_Land.

Figure 16Vertical profiles of (a–b) buoyancy terms (m s−2; red for thermal buoyancy, blue for condensate loading and black for total buoyancy), (c–d) latent heating (K h−1) from condensation (blue), deposition (red), drop freezing (orange), and riming (green), and (e–f) droplet nucleation rate (mg−1 s−1) averaged over the top 25 percentiles (i.e., 75th to 100th) of the updrafts with a value greater than 2 m s−1 from the simulations LandAero and No_Aero in the study area during the mixed-phase cloud (a, c, e) and deep cloud (b, d, f) stages.

Figure 17Vertical profiles of (a–b) number mixing ratio (mg−1) and (c–d) mass mixing ratio (g kg−1) of cloud droplets (blue), raindrops (red) and ice particles (green) averaged over the top 25 percentiles (i.e., 75th to 100th) of the updrafts with a value greater than 2 m s−1 from the simulations LandAero and No_Aero in the study area during the mixed-phase cloud (a, c) and deep cloud (b, d) stages.
Grabowski and Morrison (2020) interpreted this warm-phase convective invigoration at low levels by aerosols in a different way. They argued that supersaturation (S) in updrafts rapidly, within a few seconds, approaches the quasi-equilibrium supersaturation (Seq). With this quasi-steady assumption (S≈Seq), the condensation rate and buoyancy only depend on updraft velocity, not droplet number and size. Thus they concluded that the lower quasi-equilibrium supersaturation in the polluted case than the pristine case is the reason for enhanced buoyancy and updraft velocity, not the enhanced condensation. The problem is that the quasi-steady approximation is invalidated for updrafts where droplet concentrations are low or droplets are growing and their sizes are changing based on the explicit solution of supersaturation (Korolev and Mazin, 2003). The explicit theoretical solution of supersaturation showed that condensation depends on droplet number and size besides updraft speeds (Pinsky et al., 2013). Here in this study the quasi-equilibrium supersaturation in the updrafts is generally 2–3 times higher than the true supersaturation, and the phase relaxation time is generally above 10 s above 3 km altitude in the case without anthropogenic aerosols and about 60 s when droplet number is 10 cm−3, which occurs frequently in the convective cores where autoconversion and rain accretion are strong.
At the deep cloud stage, the anthropogenic aerosol effect becomes more significant compared with that in the mixed-phase cloud stage (Fig. 12c vs. 11b), particularly at the low levels. We can still see the enhancement of convective intensity by the urban land effect, although the sea-breeze difference is relatively smaller at this stage, as explained above. The larger aerosol effect at the deep cloud stage compared with the mixed-phase cloud stage is because the secondary droplet nucleation above the cloud base becomes larger (Fig. 16f). More aerosols getting activated is the result of higher supersaturation since (a) updrafts are stronger than the mixed-phase cloud stage and (b) more rain forms and removes droplet surface area for condensation (Fan et al., 2018). As a result, the latent heating from condensation and then the thermal buoyancy is increased in a larger magnitude (Fig. 16b, d), and thus a larger aerosol impact is seen at the deep cloud stage. The invigorated deep convection has up to 2 times more ice particle number concentration and 30 % larger ice particle mass mixing ratio (Fig. 17b, d), with the maximal cloud top height increased by ∼ 1 km. The enhanced ice number and mass concentrations also partially result from the freezing of more droplets that are being transported from low levels (Rosenfeld et al., 2008), as suggested by the increased latent heating associated with the ice-phase processes (Fig. 16d), but this is not the major mechanism for the large aerosol effects on convective intensity in this case.
Note that both ACI and ARI are considered in the aerosol effects we discussed above, and the results above suggest ACI plays a key role in invigorating convection. To confirm that, we conducted two additional sensitivity tests by turning off ARI based on LandAero and No_Aero, referred to as LandAero_ACI and No_Aero_ACI, respectively. The differences in precipitation and convective intensity between LandAero_ACI and No_Aero_ACI (i.e., the ACI effect) are only slightly smaller than the differences between LandAero and No_Aero (i.e., the total aerosol effect). This confirms that ACI is the major factor responsible for the convective invigoration and precipitation enhancement by aerosols.
We have investigated the Houston urbanization effects on convective evolution, convective intensity, and precipitation of a sea-breeze-induced convective storm using WRF-Chem coupled with SBM and the BEM-BEP urban canopy model. The baseline simulation with the urbanization effects considered was extensively evaluated in Zhang et al. (2020) in aerosol and CCN, surface meteorological measurements, reflectivity and precipitation, and in this study in Houston cell reflectivity and precipitation. The simulated convective storm in Houston was shown to be consistent with the observed maximal radar reflectivity and peak precipitation intensity and PDF, despite the peak precipitation time being about ∼ 40 min earlier. The accumulated rain is overestimated by the baseline simulation due to the longer rain period.
Model sensitivity tests were carried out to examine the joint and respective effects of urban land and anthropogenic aerosols as a result of Houston urbanization on convective evolution and precipitation. We find that the joint effect of Houston urban land and anthropogenic aerosols enhances the storm intensity (by ∼ 60 % in the mean of the top 25 percentiles in the deep cloud stage), radar reflectivity (by up to 10 dBZ), peak precipitation rate (by ∼ 45 %), and the accumulated rain (by ∼ 26 %), with the anthropogenic aerosol effect more significant than the urban land effect overall. The anthropogenic aerosol effect increases the peak precipitation rate by ∼ 30 % and the frequency of large rain rates (> 15 mm h−1) by about 5 times. Although the urban land effect alone (under the condition of the existence of anthropogenic aerosols) does not impact the peak precipitation rate and the frequency of large rain rates much, its interaction with aerosol effects leads to an increase in the peak rain rates by 45 % and the frequency of large rain rates by an order of magnitude. Therefore, the interactions between the two factors amplify the effect on precipitation, particularly on the large rain rates, emphasizing the importance of considering both effects in studying urbanization effects on convective clouds and precipitation.
The Houston urban land effect affects the convective evolution, making the initiation of mixed-phase cloud and surface rain ∼ 30 min earlier because of the strengthened sea-breeze circulation as a result of urban heating. It also slows down the dissipation of convective storms because the urban heating extends to late afternoon and evening. The aerosol effect from Houston anthropogenic emissions overall invigorates convection and precipitation, with ACI dominant. The ACI effect is mainly through enhanced condensation (so-called “warm-phase invigoration”) by activating numerous small aerosol particles at higher levels above the cloud base. This invigoration is notable starting from the mixed-phase cloud stage and becomes more significant at the deep cloud stage. The enhanced convective intensity in the mixed-phase cloud stage by aerosols accelerates the development of convective storms into the deep cloud stage by ∼ 40 min, which is significant for thunderstorms since the storm duration is only a few hours.
This study improves our understanding of how Houston urban land and anthropogenic aerosols jointly shape thunderstorms in the region. Our findings of the relative importance of the urban land effect vs. anthropogenic aerosol effects are consistent with some of the previous studies, which showed that for coastal cities, the anthropogenic aerosol effect on precipitation was relatively more important than the urban land effect (Liu and Niyogi, 2019; Ganeshan et al., 2013; Ochoa et al., 2015; Hu et al., 2019b). The low background aerosol concentration in coastal cities is one of the factors responsible for the significant aerosol effect. In Houston, another factor would be the warm and humid meteorological conditions, in which aerosols were shown to invigorate convective clouds in many previous studies as reviewed in Tao et al. (2012) and Fan et al. (2016).
To simulate aerosol–deep convective cloud interactions, there are a few key modeling requirements as summarized in Fan et al. (2016), such as (1) prognostic supersaturation being needed for secondary aerosol activation, condensation, and evaporation calculations, (2) hydrometeor size distributions needing to be prognostic to physically simulate the responses of microphysical processes to CCN changes, and (3) aerosols needing to be prognostic, and fixed aerosol concentrations gave unrealistic cloud properties and qualitatively changed aerosol impacts on convective intensity (Fan et al., 2012). With the SBM used in this study, all these criteria are satisfied. Furthermore, for (3), we are prognosing not only aerosol numbers, but also aerosol composition and size distribution, by coupling the SBM with the chemistry and aerosol components. With this coupling, the spatial heterogeneity of aerosols is considered. Also, aerosol regeneration and wet removal processes can be more physically accounted for compared with the WRF-Chem with two-moment bulk schemes (Gao et al., 2016). The spatial heterogeneity of aerosols was shown to play an important role in simulating a torrential rain event observed over Seoul, Korea (Lee et al., 2018). However, bin schemes also have uncertainties in representing ice-related processes, mainly due to our poor understanding of convective microphysics such as ice nucleation and riming processes. In particular, the conversions between different ice categories are also determined by threshold sizes or masses. However, those uncertainties are not expected to qualitatively change the warm-phase invigoration mechanism which occurs via enhanced condensation. In the companion paper, Zhang et al. (2020), we carried out a small number of ensemble simulations for the anthropogenic aerosol effects for the same case, and the results are consistent with this study, indicating this mechanism is robust with the initial thermodynamic and dynamic perturbations. More sophisticated uncertainty qualifications can be done in future with a larger number of ensembles when computer power becomes more advanced.
The finding that the urban land effect enhances sea-breeze circulation, which transports more moisture into the urban area and enhances convection and precipitation, is consistent with previous studies, such as Ryu et al. (2016) for the Baltimore–Washington metropolitan area and You et al. (2019) for the Pearl River Delta (PRD) region.
The model data can be accessed at https://portal.nersc.gov/project/m2977/fanetal2020 (last access: 16 November 2020).
JF came up with the idea, guided the research, and wrote the first draft. YZ carried out the experiments and analysis. JH and DR helped with cell tracking. YZ, ZL, JH and DR revised and polished the manuscript.
The authors declare that they have no conflict of interest.
PNNL is operated for the U.S. Department of Energy (DOE) by Battelle Memorial Institute under contract DE-AC05-76RL01830. This research used resources of PNNL Institutional Computing (PIC) and the National Energy Research Scientific Computing Center (NERSC), a U.S. Department of Energy Office of Science User Facility operated under contract no. DE-AC02-05CH11231.
This research has been supported by the U.S. Department of Energy, Office of Science, Early Career Research Program (grant no. 70017), and the NSF (grant no. AGS1837811).
This paper was edited by Fangqun Yu and reviewed by two anonymous referees.
Alig, R. J., Kline, J. D., and Lichtenstein, M.: Urbanization on the US landscape: looking ahead in the 21st century, Landscape Urban Plan., 69, 219–234, https://doi.org/10.1016/j.landurbplan.2003.07.004, 2004.
Angevine, W. M., Tjernstrom, M., and Zagar, M.: Modeling of the coastal boundary layer and pollutant transport in New England, J. Appl. Meteorol. Clim., 45, 137–154, https://doi.org/10.1175/Jam2333.1, 2006.
Ashley, W. S., Bentley, M. L., and Stallins, J. A.: Urban-induced thunderstorm modification in the Southeast United States, Climatic Change, 113, 481–498, https://doi.org/10.1007/s10584-011-0324-1, 2012.
Banta, R. M., Senff, C. J., Nielsen-Gammon, J., Darby, L. S., Ryerson, T. B., Alvarez, R. J., Sandberg, S. R., Williams, E. J., and Trainer, M.: A bad air day in Houston, B. Am. Meteorol. Soc., 86, 657–669, https://doi.org/10.1175/Bams-86-5-657, 2005.
Bao, J. W., Michelson, S. A., McKeen, S. A., and Grell, G. A.: Meteorological evaluation of a weather-chemistry forecasting model using observations from the TEXAS AQS 2000 field experiment, J. Geophys. Res.-Atmos., 110, D21105, https://doi.org/10.1029/2004jd005024, 2005.
Bornstein, R. and Lin, Q. L.: Urban heat islands and summertime convective thunderstorms in Atlanta: three case studies, Atmos. Environ., 34, 507–516, https://doi.org/10.1016/S1352-2310(99)00374-X, 2000.
Caicedo, V., Rappenglueck, B., Cuchiara, G., Flynn, J., Ferrare, R., Scarino, A. J., Berkoff, T., Senff, C., Langford, A., and Lefer, B.: Bay Breeze and Sea Breeze Circulation Impacts on the Planetary Boundary Layer and Air Quality From an Observed and Modeled DISCOVER-AQ Texas Case Study, J. Geophys. Res.-Atmos., 124, 7359–7378, https://doi.org/10.1029/2019jd030523, 2019.
Carrio, G. G., Cotton, W. R., and Cheng, W. Y. Y.: Urban growth and aerosol effects on convection over Houston Part I: The August 2000 case, Atmos. Res., 96, 560–574, https://doi.org/10.1016/j.atmosres.2010.01.005, 2010.
Chen, F., Miao, S. G., Tewari, M., Bao, J. W., and Kusaka, H.: A numerical study of interactions between surface forcing and sea breeze circulations and their effects on stagnation in the greater Houston area, J. Geophys. Res.-Atmos., 116, D12105, https://doi.org/10.1029/2010jd015533, 2011.
Fan, J. W., Zhang, R. Y., Li, G. H., and Tao, W. K.: Effects of aerosols and relative humidity on cumulus clouds, J. Geophys. Res.-Atmos., 112, D14204, https://doi.org/10.1029/2006jd008136, 2007.
Fan, J. W., Leung, L. R., Li, Z. Q., Morrison, H., Chen, H. B., Zhou, Y. Q., Qian, Y., and Wang, Y.: Aerosol impacts on clouds and precipitation in eastern China: Results from bin and bulk microphysics, J. Geophys. Res.-Atmos., 117, D00k36, https://doi.org/10.1029/2011jd016537, 2012.
Fan, J. W., Leung, L. R., Rosenfeld, D., Chen, Q., Li, Z. Q., Zhang, J. Q., and Yan, H. R.: Microphysical effects determine macrophysical response for aerosol impacts on deep convective clouds, P. Natl Acad. Sci. USA, 110, E4581–E4590, https://doi.org/10.1073/pnas.1316830110, 2013.
Fan, J. W., Liu, Y. C., Xu, K. M., North, K., Collis, S., Dong, X. Q., Zhang, G. J., Chen, Q., Kollias, P., and Ghan, S. J.: Improving representation of convective transport for scale-aware parameterization: 1. Convection and cloud properties simulated with spectral bin and bulk microphysics, J. Geophys. Res.-Atmos., 120, 3485–3509, https://doi.org/10.1002/2014jd022142, 2015.
Fan, J. W., Wang, Y., Rosenfeld, D., and Liu, X. H.: Review of Aerosol-Cloud Interactions: Mechanisms, Significance, and Challenges, J. Atmos. Sci., 73, 4221–4252, https://doi.org/10.1175/Jas-D-16-0037.1, 2016.
Fan, J. W., Han, B., Varble, A., Morrison, H., North, K., Kollias, P., Chen, B. J., Dong, X. Q., Giangrande, S. E., Khain, A., Lin, Y., Mansell, E., Milbrandt, J. A., Stenz, R., Thompson, G., and Wang, Y.: Cloud-resolving model intercomparison of an MC3E squall line case: Part I – Convective updrafts, J. Geophys. Res.-Atmos., 122, 9351–9378, https://doi.org/10.1002/2017jd026622, 2017.
Fan, J. W., Rosenfeld, D., Zhang, Y. W., Giangrande, S. E., Li, Z. Q., Machado, L. A. T., Martin, S. T., Yang, Y., Wang, J., Artaxo, P., Barbosa, H. M. J., Braga, R. C., Comstock, J. M., Feng, Z., Gao, W. H., Gomes, H. B., Mei, F., Pohlker, C., Pohlker, M. L., Pöschl, U., and de Souza, R. A. F.: Substantial convection and precipitation enhancements by ultrafine aerosol particles, Science, 359, 411–418, https://doi.org/10.1126/science.aan8461, 2018.
Fast, J. D., Gustafson, W. I., Easter, R. C., Zaveri, R. A., Barnard, J. C., Chapman, E. G., Grell, G. A., and Peckham, S. E.: Evolution of ozone, particulates, and aerosol direct radiative forcing in the vicinity of Houston using a fully coupled meteorology-chemistry-aerosol model, J. Geophys. Res.-Atmos., 111, D21305, https://doi.org/10.1029/2005jd006721, 2006.
Ganeshan, M., Murtugudde, R., and Imhoff, M. L.: A multi-city analysis of the UHI-influence on warm season rainfall, Urban Climate, 6, 1–23, https://doi.org/10.1016/j.uclim.2013.09.004, 2013.
Gao, W. H., Fan, J. W., Easter, R. C., Yang, Q., Zhao, C., and Ghan, S. J.: Coupling spectral-bin cloud microphysics with the MOSAIC aerosol model in WRF-Chem: Methodology and results for marine stratocumulus clouds, J. Adv. Model. Earth Syst., 8, 1289–1309, https://doi.org/10.1002/2016ms000676, 2016.
Gelaro, R., McCarty, W., Suarez, M. J., Todling, R., Molod, A., Takacs, L., Randles, C. A., Darmenov, A., Bosilovich, M. G., Reichle, R., Wargan, K., Coy, L., Cullather, R., Draper, C., Akella, S., Buchard, V., Conaty, A., da Silva, A. M., Gu, W., Kim, G. K., Koster, R., Lucchesi, R., Merkova, D., Nielsen, J. E., Partyka, G., Pawson, S., Putman, W., Rienecker, M., Schubert, S. D., Sienkiewicz, M., and Zhao, B.: The Modern-Era Retrospective Analysis for Research and Applications, Version 2 (MERRA-2), J. Climate, 30, 5419–5454, https://doi.org/10.1175/Jcli-D-16-0758.1, 2017.
Grabowski, W. W. and Morrison, H.: Do ultrafine cloud condensation nuclei invigorate deep convection?, J. Atmos. Sci., 77, 2567–2583, https://doi.org/10.1175/JAS-D-20-0012.1, 2020.
Greene, D. R. and Clark, R. A.: Vertically Integrated Liquid Water – New Analysis Tool. Mon. Weather Rev. 100, 548–552, https://doi.org/10.1175/1520-0493(1972)100<0548:VILWNA>2.3.CO;2, 1972.
Grell, G. A., Peckham, S. E., Schmitz, R., McKeen, S. A., Frost, G., Skamarock, W. C., and Eder, B.: Fully coupled “online” chemistry within the WRF model, Atmos. Environ., 39, 6957–6975, https://doi.org/10.1016/j.atmosenv.2005.04.027, 2005.
Guenther, A., Karl, T., Harley, P., Wiedinmyer, C., Palmer, P. I., and Geron, C.: Estimates of global terrestrial isoprene emissions using MEGAN (Model of Emissions of Gases and Aerosols from Nature), Atmos. Chem. Phys., 6, 3181–3210, https://doi.org/10.5194/acp-6-3181-2006, 2006.
Haberlie, A. M., Ashley, W. S., and Pingel, T. J.: The effect of urbanisation on the climatology of thunderstorm initiation, Q. J. Roy. Meteor. Soc., 141, 663–675, https://doi.org/10.1002/qj.2499, 2015.
Hu, J. X., Rosenfeld, D., Zrnic, D., Williams, E., Zhang, P. F., Snyder, J. C., Ryzhkov, A., Hashimshoni, E., Zhang, R. Y., and Weitz, R.: Tracking and characterization of convective cells through their maturation into stratiform storm elements using polarimetric radar and lightning detection, Atmos. Res., 226, 192–207, https://doi.org/10.1016/j.atmosres.2019.04.015, 2019a.
Hu, J. X., Rosenfeld, D., Ryzhkov, A., Zrnic, D., Williams, E., Zhang, P. F., Snyder, J. C., Zhang, R. Y., and Weitz, R.: Polarimetric Radar Convective Cell Tracking Reveals Large Sensitivity of Cloud Precipitation and Electrification Properties to CCN, J. Geophys. Res.-Atmos., 124, 12194–12205, https://doi.org/10.1029/2019jd030857, 2019b.
Hubbart, J. A., Kellner, E., Hooper, L., Lupo, A. R., Market, P. S., Guinan, P. E., Stephan, K., Fox, N. I., and Svoma, B. M.: Localized Climate and Surface Energy Flux Alterations across an Urban Gradient in the Central US, Energies, 7, 1770–1791, https://doi.org/10.3390/en7031770, 2014.
Kar, S. K. and Liou, Y. A.: Influence of Land Use and Land Cover Change on the Formation of Local Lightning, Remote Sens.-Basel, 11, 407, https://doi.org/10.3390/rs11040407, 2019.
Khain, A., Pokrovsky, A., Pinsky, M., Seifert, A., and Phillips, V.: Simulation of effects of atmospheric aerosols on deep turbulent convective clouds using a spectral microphysics mixed-phase cumulus cloud model. Part I: Model description and possible applications, J. Atmos. Sci., 61, 2963–2982, https://doi.org/10.1175/Jas-3350.1, 2004.
Khain, A. P., Phillips, V., Benmoshe, N., and Pokrovsky, A.: The role of small soluble aerosols in the microphysics of deep maritime clouds, J. Atmos. Sci., 69, 2787–2807, 2012.
Kingfield, D. M., Calhoun, K. M., and de Beurs, K. M.: Antenna structures and cloud-to-ground lightning location: 1995–2015, Geophys. Res. Lett., 44, 5203–5212, https://doi.org/10.1002/2017gl073449, 2017.
Kocen, M.: Observations of sea-breeze fronts along the houston gulf coast, University of Houston, University of Houston libraries, 76 pp., available at: http://hdl.handle.net/10657/864 (last access: 14 November 2020), 2013.
Korolev A. and Mazin, I.: Supersaturation of water vapor in clouds, J. Atmos. Sci., 60, 2957–2974, 2003.
Lebo, Z.: A Numerical Investigation of the Potential Effects of Aerosol-Induced Warming and Updraft Width and Slope on Updraft Intensity in Deep Convective Clouds, J. Atmos. Sci., 75, 535–554, https://doi.org/10.1175/Jas-D-16-0368.1, 2018.
Lee, S. S., Kim, B.-G., Li, Z., Choi, Y.-S., Jung, C.-H., Um, J., Mok, J., and Seo, K.-H.: Aerosol as a potential factor to control the increasing torrential rain events in urban areas over the last decades, Atmos. Chem. Phys., 18, 12531–12550, https://doi.org/10.5194/acp-18-12531-2018, 2018.
Li, Z. Q., Wang, Y., Guo, J. P., Zhao, C. F., Cribb, M. C., Dong, X. Q., Fan, J. W., Gong, D. Y., Huang, J. P., Jiang, M. J., Jiang, Y. Q., Lee, S. S., Li, H., Li, J. M., Liu, J. J., Qian, Y., Rosenfeld, D., Shan, S. Y., Sun, Y. L., Wang, H. J., Xin, J. Y., Yan, X., Yang, X., Yang, X. Q., Zhang, F., and Zheng, Y. T.: East Asian Study of Tropospheric Aerosols and their Impact on Regional Clouds, Precipitation, and Climate (EAST-AIR(CPC)), J. Geophys. Res.-Atmos., 124, 13026–13054, https://doi.org/10.1029/2019jd030758, 2019.
Liu, J. and Niyogi, D.: Meta-analysis of urbanization impact on rainfall modification, Sci. Rep.-UK, 9, 7301, https://doi.org/10.1038/s41598-019-42494-2, 2019.
Morrison, H., Curry, J. A., and Khvorostyanov, V. I.: A new double-moment microphysics parameterization for application in cloud and climate models. Part I: Description, J. Atmos. Sci., 62, 1665–1677, https://doi.org/10.1175/Jas3446.1, 2005.
Niyogi, D., Holt, T., Zhong, S., Pyle, P. C., and Basara, J.: Urban and land surface effects on the 30 July 2003 mesoscale convective system event observed in the southern Great Plains, J. Geophys. Res.-Atmos., 111, D19107, https://doi.org/10.1029/2005jd006746, 2006.
Niyogi, D., Pyle, P., Lei, M., Arya, S. P., Kishtawal, C. M., Shepherd, M., Chen, F., and Wolfe, B.: Urban Modification of Thunderstorms: An Observational Storm Climatology and Model Case Study for the Indianapolis Urban Region, J. Appl. Meteorol. Clim., 50, 1129–1144, https://doi.org/10.1175/2010jamc1836.1, 2011.
Ochoa, C. A., Quintanar, A. I., Raga, G. B., and Baumgardner, D.: Changes in Intense Precipitation Events in Mexico City, J. Hydrometeorol., 16, 1804–1820, https://doi.org/10.1175/Jhm-D-14-0081.1, 2015.
Pinsky, M., Mazin, I. P., Korolev, A., and Khain, A. P.: Supersaturation and diffusional droplet growth in liquid clouds, J. Atmos. Sci. 70, 2778–2793, 2013.
Rosenfeld, D., Lohmann, U., Raga, G. B., O'Dowd, C. D., Kulmala, M., Fuzzi, S., Reissell, A., and Andreae, M. O.: Flood or drought: How do aerosols affect precipitation?, Science, 321, 1309–1313, https://doi.org/10.1126/science.1160606, 2008.
Rosenfeld, D., Andreae, M. O., Asmi, A., Chin, M., de Leeuw, G., Donovan, D. P., Kahn, R., Kinne, S., Kivekäs, N., Kulmala, M., Lau, W., Schmidt, K. S., Suni, T., Wagner, T., Wild, M., and Quaas, J.: Global observations of aerosol-cloud-precipitation-climate interactions, Rev. Geophys., 52, 750–808, https://doi.org/10.1002/2013RG000441, 2014.
Ryu, Y. H., Smith, J. A., Bou-Zeid, E., and Baeck, M. L.: The Influence of Land Surface Heterogeneities on Heavy Convective Rainfall in the Baltimore-Washington Metropolitan Area, Mon. Weather Rev., 144, 553–573, https://doi.org/10.1175/Mwr-D-15-0192.1, 2016.
Sarangi, C., Tripathi, S. N., Qian, Y., Kumar, S., and Leung, L. R.: Aerosol and Urban Land Use Effect on Rainfall Around Cities in Indo-Gangetic Basin From Observations and Cloud Resolving Model Simulations, J. Geophys. Res.-Atmos., 123, 3645–3667, https://doi.org/10.1002/2017jd028004, 2018.
Schmid, P. E. and Niyogi, D.: Modeling Urban Precipitation Modification by Spatially Heterogeneous Aerosols, J. Appl. Meteorol. Clim., 56, 2141–2153, https://doi.org/10.1175/Jamc-D-16-0320.1, 2017.
Sheffield, A. M., Saleeby, S. M., and van den Heever, S. C.: Aerosol-induced mechanisms for cumulus congestus growth, J. Geophys. Res.-Atmos., 120, 8941–8952, https://doi.org/10.1002/2015jd023743, 2015.
Shen, L. X., Zhao, C. F., Ma, Z. S., Li, Z. Q., Li, J. P., and Wang, K. C.: Observed decrease of summer sea-land breeze in Shanghai from 1994 to 2014 and its association with urbanization, Atmos. Res., 227, 198–209, https://doi.org/10.1016/j.atmosres.2019.05.007, 2019.
Shepherd, J. M.: A review of current investigations of urban-induced rainfall and recommmendations for the future, Earth Interact., 9, 1–27, https://doi.org/10.1175/EI156.1, 2005.
Shepherd, J. M., Pierce, H., and Negri, A. J.: Rainfall modification by major urban areas: Observations from spaceborne rain radar on the TRMM satellite, J. Appl. Meteorol., 41, 689–701, https://doi.org/10.1175/1520-0450(2002)041<0689:Rmbmua>2.0.Co;2, 2002.
Shepherd, J. M., Stallins, J. A., Jin, M., and Mote, T. L.: Urbanization: impacts on clouds, precipitation, and lightning. Monograph on Urban Ecological Ecosystems, edited by: Peterson, J. and Volder, A., American Society of Agronomy, Crop Science Society of America, and Soil Science Society of America, 354 pp., https://doi.org/10.2134/agronmonogr55.c1, 2010.
Shimadera, H., Kondo, A., Shrestha, K. L., Kitaoka, K., and Inoue, Y.: Numerical Evaluation of the Impact of Urbanization on Summertime Precipitation in Osaka, Japan, Adv. Meteorol., 2015, 379361, https://doi.org/10.1155/2015/379361, 2015.
Skamarock, W. C., Klemp, J. B., Dudhia, J., Gill, D. O., Barker, D. M., Duda, M., Huang, X. Y., Wang, W., and Powers, J. G.: A description of the advanced research WRF version 3, NCAR, Tech. Note, Mesoscale and Microscale Meteorology Division, National Center for Atmospheric Research, Boulder, Colorado, USA, 2008.
Tao, W. K., Chen, J. P., Li, Z. Q., Wang, C., and Zhang, C. D.: Impact of Aerosols on Convective Clouds and Precipitation, Rev. Geophys., 50, Rg2001, https://doi.org/10.1029/2011rg000369, 2012.
Van Den Heever, S. C. and Cotton, W. R.: Urban aerosol impacts on downwind convective storms, J. Appl. Meteorol. Clim., 46, 828–850, https://doi.org/10.1175/Jam2492.1, 2007.
Varble, A., Fridlind, A. M., Zipser, E. J., Ackerman, A. S., Chaboureau, J. P., Fan, J. W., Hill, A., McFarlane, S. A., Pinty, J. P., and Shipway, B.: Evaluation of cloud-resolving model intercomparison simulations using TWP-ICE observations: Precipitation and cloud structure, J. Geophys. Res.-Atmos., 116, D12206, https://doi.org/10.1029/2010jd015180, 2011.
Varble, A., Zipser, E. J., Fridlind, A. M., Zhu, P., Ackerman, A. S., Chaboureau, J. P., Fan, J. W., Hill, A., Shipway, B., and Williams, C.: Evaluation of cloud-resolving and limited area model intercomparison simulations using TWP-ICE observations: 2. Precipitation microphysics, J. Geophys. Res.-Atmos., 119, 13919–13945, https://doi.org/10.1002/2013jd021372, 2014.
Wiedinmyer, C., Akagi, S. K., Yokelson, R. J., Emmons, L. K., Al-Saadi, J. A., Orlando, J. J., and Soja, A. J.: The Fire INventory from NCAR (FINN): a high resolution global model to estimate the emissions from open burning, Geosci. Model Dev., 4, 625–641, https://doi.org/10.5194/gmd-4-625-2011, 2011.
You, C., Fung, J. C. H., and Tse, W. P.: Response of the Sea Breeze to Urbanization in the Pearl River Delta Region, J. Appl. Meteorol. Clim., 58, 1449–1463, https://doi.org/10.1175/Jamc-D-18-0081.1, 2019.
Zaveri, R. A., Easter, R. C., Fast, J. D., and Peters, L. K.: Model for Simulating Aerosol Interactions and Chemistry (MOSAIC), J. Geophys. Res.-Atmos., 113, D13204, https://doi.org/10.1029/2007jd008782, 2008.
Zhang, Y., Fan, J., Li, Z., and Rosenfeld, D.: Impacts of Cloud Microphysics Parameterizations on Simulated Aerosol–Cloud-Interactions for Deep Convective Clouds over Houston, Atmos. Chem. Phys. Discuss., https://doi.org/10.5194/acp-2020-372, in review, 2020.
Zhong, S., Qian, Y., Zhao, C., Leung, R., and Yang, X. Q.: A case study of urbanization impact on summer precipitation in the Greater Beijing Metropolitan Area: Urban heat island versus aerosol effects, J. Geophys. Res.-Atmos., 120, 10903–10914, https://doi.org/10.1002/2015jd023753, 2015.
Zhong, S., Qian, Y., Zhao, C., Leung, R., Wang, H., Yang, B., Fan, J., Yan, H., Yang, X.-Q., and Liu, D.: Urbanization-induced urban heat island and aerosol effects on climate extremes in the Yangtze River Delta region of China, Atmos. Chem. Phys., 17, 5439–5457, https://doi.org/10.5194/acp-17-5439-2017, 2017.