the Creative Commons Attribution 4.0 License.
the Creative Commons Attribution 4.0 License.
 | 21 Nov 2020
The determination of highly time-resolved and source-separated black carbon emission rates using radon as a tracer of atmospheric dynamics
Luka Drinovec
Irena Ježek
Janja Vaupotič
Matevž Lenarčič
Domen Grauf
Longlong Wang
Maruška Mole
Samo Stanič
Griša Močnik
We present a new method for the determination of the source-specific black carbon emission rates. The methodology was applied in two different environments: an urban location in Ljubljana and a rural one in the Vipava valley (Slovenia, Europe), which differ in pollution sources and topography. The atmospheric dynamics was quantified using the atmospheric radon (222Rn) concentration to determine the mixing layer height for periods of thermally driven planetary boundary layer evolution. The black carbon emission rate was determined using an improved box model taking into account boundary layer depth and a horizontal advection term, describing the temporal and spatial exponential decay of black carbon concentration. The rural Vipava valley is impacted by a significantly higher contribution to black carbon concentration from biomass burning during winter (60 %) in comparison to Ljubljana (27 %). Daily averaged black carbon emission rates in Ljubljana were 210 ± 110 and 260 ± 110 in spring and winter, respectively. Overall black carbon emission rates in Vipava valley were only slightly lower compared to Ljubljana: 150 ± 60 and 250 ± 160 in spring and winter, respectively. Different daily dynamics of biomass burning and traffic emissions was responsible for slightly higher contribution of biomass burning to measured black carbon concentration, compared to the fraction of its emission rate. Coupling the high-time-resolution measurements of black carbon concentration with atmospheric radon concentration measurements can provide a useful tool for direct, highly time-resolved measurements of the intensity of emission sources. Source-specific emission rates can be used to assess the efficiency of pollution mitigation measures over longer time periods, thereby avoiding the influence of variable meteorology.
- Article
(8111 KB) - Full-text XML
-
Supplement
(2364 KB) - BibTeX
- EndNote


Black carbon (BC), an important component of fine particulate matter in the atmosphere, significantly contributes to the climate forcing by aerosols (Pöschl, 2005; Bond et al., 2013; IPCC, 2013) and is an important air pollutant, associated with undesirable health outcomes (Janssen et al., 2011; WHO, 2012). Since BC is a chemically inert primary pollutant, it can be used as a good measured indicator of emissions and can provide valuable information to authorities in the implementation and evaluation of air quality action plans, by indicating the strength of different emissions sources (e.g., Reche et al., 2011; Titos et al., 2015). On the other hand, emission inventories provide important information for climate models by providing data about the changing pattern of BC emissions, its major sources and its historical evolution. From the perspective of short-term local air quality prediction, improving local diurnal and seasonal patterns of BC emissions would greatly benefit the model prediction performance. Although atmospheric chemical transport models based on the fundamental description of atmospheric physical processes can improve the knowledge about temporal evolution of BC emissions at the modelled area, they require comprehensive input data of atmospheric processes (Seinfeld and Pandis, 2016).
Bottom-up emission inventories rely on information on the amount of used fuel combined with fuel-specific emission factors (e.g., Bond et al., 2007; Bond et al., 2013; Klimont et al., 2017). Although current emission inventories agree quite well on the main emission sources and regions, there exist significant uncertainties in the emission factors and activity data, used for emission calculation, with recent observationally constrained estimations much higher than the ones traditionally used (Sun et al., 2019). In contrast to bottom-up emission inventories, top-down constrained methods (such as inverse modelling) focus on minimizing the difference between simulated pollutant concentration, based on estimated emission flux, and measured pollutant concentration (Brioude et al., 2013; Wang et al., 2016b; Guerrette and Henze, 2017). These methods can provide spatially and temporally better resolved assessment of pollutant emissions, including BC, but they are influenced by different sources of uncertainty, mainly from the insufficient evaluation of long-range transport of polluted air masses.
According to the European Union emission inventory report (LRTAP, 2018), 0.2 Tg of BC was emitted in 2016 in the EU-28 region, with the dominant energy-related emissions from on-road and non-road diesel engines accounting for about 70 % of all anthropogenic BC emissions (Bond et al., 2013). A recently updated United States black carbon emission inventory (Sun et al., 2019) pointed out a decreasing trend of BC emissions from 1960 to 2000, dominated by the vehicle, industrial and residential sectors. Traffic-related BC emission primarily dominates particulate matter (PM) emission, especially in major cities (e.g., Pakkanen et al., 2000; Klimont et al., 2017). Recently, biomass combustion for residential heating has been promoted under the label of renewable fuel and additionally increased due to economic crises and increase in other fuel prices (Crilley et al., 2015; Denier van der Gon et al., 2015; Hovorka et al., 2015; Athanasopoulou et al., 2017). Although several studies report a significant role of wood burning emissions in BC concentrations in Alpine valleys (Sandradewi et al., 2008b; Favez et al., 2010; Herich et al., 2014) and Scandinavian rural areas (Ricard et al., 2002; Aurela et al., 2011), an increase in the contribution of wood smoke to fine PM was also noticed in several large urban areas (Favez et al., 2009; Crippa et al., 2013; Fuller et al., 2014; Denier van der Gon et al., 2015; Hovorka et al., 2015; Helin et al., 2018; Zhang et al., 2019). A notable contribution of wood smoke was also observed in Slovenian urban (Ogrin et al., 2016) and rural areas (Wang et al., 2019), responsible for air quality deterioration especially in geographically constrained areas such as valleys and basins.
To assess the efficiency of abatement measures aiming to improve air quality, concentration of pollutants is usually measured before and after the measures are implemented, in order to quantitatively determine the reduction of pollutant concentration. However, this approach can be biased due to changes of micrometeorology of the planetary boundary layer (PBL) which plays an important role in controlling time evolution of pollutant concentration. Therefore, assessment of BC emission rate requires decoupling of meteorologically driven variation from the dynamics of the sources. On diurnal timescales, atmospheric stability and dynamics play a key role in the variability of primary inert pollutants (e.g., Quan et al., 2013; McGrath-Spangler et al., 2015; Tang et al., 2016), such as BC, and are affected by them (e.g., Ferrero et al., 2014). The evolution of the planetary boundary layer (PBL), the lowest part of the troposphere, is driven by convective heat transfer from the ground surface and by mechanical mixing (due to wind shear and surface roughness), which are responsible for the formation of the turbulent mixing layer (ML). ML grows by entraining the air from above and reaches its maximum depth in the late afternoon. The residual layer is formed after the decay of turbulence shortly before sunset, with its bottom portion transformed into a stable nocturnal boundary layer (SNBL) during the night. SNBL is characterized by stable stratification with low mixing. Different approaches exist for mixing layer height (MLH) determination (Seibert et al., 2000).
An alternative way to overcome the difficulty associated with the proper physical interpretation of micrometeorological properties of the ML and dispersion characteristics is the use of a tracer method. The naturally occurring noble radioactive gas radon (222Rn) has been applied in the past for different studies. Radon characteristics, its emanation from rocks and its transport in rocks, soil (e.g., Etiope and Martinelli, 2002) and the atmosphere (e.g., Williams et al., 2011; Williams et al., 2013), were comprehensively studied in the past. Radon was used to study long-range transport of air masses (Hansen et al., 1990; Crawford et al., 2007), PBL characteristics (e.g., Griffiths et al., 2013; Williams et al., 2013; Pal et al., 2015; Salzano et al., 2016; Vecchi et al., 2018), microclimate spatial variability (Chambers et al., 2016; Podstawczyńska, 2016) and impact assessment of atmospheric stability on local air pollution (Perrino et al., 2001; Chambers et al., 2015; Crawford et al., 2016; Wang et al., 2016a; Williams et al., 2016; Chambers et al., 2019). Good correlation, at least for the periods of thermally driven PBL convection, was observed in previous studies comparing effective MLH derived by the box model and MLH obtained by modelling approaches based on turbulence variables (Allegrini et al., 1994; Vecchi et al., 2018; Kikaj et al., 2019) or remote sensing techniques (sodar, lidar) (e.g., Salzano et al., 2016). Kikaj et al. (2019) successfully identified persistent inversion events in the Ljubljana basin based on 222Rn measurements. The emission pattern of gaseous traffic-related air pollutants in Bern (Switzerland), estimated by a box model based on a radon tracer, with an included advection term, showed an excellent correlation with traffic density (Williams et al., 2016). These studies imply that the radioactive tracer method gives reliable information on the effective mixing layer height and indication of atmospheric stability (e.g., Perrino et al., 2001), which can be easily implemented in the environmental monitoring networks.
The strength of radon flux from the surface to the atmosphere, the so-called radon exhalation rate (ERn), depends mainly on the surface permeability and the radon potential (Karstens et al., 2015), which are controlled by geological and climatic characteristics of the area (e.g., Vaupotič et al., 2007; Vaupotič et al., 2010; Kardos et al., 2015; Karstens et al., 2015). As reported by Vaupotič et al. (2007), measured ERn on Slovenian territory spans a large range from tens to several hundred milli-becquerels per square metre per second. Karstens et al. (2015) reported modelled radon exhalation rate on a European scale, which varies in the range from 70 to 150 and from 160 to 180 Bq m−2 h−1 in the southwestern part of Slovenia in winter and summer, respectively. The range of ERn in the central part of Slovenia is 35–90 and 90–125 Bq m−2 h−1 for winter and summer, respectively. Radon exhalation rate is usually considered constant on short temporal scales in areas with homogeneous geologic characteristics (Pearson and Jones, 1965). However, exhalation of Rn is a complex process which can be assessed with different modelling approaches. Salzano et al. (2016) showed, that the error in the modelled effective MLH, by considering constant radon source, can be up to 10 %. Local heterogeneity of ERn due to heterogeneous soil permeability (within a range of a few metres) is homogenized in the thin atmospheric layer (∼ 0.5 m) close to the ground and does not represent a significant concern for measurements above this height (Ochmann, 2005). Due to a continuous source from the surface, radon concentration profiles in the SNBL can exhibit strong gradients, resulting in higher radon concentration when measurements are conducted closer to the ground, especially in the SNBL conditions. On a seasonal scale, however, ERn decreases with the presence of snow cover or frozen soil or during and shortly after (on a timescale of a few days) rainy periods, due to reduced surface permeability, thus representing one of the main sources of uncertainty in the box model. It is also worth noting that reliable exhalation rate measurements (used for the box model) should be conducted in a broad network in the extent of modelled area in different periods of year, so the seasonal changes in soil permeability would also be considered. The seasonal changes of ERn were already pointed out in different studies (Karstens et al., 2015; Salzano et al., 2016; Williams et al., 2016; Chambers et al., 2019).
The aim of this paper is to determine the BC emission rate apportioned to traffic and biomass burning sources and its diurnal pattern and monthly variation for two distinct locations in Slovenia (Europe), which differ from the point of view of their natural characteristics (geology, geomorphology, meteorology) and urban environment (urban and rural background). Both sites are subjected to their own pattern of air pollution episodes which will be addressed and interpreted based on an Eulerian box model. The effective mixing layer height will be reproduced for both sites based on Rn measurements, taking into account seasonally resolved ERn, then used for decoupling meteorologically driven changes of measured BC concentration from those resulting from the source dynamics. The highly time-resolved and source-apportioned BC emission rate (EBC) represents essential information for short-term forecasts of air pollution episodes as well as for the evaluation of the efficiency of air quality abatement measures and their potential adaptation. Temporal variation in BC concentration will be highlighted from the point of view of PBL evolution.
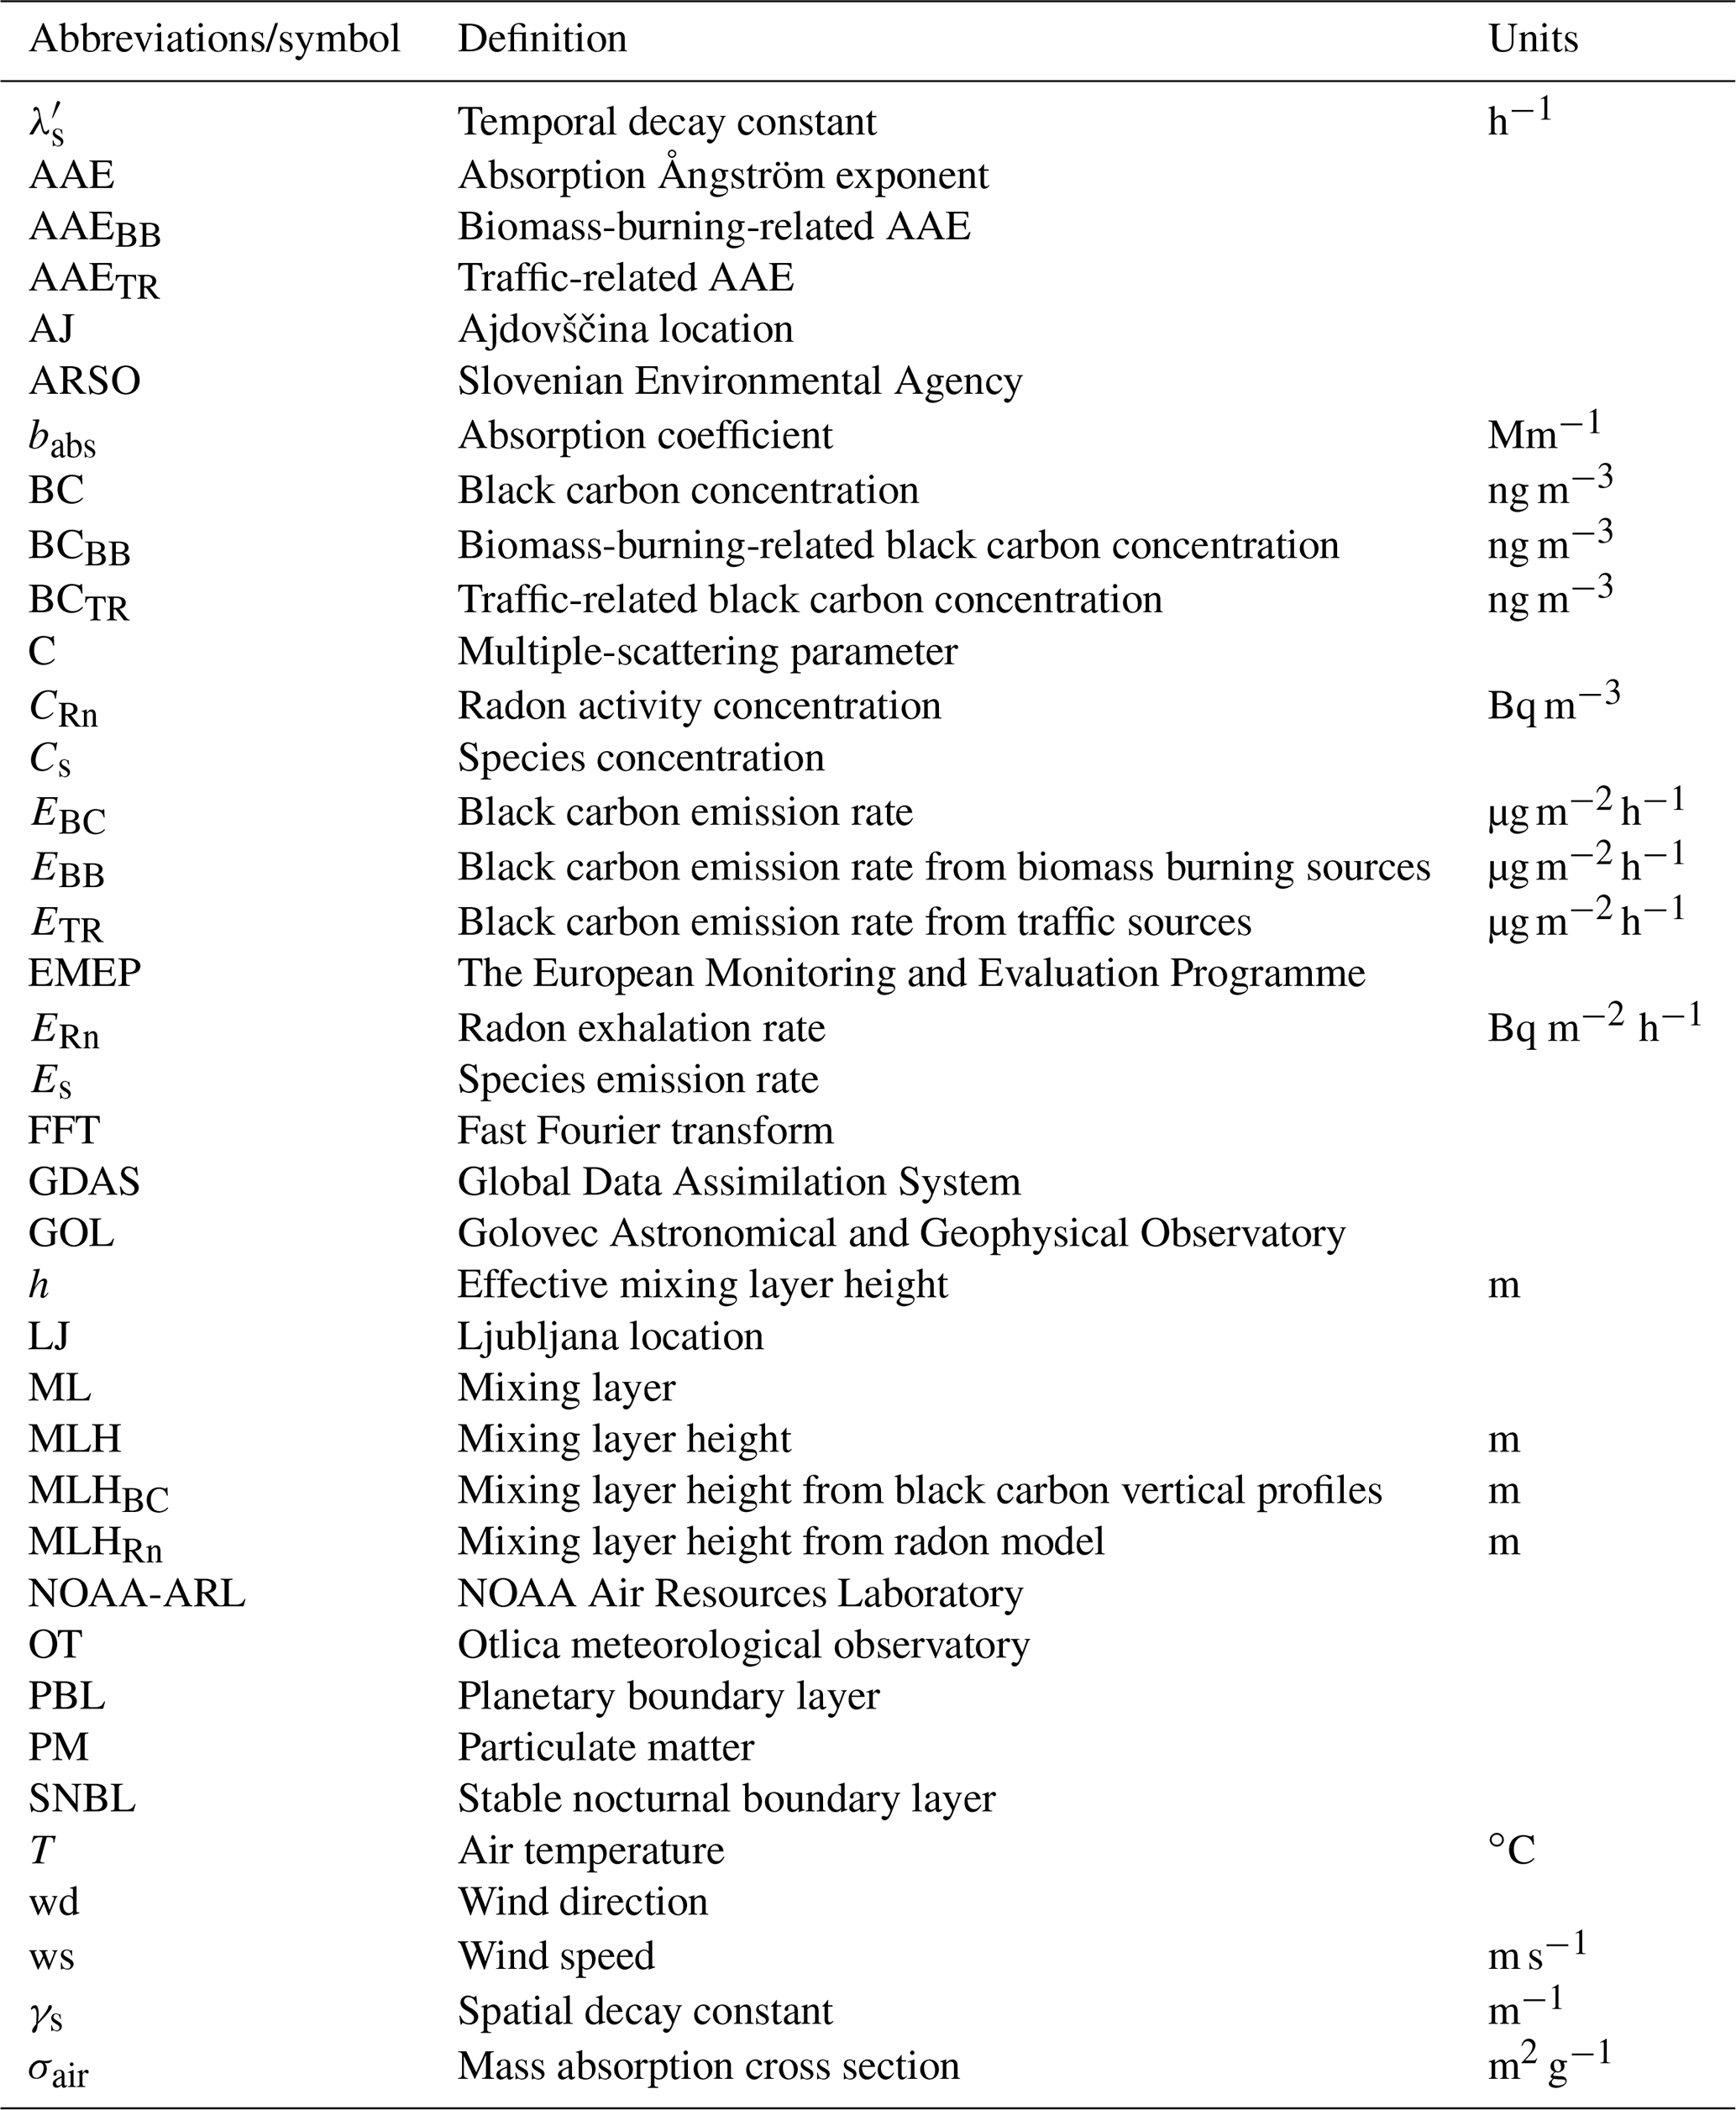
A list of abbreviations and symbols used in this paper is given in Table 1.
2.1 Measurement locations
Two distinct measurement locations were selected for this study. The first one is located in the urban area of Ljubljana (LJ, capital city of Slovenia), which lies in the central part of Slovenia (Europe) (Fig. 1). The second measurement location was in a small town, Ajdovščina (AJ), located in the Vipava valley in the western part of Slovenia. Measurement campaigns lasted from autumn 2016 to spring 2017 (23 November 2016 to 20 May 2017) in Vipava valley and from winter 2017 to summer 2017 (1 February 2017 to 8 June 2017) in Ljubljana. Due to its basin location, Ljubljana is characterized by poor ventilation and frequent occurrence of persistent temperature inversions (Kikaj et al., 2019), which constrains pollutants emitted from surface sources within the limited air volume inside the basin. During stable atmospheric conditions, especially in the SNBL, a thin layer of drainage winds (colder air, adjacent to the ground, flowing downhill under the influence of gravity) and a flow of air from the edge of the city towards the centre (formed due to the heat island) governs air circulation within the Ljubljana basin (Stull, 1988; Ogrin et al., 2016). Ljubljana is characterized by temperate continental climate, with a significant seasonal temperature cycle.

Figure 1Map of Slovenia (a) with marked areas of measurement sites Ljubljana (LJ) and Vipava valley (VV). (b) The city of Ljubljana with urban background (ARSO) and hill (Golovec – GOL) measurement sites. (c) Area of the Vipava valley with urban background (Ajdovščina – AJ) and hill (Otlica – OT) measurement sites (Source: map data © 2018 GeoBasis-DE/BKG (© 2009) Google and OpenStreetMap).
The population of the wider Ljubljana basin is around 500 000, of which 287 000 live in the urban municipality of Ljubljana. Many more than 100 000 daily commuters from other municipalities represent additional traffic flow on working days (Ogrin et al., 2016). Besides traffic-related air pollution, emissions from combustion of biomass fuel for residential heating are a significant source of particulate concentrations in the whole country (Gjerek et al., 2018), not only in rural areas, but in Ljubljana as well. Although district heating is provided in several areas of the city, the use of wood boilers and fireplaces is a common practice.
The population of the second area of interest including surrounding villages is relatively small, with about 7000 residents living in the town of Ajdovščina. The Vipava valley is confined to the north by the steep ridge, which rises up to about 1000 m a.s.l., and to the south by the Karst plateau with an average altitude of about 300 m. Due to the complex topography, the valley usually experiences two extreme cases of atmospheric stability conditions. On the one side, stable atmospheric conditions can last for several days, leading to the formation of strong vertical aerosol gradients, which are followed by frequent occurrences of strong downslope bora wind (Mole et al., 2017; Wang et al., 2019). A highway connecting the central part of Slovenia with Italy runs through the valley on the southern border of the town, around 800 m away from our measurement site. The Mediterranean climate of this area is responsible for mild winters and warm summers, with residential heating mainly limited to the cold season, from November to February, with biomass fuel being the primary source of energy.
From a geological point of view, the city of Ljubljana lies in the neotectonic basin with extensive and thick accumulations of Quaternary glaciofluvial sediments on the northern and central parts (gravel and conglomerate), whereas the southwestern part of the Ljubljana basin is filled with lacustrine and paludal sediments (Janža et al., 2017). The maximum thickness of sediments is around 170 m. Non-consolidated Quaternary sediments are permeable enough to allow spatially and temporally homogeneous Rn exhalation rate.
The geological structure of the broader area of Vipava valley results from Tertiary thrust of Cretaceous limestone, which forms the steep northeastern ridge of the valley, on the Eocene flysch rocks, forming the valley floor. Flysch rocks consist of alternating layers of marlstone and carbonatic sandstone. Due to physical weathering of the limestone, a large amount of limestone scree material has been formed and deposited on the underlying flysch rocks on the slopes of the northeastern ridge. The valley floor is covered by clayey weathered residual of flysch rocks with fine flysch scree (Jež, 2007). Spatially homogeneous Rn exhalation rates can be expected along the valley.
2.2 Black carbon measurements and source apportionment
Measurements of black carbon concentration were conducted at two sites at each location, Ljubljana and Vipava valley, one at the urban background and the other one at the higher altitude (Fig. 1), in order to provide insight into the extent of the vertical aerosol mixing. Periods during which similar BC concentrations were measured at both sites indicate time periods when MLH reached or exceeded altitude differences between both sites. Although this kind of measurement composition certainly indicates periods of stable PBL conditions, detection of the exact time of MLH reaching the upper site is more uncertain due to diffusion mixing (in the case of Ljubljana) or local slope winds (Leukauf et al., 2016) (Vipava valley), and therefore it does not provide undisturbed MLH evolution characteristics for the whole valley/basin.
The urban background site of the Slovenian Environment Agency (ARSO) was used for BC measurements in the city of Ljubljana (295 m a.s.l.), while measurements at the Golovec Astronomical and Geophysical Observatory (GOL), 100 m above Ljubljana (395 m a.s.l.), were used as the hill site. The inlet at ARSO was about 4 m above the ground, while the inlet at GOL was about 2.5 m above ground. Measurements in the Vipava valley were conducted about 12 m above ground level (120 m a.s.l) on the roof of the building of the University of Nova Gorica, located in the town of Ajdovščina (AJ). About 830 m higher (950 m a.s.l.), on the northeastern ridge of the valley, the second measurement site was installed at the Otlica meteorological observatory (OT) of the same university.
Aerosol light absorption and corresponding mass equivalent black carbon concentration (BC) were measured at seven different wavelengths (370–950 nm) using the Aethalometer model AE33 (Magee Scientific, Aerosol d.o.o.), with the “dual spot” technique used for real-time loading effect compensation (Drinovec et al., 2015). Flow rate was set to 5 L/min and the measurement time resolution to 1 min. A TFE-coated glass fibre filter was used with the multiple-scattering parameter (C) set to 1.57. The mass absorption cross section σair of 7.77 m2 g−1 was used to convert the optical measurement at 880 nm to BC mass concentration.
Aethalometer measurements at different wavelengths provide an insight into the chemical composition of light-absorbing particles. The so-called Aethalometer model (Sandradewi et al., 2008a) was used to apportion BC to traffic (BCTR) and biomass burning (BCBB) sources. The model uses an a priori assumed pair of absorption Ångström exponents (AAEs) for traffic (AAETR) and biomass burning (AAEBB) to determine the contribution of both sources. AAETR and AAEBB were set to 1.0 and 2.0, respectively. Further discussion on the choice of AAE pair used for source apportionment is provided in Sect. S1 of the Supplement.
2.3 Radon measurements
Radon measurements were conducted at both measurement locations, in the city of Ljubljana on the floor of the basin and on the floor of Vipava valley, close to the town of Ajdovščina. Measurements cover longer periods than BC measurements: from 11 November 2016 to 31 May 2017 in Vipava valley (with about a 1-month gap in March 2017 due to instrument malfunction) and from 14 December 2016 to 8 June 2017 in Ljubljana. At both measurement sites, instruments were installed outdoors under the roof of a single-family house (to shelter instruments from environmental effects, but otherwise open), surrounded by unperturbed natural soil ground. Both sites were selected in the area that is subjected to the same boundary layer characteristics as aerosol measurements. Instruments were installed 1 and 3 m above ground in Ljubljana and Vipava valley, respectively. Radon activity concentration (CRn) was measured using an AlphaGUARD PQ2000 PRO (Bertin Instruments) radon monitor. In the instrument, the measured gas diffuses through a large-surface glass fibre filter into the ionization chamber. The instrumental lower limit of detection is 2–3 Bq m−3 at 1 h time resolution. In order to decrease noise, radon measurements were smoothed by applying a FFT filter with a cut-off frequency of 0.25 h−1. Comparison of smoothed and raw Rn measurements is shown in Fig. S6. Due to sampling in diffusion mode, 1 h time lag was considered when combining CRn data with other measurements.
2.4 Meteorological parameters and supporting information
Meteorological parameters, such as air temperature (T), wind speed and direction (ws, wd), amount of precipitation, and snow cover were provided by the Slovenian Environment Agency (ARSO) for the Ljubljana measuring location. In the Vipava valley, all meteorological parameters are measured at the meteorological station situated at the valley floor close to the town of Ajdovščina, whereas wind data were collected at the rooftop of the University of Nova Gorica building in Ajdovščina as a part of research conducted at the Centre for Atmospheric Research (Mole et al., 2017).
The MLH dataset, obtained from the NOAA Air Resources Laboratory (NOAA-ARL) Global Data Assimilation System (GDAS) database (Rolph et al., 2017), was considered as supplementary information for comparison with the effective MLH values derived from the box model. The archived dataset has a spatial resolution of 1∘ and temporal resolution of 3 h. Although spatial resolution is not fine enough to capture local micrometeorological characteristics, it gives an estimation on the wider area PBL stability and effective mixing height.
Traffic count data for Ljubljana were provided by the municipality of Ljubljana for the whole period of measurements for several different locations within the city.
Two complementary methods were used for detection of MLH and comparison with MLH derived by the box model. Scanning mobile Mie-scattering lidar is used at the University of Nova Gorica for studies of bora wind (Mole et al., 2017), aerosol properties and PBL characteristics (Wang et al., 2019) in the Vipava valley. Detailed lidar configuration and performance are provided by He et al. (2010). In our study, MLH was estimated based on the retrieval of range-corrected lidar signal in selected periods. On the other hand, vertical BC concentration profiles were measured over the Ljubljana basin by ultralight aircraft on selected days from February to May 2017. A lighter modified version of the Aethalometer AE33 with an isokinetic sampling inlet was used for BC vertical profile measurements. Measurements provided useful information about aerosol vertical dispersion characteristics and MLH estimation (Ferrero et al., 2011). Further details about the analysis approach are provided in the Supplement (Sect. S2).
2.5 Radon-based MLH modelling
The box model approach introduced in previous studies (Sesana et al., 2003; Griffiths et al., 2013; Salzano et al., 2016; Williams et al., 2016; Vecchi et al., 2018) employs the Eulerian approach, including a constant radon source (ERn) and vertical entrainment of air masses from the residual layer. Salzano et al. (2016) improved the model performance by considering the variability in the soil radon exhalation rate, where the authors showed up to a 10 % difference in modelled MLH compared to the model using a constant Rn source. In this paper we applied the approach introduced by Williams et al. (2016), where an inclusion of a simplified horizontal advection term allows the quantification of local emissions of air pollutants.
Considering a vertically well-mixed box (box dimension discussed in detail in Sect. 2.6.1) with species concentration Cs, the mass of species “s” in a column of air within the effective MLH (h) over 1 m2 at time ti depends mainly on the emissions (Es) from the surface and the remaining mass of species from the previous time period (ti−1). When ML is growing (), there is an additional encroachment of species, which remained in the residual layer from the previous day, while in the case when this layer is shrinking (), a part of mass is considered to be removed from the mixing layer (Eq. 1).
The term ΔTs (Eq. 2) includes correction due to decay of species in time period , which is characterized by decay constant . If decay rate is very slow, decay of species within dt becomes negligible; thus ΔTs→dt.
Decay constant takes into account temporal decay and horizontal advection. The temporal decay constant λs (h−1) accounts for internal sinks due to chemical reactions, dry and wet deposition, or radioactive decay. Horizontal advection assumes exponential decrease in species concentration downstream (Eq. 3) and is characterized by spatial decay constant γs (m−1):
where U represents layer-averaged wind speed. A small uncertainty is introduced to the model, since wind data were available only from standard meteorological measurements at the height of 2 m above the surface.
Three different cases can be parameterized during the course of a day.
During stable conditions, when , Eq. (1) is reduced to Eq. (4):
After the sunrise when PBL starts to grow (), a volume of air mass from the residual layer is incorporated into the expanding ML and the term from the last part of Eq. (1) is modelled as (Eq. 5):
where is species concentration from the previous day at time t0, just before the afternoon transition to SNBL. represents the concentration of species in the residual layer.
When PBL is shrinking () a volume of air is decoupled from ML and forms the residual layer. of Eq. (1) is set to .
The first phase of modelling is focused to the quantification of the effective MLH based on atmospheric Rn concentration measurements. Rn data with 1 h time resolution were first smoothed by applying the FFT filter with a cut-off frequency of 0.25 h−1 in order to decrease noise level, since small changes of Rn concentration can cause unexpected fluctuation in the calculated MLH. Assuming a constant, spatially homogeneous radon source, which extends beyond the limits of our modelled area, the spatial decay constant in Eq. 3 can be approximated to zero (γRn=0) and decay constant is equal to the radon radioactive decay constant: . Radioactive decay accounts for less than 1 % of CRn decrease during the course of 1 h.
For stable atmospheric conditions, when , Eq. (4) is simplified to
where dCRn represents the difference in radon concentration measured in the time period dt:
The condition of expanding or shrinking ML is tested by comparing the difference of concentration with emission of Rn to the ML with in the same time period. In the case of expanding ML, change of Rn concentration is smaller than expected for stable MLH: (Eq. 8), whereas in the case of shrinking ML, concentration increases faster than would be expected for stable MLH: (Eq. 9). Effective MLH is then calculated for the two separate conditions as
where represents radon concentration remaining after decay in the residual layer from the previous afternoon. An approximation of linear decrease in with height was considered (Williams et al., 2011), reaching radon concentration of zero at the top of the previous day's residual layer. When MLH reaches its full extent in the late afternoon, it can extend above the previous day's residual layer, thus incorporating Rn “free” air into the ML.
2.5.1 Determination of radon exhalation rate – ERn
The MLH values, determined by the box model, strongly depend on the correct estimation of radon exhalation rate. As discussed in previous sections, ERn is affected by seasonal meteorological changes mostly by varying soil humidity and permeability. Since continuous monitoring of ERn is usually not available, the box model has to be calibrated to the available information of MLH. Due to vertical gradients in radon concentration, which are especially present during the SNBL conditions, the height of radon measurements above ground level can play an important role in its observed daily variation, potentially biassing the results of the modelled MLH, if the measurement height is not taken into account. As introduced by Griffiths et al. (2013), the actual radon exhalation rate (ERn−0) has to be calibrated based on the radon measurement height. Therefore, the radon exhalation rate estimated in this study represents an effective ERn, rather than actual ERn−0 for the area under consideration (Eq. 10):
where s represents a scaling factor which depends on the measurement height. Lower measurement height results in larger s. We use this effective exhalation rate, representing a wider region, in our model.
The calibration of the radon box model in terms of selection of appropriate ERn was performed by combining three different approaches.
Comparison of the radon-derived MLH (MLHRn) (for ERn in the range from 50 to 400 Bq m−2 h−1) was based on Eqs. (6), (8) and (9) with modelled values of MLH, obtained from the Air Resources Laboratory (NOAA-ARL) Global Data Assimilation System (GDAS) database. The approach is explained in detail in the Supplement Sect. S5.1. A 100 Bq m−2 h−1 acceptable range was used.
MLH determined in the first step was compared to black carbon measurements at different elevations. When MLH exceeds the elevation of the higher BC measurement site (hill), BC concentration is expected to be similar at both measurement sites (city and hill), whereas in the period when MLH is below the hill measurement site, a strong gradient in BC concentration is observed. In the third step, radon-derived MLHRn for selected days was compared to the MLH determined from vertical profiles (MLHBC) of BC measured with an aircraft over the Ljubljana basin (Supplement Sect. S2) or with lidar-derived MLH in the Vipava valley.
The results of the first approach were used as the first estimate of the ERn. In the case of high uncertainty (low number of data points, wide confidence interval level, unrealistic values of ERn estimate), the second approach was used to confirm the previously obtained ERn estimates or to obtain a suitable range of ERn. For the months when the BC vertical profiles or lidar-derived MLH were available, the third approach was used to estimate the ERn. Graphical presentation of the above-mentioned approaches for each month is presented in the Supplement Sect. S5.2.
This method allowed us to obtain average monthly exhalation rate (Table 2) using the data from the meteorological model (GDAS), even though the model spatial and time resolution is low. We interpret this effective exhalation rate to be representative of the investigated regions for the purpose of using it in our model.
Table 2Selected Rn exhalation rates (ERn) and the range (ERn−min–ERn−max) for each month for both measurement locations.
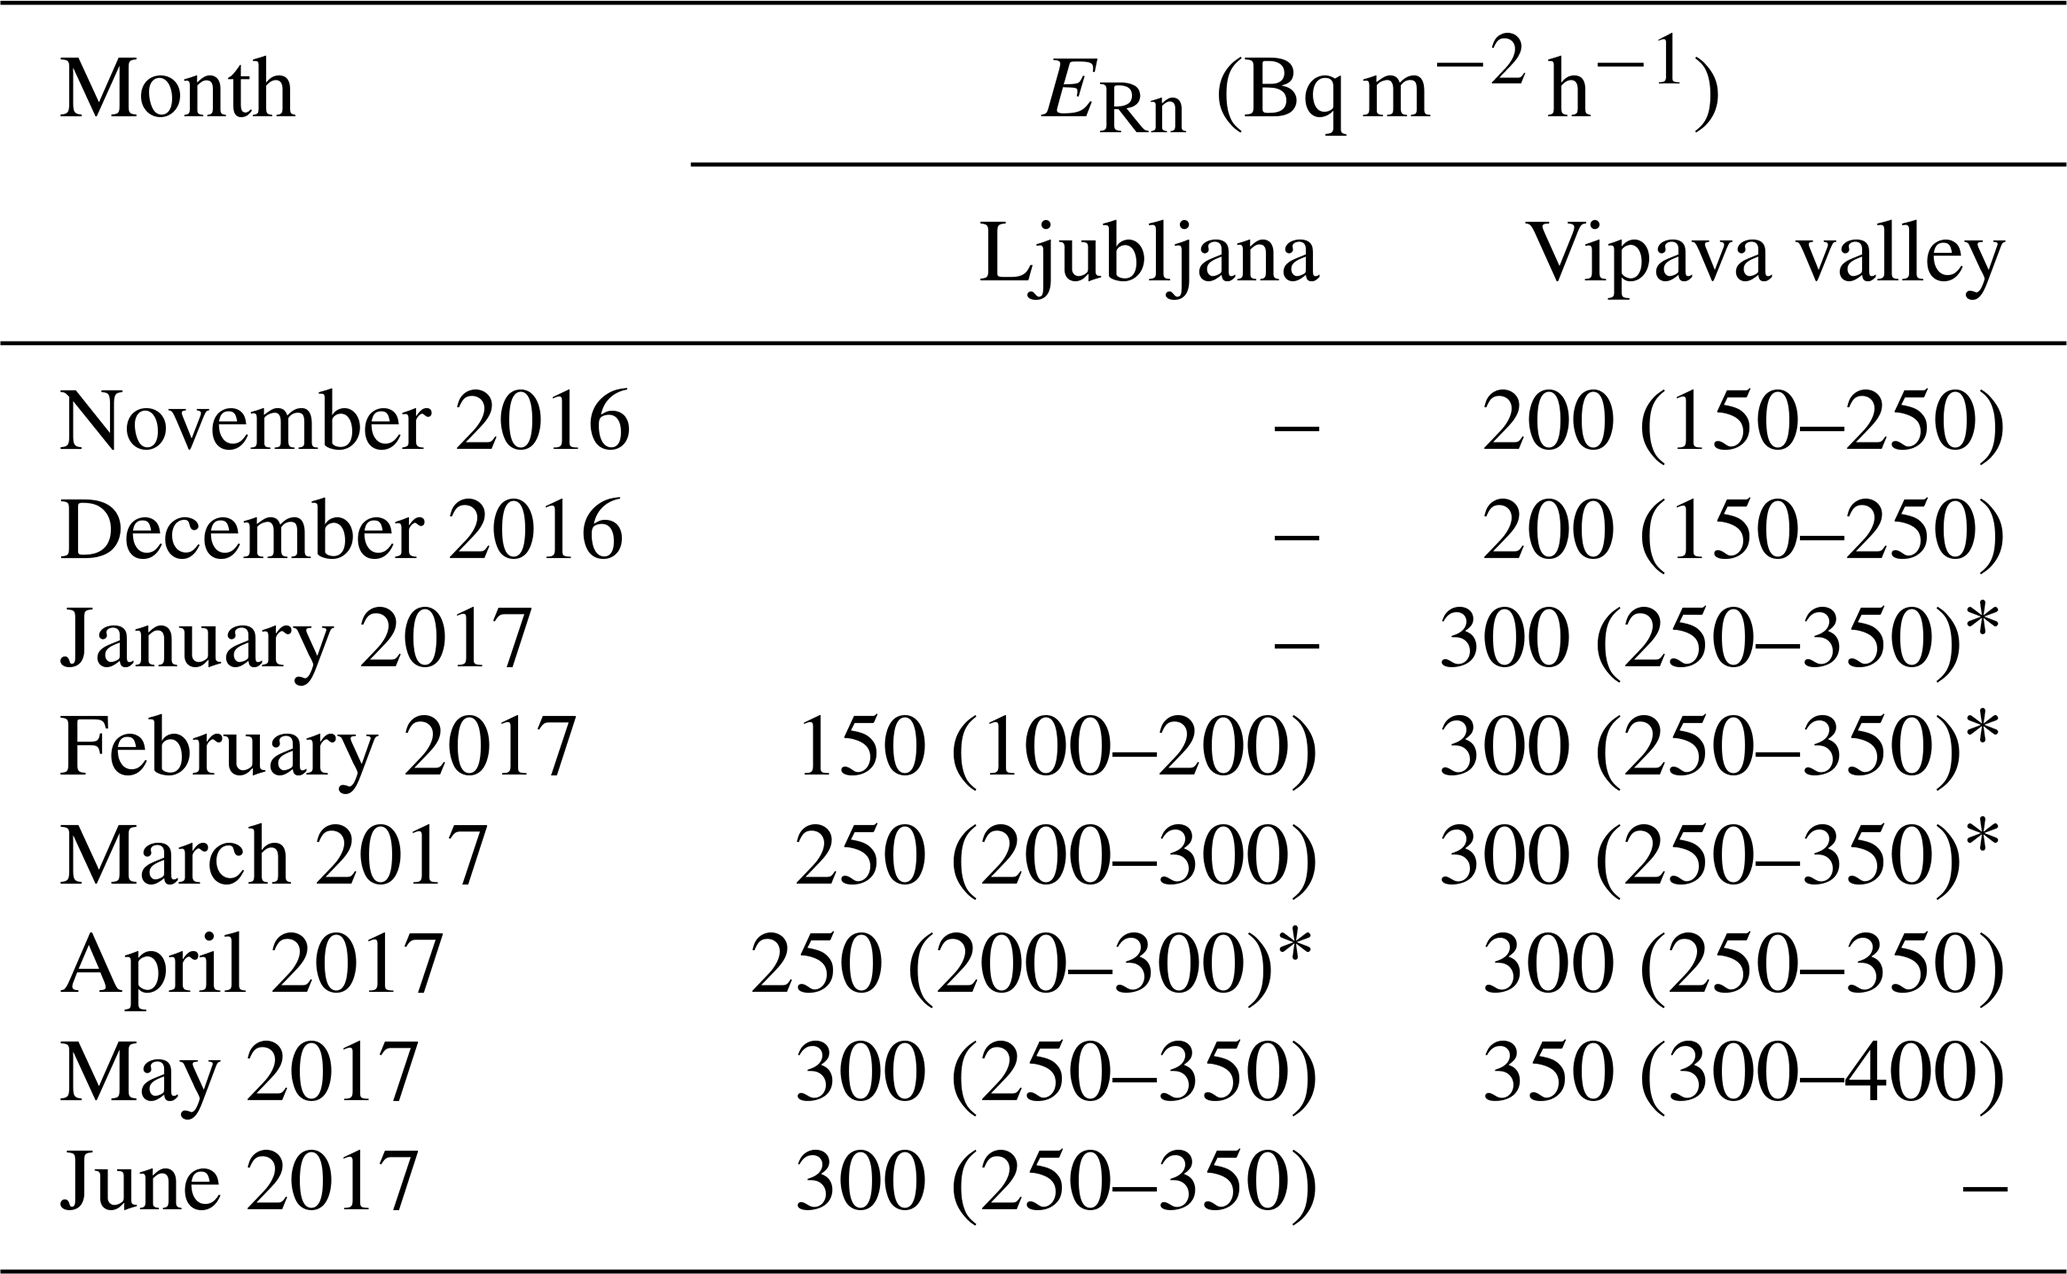
* High uncertainty.
2.6 Black carbon emission rate modelling
The second part of modelling uses the box model (Eq. 1), where measured BC concentrations, apportioned to sources, are inverted, taking into account effective MLH determined during the first step, to calculate hourly resolved BC emission rate (EBC).
The 1 min dataset of source-apportioned BC concentration was first averaged to a 1 h time base in order to correspond to the determined MLH values. BC emission rates were calculated separately for traffic (ETR) and biomass burning emissions (EBB), using Eqs. (11) and (12), for increasing and decreasing MLH, respectively:
where the index i represents the traffic (TR) or biomass burning (BB) contributions to BC concentrations, and is the decay constant calculated by Eq. (3), which accounts for temporal decay and horizontal advection. The latter is introduced due to dispersion characteristics and inhomogeneous spatial distribution of emission sources, which usually leads to a decrease in species concentration downstream. In the Eulerian box model, the difference between species concentration within the modelled area and outside the box controls the spatial decrease in the concentration downstream. Based on the study presented by Williams et al. (2016), an assumption of exponential decay was considered in this study to simplify the model and overcome the missing measurements at the outer box limits. The size of the modelled area and distribution of specific sources lead to source-specific spatial decay constants, namely γBB for biomass burning and γTR for traffic-related BC. Spatial decrease in BC concentration with distance from the source for different choices of γ is presented in Fig. S13a.
Since BC particles are inert, the rate of BC removal from the atmosphere is governed by wet deposition (e.g., Blanco-Alegre et al., 2019). The temporal sink was estimated based on mean lifetime of soot particles in the atmosphere, which can be considered between 1 week and 10 d (Cape et al., 2012). Therefore λBC of 0.006 h−1 was considered in this study, corresponding to 1-week mean lifetime of BC. The same temporal sink was considered regardless of BC source.
Data analysis and graphical representation were performed using the R programming language (R Core Team, 2018), with the “ggplot2” (Wickham, 2009), “openair” (Carslaw and Ropkins, 2012), “dplyr” and “deming” packages. If not stated otherwise, time is reported as local time (CET/CEST). Seasonal statistics was computed considering December–February as winter, March–May as spring, June–August as summer and September–November as autumn.
2.6.1 Determination of decay constants
Horizontal advection dominates over the BC temporal sink, which is responsible for a small offset in modelled emission rates. A longer estimated lifetime of BC particles would result in lower modelled emission rates. Changing λBC from 0.006 h−1 (mean lifetime of 7 d) to 0.004 h−1 (mean lifetime of 10 d) would lower the average BC emission rate by approximately 15 %. On the other hand, horizontal advection as parametrized by the estimated spatial decay constant has much stronger influence on the calculation of BC emission rates. Since horizontal advection strongly depends on wind speed, the total decay constant () also follows the diurnal wind pattern with the highest values in the afternoon (Fig. S5). When ws →0, the only process responsible for decrease in BC concentration is its temporal sink. With higher wind speed, concentration would decrease exponentially. Previous studies of BC source apportionment and distribution of BC apportioned to traffic and biomass burning sources, performed in the Ljubljana basin, have revealed a homogeneous distribution of BCBB, while BCTR showed a stronger dependence on the proximity of traffic sources (Ogrin et al., 2016). Therefore, γBB for the Ljubljana basin was selected based on the general area contributing to BCBB concentrations and was set to m−1 (Table 3), which corresponds to half-distance decay of approximately 14 km. On the other hand, a smaller contributing area was chosen for BCTR; thus γTR was set to m−1 (corresponding to 10 km half-distance decay). A comparison with the traffic density shows that the most suitable γTR for Ljubljana is found in the range from to m−1 (Fig. S13b). Overestimating horizontal advection (an overestimation of the γ value) would result in an overestimation of ETR (and EBB), which would be especially pronounced during the periods of stronger wind speed, thus in the afternoon, which would result in an altered ETR diurnal pattern. Results of sensitivity analyses of modelled ETR for different γTR values, which were performed based on comparison with measured traffic density at a representative location close to the BC measurement site in Ljubljana, are presented in the Supplement (Sect. S6).
Table 3Summary of temporal and spatial decay constants selected for the modelled Ljubljana and Vipava valley area.
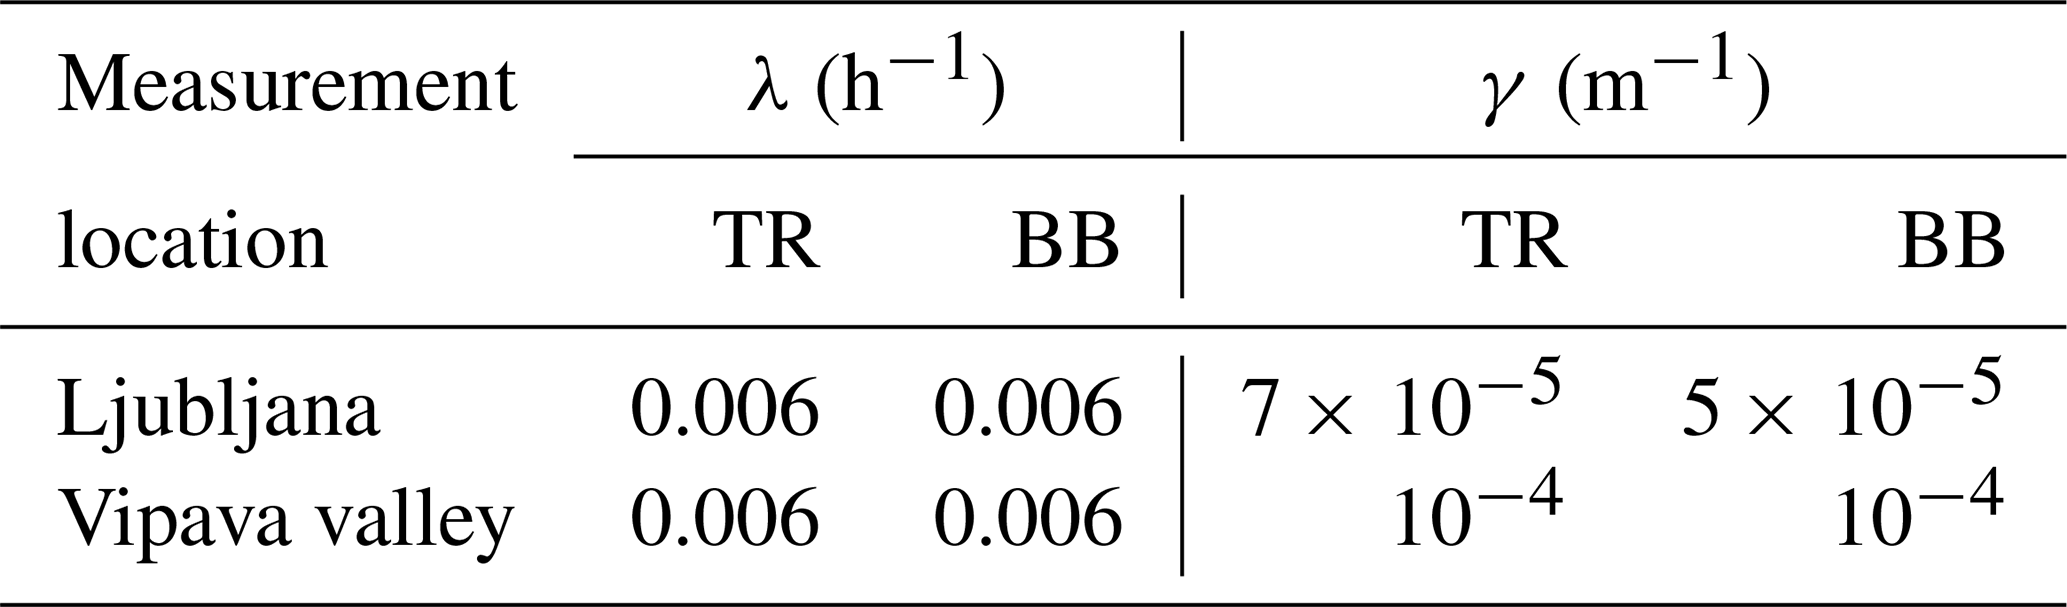
Vipava valley is geographically constrained to a smaller area, with a small urban centre, widespread distribution of individual houses and a highway running along the valley. Considering these characteristics, γBB and γTR were both set to 10−4 m−1 (7 km half-distance decay).
3.1 Radon concentration and meteorological conditions
Average radon activity concentration derived from hourly measurements (Fig. 2) was similar at both measurement locations, 15 ± 11 and 14 ± 10 Bq m−3 in winter and 13 ± 9 and 12 ± 8 Bq m−3 in spring, in Ljubljana and Vipava valley, respectively (Table 4). Note that radon measurements were performed at different heights above ground: 1 and 3 m in Ljubljana and Vipava valley, respectively, which affects average concentrations. These values are above the annual average outdoor radon concentration of 10 Bq m−3 reported by UNSCEAR (2000) for the continental areas. Due to limited atmospheric mixing, higher winter concentrations are usually observed. However, a decrease in atmospheric CRn by more efficient atmospheric mixing is compensated for by increased radon exhalation rate in the warmer season.
Table 4Summary statistics (mean ± standard deviation) of measured Rn concentration (Bq m−3), BC (µ g m−3) concentration apportioned to traffic and biomass burning for urban background sites in Ljubljana (ARSO) and Vipava valley (AJ), and BC (µg m−3) concentration at the hill sites (GOL and OT).


Figure 2Time series of radon activity concentration (CRn) measured in Ljubljana and (a) and in Ajdovščina (at the floor of Vipava valley).
Apart from the changes in radon exhalation rate from the ground, time evolution of CRn is mainly affected by atmospheric dispersion characteristics. Periods of mechanically driven mixing within the PBL, with stronger wind speeds, and periods of prevailing thermally driven mixing can be distinguished in particular during winter months, which results in irregular diurnal time evolution. Typical diurnal variation is more pronounced in spring, when thermally driven atmospheric mixing prevails. Due to the limitations of the box model, this study is limited to the cases with a thermally driven convective boundary layer. With this in mind only days with average daily wind speeds below 2 m/s were considered and addressed further on as “normal” wind conditions. Local wind conditions are further presented in the Supplement (Sect. S3, Figs. S4 and S5). Diurnal variation in CRn in thermally driven convective mixing, presented in Fig. 3, reflects daily evolution of the PBL with the lowest CRn in the middle of the day, when PBL is fully mixed. The lowest values of CRn are on average around 5 Bq m−3. CRn starts to increase with the afternoon transition to the stable boundary layer and reaches the highest values in the early morning. The amplitude of diurnal variation is controlled by PBL stability and duration of SNBL, resulting in the highest morning peak values in winter months, when the SNBL regime lasts longer.
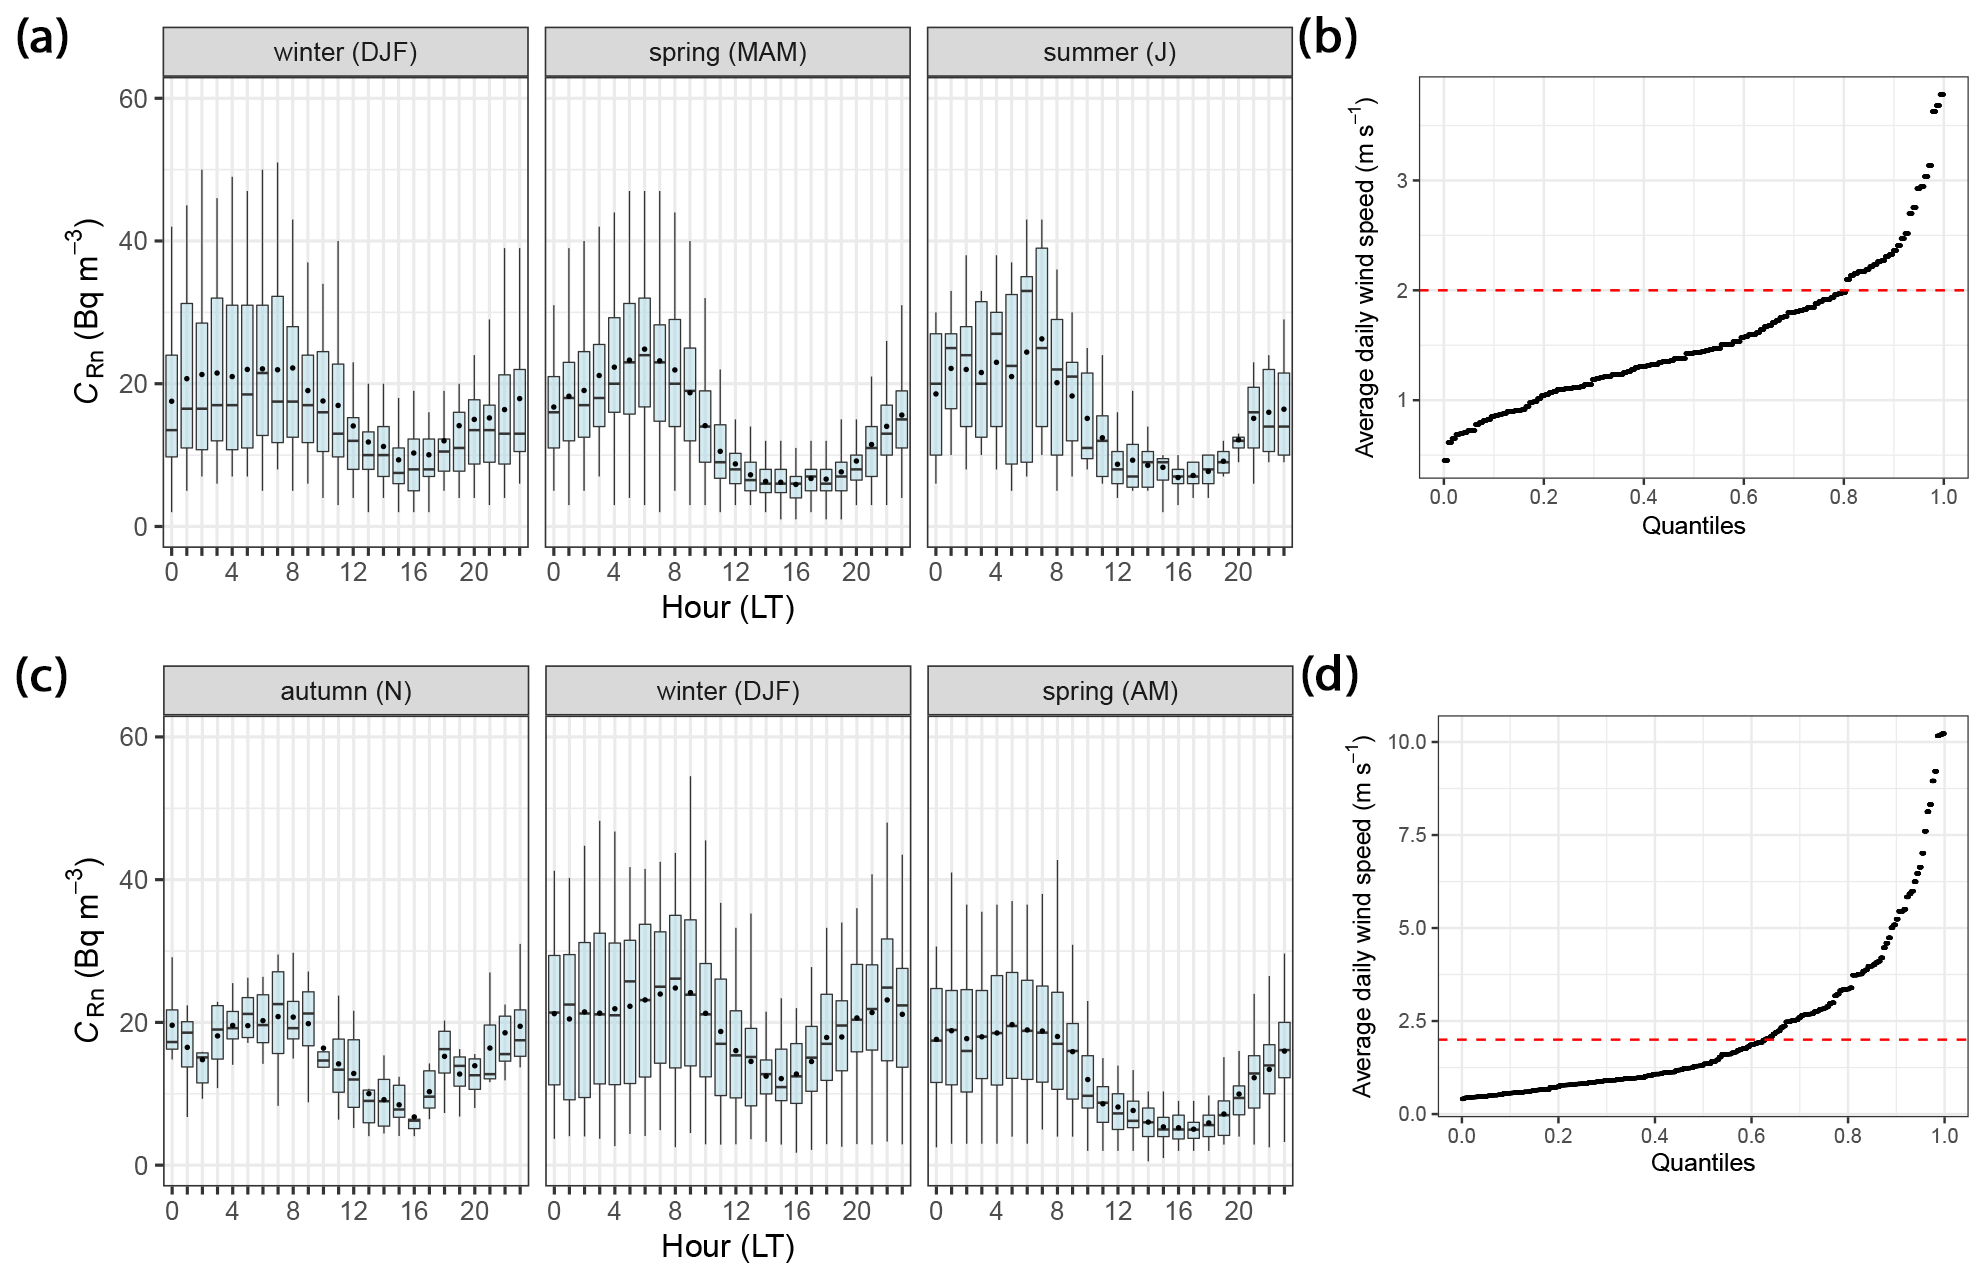
Figure 3Diurnal variation (local time: CET/CEST) in radon concentration (CRn) in Ljubljana (a) and Vipava valley (c), grouped by season for the whole period of Rn measurements. Statistics for every hour in a day are represented by a box plot derived from 1 h data (point: mean; horizontal line: median; grey-coloured box: 25th–75th percentiles; whiskers: 5th–95th percentiles). Only days during which daily average wind speed is below 2 m s−1 are considered. Distribution of wind speed for Ljubljana and Vipava valley is presented in (b) and (d).
3.2 Black carbon concentration, diurnal and seasonal cycle
Clear seasonality of BC concentrations was observed at both urban background sites. Higher concentrations were measured in the colder season (Fig. 4), resulting from weaker dispersion characteristics within the more stable PBL, as well as from stronger biomass burning sources.
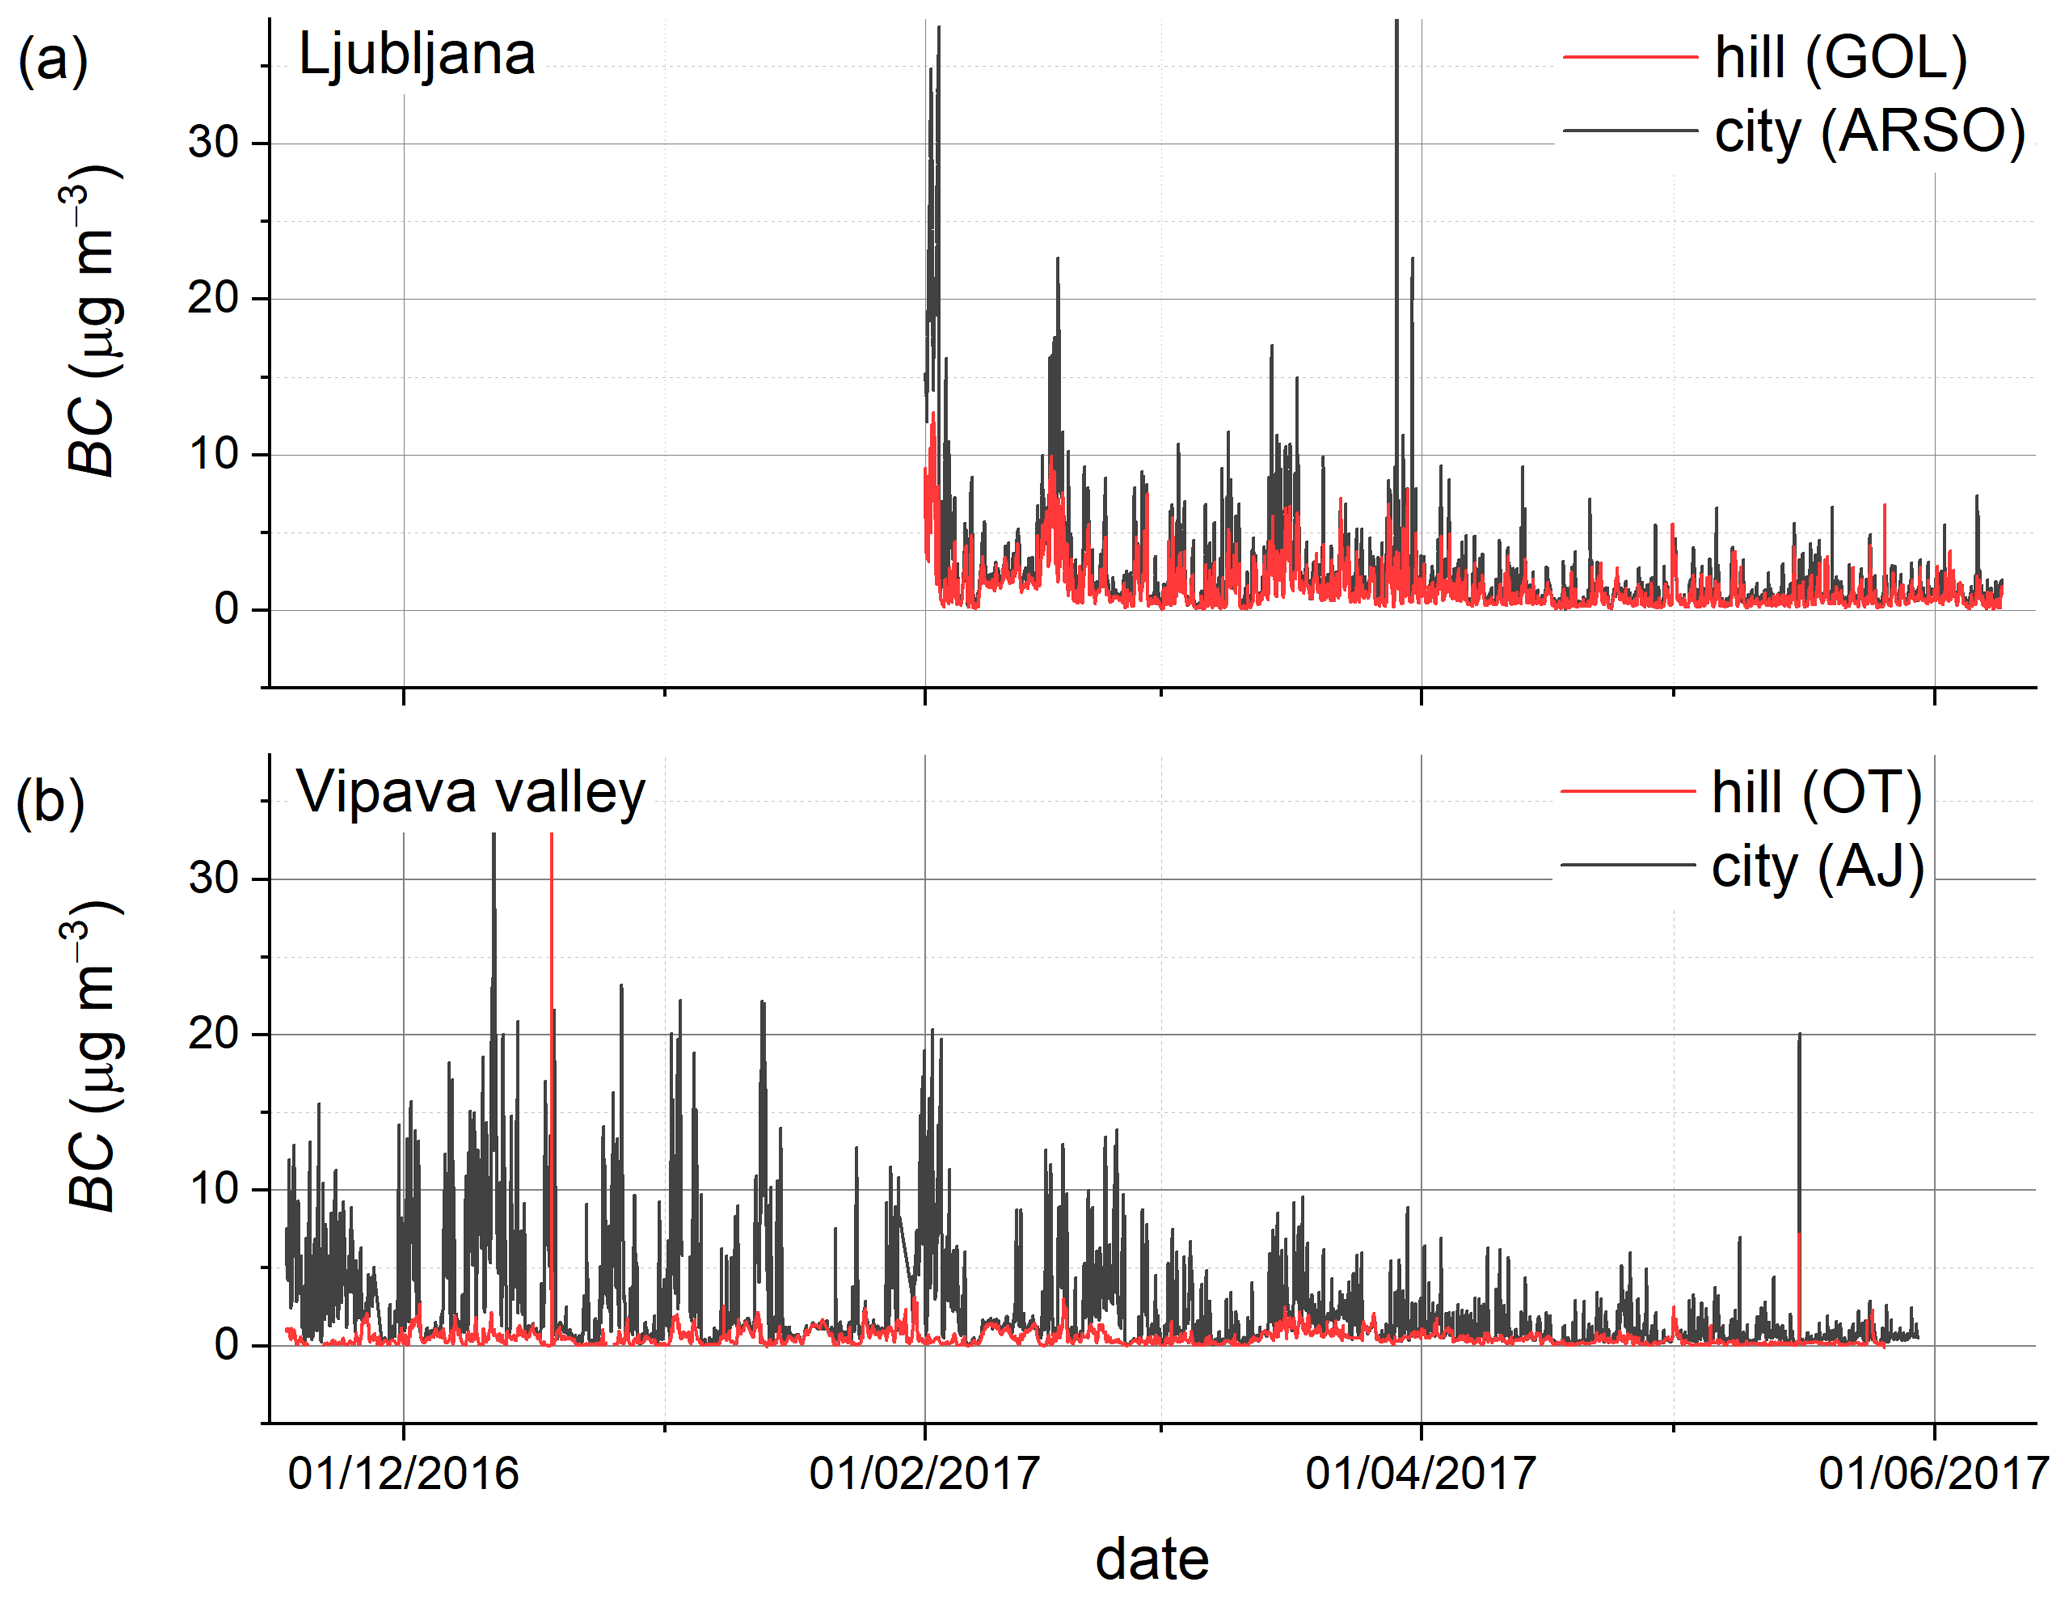
Figure 4Time series (1 h running average is applied to 1 min data) of black carbon concentration (BC) measured at two measurement sites (city – black, hill – red) in Ljubljana (a) and in Vipava valley (b).
The average BC concentration in winter was 4.5 ± 5.7 and 3.4 ± 4.2 µg m−3 for LJ and AJ, respectively (Table 4). However, a significant micrometeorological difference between both locations has to be considered. Vipava valley is characterized by two extremes in atmospheric stability: very stable atmospheric conditions with strong pollution events can shift within a few hours to the strong bora wind conditions, which disperse all atmospheric pollutants to the nearly regional background levels. In fact, during stable PBL conditions in winter, BC concentration in AJ can easily exceed concentrations in LJ, reaching an average daily BC concentration of 10–15 µg m−3. Based on the source apportionment model described in Sect. 2.2, there was a significantly higher contribution of biomass burning observed during winter in AJ (62 %) than in LJ (31 %), corresponding to the rural characteristics of the Vipava valley area. Significantly lower BC concentrations were measured in spring, 1.5 ± 1.6 and 1.1 ± 1.2 µg m−3 in LJ and AJ, respectively.
BC concentrations at both hill sites were expectedly lower than that at the urban background sites. The Golovec site (GOL), which is located 100 m above the city of Ljubljana is nevertheless more affected by urban emissions than the Otlica site (OT), which lies about 830 m above the valley floor. BC concentrations measured at GOL were 2.2 ± 2.0, 1.1 ± 1.0 and 0.8 ± 0.5 µg m−3 in winter, spring and summer, respectively, which is 51 %, 42 % and 38 % lower than in the city. This indicates more intensive vertical dispersion of air pollutants (including BC) towards the warmer season. Nevertheless, since the vertical difference between ARSO and GOL site is only 100 m, the GOL site remains above the ML only during very stable PBL conditions.
On the other hand, the vertical difference between the AJ and OT sites in Vipava valley is much larger, resulting in significantly lower BC concentrations on the hill. BC concentrations measured at OT during autumn, winter and spring were similar, 0.4 ± 0.5, 0.6 ± 0.8 and 0.4 ± 0.4 µg m−3, respectively. Slightly higher winter concentrations can be assigned to small local contribution from a few houses which are spread on the slope around the observatory and a small natural grass fire close to the observatory on 18 December 2016, which increased BC concentrations to around 30 µg m−3 for several hours (Fig. 4). The OT site is located above the PBL most of the time during winter and therefore represents regional background BC concentrations. Towards spring, when MLH frequently reaches the OT site in the afternoon, the site is affected by polluted air masses from the valley (Fig. 8c) and BC concentrations increase. The OT site can lie during the night and morning hours in either the residual layer – in the case when MLH reached the OT site in the previous afternoon – or in free atmosphere, in the case when MLH remained below OT altitude on the previous day.
The BC diurnal variation presented in Fig. 5 reflects different dynamics of sources and their relative contribution. In general, the main driver of BC concentrations at both sites is atmospheric stability, leading to dispersion of pollutants during the day, and subsequently lower BC concentration in the middle of day, and thus lower exposure of the population, except in the case of stable PBL conditions. In addition, two peaks are usually observed in traffic-related BC concentration (BCTR), which is a combined consequence of traffic density and PBL stability. The morning traffic-related peak of BCTR concentration is usually stronger at both locations, since dispersion of BC in the morning hours is limited due to low MLH. Due to higher traffic density and consequently stronger BC sources in LJ, it usually takes more time for BC to decrease during the day than in AJ. The afternoon peak, on the other hand, strongly depends on daylight hours (which in general drive the PBL evolution). In winter, BC concentrations start to increase already between 16:00 and 17:00, whereas in spring and summer, a much smaller increase can be observed, which is constrained to evening hours. Biomass burning BC sources are mostly limited to the colder season, when higher concentrations are measured, especially in the evenings and the first part of the night. In contrast to LJ, AJ is also affected by increased BCBB concentration during the morning hours. During the weekends, lower BCTR concentrations are observed in LJ, whereas no significant difference can be seen in AJ, leading to the assumption that meteorology plays a much stronger role in Vipava valley than it does in Ljubljana (where BC sources are stronger), or it could be assumed that the highway along the valley represents a continuous source of BC, regardless of the weekday.

Figure 5Diurnal variation (local time: CET/CEST) in source-specific black carbon concentration (traffic – TR and biomass burning – BB) at Ljubljana urban background – ARSO (a) and Vipava valley urban background – AJ (b), grouped by season and weekday or weekend. The statistics for every hour in a day are represented by the median value (line) and 25th–75th percentiles (shaded area) derived from 1 min data. AAETR and AAEBB were set to 1 and 2, respectively. Blue vertical lines mark the sunrise and sunset time.
3.3 Effective mixing height derived from box model
Hourly resolved MLH values were calculated based on Eqs. (6), (8) and (9) for the whole period, when CRn measurements were available. Although MLH results represent an intermediate model outcome and are actually not required for emission rate modelling, the results are important for understanding diurnal characteristics of PBL evolution and extent of pollutant dispersion, which allow us to compare the two locations from the point of view of micro-meteorological characteristics. They also serve as a quality control parameter of the model. Derived MLH for both locations, calculated from the specifically selected monthly values of effective radon exhalation rate (Sect. 2.5), is presented in Fig. 6. SNBL height was in general between 100 and 200 m a.g.l. at both locations and was found to slightly increase from the cold to warm seasons. However, the seasonal pattern of SNBL height is not as pronounced as the seasonal pattern for the thermally driven daytime MLH. In February PBL reached its highest altitude at around 15:00, with the median MLH value for LJ of 450 m. On the contrary, in June MLH reached its highest extent of 1210 m (median) at 17:00. In conditions of an extremely unstable boundary layer, the maximum observed MLH extended higher than 2000 m at both locations. The influence of MLH on BC concentration measured at the urban background site (ARSO) and on the hill (GOL) is presented in Fig. 7 for selected days, when derived MLH was validated from vertical profiles of BC concentration measured by plane. The highest BC concentrations at ARSO and the highest difference between ARSO and GOL are observed during periods when MLH extends below the altitude of the hill site, 100 m a.g.l. (Fig. 7a).
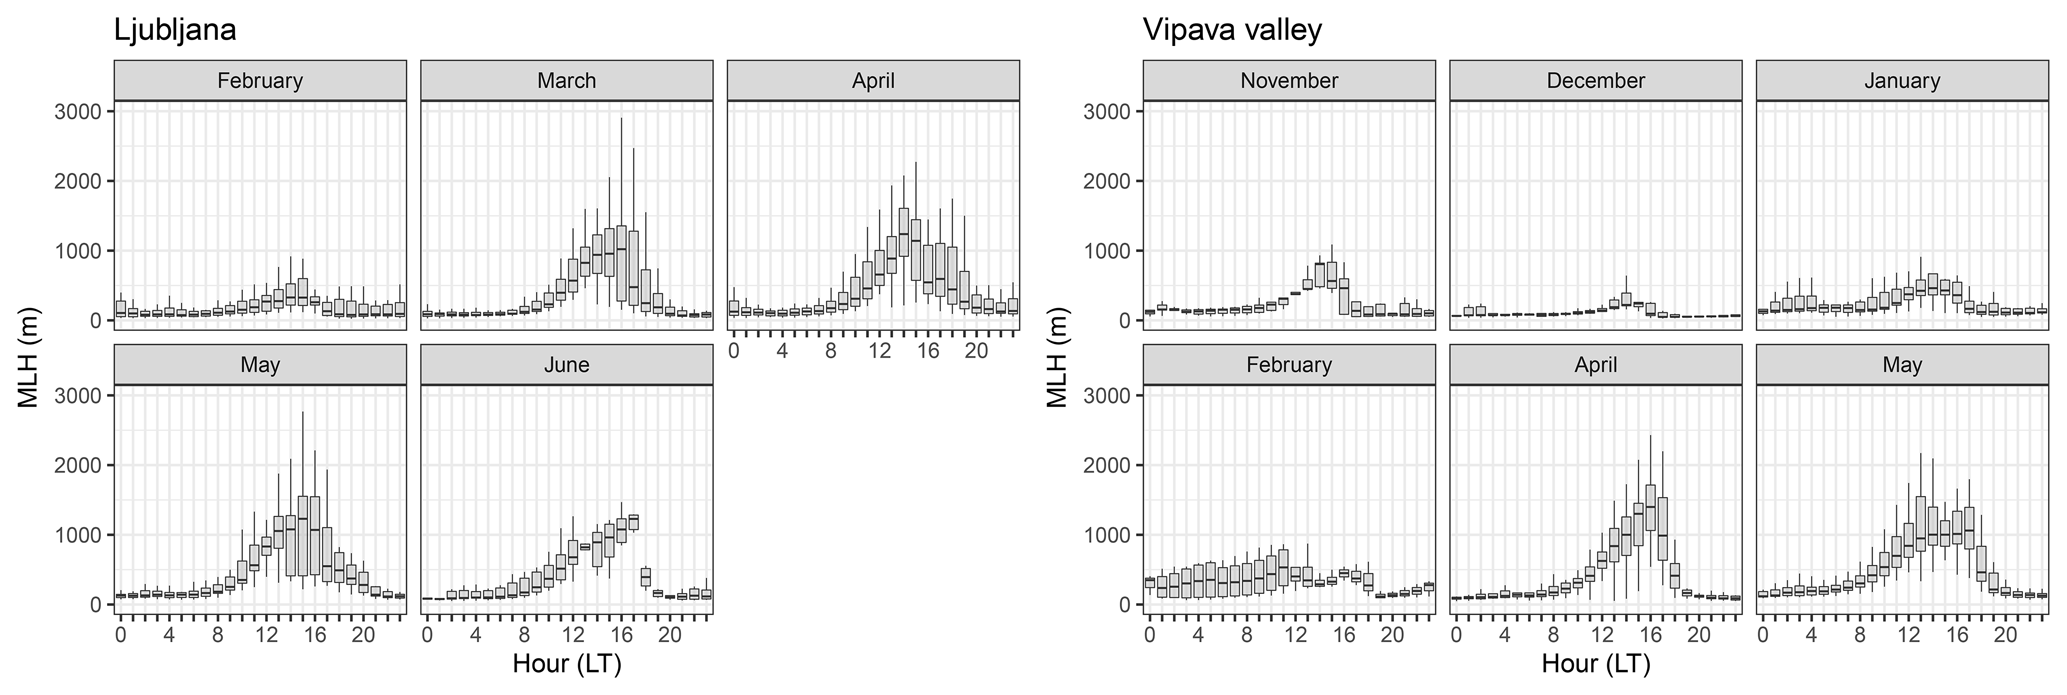
Figure 6Diurnal variation (local time: CET/CEST) in modelled mixing layer height (MLH) grouped by months for the periods of thermally driven PBL convection, for Ljubljana and Vipava valley. Hourly statistics are represented by box plots (horizontal line: median; grey-coloured box: 25th–75th percentiles; whiskers: 5th–95th percentiles).
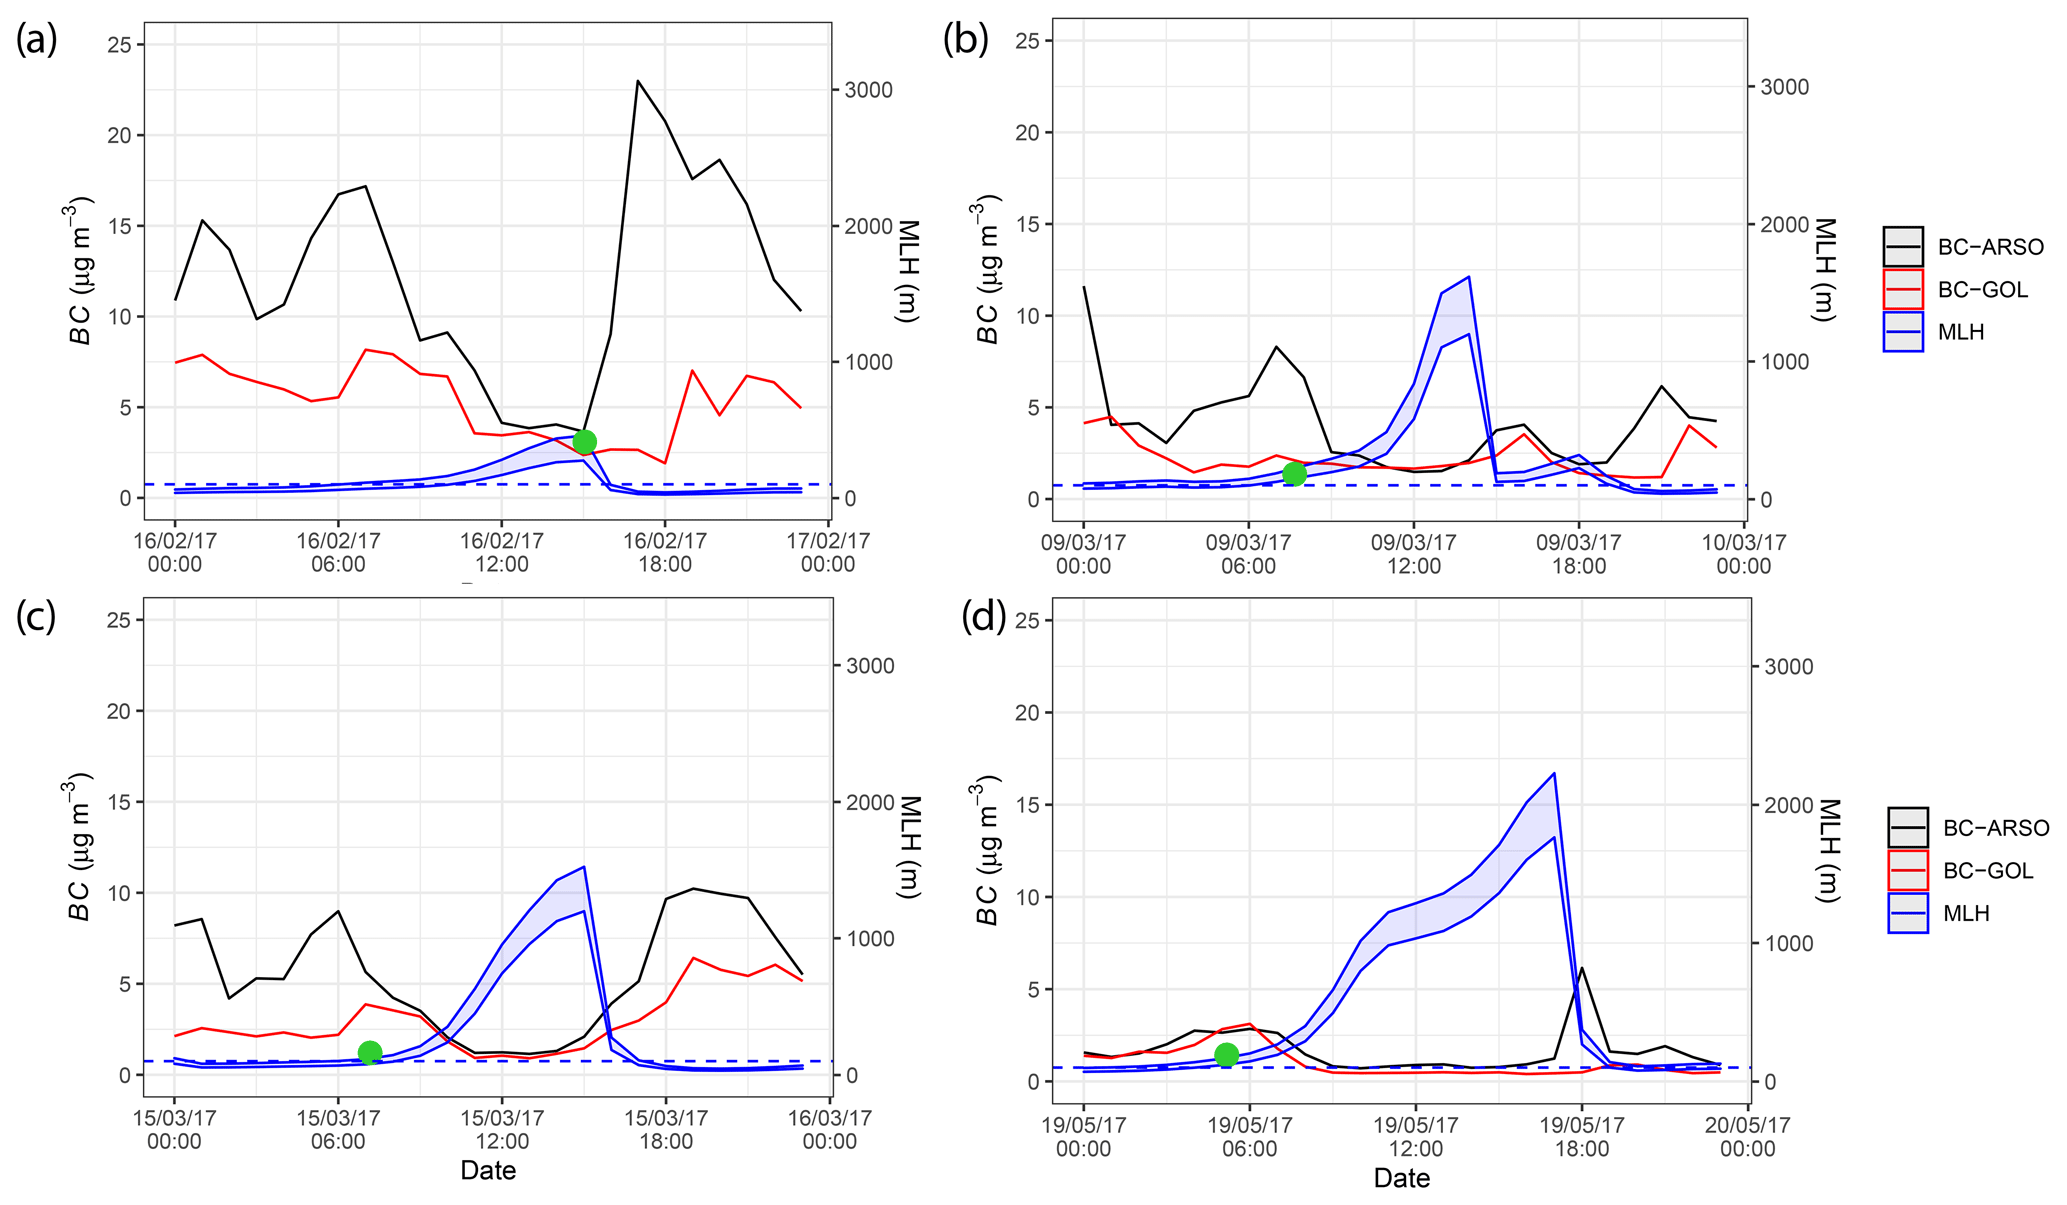
Figure 7Time series (UTC) of BC concentration measured in Ljubljana (ARSO) and on the hill (GOL) with modelled MLHRn (based on min and max ERn estimate) in blue and MLHBC determined by flight measurements (green point) on 16 February 2017 (a), 9 March 2017 (b), 15 March 2017 (c) and 19 May 2017 (d).
The most stable PBL conditions (excluding periods of bora wind) in the Vipava valley were observed in December 2016 and February 2017, when no significant diurnal variation could be detected. During these 2 months median MLH values at 15:00 were 240 and 330 m, respectively. The highest vertical extent of PBL was observed in April, when MLH reached 1400 m (median) at 16:00. Results of MLH values also explain the measured BC concentration in AJ and OT (Sect. 3.2), where comparison of BC concentration reveals the time periods, when both sites are located within the same air volume (i.e., periods when MLH overreaches the OT site at 830 m a.g.l.). Especially in April and May, MLH reaches the OT site in the afternoon frequently (from noon to 16:00), leading to an increase in BC concentrations at OT and decrease in BC concentrations at the AJ site (Fig. 8b and c). Good correlation was observed between MLH (derived from the box model) and vertically resolved lidar backscatter signal over Vipava valley in periods when conditions are met for the application of both approaches. Figure 8a represents measurements from 9 January 2017.
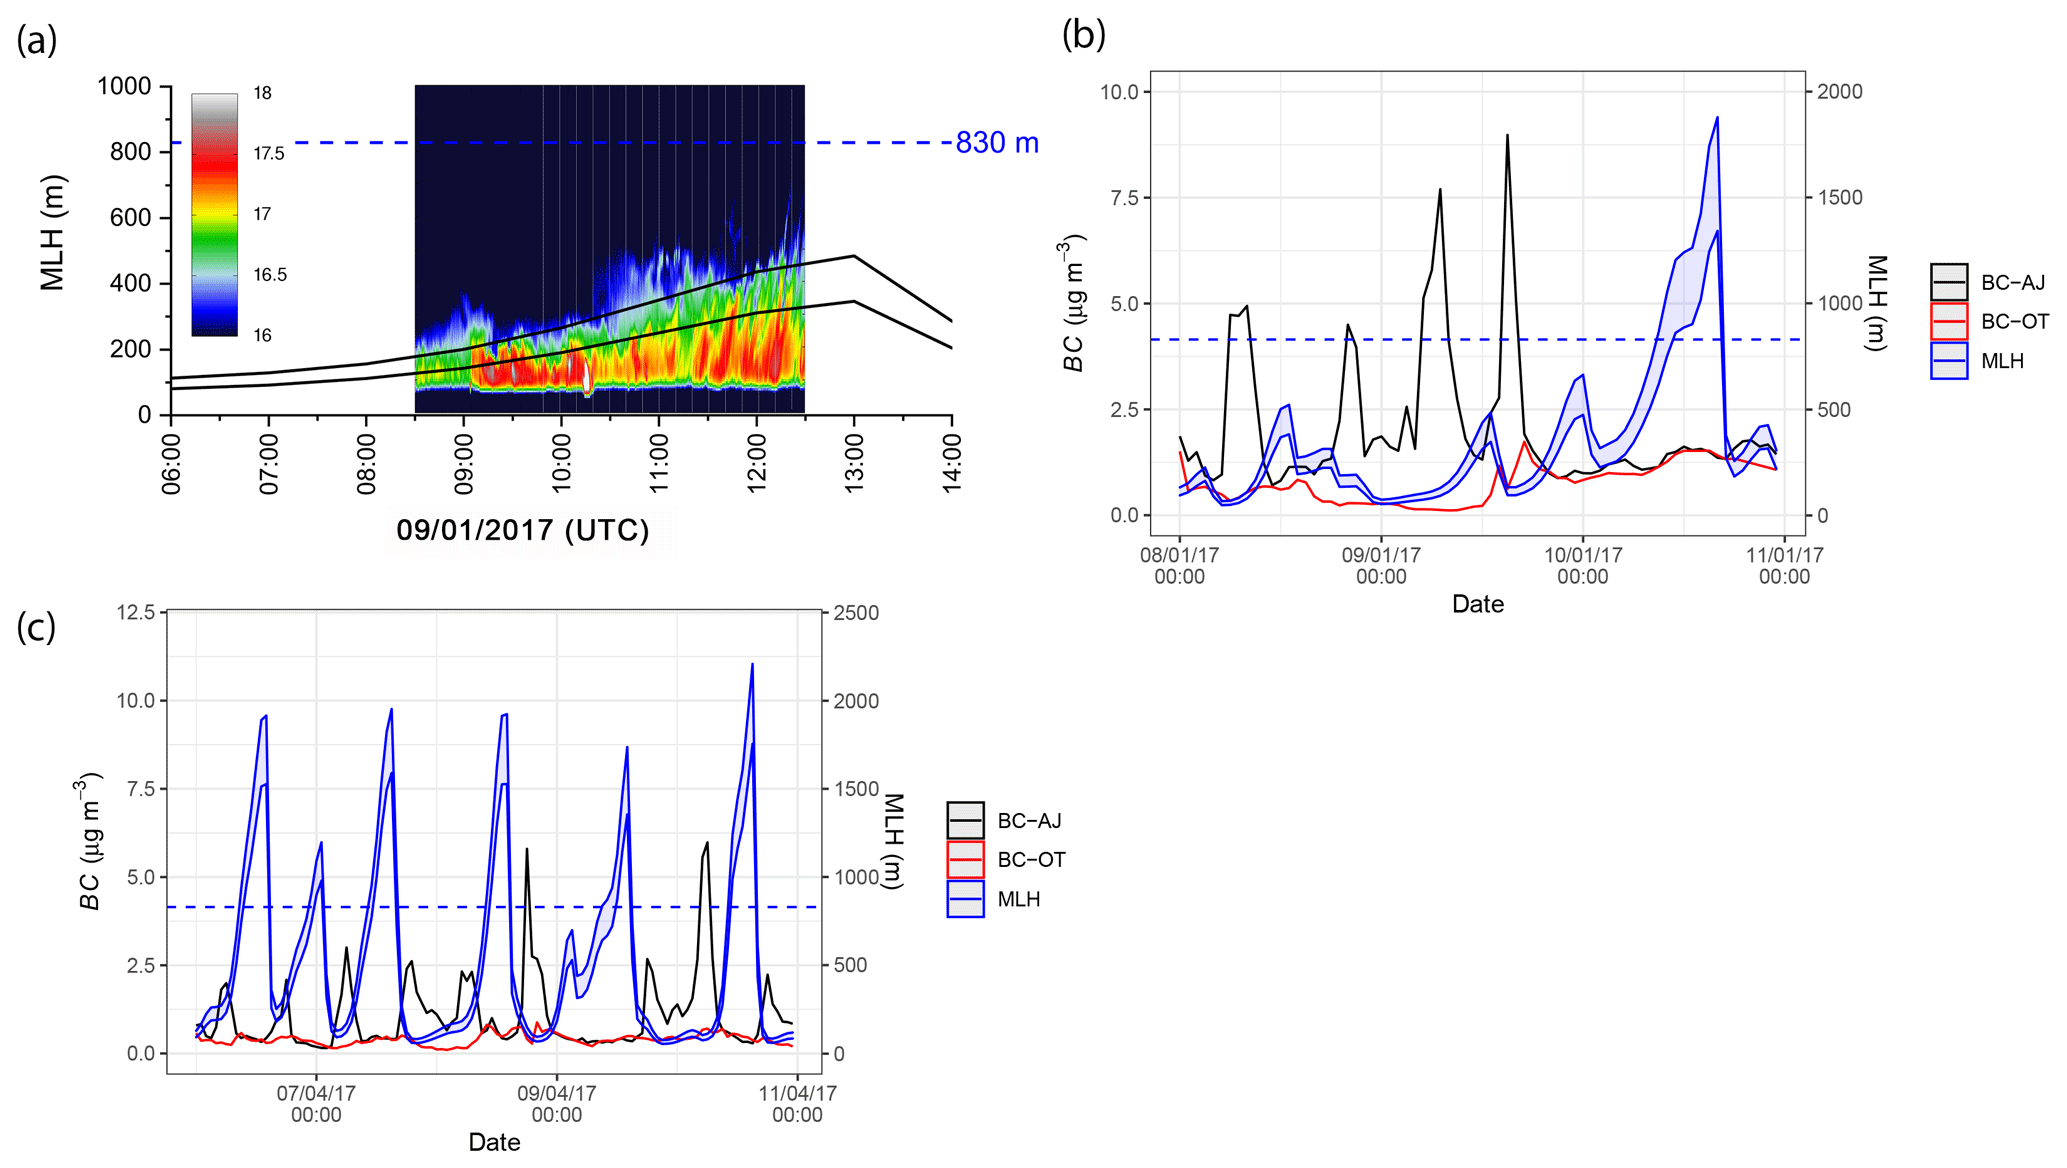
Figure 8Comparison of modelled MLH (black line) over the Vipava valley with range-corrected lidar return signal on 9 January 2017 (a). Time series (UTC) of BC concentration in the city (AJ) and on the hill (OT) with modelled MLHRn (based on min and max ERn estimate) in the periods 8–10 January 2017 (b) and 6–10 April 2017 (c). The dashed blue line represents the altitude of OT site, 830 m a.g.l.
Results show that the PBL reaches its full depth in the early afternoon, between 15:00 and 17:00, depending on the extent of daylight hours. Strong thermally driven mixing starts to diminish about 2 h before sunset, followed by rapid transition to the SNBL conditions (Fig. 6).
3.4 Black carbon emission rates
BC emission rates were determined in the second phase by inversion of BC concentrations based on the results of derived MLH values using Eqs. (11) and (12). Emission rates from traffic (ETR) and biomass burning (EBB) sources were determined separately in order to take into account spatial characteristics and different dynamics of sources. Average daily BC emission rates in different seasons for both locations are presented in Table 5. As expected, higher BC emissions are characteristic for Ljubljana, where overall BC emission rates ranged from 210 to 260 in spring and winter, respectively. Lower overall BC emissions were found in Vipava valley and were in the range from 150 to 250 in spring and winter, respectively. Emissions from traffic prevail in the city of Ljubljana and account for 73 % in wintertime. On the other hand, biomass burning in individual houses contributes more than half (60 %) of the emitted BC in Vipava valley during the heating season. In spring, however, outdoor temperature increases faster in the Mediterranean climate of Vipava valley than it does in Ljubljana, which means that the heating season ends much sooner in spring, resulting in only a 27 % contribution of biomass burning emissions in the Vipava valley and 14 % contribution in Ljubljana. The fraction of source-specific emission rates slightly differs from the contribution fraction of actually measured BC concentrations from both sources (Table 4) after mixing and dispersion within the PBL. Due to the difference in daily dynamics of emission rate from biomass burning and traffic, the fraction of BC concentration from biomass burning is slightly higher than the fraction of its emission rate. Traffic emissions occur mostly during the daytime and are dispersed in the PBL more effectively than biomass burning emissions, with the sources also active during the night hours, thus having a stronger impact on the concentrations. Average determined BC emission rates are about an order of magnitude higher than Slovenian national BC emissions of 2.2 kilotons reported by the EMEP (The European Monitoring and Evaluation Programme) emission inventory for 2016, which corresponds to the average hourly emission rate of 12.4 . The difference is reasonable if we account for spatially heterogeneous emissions and the small contribution of less populated areas like forests and mountains. BC emission rates calculated in our study are nevertheless lower than reported for larger cities, such as Kathmandu, where 316 and 914 were reported for the summer and winter periods, respectively, or Delhi (608 ) and Mumbai (2160 ) (Mues et al., 2017).
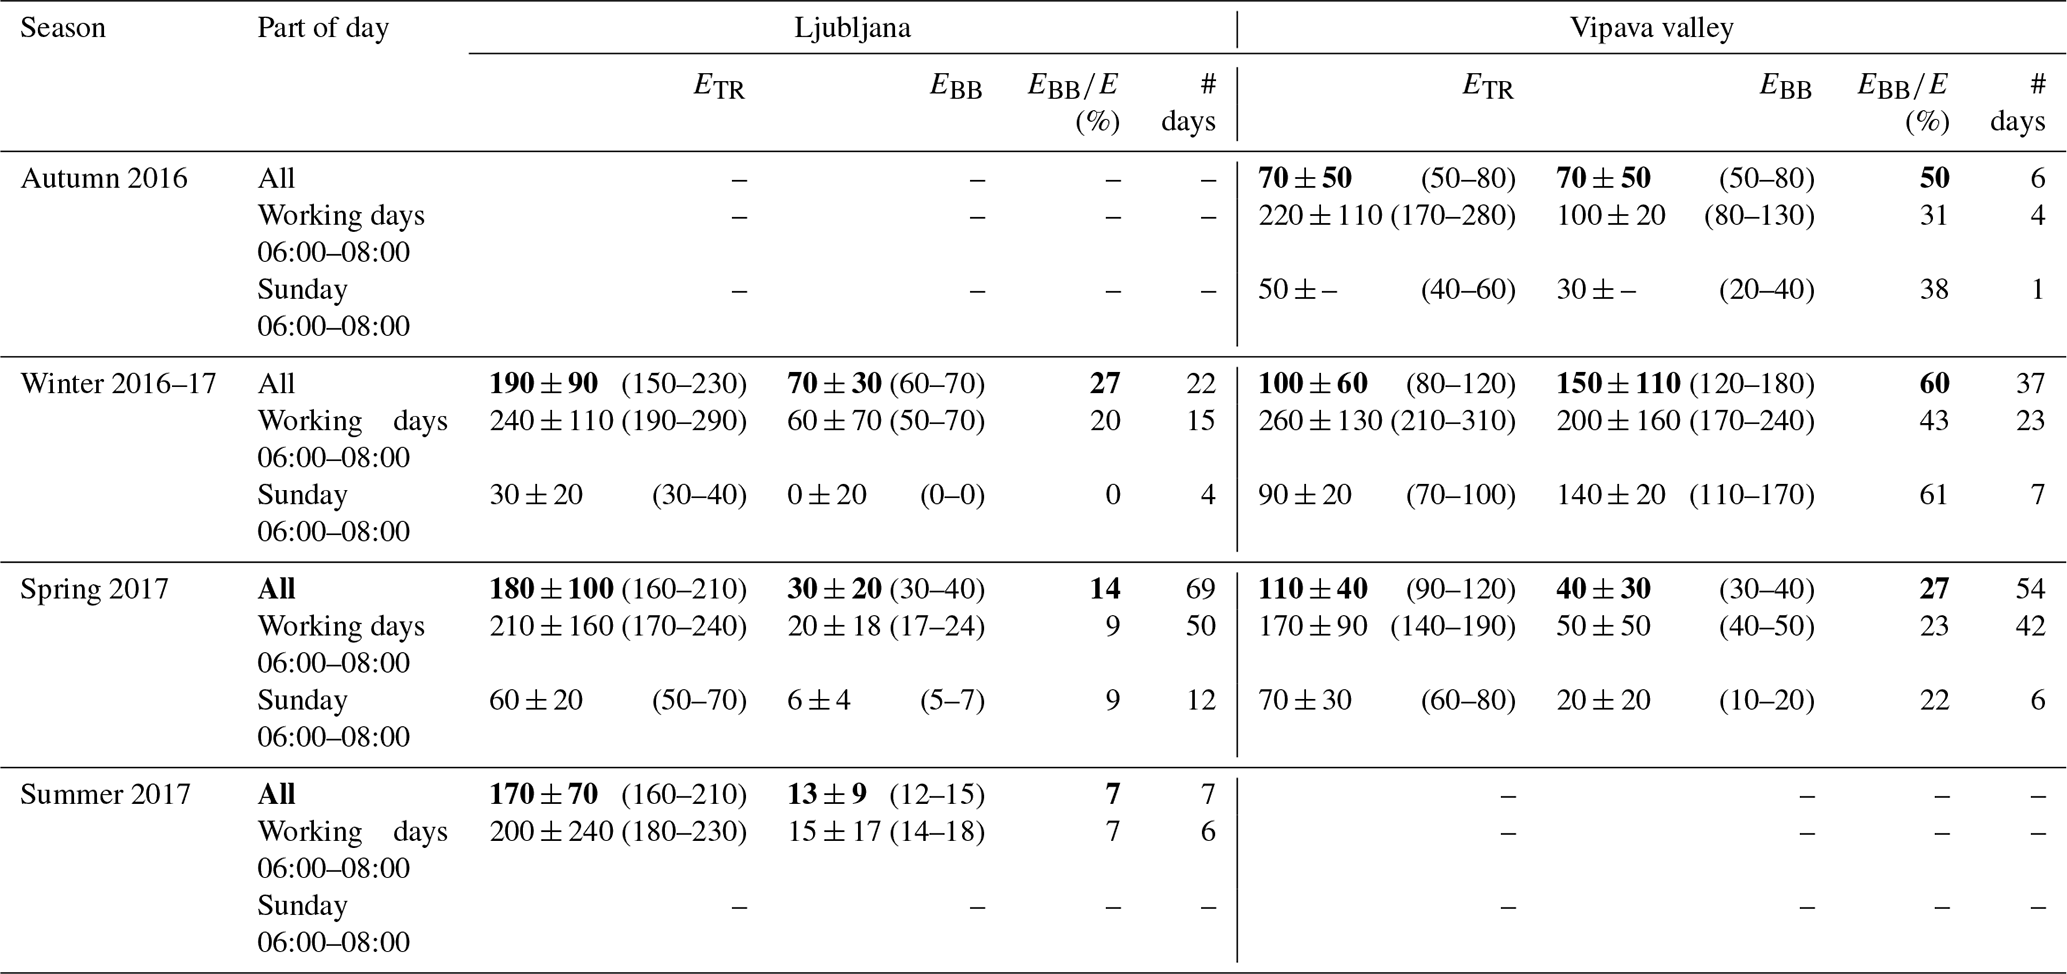
Table 5BC emission rates (EBC) (weighted mean ± standard deviation derived from daily mean values) and range of EBC for lower and upper MLHRn estimates (EBC−min–EBC−max). TR (traffic) and BB (biomass burning) emissions are reported separately for each season (all days, mornings of working days and Sundays) and location, expressed in micrograms per square metre per hour. Daily mean values for specific seasons are marked with bold font.
Daily average ETR remains constant through the year and in general does not depend on outdoor temperature (Fig. 9). As expected, EBB is higher on colder days due to the stronger heating demand. Since wood is the most frequently used fuel for heating in individual houses in the Vipava valley, emission rate increases much faster with colder days than it does in Ljubljana, where parts of the city dominated by individual houses are connected to the district heating system powered by the local thermal power plant. At both locations, higher EBB is observed when average daily temperature drops below 15 ∘C.
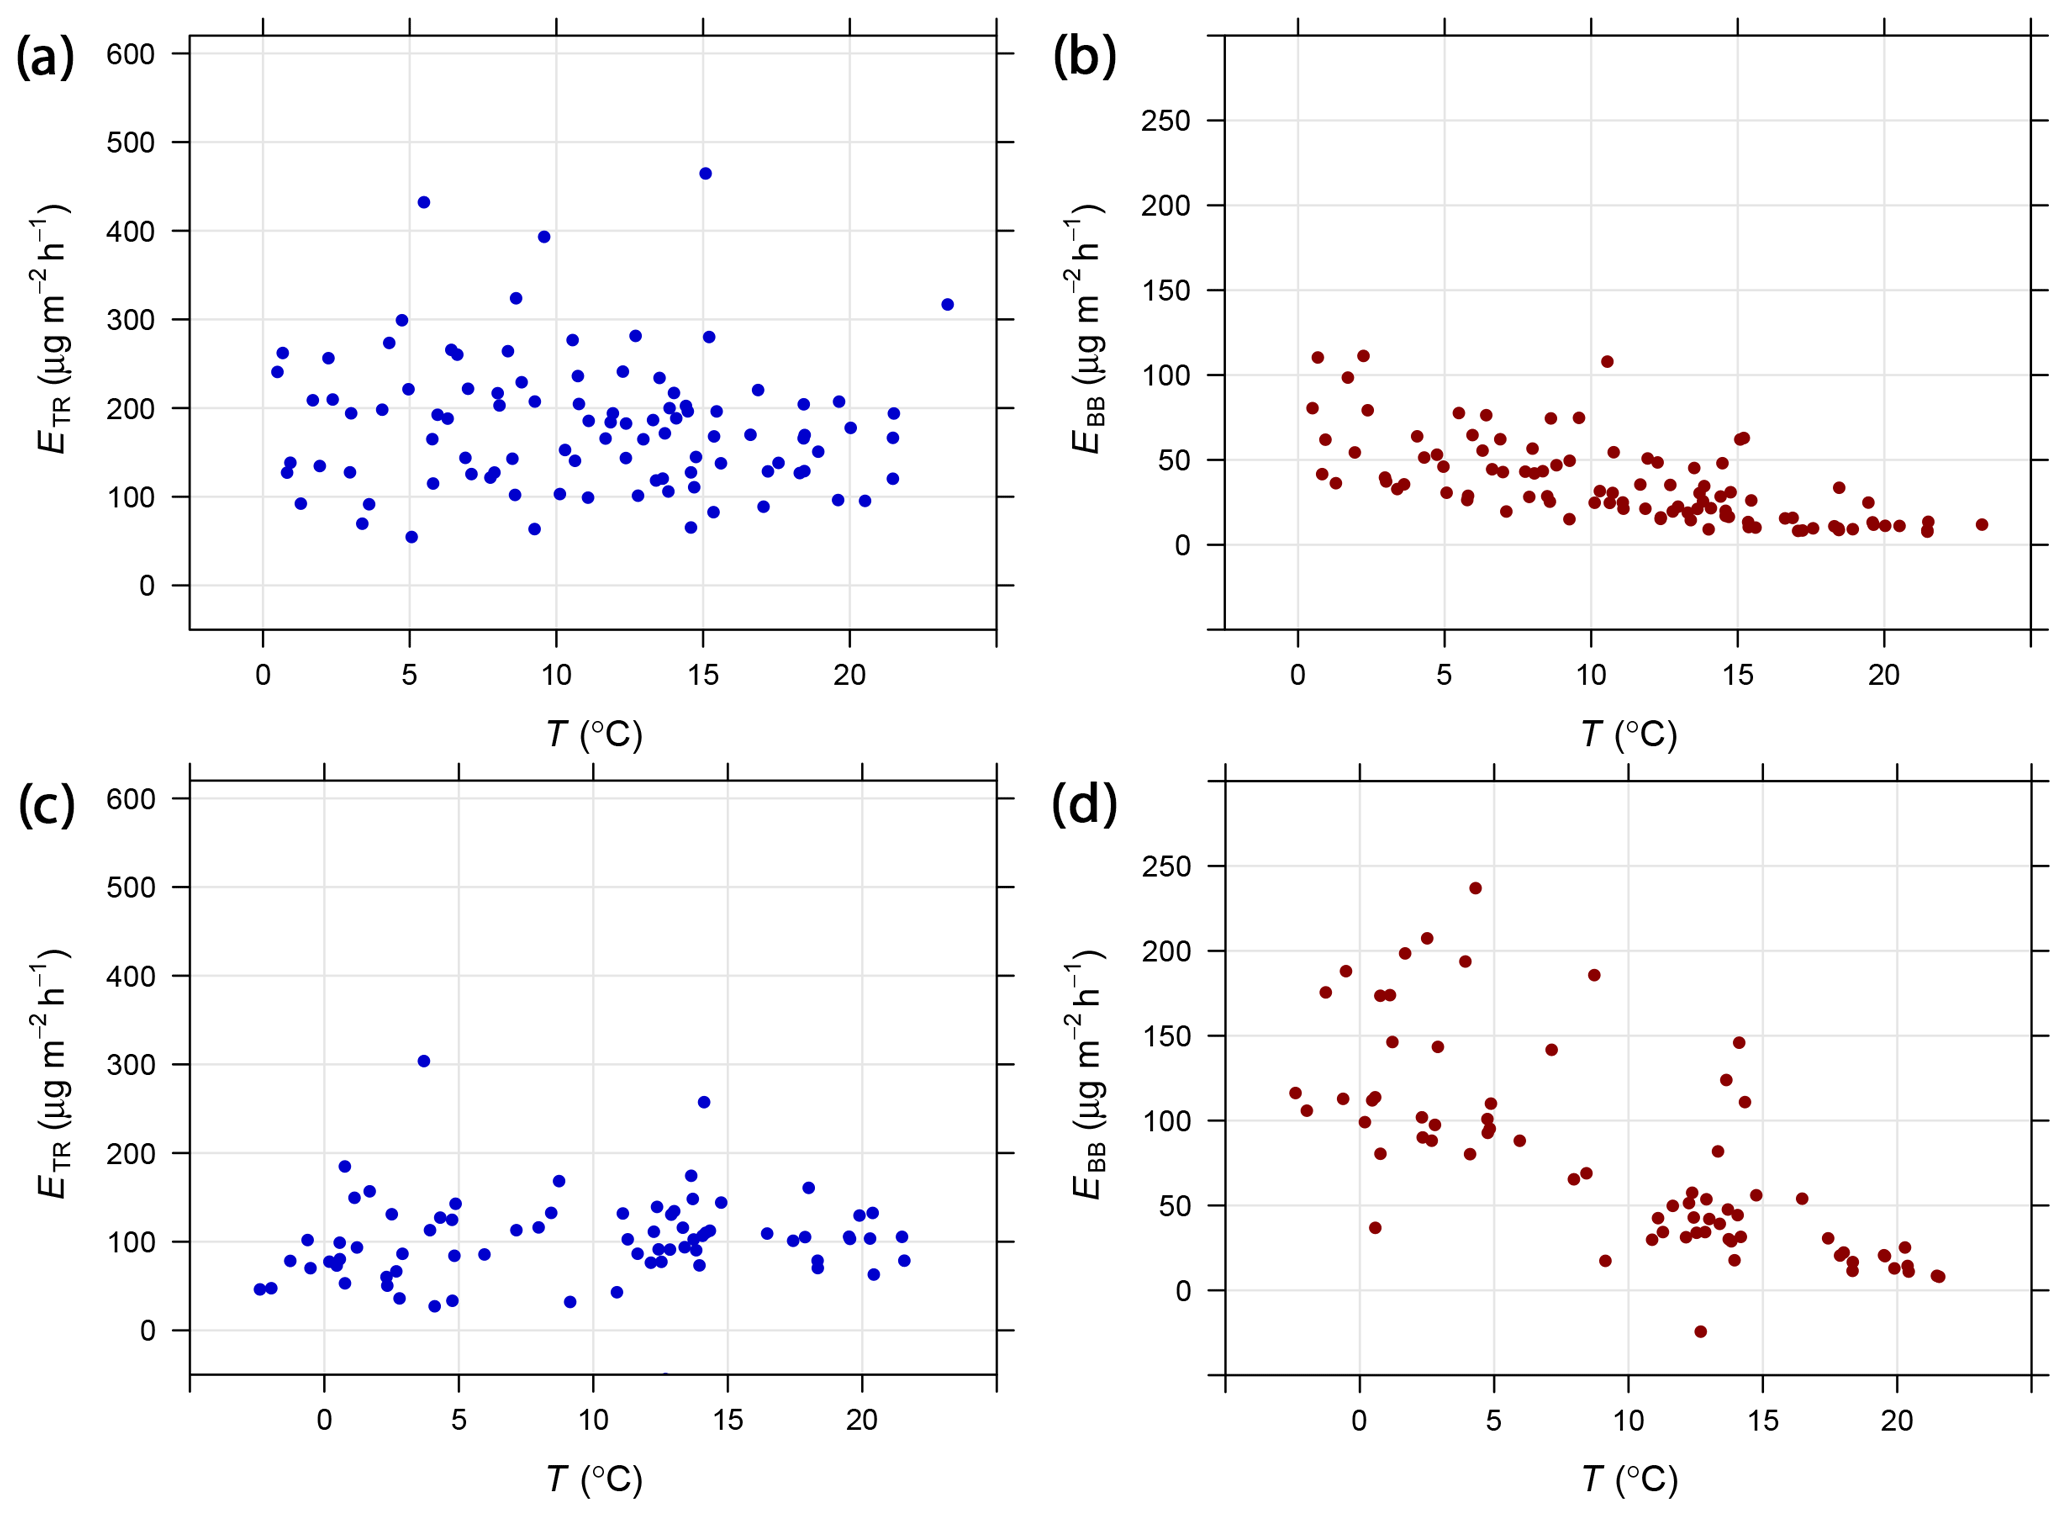
Figure 9Dependence of source-specific emission rates ETR (traffic) and EBB (biomass burning) on the outdoor air temperature for Ljubljana (a, b) and Vipava valley (c, d). Daily average values are shown.
3.4.1 Hourly resolved source-specific BC emission rate
The typical diurnal profile of ETR averaged over the whole measurement period reflects the traffic dynamics in the city of Ljubljana and in a much smaller town – Ajdovščina in the Vipava valley (Fig. 10). A statistical summary of source-apportioned EBC is presented in Table 5. To account for higher model uncertainty during the midafternoon, daily averages were calculated by applying 50 % weight to the EBC results between 11:00 and 17:00.

Figure 10Diurnal variation (local time: CET/CEST) in emission rate of traffic-related BC (ETR) in Ljubljana (a) and Vipava valley (b), grouped by working days and Sundays. The statistics for every hour in a day are represented by a box plot (horizontal line: median; blue-coloured box: 25th–75th percentiles; whiskers: 5th–95th percentiles).
Minimum BC emissions are observed during the night hours, between midnight and 04:00 in LJ and between 22:00 and 04:00 in AJ. Traffic and consequently ETR start to increase in the morning around 05:00 and peak during working days between 06:00 and 08:00 with ETR in LJ of 240 ± 110, 210 ± 160 and 200 ± 240 (weighted mean) in winter, spring and summer, respectively (Table 5). Morning peak ETR during working days was similar in AJ and in LJ: 220 ± 110, 260 ± 130 and 170 ± 90 in autumn, winter and spring, respectively. Slightly lower morning ETR in warmer months at both locations is probably the result of transportation changes when warmer weather facilitates environmentally friendly mobility. A morning peak is not observed during Sundays, when ETR during this period reaches significantly lower values: 30 ± 20 and 60 ± 20 in LJ in winter and spring, respectively. Sunday morning ETR in AJ was 90 ± 20 and 70 ± 30 in winter and spring, respectively. The morning peak is followed by a slight decrease in ETR in LJ, whereas in AJ, ETR drops substantially. ETR starts to increase again in the late morning and accelerates in the early afternoon, peaking in the midafternoon (15:00–16:00). During this period the calculated BC emission rates are the most uncertain due to the reasons explained in detail in Sect. 3.5. During the working days, maximum ETR during the afternoon traffic peak (between 15:00 and 16:00) was ∼ 500 in LJ and ∼ 350 in AJ. These results are comparable to results published by Ježek et al. (2018) for traffic BC emissions in Maribor (the second largest Slovenian city), where ETR during the afternoon peak in the range of 300–1300 is reported for 500 m × 500 m grid cells. In the evening hours ETR decreases faster in AJ than in LJ. Since traffic BC emissions also continue after the PBL shifts to the SNBL conditions, which is especially true during winter in LJ, there is a stronger evening peak of BCTR concentration in LJ compared to AJ. Sunday ETR was found to increase from the morning towards the evening, when similar ETR was observed. The emission rates are correlated with the traffic density in Ljubljana (Fig. 12), especially in the time period from midnight to 10:00, when the uncertainty of the model is expected to be the lowest.
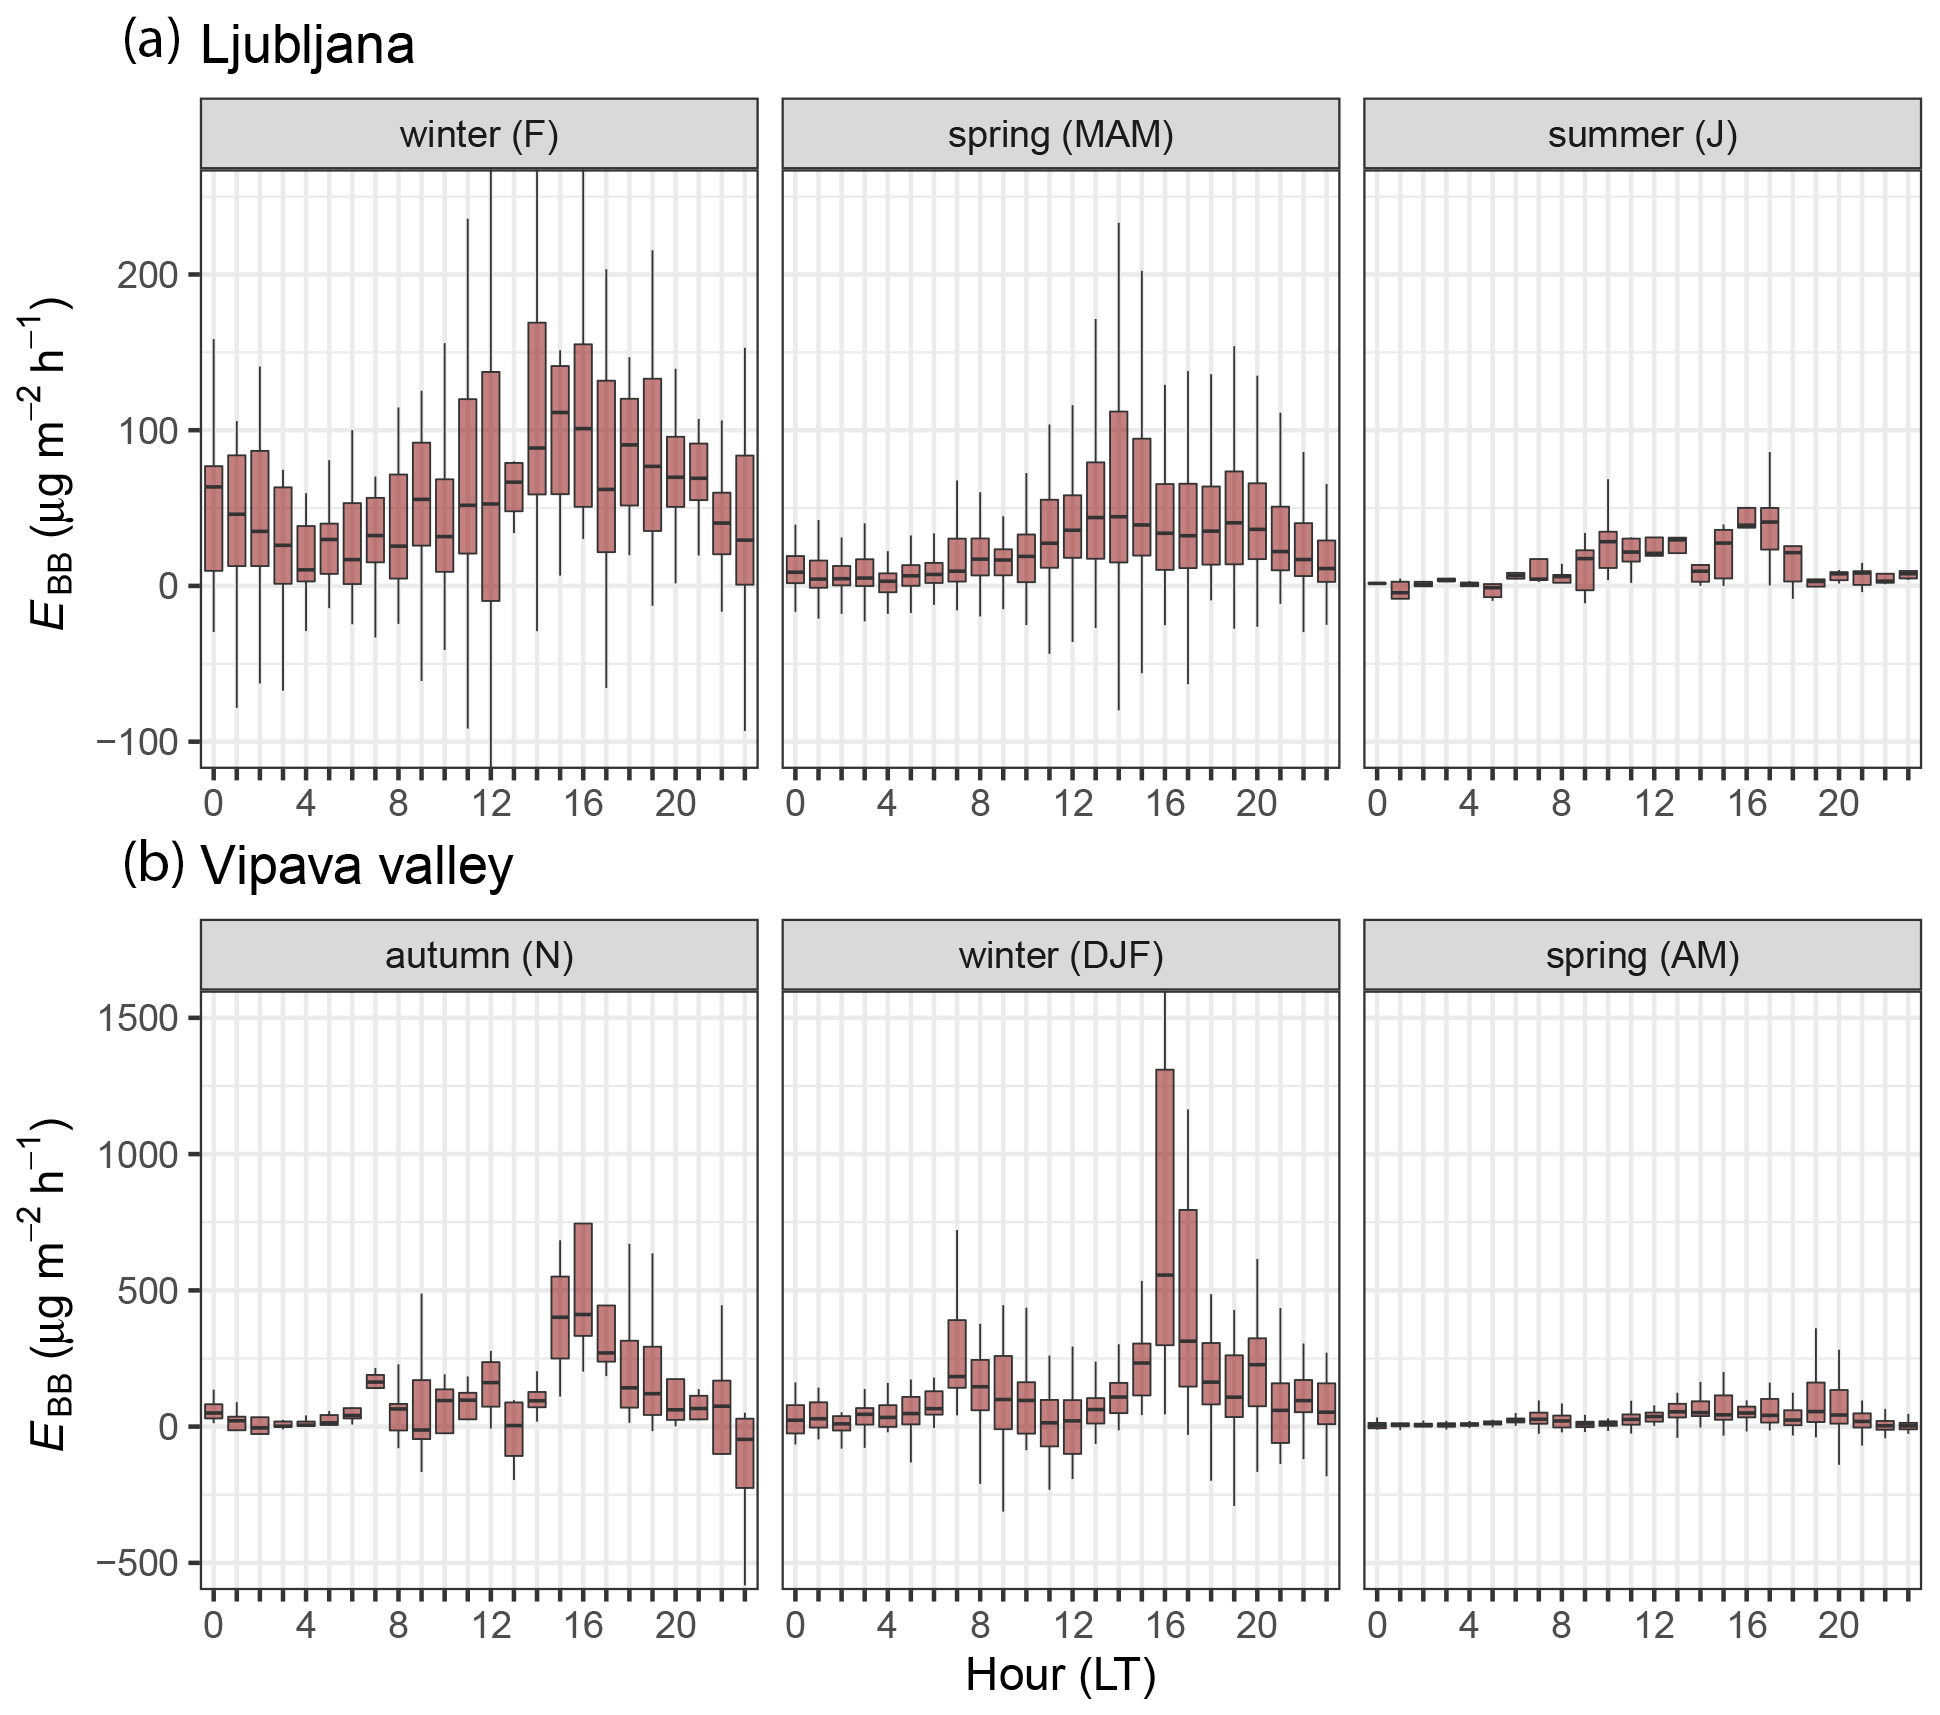
Figure 11Diurnal variation (local time: CET/CEST) in emission rate of biomass-burning-related BC (EBB) in Ljubljana (a) and Vipava valley (b), grouped by season (note the different scales). The statistics for every hour in a day are represented by a box plot (horizontal line: median; brown-coloured box: 25th–75th percentiles; whiskers: 5th–95th percentiles).
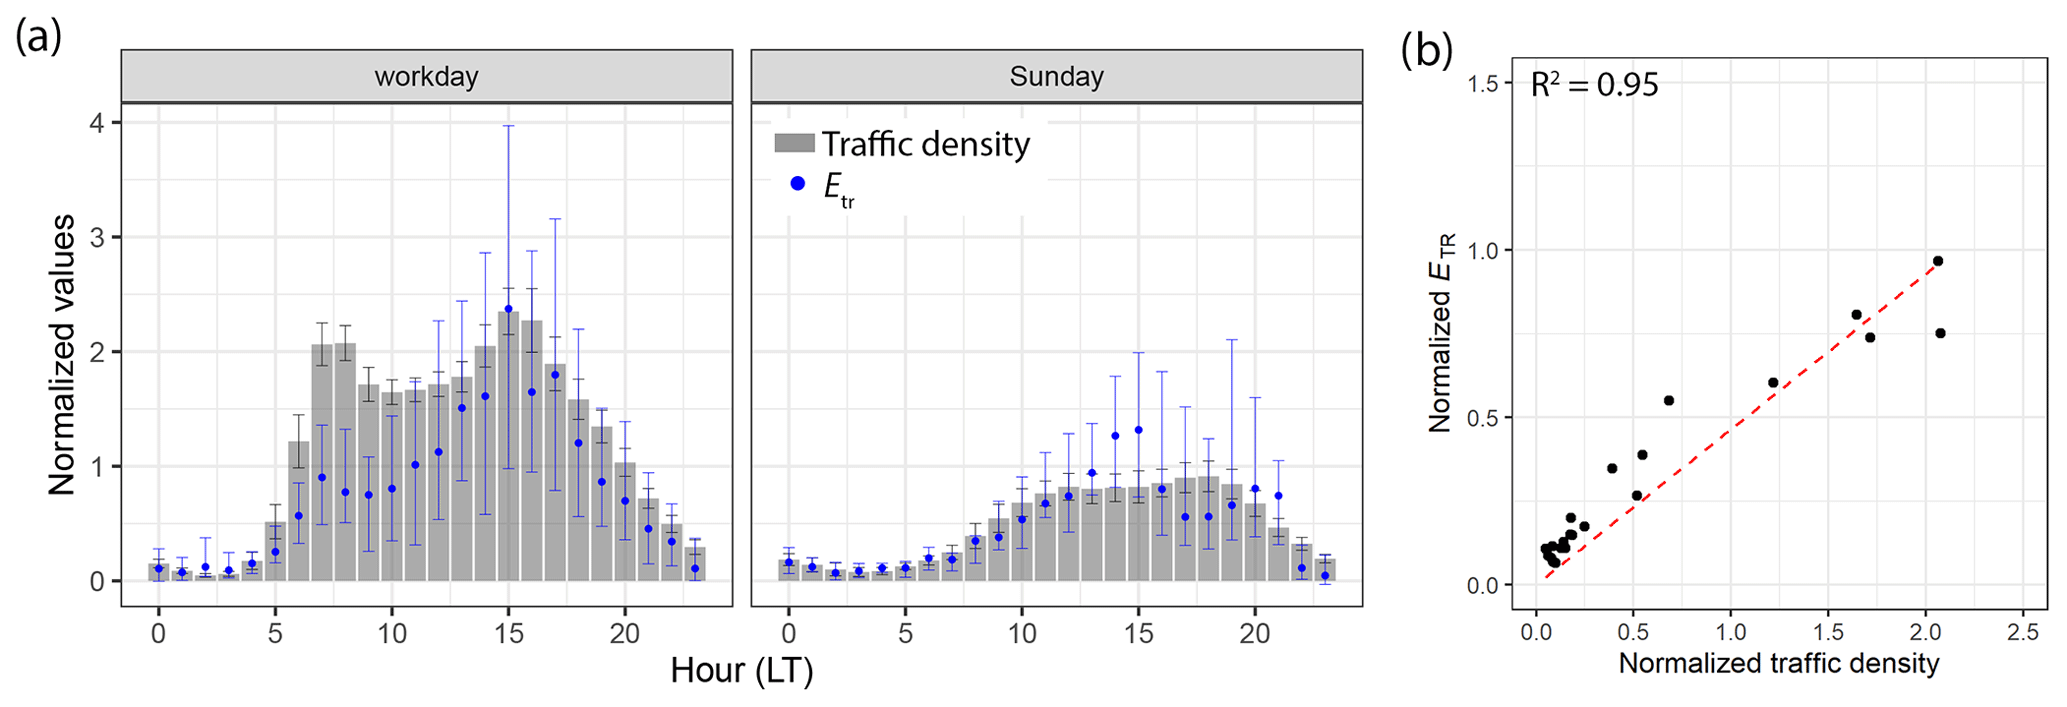
Figure 12Comparison between diurnal profiles of traffic density and modelled ETR in Ljubljana. Normalized mean hourly values are presented for traffic density, whereas ETR values are presented in terms of normalized median and 25th and 75th quantiles (a). Linear regression (without offset) of points from 00:00 to 10:00 that are presented in the diurnal plot results in R2=0.95.
Biomass burning BC emission rates (EBB), on the other hand, show weaker diurnal dynamics than traffic BC emission rates (Fig. 11). Although seasonal variation in EBB is more pronounced, the diurnal pattern in LJ shows slightly higher emission rates in the afternoon and evening hours. However, high uncertainty of the midafternoon results may be the reason for increased EBB in the midafternoon, with average winter EBB increasing from 60 ± 70 in the morning to 90 ± 45 between 18:00 and 20:00 (working days). In AJ, an additional morning increase is present in winter between 06:00 and 08:00, with EBB of 200 ± 160 (working days) followed by a stronger afternoon peak of 900 ± 1200 between 16:00 and 17:00. In spring, similar average daily EBB was obtained in LJ (30 ± 20) and AJ (40 ± 30 ).
Traffic was found to be the main source of BC emissions in Ljubljana, where biomass burning represents 27 % of all BC emissions in winter. On the other hand, biomass burning exceeds traffic BC emissions in the Vipava valley, with 60 % contribution in the winter months.
3.5 Uncertainty estimation
The uncertainty of the box model depends on different parameters and processes.
The results of MLH determined by the box model strongly depend on the correct (a) estimation of the radon exhalation rate. A biased effective ERn estimate would bias results of the EBC in a positive or negative way. Due to seasonal changes of the ERn, it has to be evaluated for each season and month separately. Since continuous monitoring of ERn is usually not available, the box model has to be calibrated to any available information on the MLH in order to get the ERn, scaled for the measurement height. In this regard it has to be pointed out that additional measurements, which can be used to determine the MLH for limited time periods, are necessary to lower the uncertainty of the ERn estimate. The uncertainty of the ERn was estimated to be 50 Bq m−2 h−1 (∼ 20 % of the mean ERn estimate for the area under investigation). To account for this, the model was evaluated for upper and lower ERn estimates which were selected 100 Bq m−2 h−1 apart (Table 2).
Uncertain levels of the (b) Rn concentration in the residual layer and approximation of its vertical gradient can influence the modelled daily evolution of MLH, especially towards the midafternoon, when the denominator in Eqs. (11) and (12) limits towards zero, making the box model highly uncertain. The uncertainty of the Rn concentration in the residual layer is estimated to be ∼ 50 %. However, the uncertainty of the MLH results increases with decreasing radon concentration in the mixing layer, when the resulting difference of Rn concentration between mixing and residual layer approaches zero. This reflects 50 %–75 % uncertainty of the MLH calculation in the midafternoon of convective days in the worst-case scenario. On the other hand, the residual layer Rn concentration does not influence the MLH estimates in the SNBL conditions.
As discussed in Sect. 2.6.1, (c) horizontal advection, which is accounted for by introducing spatial decay constants to the box model, can lead to an overestimation of the EBC, when advection prevails over the convective mixing. This effect is again present mostly during the midafternoon and adds to the uncertainty of emission rate estimation. The uncertainty of BC spatial decay constant is estimated at ∼ 30 %, where a 30 % increase in the spatial decay constant results in a 30 % increase in BC emission rates at midafternoon in the case of Ljubljana (on average).
Another contribution to the uncertainty arises from Rn measurements, when radon concentration, especially in the convective PBL, reaches the (d) instrumental lower detection limit in the early afternoon. This can lead to underestimation of the MLH and consequently also underestimation of the derived BC emission rate.
Uncertainty contributions described above lead to the conclusion that the highest uncertainty of emission rate estimate can be expected in the midafternoon period during the convective days, when the overall uncertainty can reach 100 %. On the other hand, the model uncertainty is the lowest in stable atmospheric conditions, when the main sources of uncertainty come from points (a) and (b), resulting in ∼ 30 % uncertainty of the BC emission rate estimates. The comparison of the traffic-related emission rate ETR and the traffic density in LJ shows the presence of the higher model uncertainty (overestimated emissions) in the midafternoon (Fig. 12).
Negative hourly EBC values result from the BC distribution, from a temporal and spatial point of view, not complying with the expected background evolution of BC concentration. Thus, the local BC concentration peak, measured at the urban background site, would result in a high calculated emission rate, followed by a negative calculation of the emission rate. This effect (positive–negative spike due to local BC concentration peak) is usually observed in the time period when sources are active. Higher noise is thus obtained during unstable atmospheric conditions in the presence of local BC concentration peaks. The traffic BC emission rate results in more noisy results than biomass burning BC emissions. Higher noise is also observed for the Vipava valley emission rate calculation, induced by non-homogeneous distribution of biomass burning sources. Negative values were treated as valid model results, since averaging removes these oscillations and results in a more realistic estimation of the emission rate.
Due to different BC sampling height at the LJ and AJ locations – 4 and 12 m, respectively – some uncertainty of BC emission rates can be expected during the SNBL conditions, since stratification of SNBL can play a role in measured black carbon concentration. This is especially important when comparing traffic and biomass burning BC sources, since their emissions have different characteristics. BCTR is emitted from the sources at the ground surface, whereas biomass burning sources are usually several metres higher, at the height of the chimneys. Due to dispersion and dilution processes, the concentration gradient flattens with time. Thus, in the case of traffic-related BC with higher intensity during the day, there would be enough time for the dispersion of BCTR before stratification of SNBL. However, the morning emissions before the break of SNBL could be slightly underestimated in AJ, where sampling was performed at 12 m above ground. On the other hand, biomass burning BC is emitted higher above ground. For the Ljubljana basin it was shown that BCBB is homogeneously distributed within the city (Ogrin et al., 2016). At the AJ location, with numerous biomass burning sources over a smaller area, the concentration profile could be more significant, especially in stable atmospheric conditions, which could lead to increased BCBB measured for the same level of emissions. This could in turn cause slight overestimation of EBB in the afternoon–early evening, before the emission plume is dispersed. However, a rough estimate of the emission inventory leads us to believe that biomass burning is ubiquitous in AJ, not leading to significant emission gradients in the urban area.
Overall, the box model results are more reliable in stable atmospheric conditions, especially during the morning hours, after the break of stratified SNBL and before midafternoon advection prevails in the convective mixing. To account for the uncertainty, the midafternoon MLH estimates were excluded from the ERn calibration procedure, and weighted averaging was used to determine the daily average of BC emission rates. Measurements of pollutant concentration should be conducted at background sites, to allow for their homogeneous dispersion, resulting in lower noise of the calculated emission rates.
We present a method for the determination of the source-specific black carbon emission rates and apply it to measurements in two different environments: an urban location in Ljubljana and a rural one in the Vipava valley (Slovenia, Europe), which also differ in their natural characteristics (geology, geomorphology, meteorology). The influence of atmospheric dynamics was quantified based on atmospheric Rn concentration and monthly resolved ERn, allowing for 1 h time resolution MLH determination for periods of thermally driven PBL evolution. Intensity of BC sources – BC emission rate – was determined by taking into account the horizontal advection term, simplified by temporal and spatial exponential decay. Whereas the choice of temporal decay constant introduces only a small offset in determined BC emission rates, the spatial decay constant was shown to influence the daily pattern of calculated BC emission rates significantly. Different spatial decay rate was introduced for traffic and biomass burning emission sources depending on the area under consideration and spatial distribution of both sources. Therefore γBB for the Ljubljana basin was set to m−1, which corresponds to a half-distance decay of approximately 14 km. On the other hand, a smaller contributing area was chosen for BCTR, with γTR set to m−1 (corresponding to 10 km half-distance decay). Distribution of sources within the Vipava valley indicates a smaller contribution area, with γBB and γTR set to 10−4 m−1 (7 km half-distance decay).
The rural characteristics of Vipava valley area reflect in significantly higher BC contribution from biomass burning during winter in AJ (60 %) in comparison to LJ (27 %). The average BC concentration in winter was 4.5 ± 5.7 and 3.4 ± 4.2 µg m−3 for LJ and AJ, respectively. However, during stable PBL conditions in winter, BC concentration in AJ can easily exceed concentrations in LJ, reaching an average daily BC concentration of 10–15 µg m−3. BC concentrations decrease in warmer months.
Results show the overall BC emission rates in Ljubljana in the range from 210 to 260 in spring and winter, respectively. By accounting for the uncertainty introduced by estimation of radon exhalation rate, the range may be extended to 190–250 and 210–300 in spring and winter, respectively. BC emissions in the Vipava valley were lower in spring, 150 (120–160) , but in the same range in winter, 250 (200–300) . This shows that the emission rates are not necessarily related to the population density, and sparsely populated areas do feature high black carbon emission rates. As expected, BC emissions from traffic prevail in Ljubljana and account for 73 % in wintertime. On the other hand, biomass burning in individual houses contributes more than half (60 %) of the emitted BC in Vipava valley during the heating season. Due to the difference in respective daily dynamics of emission rates from biomass burning and traffic, the fraction of BC concentration from biomass burning is slightly higher than the fraction of its emission rate. Traffic emissions occur mostly during the daytime and are dispersed in the PBL more effectively than biomass burning emissions, with the sources also being active during the night hours, thus having a stronger impact on the concentrations. Although BC concentrations from both sources decrease towards warmer months, traffic-related emission rates remain constant year-round, whereas biomass burning emission rates strongly depend on the outside temperature, which drives the heating demand.
A different diurnal pattern of ETR was revealed for both measurement locations, reflecting traffic dynamics characteristic for Ljubljana and Vipava valley. A narrow peak in ETR in the morning (LJ: 170–250 and AJ: 130–190 ) was observed at both locations. Traffic-related emissions remained elevated through the whole day in Ljubljana, whereas emissions decreased substantially in the Vipava valley in the late morning hours. Midafternoon estimated emissions are higher but also subjected to high uncertainties. Biomass burning BC emission rates, on the other hand, show weaker diurnal dynamics than traffic BC emission rates. In Ljubljana, EBB slowly increases from the early morning to the afternoon. More pronounced daily dynamics of EBB was observed in Vipava valley in winter, when an increase in biomass burning emissions was observed in the morning and in the afternoon.
Coupling of highly time-resolved measurements of a primary, inert air pollutant, such as BC, with atmospheric radon concentration measurements provides a useful tool for direct, high-time-resolution measurements of intensity of emission sources. This information is essential for short-term forecast of air pollution episodes, as well as for the evaluation of the efficiency of air pollution abatement measures.
Although a set of criteria has to be fulfilled to keep the level of uncertainty in the reasonable range, the presented approach may also be applicable in complex terrain, under the condition of a relatively constant radon source term.
The data used in this publication are available upon request to the corresponding author (asta.gregoric@aerosol.eu).
The supplement related to this article is available online at: https://doi.org/10.5194/acp-20-14139-2020-supplement.
AG, LD, IJ and GM designed the study. JV and AG performed and analysed radon measurements. ML, DG, LD and GM performed and analysed measurements by ultralight aircraft. LW, MM and SS performed lidar measurements. Model development and paper preparation were performed by AG, LD and GM. All authors contributed to the scientific discussion.
At the time of the research, Asta Gregorič, Irena Ježek, Griša Močnik and Luka Drinovec were also employed by the manufacturer of the Aethalometer instruments, used to measure black carbon. Other authors declare no conflict of interest. The funding sponsors had no role in the design of the study; in the collection, analyses or interpretation of data; in the writing of the manuscript; or in the decision to publish the results.
The authors would like to thank Scott Chambers and the anonymous referee for their valuable comments which greatly contributed to improving the first version of the paper. We thank Marta Stopar for her dedicated help with measurements.
This research has been supported by the Ministry of Economic Development and Technology of Republic of Slovenia (grant no. TRL 6-9/4300-1/2016-60) and by the Slovenian Research Agency (grant nos. I0-0033, P1- 0385, P1-0099 and P1-0143).
This paper was edited by Barbara Ervens and reviewed by Scott Chambers and one anonymous referee.
Allegrini, I., Febo, A., Pasini, A., and Schiarini, S.: Monitoring of the nocturnal mixed layer by means of participate radon progeny measurement, J. Geophys. Res.-Atmos., 99, 18765–18777, https://doi.org/10.1029/94JD00783, 1994.
Athanasopoulou, E., Speyer, O., Brunner, D., Vogel, H., Vogel, B., Mihalopoulos, N., and Gerasopoulos, E.: Changes in domestic heating fuel use in Greece: effects on atmospheric chemistry and radiation, Atmos. Chem. Phys., 17, 10597–10618, https://doi.org/10.5194/acp-17-10597-2017, 2017.
Aurela, M., Saarikoski, S., Timonen, H., Aalto, P., Keronen, P., Saarnio, K., Teinilä, K., Kulmala, M., and Hillamo, R.: Carbonaceous aerosol at a forested and an urban background sites in Southern Finland, Atmos. Environ., 45, 1394–1401, https://doi.org/10.1016/j.atmosenv.2010.12.039, 2011.
Blanco-Alegre, C., Calvo, A. I., Coz, E., Castro, A., Oduber, F., Prevot, A. S. H., Mocnik, G., and Fraile, R.: Quantification of source specific black carbon scavenging using an aethalometer and a disdrometer, Environ. Pollut., 246, 336–345, https://doi.org/10.1016/j.envpol.2018.11.102, 2019.
Bond, T. C., Bhardwaj, E., Dong, R., Jogani, R., Jung, S., Roden, C., Streets, D. G., and Trautmann, N. M.: Historical emissions of black and organic carbon aerosol from energy-related combustion, 1850–2000, Global Biogeochem. Cy., 21, 1944–9224, https://doi.org/10.1029/2006GB002840, 2007.
Bond, T. C., Doherty, S. J., Fahey, D. W., Forster, P. M., Berntsen, T., DeAngelo, B. J., Flanner, M. G., Ghan, S., Kärcher, B., Koch, D., Kinne, S., Kondo, Y., Quinn, P. K., Sarofim, M. C., Schultz, M. G., Schulz, M., Venkataraman, C., Zhang, H., Zhang, S., Bellouin, N., Guttikunda, S. K., Hopke, P. K., Jacobson, M. Z., Kaiser, J. W., Klimont, Z., Lohmann, U., Schwarz, J. P., Shindell, D., Storelvmo, T., Warren, S. G., and Zender, C. S.: Bounding the role of black carbon in the climate system: A scientific assessment, J. Geophys. Res.-Atmos., 118, 5380–5552, https://doi.org/10.1002/jgrd.50171, 2013.
Brioude, J., Angevine, W. M., Ahmadov, R., Kim, S.-W., Evan, S., McKeen, S. A., Hsie, E.-Y., Frost, G. J., Neuman, J. A., Pollack, I. B., Peischl, J., Ryerson, T. B., Holloway, J., Brown, S. S., Nowak, J. B., Roberts, J. M., Wofsy, S. C., Santoni, G. W., Oda, T., and Trainer, M.: Top-down estimate of surface flux in the Los Angeles Basin using a mesoscale inverse modeling technique: assessing anthropogenic emissions of CO, NOx and CO2 and their impacts, Atmos. Chem. Phys., 13, 3661–3677, https://doi.org/10.5194/acp-13-3661-2013, 2013.
Cape, J. N., Coyle, M., and Dumitrean, P.: The atmospheric lifetime of black carbon, Atmos. Environ., 59, 256–263, https://doi.org/10.1016/j.atmosenv.2012.05.030, 2012.
Carslaw, D. C. and Ropkins, K.: openair – An R package for air quality data analysis, Environ. Model. Soft., 27–28, 52–61, https://doi.org/10.1016/j.envsoft.2011.09.008, 2012.
Chambers, S. D., Podstawczyńska, A., Williams, A. G., and Pawlak, W.: Characterising the influence of atmospheric mixing state on Urban Heat Island Intensity using Radon-222, Atmos. Environ., 147, 355–368, https://doi.org/10.1016/j.atmosenv.2016.10.026, 2016.
Chambers, S. D., Podstawczyńska, A., Pawlak, W., Fortuniak, K., Williams, A. G., and Griffiths, A. D.: Characterizing the State of the Urban Surface Layer Using Radon-222, J. Geophys. Res.-Atmos., 124, 770–788, https://doi.org/10.1029/2018jd029507, 2019.
Crawford, J., Chambers, S., Cohen, D. D., Dyer, L., Wang, T., and Zahorowski, W.: Receptor modelling using Positive Matrix Factorisation, back trajectories and Radon-222, Atmos. Environ., 41, 6823–6837, https://doi.org/10.1016/j.atmosenv.2007.04.048, 2007.
Crawford, J., Chambers, S., Cohen, D., Williams, A., Griffiths, A., and Stelcer, E.: Assessing the impact of atmospheric stability on locally and remotely sourced aerosols at Richmond, Australia, using Radon-222, Atmos. Environ., 127, 107–117, https://doi.org/10.1016/j.atmosenv.2015.12.034, 2016.
Crilley, L. R., Bloss, W. J., Yin, J., Beddows, D. C. S., Harrison, R. M., Allan, J. D., Young, D. E., Flynn, M., Williams, P., Zotter, P., Prevot, A. S. H., Heal, M. R., Barlow, J. F., Halios, C. H., Lee, J. D., Szidat, S., and Mohr, C.: Sources and contributions of wood smoke during winter in London: assessing local and regional influences, Atmos. Chem. Phys., 15, 3149–3171, https://doi.org/10.5194/acp-15-3149-2015, 2015.
Crippa, M., DeCarlo, P. F., Slowik, J. G., Mohr, C., Heringa, M. F., Chirico, R., Poulain, L., Freutel, F., Sciare, J., Cozic, J., Di Marco, C. F., Elsasser, M., Nicolas, J. B., Marchand, N., Abidi, E., Wiedensohler, A., Drewnick, F., Schneider, J., Borrmann, S., Nemitz, E., Zimmermann, R., Jaffrezo, J.-L., Prévôt, A. S. H., and Baltensperger, U.: Wintertime aerosol chemical composition and source apportionment of the organic fraction in the metropolitan area of Paris, Atmos. Chem. Phys., 13, 961–981, https://doi.org/10.5194/acp-13-961-2013, 2013.
Denier van der Gon, H. A. C., Bergström, R., Fountoukis, C., Johansson, C., Pandis, S. N., Simpson, D., and Visschedijk, A. J. H.: Particulate emissions from residential wood combustion in Europe – revised estimates and an evaluation, Atmos. Chem. Phys., 15, 6503–6519, https://doi.org/10.5194/acp-15-6503-2015, 2015.
Drinovec, L., Močnik, G., Zotter, P., Prévôt, A. S. H., Ruckstuhl, C., Coz, E., Rupakheti, M., Sciare, J., Müller, T., Wiedensohler, A., and Hansen, A. D. A.: The ”dual-spot” Aethalometer: an improved measurement of aerosol black carbon with real-time loading compensation, Atmos. Meas. Tech., 8, 1965–1979, https://doi.org/10.5194/amt-8-1965-2015, 2015.
Etiope, G. and Martinelli, G.: Migration of carrier and trace gases in the geosphere: an overview, Phys. Earth Planet. In., 129, 185–204, https://doi.org/10.1016/S0031-9201(01)00292-8, 2002.
Favez, O., Cachier, H., Sciare, J., Sarda-Estève, R., and Martinon, L.: Evidence for a significant contribution of wood burning aerosols to PM2.5 during the winter season in Paris, France, Atmos. Environ., 43, 3640–3644, https://doi.org/10.1016/j.atmosenv.2009.04.035, 2009.
Favez, O., El Haddad, I., Piot, C., Boréave, A., Abidi, E., Marchand, N., Jaffrezo, J.-L., Besombes, J.-L., Personnaz, M.-B., Sciare, J., Wortham, H., George, C., and D'Anna, B.: Inter-comparison of source apportionment models for the estimation of wood burning aerosols during wintertime in an Alpine city (Grenoble, France), Atmos. Chem. Phys., 10, 5295–5314, https://doi.org/10.5194/acp-10-5295-2010, 2010.
Ferrero, L., Mocnik, G., Ferrini, B. S., Perrone, M. G., Sangiorgi, G., and Bolzacchini, E.: Vertical profiles of aerosol absorption coefficient from micro-Aethalometer data and Mie calculation over Milan, Sci. Total. Environ., 409, 2824–2837, https://doi.org/10.1016/j.scitotenv.2011.04.022, 2011.
Ferrero, L., Castelli, M., Ferrini, B. S., Moscatelli, M., Perrone, M. G., Sangiorgi, G., D'Angelo, L., Rovelli, G., Moroni, B., Scardazza, F., Močnik, G., Bolzacchini, E., Petitta, M., and Cappelletti, D.: Impact of black carbon aerosol over Italian basin valleys: high-resolution measurements along vertical profiles, radiative forcing and heating rate, Atmos. Chem. Phys., 14, 9641–9664, https://doi.org/10.5194/acp-14-9641-2014, 2014.
Fuller, G. W., Tremper, A. H., Baker, T. D., Yttri, K. E., and Butterfield, D.: Contribution of wood burning to PM10 in London, Atmos. Environ., 87, 87–94, https://doi.org/10.1016/j.atmosenv.2013.12.037, 2014.
Gjerek, M., Koleša, T., Logar, M., Matavž, L., Murovec, M., Rus, M., and Žabkar, R.: Kakovost zraka v Sloveniji v letu 2017 (Air quality in Slovenia in 2017), Agencija Republike Slovenije za Okolje (Slovenian Environment Agency), Ljubljana, 130, 2018.
Griffiths, A. D., Parkes, S. D., Chambers, S. D., McCabe, M. F., and Williams, A. G.: Griffiths, A. D., Parkes, S. D., Chambers, S. D., McCabe, M. F., and Williams, A. G.: Improved mixing height monitoring through a combination of lidar and radon measurements, Atmos. Meas. Tech., 6, 207–218, https://doi.org/10.5194/amt-6-207-2013, 2013.
Guerrette, J. J. and Henze, D. K.: Four-dimensional variational inversion of black carbon emissions during ARCTAS-CARB with WRFDA-Chem, Atmos. Chem. Phys., 17, 7605–7633, https://doi.org/10.5194/acp-17-7605-2017, 2017.
Hansen, A. D. A., Artz, R. S., Pszenny, A. A. P., and Larson, R. E.: Aerosol black carbon and radon as tracers for air mass origin over the North Atlantic ocean, Global Biogeochem. Cy., 4, 189–199, 1990.
He, T.-Y., Gao, F., Stanič, S., Veberič, D., Bergant, K., Dolžan, A., and Song, X.-Q.: Scanning mobile lidar for aerosol tracking and biological aerosol identification, Proc. SPIE, 7832, 78320U, https://doi.org/10.1117/12.868387 2010.
Helin, A., Niemi, J. V., Virkkula, A., Pirjola, L., Teinilä, K., Backman, J., Aurela, M., Saarikoski, S., Rönkkö, T., Asmi, E., and Timonen, H.: Characteristics and source apportionment of black carbon in the Helsinki metropolitan area, Finland, Atmos. Environ., 190, 87–98, https://doi.org/10.1016/j.atmosenv.2018.07.022, 2018.
Herich, H., Gianini, M. F. D., Piot, C., Močnik, G., Jaffrezo, J. L., Besombes, J. L., Prévôt, A. S. H., and Hueglin, C.: Overview of the impact of wood burning emissions on carbonaceous aerosols and PM in large parts of the Alpine region, Atmos. Environ., 89, 64–75, https://doi.org/10.1016/j.atmosenv.2014.02.008, 2014.
Hovorka, J., Pokorná, P., Hopke, P. K., Křůmal, K., Mikuška, P., and Píšová, M.: Wood combustion, a dominant source of winter aerosol in residential district in proximity to a large automobile factory in Central Europe, Atmos. Environ., 113, 98–107, https://doi.org/10.1016/j.atmosenv.2015.04.068, 2015.
IPCC: Contribution of Working Group I to the Fifth Assessment Report of the Intergovernmental Panel on Climate Change, in: Climate Change 2013: the Physical Science Basis, edited by: Stocker, T. F., Qin, D., Plattner, G.-K., Tignor, M., Allen, S. K., Boschung, J., Nauels, A., Xia, Y., Bex, V., and Midgley, P. M., Cambridge University Press, Cmbridge, United Kingdom and New York, USA, 2013.
Janssen, N. A., Hoek, G., Simic-Lawson, M., Fischer, P., van Bree, L., ten Brink, H., Keuken, M., Atkinson, R. W., Anderson, H. R., Brunekreef, B., and Cassee, F. R.: Black carbon as an additional indicator of the adverse health effects of airborne particles compared with PM10 and PM2.5, Environ. Health Persp., 119, 1691–1699, https://doi.org/10.1289/ehp.1003369, 2011.
Janža, M., Lapanje, A., Šram, D., Rajver, D., and Novak, M.: Research of the geological and geothermal conditions for the assessment of the shallow geothermal potential in the area of Ljubljana, Slovenia, Geologija, 60, 309–327, https://doi.org/10.5474/geologija.2017.022, 2017.
Jež, J.: Reasons and mechanism for soil sliding processes in the Rebrnice area, Vipava valley, SW Slovenia, Geologija, 50, 55–63, https://doi.org/10.5474/geologija.2007.005, 2007.
Ježek, I., Blond, N., Skupinski, G., and Močnik, G.: The traffic emission-dispersion model for a Central-European city agrees with measured black carbon apportioned to traffic, Atmos. Environ., 184, 177–190, https://doi.org/10.1016/j.atmosenv.2018.04.028, 2018.
Kardos, R., Gregorič, A., Jónás, J., Vaupotič, J., Kovács, T., and Ishimori, Y.: Dependence of radon emanation of soil on lithology, J. Radioanal. Nucl. Chem., 304, 1321–1327, https://doi.org/10.1007/s10967-015-3954-3, 2015.
Karstens, U., Schwingshackl, C., Schmithüsen, D., and Levin, I.: Karstens, U., Schwingshackl, C., Schmithüsen, D., and Levin, I.: A process-based 222radon flux map for Europe and its comparison to long-term observations, Atmos. Chem. Phys., 15, 12845–12865, https://doi.org/10.5194/acp-15-12845-2015, 2015.
Kikaj, D., Vaupotič, J., and Chambers, S. D.: Kikaj, D., Vaupotič, J., and Chambers, S. D.: Identifying persistent temperature inversion events in a subalpine basin using radon-222, Atmos. Meas. Tech., 12, 4455–4477, https://doi.org/10.5194/amt-12-4455-2019, 2019..
Klimont, Z., Kupiainen, K., Heyes, C., Purohit, P., Cofala, J., Rafaj, P., Borken-Kleefeld, J., and Schöpp, W.: Global anthropogenic emissions of particulate matter including black carbon, Atmos. Chem. Phys., 17, 8681–8723, https://doi.org/10.5194/acp-17-8681-2017, 2017.
Leukauf, D., Gohm, A., and Rotach, M. W.: Quantifying horizontal and vertical tracer mass fluxes in an idealized valley during daytime, Atmos. Chem. Phys., 16, 13049–13066, https://doi.org/10.5194/acp-16-13049-2016, 2016.
LRTAP 2018: European Union emission inventory report 1990–2016 under the UNECE Convention on Long-range Transboundary Air Pollution, European Environment Agency, Luxemburg, 2018.
McGrath-Spangler, E. L., Molod, A., Ott, L. E., and Pawson, S.: Impact of planetary boundary layer turbulence on model climate and tracer transport, Atmos. Chem. Phys., 15, 7269–7286, https://doi.org/10.5194/acp-15-7269-2015, 2015.
Mole, M., Wang, L., Stanič, S., Bergant, K., Eichinger, W. E., Ocaña, F., Strajnar, B., Škraba, P., Vučković, M., and Willis, W. B.: Lidar measurements of Bora wind effects on aerosol loading, J. Quant. Spectrosc. Ra., 188, 39–45, https://doi.org/10.1016/j.jqsrt.2016.05.020, 2017.
Mues, A., Rupakheti, M., Münkel, C., Lauer, A., Bozem, H., Hoor, P., Butler, T., and Lawrence, M. G.: Investigation of the mixing layer height derived from ceilometer measurements in the Kathmandu Valley and implications for local air quality, Atmos. Chem. Phys., 17, 8157–8176, https://doi.org/10.5194/acp-17-8157-2017, 2017.
Ochmann, A. A.: Distribution of radon activity in the atmosphere above Wzgórza Niemczansko-Strzelinskie (South-West Poland) and its dependence on uranium and thorium content in the underlying rock and indirect ground basement, Ann. Geophys-Italy, 48, 117–127, 2005.
Ogrin, M., Vintar Mally, K., Planinšek, A., Gregorič, A., Drinovec, L., and Močnik, G.: Nitrogen dioxide and black carbon concentrations in Ljubljana, GeograFF, Ljubljana University Press, Faculty of Arts, Ljubljana, 118 pp., 2016.
Pakkanen, T. A., Kerminen, V.-M., Ojanen, C. H., Hillamo, R. E., Aarnio, P., and Koskentalo, T.: Atmospheric black carbon in Helsinki, Atmos. Environ., 34, 1497–1506, https://doi.org/10.1016/S1352-2310(99)00344-1, 2000.
Pal, S., Lopez, M., Schmidt, M., Ramonet, M., Gibert, F., Xueref-Remy, I., and Ciais, P.: Investigation of the atmospheric boundary layer depth variability and its impact on the 222Rn concentration at a rural site in France, J. Geophys. Res.-Atmos., 120, 623–643, https://doi.org/10.1002/2014JD022322, 2015.
Pearson, J. E. and Jones, G. E.: Emanation of radon 222 from soils and its use as a tracer, J. Geophys. Res., 70, 5279–5290, https://doi.org/10.1029/JZ070i020p05279, 1965.
Perrino, C., Pietrodangelo, A., and Febo, A.: An atmospheric stability index based on radon progeny measurements for the evaluation of primary urban pollution, Atmos. Environ., 35, 5235–5244, https://doi.org/10.1016/S1352-2310(01)00349-1, 2001.
Podstawczyńska, A.: Differences of near-ground atmospheric Rn-222 concentration between urban and rural area with reference to microclimate diversity, Atmos. Environ., 126, 225–234, https://doi.org/10.1016/j.atmosenv.2015.11.037, 2016.
Pöschl, U.: Atmospheric aerosols: composition, transformation, climate and health effects, Angew. Chem. Int. Edit., 44, 7520–7540, https://doi.org/10.1002/anie.200501122, 2005.
Quan, J., Gao, Y., Zhang, Q., Tie, X., Cao, J., Han, S., Meng, J., Chen, P., and Zhao, D.: Evolution of planetary boundary layer under different weather conditions, and its impact on aerosol concentrations, Particuology, 11, 34–40, https://doi.org/10.1016/j.partic.2012.04.005, 2013.
R Core Team: R: A language and environment for statistical computing, R Foundation for Statistical Computing, Vienna, Austria, 2018.
Reche, C., Querol, X., Alastuey, A., Viana, M., Pey, J., Moreno, T., Rodríguez, S., González, Y., Fernández-Camacho, R., de la Rosa, J., Dall'Osto, M., Prévôt, A. S. H., Hueglin, C., Harrison, R. M., and Quincey, P.: New considerations for PM, Black Carbon and particle number concentration for air quality monitoring across different European cities, Atmos. Chem. Phys., 11, 6207–6227, https://doi.org/10.5194/acp-11-6207-2011, 2011.
Ricard, V., Jaffrezo, J. L., Kerminen, V. M., Hillamo, R. E., Sillanpaa, M., Ruellan, S., Liousse, C., and Cachier, H.: Two years of continuous aerosol measurements in northern Finland, J. Geophys. Res.-Atmos., 107, ACH 10-11–ACH 10-17, 2002.
Rolph, G., Stein, A., and Stunder, B.: Real-time Environmental Applications and Display sYstem: READY, Environ., Modell. Softw., 95, 210–228, https://doi.org/10.1016/j.envsoft.2017.06.025, 2017.
Salzano, R., Pasini, A., Casasanta, G., Cacciani, M., and Perrino, C.: Quantitative Interpretation of Air Radon Progeny Fluctuations in Terms of Stability Conditions in the Atmospheric Boundary Layer, Bound.-Lay. Meteorol., 160, 529–550, https://doi.org/10.1007/s10546-016-0149-6, 2016.
Sandradewi, J., Prévôt, A. S. H., Szidat, S., Perron, N., Alfarra, M. R., Lanz, V. A., Weingartner, E., and Baltensperger, U.: Using aerosol light absorption measurements for the quantitative determination of wood burning and traffic emission contributions to particulate matter, Environ. Sci. Technol., 42, 3316–3323, https://doi.org/10.1021/es702253m, 2008a.
Sandradewi, J., Prévôt, A. S. H., Weingartner, E., Schmidhauser, R., Gysel, M., and Baltensperger, U.: A study of wood burning and traffic aerosols in an Alpine valley using a multi-wavelength Aethalometer, Atmos. Environ., 42, 101–112, https://doi.org/10.1016/j.atmosenv.2007.09.034, 2008b.
Seibert, P., Beyrich, F., Gryning, S.-E., Joffre, S., Rasmussen, A., and Tercier, P.: Review and intercomparison of operational methods for the determination of the mixing height, Atmos. Environ., 34, 1001–1027, https://doi.org/10.1016/S1352-2310(99)00349-0, 2000.
Seinfeld, J. H. and Pandis, S. N.: Atmospheric chemistry and physics, from air pollution to climate change, 3rd Edn., John Wiley & Sons, Hoboken, New Jersey, 2016.
Sesana, L., Caprioli, E., and Marcazzan, G. M.: Long period study of outdoor radon concentration in Milan and correlation between its temporal variations and dispersion properties of atmosphere, J. Environ. Radioactiv., 65, 147–160, https://doi.org/10.1016/s0265-931x(02)00093-0, 2003.
Stull, R. B.: An introduction to Boundary Layer Meteorology, Kluwer Academics Press, Dordrecht, The Netherlands, 670 pp., 1988.
Sun, T., Liu, L., Flanner, M. G., Kirchstetter, T. W., Jiao, C., Preble, C. V., Chang, W. L., and Bond, T. C.: Constraining a Historical Black Carbon Emission Inventory of the United States for 1960–2000, J. Geophys. Res.-Atmos., 124, 4004–4025, https://doi.org/10.1029/2018jd030201, 2019.
Tang, G., Zhang, J., Zhu, X., Song, T., Münkel, C., Hu, B., Schäfer, K., Liu, Z., Zhang, J., Wang, L., Xin, J., Suppan, P., and Wang, Y.: Mixing layer height and its implications for air pollution over Beijing, China, Atmos. Chem. Phys., 16, 2459–2475, https://doi.org/10.5194/acp-16-2459-2016, 2016.
Titos, G., Lyamani, H., Drinovec, L., Olmo, F. J., Močnik, G., and Alados-Arboledas, L.: Evaluation of the impact of transportation changes on air quality, Atmos. Environ., 114, 19–31, https://doi.org/10.1016/j.atmosenv.2015.05.027, 2015.
UNSCEAR (United Nations Scientific Committee on the Effects of Atomic Radiation): Sources and effects of ionizing radiation, Vol I: Sources, UNSCEAR 2000 Report to the General Assembly, with Scientific Annexes, 2000.
Vaupotič, J., Žvab, P., Gregorič, A., Dujmovič, P., Kocman, D., Kobal, I., Kozak, K., Mazur, J., Kochowska, E., and Haber, R.: Soil gas radon potential on radon prone areas, Jozef Stefan Institute, IJS-DP-9694, Jozef Stefan Institute, Ljubljana, Internal report no. 9694, 37 pp., 2007 (in Slovene).
Vaupotič, J., Gregorič, A., Kobal, I., Žvab, P., Kozak, K., Mazur, J., Kochowska, E., and Grządziel, D.: Radon concentration in soil gas and radon exhalation rate at the Ravne Fault in NW Slovenia, Nat. Hazards Earth Syst. Sci., 10, 895–899, https://doi.org/10.5194/nhess-10-895-2010, 2010.
Vecchi, R., Piziali, F. A., Valli, G., Favaron, M., and Bernardoni, V.: Radon-based estimates of equivalent mixing layer heights: A long-term assessment, Atmos. Environ., 197, 150–158, 10.1016/j.atmosenv.2018.10.020, 2018.
Wang, F., Chambers, S. D., Zhang, Z., Williams, A. G., Deng, X., Zhang, H., Lonati, G., Crawford, J., Griffiths, A. D., Ianniello, A., and Allegrini, I.: Quantifying stability influences on air pollution in Lanzhou, China, using a radon-based “stability monitor”: Seasonality and extreme events, Atmos. Environ., 145, 376–391, https://doi.org/10.1016/j.atmosenv.2016.09.014, 2016a.
Wang, L., Stanič, S., Bergant, K., Eichinger, W., Močnik, G., Drinovec, L., Vaupotič, J., Miler, M., Gosar, M., and Gregorič, A.: Retrieval of Vertical Mass Concentration Distributions–Vipava Valley Case Study, Remote Sens-Basel, 11, 106, https://doi.org/10.3390/rs11020106, 2019.
Wang, P., Wang, H., Wang, Y. Q., Zhang, X. Y., Gong, S. L., Xue, M., Zhou, C. H., Liu, H. L., An, X. Q., Niu, T., and Cheng, Y. L.: Inverse modeling of black carbon emissions over China using ensemble data assimilation, Atmos. Chem. Phys., 16, 989–1002, https://doi.org/10.5194/acp-16-989-2016, 2016b.
WHO: Health effects of Black Carbon, The WHO European Centre for Environment and Health, Bonn, Germany, 2012.
Wickham, H.: ggplot2: Elegant Graphics for Data Analysis, Springer-Verlag, New York, 2009.
Williams, A. G., Zahorowski, W., Chambers, S., Griffiths, A., Hacker, J. M., Element, A., and Werczynski, S.: The Vertical Distribution of Radon in Clear and Cloudy Daytime Terrestrial Boundary Layers, J. Atmos. Sci., 68, 155–174, https://doi.org/10.1175/2010jas3576.1, 2011.
Williams, A. G., Chambers, S., and Griffiths, A.: Bulk Mixing and Decoupling of the Nocturnal Stable Boundary Layer Characterized Using a Ubiquitous Natural Tracer, Bound.-Lay. Meteorol., 149, 381–402, https://doi.org/10.1007/s10546-013-9849-3, 2013.
Williams, A. G., Chambers, S. D., Conen, F., Reimann, S., Hill, M., Griffiths, A. D., and Crawford, J.: Radon as a tracer of atmospheric influences on traffic-related air pollution in a small inland city, Tellus B, 68, 30967, https://doi.org/10.3402/tellusb.v68.30967, 2016.
Zhang, Y., Favez, O., Petit, J.-E., Canonaco, F., Truong, F., Bonnaire, N., Crenn, V., Amodeo, T., Prévôt, A. S. H., Sciare, J., Gros, V., and Albinet, A.: Six-year source apportionment of submicron organic aerosols from near-continuous highly time-resolved measurements at SIRTA (Paris area, France), Atmos. Chem. Phys., 19, 14755–14776, https://doi.org/10.5194/acp-19-14755-2019, 2019.