the Creative Commons Attribution 4.0 License.
the Creative Commons Attribution 4.0 License.
 | 20 Nov 2020
Chemical composition, structures, and light absorption of N-containing aromatic compounds emitted from burning wood and charcoal in household cookstoves
Mingjie Xie
Zhenzhen Zhao
Amara L. Holder
Michael D. Hays
Xi Chen
Guofeng Shen
James J. Jetter
Wyatt M. Champion
Qin'geng Wang
N-containing aromatic compounds (NACs) are an important group of light-absorbing molecules in the atmosphere. They are often observed in combustion emissions, but their chemical formulas and structural characteristics remain uncertain. In this study, red oakwood and charcoal fuels were burned in cookstoves using the standard water-boiling test (WBT) procedure. Submicron aerosol particles in the cookstove emissions were collected using quartz (Qf) and polytetrafluoroethylene (PTFE) filter membranes positioned in parallel. A backup quartz filter (Qb) was also installed downstream of the PTFE filter to evaluate the effect of sampling artifacts on NAC measurements. Liquid chromatography–mass spectroscopy (LC–MS) techniques identified 17 NAC chemical formulas in the cookstove emissions. The average concentrations of total NACs in Qb samples (0.37±0.31–1.79±0.77 µg m−3) were greater than 50 % of those observed in the Qf samples (0.51±0.43–3.91±2.06 µg m−3), and the Qb-to-Qf mass ratios of individual NACs had a range of 0.02–2.71, indicating that the identified NACs might have substantial fractions remaining in the gas phase. In comparison to other sources, cookstove emissions from red oak or charcoal fuels did not exhibit unique NAC structural features but had distinct NAC composition. However, before identifying NAC sources by combining their structural and compositional information, the gas-particle partitioning behaviors of NACs should be further investigated. The average contributions of total NACs to the light absorption of organic matter at λ=365 nm (1.10 %–2.57 %) in Qf and Qb samples (10.7 %–21.0 %) are up to 10 times larger than their mass contributions (Qf: 0.31 %–1.01 %; Qb: 1.08 %–3.31 %), so the identified NACs are mostly strong light absorbers. To explain more sample extract absorption, future research is needed to understand the chemical and optical properties of high-molecular-weight (e.g., molecular weight, MW>500 Da) entities in particulate matter.
- Article
(1712 KB) - Full-text XML
-
Supplement
(2304 KB) - BibTeX
- EndNote


In the developing world, 2.8 billion people burn solid fuels in household cookstoves for domestic activities such as heating and cooking (Bonjour et al., 2013). A variety of gaseous and particle-phase pollutants – carbon monoxide (CO), nitrogen oxides (NOx), volatile organic compounds (VOCs), fine particulate matter with aerodynamic diameters ≤2.5 µm (PM2.5), black carbon (BC), organic carbon (OC), etc. – are emitted from cookstoves largely due to incomplete combustion (Jetter et al., 2012; Shen et al., 2012; Wathore et al., 2017). In China, the relative contributions of residential coal and biomass burning (BB) to annual PM2.5 emissions decreased from 47 % (4.32 Tg) in 1990 to 34 % (4.39 Tg) in 2005 due to the growth in industrial emissions (Lei et al., 2011). However, more than half of BC (>50 %) and OC (>60 %) emissions are attributed to residential coal and BB in both China and India (Cao et al., 2006; Klimont et al., 2009; Lei et al., 2011).
Household solid-fuel combustion is a leading human health risk, especially for women and children, who tend to spend more time indoors than men (Anenberg et al., 2013). Estimates show that exposures to PM2.5 from domestic solid-fuel combustion caused 3.9 million premature deaths and a loss of healthy life years of ∼4.8 % (Smith et al., 2014). In addition, the emissions of carbonaceous aerosols from cookstoves can affect the Earth's radiative balance by absorbing and scattering incoming solar radiation (Lacey and Henze, 2015; Aunan et al., 2009). BC is the most efficient light absorber in the atmosphere, while the total aerosol absorption, including that from OC, is still highly uncertain (Yang et al.,2009; Park et al., 2010; Feng et al., 2013; Wang et al., 2014; Tuccella et al., 2020). Multiple field and laboratory studies have demonstrated that OC in both primary PM emissions (e.g., biomass and fossil fuel combustions) and secondary organic aerosol (SOA) feature a range of absorptivity in the near-ultraviolet (UV) and short-visible-wavelength regions (Nakayama et al., 2010; Forrister et al., 2015; Lin et al., 2015; De Haan et al., 2017; Xie et al., 2017a, b, 2018). The light-absorbing OC fraction is often referred to as “brown carbon” (BrC). Unlike open BB (e.g., forest, grassland, and cropland fires) – one of the most important primary sources for organic aerosols (Bond et al., 2004) – the light absorption of BrC from household cookstove emissions is rarely investigated. Sun et al. (2017) found that the BrC absorption from residential coal burning accounted for 26.5 % of the total aerosol absorption at 350–850 nm. BrC from wood combustion in cookstoves has a greater mass-specific absorption than that from open BB over the wavelength range of 300–550 nm (Xie et al., 2018). These results suggest that cookstove emissions may also be an important BrC source, which needs to be accounted for separately from open BB.
Organic molecular markers (OMMs) are commonly used in receptor-based source apportionment of carbonaceous aerosols (Jaeckels et al., 2007; Shrivastava et al., 2007; Xie et al., 2012). Polycyclic aromatic hydrocarbons (PAHs) and their derivatives are a group of OMMs with light absorption properties dependent on ring number or the degree of conjugation (Samburova et al., 2016). As discussed in Xie et al. (2019), PAHs are generated from a multitude of combustion processes (e.g., BB, fossil fuel combustion; Chen et al., 2005; Riddle et al., 2007; Samburova et al., 2016), and their ubiquitous nature makes them less than ideal OMMs for BrC source attribution. Because of the specific toxicological concern raised by PAHs – they are mutagenic and carcinogenic (International Agency for Research on Cancer, 2010) – source emission factors (EFs), ambient levels, and potential health effects of PAHs are investigated exhaustively (Ravindra et al., 2008; Kim et al., 2013). Similar to PAHs, N-containing aromatic compounds (NACs) are a group of BrC chromophores commonly detected in ambient PM and source emissions. Zhang et al. (2013) and Teich et al. (2017) calculated the absorption of individual NACs in aqueous extracts of ambient PM, the total of which explained ∼3 % of the bulk extract absorption at 365–370 nm. With the same approach, Xie et al. (2017a, 2019) found that the absorbance due to NACs in BB or secondary OC was 3–10 times higher than their mass contributions. Lin et al. (2016, 2017) estimated an absorbance contribution of 50 %–80 % from NACs in BB OC directly from their high-performance liquid chromatographer (HPLC)–photodiode array (PDA) signals, which are subject to considerable uncertainty due to the coelution of other BrC chromophores (e.g., PAHs and their derivatives). These results indicate that NACs are strong BrC chromophores, but the estimation of their contributions to BrC absorption depends largely on how well they are chemically characterized. Nitrophenols, methyl nitrophenols, nitrocatechols, and methyl nitrocatechols (including isomers) are typical atmospheric NACs (Claeys et al., 2012; Desyaterik et al., 2013; Zhang et al., 2013). These NACs can be generated from BB (Lin et al., 2016, 2017; Xie et al., 2019), fossil fuel combustion (Lu et al., 2019), and the reactions of aromatic volatile organic compounds (VOCs) with reactive nitrogen species (e.g., NOx; Xie et al., 2017a) and are not unique to specific sources (e.g., BB). By using an HPLC interfaced to a diode array detector (DAD) and quadrupole (Q) time-of-flight mass spectrometer (ToF-MS), Xie et al. (2019) found that BB NACs contain methoxy and cyanate groups. Nitronaphthol, nitrobenzenetriol, and methyl nitrobenzenetriol are characteristic NACs for NOx-based chamber reactions of naphthalene, benzene, and m-cresol, respectively (Xie et al., 2017a). Yet, few studies have investigated the composition of NACs from household cookstove emissions (Fleming et al., 2018; Lu et al., 2019).
The present study aims to characterize NACs in PM2.5 from burning red oak and charcoal in a variety of cookstoves and calculate their contributions to bulk OC absorption. The absorption of OC in solvent extracts of cookstove emissions was measured in our previous work (Xie et al., 2018). Presently, NACs are identified and quantified using an HPLC–DAD–Q-ToF-MS system described earlier. In addition, the NACs adsorbed on a backup quartz filter downstream of a polytetrafluoroethylene (PTFE) membrane filter are analyzed to evaluate the potential for sampling artifacts of PM2.5 NACs on the bare quartz filter in parallel. This work unveils BrC composition at a molecular level and increases the understanding of BrC chromophores and their sources. It also shows that further identification of large molecules (e.g., >500 Da) may better explain BrC absorption in the particle phase.
2.1 Cookstove emission sampling
The cookstove emission test facility, fuel–cookstove combinations, water-boiling test (WBT) protocol, and PM2.5 emission sampling were described previously in Jetter and Kariher (2009) and Jetter et al. (2012). Briefly, the cookstove emission tests were performed at the United States Environmental Protection Agency (US EPA) cookstove test facility in Research Triangle Park, NC, USA. Red oakwood and lump charcoal were burned in fuel-specific cookstoves under controlled conditions. Emission tests for each fuel–cookstove combination were performed in triplicate. The WBT protocol (version 4; Global Alliance for Clean Cookstoves, 2014) is designed to measure cookstove power, energy efficiency, and fuel use and contains cold-start (CS) high-power, hot-start (HS) high-power, and simmer (SIM) low-power phases. Both CS and HS phases are defined by the duration between the ignition and the water boils. The CS phase starts with the cookstove, pot, and water at ambient temperature; the HS immediately follows the CS with the cookstove hot but the pot and water at ambient temperature; and the SIM phase is defined by a 30 min time period with the cookstove hot and water temperature maintained at 3 ∘C below the boiling point. Low-moisture (∼10 %) oak and charcoal fuels were burned with five specifically designed cookstove types (Tables S1 and S2 in the Supplement); high-moisture (∼30 %) oak fuels were burned in one cookstove (Jiko Poa, BURN Manufacturing, Kenya). A brief description of each fuel-specific cookstove is given in the Supplement (Sect. S1). Gaseous pollutant (e.g., CO; methane, CH4) emissions were monitored continuously, and PM2.5 filter samples were collected during each test phase of the WBT protocol. The modified combustion efficiency (MCE), defined as on a molar basis, was calculated and discussed in Xie et al. (2018). A quartz-fiber filter (Qf) and a PTFE membrane filter positioned in parallel collected PM2.5 isokinetically at a flow rate of 16.7 L min−1. The adsorption artifact of Qf was evaluated using a quartz-fiber backup filter (Qb) installed downstream of the PTFE filter during PM2.5 sampling.
2.2 Chemical analysis
The OC and elemental-carbon (EC) emissions and UV–vis light absorption properties (BrC) of methanol-extracted cookstove particles were reported in Xie et al. (2018). Details for determinations of OC–EC concentrations and BrC absorption are provided in the Supplement (Sect. S2). Except the three-stone fire, EFs of OC and EC in the SIM phase were substantially lower than those in high-power phases (CS and HS), so the BrC absorption from red oak and charcoal burning was primarily measured for CS- and HS-phase samples in Xie et al. (2018). The SIM-phase samples were analyzed only for red oak burning in a three-stone fire. This test had comparable OC emissions between CS- and SIM-phase combustions, and CS and HS phases of the three-stone fire were typically similar and could not be separated (Xie et al., 2018). In the current work, the same emission samples were selected for the analysis of NACs, and the three SIM-phase samples from the three-stone fire were treated as HS-phase samples of other cookstove tests. Tables S1 and S2 summarized the measurement results of Qf and Qb, respectively, for each fuel–cookstove combination, including concentrations of carbon contents and light-absorbing properties of sample extracts. As the light absorption of BB BrC is expected to depend largely on burn conditions (Saleh et al., 2014; Pokhrel et al., 2016), the MCE and EC∕OC ratio, two indicators of burn conditions, are also given in Table S1.
The Qf and Qb sample extraction and subsequent analysis for NACs were conducted as described in Xie et al. (2019). In brief, an aliquot of each filter sample was prespiked with 250 ng nitrophenol-d4 (internal standard) and extracted ultrasonically twice for 15 min in 3–5 mL of methanol. After filtration (30 mm diameter × 0.2 µm pore size; PTFE filter, National Scientific Co. Ltd, TN, USA), the extract volume was reduced to ∼500 µL with rotary evaporation prior to HPLC–DAD–MS (Q-ToF) analysis. The NACs targeted in this work were chromatographed using an Agilent 1200 Series HPLC equipped with a Zorbax Eclipse Plus C18 column (2.1 mm×100 mm, 1.8 µm particle size; Agilent Technologies, CA, USA). The gradient separation was performed using water (eluent A) and methanol (eluent B) containing 0.2 % acetic acid (v∕v) with a total flow rate of 0.2 mL min−1. The eluent B fraction was held at 25 % for 3 min; increased to 100 % over the next 7 min, where it was held for 22 min; and then returned to 25 % over 5 min. An Agilent 6520 Q-ToF MS equipped with a multimode ion source operating in electrospray ionization (ESI) negative (−) mode was used to determine the chemical formula, molecular weight (MW), and quantity of each target compound. All sample extracts were analyzed in full-scan mode over 40–1000 Da. A mass accuracy of ±10 ppm was selected for compound identification and quantification. Samples with individual NACs exhibiting the highest MS signal intensities in full-scan mode were re-examined in targeted MS–MS mode using a collision-induced dissociation (CID) technique. The MS–MS spectra of target NACs [M-H]− ions were acquired to deduce structural information. Similar to bulk carbon and light absorption measurements, NACs were primarily determined for CS- and HS-phase samples with substantial OC loadings.
Due to the limited availability of authentic standards, many of the NACs identified in cookstove combustion samples were quantified using surrogate compounds with similar MW or structures. An internal standard method with a nine-point calibration curve (∼0.01–2 ng µL−1) was applied for quantification of concentrations. The compounds represented by each identified NAC formula were quantified individually and combined to calculate the mass ratio of total NACs to OC (µg m−3) ×100 % (tNACOC %). Presently, the ratio of organic matter (OM) to OC was not measured or estimated for cookstove combustion emissions, so tNACOC % could be up to 2 times greater than the contributions of NACs to OM (Reff et al., 2009; Turpin and Lim, 2001). Table S3 lists the chemical formulas, proposed structures, and standard assignments for the NACs identified here. The quality assurance and control (QA–QC) procedures for filter extraction and instrumental analysis were the same as Xie et al. (2017a, 2019). NACs were not detected in field blank and background samples. The average recoveries of NAC standards on prespiked blank filters ranged from 75.1 % to 116 %, and the method detection limit had a range of 0.70–17.6 pg.
2.3 Data analysis
In Xie et al. (2017a), the DAD measurement directly identified the chemical compounds in chamber SOA responsible for light absorption in the near-UV and visible-light ranges. However, no light absorption from individual NACs was detected in the DAD chromatograms from open BB (Xie et al., 2019) and cookstove emissions (this work). So the contributions of individual NACs to light absorption coefficient (Absλ; Mm−1) for each sample extract at 365 nm (Abs365,iNAC %) were calculated using the method described in Xie et al. (2017a, 2019):
where CiNAC is the mass concentration (ng m−3) of individual NACs, and MAC365,iNAC is the mass absorption coefficient (MACλ, m2 g−1) of individual NACs at 365 nm. Abs365 is the light absorption coefficient (Mm−1) of each sample extract at 365 nm and has been widely used to represent BrC absorption (Chen and Bond, 2010; Hecobian et al., 2010; Liu et al., 2013). Each NAC compound was assumed to absorb as a standard (Table S3); of these NAC compounds, the MAC365,iNAC value was obtained from Xie et al. (2017a, 2019) and listed in Table S4. In this work, Student's t test was used to determine if the means of two sets of data are significantly different from each other, and a p value less than 0.05 indicates significant difference.
Table 1Average concentrations of total NACs and tNACOC % in Qf and Qb samples by fuel type and WBT phase.
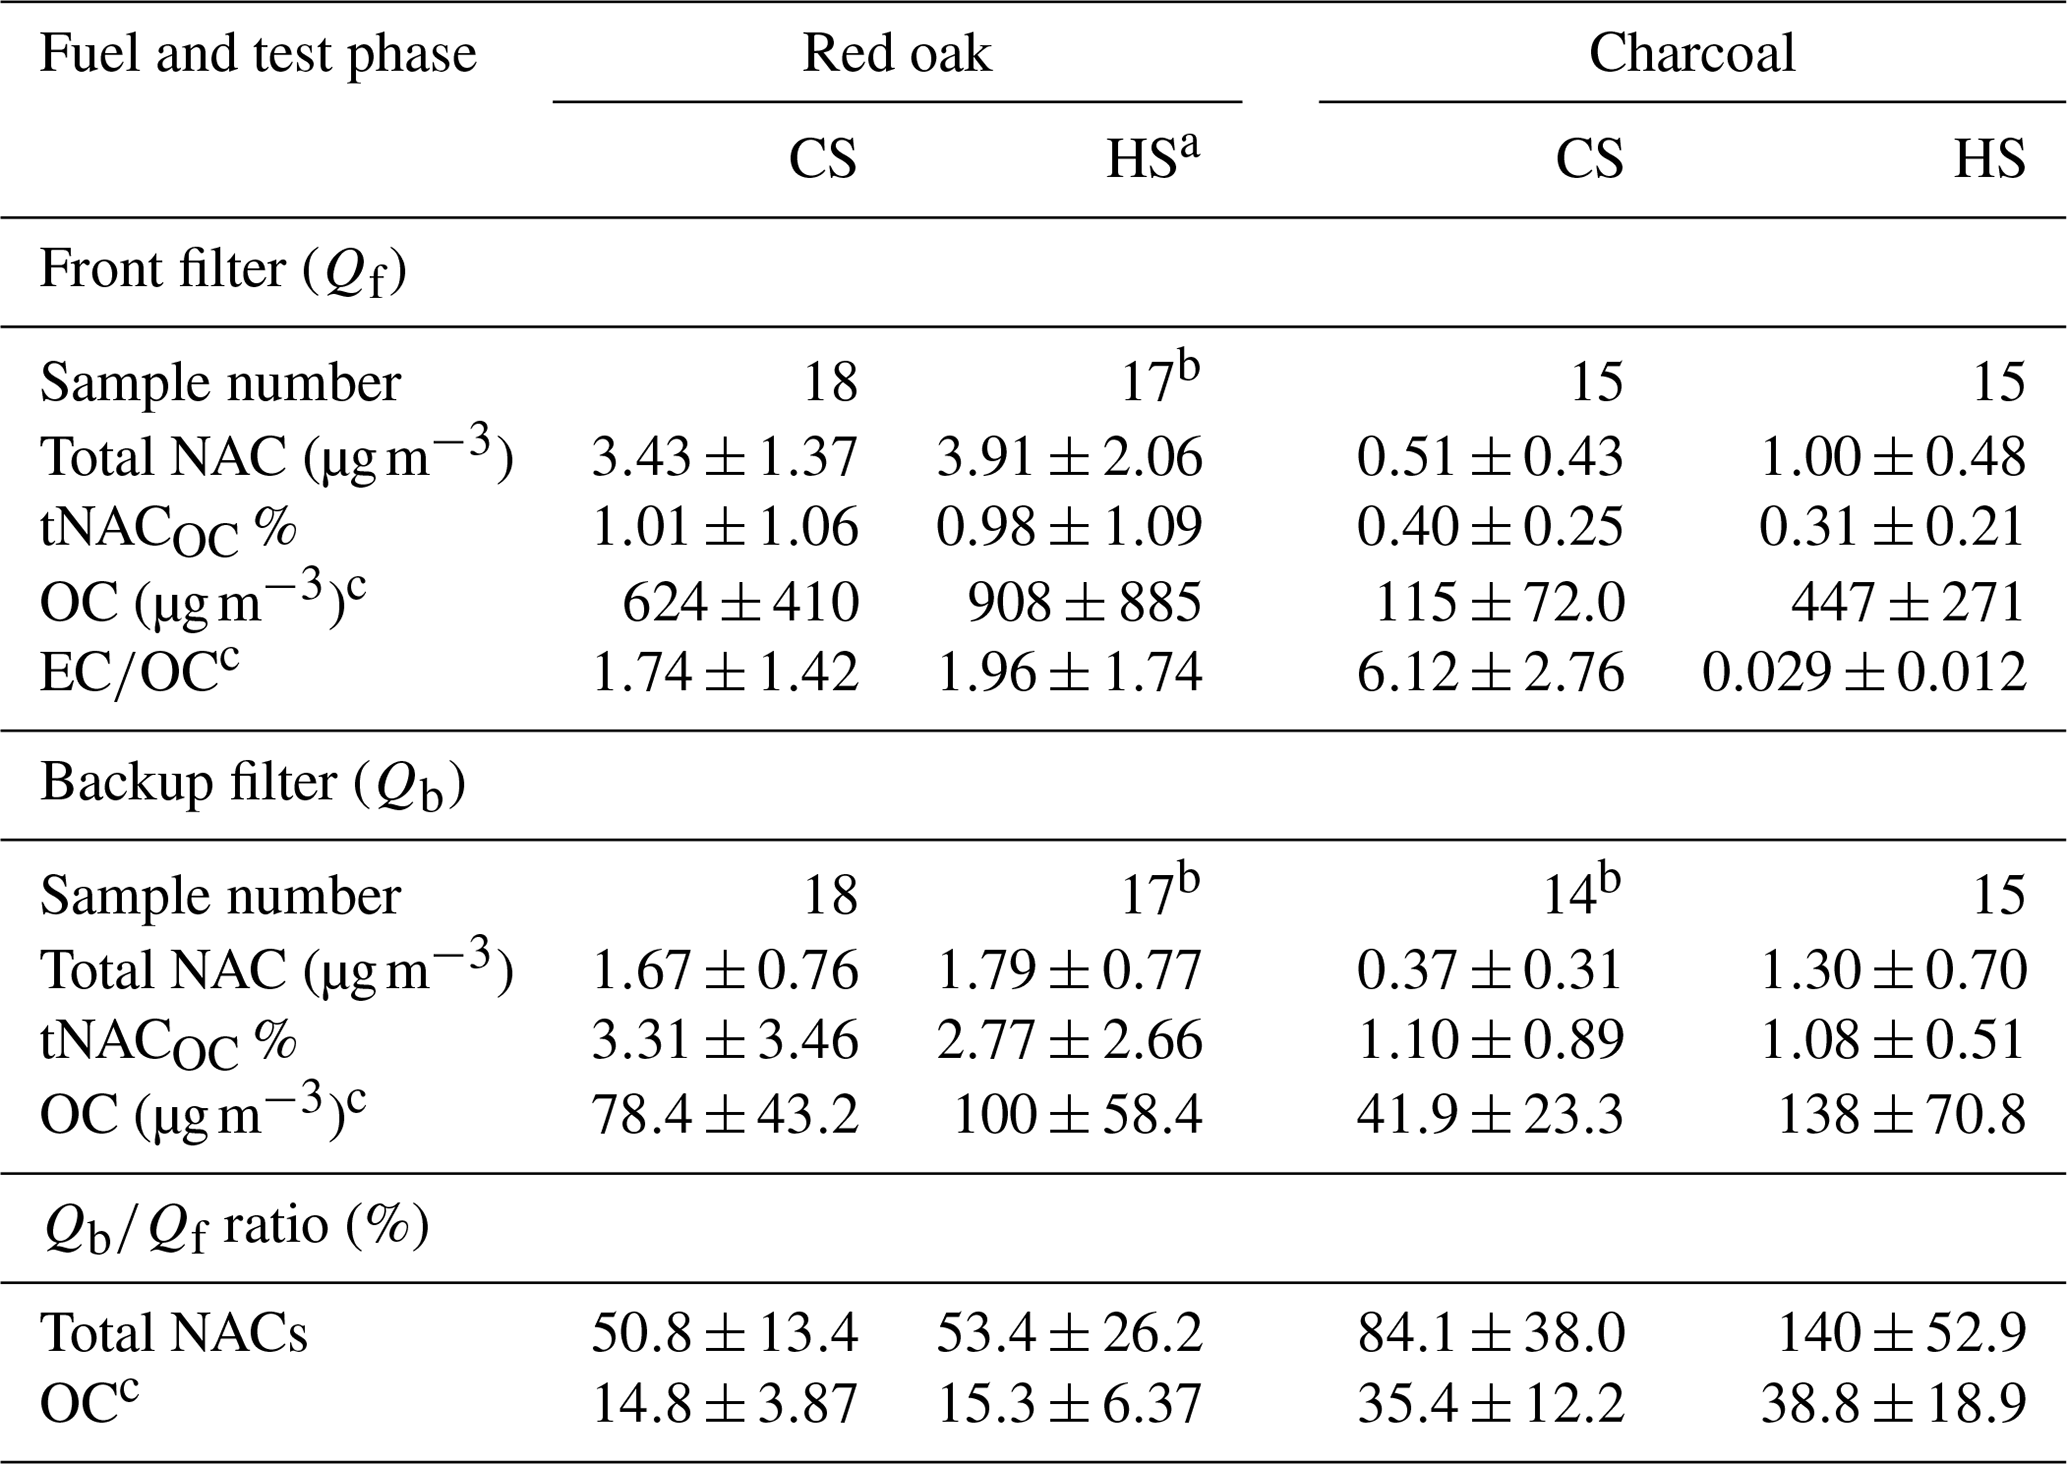
a Including three SIM-phase samples from the three-stone fire. b One filter sample was missed for analysis. c Data were obtained from Xie et al. (2018).
3.1 Summary of total NAC concentration from cookstove emissions
Table 1 summarizes the average concentrations of total NACs and average tNACOC % for Qf and Qb by fuel type and WBT phase. The EFs of total NACs shown in Table S5 were obtained by multiplying the EFs of OC and tNACOC %. Filter samples of emissions from burning red oakwood had significantly (p<0.05) higher average total NAC concentrations and tNACOC % than the charcoal-burning samples. Wood burning generates more volatile aromatic compounds (e.g., phenols, PAHs) than charcoal burning (Kim Oanh et al., 1999), and NACs can form when aromatic compounds and reactive nitrogen (e.g., NOx) are present during solid-fuel combustion (Lin et al., 2016, 2017). While burning red oak, emissions from the CS and HS phases show similar average NAC concentrations, tNACOC %, and NAC EFs (Tables 1 and S5). Additionally, burning low-moisture red oak in the Jiko Poa stove had higher tNACOC % than burning high-moisture red oak (Tables S6 and S7), but the difference was not significant (p>0.05). Thus, the NAC emissions from red oak burning are less likely influenced by the WBT phase, and the effect of fuel moisture content needs further investigation. For charcoal fuel samples, compared with the CS phase, the HS phase shows significantly higher (p<0.05) average NAC concentrations and EFs. This is likely due to the increase in OC with the HS phase (Tables 1 and S5) as the average tNACOC % values are much closer for the CS (0.40±0.25 %) and HS phases (0.31±0.21 %).
Several studies have placed a quartz-fiber filter behind a PTFE filter to evaluate the positive adsorption artifact – adsorption of gas-phase compounds onto particle filter media (“blow-on” effect; Peters et al., 2000; Subramanian et al., 2004; Watson et al., 2009; Xie et al., 2014). This method is expected to provide a consistent estimate irrespective of sampling time but may overcorrect the positive artifact by 16 %–20 % due to volatilization of OC off the upstream PTFE filter (negative artifact, “blow-off” effect; Subramanian et al., 2004). A denuder upstream of the filter for gas sampling was used to avoid positive artifacts in several studies (Ding et al., 2002; Ahrens et al., 2012). This approach can generate large negative artifacts by altering the gas-particle equilibrium after the denuder, and a denuder efficiency of 100 % might not be guaranteed (Kirchstetter et al., 2001; Subramanian et al., 2004). The present study is the first to consider sampling artifacts when measuring semivolatile NACs. This concept merits consideration as quantification of particle-phase NACs may be subject to large uncertainty. Table 1 shows that the average concentrations of total NACs on Qb (0.37±0.31–1.79±0.77 µg m−3) are greater than 50 % and 80 % for those on Qf (0.51±0.43–3.91±2.06 µg m−3) for red oak and charcoal burning, respectively. The average Qb-to-Qf ratio in percentage using OC concentrations is 2–3 times lower (14.8±3.87 %–38.8±18.9 %). Hence, the NACs identified in this work are present in the relatively volatile bulk OC fraction emitted from cookstoves, and the NACs in the Qf samples may also be present in the gas phase in the atmosphere. Charcoal-burning emissions show even higher (p<0.05) Qb-to-Qf total NAC mass ratios (CS: 84.1±38.0 %; HS: 140±52.9 %) than red oak burning (CS: 50.8±13.4 %; HS: 53.4±26.2 %), which is largely due to the higher OC loads on Qf from red oak burning. Xie et al. (2018) assumed previously that the Qb-adsorbed OC represented the positive sampling artifact only and adjusted the light-absorbing properties of OC on Qf by subtracting Abs365 and OC of Qb samples directly. In this study, the high Qb-to-Qf ratios of total NACs indicate that the volatilization of NACs from the upstream PTFE filter cannot be neglected, but the relative contributions of positive and negative artifacts to Qb measurements are unknown. Therefore, the measurement results of NACs in Qf and Qb samples were provided separately, and no correction was conducted for Qf measurements in this work. Since the gaseous NACs adsorbed in Qb samples depends on Qf loadings, tNACOC % and total NAC concentrations in each Qf–Qb pair from matching tests are significantly correlated (p<0.05; Fig. S1a, b, d, and e in the Supplement).
Along with modified combustion efficiency (MCE), the EC∕OC and BC∕OA (organic aerosol) ratios were used previously as indicators of biomass-burning conditions (McMeeking et al., 2014; Pokhrel et al., 2016). Here the burn condition indicates general flame intensity or combustion temperature (Chen and Bond, 2010; Saleh et al., 2014) and is parameterized to investigate combustion processes (e.g., pyrolysis). The MCE and the EC∕OC and BC∕OA ratios are key to understanding particulate OC absorptivity (Saleh et al., 2014; Lu et al., 2015) and NAC formation from open BB (Xie et al., 2019). Presently, the relationships of tNACOC % versus EC∕OC for Qf samples are shown in Fig. S1c and f by fuel type. Because no significant difference was observed for average total NAC concentrations, tNACOC %, and EC∕OC ratios when testing CS versus HS phases during red oak fuel burning, the CS and HS phases were pooled for a regression analysis. The tNACOC % values of Qf samples positively correlate (r=0.83, p<0.05) with EC∕OC for red oak burning (Fig. S1c), as observed in Xie et al. (2019) for open BB, which suggests that burn conditions influence NAC formation during BB. Note that the NAC concentrations on Qf were possibly adsorbed while in a gaseous state, while EC is particle-phase.
In Table S1, the MCE values of charcoal burning indicate that the HS phase is more smoldering than the CS phase. However, the average tNACOC % values showed no significant difference (p=0.29) between HS and CS phases. Like MAC365 and Åabs in Qf samples for charcoal burning (Xie et al., 2018), tNACOC % derived from the same samples did not correlate with EC∕OC ratios in this work (Fig. S1f). Xie et al. (2018) found that the HS phase for charcoal burning had average OC EFs 5–10 times higher than the CS phase, while the EC EFs decreased by more than 90 % from the CS to HS phase. Furthermore, no correlation has been observed between MCE and EC∕OC for charcoal burning in the HS phase. So, the EC∕OC for charcoal burning tends to depend more on the initial temperature in the cookstove than MCE variations and cannot be used to predict burn conditions, BrC absorption, or NAC formation.
3.2 Composition of NACs in Qf and Qb
During solid-fuel combustion, NACs may form from aromatic compounds (e.g., substituted phenols) and reactive nitrogen species (e.g., NH3, NOx, and HONO) in both the gas and particle phases (Harrison et al., 2005; Kwamena and Abbatt, 2008; Lu et al., 2011; Lin et al., 2016, 2017). Aromatic hydrocarbons are produced during fuel pyrolysis (Simoneit et al., 1993; Simoneit, 2002; Kaal et al., 2009). Oxidation of fuel-derived nitrogen rather than molecular nitrogen in air is the major formation pathway of reactive nitrogen species (Glarborg et al., 2003).
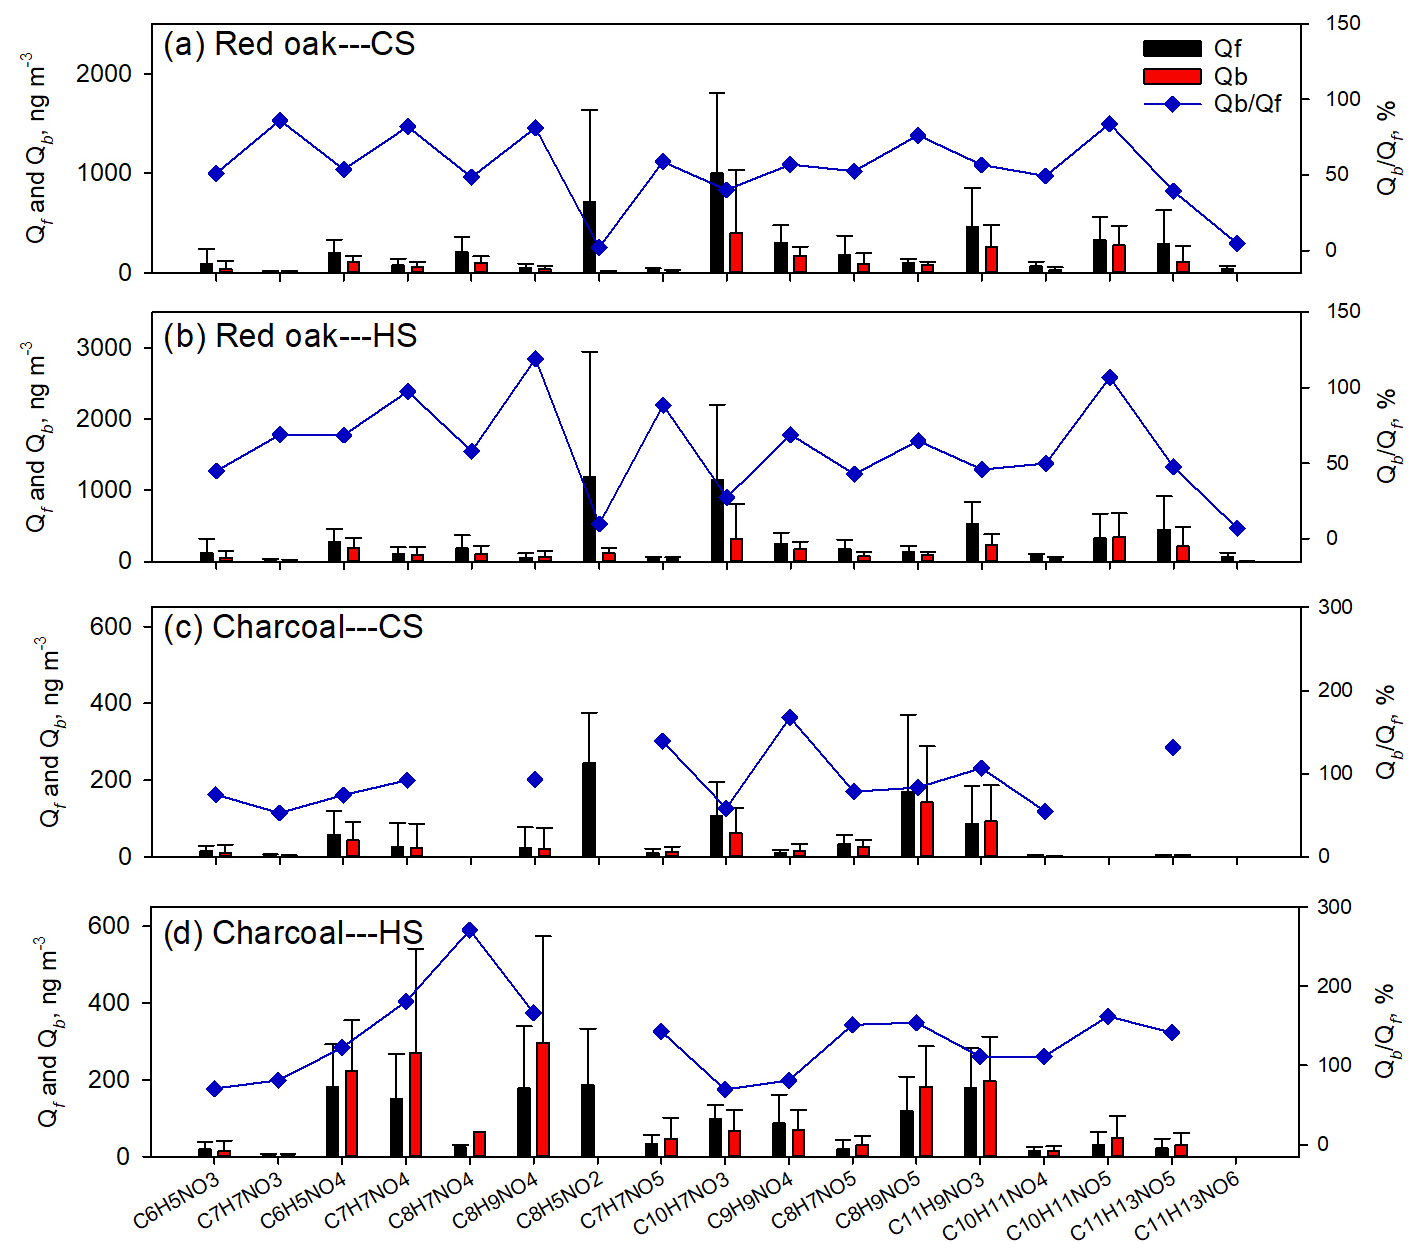
Figure 1Average concentrations of individual NACs in Qf and Qb samples for (a) red oak burning in the CS phase, (b) red oak burning in the HS phase, (c) charcoal burning in the CS phase, and (d) charcoal burning in the HS phase. The blue scatters in each plot are Qb-to-Qf mass ratios of individual NACs ×100 %.
Presently, 17 chemical formulas were identified as NACs in cookstove emissions, several of which are widely observed in ambient air and open BB particles (e.g., C6H5NO3, C6H5NO4; Claeys et al., 2012; Zhang et al., 2013; Lin et al., 2016, 2017; Xie et al., 2019). Figure 1 shows the average concentrations (ng m−3) of individual NACs in Qf and Qb samples by fuel type and WBT phase. The corresponding average mass ratios of individual NACs to OC×100 % (iNACOC %) are exhibited in Fig. S2. Details of the NAC composition expressed in iNACOC % for each fuel–cookstove experiment are given in Tables S6–S9.
Generally, the CS and HS phases have consistent NAC profiles for red oak combustion (Figs. 1a, b and S2a, b). C10H7NO3 (CS-Qf: 1003±803 ng m−3; HS-Qf: 1149±1053 ng m−3) and C8H5NO2 (CS-Qf: 712±921 ng m−3; HS-Qf: 1185±1761 ng m−3) have the highest average concentrations on Qf, followed by C11H9NO3, C10H11NO5, and C11H13NO5. However, C8H5NO2 was only detected in emission samples of Jiko Poa among the five wood stoves (Tables S6 and S7). Not considering C8H5NO2, Qb samples of red oak combustion emissions have similar NAC profiles and characteristic species (e.g., C10H7NO3, C11H9NO3) as Qf samples, and the Qb-to-Qf mass ratios of individual NACs are similar between the CS and HS phases (Fig. 1a, b). It appears that the formation of NACs from red oak burning in cookstoves depends largely on burn conditions reflected by EC∕OC ratios (Fig. S1c) rather than WBT phases. Among the 17 identified NACs from red oak burning, C8H5NO2 and C11H13NO6 have the lowest Qb-to-Qf ratios (2.03 %–9.80 %; Fig. 1a, b), indicating their low volatility. The low volatility of C11H13NO6 might be due to its relatively high MW, while C8H5NO2 has the second-lowest MW, and its structure likely contains functional groups that decrease vapor pressure (e.g., carboxyl group; Donahue et al., 2011).
Charcoal burning generated high abundances of C8H9NO5, C11H9NO3, and C10H7NO3 for both CS (86.6±98.7–170±200 ng m−3) and HS (97.1±38.5–178±104 ng m−3) phases (Figs. 1c, d and S2c, d). Only one of the five charcoal stoves (Éclair, GIZ, Bonn, Germany) emitted C8H5NO2, which was not detected on Qb for charcoal combustions (Tables S8 and S9). Average concentrations of C8H9NO5, C11H9NO3, and C10H7NO3 in the Qb (62.0±64.9–198±115 ng m−3) and Qf samples were comparable. However, the iNACOC % values of these compounds are 1.45±0.68–5.16±2.84 times higher in Qb (0.11±0.18 %–0.46±0.69 %) than in Qf samples (0.052±0.067 %–0.14±0.15 %). High levels of C6H5NO4, C7H7NO4, and C8H9NO4 were also observed in the HS phase for charcoal burning (Fig. 1d). These compounds in Qb samples had average concentrations (222±132–297±277 ng m−3) 22.6 %–80.8 % higher than in Qf samples (150±118–181±111 ng m−3). As such, the charcoal HS phase generates more low-MW NACs (e.g., C6H5NO4, C7H7NO4) than the CS phase, and the initial temperature in the cookstove has an impact on NAC formation from charcoal burning.
As mentioned in Sect. 3.1, using a Qb has been widely applied to evaluate the positive sampling artifact for OC and semivolatile organic compounds. This method might only work for bulk PM, OC, and organic compounds with low volatility, of which the concentrations in Qb samples are much lower than Qf samples and usually presumed to be due to positive adsorption artifacts only (Subramanian et al., 2004; Watson et al., 2009). In this work, the average Qb-to-Qf mass ratios of the 17 individual NACs ranged from 50.8±13.4 % to 140±52.9 %, comparable to n-alkanes with carbon number ≤21 (e.g., henicosane: 26.3 %–163 %) and PAHs with benzene ring number ≤4 (e.g., fluoranthene: 46.3 %–134 %) in the ambient of urban Denver (Xie et al., 2014). Xie et al. (2014) found that the gas-phase concentrations of n-alkanes and PAHs with vapor pressure greater than henicosane and fluoranthene were comparable to or higher than their particle-phase concentrations. The vapor pressure of five NAC standards at 25 ∘C () was predicted using the US EPA Toxicity Estimation Software Tool (TEST) and listed in Table S10. Their values are mostly higher than henicosane and fluoranthene ( atm; Xie et al., 2013, 2014). Then the identified NACs in this study may have substantial fractions remaining in the gas phase. As the evaporation of NACs from the upstream filter (negative artifact) is unknown, the particle-phase NAC concentrations cannot be calculated by simply subtracting Qb measurements from those of Qf. Considering that most of the Qf and Qb samples were collected near ambient temperature (Table S2; ∼25 ∘C), the composition of NACs derived from Qf measurements alone can be biased due to the lack of gas-phase measurements. Future work is needed to evaluate the composition of NACs from emission sources in both the particle and gas phases.
3.3 Identification of NAC structures
Figures S3 and S4 exhibited extracted ion chromatograms (EICs) and MS–MS spectra of the 17 identified NACs. For comparison, the MS–MS spectra of standard compounds used in this work are obtained from Xie et al. (2017a, 2019) and shown in Fig. S5. Among all identified NAC formulas, C10H7NO3 was detected in each fuel–cookstove experiment (Tables S6–S9) and showed the highest concentrations in emissions from burning red oak (Fig. 1a, b). The MS–MS spectrum of C10H7NO3 (Fig. S4l) is like 2-nitro-1-phenol (Fig. S5g) but shows a ∼1 min difference in retention time (Fig. S3i; 10.9 min, 2-nitro-1-phenol 11.8 min). C10H7NO3 is presumed to be an isomer of 2-nitro-1-phenol with a nitronaphthol structure. C11H9NO3 has a degree of unsaturation and a fragmentation pattern (Fig. S4q) like C10H7NO3 and is likely a structural isomer of methyl nitronaphthol. C6H5NO3, C7H7NO3, C6H5NO4, and C7H7NO4 are commonly detected in combustion emissions (Lin et al., 2016, 2017; Xie et al., 2019) and atmospheric particles (Claeys et al., 2012; Zhang et al., 2013). C6H5NO3 and C6H5NO4 are identified as 4-nitrophenol and 4-nitrocatechol using authentic standards (Figs. S4a, d and S5a, c). C7H7NO3 has two isomers (Fig. S3b), and the compound eluting at 9.98 min has the same retention time and MS–MS spectrum (Fig. S4c) as 2-methyl-4-nitrophenol (Fig. S5b). In ambient PM and chamber SOA, C7H7NO4 was identified using standard compounds as a series of methyl-nitrocatechol isomers (4-methyl-5-nitrocatechol, 3-methyl-5-nitrocatechol, and 3-methyl-6-nitrocatechol; Iinuma et al., 2010). According to the HPLC–Q-ToF-MS data for C7H7NO4 identified in Iinuma et al. (2010) and our previous studies (Xie et al., 2017a, 2019), the two C7H7NO4 isomers in Fig. S3d are likely 4-methyl-5-nitrocatechol and 3-methyl-6-nitrocatechol, respectively. Here we cannot rule out the presence of 3-methyl-5-nitrocatechol, which may coelute with 4-methyl-5-nitrocatechol (Iinuma et al., 2010). In Fig. S4k, o, and p, the MS–MS spectra of C7H7NO5, C8H7NO5, and C8H9NO5 all show a loss of . The loss of CH3 is typically due to a methoxy group in NAC molecules, and NO (or NO2) and CO loss is commonly observed for NACs with more than one phenoxy group (Xie et al., 2019). So methoxy nitrophenol is the proposed skeleton for C7H7NO5, C8H7NO5, and C8H9NO5. Other functional groups were estimated using their chemical formulas and degree of unsaturation as a basis (Table S3).
The present study quantifies C8H7NO4 and C9H9NO4 using 2-methyl-5-benzoic acid (C8H7NO4) and 2,5-dimethyl-4-nitrobenzoic acid (C9H9NO4), respectively. The fragmentation patterns of C8H7NO4 (Fig. S4g, h) and C9H9NO4 compounds (Fig. S4m, n) are different from their corresponding surrogates (Fig. S5f, h), and loss of CO2 is not observed, so C8H7NO4 and C9H9NO4 compound structures do not include a carboxyl group. The MS–MS spectra of C8H7NO4 eluting at 8.14 min (Fig. S3e) and C9H9NO4 eluting at 9.22 min (Fig. S3j) indicate the loss of an OCN benzisoxazole structure or the presence of cyanate (−O−C≡N) or isocyanate (−O=C=N) groups. Mass spectra of selected standard compounds (Fig. S5i–n) in our previous work (Xie et al., 2019) show that the loss of an OCN group only happens during the fragmentation of phenyl cyanate. Thus, the C8H7NO4 and C9H9NO4 isomers containing OCN indicate a phenyl cyanate feature. However, the fragmentation mechanism related to the loss of a single nitrogen for the second C8H7NO4 isomer (Figs. S3e and S4h) is unknown and requires further study. The MS–MS spectrum of the second C9H9NO4 isomer had dominant ions at m∕z 194 ([M–H]−), 164 (loss of NO), and 149 (loss of NO+CH3). Compared with the MS–MS spectra of 4-nitrophenol and 2-methyl-4-nitrophenol (Fig. S5a, b), the second C9H9NO4 isomer is likely a methoxy nitrophenol with an extra ethyl group.
The EIC signal of C8H9NO4 in Fig. S3f comprises at least 3–4 isomers, and the MS–MS spectra are always dominated by ions at m∕z 182 ([M–H]−), 152 (loss of NO), and 137 (loss of NO+CH3), with some changes in relative abundance. The fragmentation mechanism of C8H9NO4 represented by the MS–MS spectrum in Fig. S4i is consistent with that of the second C9H9NO4 isomer (Fig. S4n), so the C8H9NO4 might also have a methoxy nitrophenol skeleton. The MS–MS spectrum of C8H5NO2 is characterized by CO2 loss (Fig. S4j), indicative of a carboxyl group. Considering the degree of unsaturation of the C8H5NO2 molecule and the cyano group feature in BB tracers (e.g., hydrogen cyanide, benzonitrile; Schneider et al., 1997; Li et al., 2000; Gilman et al., 2015), C8H5NO2 was identified as 4-cyanobenzoic acid using an authentic standard (Fig. S5o). The C10H11NO4, C10H11NO5, C11H13NO5, and C11H13NO6 detected here are also observed in other BB experiments (Xie et al., 2019). Their MS–MS spectra are characterized by the loss of at least one CH3 and/or OCN (Fig. S4r–u), suggestive of methoxy or cyanate groups. Without authentic standards, fragmentation patterns (Fig. S4r–u) were used to determine the molecular structures of C10H11NO4, C10H11NO5, C11H13NO5, and C11H13NO6 (Table S3).
Nearly all NAC formulas identified in this work were observed previously (Lin et al., 2016, 2017; Xie et al., 2017a; Fleming et al., 2018; Xie et al., 2019). Few studies attempt to retrieve structural information for NACs using MS–MS spectra of authentic standards. Although multiple NACs may be generated from BB and photo-oxidation of aromatics in the presence of NOx, NAC structures may differ across emission sources. Xie et al. (2019) found that fragmentation patterns of C7H7NO5 and C8H9NO5 from BB and photochemical reactions are distinct, and the methoxy and cyanate groups are featured only in BB NACs. Thus, knowing the NAC structure is useful to emission source identification. In this work, the chemical and structural information obtained for NACs sampled during red oak and charcoal burning is similar, presumably because the charcoal fuel used is produced by the slow pyrolysis of wood. However, NACs in red-oak- and charcoal-burning emissions can be differentiated compositionally. As shown in Figs. 1 and S2, the NAC emissions from red oak burning in cookstoves are characterized by C10H7NO3 and C11H9NO3. In addition to these two species, charcoal burning in cookstoves also generates high fractions of C8H9NO5 (Fig. S2c, d). This difference among NACs may help with source apportionment using receptor models, which are commonly used and assume that the ambient pollutants measured in the field are linear combinations from a number of time-variant sources or factors. (Jaeckels et al., 2007; Shrivastava et al., 2007; Xie et al., 2013).
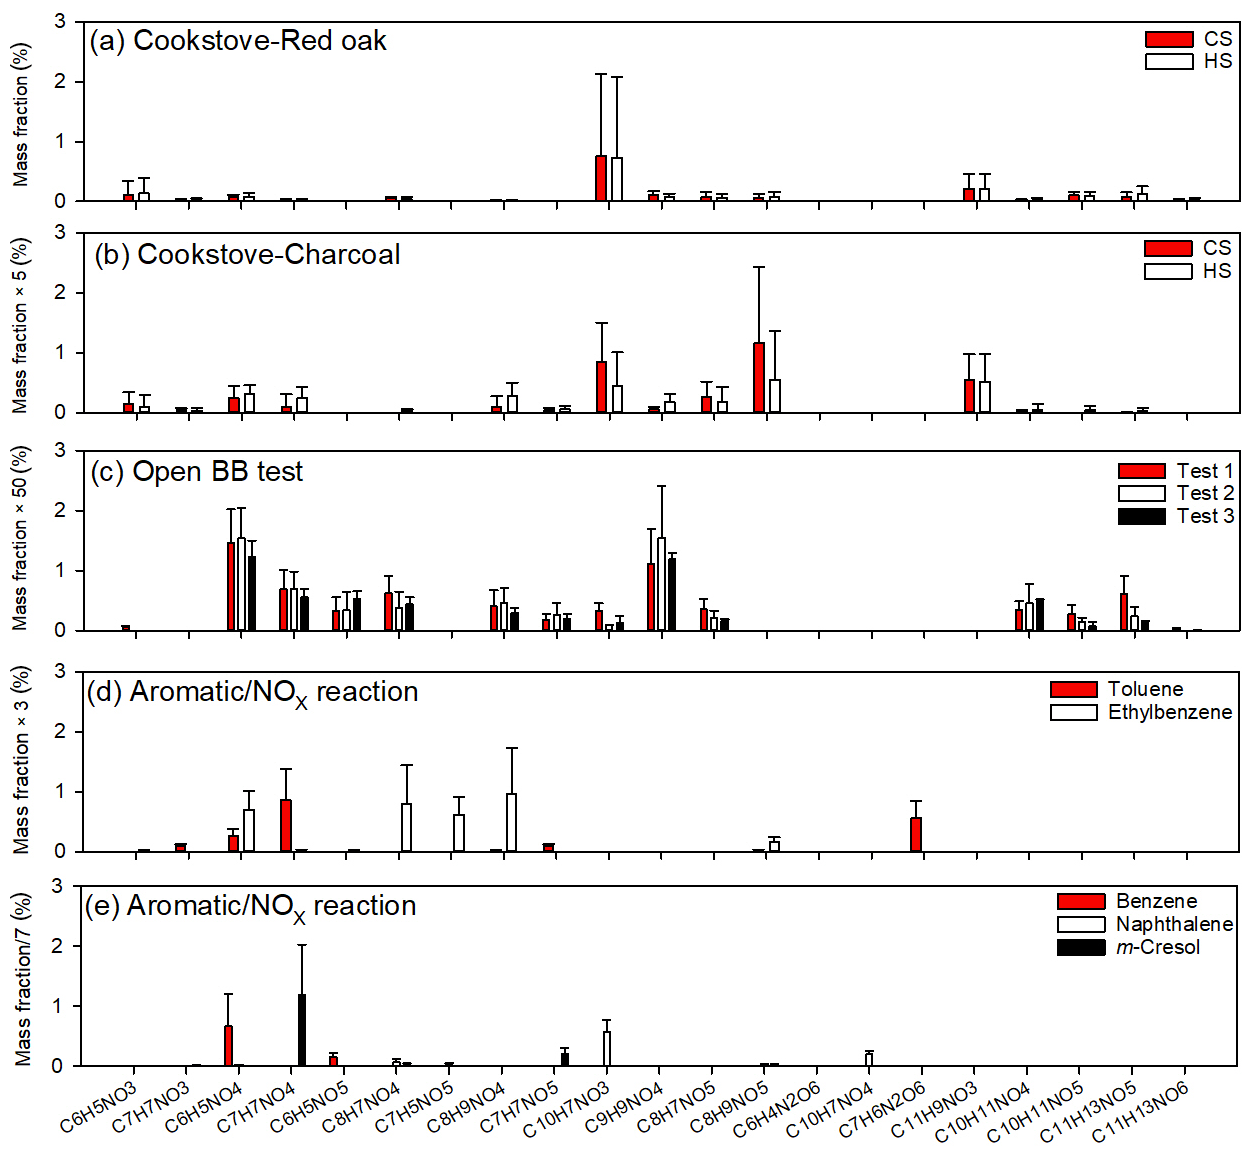
Figure 2Average mass ratios (%) of individual NACs to organic matter from (a) red oak burning in cookstoves; (b) charcoal burning in cookstoves; (c) open BB experiments (Xie et al., 2019); and photochemical reactions of (d) toluene and ethylbenzene and (e) benzene, naphthalene, and m-cresol with NOx (Xie et al., 2017a).
Figure 2 compares NAC composition from cookstove emissions (not including C8H5NO2), open BB (Xie et al., 2019), and SOA chamber experiments (Xie et al., 2017a). Since previous source emission studies ignored Qb measurements and normalized individual NAC contributions to OM, only Qf measurements in this work are compared (Fig. 2a, b) with their iNACOC % values multiplied by 1.7 (proposed OM∕OC ratio; Reff et al., 2009). The three open BB tests (Fig. 2c) were conducted with two fuel types under different ambient temperatures (10–29 ∘C) and relative humidity (49 %–83 %; Xie et al., 2019). But they consistently emit C6H5NO4, C7H7NO4, and C9H9NO4, which is compositionally distinct from cookstove emissions (Fig. 2a, b). Moreover, the average mass contribution of total NACs to OM for open BB (0.12±0.051 %) was 4–14 times lower than that for cookstove emissions. This result is likely due to the high-temperature flaming combustion produced in the cookstoves (Shen et al., 2012; Xie et al., 2018). In Fig. 2d and e, the NAC profiles for photochemical reactions appear to have aromatic precursors. When using field measurement data of NACs for receptor modeling, the resulting factors can be linked with specific emission sources by comparing with the NAC patterns shown in Fig. 2. Further studies are also warranted to unveil NAC patterns of other potential sources (e.g., motor vehicle emissions). Therefore, the source of NACs can be identified by combining their characteristic structures and composition. The filter-based NACs reported for the experiments shown in Fig. 2 were all measured using an identical method and HPLC–Q-ToF-MS instrument, reducing any potential methodological bias. However, total gas-phase NAC concentrations need to be properly sampled and measured to account for the impact of gas-to-particle partitioning on their distribution.
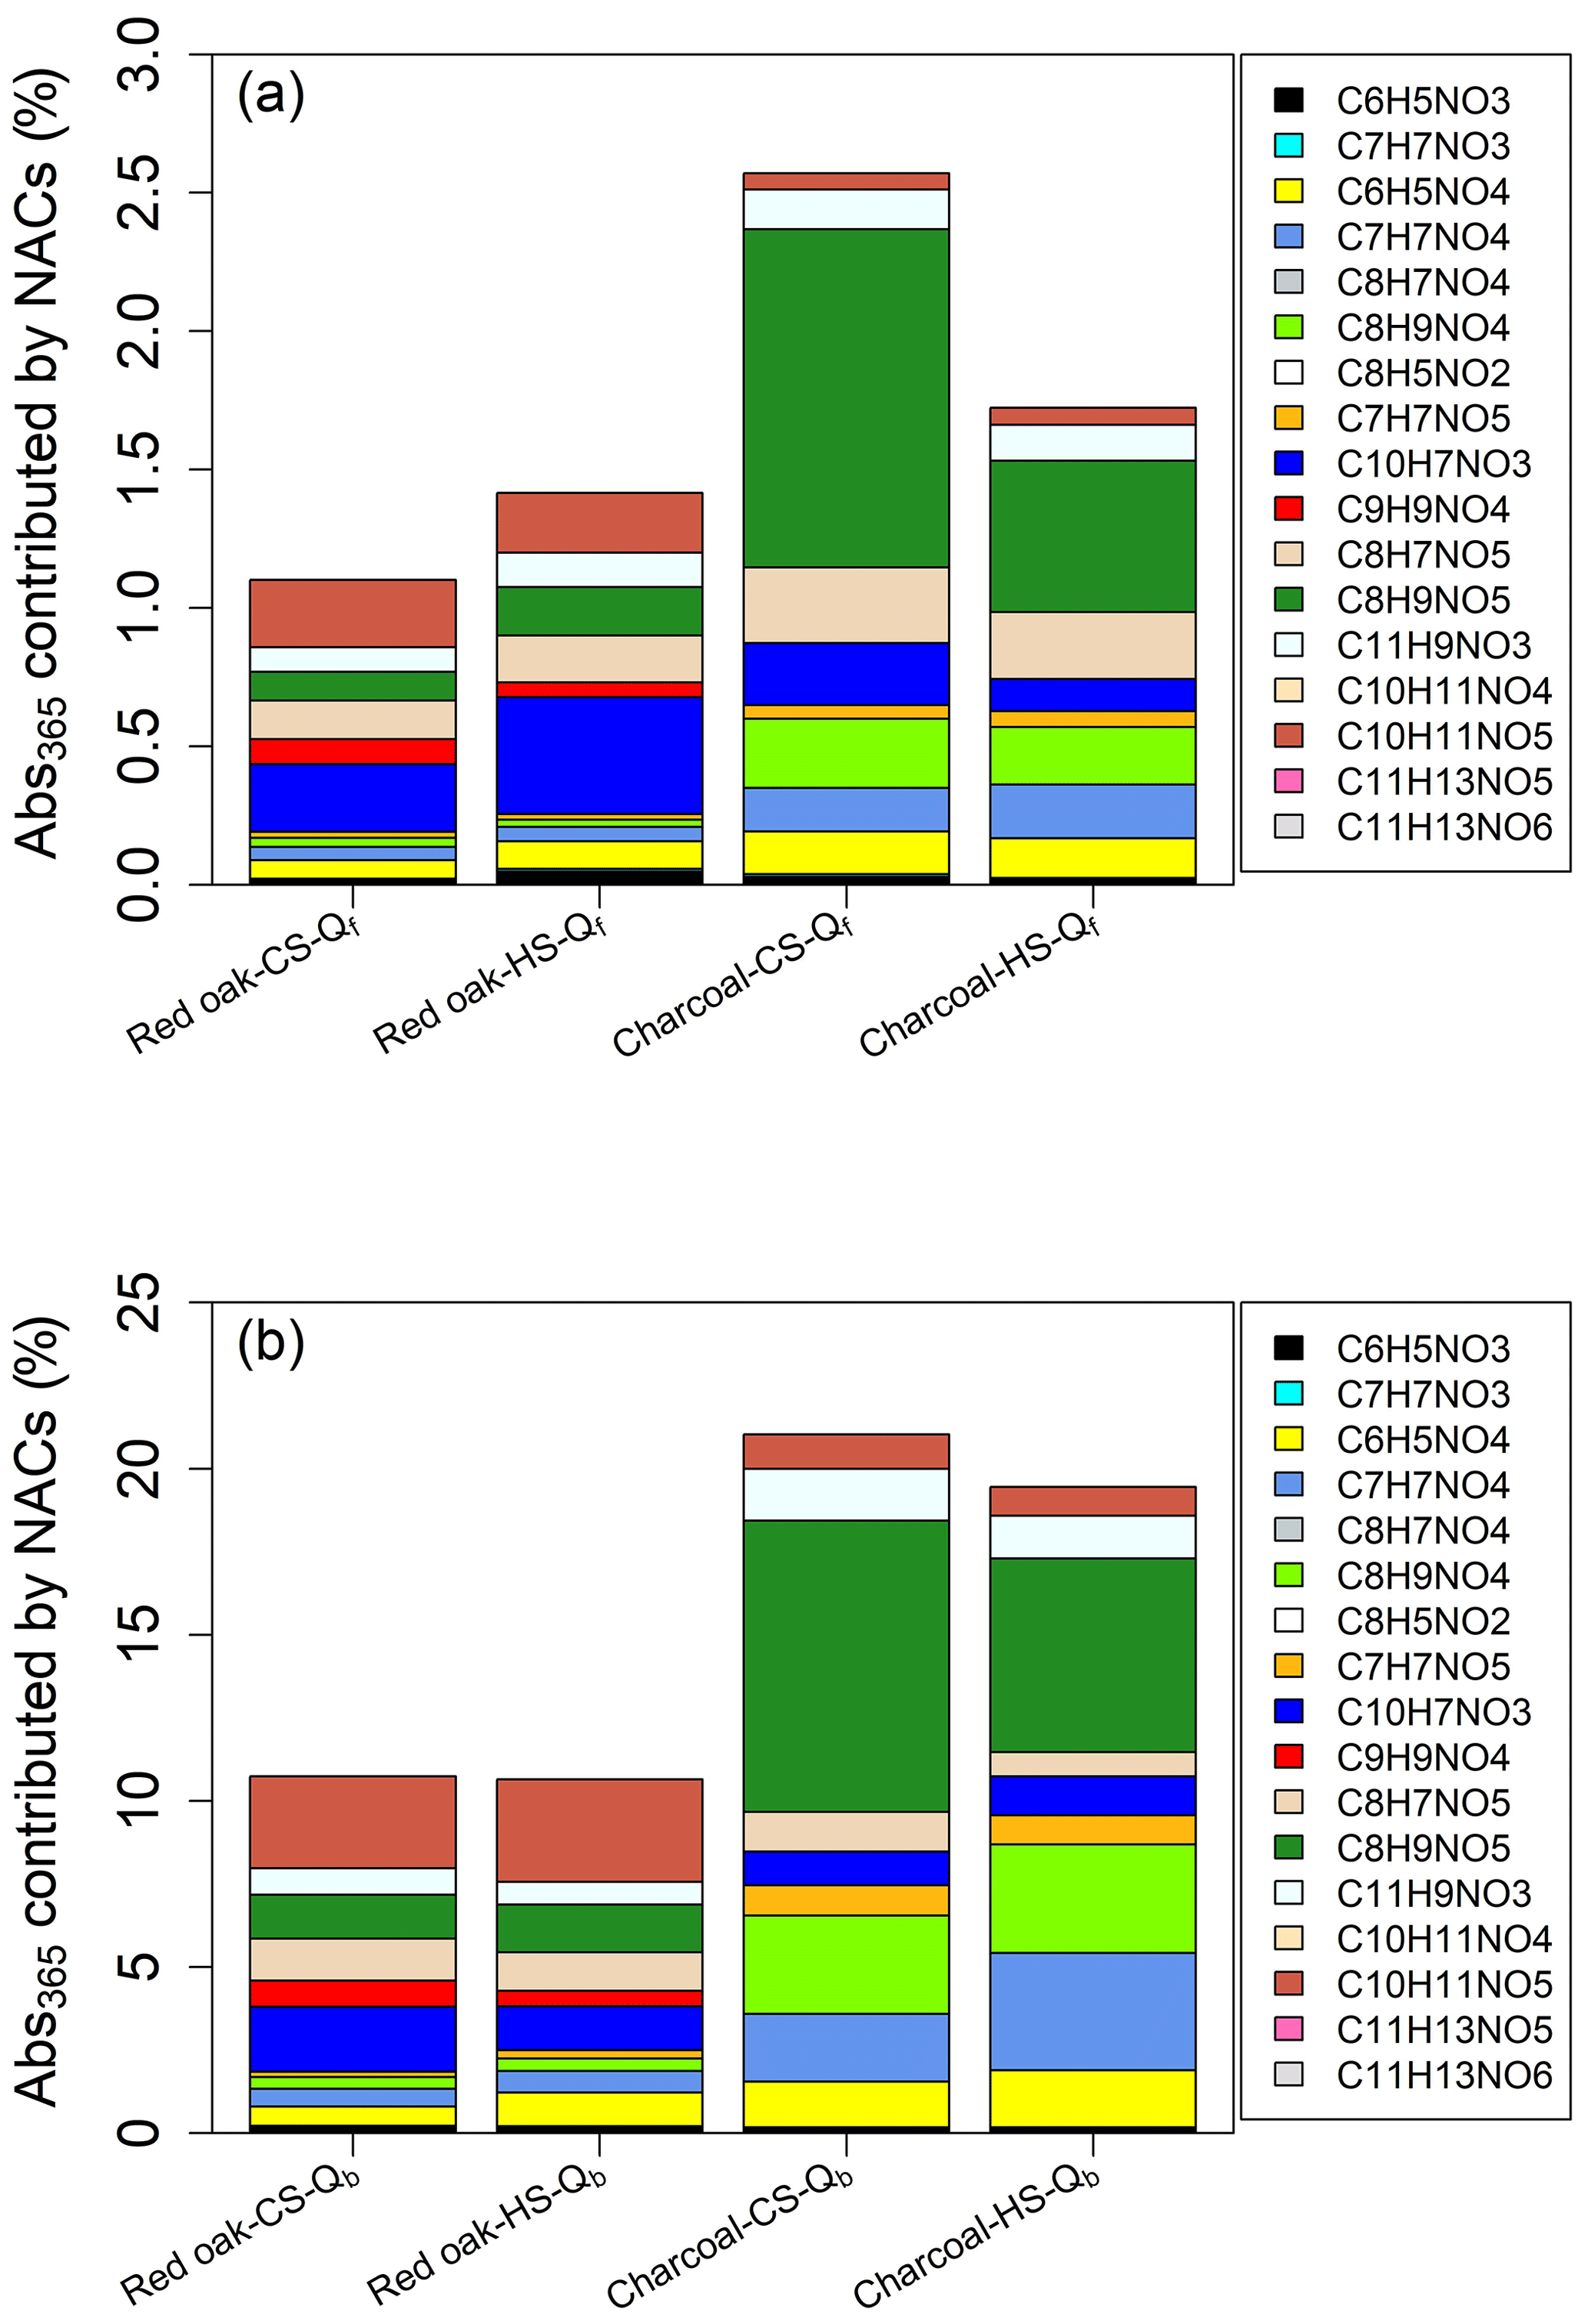
Figure 3Average contributions (%) of individual NACs to Abs365 of bulk (a) Qf and (b) Qb extracts from burning red oak and charcoal in cookstoves in CS and HS phases.
3.4 Contributions of NACs to Abs365
The average Abs365,iNAC % values of Qf and Qb samples are presented by fuel type and WBT phase in the Fig. 3 stack plots, and experimental data for each fuel–cookstove experiment are provided in Tables S11–S14. The average contributions of total NACs to Abs365 (Abs365,tNAC %) of the sample extracts (Qf: 1.10 %–2.57 %; Qb: 10.7 %–21.0 %) are up to 10 times greater than their average tNACOC % (Qf: 0.31 %–1.01 %; Qb: 1.08 %–3.31 %; Table 1). Considering that some NACs are not light-absorbing (Table S4), and the OM∕OC ratio is typically greater than unity, most NACs that contribute to Abs365 are strong BrC chromophores. Like the mass composition of NACs (Fig. 1), C10H7NO3 (CS: 0.24 %; HS: 0.43 %) and C8H9NO5 (CS: 1.22 %; HS: 0.55 %) were the major contributors to Abs365 for the Qf samples collected during red oak and charcoal burning, respectively (Fig. 3a). The average Abs365,tNAC % values of Qb samples are 7.53 to 11.3 times higher than those of Qf samples. Unlike the Qf samples from red oak burning, C10H11NO5 (CS: 2.77 %; HS: 3.09 %) has the highest average contribution to Abs365 for Qb samples, followed by C10H7NO3 (CS: 1.96 %; HS: 1.32 %) and C8H9NO5 (CS: 1.32 %; HS: 1.44 %). C8H9NO5 dominated the contribution (CS: 8.78 %; HS: 5.82 %) to Abs365 for the Qb samples from charcoal burning (Fig. 3b). All identified NACs explained 1.10 %–2.58 % (Fig. S3) of Qf extract absorption. Even if the NACs on Qb were totally derived from upstream filter evaporation, the adjusted average contributions of total NACs (Qf+Qb) to Abs365 of Qf extracts were still lower than 5 % (1.59 %–4.01 %). Due to the lack of authentic standards, the quantification of NAC concentrations and their contributions to Abs365 of Qf extracts might be subject to uncertainties. However, growing evidence has shown that BrC absorption was majorly contributed by large molecules with an MW>500–1000 Da (Di Lorenzo and Young, 2016; Di Lorenzo et al., 2017). Large molecules of NACs may be generated from flaming combustions in cookstoves, and their structures and light absorption are worth future investigations. In previous studies on ambient and biomass-burning particles, most identified NACs had an MW lower than 300–500 Da, and their total contributions to bulk BrC absorption were estimated to be less than 10 % (Mohr et al., 2013; Zhang et al., 2013; Teich et al., 2017; Xie et al., 2019). Similar results were also obtained in the current work. Therefore, further studies are needed to identify large BrC molecules (including high-MW NACs) in ambient and source particles.
This study investigated the composition, chemical formulas, and structures of NACs in PM2.5 emitted from burning red oak and charcoal in a variety of cookstoves. Total NAC mass and compositional differences between Qf and Qb samples suggest that the identified NACs might have substantial gas-phase concentrations. By comparing the MS–MS spectra of identified NACs to standard compound spectra, the structures of NACs featuring methoxy and cyanate groups in cookstove emissions are confirmed. The source identification of NACs would be less ambiguous if both the structures and composition of NACs are known as different emission sources have distinct NAC characteristics. However, the compositional information of NACs based on Qf measurements only is biased due to the lack of gas-phase data, and further studies are warranted to investigate the gas-to-particle distribution of NACs in the ambient and source emissions. Similar to previous work, the average contribution of total NACs to Abs365 of Qf samples is less than 5 % (1.10 %–2.57 %), suggesting the need to shift our focus from low-MW NACs (MW<300 Da) to the chemical and optical properties of large molecules (e.g., MW>500 Da) in particles.
Data used in the writing of this paper is available at the Harvard Dataverse (https://doi.org/10.7910/DVN/VERFPS, Xie at al., 2020) and the US Environmental Protection Agency’s Environmental Dataset Gateway (https://edg.epa.gov, last access: 16 November 2020).
The supplement related to this article is available online at: https://doi.org/10.5194/acp-20-14077-2020-supplement.
MX and ALH designed the research. MX, ZZ, and XC performed the experiments. GS, WMC, and JJJ managed cookstove emission tests and sample collection. MX and MDH analyzed the data and wrote the paper with significant contributions from ALH and QW.
The authors declare that they have no conflict of interest.
The views expressed in this article are those of the authors and do not necessarily represent the views or policies of the US Environmental Protection Agency.
This research was supported in part by an appointment to the Postdoctoral Research Program at the Office of Research and Development by the Oak Ridge Institute for Science and Education through interagency agreement no. 92433001 between the US Department of Energy and the US Environmental Protection Agency. We thank Bakul Patel for assistance in ECOC analysis of PM2.5 filters.
This research has been supported by the National Natural Science Foundation of China (grant no. 41701551).
This paper was edited by Sergey A. Nizkorodov and reviewed by three anonymous referees.
Ahrens, L., Harner, T., Shoeib, M., Lane, D. A., and Murphy, J. G.: Improved characterization of gas–particle partitioning for per- and polyfluoroalkyl substances in the atmosphere using annular diffusion denuder samplers, Environ. Sci. Technol., 46, 7199–7206, https://doi.org/10.1021/es300898s, 2012.
Anenberg, S. C., Balakrishnan, K., Jetter, J., Masera, O., Mehta, S., Moss, J., and Ramanathan, V.: Cleaner cooking solutions to achieve health, climate, and economic cobenefits, Environ. Sci. Technol., 47, 3944–3952, https://doi.org/10.1021/es304942e, 2013.
Aunan, K., Berntsen, T. K., Myhre, G., Rypdal, K., Streets, D. G., Woo, J.-H., and Smith, K. R.: Radiative forcing from household fuel burning in Asia, Atmos. Environ., 43, 5674–5681, https://doi.org/10.1016/j.atmosenv.2009.07.053, 2009.
Bond, T. C., Streets, D. G., Yarber, K. F., Nelson, S. M., Woo, J.-H., and Klimont, Z.: A technology-based global inventory of black and organic carbon emissions from combustion, J. Geophys. Res.-Atmos., 109, D14203, https://doi.org/10.1029/2003jd003697, 2004.
Bonjour, S., Adair-Rohani, H., Wolf, J., Bruce Nigel, G., Mehta, S., Prüss-Ustün, A., Lahiff, M., Rehfuess Eva, A., Mishra, V., and Smith Kirk, R.: Solid fuel use for household cooking: Country and regional estimates for 1980–2010, Environ. Health Persp., 121, 784–790, https://doi.org/10.1289/ehp.1205987, 2013.
Cao, G., Zhang, X., and Zheng, F.: Inventory of black carbon and organic carbon emissions from China, Atmos. Environ., 40, 6516–6527, https://doi.org/10.1016/j.atmosenv.2006.05.070, 2006.
Chen, Y. and Bond, T. C.: Light absorption by organic carbon from wood combustion, Atmos. Chem. Phys., 10, 1773–1787, https://doi.org/10.5194/acp-10-1773-2010, 2010.
Chen, Y., Sheng, G., Bi, X., Feng, Y., Mai, B., and Fu, J.: Emission factors for carbonaceous particles and polycyclic aromatic hydrocarbons from residential coal combustion in China, Environ. Sci. Technol., 39, 1861–1867, https://doi.org/10.1021/es0493650, 2005.
Claeys, M., Vermeylen, R., Yasmeen, F., Gómez-González, Y., Chi, X., Maenhaut, W., Mészáros, T., and Salma, I.: Chemical characterisation of humic-like substances from urban, rural and tropical biomass burning environments using liquid chromatography with UV/vis photodiode array detection and electrospray ionisation mass spectrometry, Environ. Chem., 9, 273–284, https://doi.org/10.1071/EN11163, 2012.
De Haan, D. O., Hawkins, L. N., Welsh, H. G., Pednekar, R., Casar, J. R., Pennington, E. A., de Loera, A., Jimenez, N. G., Symons, M. A., Zauscher, M., Pajunoja, A., Caponi, L., Cazaunau, M., Formenti, P., Gratien, A., Pangui, E., and Doussin, J.-F.: Brown carbon production in ammonium- or amine-containing aerosol particles by reactive uptake of methylglyoxal and photolytic cloud cycling, Environ. Sci. Technol., 51, 7458–7466, https://doi.org/10.1021/acs.est.7b00159, 2017.
Desyaterik, Y., Sun, Y., Shen, X., Lee, T., Wang, X., Wang, T., and Collett, J. L.: Speciation of “brown” carbon in cloud water impacted by agricultural biomass burning in eastern China, J. Geophys. Res.-Atmos., 118, 7389–7399, https://doi.org/10.1002/jgrd.50561, 2013.
Di Lorenzo, R. A. and Young, C. J.: Size separation method for absorption characterization in brown carbon: Application to an aged biomass burning sample, Geophys. Res. Lett., 43, 458–465, https://doi.org/10.1002/2015gl066954, 2016.
Di Lorenzo, R. A., Washenfelder, R. A., Attwood, A. R., Guo, H., Xu, L., Ng, N. L., Weber, R. J., Baumann, K., Edgerton, E., and Young, C. J.: Molecular-size-separated brown carbon absorption for biomass-burning aerosol at multiple field sites, Environ. Sci. Technol., 51, 3128–3137, https://doi.org/10.1021/acs.est.6b06160, 2017.
Ding, Y., Pang, Y., and Eatough, D. J.: High-volume diffusion denuder sampler for the routine monitoring of fine particulate matter: I. Design and optimization of the PC-BOSS, Aerosol Sci. Technol., 36, 369–382, https://doi.org/10.1080/027868202753571205, 2002.
Donahue, N. M., Epstein, S. A., Pandis, S. N., and Robinson, A. L.: A two-dimensional volatility basis set: 1. organic-aerosol mixing thermodynamics, Atmos. Chem. Phys., 11, 3303–3318, https://doi.org/10.5194/acp-11-3303-2011, 2011.
Feng, Y., Ramanathan, V., and Kotamarthi, V. R.: Brown carbon: a significant atmospheric absorber of solar radiation?, Atmos. Chem. Phys., 13, 8607–8621, https://doi.org/10.5194/acp-13-8607-2013, 2013.
Fleming, L. T., Lin, P., Laskin, A., Laskin, J., Weltman, R., Edwards, R. D., Arora, N. K., Yadav, A., Meinardi, S., Blake, D. R., Pillarisetti, A., Smith, K. R., and Nizkorodov, S. A.: Molecular composition of particulate matter emissions from dung and brushwood burning household cookstoves in Haryana, India, Atmos. Chem. Phys., 18, 2461–2480, https://doi.org/10.5194/acp-18-2461-2018, 2018.
Forrister, H., Liu, J., Scheuer, E., Dibb, J., Ziemba, L., Thornhill, K. L., Anderson, B., Diskin, G., Perring, A. E., Schwarz, J. P., Campuzano-Jost, P., Day, D. A., Palm, B. B., Jimenez, J. L., Nenes, A., and Weber, R. J.: Evolution of brown carbon in wildfire plumes, Geophys. Res. Lett., 42, 4623–4630, https://doi.org/10.1002/2015gl063897, 2015.
Gilman, J. B., Lerner, B. M., Kuster, W. C., Goldan, P. D., Warneke, C., Veres, P. R., Roberts, J. M., de Gouw, J. A., Burling, I. R., and Yokelson, R. J.: Biomass burning emissions and potential air quality impacts of volatile organic compounds and other trace gases from fuels common in the US, Atmos. Chem. Phys., 15, 13915–13938, https://doi.org/10.5194/acp-15-13915-2015, 2015.
Glarborg, P., Jensen, A., and Johnsson, J. E.: Fuel nitrogen conversion in solid fuel fired systems, Prog. Energ. Combust., 29, 89–113, 2003.
Global Alliance for Clean Cookstoves: Water Boiling Test (WBT) 4.2.3, Released 19 March 2014, available at: http://cleancookstoves.org/technology-and-fuels/testing/protocols.html (last access: July 2017), 2014.
Harrison, M. A., Barra, S., Borghesi, D., Vione, D., Arsene, C., and Olariu, R. I.: Nitrated phenols in the atmosphere: a review, Atmos. Environ., 39, 231–248, 2005.
Hecobian, A., Zhang, X., Zheng, M., Frank, N., Edgerton, E. S., and Weber, R. J.: Water-Soluble Organic Aerosol material and the light-absorption characteristics of aqueous extracts measured over the Southeastern United States, Atmos. Chem. Phys., 10, 5965–5977, https://doi.org/10.5194/acp-10-5965-2010, 2010.
Iinuma, Y., Böge, O., Gräfe, R., and Herrmann, H.: Methyl-nitrocatechols: Atmospheric tracer compounds for biomass burning secondary organic aerosols, Environ. Sci. Technol., 44, 8453–8459, https://doi.org/10.1021/es102938a, 2010.
International Agency for Research on Cancer: Some non-heterocyclic polycyclic aromatic hydrocarbons and some related exposures (Vol. 92), IARC Press, International Agency for Research on Cancer, Lyon, France, 2010.
Jaeckels, J. M., Bae, M. S., and Schauer, J. J.: Positive matrix factorization (PMF) analysis of molecular marker measurements to quantify the sources of organic aerosols, Environ. Sci. Technol., 41, 5763–5769, https://doi.org/10.1021/es062536b, 2007.
Jetter, J. J. and Kariher, P.: Solid-fuel household cook stoves: Characterization of performance and emissions, Biomass and Bioenergy, 33, 294–305, https://doi.org/10.1016/j.biombioe.2008.05.014, 2009.
Jetter, J., Zhao, Y., Smith, K. R., Khan, B., Yelverton, T., DeCarlo, P., and Hays, M. D.: Pollutant emissions and energy efficiency under controlled conditions for household biomass cookstoves and implications for metrics useful in setting international test standards, Environ. Sci. Technol., 46, 10827–10834, https://doi.org/10.1021/es301693f, 2012.
Kaal, J., Martínez Cortizas, A., and Nierop, K. G. J.: Characterisation of aged charcoal using a coil probe pyrolysis-GC/MS method optimised for black carbon, J. Anal. Appl. Pyrol., 85, 408–416, https://doi.org/10.1016/j.jaap.2008.11.007, 2009.
Kim, K.-H., Jahan, S. A., Kabir, E., and Brown, R. J. C.: A review of airborne polycyclic aromatic hydrocarbons (PAHs) and their human health effects, Environ. Int., 60, 71–80, https://doi.org/10.1016/j.envint.2013.07.019, 2013.
Kim Oanh, N. T., Bætz Reutergårdh, L., and Dung, N. T.: Emission of polycyclic aromatic hydrocarbons and particulate matter from domestic combustion of selected fuels, Environ. Sci. Technol., 33, 2703–2709, https://doi.org/10.1021/es980853f, 1999.
Kirchstetter, T. W., Corrigan, C. E., and Novakov, T.: Laboratory and field investigation of the adsorption of gaseous organic compounds onto quartz filters, Atmos. Environ., 35, 1663–1671, https://doi.org/10.1016/S1352-2310(00)00448-9, 2001.
Klimont, Z., Cofala, J., Xing, J., Wei, W., Zhang, C., Wang, S., Kejun, J., Bhandari, P., Mathur, R., Purohit, P., Rafaj, P., Chambers, A., Amann, M., and Hao, J.: Projections of SO2, NOx and carbonaceous aerosols emissions in Asia, Tellus B, 61, 602–617, https://doi.org/10.1111/j.1600-0889.2009.00428.x, 2009.
Kwamena, N.-O. and Abbatt, J.: Heterogeneous nitration reactions of polycyclic aromatic hydrocarbons and n-hexane soot by exposure to NO3/NO2/N2O5, Atmos. Environ., 42, 8309–8314, 2008.
Lacey, F. and Henze, D.: Global climate impacts of country-level primary carbonaceous aerosol from solid-fuel cookstove emissions, Environ. Res. Lett., 10, 114003, https://doi.org/10.1088/1748-9326/10/11/114003, 2015.
Lei, Y., Zhang, Q., He, K. B., and Streets, D. G.: Primary anthropogenic aerosol emission trends for China, 1990–2005, Atmos. Chem. Phys., 11, 931–954, https://doi.org/10.5194/acp-11-931-2011, 2011.
Li, Q., Jacob, D. J., Bey, I., Yantosca, R. M., Zhao, Y., Kondo, Y., and Notholt, J.: Atmospheric hydrogen cyanide (HCN): Biomass burning source, ocean sink?, Geophys. Res. Lett., 27, 357–360, https://doi.org/10.1029/1999gl010935, 2000.
Lin, P., Liu, J. M., Shilling, J. E., Kathmann, S. M., Laskin, J., and Laskin, A.: Molecular characterization of brown carbon (BrC) chromophores in secondary organic aerosol generated from photo-oxidation of toluene, Phys. Chem. Chem. Phys., 17, 23312–23325, https://doi.org/10.1039/c5cp02563j, 2015.
Lin, P., Aiona, P. K., Li, Y., Shiraiwa, M., Laskin, J., Nizkorodov, S. A., and Laskin, A.: Molecular characterization of brown carbon in biomass burning aerosol particles, Environ. Sci. Technol., 50, 11815–11824, https://doi.org/10.1021/acs.est.6b03024, 2016.
Lin, P., Bluvshtein, N., Rudich, Y., Nizkorodov, S. A., Laskin, J., and Laskin, A.: Molecular chemistry of atmospheric brown carbon inferred from a nationwide biomass burning event, Environ. Sci. Technol., 51, 11561–11570, https://doi.org/10.1021/acs.est.7b02276, 2017.
Liu, J., Bergin, M., Guo, H., King, L., Kotra, N., Edgerton, E., and Weber, R. J.: Size-resolved measurements of brown carbon in water and methanol extracts and estimates of their contribution to ambient fine-particle light absorption, Atmos. Chem. Phys., 13, 12389–12404, https://doi.org/10.5194/acp-13-12389-2013, 2013.
Lu, C., Wang, X., Li, R., Gu, R., Zhang, Y., Li, W., Gao, R., Chen, B., Xue, L., and Wang, W.: Emissions of fine particulate nitrated phenols from residential coal combustion in China, Atmos. Environ., 203, 10–17, https://doi.org/10.1016/j.atmosenv.2019.01.047, 2019.
Lu, J. W., Flores, J. M., Lavi, A., Abo-Riziq, A., and Rudich, Y.: Changes in the optical properties of benzo[a]pyrene-coated aerosols upon heterogeneous reactions with NO2 and NO3, Phys. Chem. Chem. Phys., 13, 6484–6492, https://doi.org/10.1039/C0CP02114H, 2011.
Lu, Z., Streets, D. G., Winijkul, E., Yan, F., Chen, Y., Bond, T. C., Feng, Y., Dubey, M. K., Liu, S., Pinto, J. P., and Carmichael, G. R.: Light absorption properties and radiative effects of primary organic aerosol emissions, Environ. Sci. Technol., 49, 4868–4877, https://doi.org/10.1021/acs.est.5b00211, 2015.
McMeeking, G., Fortner, E., Onasch, T., Taylor, J., Flynn, M., Coe, H., and Kreidenweis, S.: Impacts of nonrefractory material on light absorption by aerosols emitted from biomass burning, J. Geophys. Res.-Atmos., 119, 12272–12286, 2014.
Mohr, C., Lopez-Hilfiker, F. D., Zotter, P., Prévôt, A. S. H., Xu, L., Ng, N. L., Herndon, S. C., Williams, L. R., Franklin, J. P., Zahniser, M. S., Worsnop, D. R., Knighton, W. B., Aiken, A. C., Gorkowski, K. J., Dubey, M. K., Allan, J. D., and Thornton, J. A.: Contribution of nitrated phenols to wood burning brown carbon light absorption in Detling, United Kingdom during winter time, Environ. Sci. Technol., 47, 6316–6324, https://doi.org/10.1021/es400683v, 2013.
Nakayama, T., Matsumi, Y., Sato, K., Imamura, T., Yamazaki, A., and Uchiyama, A.: Laboratory studies on optical properties of secondary organic aerosols generated during the photooxidation of toluene and the ozonolysis of α-pinene, J. Geophys. Res.-Atmos., 115, D24204, https://doi.org/10.1029/2010jd014387, 2010.
Park, R. J., Kim, M. J., Jeong, J. I., Youn, D., and Kim, S.: A contribution of brown carbon aerosol to the aerosol light absorption and its radiative forcing in East Asia, Atmos. Environ., 44, 1414–1421, https://doi.org/10.1016/j.atmosenv.2010.01.042, 2010.
Peters, A. J., Lane, D. A., Gundel, L. A., Northcott, G. L., and Jones, K. C.: A comparison of high volume and diffusion denuder samplers for measuring semivolatile organic compounds in the atmosphere, Environ. Sci. Technol., 34, 5001–5006, https://doi.org/10.1021/es000056t, 2000.
Pokhrel, R. P., Wagner, N. L., Langridge, J. M., Lack, D. A., Jayarathne, T., Stone, E. A., Stockwell, C. E., Yokelson, R. J., and Murphy, S. M.: Parameterization of single-scattering albedo (SSA) and absorption Ångström exponent (AAE) with EC∕OC for aerosol emissions from biomass burning, Atmos. Chem. Phys., 16, 9549–9561, https://doi.org/10.5194/acp-16-9549-2016, 2016.
Ravindra, K., Sokhi, R., and Van Grieken, R.: Atmospheric polycyclic aromatic hydrocarbons: Source attribution, emission factors and regulation, Atmos. Environ., 42, 2895–2921, https://doi.org/10.1016/j.atmosenv.2007.12.010, 2008.
Reff, A., Bhave, P. V., Simon, H., Pace, T. G., Pouliot, G. A., Mobley, J. D., and Houyoux, M.: Emissions inventory of PM2.5 trace elements across the United States, Environ. Sci. Technol., 43, 5790–5796, https://doi.org/10.1021/es802930x, 2009.
Riddle, S. G., Jakober, C. A., Robert, M. A., Cahill, T. M., Charles, M. J., and Kleeman, M. J.: Large PAHs detected in fine particulate matter emitted from light-duty gasoline vehicles, Atmos. Environ., 41, 8658–8668, https://doi.org/10.1016/j.atmosenv.2007.07.023, 2007.
Saleh, R., Robinson, E. S., Tkacik, D. S., Ahern, A. T., Liu, S., Aiken, A. C., Sullivan, R. C., Presto, A. A., Dubey, M. K., Yokelson, R. J., Donahue, N. M., and Robinson, A. L.: Brownness of organics in aerosols from biomass burning linked to their black carbon content, Nat. Geosci., 7, 647–650, https://doi.org/10.1038/ngeo2220, 2014.
Samburova, V., Connolly, J., Gyawali, M., Yatavelli, R. L. N., Watts, A. C., Chakrabarty, R. K., Zielinska, B., Moosmüller, H., and Khlystov, A.: Polycyclic aromatic hydrocarbons in biomass-burning emissions and their contribution to light absorption and aerosol toxicity, Sci. Total Environ., 568, 391–401, https://doi.org/10.1016/j.scitotenv.2016.06.026, 2016.
Schneider, J., Bürger, V., and Arnold, F.: Methyl cyanide and hydrogen cyanide measurements in the lower stratosphere: Implications for methyl cyanide sources and sinks, J. Geophys. Res.-Atmos., 102, 25501–25506, https://doi.org/10.1029/97jd02364, 1997.
Shen, G., Tao, S., Wei, S., Zhang, Y., Wang, R., Wang, B., Li, W., Shen, H., Huang, Y., Chen, Y., Chen, H., Yang, Y., Wang, W., Wei, W., Wang, X., Liu, W., Wang, X., and Simonich, S. L. M.: Reductions in Emissions of Carbonaceous particulate matter and polycyclic aromatic hydrocarbons from combustion of biomass pellets in comparison with raw fuel burning, Environ. Sci. Technol., 46, 6409–6416, https://doi.org/10.1021/es300369d, 2012.
Shrivastava, M. K., Subramanian, R., Rogge, W. F., and Robinson, A. L.: Sources of organic aerosol: Positive matrix factorization of molecular marker data and comparison of results from different source apportionment models, Atmos. Environ., 41, 9353–9369, https://doi.org/10.1016/j.atmosenv.2007.09.016, 2007.
Simoneit, B. R.: Biomass burning – a review of organic tracers for smoke from incomplete combustion, Appl. Geochem., 17, 129–162, 2002.
Simoneit, B. R., Rogge, W., Mazurek, M., Standley, L., Hildemann, L., and Cass, G.: Lignin pyrolysis products, lignans, and resin acids as specific tracers of plant classes in emissions from biomass combustion, Environ. Sci. Technol., 27, 2533–2541, 1993.
Smith, K. R., Bruce, N., Balakrishnan, K., Adair-Rohani, H., Balmes, J., Chafe, Z., Dherani, M., Hosgood, H. D., Mehta, S., Pope, D., and Rehfuess, E.: Millions dead: How do we know and what does it mean? Methods used in the comparative risk assessment of household air pollution, Annu. Rev. Publ. Health, 35, 185–206, https://doi.org/10.1146/annurev-publhealth-032013-182356, 2014.
Subramanian, R., Khlystov, A. Y., Cabada, J. C., and Robinson, A. L.: Positive and negative artifacts in particulate organic carbon measurements with denuded and undenuded sampler configurations special issue of Aerosol Science and Technology on findings from the fine particulate matter supersites program, Aerosol Sci. Technol., 38, 27–48, https://doi.org/10.1080/02786820390229354, 2004.
Sun, J., Zhi, G., Hitzenberger, R., Chen, Y., Tian, C., Zhang, Y., Feng, Y., Cheng, M., Zhang, Y., Cai, J., Chen, F., Qiu, Y., Jiang, Z., Li, J., Zhang, G., and Mo, Y.: Emission factors and light absorption properties of brown carbon from household coal combustion in China, Atmos. Chem. Phys., 17, 4769–4780, https://doi.org/10.5194/acp-17-4769-2017, 2017.
Teich, M., van Pinxteren, D., Wang, M., Kecorius, S., Wang, Z., Müller, T., Močnik, G., and Herrmann, H.: Contributions of nitrated aromatic compounds to the light absorption of water-soluble and particulate brown carbon in different atmospheric environments in Germany and China, Atmos. Chem. Phys., 17, 1653–1672, https://doi.org/10.5194/acp-17-1653-2017, 2017.
Tuccella, P., Curci, G., Pitari, G., Lee, S., and Jo, D. S.: Direct radiative effect of absorbing aerosols: sensitivity to mixing state, brown carbon and soil dust refractive index and shape, J. Geophys. Res.-Atmos., 125, e2019JD030967, https://doi.org/10.1029/2019JD030967, 2020.
Turpin, B. J. and Lim, H.-J.: Species contributions to PM2.5 mass concentrations: Revisiting common assumptions for estimating organic mass, Aerosol Sci. Technol., 35, 602–610, https://doi.org/10.1080/02786820119445, 2001.
Wang, X., Heald, C. L., Ridley, D. A., Schwarz, J. P., Spackman, J. R., Perring, A. E., Coe, H., Liu, D., and Clarke, A. D.: Exploiting simultaneous observational constraints on mass and absorption to estimate the global direct radiative forcing of black carbon and brown carbon, Atmos. Chem. Phys., 14, 10989–11010, https://doi.org/10.5194/acp-14-10989-2014, 2014.
Wathore, R., Mortimer, K., and Grieshop, A. P.: In-use emissions and estimated impacts of traditional, natural- and forced-draft cookstoves in rural Malawi, Environ. Sci. Technol., 51, 1929–1938, https://doi.org/10.1021/acs.est.6b05557, 2017.
Watson, J. G., Chow, J. C., Chen, L. W. A., and Frank, N. H.: Methods to assess carbonaceous aerosol sampling artifacts for IMPROVE and other long-term networks, J. Air Waste Manag. Assoc., 59, 898–911, https://doi.org/10.3155/1047-3289.59.8.898, 2009.
Xie, M., Hannigan, M. P., Dutton, S. J., Milford, J. B., Hemann, J. G., Miller, S. L., Schauer, J. J., Peel, J. L., and Vedal, S.: Positive matrix factorization of PM2.5: Comparison and implications of using different speciation data sets, Environ. Sci. Technol., 46, 11962–11970, https://doi.org/10.1021/es302358g, 2012.
Xie, M., Piedrahita, R., Dutton, S. J., Milford, J. B., Hemann, J. G., Peel, J. L., Miller, S. L., Kim, S.-Y., Vedal, S., Sheppard, L., and Hannigan, M. P.: Positive matrix factorization of a 32-month series of daily PM2.5 speciation data with incorporation of temperature stratification, Atmos. Environ., 65, 11–20, https://doi.org/10.1016/j.atmosenv.2012.09.034, 2013.
Xie, M., Hannigan, M. P., and Barsanti, K. C.: Gas/particle partitioning of n-alkanes, PAHs and oxygenated PAHs in urban Denver, Atmos. Environ., 95, 355–362, https://doi.org/10.1016/j.atmosenv.2014.06.056, 2014.
Xie, M., Chen, X., Hays, M. D., Lewandowski, M., Offenberg, J., Kleindienst, T. E., and Holder, A. L.: Light absorption of secondary organic aerosol: Composition and contribution of nitroaromatic compounds, Environ. Sci. Technol., 51, 11607–11616, https://doi.org/10.1021/acs.est.7b03263, 2017a.
Xie, M., Hays, M. D., and Holder, A. L.: Light-absorbing organic carbon from prescribed and laboratory biomass burning and gasoline vehicle emissions, Sci. Rep.-UK, 7, 7318, https://doi.org/10.1038/s41598-017-06981-8, 2017b.
Xie, M., Shen, G., Holder, A. L., Hays, M. D., and Jetter, J. J.: Light absorption of organic carbon emitted from burning wood, charcoal, and kerosene in household cookstoves, Environ. Pollut., 240, 60–67, https://doi.org/10.1016/j.envpol.2018.04.085, 2018.
Xie, M., Chen, X., Hays, M. D., and Holder, A. L.: Composition and light absorption of N-containing aromatic compounds in organic aerosols from laboratory biomass burning, Atmos. Chem. Phys., 19, 2899–2915, https://doi.org/10.5194/acp-19-2899-2019, 2019.
Xie, M., Zhao, Z., Holder, A., Hays, M., Chen, X., Shen, G., Jetter, J., Champion, W., and Wang, Q. G.: Replication Data for: Chemical composition, structures, and light absorption of N-containing aromatic compounds emitted from burning wood and charcoal in household cookstoves, V1 ed., Harvard Dataverse, https://doi.org/10.7910/DVN/VERFPS, 2020.
Yang, M., Howell, S. G., Zhuang, J., and Huebert, B. J.: Attribution of aerosol light absorption to black carbon, brown carbon, and dust in China – interpretations of atmospheric measurements during EAST-AIRE, Atmos. Chem. Phys., 9, 2035–2050, https://doi.org/10.5194/acp-9-2035-2009, 2009.
Zhang, X., Lin, Y.-H., Surratt, J. D., and Weber, R. J.: Sources, composition and absorption Ångström exponent of light-absorbing organic components in aerosol extracts from the Los Angeles basin, Environ. Sci. Technol., 47, 3685–3693, https://doi.org/10.1021/es305047b, 2013.