the Creative Commons Attribution 4.0 License.
the Creative Commons Attribution 4.0 License.
 | 19 Nov 2020
Laboratory measurements of stomatal NO2 deposition to native California trees and the role of forests in the NOx cycle
Erin R. Delaria
Bryan K. Place
Amy X. Liu
Both canopy-level field measurements and laboratory studies suggest that uptake of NO2 through the leaf stomata of vegetation is a significant sink of atmospheric NOx. However, the mechanisms of this foliar NO2 uptake and their impact on NOx lifetimes remain incompletely understood. To understand the leaf-level processes affecting ecosystem-scale atmosphere–biosphere NOx exchange, we have conducted laboratory experiments of branch-level NO2 deposition fluxes to six coniferous and four broadleaf native California trees using a branch enclosure system with direct laser-induced fluorescence (LIF) detection of NO2. We report NO2 foliar deposition that demonstrates a large degree of inter-species variability, with maximum observed deposition velocities ranging from 0.15 to 0.51 cm s−1 during the daytime, as well as significant stomatal opening during the night. We also find that the contribution of mesophyllic processing to the overall deposition rate of NO2 varies by tree species but has an ultimately inconsequential impact on NOx budgets and lifetimes. Additionally, we find no evidence of any emission of NO2 from leaves, suggesting an effective unidirectional exchange of NOx between the atmosphere and vegetation.
- Article
(5294 KB) - Full-text XML
-
Supplement
(2230 KB) - BibTeX
- EndNote


Nitrogen oxides () are a form of reactive nitrogen that play a major role in the chemistry of the atmosphere. NOx catalyzes tropospheric ozone formation, contributes to the production of photochemical smog, and influences the oxidative capacity of the atmosphere (Crutzen, 1979). NOx is primarily emitted as NO through fossil fuel burning, lighting, and soil microbial activity (Seinfeld and Pandis, 2006). The latter source is of particular importance in remote forested and agricultural regions, where emission from soils is the primary source of NOx (e.g., Jacob and Wofsy, 1990; Lerdau et al., 2000; Seinfeld and Pandis, 2006; Romer et al., 2018; Almaraz et al., 2018).
Understanding the fate of atmospheric NOx, in addition to its emission sources, is essential for interpreting the impact of NOx on atmospheric chemistry. Prior studies have demonstrated that NO2 can directly deposit to foliage after diffusion through stomata (e.g., Teklemmariam and Sparks, 2006; Chaparro-Suarez et al., 2011; Breuninger et al., 2013; Delaria et al., 2018). The currently understood mechanism of this uptake process is as follows: NO2 enters through the stomatal cavity and dissolves into the apoplastic fluid, forming nitrate, which then is reduced to ammonium by the enzyme nitrate reductase (Park and Lee, 1988; Ammann et al., 1995; Tischner, 2000; Lillo, 2008; Heidari et al., 2011). There is evidence that NO2 may also be directly scavenged by antioxidants, most notably ascorbate (Ramge et al., 1993; Teklemmariam and Sparks, 2006). These processes may be impacted by the leaf pH, which is known to change under conditions of limited water availability (Bahrun et al., 2002). Experiments using 15N as an isotopic tracer have demonstrated that absorbed NO2 is eventually assimilated into amino acids (Rogers et al., 1979; Okano and Totsuka, 1986). Although the role of stomatal conductance (gs) in controlling the deposition of NO2 is well-documented, the impact of mesophyllic processes remains poorly resolved. These mesophyllic mechanisms are complex and include any process taking place between the intercellular air space and the ultimate nitrogen assimilation site. The question of whether and how much mesophyllic processes affect NOx budgets at the canopy scale thus persists.
The most divisive example of the mesophyll quandary is the sometimes-reported emission of NOx from plants, mostly in the form of NO, at low NOx mixing ratios that would be relevant to remote forested regions (Johansson, 1987; Rondón and Granat, 1994; Hereid and Monson, 2001; Sparks et al., 2001; Teklemmariam and Sparks, 2006). This would, under many conditions, indicate that trees instead serve as a constant source, rather than sink, of NOx. However, this idea has been called into question by a number of recent studies including Chaparro-Suarez et al. (2011), Breuninger et al. (2013), and Delaria et al. (2018). It is possible that the magnitude and direction of the NOx flux to leaves may vary depending on the species and conditions. One such factor that has been suggested to impact foliar emission and deposition of NOx is elevated soil nitrogen. Soil nitrate fertilization has been documented to lead to an increase in nitrate reductase activity in the needles of Scots pine seedlings (Andrews, 1986; Pietilainen and Lahdesmaki, 1988; Sarjala, 1991). It is possible that as a result of abundant nitrate fertilization, nitrate accumulates in leaves, leading to emission or a reduction in uptake. For example, Chen et al. (2012) observed an increase in NO emission and Teklemmariam and Sparks (2006) detected an increase in NO2 emission under conditions of elevated soil nitrate. By contrast, Joensuu et al. (2014) found no evidence of fertilization-induced NOx emissions. No influence of soil nitrogen on either NO2 or NO uptake has been documented (Okano and Totsuka, 1986; Teklemmariam and Sparks, 2006; Joensuu et al., 2014).
In this study we present results from laboratory measurements of NO2 fluxes of 10 native California tree species – six conifers and four broadleaf trees – using a branch enclosure system and laser-induced fluorescence (LIF) detection of NO2. Here we investigate the relative influence of stomatal and mesophyllic processes on the total uptake rate of NO2 under atmospherically relevant conditions. Our aim is to assess the factors controlling NO2 foliar deposition and their ultimate impact on the NOx cycle. To test this, we measured the NO2 deposition velocity over a range of stomatal conductances and considered evidence for additional limits on the uptake rate. We also conducted experiments under drought and elevated soil nitrogen and tested for indications of NO2 emission or changes in the apparent mesophyllic uptake limit.
2.1 Tree specimens
Foliar deposition of NO2 was investigated in the laboratory using 10 native California tree species – Pinus sabiniana, Pinus ponderosa, Pinus contorta, Pseudotsuga menziesii, Calocedrus decurrens, Sequoia sempervirens, Arbutus menziesii, Acer macrophyllum, Quercus agrifolia, and Quercus douglasii. Three to six individuals of each species were purchased from a local native California plant nursery (Native Here Nursery) or Forestfarm, where the plants were grown from seeds and cuttings. The tree specimens were grown in a nutrient-rich commercial soil mixture of Sun Gro Sunshine no. 4 and Supersoil potting soil in 20–40 L pots in an outdoor section of the Oxford facility greenhouse at the University of California, Berkeley. The trees were 2–3 yr old when measurements were taken. No additional fertilizers or pesticides were used on the plants. Trees were transported into the lab for experimentation, where they were exposed to a 12 h light–dark cycle. Trees were illuminated with an LED diode array of 430–475 and 620–670 nm lights (Apollo Horticulture). For the deciduous trees (Q. douglasii and A. macrophyllum) experiments were run between May and September 2019. For all other species experiments were conducted year-round, between October 2018 and November 2019.
2.2 LIF measurement of NO2 deposition fluxes
Measurements were made with a dynamic chamber and LIF detection of NO2. A full description of our apparatus can be found in Delaria et al. (2018). Briefly, an NO2 standard was mixed with humidified zero air (air filtered to remove NOx and reactive species) and delivered to a ∼10 L chamber enclosing the branch of a tree at a total flow rate of ∼6000 cm3 min−1 (Fig. 1). The lifetime of air within the chamber was ∼2 min. Humidity was adjusted by controlling the fraction of zero air that passed through a bubbler filled with distilled water. The mixing ratios of NO2 entering the chamber were typically between 0 and 10 ppb. Some of the air entering the chamber was diverted to cell no. 1 of the NO2 LIF analyzer and to two LI-COR instruments (6262 and 7000), such that the flow rate of air directly into the chamber was ∼ 5000 cm3 min−1. Cell no. 1 of the LIF analyzer measured NO2 and the two LI-COR instruments measured CO2 and H2O in the in-flowing air stream. Air from the chamber was simultaneously pumped out to cell no. 2 of the NO2 LIF analyzer and the LI-COR-7000 instrument for measuring the mixing ratio of NO2 within the chamber and the change in CO2 and water vapor between the incoming and outgoing air streams, respectively (Fig. 1). A slight positive pressure was maintained within the chamber to ensure lab air did not leak into the chamber.

Figure 1Figure of instrumental setup. Blue lines show the flow of gas that enters the chamber and red lines show the flow of gas sampled from the chamber.
Fluxes of NO2 to leaves were calculated according to (Eqs. 1 and 2):
where [NO2]in and [NO2]out are concentrations of NO2 entering and exiting the chamber, respectively, at chamber equilibrium. Chamber equilibrium is achieved when the flow rates in and out of the chamber are equal and can be identified by a constant concentration of [NO2]out. [NO2]comp is the compensation point concentration – the ambient concentration of NO2 at which the tree acts as a source rather than a sink of NO2. Q is the flow rate (cm3 s−1), A is the enclosed one-sided leaf area, and Vd is the deposition velocity. The leaf area was determined using the ImageJ software package (Schneider et al., 2012), and the flow rate was measured at the beginning of each experimental run (Mesa Laboratories 510-M Bios Defender). Peroxyacetyl nitrate (PAN) and acetone were also delivered to the chamber for simultaneous measurements of PAN stomatal deposition. Negligible thermal production of NO2 was observed. The results of PAN deposition experiments are discussed in Place et al. (2020). The NO2 mixing ratio was also corrected for the differences in collisional quenching of the excited state NO2 by water vapor in cells no. 1 and no. 2, caused by transpiration of the tree within the chamber (Thornton et al., 2000).
where is the difference in the water vapor mole fraction between the chamber and the incoming air stream. Experiments to an empty chamber were conducted approximately every 2 months during this study to calculate the deposition of NO2 to the chamber walls. The wall loss was at maximum ∼2 % of the [NO2]in concentration and was background-subtracted from our flux calculations.
Deposition velocities were determined using the method described in Delaria et al. (2018): a weighted orthogonal distance linear regression was performed on NO2 fluxes (determined using Eq. 1) against [NO2]out to obtain a slope equal to Vd. A positive x intercept was interpreted as evidence for a possible compensation point. During each day of experimentation we stepped through at least eight different NO2 concentrations, with each concentration step lasting for 40 min. Uncertainty in Vd was obtained through propagating uncertainty in measured NO2 concentrations, Q, and A. The uncertainty in NO2 concentrations was estimated as 1 standard deviation of variation in measurements during the last 10 minutes of each concentration step. The uncertainty in Q was estimated as <1 % and a 10 % uncertainty was estimated for the enclosed one-sided leaf area.
The deposition velocities measured can be related to the resistance-model framework for deposition of trace gases developed by Baldocchi et al. (1987) (Eqs. 4–6).
R is the total resistance to deposition, Ra is the aerodynamic resistance, Rb is the boundary layer resistance, and Rleaf is resistance to uptake by the leaf. Ra was assumed to be negligible under our chamber conditions (Pape et al., 2009; Breuninger et al., 2012; Delaria et al., 2018). Rleaf is made up of Rcut, Rs, and Rm. Respectively, these refer to the cuticular resistance (resistance to deposition to the surface of the leaf), stomatal resistance (1∕gs), and mesophyllic resistance (resistance associated with all processes taking place within the leaf that limit uptake).
2.3 Measurement of stomatal conductance
CO2 and water vapor exchanges were measured using the LI-COR-6262 and LI-COR-7000 instruments. Measurements of water vapor exchange were used to calculate the transpiration rate (E) and total conductance to water vapor () using Eqs. (7) and (8), according to von Caemmerer and Farquhar (1981).
where wa and we are the mole fractions of water vapor to the outgoing and incoming airstreams, respectively, and ωi is the internal leaf water vapor mole fraction. ωe was measured with the LI-COR-6262 with dry air as a reference, and Δω (ωa−ωe) was measured with the LI-COR-7000 with incoming air as the reference. ωe was kept constant throughout a day of measurements and was varied between days. Measurements of an empty chamber were also used to calculate and correct for the water vapor deposition to the chamber at varying relative humidity. The difference between ωa and ωe for an empty chamber was not statistically significant and at all relative humidity levels was within instrumental uncertainty of the LI-COR-6262. ωi was assumed to be the saturation vapor pressure at the leaf temperature, which was measured with a thermocouple at the surface of an enclosed leaf. The chamber temperature was measured with a second thermocouple and was typically . Over the course of a day the temperature and humidity varied by a maximum of 2 ∘C and 5 %, respectively. These deviations were not found to be significantly correlated with stomatal opening. The photosynthetic photon flux density (PPFD) was monitored outside the chamber with a LI-COR quantum sensor (LI-COR LI-190SA) and was 1190 , approximately the PPFD for Berkeley, California, at noon during the month of October. We performed calculations based on von Caemmerer and Farquhar (1981) to confirm this is above the photon flux required to achieve maximal stomatal aperture for tree types relevant to this study. Total conductance was calculated as the average over the light or dark period of an experiment. The uncertainty in our calculation of total conductance to water vapor was primarily influenced by uncertainty in the leaf temperature and the assumption of leaf water vapor saturation. We observed fluctuations in the temperature of enclosed leaves of . Total uncertainty in was determined by propagating this uncertainty in leaf temperature, which resulted in larger estimated uncertainties at larger chamber humidities, usually coinciding with higher stomatal conductances. Chamber relative humidity was maintained at less than 90 % to minimize this effect. Variations in stomatal conductance were achieved by varying the mole fraction of water vapor in the air delivered to the chamber. The LI-COR-6262 instrument was calibrated weekly using standard CO2 cylinders and a LI-COR-610 dew point generator. The LI-COR-7000 instrument was calibrated daily.
The stomatal conductance () could then be calculated from Eq. (9):
where is the boundary layer resistance to water vapor. The boundary layer resistance to water vapor was estimated to be negligible under our experimental conditions, with an upper bound of 0.6 s cm−1. This was calculated by measuring the deposition of NO2 to a 30 cm2 tray of activated charcoal and confirmed by measuring the evaporation from a water-soaked Whatman no. 1 filter paper. (Delaria et al., 2018). A detailed description of our assumption of negligible Rb can be found in Sect. 3.1. Stomatal (gs) and total (gt) conductances to NO2 were calculated by scaling the values for water vapor by the ratio of diffusivities in air () according to Massman (1998).
2.4 Nitrogen measurements
To test the influence of excess soil nitrogen on the ability of trees to take up nitrogen through their stomata in the form of NO2, we fertilized three individuals of both Quercus agrifolia and Pseudotsuga menziesii with a 20 mM ammonium nitrate solution. The trees were watered with 250 mL of this ammonium nitrate solution 3 d per week. Three individuals of each species were watered with deionized (DI) water as the control group. The trees underwent this fertilization treatment for 120 d before beginning dynamic chamber measurements on NO2 foliar deposition. NO2 deposition experiments were conducted for 70 d, during which time the soil fertilization treatments were continued.
2.4.1 Soil nitrogen
Approximately 5 mg of a soil core sample was taken each day from the individual on which we conducted an NO2 deposition experiment. The soil was sifted through a mesh 2 mm sieve. Soil nitrate and ammonium were extracted by shaking ≈2.5 mg of the soil sample in 30 mL of ≈2 M KCl for 1 h, followed by filtering the samples through a Whatman no. 1 filter paper. The other ≈2.5 mg was dried in a drying oven at 60 ∘C for at least 48 h. The mass of the soil after drying was measured to determine the percentage dry mass of the extracted soil sample. Twelve quality control (QC) samples were made and carried through the extraction process. These samples consisted of six 30 mL KCl blanks and six KCl samples spiked with either 5 mL (low QC) or 10 mL (high QC) of 1 ppm ammonium nitrate solution. and were measured using a colorimetric synthesis following the method of Sims et al. (1995) and Decina et al. (2017). Briefly, a standard 1 ppm stock solution of ammonium nitrate was made from ammonium nitrate solid dissolved in Milli-Q water and was diluted to 0, 0.1, 0.2, 0.3, 0.4, and 0.5 mg L−1 in 1 cm, 2.5 mL cuvettes. These standard solutions served as the calibration standards; we made three sets of calibration standards for both ammonium and nitrate analysis. All glassware was acid washed in a 1 M solution of HCl prior to all measurements and extractions to prevent contamination.
For ammonium analysis, 160 µL of each soil extraction sample from the control group, 10 µL from the fertilizer-treated group, and 1.6 mL of the QC samples were pipetted into individual cuvettes. In total, 100 µL of 0.2 M citrate, 200 µL of 5 mM nitroprusside, 100 µL of 0.3 M hypochlorite reagents, and 500 µL of Milli-Q water were then added sequentially into each cuvette. The cuvettes were filled to a final volume of 2.5 mL with KCl, and the samples were allowed to sit for 30 min. For nitrate measurements, 320 and 10 µL of soil samples from the control and fertilized groups, respectively, and 1550 µL of the QC samples, were pipetted into separate cuvettes. In total, 950 µL of a regent containing 1 g L−1 vanadium chloride and 25 mg L−1 N-(1-naphthyl)ethylenediamine (NEDD) were subsequently added to each cuvette; these were then filled to a final volume of 2.5 mL with KCl and allowed to sit for 24 h. To test the effects of the soil matrix on the calibration, 160 and 320 µL of a control Q. agrifolia soil extraction sample were added to one set of calibration standards for ammonium and nitrate analysis, respectively.
Concentrations of ammonium and nitrate in each sample were determined with colorimetric measurements using a custom-built spectrophotometer. The spectrophotometer light source was a broad spectrum quartz tungsten halogen lamp (QTH10 Thorlabs Inc.). The absorption of each sample and standard was measured with the light source passing through a 540±2 nm bandpass filter (FB570-10 Thorlabs Inc.) for nitrate analysis or a 670±2 nm bandpass filter (FB540-10 Thorlabs Inc.) for ammonium analysis.
2.4.2 Uncertainty analysis
Concentrations of ammonium and nitrate in the soil extraction samples were determined from the slope in their respective calibration curves. The calibrations for ammonium and nitrate analysis had respective uncertainties of 7 % and 5 %. The slopes of the calibration curves with added sample from a Q. agrifolia soil extraction were not statistically different from those containing only standards, allowing us to exclude the possibility of interference from the soil matrix.
The accuracy uncertainty in the high and low QC samples were 3 % and 11 %, respectively, for ammonium measurements, and 3 % and 12 % for nitrate measurements. We estimated the resulting uncertainty for cuvette samples with less than 0.15 mg L−1 or ( soil or ) to be 15 %. Samples with larger concentrations were estimated to have 5 % uncertainty. The blank quality control standards contained 0.04 mg L−1 ammonium and nitrate. This was blank-subtracted from each sample.
2.4.3 Leaf nitrogen
After deposition experiments were completed the leaves were removed from the trees and dried for 48 h in a drying oven. The leaves were then ground to a fine powder and the percent nitrogen, hydrogen, and carbon content were measured with an inductively coupled plasma–optical emission spectrometry instrument (Optima 7000 DV ICP-OES)
2.5 Drought stress
Calocedrus decurrens and Pinus ponderosa were drought stressed to study the impact of drought on NO2 deposition. Three individuals of each species were watered daily (control group) and three individuals of each species were watered with 250 mL once every 4 weeks (drought group). Limited-water treatment of the drought group was carried out for 60 d before conducting dynamic chamber experiments for NO2 foliar deposition. NO2 deposition experiments were run for 30–40 d. During the experiments, the control group was watered 50 mL daily and the experimental group was watered 50 mL once every 2 weeks. The P. ponderosa drought stress experiments took place between March and June 2019. The C. decurrens drought stress spanned from August to December 2019.
The xylem water potential (Ψp) of the trees was monitored to measure the drought stress level of the trees, using a Scholander pressure chamber (Model 670 PMS Instr. Comp.). Leaves were cut, wrapped in aluminum foil, and then inserted into the pressure bomb. The Ψp of cuttings were measured around 11:00 LT each day. A Ψp measurement lower than −1.0 MPa indicated signs of drought stress in P. ponderosa. C. decurrens did not show evidence of drought stress in Ψp measurements, while in the greenhouse, however, early signs of embolism were observed.
Vd was calculated for each day of measurements with a weighted linear regression of measured fluxes and chamber NO2 concentrations (Delaria et al., 2018). No statistically significant compensation point was observed under any experimental condition for the majority of the species studied, in agreement with previous work (Chaparro-Suarez et al., 2011; Breuninger et al., 2013; Delaria et al., 2018). Only P. menziesii was found to have a compensation point, estimated to be 20 ppt, but this concentration is below the limit of quantification for our instrument, so we consider this measurement to be consistent with a compensation point of zero. Vd and gs measurements allowed for consideration of whether the deposition of NO2 is exclusively stomatally controlled or is also affected by the internal processing in the mesophyll. We rarely observed total closing of the stomata when the chamber lights were turned off at night. All of the deposition observed at night could be explained by deposition to these partially open stomata. This is consistent with previous studies observing only partial closing of stomata at night in a variety of plant species (Dawson et al., 2007; Drake et al., 2013). The results of experiments are shown in (Table 2).
Table 1Average soil and leaf nitrogen.

a QA is Q. agrifolia and PM is Pseudotsuga menziesii.
Table 2Summary of species-dependent foliar deposition results.
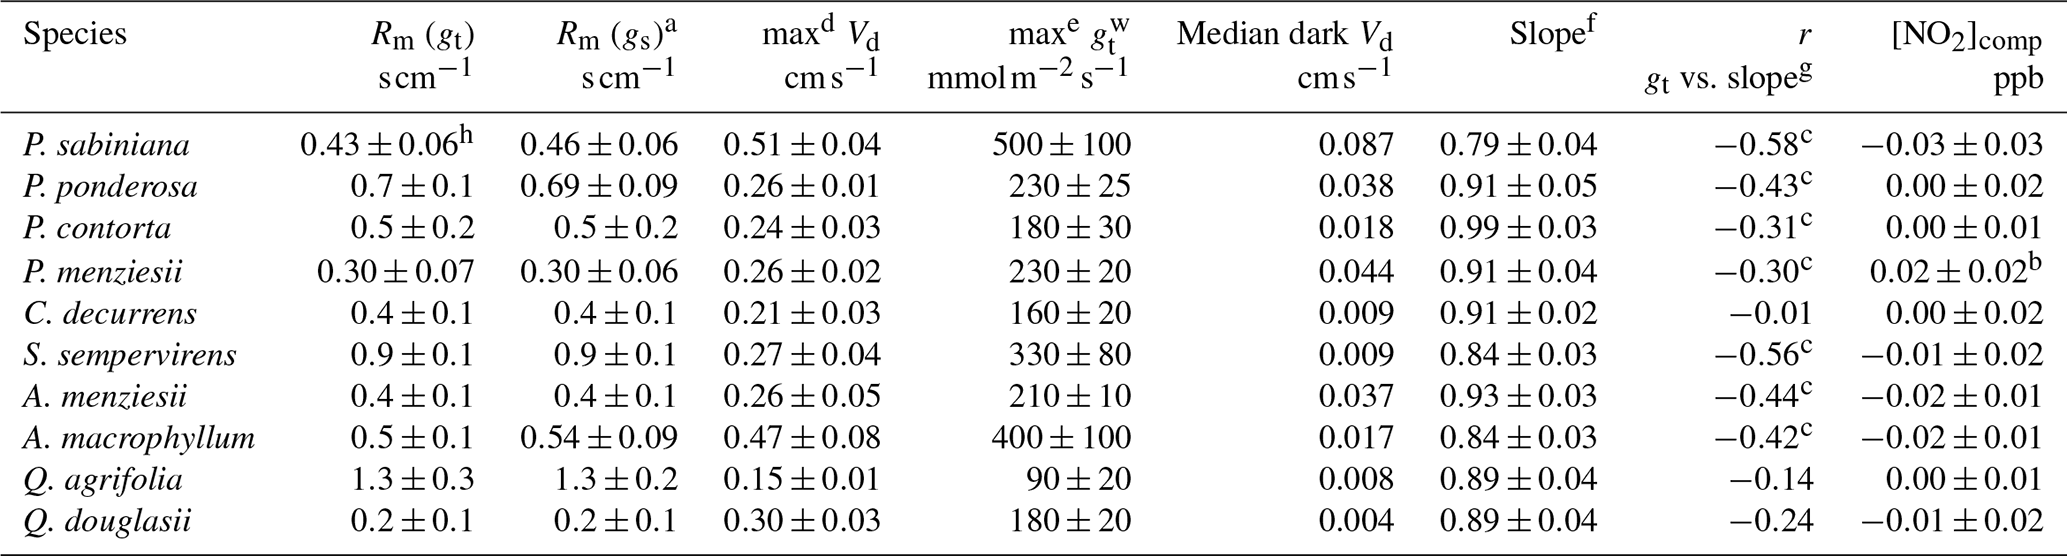
a Rm calculated assuming .
b Statistically significant (α=0.01) compensation point. Compensation point listed is at limit of detection for the instrument. All other compensation points are not statistically significant (α=0.05).
c Statistically significant (α=0.05) correlation. Correlations not indicated are not statistically significant (α=0.05).
d Maximum deposition velocity that was observed during our experiments and the error associated with that measurement.
e Listed maximum the maximum stomatal conductance to water vapor that was observed during our experiments and the error associated with that measurement. Units in for ease of comparison with other stomatal conductance studies.
f Total slope of measured vs. predicted fluxes (Fig. 2).
g Individual slopes of predicted vs. measured fluxes from each day an experiment was run.
h Calculated including data in helium.
3.1 Measurements of mesophyllic resistance
We utilized two methods for analyzing the importance of the mesophyllic resistance on the deposition of NO2. Figure 2 shows the predicted stomatally limited NO2 deposition fluxes, assuming negligible Rb, Rc, and Rm (Flux=gt[NO2]out) plotted vs. the measured NO2 fluxes. Our upper bound measurement of Rb for NO2 was 1 s cm−1 (0.6 s cm−1 for water vapor). Assuming gs=gt would lead to a maximum of a 60 % or 10 % error in the calculated gs with a or , respectively. However, Rb decreases with the enclosed leaf area according to Pape et al. (2009), which at a minimum was 200 cm2. The maximum Rb in the chamber should have thus been ≈0.1 s cm−1. Assuming gs=gt would lead to a maximum of a 6 % error at in this case. Any deviation from unity in the observed slope of predicted vs. measured fluxes can thus be attributed to Rm. Any error in our assumption of negligible Rb may partially mask the effect of Rm. We do not expect that variation in Rb due to changes in leaf morphology, micrometeorology, and leaf movement would substantially change the effect of Rb, although we cannot rule out the possibility that this was partially responsible for day-to-day fluctuations in NO2 fluxes. We confirmed the validity of our assumption of negligible Rb by comparing measurements of total conductance to water vapor, , in the chamber to measurements of stomatal conductance for the enclosed branch with a LI-COR-6800 instrument under identical environmental conditions of light irradiation, humidity, and temperature. This test was performed on one individual of three different tree species, and in all cases the chamber measurements were found to be approximately equal to the LI-COR-6800 measurements of within the range of uncertainty in .

Figure 2Measured fluxes (mflux) plotted against stomatally limited predicted fluxes (pflux=gt[NO2]out). Drought data and nitrogen fertilization data are included. Blue solid lines are the linear fit to data. Red lines are the 1:1 line. Error bars for the measured fluxes are calculated by propagating uncertainty in the measured NO2 mixing ratios, the flow rate, and the leaf area (Eq. 1). Error bars for the predicted fluxes are calculated by propagating uncertainties in the measured NO2 mixing ratios and the total conductance (Eq. 8). Red markers indicate data determined to be outliers by a generalized extreme studentized deviate test for outliers.
Significant deviations from unity in the slope of gt[NO2]out vs. measured fluxes could be seen in several species, most notably S. sempervirens (Table 2 and Fig. 2). Figure 2 shows each flux measurement as a single data point. For each day of experiments a slope of predicted vs. measured fluxes was obtained from a least squares cubic weighted fit on the 8–12 fluxes measured at varying NO2 concentrations. The reported slope for a given species (Table 2, shown in blue in Fig. 2) was calculated using a weighted average of the slopes from all experiment days. This was done to minimize the contribution of systematic errors potentially introduced by the LI-COR-7000 instrument, which was calibrated daily. All data points for a given day were excluded (shown in red in Fig. 2) if the calculated slope on that day was determined to be an outlier by a generalized extreme studentized deviate test for outliers. Identified outliers were excluded both to account for potentially erroneous deviations in the Vd∕gt ratio (most likely due to systematic error in calibration of the LI-COR-7000 instrument) and to avoid overweighting of days with abnormally large stomatal conductances. These latter instances normally coincided with low Vd∕gt ratios, and if these data were also subject to some systematic error, they would bias our analysis of Rm.
Rm was also explicitly calculated using the relationship of Vd and gt. Figure 3 shows Vd from each day of experiments plotted against the measured gt. Positive y intercepts are indications of cuticular deposition, and curvatures in the fit away from the 1:1 line are implications of mesophyllic resistance. Rm was calculated with a weighted fit of the resistance model:
No evidence of cuticular deposition was observed, so only results of Rm are recorded (Table 2). The deposition observed with the chamber lights turned off could be explained completely by the measured stomatal conductance. Fits of the resistance model (Eq. 10) typically resulted in cuticular resistances on the order of 1000 s cm−1. Rm was calculated both assuming negligible Rb (gs=gt) and . There were no significant differences between these two calculations (Table 2).
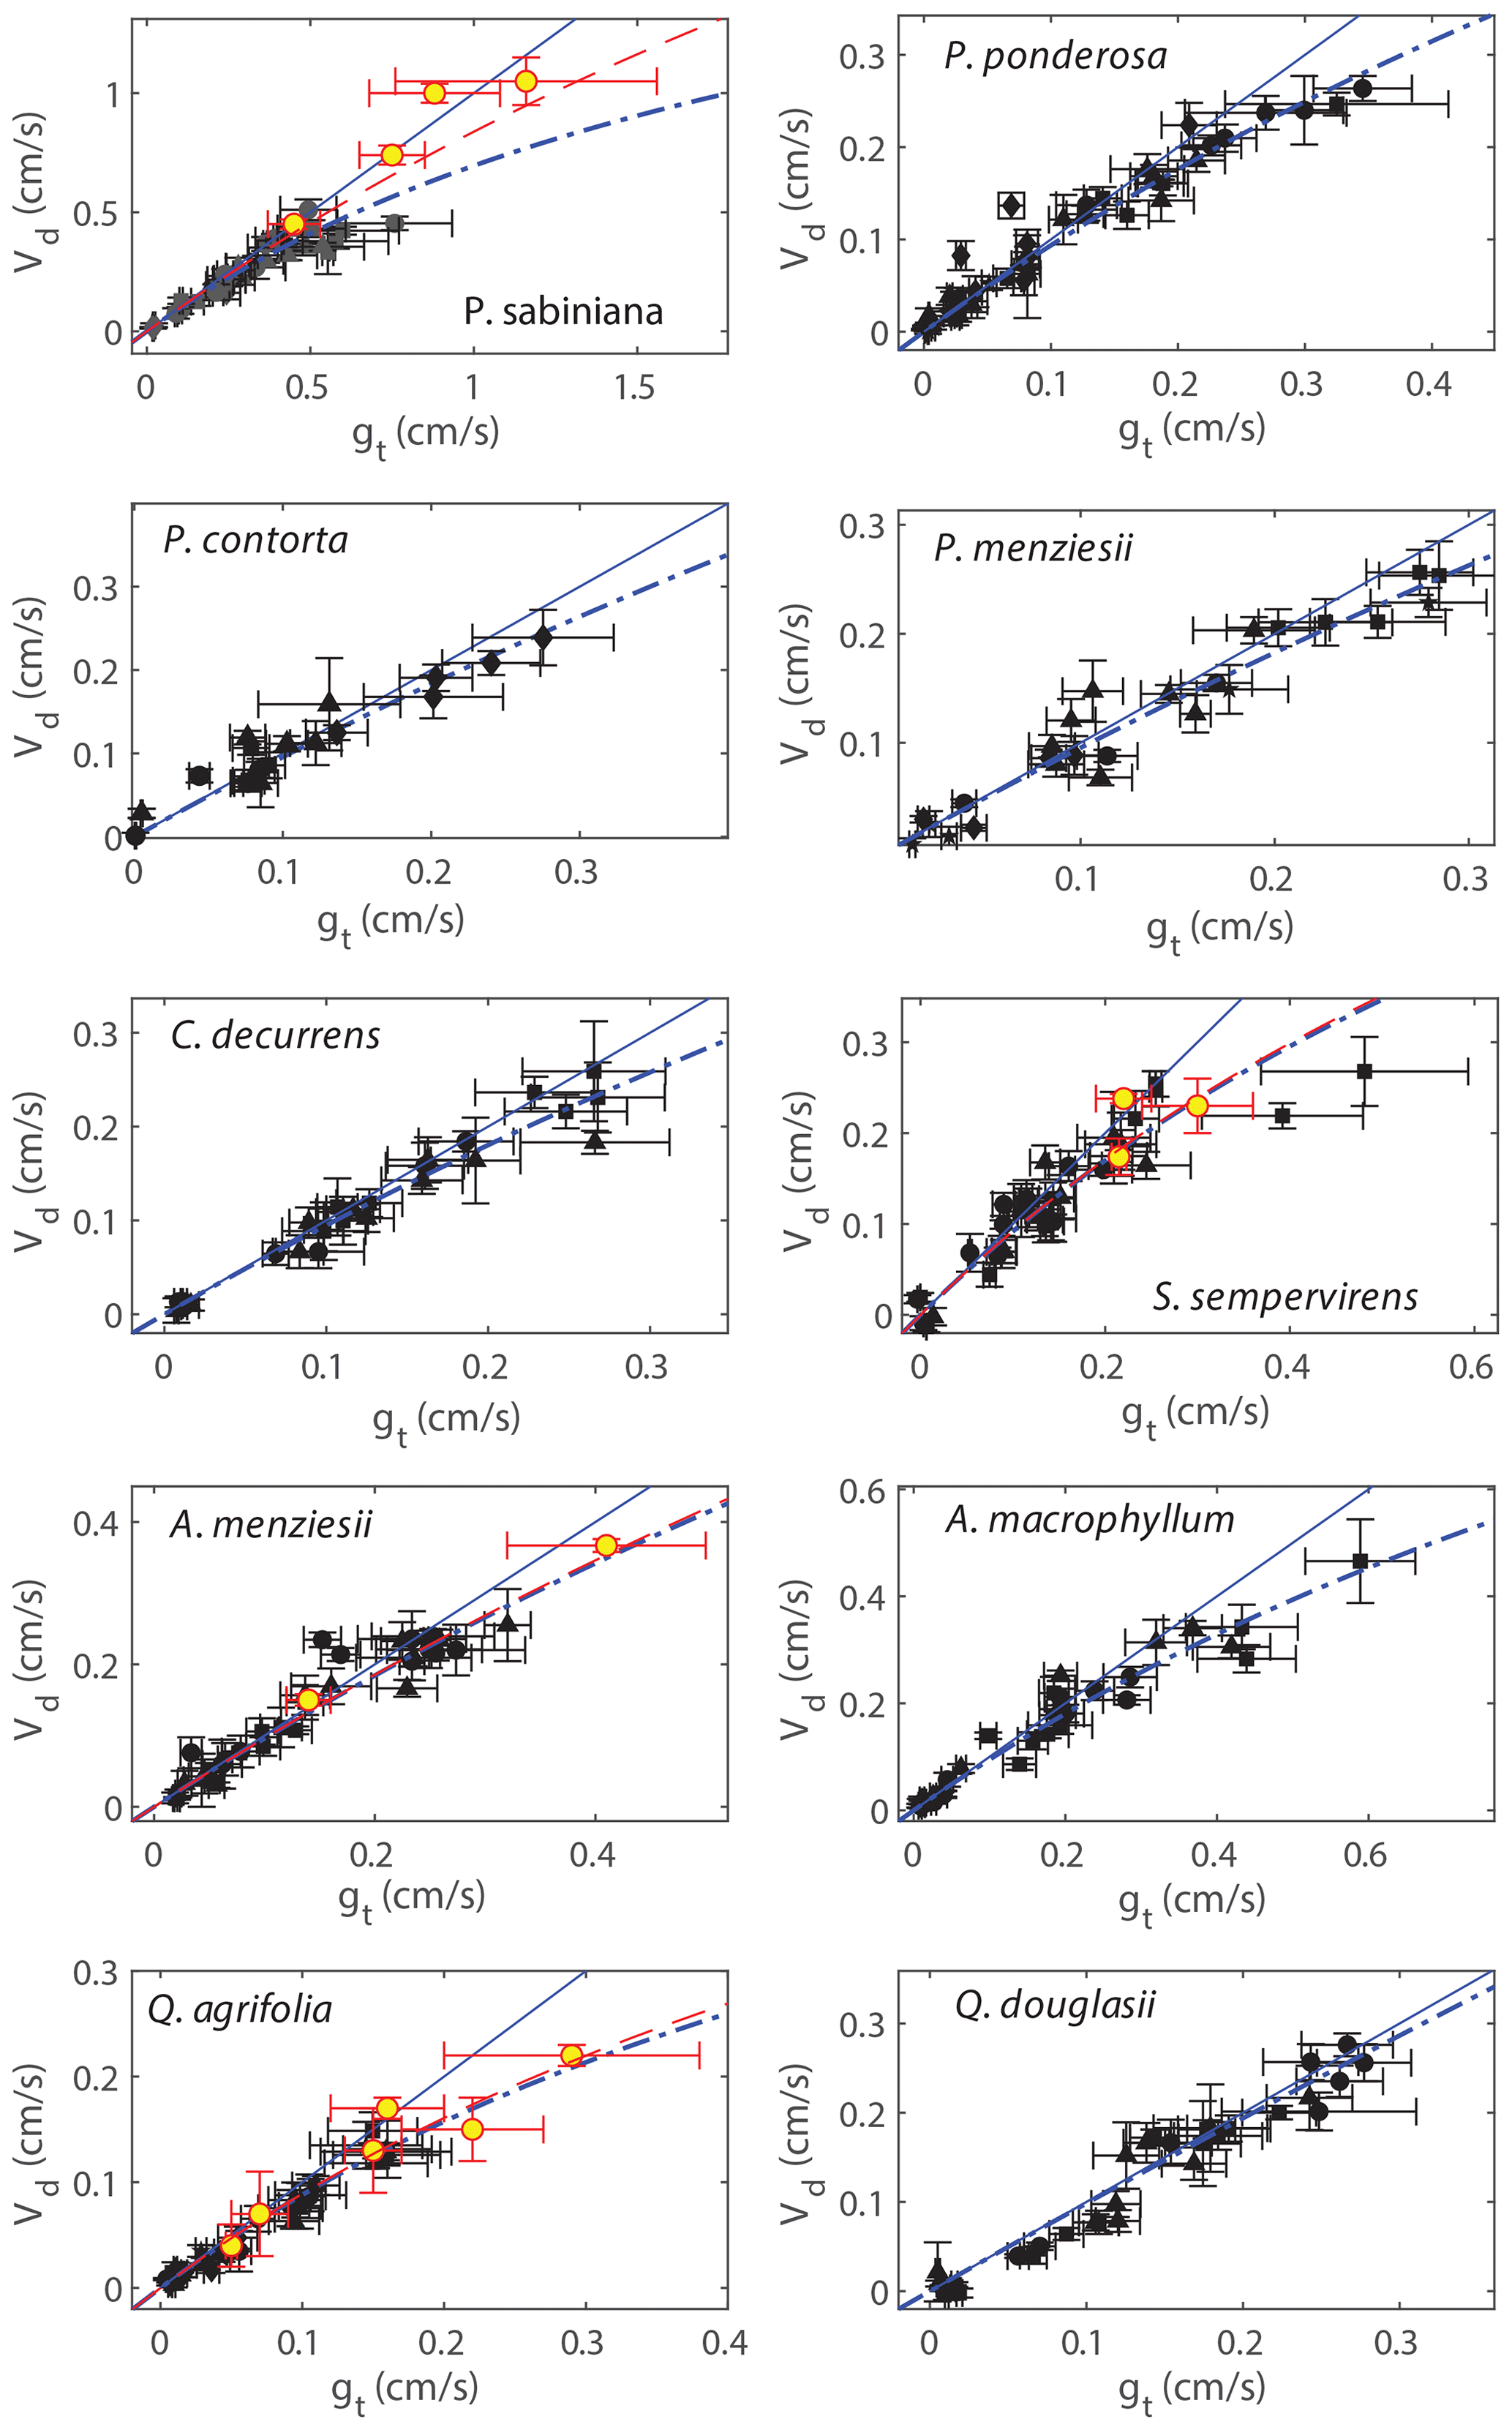
Figure 3Deposition velocities (Vd) plotted against measured total conductances to NO2 (gt). Black markers represent measurements in zero air, and red–yellow markers are measurements in helium. Measurements in helium are subject to less uncertainty introduced by potential systematic error in the leaf temperature. Solid blue lines are the 1:1 line, and dashed blue lines are error-weighted fits to the resistance model using only measurements in zero air, assuming the boundary layer resistance is negligible (Eq. 4). Fits to the resistance model including data from helium measurements are shown as dashed red lines.
3.2 Effects of excess soil nitrogen
The impact of soil fertilization on the foliar uptake of NO2 by two tree species, Q. agrifolia and P. menziesii, was examined by watering a control group of both species with deionized water and a fertilized group with 20 ppm ammonium nitrate. On average, the soil nitrogen concentrations of and were 100× larger for the fertilized groups than the control groups (Table 1). The percentage of leaf nitrogen content approximately doubled between the control groups and the fertilized groups (Table 1).
The effect of soil nitrogen fertilization and leaf nitrogen content on the ratio of Vd∕gt is shown in Fig. 4. No significant relationship (α=0.01) was observed for either Q. agrifolia or P. menziesii, suggesting the mesophyllic processing of NO2 is unaffected by soil or leaf nitrogen content . We also observe no increase in the compensation point of NO2 as a result of higher leaf nitrogen content or elevated soil nitrogen (Fig. 5).

Figure 4The Vd∕gt ratio is plotted against soil nitrogen concentration in the form of and for (a) Q. agrifolia and (c) P. menziesii. The dashed line shows a linear fit to NH4 data. The relationship is not significantly different (α=0.05) when fit to data. The Vd∕gt ratio is plotted against the leaf nitrogen : carbon ratio for (b) Q. agrifolia and (d) P. menziesii. Vd∕gt ratios less that 1 imply contributions from the mesophyll to the NO2 uptake rate. On each panel the Pearson's correlation coefficient and the p value for the slope are shown. The amount of soil and leaf nitrogen has no significant impact on the Vd∕gt ratio.

Figure 5The concentration below which leaves emit NO2 is the compensation point ([NO2]comp). [NO2]comp is plotted against the soil nitrogen concentration in the form of and for (a) Q. agrifolia and (c) P. menziesii. The dashed line shows a linear fit to NH4 data. The relationship is not significantly different (α=0.05) when fit to data. [NO2]comp is plotted against the leaf nitrogen : carbon ratio for (b) Q. agrifolia and (d) P. menziesii. On each panel the Pearson's correlation coefficient, the slope, the intercept, and their p values are shown. The amount of soil and leaf nitrogen has no significant impact on the compensation point.
3.3 Drought stress measurements
The impact of drought stress on NO2 foliar uptake for C. decurrens and P. ponderosa was observed by regularly watering a control group and watering an experimental drought group at much lower frequency (once every 4 weeks in the greenhouse and once every 2 weeks in lab). The median Ψp measured was lower for the drought groups than the control groups (Table 3). C. decurrens drought median Ψp was −0.80 MPa compared to control median of −0.30 MPa, and P. ponderosa drought median was −1.05 MPa compared to control median of −0.60 MPa. The first quartiles of the control groups and third quartiles of the drought groups did not overlap, reflecting a significant difference between the Ψp measurements of the two groups. We also observed a strong correlation between measured Ψp and stomatal conductance. We found a more substantial impact of drought on the water potentials and of the water potentials on the stomatal conductance, in P. ponderosa trees than C. decurrens. Both these California conifer species are quite drought resistant (Pharis, 1966; Kolb and Robberecht, 1996; Maherali and DeLucia, 2000), but these results may indicate C. decurrens is particularly protected against water loss.
Table 3Summary of drought stress results.
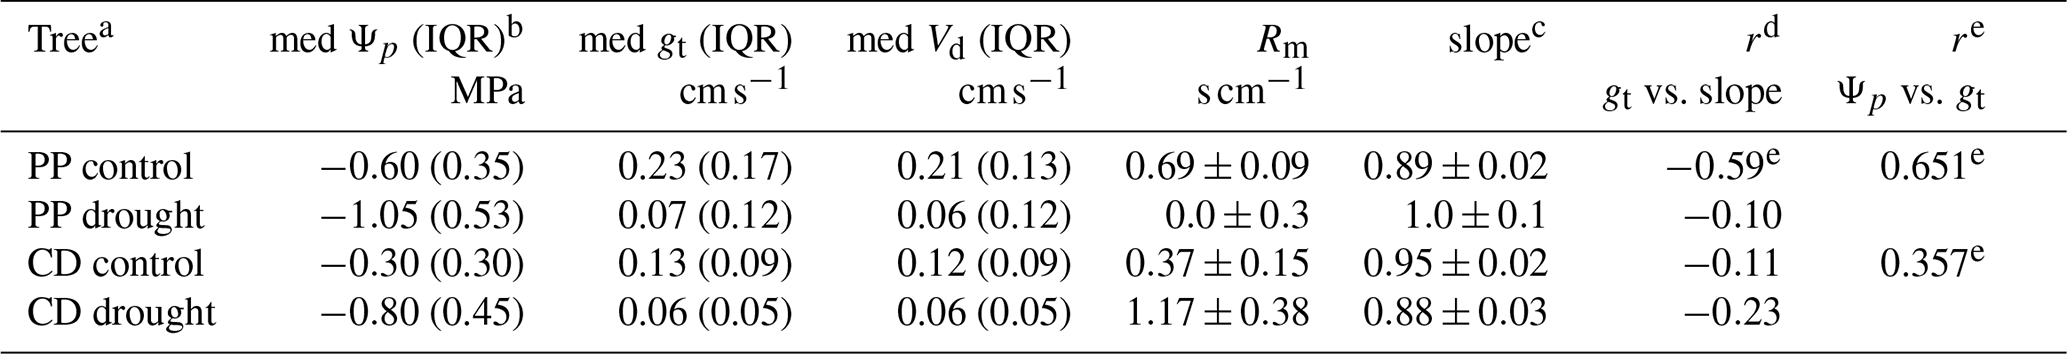
a PP is Pinus ponderosa and CD is Calocedrus decurrens.
b IQR is the interquartile range.
c Slope of measured vs. predicted fluxes.
d Pearson correlation coefficients.
e Statistically significant (α=0.05 correlation).
The mesophyllic resistance (Rm) calculated showed a statistically significant difference for both C. decurrens and P. ponderosa between drought-stressed and control groups. Rm in drought-stressed C. decurrens increased from 0.37 to 1.17 s cm−1, while in P. ponderosa Rm decreased from 0.86 to 0 s cm−1 (Fig. S5 in the Supplement).
4.1 Effects of mesophyll resistance on the lifetime of NOx
The mesophyllic resistances (Rm) for each of the 10 tree species measured are calculated from Fig. 3 and Eq. (10) and are tabulated in Table 2, assuming either gs=gt or the upper bound for Rb. The slopes of predicted fluxes vs. measured fluxes, calculated in Fig. 2, are also tabulated in Table 2. The importance of the mesophyllic resistance and internal processing of NO2 can be evaluated by examining both Rm and the slope of measured vs. predicted fluxes. We also examined the potential impact of the mesophyllic processing of NO2 by considering the Pearson's correlation coefficient between gt and the slope for an individual experiment (1 d of light or dark data) of measured vs. predicted fluxes (Fig. S3 in the Supplement). These correlation coefficients can be found in Table 2. The more negative this correlation, the greater the deviation in the slope from unity for higher values of gt, consistent with a larger impact of the mesophyll on the NO2 uptake rate. All tree species except for C. decurrens, Q. agrifolia, and Q. douglasii show statistically significant correlations (α= 0.05) (Table 2). Rm becomes more important at larger stomatal conductances (lower stomatal resistances), as can be seen with the increasing deviations from 1:1 in some species at higher values of gt in Fig. 3. Thus, even for trees with higher calculated Rm, the impact of mesophyllic processing is unlikely to be large if the maximum stomatal conductance observed is relatively small, resulting in a slope in the measured vs. predicted flux that does not deviate greatly from unity. This is the case for Q. agrifolia and P. ponderosa. Alternatively, P. sabiniana demonstrates a case of a relatively small Rm but also a smaller slope in measured vs. predicted fluxes, driven by consistently larger stomatal conductances (lower Rs) (Fig. 3). The most sizable impacts of mesophyllic NO2 processing ares seen in S. sempervirens, P. sabiniana, and A. macrophyllum. These species have the largest maximum observed gt (Fig. 3, Table 2) and slopes of measured vs. predicted fluxes of 0.79±0.04, 0.84±0.03, and 0.84±0.03, respectively. However, the greater uncertainty in measurements of stomatal conductance at a larger chamber humidity calls in to question the accuracy of many gt measurements larger than approximately 0.4 cm s−1.
To evaluate with greater certainty the relationship of Vd and gt, we conducted a set of experiments in helium to raise the stomatal conductance by increasing the gas diffusivities while maintaining relatively lower chamber humidity. These experiments were conducted on four of the tree species: P. sabiniana, S. sempervirens, Q. agrifolia, and A. menziesii. In these experiments the Vd∕gt ratio for P. sabiniana remained close to 1:1 up to 1.3 cm s−1 stomatal conductance (Fig. 3). Experiments in helium for this species thus suggest a smaller contribution of the mesophyll (red dashed line in Fig. 3). Rm calculated including helium experiments was not statistically different for S. sempervirens, Q. agrifolia, or A. menziesii.
Our laboratory measurements of mesophyllic resistance address the uncertainty in the literature for whether reactions in the mesophyll may be consequential for NO2 deposition velocities. To our knowledge, no previous studies have explicitly calculated the mesophyllic resistance. Differences between leaf-level deposition velocities and stomatal conductances measured by Breuninger et al. (2013) and observations of leaf ascorbate impacts on uptake rates by Teklemmariam and Sparks (2006) have indicated mesophyllic reactions may be important. Additional studies (Gut et al., 2002; Eller and Sparks, 2006; Chaparro-Suarez et al., 2011) have also shown some evidence that between 20 % and 40 % of NO2 deposition is under mesophyllic control. Our findings, however, suggest nearly 90 % of uptake is controlled by the stomata.
Currently, atmospheric models incorporate a mesophyllic resistance to NO2 of 0.1 s cm−1 (Zhang et al., 2002). This would result in a slope of measured vs. predicted fluxes of 0.94, even with a relatively large average gt of 0.6 cm s−1. The median slope measured in our study was 0.89. Using the multibox canopy model presented in Delaria and Cohen (2020), we investigated whether our results could possibly imply a more important impact of the mesophyllic resistance on the atmospheric fate of NOx at the canopy level. This model takes into account in-canopy processes (e.g., vertical transport, chemistry) to scale leaf-level processes to the canopy level. The model was run using meteorological conditions for June measured during the BEARPEX-2009 campaign, located at a ponderosa pine forest in the western foothills of the Sierra Nevada (38∘58′42.9′′ N, 120∘57′57.9′′ W; elevation 1315 m). The model was initialized over 2 d and data from the third day were analyzed. We conducted two model runs at a stomatal conductance (gs) to NO2 deposition of 0.3 cm s−1: the median measured maximum stomatal conductance excluding P. sabiniana – with an Rm of either 0.1 or 0.6 s cm−1; the median measured Rm excluding P. sabiniana. For a stomatal conductance to NO2 of 0.3 cm s−1 ( to water vapor) the model predicts only a 2.5 % decrease in NOx lost to deposition with an Rm of 0.6 compared with an Rm of 0.1 s cm−1. The lifetime to deposition with an Rm of 0.1 and 0.6 s cm−1 was 30.5 and 32.2 h, respectively, representing only a 6 % difference. The total atmospheric lifetime of NOx in the boundary layer with an Rm of 0.1 and 0.6 s cm−1 was 4.86 and 4.89 h, respectively, representing only a 0.6 % difference. Even the observed seemingly substantial mesophyllic resistance of S. sempervirens is therefore likely to be irrelevant at the canopy scale. Contributions from mesophyllic processing, though mechanistically important at a cellular level, are likely to not matter at the canopy scale in California forests. We therefore suggest that on canopy and regional scales, mesophyllic processes within leaves of trees represent a negligible contribution to NOx budgets and lifetimes in California. More studies on crops, grasses, and North American tree species from outside of California are needed.
4.2 Effects of excess soil nitrogen
We observed no effects of soil nitrogen, in the form of and , or the leaf nitrogen content on the ratio of Vd∕gt (Fig. 4) for either Q. agrifolia or P. menziesii. Changes in this ratio would indicate an effect on the mesophyllic resistance. We did observe declines in gt in the fertilized group relative to the control group during the later stages of experimentation, which coincided with observable evidence of plant stress (e.g., browning, wilting, and beginning signs of embolism). All variation in the uptake rates (Vd) could be explained exclusively with deviations in gt. These results are supported by previous studies which have also found a negligible impact of nitrogen fertilization on NO2 uptake (Teklemmariam and Sparks, 2006; Joensuu et al., 2014). If the fertilizer results in increased and in the leaf, this suggests that the mechanism of NO2 uptake via dissolution and subsequent reduction in and is likely not reversible and not influenced by accumulation of and within the mesophyll. Alternatively, if the increase in soil nitrogen leads only to an accumulation of organic nitrogen in the leaf, this increase has no effect on the uptake rates. Numerous studies indicate nitrate reductase activity is affected by the presence of ammonium, nitrate, and organic nitrogen in the form of amino acids in a variety of plant species (e.g., Datta et al., 1981; McCarty and Bremner, 1992; Woodin et al., 2006). Based on our current understanding of the mechanism of NO2 mesophyllic processing, if reactions in the mesophyll indeed affect the rate of stomatal uptake, our fertilization experiments should have succeeded in changing NO2 uptake rates, given that they succeeded in changing leaf nitrogen content. Because we observed no effect of nitrogen fertilization on NO2 uptake, we believe that this finding further supports that reactions within the mesophyll may be atmospherically unimportant. It is also possible that the disproportionation of NO2 to form nitrate and nitrite and scavenging by antioxidants (e.g., ascorbate) are the rate-limiting steps in the mesophyllic processing of NO2 rather than enzyme activity. More leaf and cellular-level studies are needed to elucidate the uptake mechanism.
We also did not observe any evidence for a relationship between the NO2 compensation point and the soil nitrogen content nor the leaf nitrogen content (Fig. 5) for either Q. agrifolia or P. menziesii. In general, we only observed uptake and no emission of NO2. We also conducted measurements of NO uptake and emission, but the fluxes measured were so small they were below the limit of quantification for our instrument. Chen et al. (2012) observed a strong relationship between NO emissions from stomata and soil nitrate fertilization. However, the maximum NO emissions they measured were a factor of 50 lower than the deposition of NO2 measured here. NO emission from leaves is therefore not likely to be an important source of atmospheric NOx. P. menziesii was the only tree examined in our experiments that demonstrated any evidence for emission of NO2 at low mixing ratios, with a compensation point of ≈ 20 ppt. This concentration is much lower than has been observed in previous studies that have detected an NO2 compensation point (Hereid and Monson, 2001; Teklemmariam and Sparks, 2006). However, this concentration is near the limit of detection for our instrument (Delaria et al., 2018) so should be taken with a grain of salt. A possible cause for discrepancy between our study and those that have measured significant NO2 compensation points is that our experiments are conducted only using photosynthetically active radiation. Some past work has demonstrated that UV light may cause photolysis of nitrate at the leaf surface and subsequent emission of NOx (Hari et al., 2003; Raivonen et al., 2006). The lack of a relationship between NOx emission and soil N fertilization contrasts with the results of Teklemmariam and Sparks (2006) but is consistent with the nitrogen fertilization experiments conducted by Joensuu et al. (2014).
4.3 Effects of drought stress
Although there was a statistically significant impact of drought stress on Rm, this is unlikely to be important to the overall uptake rates of NO2 at the canopy scale for reasons discussed in Sect. 4.1. The differing effects of drought on Rm between P. ponderosa and C. decurrens is surprising, with the drought group having a smaller Rm in P. ponderosa and larger Rm in C. decurrens. However, in the case of P. ponderosa, the lack of measurements at larger gt is likely to mask any existing mesophyllic effects, leading to minimal deviation in the total slope of predicted vs. measured fluxes from unity (Fig. S5). Despite a calculation of significant mesophyllic resistance in both drought and control C. decurrens individuals, the lack of a statistically significant (α = 0.05) correlation between gt and the slopes of predicted vs. measured fluxes casts doubt on this relationship. The control group of P. ponderosa is the only one for which this correlation is significant. The impact of drought on NO2 uptake at the leaf level is thus primarily its effect on the stomatal conductance. At the canopy level, documented effects of drought on leaf area also require consideration (Pharis, 1966; Kolb and Robberecht, 1996; Maherali and DeLucia, 2000).
4.4 Effects of nighttime stomatal deposition
Most atmospheric chemical transport models, such as the abundantly utilized WRF-Chem and GEOS-Chem, use the Wesley model for parameterizing dry deposition of gaseous species (e.g., Skamarock et al., 2008; Fast et al., 2014; Amnuaylojaroen et al., 2014; Ng et al., 2017). The Wesley model implicitly assumes the stomata are fully closed at night, despite more recent studies demonstrating many species of vegetation maintain partially open stomata at night (Musselman and Minnick, 2000; Dawson et al., 2007; Fisher et al., 2007; Drake et al., 2013). We find minimal cuticular deposition of NO2, in agreement with several other studies (Sparks et al., 2001; Chaparro-Suarez et al., 2011). However, field observations have shown that substantial leaf-level nighttime deposition of NO2 is necessary to explain nighttime levels of NOx (Jacob and Wofsy, 1990). The same phenomenon has been seen with other gaseous molecules, most notably PAN, which has also been suggested by a number of field observations to have significant non-stomatal deposition at night (Turnipseed et al., 2006; Wolfe et al., 2009; Crowley et al., 2018). Sparks et al. (2003) did not observe any evidence of non-stomatal deposition in the laboratory, but more recently Sun et al. (2016) implicated non-stomatal deposition in accounting for over 20 % of PAN leaf-level deposition. Our PAN deposition experiments, however, discussed in Place et al. (2020), also did not identify any significant non-stomatal deposition. Despite the existing differences regarding the importance of non-stomatal PAN deposition, we suggest that a significant portion of the “missing” deposition sink of NO2 and peroxyacyl nitrates at night may be due to non-total closure of the stomata.
To assess the impact of nighttime stomatal opening on the atmospheric fates and lifetimes of NOx at night, we ran our 1-D multibox canopy model, under the conditions described above, at the minimum, maximum, 25th percentile, and 75th percentile of the median nighttime deposition velocities measured in this study (0.004, 0.087, 0.009, and 0.038 cm s−1, respectively). At such low stomatal conductances, we found these deposition velocities to be not significantly different (α=0.05) from the stomatal conductance to NO2. The fractions of NOx loss to deposition and chemistry to these levels of stomatal opening at night are shown in Fig. 6. Here chemistry represents loss to HNO3, RONO2, and PAN, and nighttime is defined from 20:00 to 05:00. The range between the first and third quartile of the nighttime deposition observed results in a range in the fraction of NOx loss to deposition from 13 % to 25 % (Fig. 6) and a range in total NOx lifetime from ≈7.5 to 5 h.
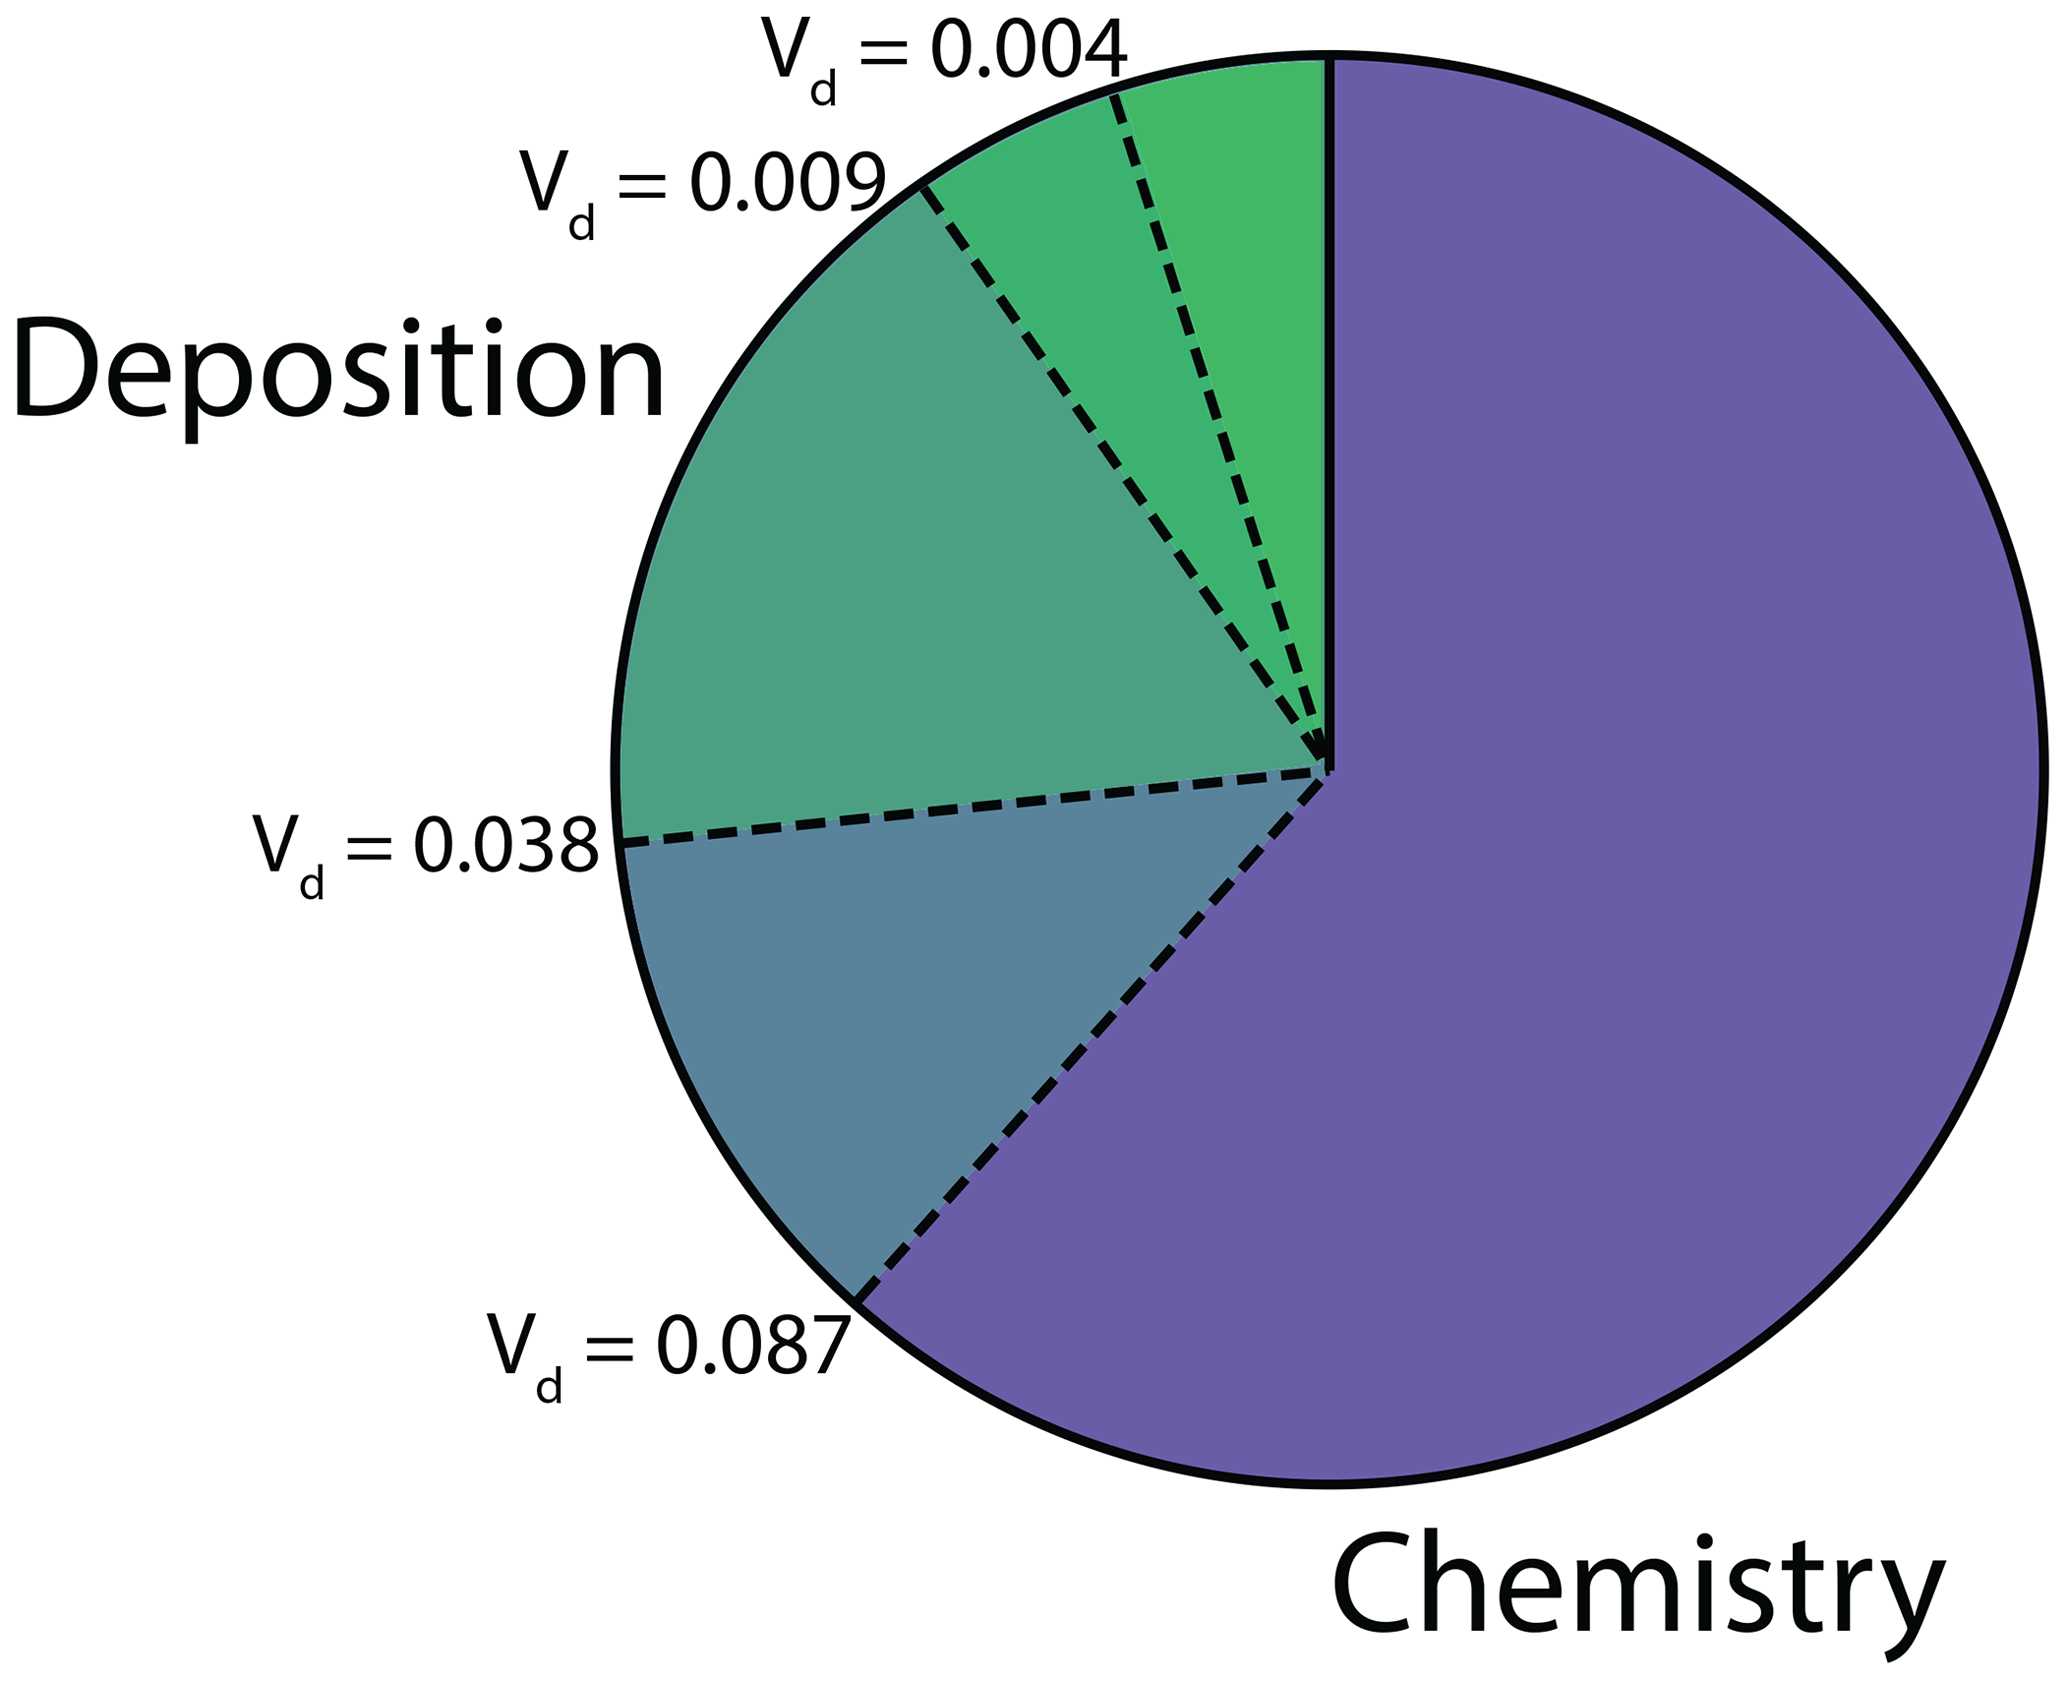
Figure 6Fraction of NOx loss to deposition and chemistry (nitric acid, alkyl nitrate, and peroxyacyl nitrate) at night (20:00–05:00). The four dashed lines between the deposition and chemistry fractions show NOx loss with a nighttime NO2 deposition velocity of 0.004, 0.009, 0.038, and 0.087 cm s−1. These deposition velocities, respectively, represent the minimum, first quartile, third quartile, and maximum of the median nighttime deposition velocities measured for the native California trees examined in this study.
The relatively large impact of the nighttime stomatal conductance on the fate of NOx, coupled with the large degree of inter-species variation in nighttime stomatal opening, indicates a need for more extensive studies of the nighttime deposition of NO2. Deposition is a permanent sink of atmospheric NOx, contrasting with the chemical nighttime sink of NOx to peroxyacyl nitrates (Russell et al., 1986; Cantrell et al., 1986; Perring et al., 2009). Heterogenous reactions at aerosol surfaces involving the NOx reservoir N2O5 and alkyl nitrate formation are among the other major nighttime chemical NOx sinks (Perring et al., 2009; Stavrakou et al., 2013; Kenagy et al., 2018). The relative fractions of nighttime NOx loss to deposition and chemistry is likely to have a substantial impact on the fate of atmospheric NOx and the cycling of reactive nitrogen.
4.5 Impacts on the nitrogen cycle in California
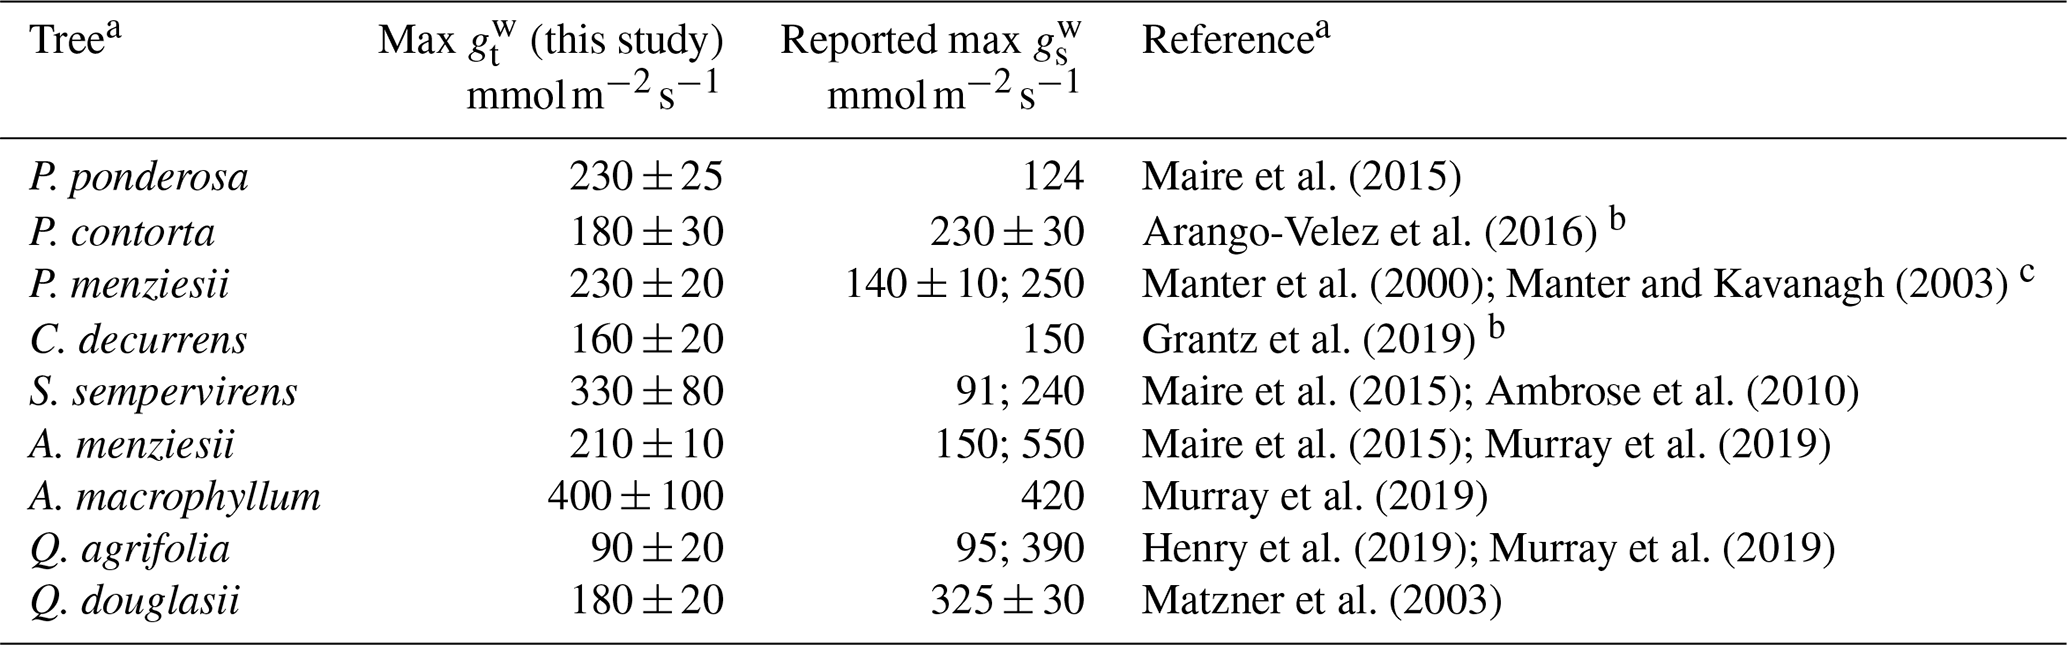
To our knowledge, this is the first study conducted on NO2 stomatal deposition to native California tree species, except for Q. agrifolia (Delaria et al., 2018). However, there are many measurements of the stomatal conductance of California trees (Table 4) with which to compare our maximum total conductance to water vapor measurements (max ). Murray et al. (2019) examined patterns in maximum stomatal conductance to water vapor (max ) across bioclimatic zones. Among the species they looked at were A. menziesii, A. macrophyllum, and Q. agrifolia, for which they measured an average max of 550, 420, and 390 , respectively. In comparison, our measurements of max for these species were, respectively, 210±10, 400±100, and 90±20 . Our estimates of max for A. menziesii and Q. agrifolia are substantially lower. Matzner et al. (2003) report larger conductances than we do for Q. douglasii as well (Table 4). Maire et al. (2015) determined a maximum stomatal conductance for A. menziesii of 150 , in better agreement with our measurements. Henry et al. (2019) measured a similar maximum stomatal conductance of Q. agrifolia to our study of 95 , also in better agreement with our results than Murray et al. (2019). Maire et al. (2015) measured a maximum stomatal conductance to water vapor for P. ponderosa and S. sempervirens of 124 and ∼91 , respectively – considerably smaller than the values measured in this study. Ambrose et al. (2010) measured a max for S. sempervirens of 240 m−2 s−1, in better agreement with our measurements. C. decurrens max reported here is in good agreement with previous measurements of max (Grantz et al., 2019). For Quercus and Acer species in similar climate regions to California, Maire et al. (2015) calculated max ranging from 103 to 890 and 112 to 320 , respectively. The median of max for all four angiosperms we measured was 200 , in good agreement with the 250 median of all angiosperms in Mediterranean climate regions found by Murray et al. (2019) and the 215 median found by Maire et al. (2015). Our median for the six gymnosperms measured was 230 , considerably larger than the median 100 max found by Maire et al. (2015) in Mediterranean climate regions (defined as warm temperature steppe regions as classified by Kottek et al., 2006).
Overall, the total conductances to water vapor measured in our laboratory experiments fall within the ranges of maximum stomatal conductances measured in previous studies – although inconsistencies exist in the current literature. (We also consider this to further support our conclusion that the boundary layer resistance in our chamber is negligible.) Possible discrepancies may have resulted from the location at which each species was measured, growing conditions, ages of the trees, etc. Nevertheless, our NO2 deposition results – and their applicability to California forests – are bolstered by the fact that our max measurements fall within the ranges of max measured for mature trees in the field. To assess the impact of the lab-measured deposition velocities on the NOx cycle in California, we used our measurements of maximum Vd during the day and median Vd at night ( and (night), respectively) to estimate the flux and lifetime of NOx to deposition in forests throughout the state during the day and night, respectively (Figs. 7 and 8).

Figure 7(a) Average midday deposition fluxes of NO2 to forests in June throughout California. (b) Average midday deposition lifetimes of NOx in June throughout California. White areas are non-forested areas.
The average deposition flux to trees in California was calculated via Eq. (11):
Leaf area index (LAI) data for June 2018 were obtained from MCD15A2H Version 6 Moderate Resolution Imaging Spectroradiometer (MODIS) Level 4 product (Myneni et al., 2015) (Fig. S6 in the Supplement). The NO2 surface concentrations and planetary boundary layer heights over California were obtained from a WRF-CHEM simulation for June 2014 (Fig. S6) (Laughner et al., 2019). The month of June was chosen because in California this is when forests have a large LAI, large gross primary productivity (GPP), and the greatest sunlight availability, and ecosystems often experience water limitations in the later summer (Turner et al., 2020). Land cover data were obtained from NLCD Land Cover (CONUS) for 2016 (Yang et al., 2018) (Fig. S1 in the Supplement). Only forested sites were considered. Although the use of products from different years may introduce some error into our calculations, this will not qualitatively change our conclusion. Tree counts were obtained from the USDA Forest Service Forestry Inventory Analysis Database (Forest Inventory and Analysis, 2014) (Fig. S2 in the Supplement). For each approximately 24 km2 hexagonal plot (Bechtold, 2005) in the Forest Service Inventory that contained more than 50 % of the trees measured in our study, an effective deposition velocity to NO2 () was calculated as a weighted (by tree species abundance) average from the values listed in Table 2 (Fig. S6). Plots that contained less than 50 % of the trees measured were not considered. Data were interpolated to a 500 m grid. The resulting midday fluxes throughout California are shown in Fig. 7 and midnight fluxes are shown in Fig. 8. The greatest fluxes predicted are south of the San Francisco Bay Area, where there are high NOx concentrations and also a relatively high forest LAI for an urban region (Fig. S6). Similar hotspots can be seen near Los Angeles in the inland chaparral regions. Large fluxes are also predicted in the foothill forest region of the Sierra Nevada, where there is a large LAI, and frequent occurrences of P. sabiniana, the tree having the largest Vd (Figs. S2 and S6). Relatively large fluxes occur in this region particularly during the nighttime.

Figure 8(a) Average midnight deposition fluxes of NO2 to forests in June throughout California. (b) Average midnight deposition lifetimes of NOx in June throughout California. White areas are non-forested areas.
Table 4Comparison of total conductance measurements with previous works.
a References refer to values in the reported max column.
b Study did not report value as a maximum stomatal conductance. The conductances shown are the maximum of the stomatal conductances reported in the cited study.
c Theoretical calculation.
The resulting lifetime of NO2 to deposition was calculated via Eq. (12):
where PBL is the planetary boundary layer height. The lifetimes to deposition during the day are shown in Fig. 7. In forested regions the lifetime to deposition is approximately 10 h. This relatively short lifetime may be especially consequential south of San Francisco Bay, where deposition could be competitive with the chemical sinks of HNO3 and RONO2 formation, which typically represent a lifetime to NOx loss of 2–11 h (e.g., Nunnermacker et al., 2000; Dillon et al., 2002; Alvarado et al., 2010; Valin et al., 2013; Romer et al., 2016; Laughner and Cohen, 2019).
The deposition fluxes and lifetimes to deposition during the night are shown in Fig. 8. With reduced deposition velocities at night, the nighttime deposition flux and the resulting total loss of NO2 to deposition is small. However, with a reduced boundary layer during the night, the lifetime of NOx to deposition at night is on the same order as the deposition lifetime during the day (10–100 h) and the overall NOx lifetime at night. This indicates this loss pathway may be an important nighttime sink of NOx from the atmosphere and may affect the nighttime chemical NOx sinks of alkyl nitrate formation and N2O5 chemistry (Brown et al., 2004, 2006; Crowley et al., 2010).
The estimations provided here are intended only to suggest qualitative indications of where NOx deposition may be important. Because we are ignoring effects of vertical transport and light attenuation through the canopy and because we are using maximum measured deposition velocities, the deposition reported here is likely to be an upper-bound estimate. We recommend areas where this estimated deposition is highest as regions that should be the subject of future field and large-scale modeling studies.
We present measurements assessing the relative effects of stomatal diffusion and mesophyllic processing of NO2 on the uptake rate of NO2. We find that the deposition velocity of NO2 is essentially equal to the stomatal conductance to NO2 under conditions of drought, excess soil nitrogen, variations in relative humidity, and during both the day and night. We find no evidence of any emission of NO2 from leaves. NO2 foliar exchange is thus unidirectional and variations are driven – from an atmospheric perspective – nearly entirely by the rate of diffusion through open stomata. This opens the possibility of using direct measurements of stomatal conductance – coupled with models and measurements of chemical transport, known relationships of the effects of environmental conditions on stomatal opening, measurements of canopy conductance – as well as indirect measurements, such as satellite solar-induced fluorescence data, to infer NOx foliar exchange. Additionally, we find significant differences in deposition velocities between species, reflecting differences in maximum stomatal conductance measurements that have been found by a number of previous studies (e.g., Ambrose et al., 2010; Maire et al., 2015; Henry et al., 2019; Murray et al., 2019). This diversity is not reflected in current atmospheric models and may have a meaningful impact on estimates of regional NOx fluxes and lifetimes. Our observations of stomatal opening in the absence of light also suggest foliar deposition may represent as much as 25 % of the total NOx loss at night, with stomatal deposition velocities as high as 0.038 cm s−1. These findings not only have important implications for NOx chemistry but are also relevant for the atmosphere–biosphere exchange of other gases, such as CO2 and biogenic volatile organic compounds.
The data collected in this study can be obtained from the authors upon request.
The supplement related to this article is available online at: https://doi.org/10.5194/acp-20-14023-2020-supplement.
ERD and BKP designed the experimental setup, and ERD, BKP, and AXL collected all NO2 exchange data. BKP and ERD designed methods and collected data for nitrogen fertilization experiments. ERD and AXL designed methods and collected data for drought stress experiments. ERD performed data analysis, with assistance from AXL. ERD prepared the paper in consultation with RCC. RCC supervised the project.
The authors declare that they have no conflict of interest.
We would like to thank Stephen Decina for his assistance in designing methods for soil ammonium and nitrate measurements. We would also like to acknowledge Robert Skelton for consultation on drought stressing trees and for allowing us to borrow a pressure chamber instrument for use in this study.
This research has been supported by the NOAA Climate Program Office's Atmospheric Chemistry, Carbon Cycle, and Climate Program (grant no. NA18OAR4310117) and the NSF Graduate Research Fellowship (grant no. DGE 1752814).
This paper was edited by Astrid Kiendler-Scharr and reviewed by two anonymous referees.
Almaraz, M., Bai, E., Wang, C., Trousdell, J., Conley, S., Faloona, I., and Houlton, B.: Agriculture is a major source of NOx pollution in California, Sci. Adv., 4, eaao3477, https://doi.org/10.1126/sciadv.aao3477, 2018. a
Alvarado, M. J., Logan, J. A., Mao, J., Apel, E., Riemer, D., Blake, D., Cohen, R. C., Min, K.-E., Perring, A. E., Browne, E. C., Wooldridge, P. J., Diskin, G. S., Sachse, G. W., Fuelberg, H., Sessions, W. R., Harrigan, D. L., Huey, G., Liao, J., Case-Hanks, A., Jimenez, J. L., Cubison, M. J., Vay, S. A., Weinheimer, A. J., Knapp, D. J., Montzka, D. D., Flocke, F. M., Pollack, I. B., Wennberg, P. O., Kurten, A., Crounse, J., Clair, J. M. St., Wisthaler, A., Mikoviny, T., Yantosca, R. M., Carouge, C. C., and Le Sager, P.: Nitrogen oxides and PAN in plumes from boreal fires during ARCTAS-B and their impact on ozone: an integrated analysis of aircraft and satellite observations, Atmos. Chem. Phys., 10, 9739–9760, https://doi.org/10.5194/acp-10-9739-2010, 2010. a
Ambrose, A. R., Sillett, S. C., Koch, G. W., Van Pelt, R., Antoine, M. E., and Dawson, T. E.: Effects of height on treetop transpiration and stomatal conductance in coast redwood (Sequoia sempervirens), Tree Physiol., 30, 1260–1272, https://doi.org/10.1093/treephys/tpq064, 2010. a, b
Ammann, M., von Ballmoos, P., Stalder, M., Suter, M., and Brunold, C.: Uptake and assimilation of atmospheric NO2–N by spruce needles (Picea abies): A field study, Water Air Soil Pollut., 85, 1497–1502, https://doi.org/10.1007/BF00477193, 1995. a
Amnuaylojaroen, T., Barth, M. C., Emmons, L. K., Carmichael, G. R., Kreasuwun, J., Prasitwattanaseree, S., and Chantara, S.: Effect of different emission inventories on modeled ozone and carbon monoxide in Southeast Asia, Atmos. Chem. Phys., 14, 12983–13012, https://doi.org/10.5194/acp-14-12983-2014, 2014. a
Andrews, M.: The partitioning of nitrate assimilation between root and shoot of higher plants, Plant Cell Environ., 9, 511–519, https://doi.org/10.1111/1365-3040.ep11616228, 1986. a
Arango-Velez, A., El Kayal, W., Copeland, C. C. J., Zaharia, L. I., Lusebrink, I., and Cooke, J. E. K.: Differences in defence responses of Pinus contorta and Pinus banksiana to the mountain pine beetle fungal associate Grosmannia clavigera are affected by water deficit, Plant Cell Environ., 39, 726–744, https://doi.org/10.1111/pce.12615, 2016. a
Bahrun, A., Jensen, C. R., Asch, F., and Mogensen, V. O.: Drought-induced changes in xylem pH, ionic composition, and ABA concentration act as early signals in field-grown maize (Zea mays L.), J. Exp. Bot., 53, 251–263, https://doi.org/10.1093/jexbot/53.367.251, 2002. a
Baldocchi, D. D., Hicks, B. B., and Camara, P.: A canopy stomatal resistance model for gaseous deposition to vegetated surfaces, Atmos. Environ. (1967), 21, 91–101, https://doi.org/10.1016/0004-6981(87)90274-5, 1987. a
Bechtold, William A.; Patterson, P. L.: The enhanced forest inventory and analysis program - national sampling design and estimation procedures, Gen. tech. rep., US Department of Agriculture, Forest Service, Southern Research Station, Asheville, NC, https://doi.org/10.2737/SRS-GTR-80, 2005. a
Breuninger, C., Oswald, R., Kesselmeier, J., and Meixner, F. X.: The dynamic chamber method: trace gas exchange fluxes (NO, NO2, O3) between plants and the atmosphere in the laboratory and in the field, Atmos. Meas. Tech., 5, 955–989, https://doi.org/10.5194/amt-5-955-2012, 2012. a
Breuninger, C., Meixner, F. X., and Kesselmeier, J.: Field investigations of nitrogen dioxide (NO2) exchange between plants and the atmosphere, Atmos. Chem. Phys., 13, 773–790, https://doi.org/10.5194/acp-13-773-2013, 2013. a, b, c, d
Brown, S. S., Dibb, J. E., Stark, H., Aldener, M., Vozella, M., Whitlow, S., Williams, E. J., Lerner, B. M., Jakoubek, R., Middlebrook, A. M., DeGouw, J. A., Warneke, C., Goldan, P. D., Kuster, W. C., Angevine, W. M., Sueper, D. T., Quinn, P. K., Bates, T. S., Meagher, J. F., Fehsenfeld, F. C., and Ravishankara, A. R.: Nighttime removal of NOx in the summer marine boundary layer, Geophys. Res. Lett., 31, L07108, https://doi.org/10.1029/2004GL019412, 2004. a
Brown, S. S., Ryerson, T. B., Wollny, A. G., Brock, C. A., Peltier, R., Sullivan, A. P., Weber, R. J., Dubé, W. P., Trainer, M., Meagher, J. F., Fehsenfeld, F. C., and Ravishankara, A. R.: Variability in Nocturnal Nitrogen Oxide Processing and Its Role in Regional Air Quality, Science, 311, 67–70, https://doi.org/10.1126/science.1120120, 2006. a
Cantrell, C. A., Davidson, J. A., Busarow, K. L., and Calvert, J. G.: The CH3CHO-NO3 reaction and possible nighttime PAN generation, J. Geophys. Res.-Atmos., 91, 5347–5353, https://doi.org/10.1029/JD091iD05p05347, 1986. a
Chaparro-Suarez, I., Meixner, F., and Kesselmeier, J.: Nitrogen dioxide (NO2) uptake by vegetation controlled by atmospheric concentrations and plant stomatal aperture, Atmos. Environ., 45, 5742–5750, https://doi.org/10.1016/j.atmosenv.2011.07.021, 2011. a, b, c, d, e
Chen, J., Wu, F.-H., Liu, T.-W., Chen, L., Xiao, Q., Dong, X.-J., He, J.-X., Pei, Z.-M., and Zheng, H.-L.: Emissions of nitric oxide from 79 plant species in response to simulated nitrogen deposition, Environ. Pollut., 160, 192–200, https://doi.org/10.1016/j.envpol.2011.09.007, 2012. a, b
Crowley, J. N., Schuster, G., Pouvesle, N., Parchatka, U., Fischer, H., Bonn, B., Bingemer, H., and Lelieveld, J.: Nocturnal nitrogen oxides at a rural mountain-site in south-western Germany, Atmos. Chem. Phys., 10, 2795–2812, https://doi.org/10.5194/acp-10-2795-2010, 2010. a
Crowley, J. N., Pouvesle, N., Phillips, G. J., Axinte, R., Fischer, H., Petäjä, T., Nölscher, A., Williams, J., Hens, K., Harder, H., Martinez-Harder, M., Novelli, A., Kubistin, D., Bohn, B., and Lelieveld, J.: Insights into HOx and ROx chemistry in the boreal forest via measurement of peroxyacetic acid, peroxyacetic nitric anhydride (PAN) and hydrogen peroxide, Atmos. Chem. Phys., 18, 13457–13479, https://doi.org/10.5194/acp-18-13457-2018, 2018. a
Crutzen, P. J.: The Role of NO and NO2 in the Chemistry of the Troposphere and Stratosphere, Annu. Rev. Earth Planet. Sci., 7, 443–472, https://doi.org/10.1146/annurev.ea.07.050179.002303, 1979. a
Datta, N., Rao, L., Guha-Mukherjee, S., and Sopory, S. K.: Regulation of nitrate reductase activity by ammonium in wheat, Plant Sci. Lett., 20, 305–313, https://doi.org/10.1016/0304-4211(81)90245-5, 1981. a
Dawson, T. E., Burgess, S. S. O., Tu, K. P., Oliveira, R. S., Santiago, L. S., Fisher, J. B., Simonin, K. A., and Ambrose, A. R.: Nighttime transpiration in woody plants from contrasting ecosystems, Tree Physiol., 27, 561–575, https://doi.org/10.1093/treephys/27.4.561, 2007. a, b
Decina, S. M., Templer, P. H., Hutyra, L. R., Gately, C. K., and Rao, P.: Variability, drivers, and effects of atmospheric nitrogen inputs across an urban area: Emerging patterns among human activities, the atmosphere, and soils, Sci. Total Environ., 609, 1524–1534, https://doi.org/10.1016/j.scitotenv.2017.07.166, 2017. a
Delaria, E. R. and Cohen, R. C.: A model-based analysis of foliar NOx deposition, Atmos. Chem. Phys., 20, 2123–2141, https://doi.org/10.5194/acp-20-2123-2020, 2020. a
Delaria, E. R., Vieira, M., Cremieux, J., and Cohen, R. C.: Measurements of NO and NO2 exchange between the atmosphere and Quercus agrifolia, Atmos. Chem. Phys., 18, 14161–14173, https://doi.org/10.5194/acp-18-14161-2018, 2018. a, b, c, d, e, f, g, h, i, j
Dillon, M. B., Lamanna, M. S., Schade, G. W., Goldstein, A. H., and Cohen, R. C.: Chemical evolution of the Sacramento urban plume: Transport and oxidation, J. Geophys. Res.-Atmos., 107, ACH 3–1–ACH 3–15, https://doi.org/10.1029/2001JD000969, 2002. a
Drake, P. L., Froend, R. H., and Franks, P. J.: Smaller, faster stomata: scaling of stomatal size, rate of response, and stomatal conductance, J. Exp. Bot., 64, 495–505, https://doi.org/10.1093/jxb/ers347, 2013. a, b
Eller, A. and Sparks, J.: Predicting leaf-level fluxes of O3 and NO2: The relative roles of diffusion and biochemical processes, Plant Cell Environ., 29, 1742–1750, https://doi.org/10.1111/j.1365-3040.2006.01546.x, 2006. a
Fast, J. D., Allan, J., Bahreini, R., Craven, J., Emmons, L., Ferrare, R., Hayes, P. L., Hodzic, A., Holloway, J., Hostetler, C., Jimenez, J. L., Jonsson, H., Liu, S., Liu, Y., Metcalf, A., Middlebrook, A., Nowak, J., Pekour, M., Perring, A., Russell, L., Sedlacek, A., Seinfeld, J., Setyan, A., Shilling, J., Shrivastava, M., Springston, S., Song, C., Subramanian, R., Taylor, J. W., Vinoj, V., Yang, Q., Zaveri, R. A., and Zhang, Q.: Modeling regional aerosol and aerosol precursor variability over California and its sensitivity to emissions and long-range transport during the 2010 CalNex and CARES campaigns, Atmos. Chem. Phys., 14, 10013–10060, https://doi.org/10.5194/acp-14-10013-2014, 2014. a
Fisher, J. B., Baldocchi, D. D., Misson, L., Dawson, T. E., and Goldstein, A. H.: What the towers don't see at night: nocturnal sap flow in trees and shrubs at two AmeriFlux sites in California, Tree Physiol., 27, 597–610, https://doi.org/10.1093/treephys/27.4.597, 2007. a
Forest Inventory and Analysis: The Forest Inventory and Analysis Database: Database description and user guide version 6.0.1 for Phase 3, available at: http://www.fia.fs.fed.us/library/database-documentation/ (last access: 18 February 2020), 2014. a
Grantz, D. A., Linscheid, B. S., and Grulke, N. E.: Differential responses of stomatal kinetics and steady-state conductance to abscisic acid in a fern: comparison with a gymnosperm and an angiosperm, New Phytol., 222, 1883–1892, https://doi.org/10.1111/nph.15736, 2019. a, b
Gut, A., Scheibe, M., Rottenberger, S., Rummel, U., Welling, M., Ammann, C., Kirkman, G. A., Kuhn, U., Meixner, F. X., Kesselmeier, J., Lehmann, B. E., Schmidt, W., Müller, E., and Piedade, M. T. F.: Exchange fluxes of NO2 and O3 at soil and leaf surfaces in an Amazonian rain forest, J. Geophys. Res.-Atmos., 107, LBA 27–1–LBA 27–15, https://doi.org/10.1029/2001JD000654, 2002. a
Hari, P., Raivonen, M., Vesala, T., Munger, J., Pilegaard, K., and Kulmala, M.: Ultraviolet light and leaf emission of NOx, Nature, 422, 134–134, https://doi.org/10.1038/422134a, 2003. a
Heidari, B., Matre, P., Nemie-Feyissa, D., Meyer, C., Rognli, O. A., Møller, S. G., and Lillo, C.: Protein Phosphatase 2A B55 and A Regulatory Subunits Interact with Nitrate Reductase and Are Essential for Nitrate Reductase Activation, Plant Physiol., 156, 165–172, https://doi.org/10.1104/pp.111.172734, 2011. a
Henry, C. L., John, G. P., Pan, R., Bartlett, M. K., Fletcher, L. R., Scoffoni, C., and Sack, L.: A stomatal safety-efficiency trade-off constrains responses to leaf dehydration, Nat. Commun., 10, 3398, https://doi.org/10.1038/s41467-019-11006-1, 2019. a, b, c
Hereid, D. and Monson, R.: Nitrogen Oxide Fluxes between Corn (Zea mays L.) Leaves and the Atmosphere, Atmos. Environ., 35, 975–983, https://doi.org/10.1016/S1352-2310(00)00342-3, 2001. a, b
Jacob, D. J. and Wofsy, S. C.: Budgets of reactive nitrogen, hydrocarbons, and ozone over the Amazon forest during the wet season, J. Geophys. Res.-Atmos., 95, 16737–16754, https://doi.org/10.1029/JD095iD10p16737, 1990. a, b
Joensuu, J., Raivonen, M., Kieloaho, A.-J., Altimir, N., Kolari, P., Sarjala, T., and Bäck, J.: Does nitrate fertilization induce NOx emission from scots pine (p. sylvestris) shoots?, Plant Soil, 388, 283–295, https://doi.org/10.1007/s11104-014-2328-x, 2014. a, b, c, d
Johansson, C.: Pine forest: a negligible sink for atmospheric NOx in rural Sweden, Tellus B, 39, 426–438, https://doi.org/10.1111/j.1600-0889.1987.tb00204.x, 1987. a
Kenagy, H. S., Sparks, T. L., Ebben, C. J., Wooldrige, P. J., Lopez-Hilfiker, F. D., Lee, B. H., Thornton, J. A., McDuffie, E. E., Fibiger, D. L., Brown, S. S., Montzka, D. D., Weinheimer, A. J., Schroder, J. C., Campuzano-Jost, P., Day, D. A., Jimenez, J. L., Dibb, J. E., Campos, T., Shah, V., Jaeglé, L., and Cohen, R. C.: NOx Lifetime and NOy Partitioning During WINTER, J. Geophys. Res.-Atmos., 123, 9813–9827, https://doi.org/10.1029/2018JD028736, 2018. a
Kolb, P. and Robberecht, R.: High temperature and drought stress effects on survival of Pinus ponderosa seedlings, Tree Physiol., 16, 665–72, https://doi.org/10.1093/treephys/16.8.665, 1996. a, b
Kottek, M., Grieser, J., Beck, C., Rudolf, B., and Rubel, F.: World Map of the Köppen-Geiger Climate Classification Updated, Meteorol. Z., 15, 259–263, https://doi.org/10.1127/0941-2948/2006/0130, 2006. a
Laughner, J. L. and Cohen, R. C.: Direct observation of changing NOx lifetime in North American cities, Science, 366, 723–727, https://doi.org/10.1126/science.aax6832, 2019. a
Laughner, J. L., Zhu, Q., and Cohen, R. C.: Evaluation of version 3.0B of the BEHR OMI NO2 product, Atmos. Meas. Tech., 12, 129–146, https://doi.org/10.5194/amt-12-129-2019, 2019. a
Lerdau, M. T., Munger, J. W., and Jacob, D. J.: The NO2 Flux Conundrum, Science, 289, 2291–2293, https://doi.org/10.1126/science.289.5488.2291, 2000. a
Lillo, C.: Signalling cascades integrating light-enhanced nitrate metabolism, Biochem. J., 415, 11–19, https://doi.org/10.1042/BJ20081115, 2008. a
Maherali, H. and DeLucia, E. H.: Xylem conductivity and vulnerability to cavitation of ponderosa pine growing in contrasting climates, Tree Physiol., 20, 859–867, https://doi.org/10.1093/treephys/20.13.859, 2000. a, b
Maire, V., Wright, I. J., Prentice, I. C., Batjes, N. H., Bhaskar, R., van Bodegom, P. M., Cornwell, W. K., Ellsworth, D., Niinemets, l., Ordonez, A., Reich, P. B., and Santiago, L. S.: Global effects of soil and climate on leaf photosynthetic traits and rates, Global Ecol. Biogeogr., 24, 706–717, https://doi.org/10.1111/geb.12296, 2015. a, b, c, d, e, f
Manter, D. and Kavanagh, K.: Stomatal regulation in Douglas fir following a fungal-mediated chronic reduction in leaf area, Trees, 17, 485–491, https://doi.org/10.1007/s00468-003-0262-2, 2003. a
Manter, D., Bond, B., Kavanagh, K., Rosso, P., and Filip, G.: Pseudothecia of Swiss needle cast fungus, Phaeocryptopus gaeumannii, physically block stomata of Douglas fir, reducing CO2 assimilation, New Phytol., 148, 481–491, https://doi.org/10.1046/j.1469-8137.2000.00779.x, 2000. a
Massman, W.: A review of the molecular diffusivities of H2O, CO2, CH4, CO, O3, SO2, NH3, N2O, NO, and NO2 in air, O2 and N2 near STP, Atmos. Environ., 32, 1111–1127, https://doi.org/10.1016/S1352-2310(97)00391-9, 1998. a
Matzner, S., Rice, K., and Richards, J.: Patterns of stomatal conductance among blue oak (Quercus douglasii) size classes and populations: Implications for seedling establishment, Tree Physiol., 23, 777–84, https://doi.org/10.1093/treephys/23.11.777, 2003. a, b
McCarty, G. and Bremner, J.: Regulation of assimilatory nitrate reductase activity in soil by microbial assimilation of ammonium, P. Natl. Acad. Sci. USA, 89, 453–456, https://doi.org/10.1073/pnas.89.2.453, 1992. a
Murray, M., Soh, W. K., Yiotis, C., Batke, S., Parnell, A. C., Spicer, R. A., Lawson, T., Caballero, R., Wright, I. J., Purcell, C., and McElwain, J. C.: Convergence in Maximum Stomatal Conductance of C3 Woody Angiosperms in Natural Ecosystems Across Bioclimatic Zones, Front. Plant Sci., 10, 558, https://doi.org/10.3389/fpls.2019.00558, 2019. a, b, c, d
Musselman, R. C. and Minnick, T. J.: Nocturnal stomatal conductance and ambient air quality standards for ozone, Atmos. Environ., 34, 719–733, https://doi.org/10.1016/S1352-2310(99)00355-6, 2000. a
Myneni, R., Knyazikhin, Y., and Park, T.: MCD15A2H MODIS/Terra+Aqua Leaf Area Index/FPAR 8-day L4 Global 500m SIN Grid V006 [Data set], NASA EOSDIS Land Processes DAAC, available at: https://doi.org/10.5067/MODIS/MCD15A2H.006 (last access: 30 June 2020), 2015. a
Ng, N. L., Brown, S. S., Archibald, A. T., Atlas, E., Cohen, R. C., Crowley, J. N., Day, D. A., Donahue, N. M., Fry, J. L., Fuchs, H., Griffin, R. J., Guzman, M. I., Herrmann, H., Hodzic, A., Iinuma, Y., Jimenez, J. L., Kiendler-Scharr, A., Lee, B. H., Luecken, D. J., Mao, J., McLaren, R., Mutzel, A., Osthoff, H. D., Ouyang, B., Picquet-Varrault, B., Platt, U., Pye, H. O. T., Rudich, Y., Schwantes, R. H., Shiraiwa, M., Stutz, J., Thornton, J. A., Tilgner, A., Williams, B. J., and Zaveri, R. A.: Nitrate radicals and biogenic volatile organic compounds: oxidation, mechanisms, and organic aerosol, Atmos. Chem. Phys., 17, 2103–2162, https://doi.org/10.5194/acp-17-2103-2017, 2017. a
Nunnermacker, L. J., Kleinman, L. I., Imre, D., Daum, P. H., Lee, Y.-N., Lee, J. H., Springston, S. R., Newman, L., and Gillani, N.: NOy lifetimes and O3 production efficiencies in urban and power plant plumes: Analysis of field data, J. Geophys. Res.-Atmos., 105, 9165–9176, https://doi.org/10.1029/1999JD900753, 2000. a
Okano, K. and Totsuka, T.: Absorption of nitrogen dioxide by sunflower plants grown at various levels of nitrate, New Phytol., 102, 551–562, https://doi.org/10.1111/j.1469-8137.1986.tb00831.x, 1986. a, b
Pape, L., Ammann, C., Nyfeler-Brunner, A., Spirig, C., Hens, K., and Meixner, F. X.: An automated dynamic chamber system for surface exchange measurement of non-reactive and reactive trace gases of grassland ecosystems, Biogeosciences, 6, 405–429, https://doi.org/10.5194/bg-6-405-2009, 2009. a, b
Park, J. Y. and Lee, Y. N.: Solubility and decomposition kinetics of nitrous acid in aqueous solution, J. Phys. Chem., 92, 6294–6302, https://doi.org/10.1021/j100333a025, 1988. a
Perring, A. E., Wisthaler, A., Graus, M., Wooldridge, P. J., Lockwood, A. L., Mielke, L. H., Shepson, P. B., Hansel, A., and Cohen, R. C.: A product study of the isoprene+NO3 reaction, Atmos. Chem. Phys., 9, 4945–4956, https://doi.org/10.5194/acp-9-4945-2009, 2009. a, b
Pharis, R.: Comparative Drought Resistance of Five Conifers and Foliage Moisture Content as a Viability Index, Ecology, 47, 211, https://doi.org/10.2307/1933767, 1966. a, b
Pietilainen, P. and Lahdesmaki, P.: Effect of various concentrations of potassium nitrate and ammonium sulphate on nitrate reductase activity in the roots and needles of Scots pine seedlings in N Finland, Ann. Bot. Fennici, 25, 201–206, 1988. a
Place, B. K., Delaria, E. R., Liu, A. X., and Cohen, R. C.: Leaf Stomatal Control over Acyl Peroxynitrate Dry Deposition to Trees, ACS Earth and Space Chemistry, https://doi.org/10.1021/acsearthspacechem.0c00152, 2020. a, b
Raivonen, M., Bonn, B., Sanz, M. J., Vesala, T., Kulmala, M., and Hari, P.: UV-induced NOy emissions from Scots pine: Could they originate from photolysis of deposited HNO3?, Atmos. Environ., 40, 6201–6213, https://doi.org/10.1016/j.atmosenv.2006.03.063, 2006. a
Ramge, P., Badeck, F.-W., Plochl, M., and Kohlmaier, G. H.: Apoplastic antioxidants as decisive elimination factors within the uptake process of nitrogen dioxide into leaf tissues, New Phytol., 125, 771–785, https://doi.org/10.1111/j.1469-8137.1993.tb03927.x, 1993. a
Rogers, H. H., Jeffries, H. E., and Witherspoon, A. M.: Measuring Air Pollutant Uptake by Plants: Nitrogen Dioxide, J. Environ. Qual., 8, 551–557, https://doi.org/10.2134/jeq1979.00472425000800040022x, 1979. a
Romer, P. S., Duffey, K. C., Wooldridge, P. J., Allen, H. M., Ayres, B. R., Brown, S. S., Brune, W. H., Crounse, J. D., de Gouw, J., Draper, D. C., Feiner, P. A., Fry, J. L., Goldstein, A. H., Koss, A., Misztal, P. K., Nguyen, T. B., Olson, K., Teng, A. P., Wennberg, P. O., Wild, R. J., Zhang, L., and Cohen, R. C.: The lifetime of nitrogen oxides in an isoprene-dominated forest, Atmos. Chem. Phys., 16, 7623–7637, https://doi.org/10.5194/acp-16-7623-2016, 2016. a
Romer, P. S., Duffey, K. C., Wooldridge, P. J., Edgerton, E., Baumann, K., Feiner, P. A., Miller, D. O., Brune, W. H., Koss, A. R., de Gouw, J. A., Misztal, P. K., Goldstein, A. H., and Cohen, R. C.: Effects of temperature-dependent NOx emissions on continental ozone production, Atmos. Chem. Phys., 18, 2601–2614, https://doi.org/10.5194/acp-18-2601-2018, 2018. a
Rondón, A. and Granat, L.: Studies on the dry deposition of NO2 to coniferous species at low NO2 concentrations, Tellus B, 46, 339–352, https://doi.org/10.3402/tellusb.v46i5.15809, 1994. a
Russell, A. G., Cass, G. R., and Seinfeld, J. H.: On some aspects of nighttime atmospheric chemistry, Env. Sci. Technol., 20, 1167–1172, https://doi.org/10.1021/es00153a013, 1986. a
Sarjala, T.: Effect of mycorrhiza and nitrate nutrition on nitrate reductase activity in Scots pine seedlings, Physiol. Plantarum, 81, 89–94, https://doi.org/10.1111/j.1399-3054.1991.tb01718.x, 1991. a
Schneider, C. A., Rasband, W. S., and Eliceiri, K. W.: A Preliminary multiple resistance routine for deriving dry deposition velocities from measured quantities, Nat. Meth., 9, 671–675, https://doi.org/10.1038/nmeth.2089, 2012. a
Seinfeld, J. and Pandis, S.: Atmospheric Chemistry and Physics: From Air Pollution to Climate Change, 2nd ed., Wiley-Interscience, Hoboken, NJ, 2006. a, b
Sims, G. K., Ellsworth, T. R., and Mulvaney, R. L.: Microscale determination of inorganic nitrogen in water and soil extracts, Commun. Soil Sci. Plant Anal., 26, 303–316, https://doi.org/10.1080/00103629509369298, 1995. a
Skamarock, W. C., Klemp, J. B., Dudhia, J., Gill, D. O., Barker, D., Duda, M. G., Huang, X.-Y., Wang, W., and Powers, J. G.: A Description of the Advanced Research WRF Version 3, Tech. rep., National Center for Atmospheric Res., Boulder, CO, https://doi.org/10.5065/D68S4MVH, 2008. a
Sparks, J., Monson, R., Sparks, K., and Lerdau, M.: Leaf uptake of nitrogen dioxide (NO2) in a tropical wet forest: Implications for tropospheric chemistry, Oecologia, 127, 214–221, https://doi.org/10.1007/s004420000594, 2001. a, b
Sparks, J. P., Roberts, J. M., and Monson, R. K.: The uptake of gaseous organic nitrogen by leaves: A significant global nitrogen transfer process, Geophys. Res. Lett., 30, 2189, https://doi.org/10.1029/2003GL018578, 2003. a
Stavrakou, T., Müller, J.-F., Boersma, K. F., van der A, R. J., Kurokawa, J., Ohara, T., and Zhang, Q.: Key chemical NOx sink uncertainties and how they influence top-down emissions of nitrogen oxides, Atmos. Chem. Phys., 13, 9057–9082, https://doi.org/10.5194/acp-13-9057-2013, 2013. a
Sun, S., Moravek, A., Trebs, I., Kesselmeier, J., and Sörgel, M.: Investigation of the influence of liquid surface films on O3 and PAN deposition to plant leaves coated with organic/inorganic solution, J. Geophys. Res.-Atmos., 121, 14239–14256, https://doi.org/10.1002/2016JD025519, 2016. a
Teklemmariam, T. and Sparks, J.: Leaf fluxes of NO and NO2 in four herbaceous plant species: The role of ascorbic acid, Atmos. Environ., 40, 2235–2244, https://doi.org/10.1016/j.atmosenv.2005.12.010, 2006. a, b, c, d, e, f, g, h, i
Thornton, J. A., Wooldridge, P. J., and Cohen, R. C.: Atmospheric NO2: In Situ Laser-Induced Fluorescence Detection at Parts per Trillion Mixing Ratios, Anal. Chem., 72, 528–539, https://doi.org/10.1021/ac9908905, 2000. a
Tischner, R.: Nitrate uptake and reduction in higher and lower plants, Plant Cell Environ., 23, 1005–1024, https://doi.org/10.1046/j.1365-3040.2000.00595.x, 2000. a
Turner, A. J., Köhler, P., Magney, T. S., Frankenberg, C., Fung, I., and Cohen, R. C.: A double peak in the seasonality of California's photosynthesis as observed from space, Biogeosciences, 17, 405–422, https://doi.org/10.5194/bg-17-405-2020, 2020. a
Turnipseed, A. A., Huey, L. G., Nemitz, E., Stickel, R., Higgs, J., Tanner, D. J., Slusher, D. L., Sparks, J. P., Flocke, F., and Guenther, A.: Eddy covariance fluxes of peroxyacetyl nitrates (PANs) and NOy to a coniferous forest, J. Geophys. Res.-Atmos., 111, D09304, https://doi.org/10.1029/2005JD006631, 2006. a
Valin, L. C., Russell, A. R., and Cohen, R. C.: Variations of OH radical in an urban plume inferred from NO2 column measurements, Geophys. Res. Lett., 40, 1856–1860, https://doi.org/10.1002/grl.50267, 2013. a
von Caemmerer, S. and Farquhar, G. D.: Some relationships between the biochemistry of photosynthesis and the gas exchange of leaves, Planta, 153, 376–387, https://doi.org/10.1007/BF00384257, 1981. a, b
Wolfe, G. M., Thornton, J. A., Yatavelli, R. L. N., McKay, M., Goldstein, A. H., LaFranchi, B., Min, K.-E., and Cohen, R. C.: Eddy covariance fluxes of acyl peroxy nitrates (PAN, PPN and MPAN) above a Ponderosa pine forest, Atmos. Chem. Phys., 9, 615–634, https://doi.org/10.5194/acp-9-615-2009, 2009. a
Woodin, S., PRESS, M., and Lee, J.: Nitrate reductase activity in Sphagnum fuscum in relation to atmospheric nitrate deposition, New Phytol., 99, 381–388, https://doi.org/10.1111/j.1469-8137.1985.tb03666.x, 2006. a
Yang, L., Jin, S., Danielson, P., Homer, C., Gass, L., Bender, S. M., Case, A., Costello, C., Dewitz, J., Fry, J., Funk, M., Granneman, B., Liknes, G. C., Rigge, M., and Xian, G.: A new generation of the United States National Land Cover Database: Requirements, research priorities, design, and implementation strategies, ISPRS J. Photogramm. Remote S., 146, 108–123, https://doi.org/10.1016/j.isprsjprs.2018.09.006, 2018. a
Zhang, L., Moran, M., Makar, P., Brook, J., and Gong, S.: Modelling gaseous dry deposition in AURAMS – A Unified Regional Air-quality Modelling System, Atmos. Environ., 36, 537–560, https://doi.org/10.1016/S1352-2310(01)00447-2, 2002. a