the Creative Commons Attribution 4.0 License.
the Creative Commons Attribution 4.0 License.
 | 16 Nov 2020
Ozone affected by a succession of four landfall typhoons in the Yangtze River Delta, China: major processes and health impacts
Chenchao Zhan
Chongwu Huang
Jane Liu
Tijian Wang
Meng Xu
Chaoqun Ma
Jianwei Yu
Yumeng Jiao
Mengmeng Li
Shu Li
Bingliang Zhuang
Ming Zhao
Dongyang Nie
Landfall typhoons can significantly affect O3 in the Yangtze River Delta (YRD) region. In this study, we investigate a unique case characterized by two multiday regional O3 pollution episodes related to four successive landfall typhoons in the summer of 2018 in the YRD. The results show that O3 pollution episodes mainly occurred during the period from the end of a typhoon to the arrival of the next typhoon. The time when a typhoon reached the 24 h warning line and the time when the typhoon dies away in mainland China can be roughly regarded as time nodes. Meanwhile, the variations of O3 were related to the track, duration and landing intensity of the typhoons. The impact of typhoons on O3 was like a wave superimposed on the background of high O3 concentration in the YRD in summer. When a typhoon was near the 24 h warning line before it landed on the coastline of the YRD, the prevailing wind originally from the ocean changed to be from inland, and it transported lots of precursors from the polluted areas to the YRD. Under influences of the typhoon, the low temperature, strong upward airflows, more precipitation and wild wind hindered occurrences of high O3 episodes. After the passing of the typhoon, the air below the 700 hPa atmospheric layer was warm and dry, and the downward airflows resumed. The low troposphere was filed with high concentration of O3 due to O3-rich air transported from the low stratosphere and strong photochemical reactions. It is noteworthy that O3 was mainly generated in the middle of the boundary layer (∼ 1000 m) instead of at the surface. High O3 levels remained in the residual layer at night, and would be transported to the surface by downward airflows or turbulence by the second day. Moreover, O3 can be accumulated and trapped on the ground due to the poor diffusion conditions because the vertical diffusion and horizontal diffusion were suppressed by downward airflows and light wind, respectively. The premature deaths attributed to O3 exposure in the YRD during the study period were 194.0, more than the casualties caused directly by the typhoons. This work has enhanced our understanding of how landfall typhoons affect O3 in the YRD and thus can be useful in forecasting O3 pollution in regions strongly influenced by typhoon activities.
- Article
(22480 KB) - Full-text XML
-
Supplement
(1972 KB) - BibTeX
- EndNote


The tropospheric ozone (O3) which is formed by a series of complex photochemical reactions between volatile organic compounds (VOCs) and nitrogen oxides (NOx = NO + NO2) in combination with sunlight (Chameides and Walker, 1973; Xie et al., 2014) has received continuous attention due to its negative impact on air quality (Chan and Yao, 2008; Monks et al., 2015), human health (Jerrett et al., 2009), climate (Allen et al., 2012) and the biosphere (Van Dingenen et al., 2009). Research on urban O3 pollution can be dated back to the early 1950s, beginning with Los Angeles smog. In China, the photochemical smog, which is characterized by a high level of O3, was first discovered in the Xigu district of Lanzhou in the 1970s (Tang et al., 1989). However, as the key atmospheric environmental problem was coal-smoke pollution (such as acid rain) at that time (Wang et al., 2019), little systematic research and coordinated O3 monitoring were performed in China until the mid-2000s (Wang et al., 2017).
Since the beginning of the 21st century, the complex air pollution, which is dominated by fine particulate matter (PM2.5, particles of 2.5 µm or less in aerodynamic diameter) and surface O3, has been ingrained in the megacities of China (Chan and Yao, 2008; Jin et al., 2016; Kan et al., 2012). Air pollution has evolved into a political and economic concern in China. Due to strict air pollution control since 2013, particle pollution has been greatly reduced, demonstrated by a significant decrease in sulfur dioxide (SO2), NOx and PM2.5. However, the concentrations of O3 and VOCs have increased from 2013 to 2017 (M. Li et al., 2017), suggesting that more attention should be paid to controlling O3 and VOCs in the future. Overall, the causes of air pollution in China are remaining challenges to confront, especially in understanding the sources, transport and dispersion processes, and chemical formation mechanisms of O3 and its precursors (Ding et al., 2016; Guo et al., 2014; Huang et al., 2014).
A typhoon (tropical cyclone, TC) is one of the most severe natural disasters in East Asia. Out of the total provinces in China, 10 coastal and 6 island provinces are affected by typhoon-induced disasters, with more than 250 million lives being affected (Liu et al., 2009). The average number of typhoons making landfall in China is nine each year, and those typhoons usually inflict vast losses in human life and property due to the accompanied strong wind, torrential rains and huge storm surges (Zhang et al., 2009; Zhao et al., 2012). Because of the long lifetime and tremendous energy, typhoons can significantly impact local atmospheric conditions and thereby can affect surface O3 concentration through advection, diffusion, deposition and other processes. The impact of typhoons on O3 has attracted extensive attention in recent years (Deng et al., 2019; Huang et al., 2005; Jiang et al., 2015; Shu et al., 2016; Wang and Kwok, 2003; Wei et al., 2016; Yang et al., 2012). For example, Deng et al. (2019) reported that high O3 and high aerosol concentrations (double high episodes) are likely to occur when the Pearl River Delta is under the control of the typhoon periphery and the subtropical high with strong downdrafts. Previous studies were mainly in southern China (including Hong Kong and Taiwan) where typhoons occur frequently. Still, research on the impact of landfall typhoons on O3 is rather limited.
The Yangtze River Delta (YRD) region, being one of the most developed and densely populated regions in China, is located on the western coast of the Pacific Ocean. With 3.7 % of the area and 16.0 % of the population of China, the YRD contributed over 20 % of the national total gross domestic product (GDP) in 2019. Due to the rapid economic development and high energy consumption, this region has been suffering from intense air pollution (Ding et al., 2013; Li et al., 2019; Wang et al., 2015; Xie et al., 2016a, 2017). In 2017, the 90th percentile of the maximum daily 8 h average (MDA8) O3 concentration was 170 µg m−3, and 16 of the 26 cities (Fig. 1b) in the YRD failed to meet national standards (http://allaboutair.cn/a/reports/2018/1227/526.html, last access: 10 November 2020). Therefore, it is urgent to investigate the spatiotemporal characteristics of O3, as well as its formation mechanisms, in the YRD. Influenced by the monsoon weather, the warm and stagnation conditions play an important role in the occurrence of high-level O3 concentrations in summer (Li et al., 2018; Liao et al., 2015; Lu et al., 2018; Zhao et al., 2010). Synoptic weather systems, such as typhoons and cold fronts, can significantly impact O3 in the YRD (Hu et al., 2016; Shu et al., 2016). This work aims to reveal the main processes of landfall typhoons affecting surface O3 in the YRD, to fill the knowledge gap and thus to provide scientific insight for effective pollution control measures.
In this study, we report a typical case observed in the YRD during the period from 16 July to 25 August 2018, during which a multiday episode of high O3 occurred and was found to be related to four successive landfall typhoons. Based on the monitoring data and numerical simulation, we explore the impact of landfall typhoons on O3 in the YRD, including the major processes and health impacts. The following part of this paper is structured as follows. Section 2 gives a brief description of monitoring data, the analysis methods and model configurations. The results and the discussion are detailed in Sect. 3. Section 4 summarizes the main conclusions.
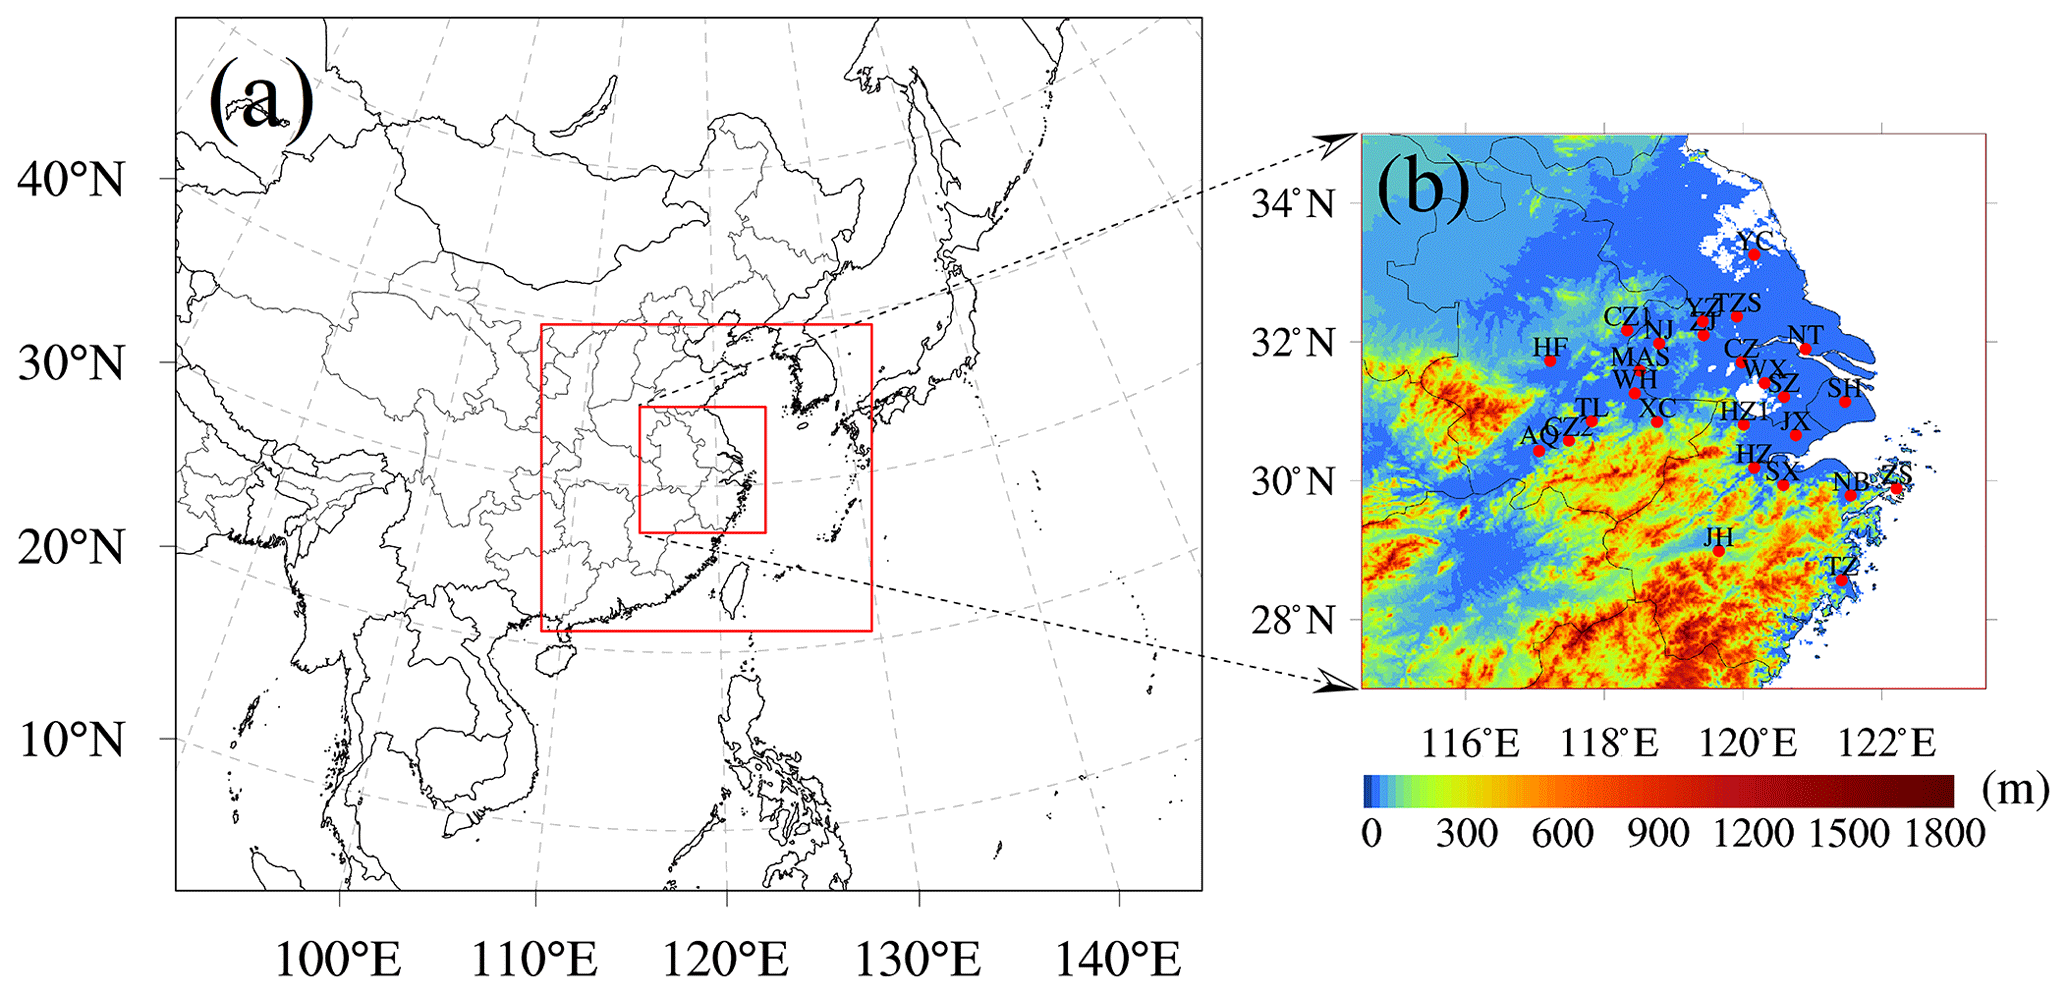
Figure 1The three nested modeling domains (a) in the WRF model, and the locations of 26 cities in the YRD with terrain elevation data (b). The cities in (b) include: Nanjing (NJ), Wuxi (WX), Changzhou (CZ), Suzhou (SZ), Nantong (NT), Yancheng (YC), Yangzhou (YZ), Zhenjiang (ZJ) and Taizhoushi (TZS) located in Jiangsu Province; Hangzhou (HZ), Ningbo (NB), Jiaxing (JX), Huzhou (HZ1), Shaoxing (SX), Jinhua (JH), Zhoushan (ZS) and Taizhou (TZ) located in Zhejiang Province; Hefei (HF), Wuhu (WH), Maanshan (MAS), Tongling (TL), Anqing (AQ), Chuzhou (CZ1), Chizhou (CZ2) and Xuancheng (XC) located in Anhui Province; and the megacity Shanghai (SH). The terrain elevation data are available at https://www.ngdc.noaa.gov/mgg/global/relief/ETOPO1/data/bedrock/cell_registered/netcdf/ (last access: 10 November 2020).
2.1 Air quality data
Surface air pollutants monitored by the China National Environmental Monitoring Center (CNMC) network are used in this study. The nationwide observation network began operating in 74 major cities in 2013, and it included 1597 nonrural sites covering 454 cities by 2017 (Lu et al., 2018). The monitoring data are strictly in accordance with the national monitoring regulations (http://www.cnemc.cn/jcgf/dqhj/, last access: 10 November 2020) and can be acquired from the national urban air quality real-time publishing platform (http://106.37.208.233:20035/, last access: 10 November 2020). Each monitoring site automatically measures hourly air pollutants (PM2.5, PM10, SO2, NO2, O3 and CO), and the urban hourly pollutants are calculated by averaging the pollutants measured at all monitoring sites in that city. The MDA8 O3 is calculated based on the hourly O3 with more than 18 h of measurements (Liao et al., 2017). Manual inspection, including the identification and handling of invalid and missing data, is performed following the methods of previous studies (Xie et al., 2016b; Shu et al., 2017; Zhan et al., 2019).
2.2 Surface and sounding meteorological data
With respect to surface-observed meteorological data, stations at the three provincial capital cities (Hefei, Nanjing and Hangzhou) and the megacity Shanghai are selected, which are ZSOF (31.87∘ N, 117.23∘ E), ZSNJ (32.00∘ N, 118.80∘ E), ZSHC (30.23∘ N, 120.17∘ E), and ZSPD (31.12∘ N, 121.77∘ E), respectively. These surface observations, including temperature at 2 m, wind speed and direction at 10 m, and relative humidity at 2 m, are recorded hourly and can be obtained from the website of the University of Wyoming (http://weather.uwyo.edu/surface/, last access: 10 November 2020). The precipitation data are not included in the dataset.
To verify the upper-air fields, the sounding observations at Shanghai (31.40∘ N, 121.46∘ E) and Nanjing (32.00∘ N, 118.80∘ E) are used. These sounding observations (pressure, temperature, relative humidity, wind direction, wind speed, etc.) are also acquired from the website of the University of Wyoming (http://weather.uwyo.edu/upperair/sounding.html, last access: 10 November 2020) with a time resolution of 12 h (00:00 and 12:00 UTC; throughout this paper the time refers to UTC unless LST is specifically stated).
2.3 The best-track TC dataset
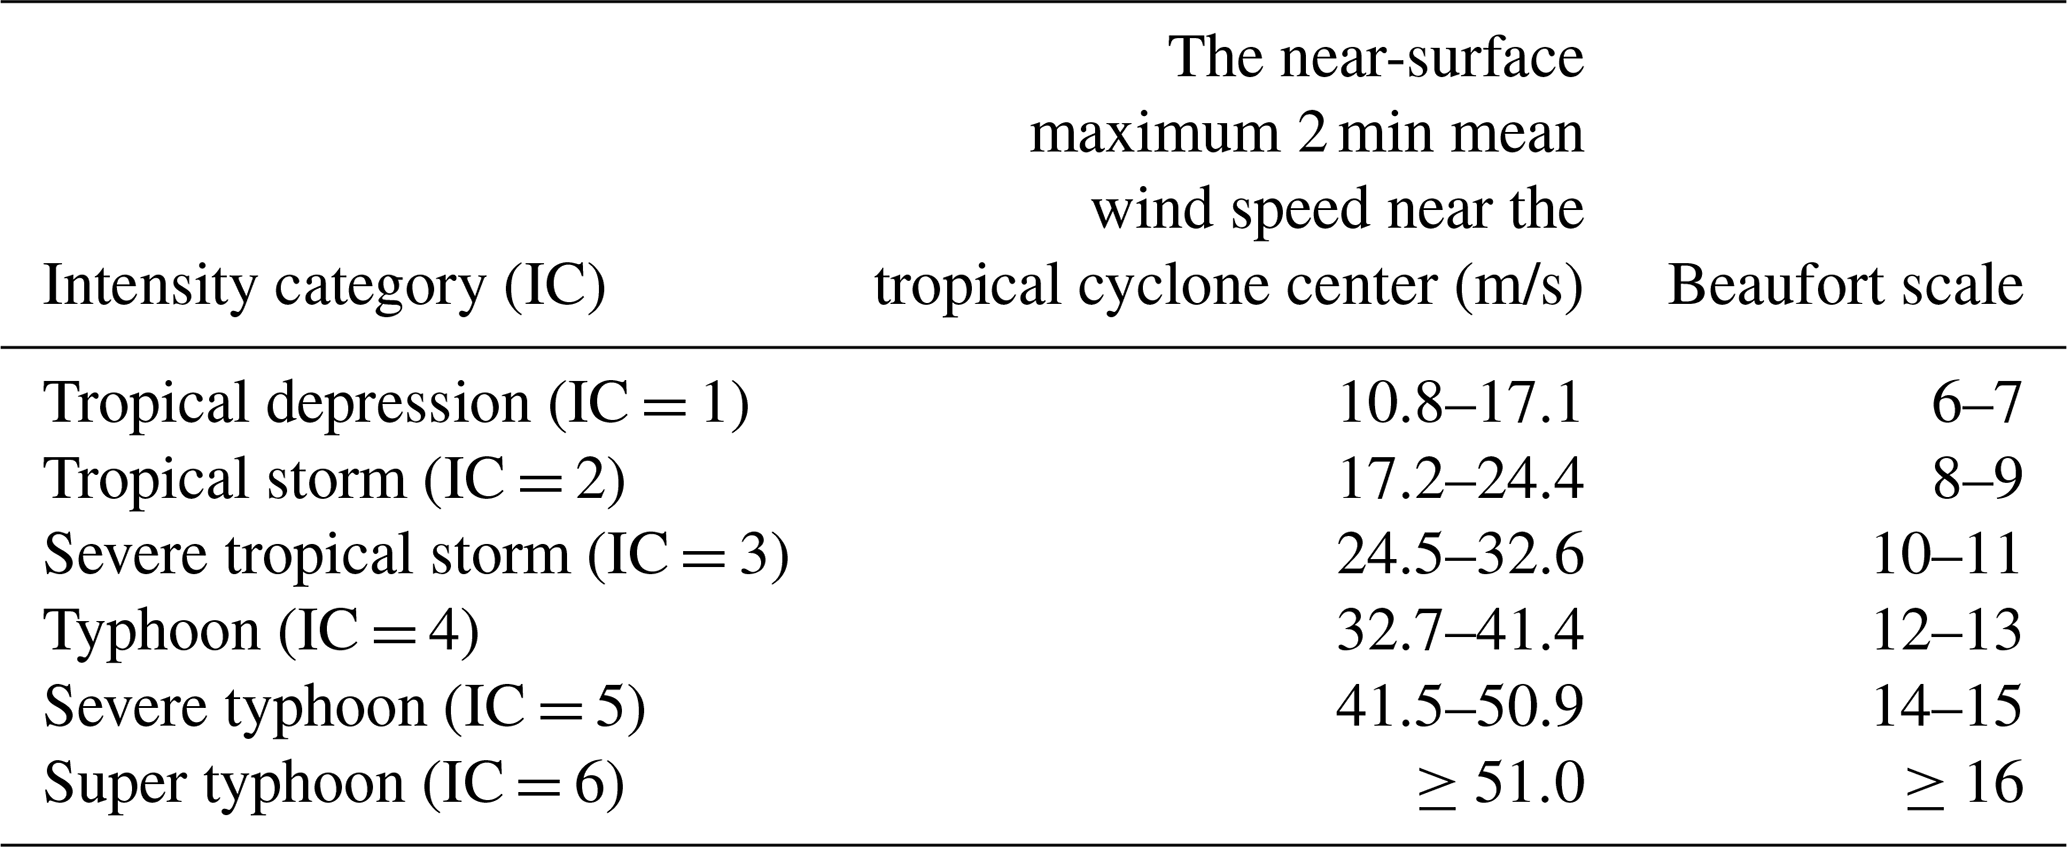
To capture the characteristics of landfall typhoons, the best-track TC dataset issued by the China Meteorological Center (CMA) is considered due to its good performance on the landfall typhoons in mainland China (available at: http://tcdata.typhoon.org.cn/zjljsjj_sm.html, last access: 10 November 2020). The dataset covers seasons from 1949 to the present and the region north of the Equator and west of 180∘ E, and it is updated annually (Li and Hong, 2016; Ying et al., 2014). A wealth of information on the typhoon is recorded every 6 h in the dataset, including location, minimum sea level pressure, etc. For landfall typhoons, 24 h before their landing and during their activities in mainland China, the meteorological data are recorded every 3 h. Referring to the national standard for the grades of tropical cyclones (GB/T 19201–2006), the intensity category (IC) of tropical cyclones is provided in the dataset, which is based on the near-surface maximum 2 min mean wind speed near the tropical cyclone center, ranging from 1 to 6 (Table 1).
2.4 Model description and configurations
To simulate the high O3 episodes over the YRD during the typhoon periods, the WRF-CMAQ one-way coupled model is applied, which consists of WRF v3.6.1 (https://www2.mmm.ucar.edu/wrf/users/, last access: 10 November 2020) developed by the United States National Center for Atmospheric Research (NCAR) and CMAQ v5.0.2 (https://github.com/USEPA/CMAQ/tree/5.0.2, last access: 10 November 2020) developed by the United States Environmental Protection Agency (EPA).
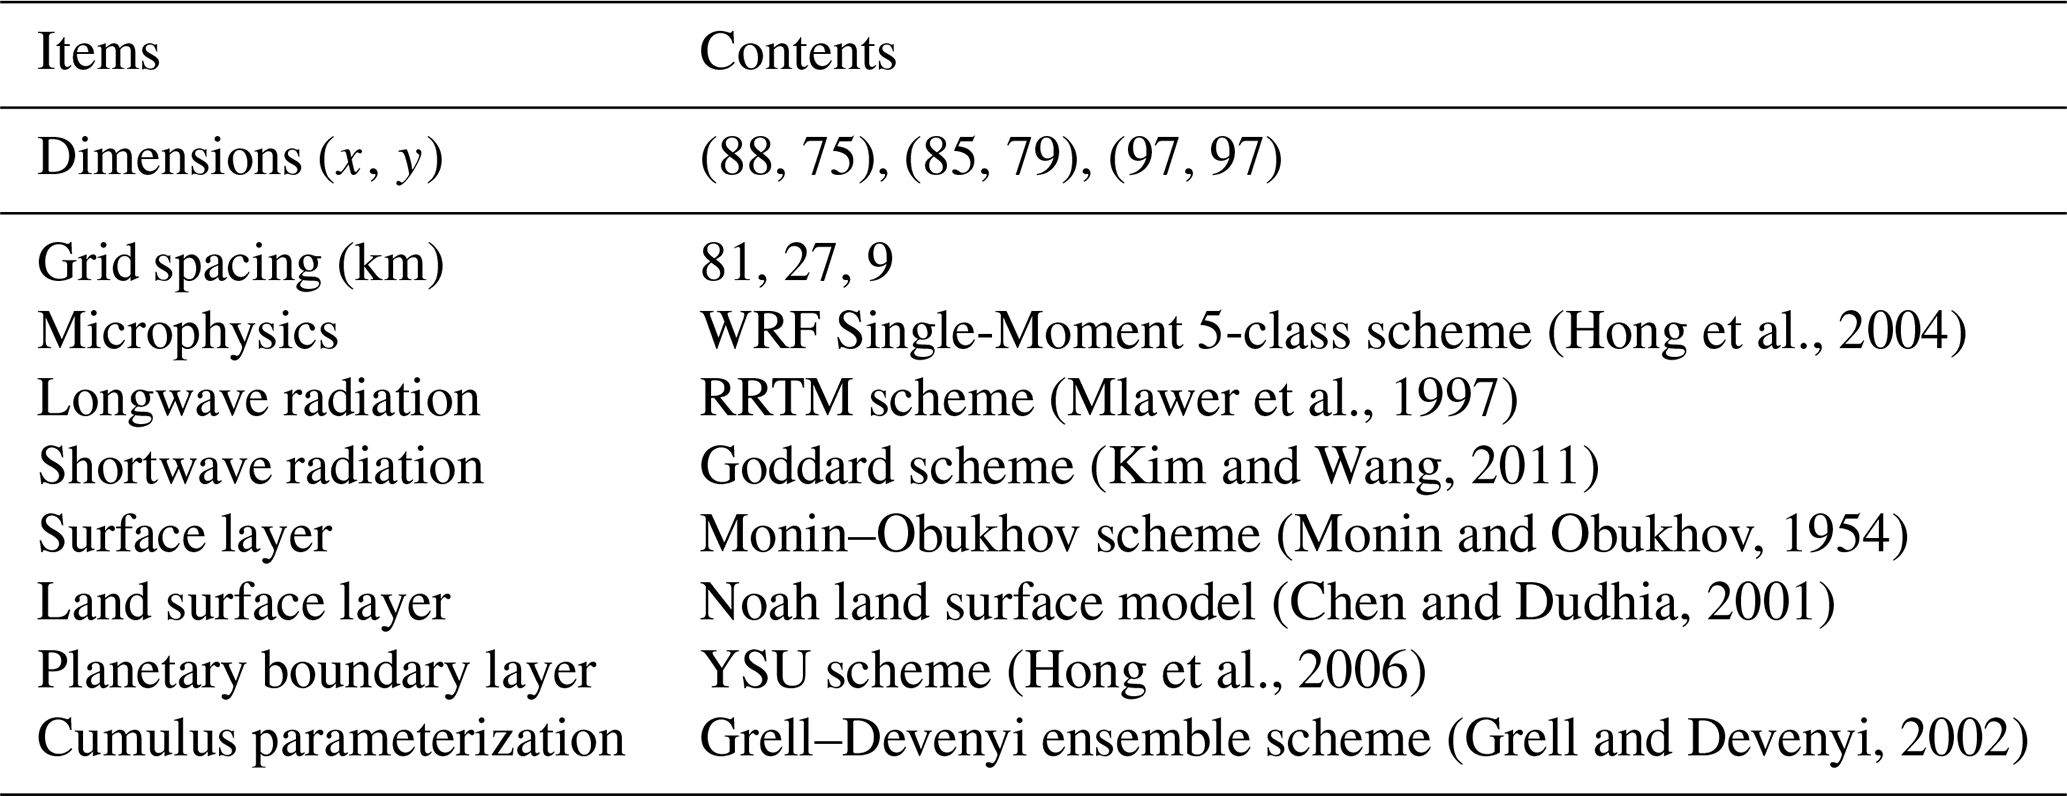
WRF generates offline meteorological inputs for CMAQ with initial and boundary conditions from the National Centers for Environmental Prediction (NCEP) global final analysis fields every 6 h at a spatial resolution of 1∘ × 1∘ (https://rda.ucar.edu/datasets/ds083.2/, last access: 10 November 2020). Three nested domains are used with horizontal resolutions of 81, 27 and 9 km and grids of 88×75, 85×79 and 97×97, respectively (Fig. 1a). There are 24 vertical sigma layers from the surface to 100 hPa with about 8 layers located below 1.5 km to resolve the boundary layer processes. Furthermore, the major physical options for the dynamic parameterization in WRF are summarized in Table 2.
Table 2The domains and physical options for WRF in this study.
Since the horizontal domains of CMAQ are one grid smaller than WRF, all three nested domains are adjusted automatically. The vertical layers of CMAQ are the same as WRF. The Meteorology–Chemistry Interface Processor (MCIP) can convert WRF outputs to the necessary meteorological inputs for CMAQ. Moreover, the CB05 gas-phase mechanism with aqueous/cloud chemistry is selected in the CMAQ configurations.
The anthropogenic emissions are from the Multi-resolution Emission Inventory for China (MEIC) in 2016 with the resolution of 0.25∘ (http://meicmodel.org/, last access: 10 November 2020), including anthropogenic emissions from power generation, industry, agriculture, residential and transportation sectors. All emission estimates are spatially allocated to the relevant grid cells based on the meteorological fields obtained from WRF and are temporally distributed on an hourly basis. The simulation ran from 00:00 on 13 July to 00:00 on 27 August with the first 72 h as the spin-up time.
2.5 Integrated process rate (IPR) analysis
To quantify the contributions of individual processes to O3 formation, the integrated process rate (IPR) analysis provided in the CMAQ is utilized. The IPR analysis can illustrate the contributions to changes in pollutant concentrations from seven different types of processes, including horizontal advection (HADV), vertical advection (ZADV), horizontal diffusion (HDIF), vertical diffusion (VDIF), dry deposition (DDEP), cloud processes with aqueous chemistry (CLDS) and chemical reaction process (CHEM), with a mass conservation adjustment at each model grid cell. The IPR analysis has been widely applied to investigate regional air pollution (Fan et al., 2015; Li et al., 2012; Wang et al., 2010). In this study, MADV is defined as the sum of HADV and ZADV, and TDIF is defined as the sum of HDIF and VDIF.
2.6 Model evaluation
To evaluate the model performance, the simulation results in the innermost domain, including O3 concentration, air temperature at 2 m (T2), relative humidity (RH), wind speed at 10 m (WS10) and wind direction at 10 m (WD10), are examined against the hourly observations at the representative cities (Table 3). The statistical metrics, including correlation coefficient (R), root mean square error (RMSE) and normalized mean bias (NMB), are used. They are defined as follows:
where Si and Oi are the simulations and observations, respectively, N is the total amount of valid data, and and are the average value of simulations and observations, respectively. In general, the model results are acceptable if the values of R, RMSE and NMB are close to 1, 0 and 0, respectively (Li et al., 2017b; Shu et al., 2016; Xie et al., 2016a).
2.7 Estimate of health impacts
Previous studies showed that surface O3 pollution can induce a series of adverse health problems and incidences of death related to respiratory diseases (Ghude et al., 2016; Jerrett et al., 2009; Lelieveld et al., 2015). To bring more attention to the issue that O3 can be significantly affected by typhoons in the YRD, we further estimate the premature mortality attributed to O3 during the study period.
A standard damage function (Anenberg et al., 2010; Liu et al., 2018; Voorhees et al., 2014; WS/T 666-2019, Technical specifications for health risk assessment of ambient air pollution of China) is employed to quantify premature mortality due to O3 exposure:
where ΔM is the excess deaths attributed to O3 exposure, y0 is the baseline mortality rate, RR is relative risk, (RR-1)/RR is the attributable fraction, and Pop is the exposed population. RR can be calculated using the following relationship:
where β is the concentration response factor, C is the exposure concentration and C0 represents the theoretical minimum-risk concentration.
In this study, the mortality rate for respiratory disease is obtained from China Health and Family Planning Statistical Yearbook 2018 (https://www.yearbookchina.com/navibooklist-n3018112802-1.html, last access: 10 November 2020), which is 68.02 per 100 000. The β is generated from Dong et al. (2016) and is 0.461 %. The population data are obtained from bureaus of statistics of different cities in the YRD. The C0 is 70 µg m−3 for MDA8 O3 given by the World Health Organization (WHO).
3.1 Characteristics of O3 episodes
In the midsummer, the warm sea surface (high temperature) is conducive to the generation of typhoons (high O3 concentration), providing a good opportunity to investigate the mechanisms of typhoons affecting O3 in the YRD. Figure 2 shows the MDA8 O3 in the typical 26 cities of the YRD in summer of 2018. Actually, it is common for typhoons to affect O3 in the YRD during summer, and 2018 is special because there were eight landfall typhoons, and many of them landed further north than in normal years (see Supplement for details). O3 concentration was relatively high in June and relatively low in July and August. The relatively low O3 may be attributed to the maritime air masses transported by the Asian summer monsoon (Ding et al., 2008; Xu et al., 2008). Nevertheless, we notice that there are two regional multiday O3 pollution episodes from 24 July to 11 August in the YRD, which means that about half of the cities in the YRD exceed the national air quality standard (the national ambient air quality standard for MDA8 O3 is 160 µg m−3 in China). The first multiday O3 episodes appeared in most of the cities from 24 July to 2 August. The highest MDA8 O3 concentration reached up to 264 µg m−3 on 27 July in Ningbo (NB). O3 pollution was even observed for 6 consecutive days from 27 July to 1 August in Maanshan (MAS). Only 2 d later, regional O3 pollution occurred in the YRD again from 5 August to 11 August.
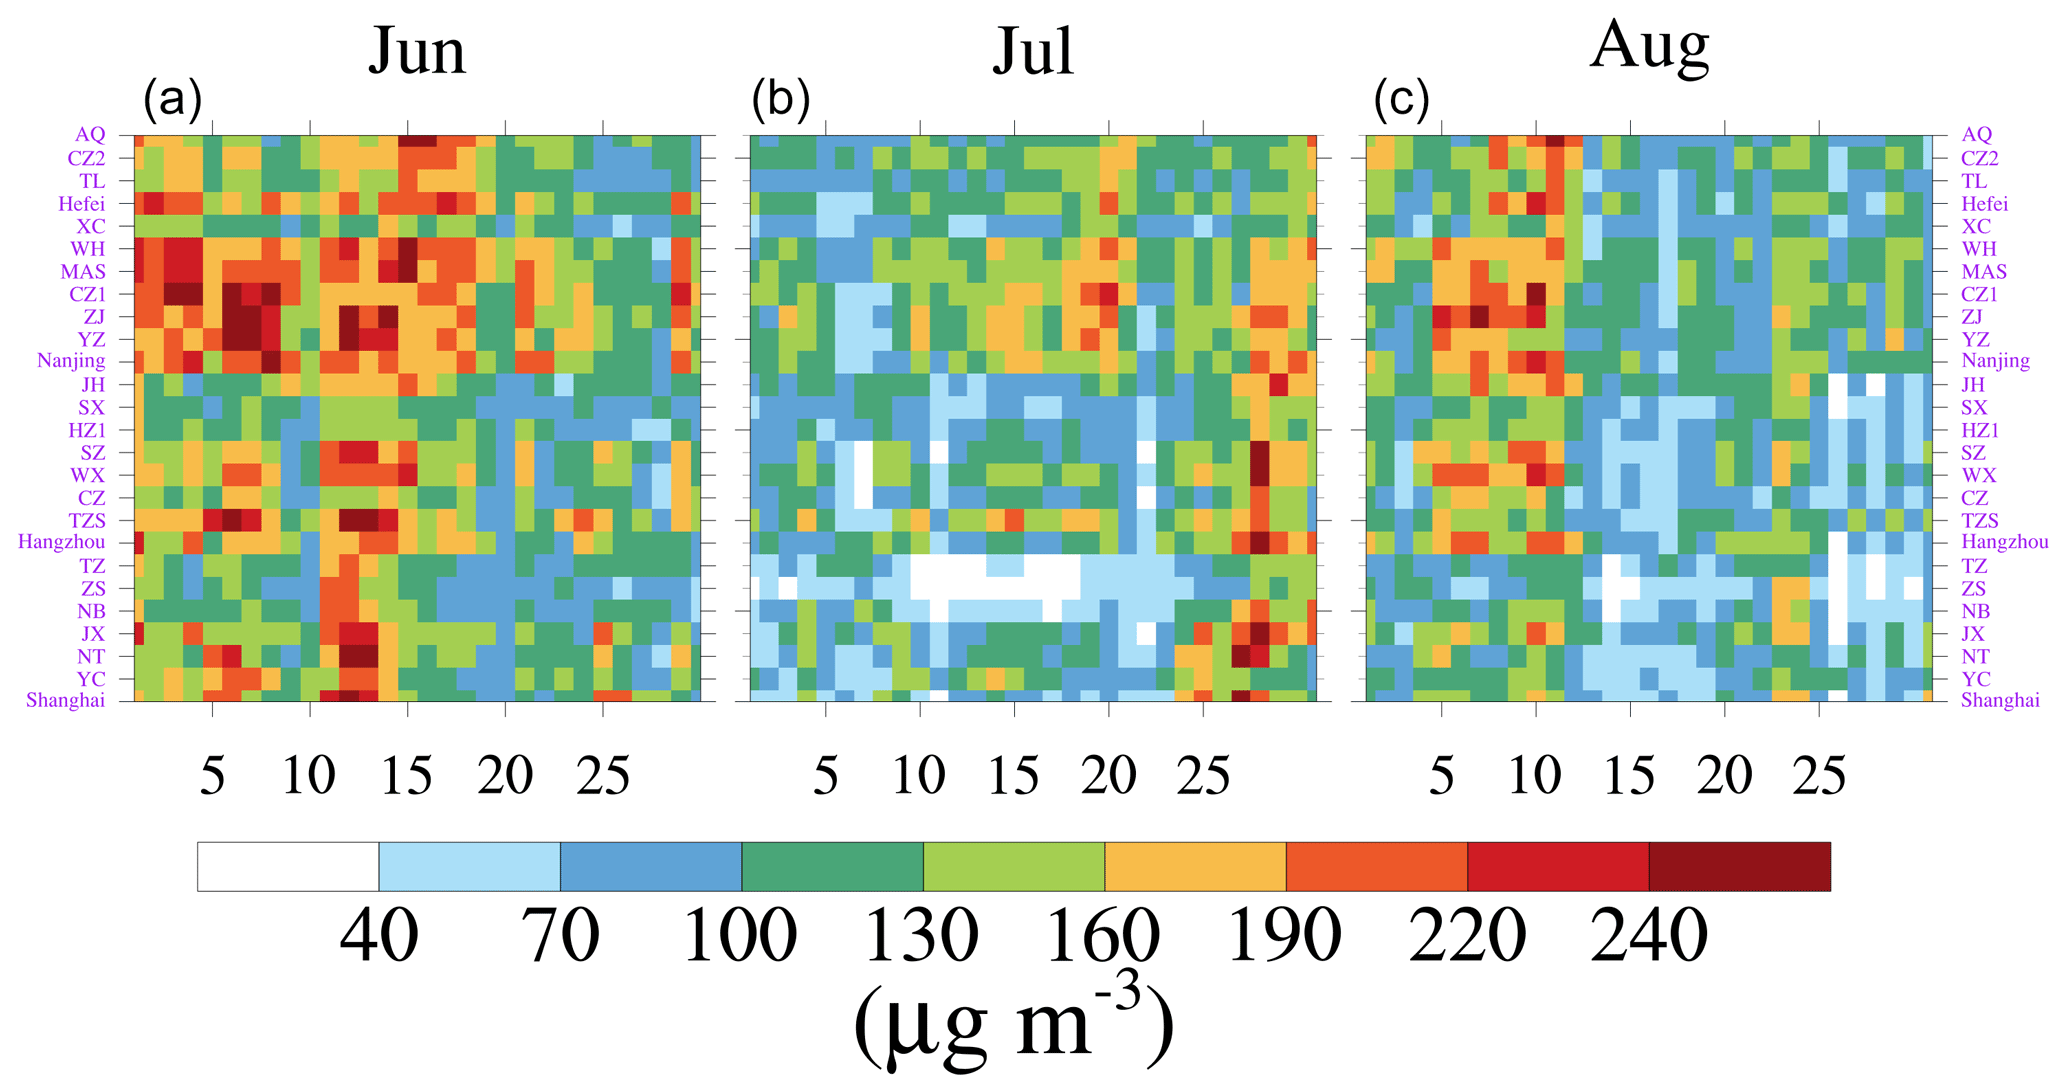
Figure 2The MDA8 O3 in 26 cities of the YRD in June (a), July (b) and August (c) 2018. The national ambient air quality standard for MDA8 O3 is 160 µg m−3 in China. These cities are sorted by longitude.

Figure 3Diurnal variation of O3 in 26 cities of the YRD from 16 June to 25 August 2018. The dotted gray lines are the national ambient air quality standard for hourly O3 (200 µg m−3) in China. The letter A indicates the moment that the typhoon reached the 24 h warning line, and the letter B indicates the last moment when the typhoon was active in mainland China. These times are acquired from the best-track TC dataset, depending on the start and end times of the 3 h observations. Coordinates 1, 2, 3 and 4 represent Typhoon Ampil, Typhoon Jongdari, Typhoon Yagi and Typhoon Rumbia, respectively. Note: these cities are sorted by longitude.
Figure 3 further shows the diurnal variation of O3 in all 26 cities of the YRD from 00:00 16 July to 00:00 25 August. Interestingly, O3 pollution occurred earlier in cities near the coastline (e.g., large longitudes in degrees east; Fig. 1b) rather than concurrently during the two multiday O3 episodes. For example, from 24 July to 2 August, the first day that the hourly O3 concentration exceeded the national air quality standard (the national ambient air quality standard for hourly O3 is 200 µg m−3 in China) in Shanghai, Hangzhou, Nanjing and Hefei was 24, 27, 28 and 31 July, respectively. Thus, we classify the 26 cities in the YRD into four categories based on their longitudes surrounding the four representative cities (Fig. 4). The category I cities include Shanghai (SH), Yancheng (YC), Nantong (NT), Jiaxing (JX), Ningbo (NB), Zhoushan (ZS) and Taizhou (TZ). The category II cities include Hangzhou (HZ), Taizhoushi (TZS), Changzhou (CZ), Wuxi (WX), Suzhou (SZ), Huzhou (HZ1), Shaoxing (SX) and Jinhua (JH), and the category III cities include Nanjing (NJ), Yangzhou (YZ), Zhenjiang (ZJ), Chuzhou (CZ1), Maanshan (MAS), Wuhu (WH) and Xuancheng (XC). Other cities are classified as category IV cities, which are Hefei (HF), Tongling (TL), Chizhou (CZ2) and Anqing (AQ). The first category cities are closest to the coastline, while the fourth category cities are the opposite.
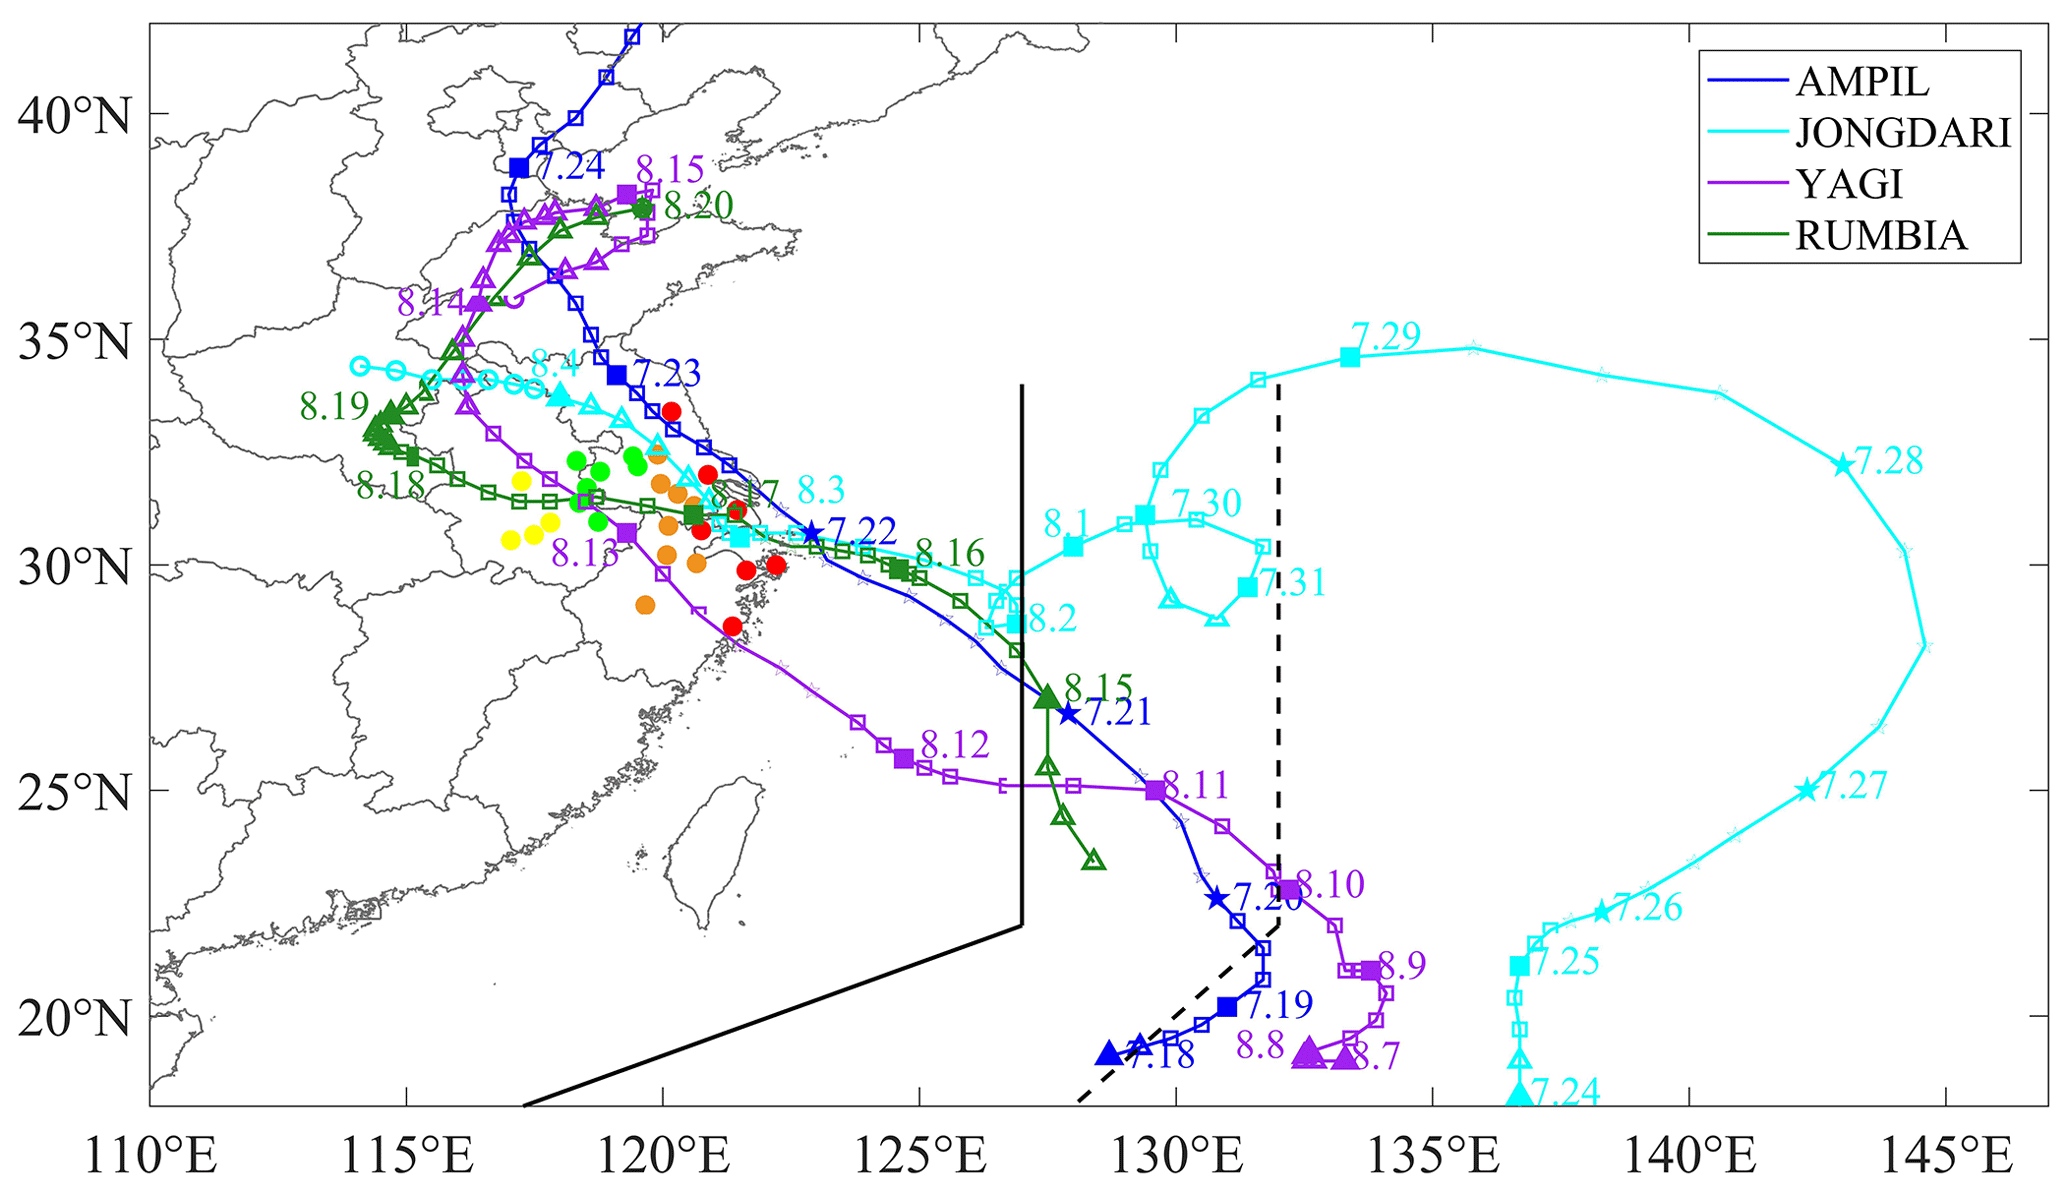
Figure 4The track and intensity of Typhoon Ampil, Typhoon Jongdari, Typhoon Yagi and Typhoon Rumbia. The track is labeled with the date of the month and day (in month.day). The circle, triangle, square and pentagram indicate that the intensity category of tropical cyclones is less than 1 (IC < 1), equal to 1 (IC = 1), equal to 2 (IC = 2) or not less than 3 (IC ≥ 3), respectively. The solid black line and dotted line represent the 24 h and 48 h warning line for tropical cyclones, respectively. The solid colored points are the locations of cities in the YRD, and different colors represent different city categories, wherein red, orange, green and yellow are category I, II, III and IV cities, respectively.
3.2 Landfall typhoons and their effects
O3 episodes with regional and long-lasting characteristics may often be associated with slow-moving synoptic weather systems. We find that the O3 episodes coincided well with activities of landfall typhoons, shown in their tracks and intensities in Fig. 4. Typhoon Ampil was first observed at 00:00 on 18 July and landed in Shanghai around 04:30 on 22 July with an intensity of a severe tropical storm (IC = 3). While Typhoon Ampil remained active, Typhoon Jongdari generated over the western North Pacific at 12:00 on 23 July and made landfall at the junction of Zhejiang province and Shanghai at 21:00 on 1 August. After Typhoon Jongdari, Typhoon Yagi generated at 00:00 on 7 August. At around 15:35 on 12 August, it landed in Zhejiang province and remained active in mainland China until 21:00 on 15 August. Before the end of Typhoon Yagi, Typhoon Rumbia was observed over the western North Pacific at 06:00 on 14 August. It finally landed in Shanghai at around 20:00 on 16 August, causing huge economic losses.
To further understand the relationship between O3 episodes and landfall typhoons, we mark the critical moments of landfall typhoons in Fig. 3. The letter A indicates the moment when a typhoon has reached the 24 h warning line, and the letter B indicates the last moment of that typhoon remaining active in mainland China. These moments are acquired from the best-track TC dataset, depending on the start and the end time of the 3 h observations. Coordinates 1, 2, 3 and 4 represent Typhoon Ampil, Typhoon Jongdari, Typhoon Yagi and Typhoon Rumbia, respectively. As shown in Fig. 3, O3 exhibited a significant cycle during the study period. That is, when the typhoon is close enough (near moments A1, A2, A3 and A4), the O3 concentrations decreased, but O3 concentrations would increase as long as the typhoon was not active in mainland China (B1, B2 and B4) any more. This cycle would repeat if the next typhoon approached. O3 pollution was likely to occur during the period from the end of a typhoon to the arrival of the next typhoon (B1A2 and B2A3) in the YRD.
Furthermore, we find that the variations of O3 were related to the track, duration and landing intensity of the typhoons. For example, during the B1A2 period when the O3 pollution occurred, the moments that hourly O3 concentrations first exceed 200 µg m−3 in about half of the cities of categories I, II, III and IV were 06:00 (14:00 LST) on 27 July, 06:00 (14:00 LST) on 28 July, 03:00 (11:00 LST) on 29 July and 06:00 (14:00 LST) on 31 July, respectively. This phenomenon also suggests that O3 pollution first occurs in cities along the coastline, which may be related to the track of typhoons (Fig. 4). Regarding the impact of typhoon duration, the A4B3 period provided a good interpretation. While Typhoon Yagi was still active in mainland China, Typhoon Rumbia had reached the 24 h warning line. Hence, the O3 remained at a low level throughout the period (A3B4), which was quite different from the B1A2 and B2A3 periods. Note that the landing point and active path of Typhoon Ampil and Typhoon Jongdari were very similar (Fig. 4). However, the landing intensity of Typhoon Ampil was as a severe tropical storm (IC = 3) and that of Typhoon Jongdari was as a tropical storm (IC = 2), resulting in a difference in O3 concentrations for Shanghai. Within 24 h after Typhoon Ampil (Jongdari) reached the 24 h warning line, the average O3 concentrations reached 40.9 (80.1) µg m−3 in Shanghai. This is because the stronger the typhoon lands, the more effective the gale (the 10 m wind speed near moment A1 was larger than that near moment A2 in Shanghai, Fig. 7a) and precipitation accompanying the typhoon will be in removing O3.
3.3 Processes of O3 pollution affected by typhoons
To reveal the major processes of O3 pollution episodes affected by landfall typhoons, one municipality and three provincial capital cities with different longitudes, including Shanghai (31.12∘ N, 121.77∘ E), Hangzhou (30.23∘ N, 120.17∘ E), Nanjing (32.00∘ N, 118.80∘ E) and Hefei (31.87∘ N, 117.23∘ E), are selected for further analysis, based on monitoring data and model results.
3.3.1 Evaluation of model performance
To evaluate the simulation performance, the hourly simulation results are compared with the measurements from 00:00 on 16 July to 00:00 on 25 August. Table 3 presents the statistical metrics for selected variables, including temperature at 2 m (T2), relative humidity (RH), wind speed at 10 m (WS10), wind direction at 10 m (WD10) and surface O3. T2 is reasonably well simulated with R values of 0.75, 0.77, 0.72 and 0.64 in Shanghai, Hangzhou, Nanjing and Hefei, respectively. Though our simulation underestimates T2 to some extent, this slight underestimation is acceptable because of the small RMSE (3.2, 2.7, 2.9 and 3.3) and NMB (−7.5 %, −5.1 %, −5.5 % and −5.5 %) values. As for RH, the simulation results are overestimated in all four cities, leading to the NMB values of 9.1 %, 4.6 %, 6.7 % and 0.5 % in Shanghai, Hangzhou, Nanjing and Hefei, respectively. With high R values (0.69, 0.65, 0.71 and 0.71) and relatively low RMSE values (12.4, 12.8, 12.1 and 10.8), the WRF simulates RH over the YRD quite well. The wind fields are closely related to the transport processes of air pollutants. The overestimation of WS10 may partly be attributed to the unresolved terrain features by the default surface drag parameterization causing an overestimation of wind speed in particular at low values (Jiménez and Dudhia, 2012; Li et al., 2017a). With regards to WD10, the simulation error is large based only on these statistical metrics. This is because near-surface wind fields are deeply influenced by local underlying surface characteristics, and improving the urban canopy parameters might be useful (Liao et al., 2015; Xie et al., 2016a). In terms of O3, the simulated O3 concentrations behave satisfactorily. R is 0.55, 0.65, 0.66 and 0.54 for the simulations for Shanghai, Hangzhou, Nanjing and Hefei, respectively, while the NMB values are 5.8 %, 16.4 %, −6.2 % and −5.3 %, respectively.
Table 3Statistical metrics in meteorological variables and O3 concentration between the observations and simulations.
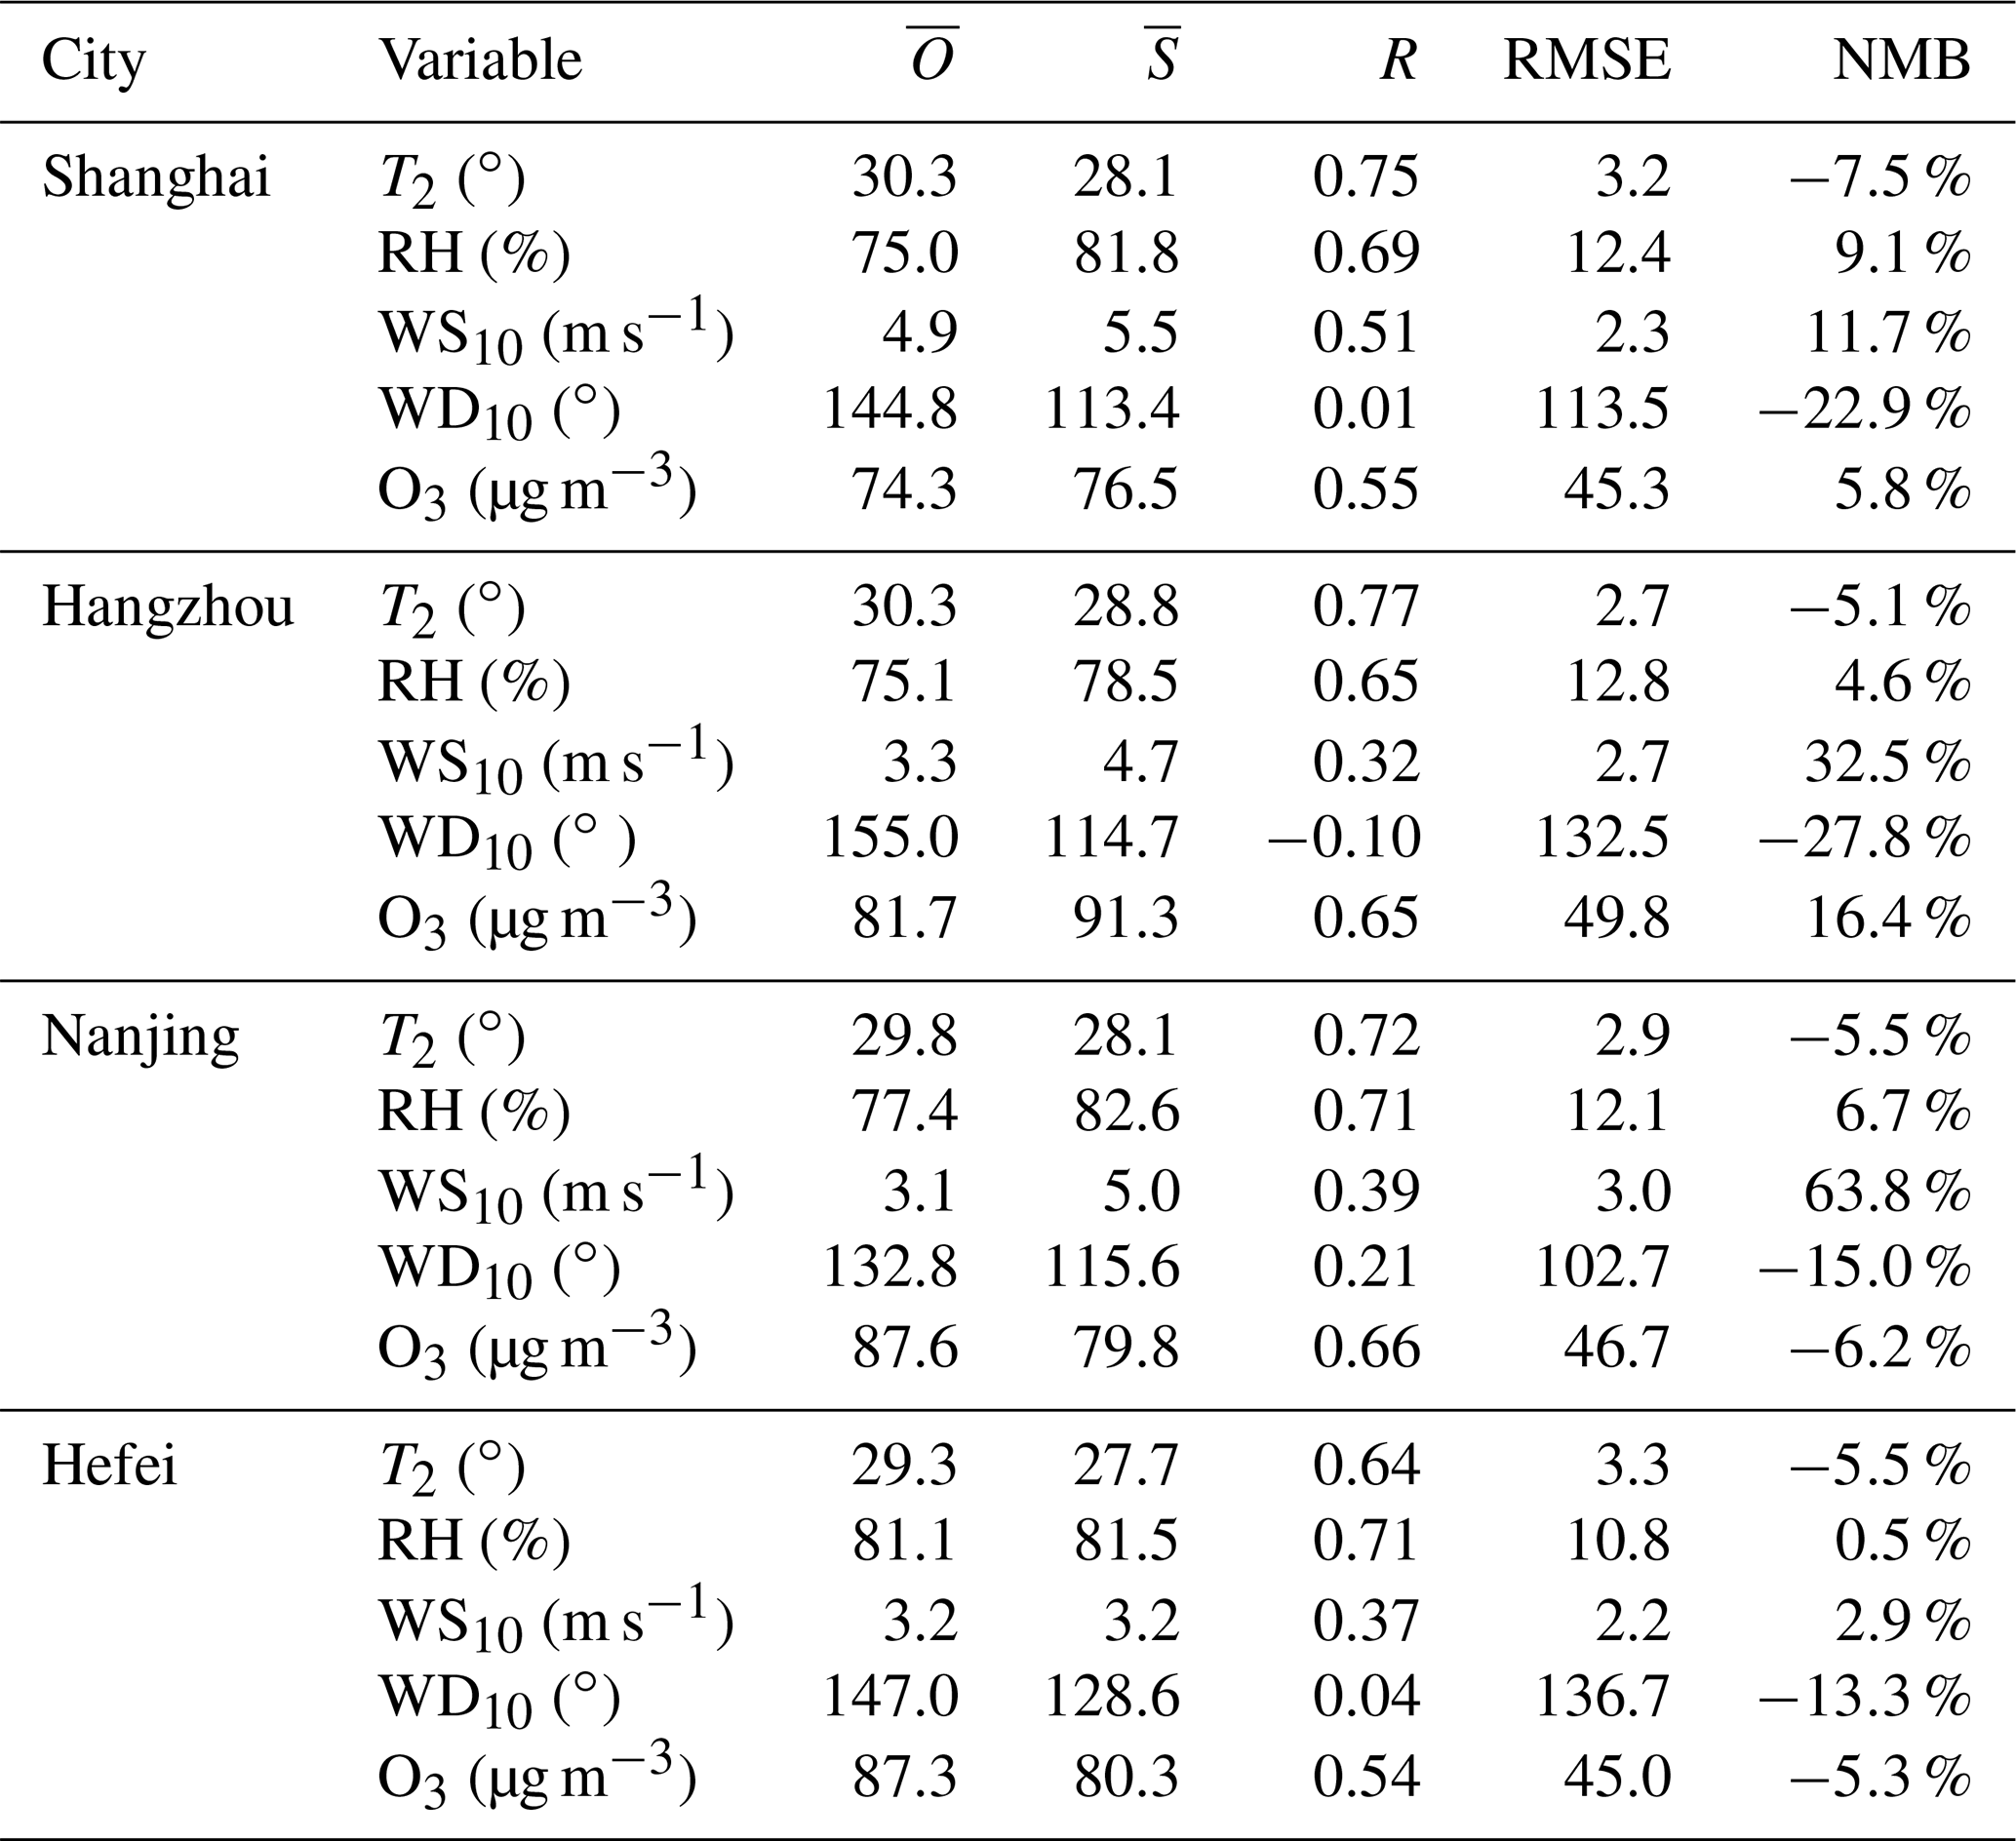
Note: R exceeds 0.1 to reach statistical significance at 99.9 % confidence level. and are the average values of the observations and simulations, respectively.
Figure 5 further shows hourly variations of O3, T2, WS10 and WD10 for measurements and simulations in four representative cities. The simulations effectively reproduce the diurnal variation of O3, T2 and WS10, confirming the reliability of the simulation results. Moreover, the model captures well the shift in wind direction during the study period. Thus, the overall model performance in simulating wind fields is acceptable. In summary, the simulations can capture and reproduce the major meteorological characteristics and O3 evolution during the O3 episodes and thus can provide valuable insights into the formation of the O3 episodes.
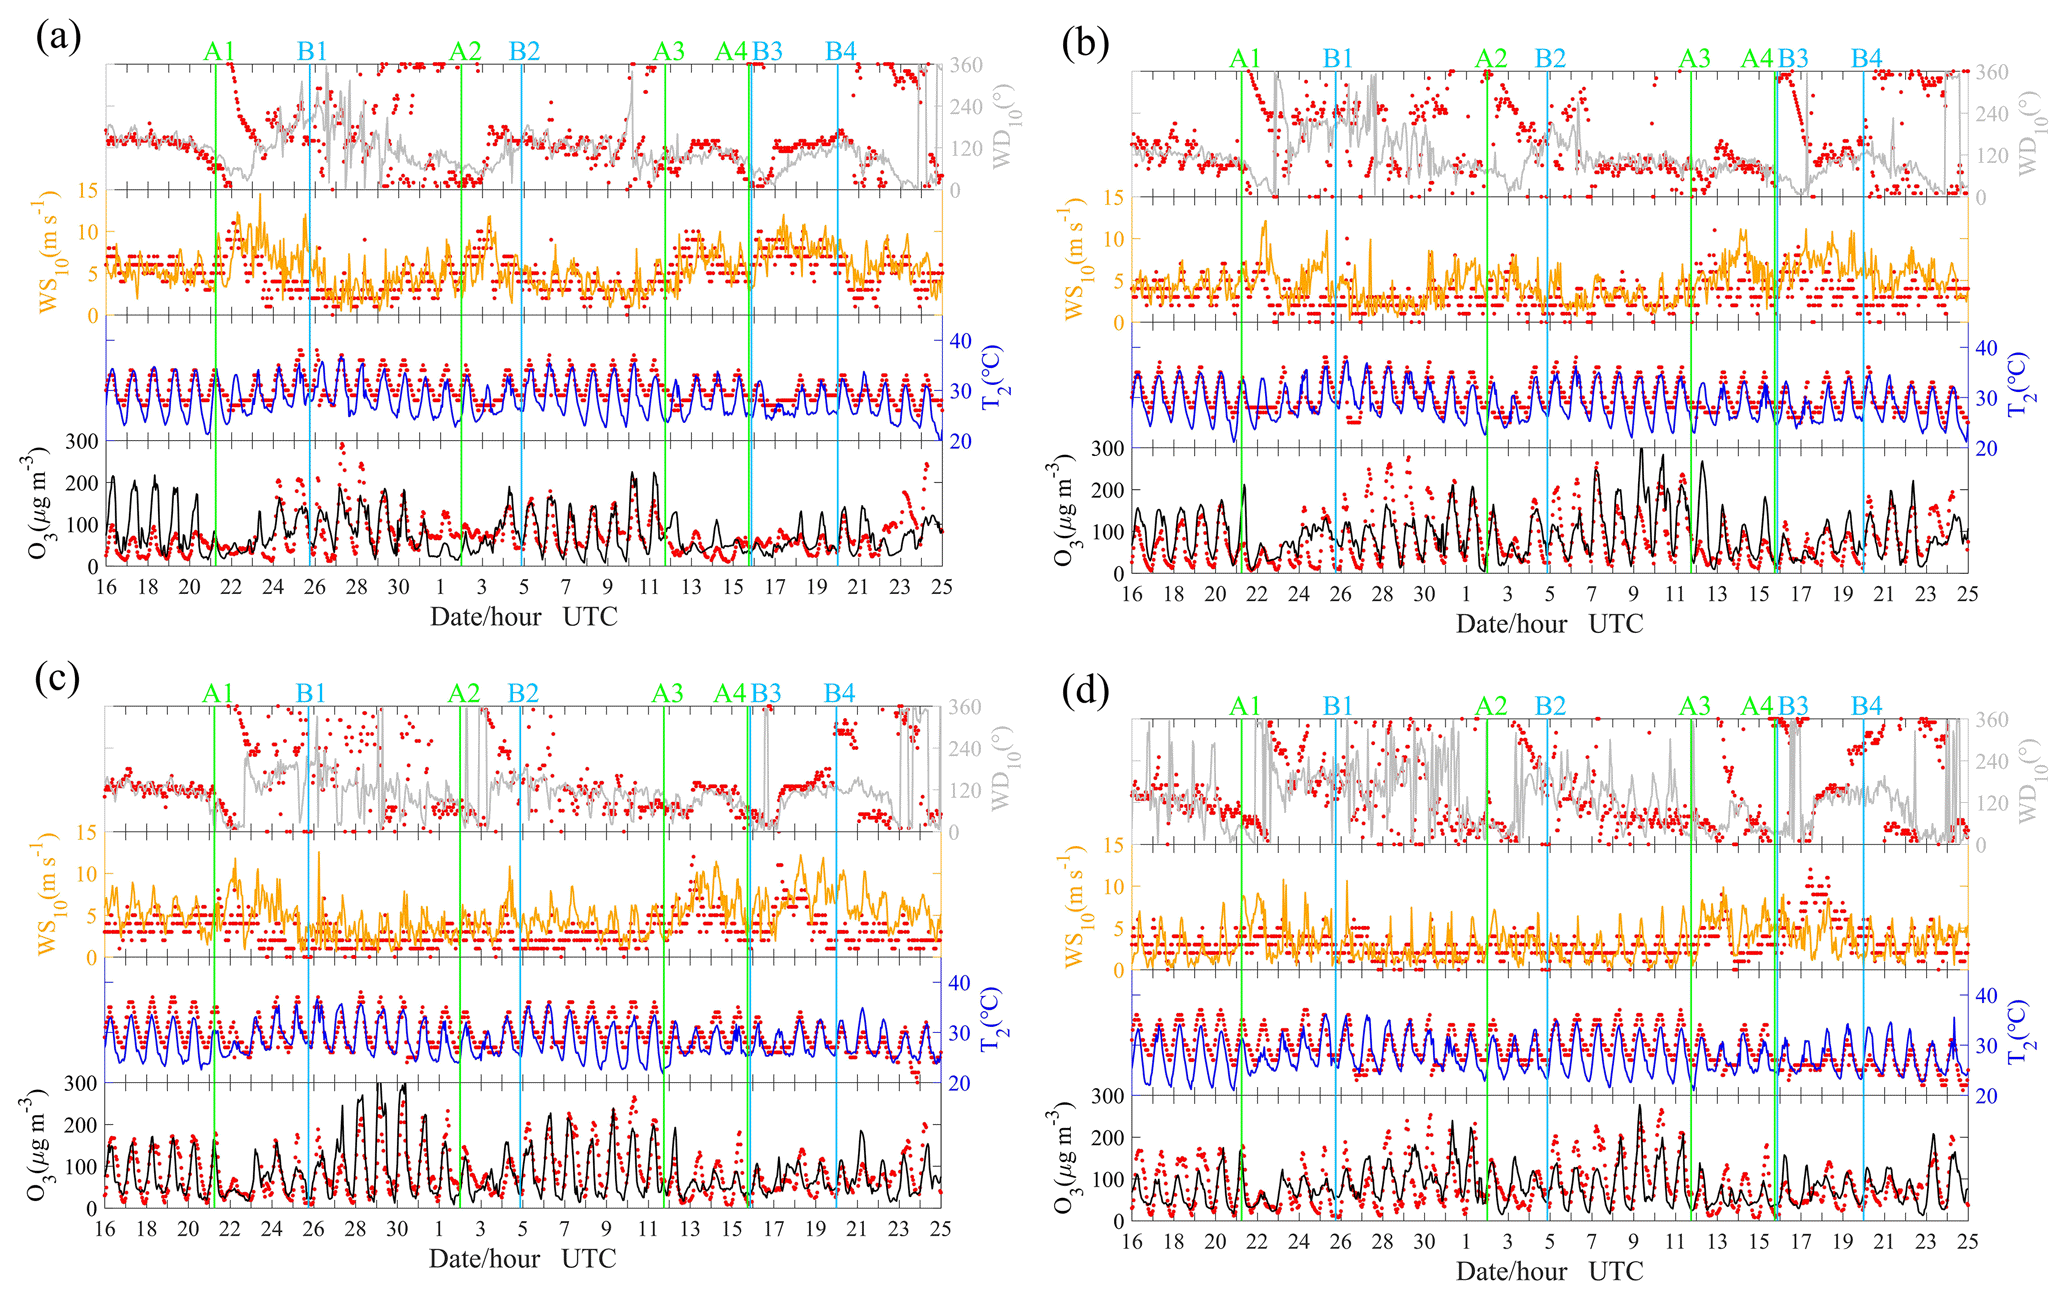
Figure 5Hourly variations of O3, T2, WS10 and WD10 in measurements (red dots) and simulations (colored lines) in (a) Shanghai, (b) Hangzhou, (c) Nanjing and (d) Hefei.
3.3.2 Shanghai and category I cities
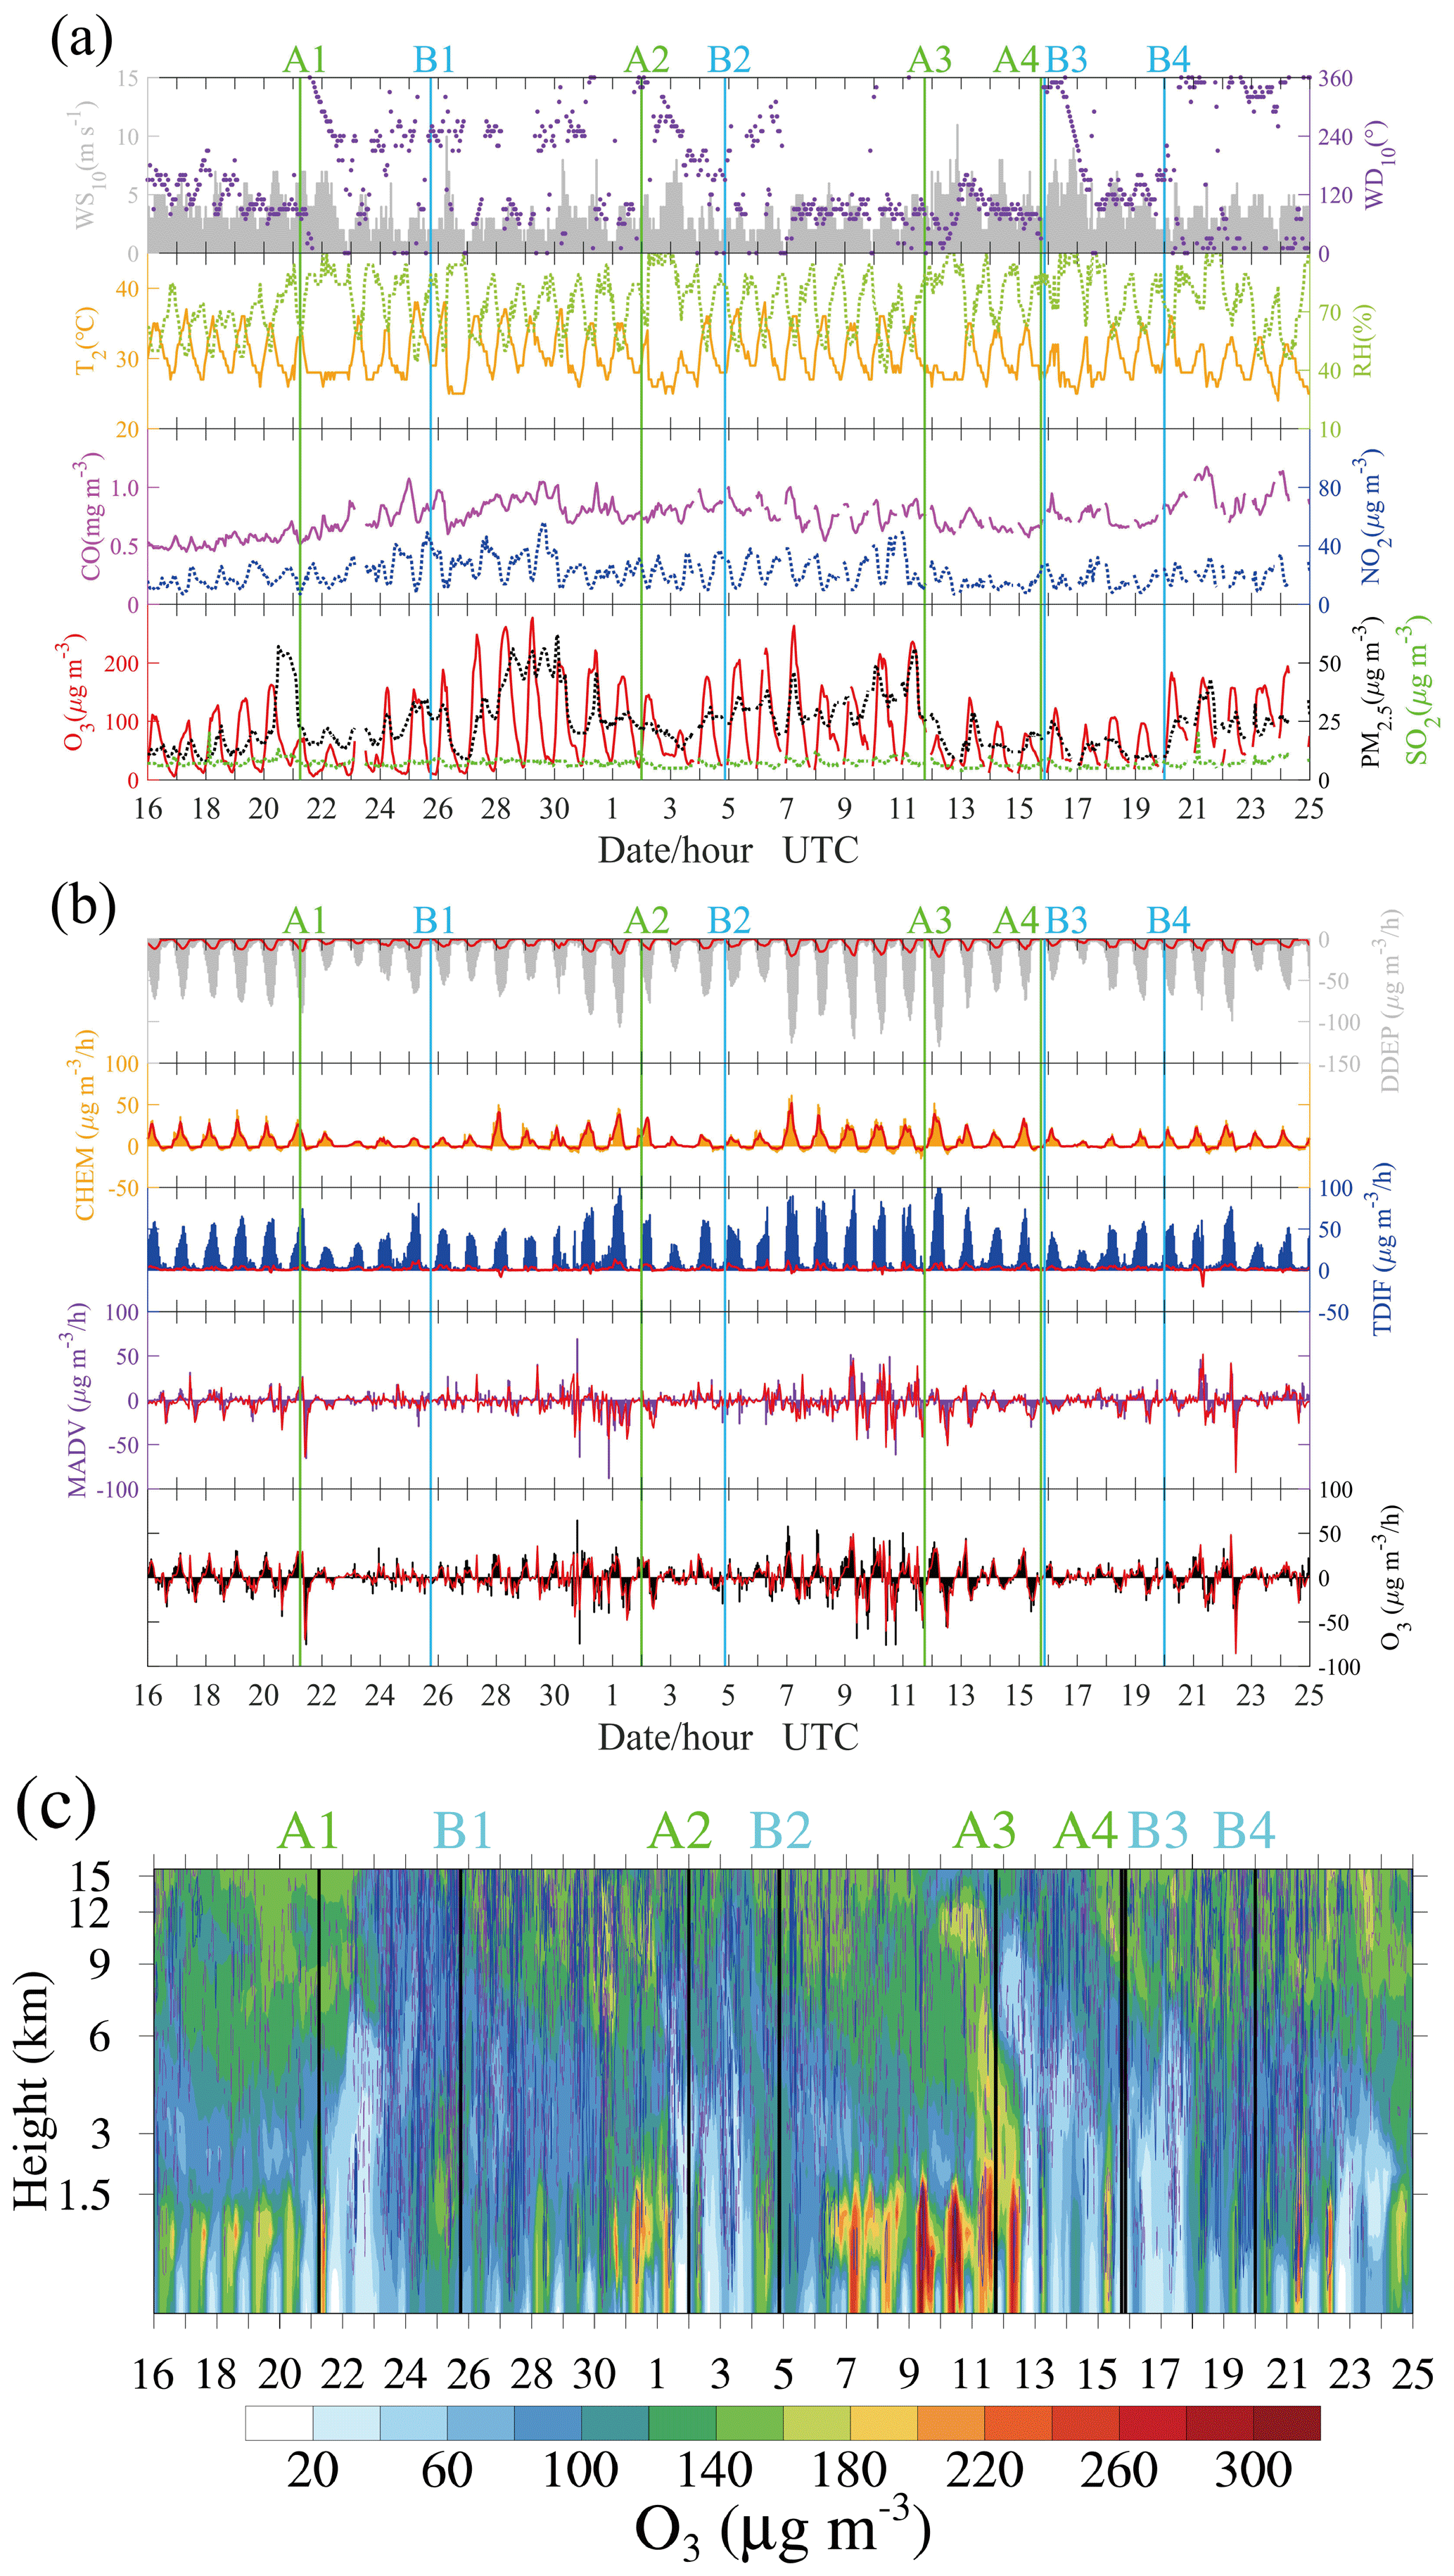
In the study period, Shanghai was usually one of the first cities affected by landfall typhoons. We can see a multiday episode of O3 during the period of 24–28 July with a maximum of hourly O3 up to 292 µg m−3 on 27 July (Fig. 6a). The high O3 concentrations, together with high primary pollutants (CO and NO2), suggest a strong photochemical O3 production under the condition of high temperature (the daily maximum temperature can reach 35∘ C) during this period, and the weak wind may play a significant role in the accumulation of surface O3. The increase in the primary pollutants may be related to a change in wind direction from the southeast to the southwest caused by Typhoon Ampil (A1 in Fig. 6a, -A1 and A1B1 in Fig. 7), which originally brought an air mass from the ocean, then shifted to being from inland. Interestingly, PM2.5 also showed a good correlation with O3 and primary pollutants, especially for NO2, during this period. This indicates that a high level of oxidizability can promote the formation of secondary particles (Kamens et al., 1999; Khoder, 2002). From the results of process analyses (Fig. 6b), the major contributions to surface O3 were TDIF, CHEM and DDEP due to the small net contribution of MADV. TDIF had a considerable positive contribution, while DDEP did the opposite, suggesting that high surface O3 may be sourced from the upper layer via a TDIF process and be removed via a DDEP process. However, for the whole boundary layer, which is defined as the layer lower than 1500 m in this study, the balance was between CHEM and DDEP instead of TDIF and DDEP. Thus, TDIF was likely to play the role of “transporter” from the upper layer to the surface. Figure 6c further shows the temporal-vertical distribution of O3 with vertical wind velocity. The downward airflows prevailed over Shanghai until 23 July, which are induced by the subtropical high. Then, strong upward airflows appeared as Typhoon Ampil arrived, and high levels of O3 disappeared. Around 27 July, the downward airflows gradually resumed, and high levels of O3 occurred. The downward airflows are critical because they can not only inhibit the vertical transport of O3 but also transport high-level O3 concentrations to the surface. The high levels of O3 in the troposphere mainly come from two sources. One is O3-rich air from the low stratosphere transported by the downdrafts in large-scale typhoon circulation (Jiang et al., 2015). The other is O3 produced by photochemical reactions during the day. It is noteworthy that a high photochemical production efficiency of O3 occurred in the middle boundary layer instead of at the surface. Moreover, most of the O3 remained in the residual layer at night, while the surface O3 concentration was much lower due to NOx titration. By the second day, high O3 in the residual layer was transported to the surface by the downward airflows as air in the boundary layer was gradually mixed. Combined with the newly generated O3, a high concentration of O3 would eventually appear on the surface.
As shown in Fig. 7, O3 pollution tends to occur during the period from the end of a typhoon to the arrival of the next typhoon (B1A2 and B2A3) in the YRD. To reveal this phenomenon, we compare these two periods (B1A2 and B2A3) with their previous periods (A1B1 and A2B2) using the skew-T log-P diagram (Fig. 6d and e). It is found that the atmospheric conditions of B1A2 (B2A3) were hotter and drier than A1B1 (A2B2) below 700 hPa in Shanghai, and wind speed is smaller in B1A2 (B2A3). Those changes in atmospheric conditions after a typhoon will be conducive to the generation of a high O3 concentration in Shanghai.
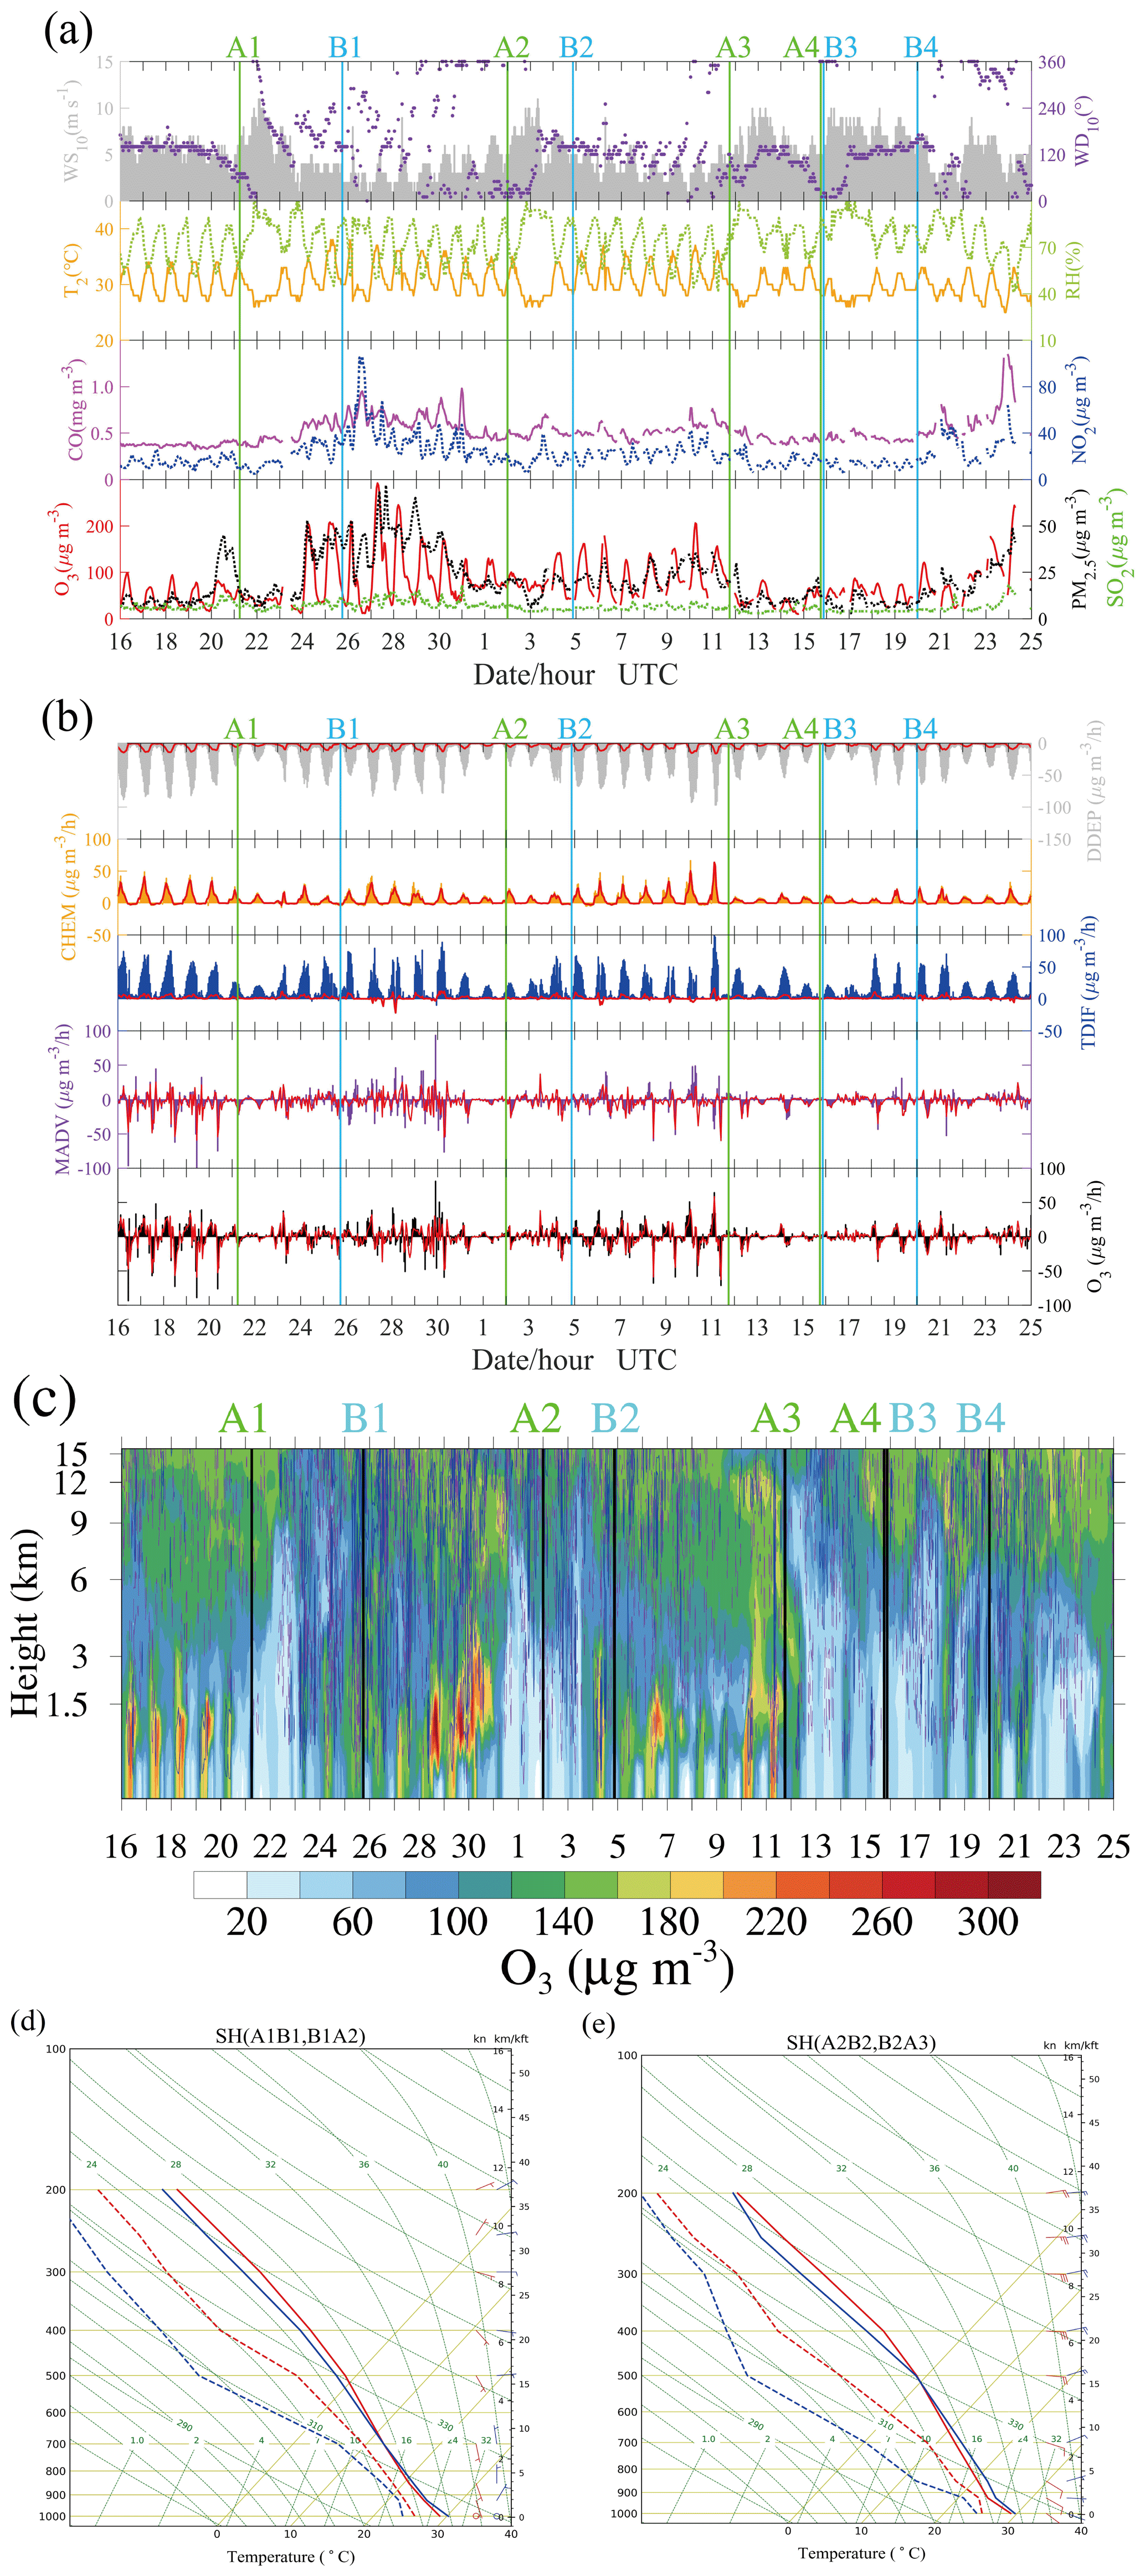
Figure 6(a) Time series of air pollutants (O3, PM2.5, SO2, CO and NO2) and meteorological factors (T2, RH, WS10 and WD10) in Shanghai. (b) Individual processes contributing to net O3 density at Shanghai. O3 is the net increase, MADV is the sum of horizontal advection (HADV) and vertical advection (ZADV), TDIF is the sum of horizontal diffusion (HDIF) and vertical diffusion (VDIF), CHEM is the chemical reaction process, and DDEP is the dry deposition process. The color histograms indicate the results for the layer near the surface, while the solid red lines indicate the average results for all layers below 1500 m. (c) Temporal-vertical distribution of O3 with vertical wind velocity over Shanghai. The dotted purple line and solid blue line indicate the negative wind speeds (downward airflows) and positive wind speeds (upward airflows), respectively. (d) The skew-T log-P diagram for Shanghai. The average results of period A1B1 and B1A2 are shown in red and blue, respectively. (e) Same as (d) but for the average results of period A2B2 and B2A3.

Figure 7Spatial distribution of surface O3 overlaid with wind fields at 850 hPa over the YRD. -A1, A1B1, B1A2, A2B2, B2A3, A3B3, A4B4 and B4- are the average results from the beginning to A1, A1 to B1, B1 to A2, A2 to B2, B2 to A3, A3 to B3, A4 to B4 and B4 to the end, respectively. Details can be found in Fig. 4.
3.3.3 Hangzhou and category II cities
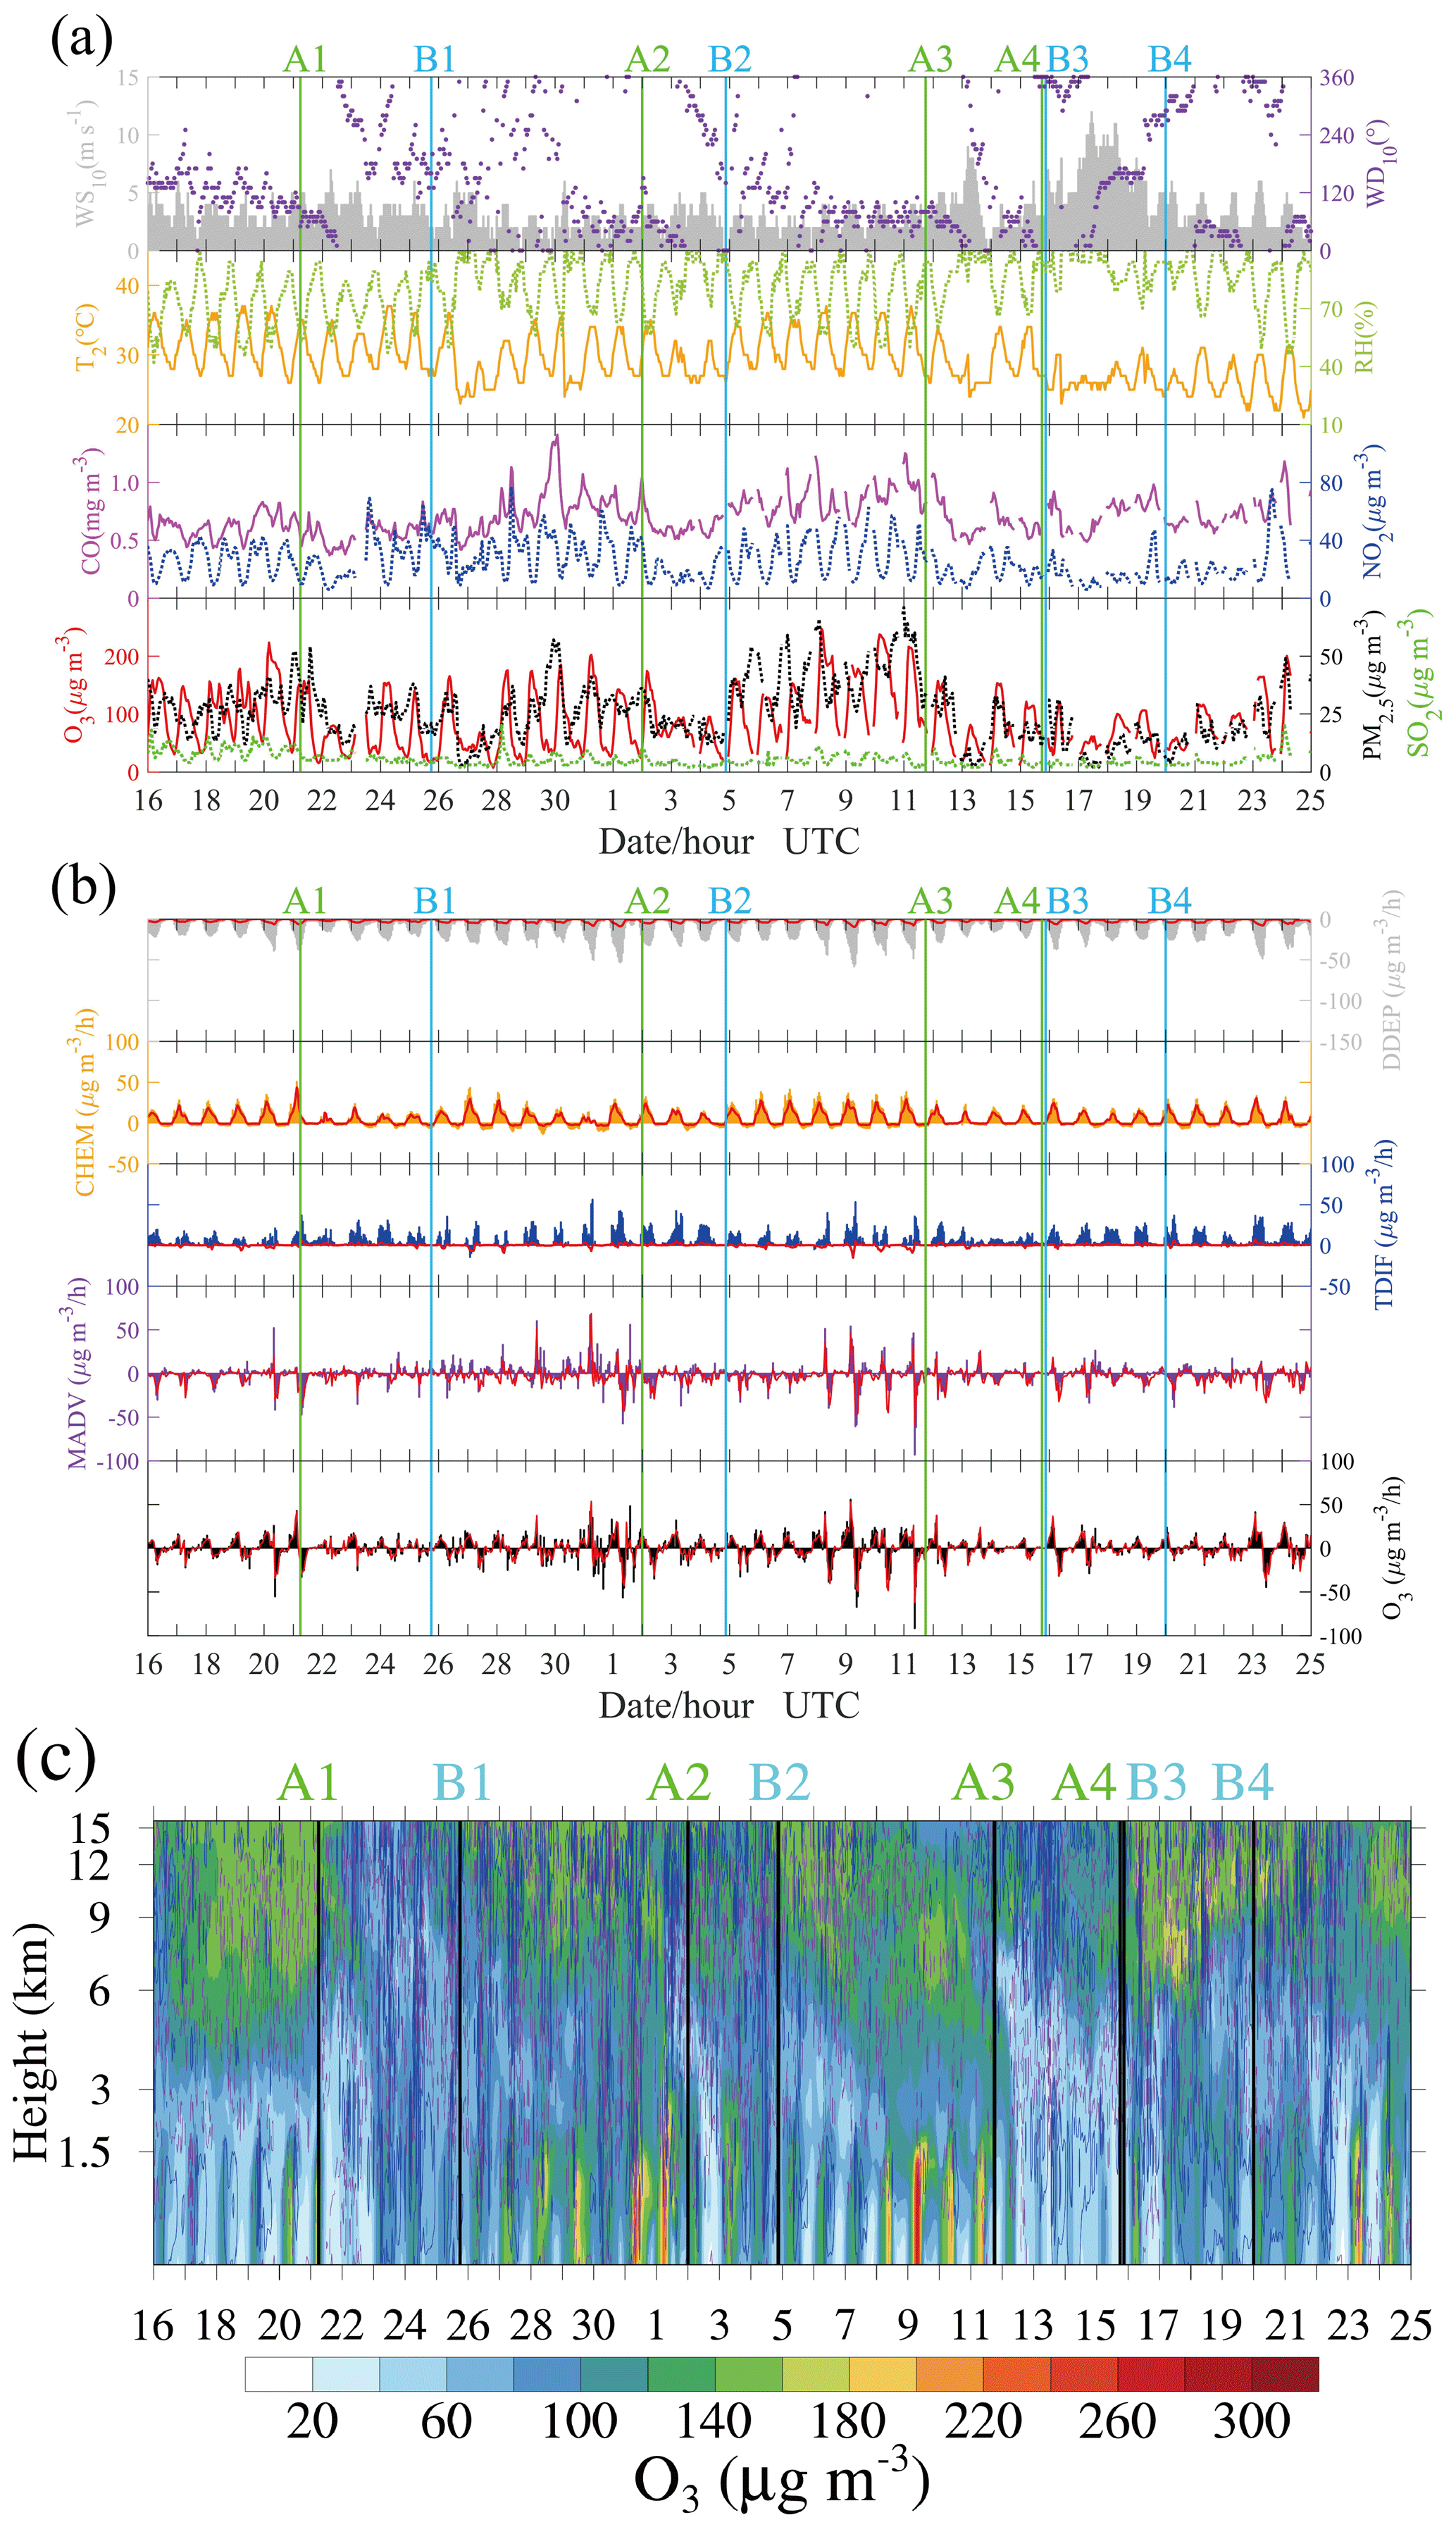
Figure 8 presents the case in Hangzhou. It shows that high O3 concentrations occurred on 27–31 July and 5–7 August, which may also be related to the strong photochemical production of O3 under the abundance of precursors (Fig. 8a) and poor diffusion conditions due to the light wind (B1A2 and B2A3 in Fig. 7). Figure 8a further shows that a high O3 level was often associated with an increase in CO, but the NO2 concentrations usually remained at the same level. This phenomenon indicates a VOC-limited regime in this city since CO usually has good correlation with VOCs and can play a similar role as VOCs in the photochemical production of O3 (Ding et al., 2013). In fact, O3 in other representative cities (Shanghai, Nanjing and Hefei) also showed a better correlation with CO than NO2. Though Hangzhou is close to Shanghai, there is a significant difference of wind fields over these two cities. Starting from the arrival of Typhoon Ampil (A1), the wind direction in Hangzhou did not change back to southeast until a few days later after Typhoon Jongdari dissipated (B2). During this period (A1B2), the frequent southwest wind may be the reason for high CO concentrations in Hangzhou. In addition, the chaotic wind field during period B1A2 (B1A2 in Fig. 7) may have led to the light wind in Hangzhou. With respect to the simulation results, the model simulated the variation of O3 but failed to capture the O3 peaks (e.g., the peak values on 27–31 July), which may be related to the strong upward airflows (Fig. 8c) that inhibited the accumulation of O3 (Fig. 8b). This further illustrates that downward airflows may be an important factor for O3 episodes in this case.
3.3.4 Nanjing and category III cities
In Nanjing, the O3 episode exceeded the national air quality standards and was observed from 28 July to 1 August and from 7 to 11 August. These O3 episodes were characterized by abundant O3 precursors under the condition of high temperature. Furthermore, light wind (B1A2 and B2A3 in Fig. 7) and downward airflows (Fig. 9c) also contributed greatly to the occurrence of O3 pollution, resulting from a mechanism similar to that for Shanghai and Hangzhou. As early as on 22 July, the wind direction in Nanjing changed from the southeast to the southwest because of the arrival of Typhoon Ampil, and thus the concentrations of the main primary pollutants (CO, NO2 and SO2) increased (Fig. 9a). However, high-level O3 concentration episodes did not occur until 28 July even though the maximum temperature did not change significantly during 24–31 July. The “obstacle” for enhancing O3 levels may be the precipitation caused by the strong upward airflows during 23–26 July (Fig. 9c). As shown in Figure 9b, the high surface O3 concentrations during the pollution episodes is the result of TDIF and CHEM processes and is lost through DDEP and MADV processes. Regarding the vertical structure of atmosphere, B1A2 (B2A3) was also hotter and drier than A1B1 (A2B2) below 700 hPa in Nanjing (Fig. 9d and e). These consequences, similar to those in Shanghai, further confirm that high O3 concentrations in a region are more likely to occur during the period from the end of an active typhoon to the arrival of the next typhoon (B1A2 and B2A3) than during the period when a typhoon approaches and is active in the region (A1B1 and A2B2).

3.3.5 Hefei and category IV cities
Hefei is the city farthest from the coast among the four representative cities, and O3 pollution occurred on 31 July and 8–11 August. We also find the phenomenon that the precursor concentrations had an increase once the wind direction changed from the southeast to the southwest (Fig. 10a). During B1A2 and B2A3, the concentrations of the main precursors of O3 were high. However, high O3 concentration was mainly found in B2A3 and not in B1A2. This may be related to the relatively low temperature during B1A2 (Fig. 10a), which is not conducive to the photochemical production of O3 (Fig. 10b). As shown in Fig. 10c, there were distinct upward airflows within the boundary layer, which may be related to urban effects (e.g., urban heat islands). These upward airflows within the boundary layer helped mix the air, resulting in a uniform distribution of O3 in the vertical direction. However, the downward airflows can still inhibit the vertical diffusion of O3, and O3 tends to be trapped within the boundary layer.
3.3.6 A schematic diagram of major processes
Although the processes of a landfall typhoon affecting O3 varied from city to city, the major processes have many similarities and are summarized as a schematic diagram in Fig. 11. The YRD region, as a typical region of the East Asian monsoon climate, is strongly influenced by typhoon activities over the West Pacific. In summer, the meteorological conditions of high temperature and downward airflows combined with high levels of precursors due to the huge energy consumption are all favorable for O3 accumulation in the region. However, powerful systems like typhoons can break this state. For typhoons that may land in the YRD, by the time they approach the 24 h warning line, the prevailing southeast wind in the YRD will change to a southwest wind, which can transport lots of precursors from inland to the YRD. The change in wind direction depends on the track of the typhoon and the geographical location of cities, and typhoons often appear first in cities along the coastline. With the influence of a typhoon, the low temperature, precipitation (upward airflows) and wild wind prevent high O3 and PM2.5 episodes from forming. Moreover, the effect of removing pollutants is related to the intensity of typhoon landing, but some of the main precursors of O3 are still at a high level due to foreign sources superposed with local emissions. After the passing of typhoons, the atmosphere returns to a warm and dry state (even more so than before), and the downward airflows resumes. The troposphere is then flooded with high O3 due to two main sources. One is O3-rich air transported from the low stratosphere by the downward airflows, and the other is O3 produced by strong photochemical reactions under the abundance of precursors. O3 is mainly generated inside the boundary layer (∼ 1000 m) instead of at the surface. The high-level O3 concentration can remain in the residual layer at night and be transported to the surface by downward airflows or turbulent mixing by the second day. At the same time, the wind readjusts to the southeast and wind speed is light, resulting in poor diffusion conditions. The downward airflows and light wind obstruct the vertical and horizontal diffusion of O3, leaving O3 trapped on the ground. The thermodynamic effects result in high-level surface O3 concentrations in the YRD.
A typhoon can exert an enormous impact on energy transports and air mass in the troposphere, as well as the redistribution of pollutants. Most typhoons generated over the western North Pacific will not land in China, or they are more likely to land in southern China rather than the YRD. In our previous study (Shu et al., 2016), the typhoon did not land in the YRD, but the processes related to high levels of O3 formation may be the same, which is to say the processes shown in the open box enclosed by dashed lines in Fig. 11, which are unique to landfall typhoons, while the processes inside the box enclosed by solid lines can be found between typhoons. The transport of precursors, downward airflows, high temperature and light wind are crucial factors, and how large a role those factors play in O3 episodes depends on the behavior of the typhoons and geographical location of the cities. Quantifying these processes with just a few cases is a great challenge. For example, it is hard to find out whether the downward airflows are modulated by the subtropical high or the periphery circulation of typhoons since they usually occur simultaneously. Furthermore, the behavior of particulate matter is intriguing since high levels of PM2.5 often occur with high levels of O3 after a typhoon, which is the opposite of the suggestion that high particulate matter concentrations inhibit the formation of O3 in previous studies (Li et al., 2005; Xing et al., 2017). This may be related to the heterogeneous reactions (Lou et al., 2014), but research on this issue is quite limited to date.
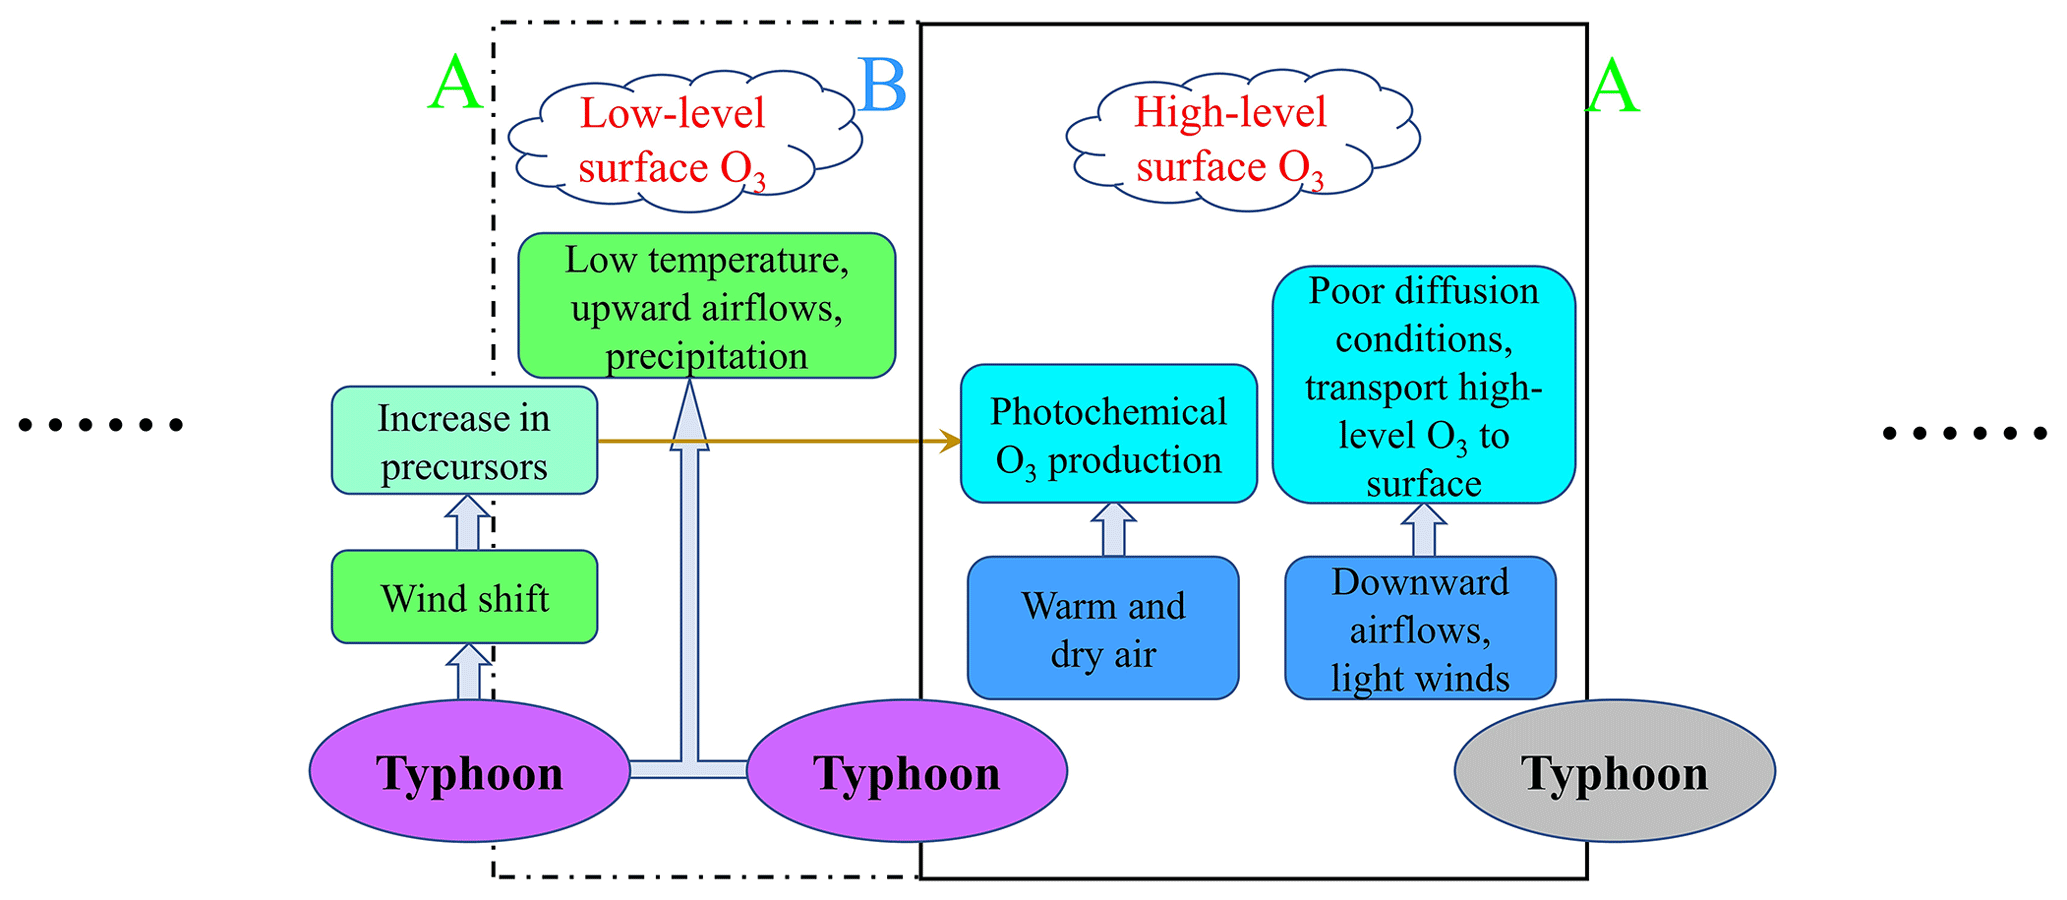
Figure 11A schematic diagram of major processes showing that summertime O3 is affected by landfall typhoons in the YRD. The letter A indicates the moment that the typhoon has reached the 24 h warning line, and the letter B indicates the last moment when typhoon remains active in mainland China.
3.4 Premature deaths induced by O3 exposure
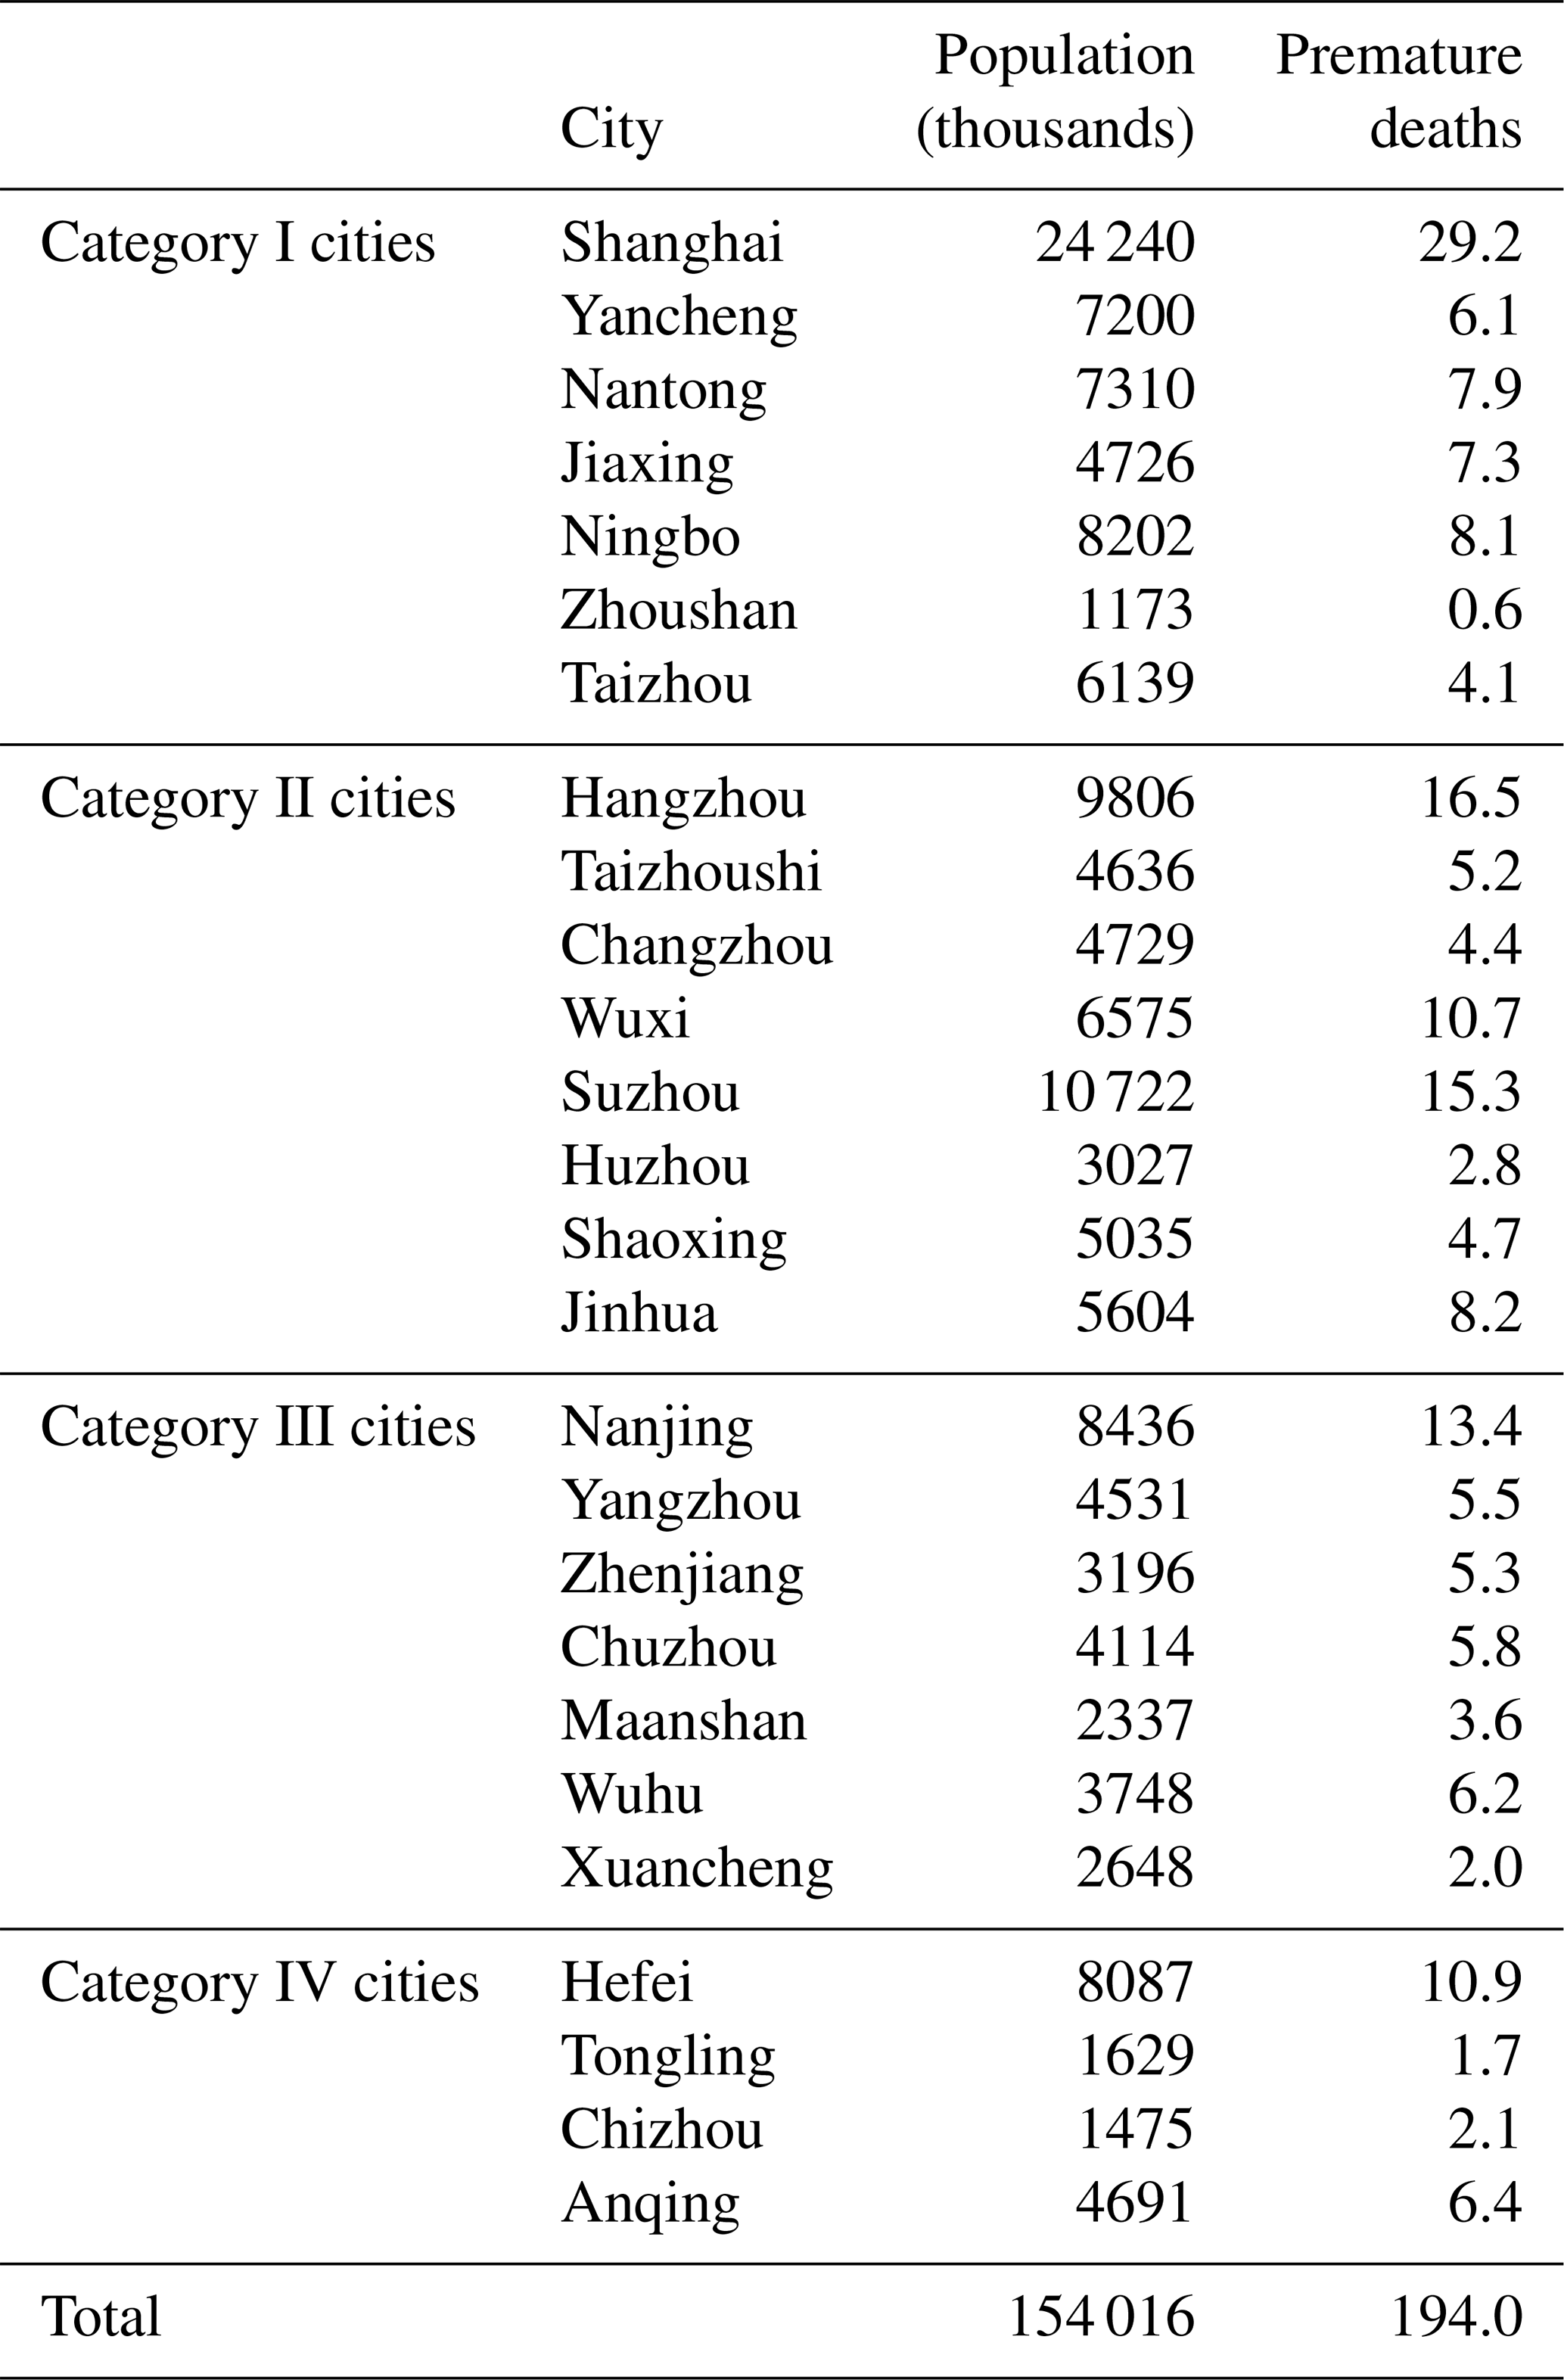
When it comes to typhoons, especially landfall typhoons, the first concern is the huge damage caused by extreme weather events. After the passing of typhoons, people are relieved and go back to their life as usual. However, our research indicates that high O3 episodes are likely to occur in the short period after a typhoon landing in the YRD, and high O3 concentrations can do harm to people's health. To bring attention to this issue, we estimate the premature mortality attributed to O3 for respiratory disease and choose two complete cycles, which is the period A1A3 (21 July to 11 August), to do the calculation. In this study, we employ the standard damage function defined by epidemiology studies (Anenberg et al., 2010; Voorhees et al., 2014) to calculate the premature deaths due to O3 exposure; the specific formulas and parameters are described in Sect. 2.7. Table 4 summarizes the premature deaths in cities in the YRD. The premature deaths are a function of both the population and O3 levels, resulting in high premature deaths in populated and heavily polluted areas. Out of the 26 cities in the YRD, Shanghai showed the highest premature deaths (29.2) due to its high surface O3 concentrations and huge population. The city with the lowest premature deaths (0.6) was Zhoushan, which may be related to the removing effect of the maritime air masses as Zhoushan is located by the sea (Fig. 1b). During this period, the total premature deaths in the YRD was 194.0, which was larger than the number of casualties caused directly by the typhoons (80 people were killed by landfall typhoons in mainland China in 2018).
Table 4Premature deaths through respiratory disease induced by O3 exposure.
In this study, we investigate the detailed processes of landfall typhoons affecting O3 in the YRD based on a unique case from 16 July to 25 August 2018, using both monitoring observations and numerical simulations. This case was characterized by two multiday regional O3 pollution episodes involving four successive landfall typhoons. The two O3 episodes appeared from 24 July to 2 August and 5 to 11 August, respectively, with the highest MDA8 O3 reaching up to 264 µg m−3.
The time when a typhoon reaches the 24 h warning line and the time when the typhoon dies away in mainland China are crucial because O3 pollution episodes mainly occur during the period from the end of a typhoon to the arrival of the next typhoon in the YRD. These two moments can be roughly regarded as time nodes. Furthermore, it is found that the variations of O3 were related to the track, duration and landing intensity of the typhoons during the study period. O3 pollution first appeared in cities along the coastline along the track of the typhoons. The interval between two typhoons can affect the duration of high O3 concentration in the YRD. Generally, a sustained high O3 concentration likely appeared in the region on days when the existing typhoon had dissipated before the arrival of the next one. Regarding the impact of the landing intensity of a typhoon, the stronger the typhoon landed, the more effective the gale and precipitation accompanying the typhoon would be in suppressing O3 generation, resulting in a lower O3 concentration in the typhoon landing location.
The detailed processes of landfall typhoons affecting O3 depend on typhoons and cities. High temperature and downward airflows combined with abundant precursors are the main reasons for high O3 concentrations in the YRD in summer. Landfall typhoons can change this state through the following mechanism: when the landfall typhoon is close enough (∼ 24 h warning line), the prevailing southeast wind will change to a southwest wind, which transports large amounts of precursors from inland to the YRD. The southwest wind usually appears first in coastal regions, and the wind direction will turn to the southeast as long as the YRD is dominated by the subtropical high. Then the typhoon makes landfall, and the low temperature, precipitation (upward airflows) and wild wind suppress the generation of O3. After the typhoon passes, the atmosphere at low layers (below 700 hPa) will be warm and dry, and downward airflows resume. The troposphere is likely to fill with a high concentration of O3 due to O3-rich air transported from the low stratosphere and strong photochemical reactions. O3 is mainly generated in the middle of the boundary layer (∼ 1000 m) instead of at the surface. The high levels of O3 can remain in the residual layer at night and can be transported to the surface by downward airflows or turbulent mixing by the second day. The downward airflows also obstruct the vertical diffusion of O3. Meanwhile, wind speed is light when the wind readjusts to the southeast, which further reduces the horizontal diffusion of O3. Thus, O3 can be accumulated and trapped on the ground. The thermodynamic effects result in high surface O3 concentrations in the YRD. Those processes will repeat if the next typhoon approaches.
The estimated premature deaths attributed to O3 exposure through respiratory disease in the YRD during 21 July to 11 August (two complete cycles of typhoons) were 194.0, which is larger than the number of casualties caused directly by the typhoons. This work has enhanced our understanding of how landfall typhoons affect O3 in the YRD, which may help the synthetically forecast O3 pollution modulated by the subtropical high and typhoons. Meanwhile, our results further confirm that large-scale synoptic weather systems play an important role in regional air pollution, suggesting a need to establish potential links between air pollution and predominant synoptic weather patterns.
Air quality monitoring data were acquired from the CNMC (http://106.37.208.233:20035/, last access: 10 November 2020; China National Environmental Monitoring Centre, 2020). Surface and sounding meteorological data were obtained from the website of the University of Wyoming (http://weather.uwyo.edu/, last access: 10 November 2020; Department of atmospheric science, 2020). The best-track TC dataset was issued by the CMA (http://tcdata.typhoon.org.cn/zjljsjj_sm.html, last access: 10 November 2020; Ying et al., 2014). The FNL meteorological data were acquired from NCEP (https://doi.org/10.5065/D6M043C6, NOAA, 2020). These data can be downloaded for free as long as you agree to the official instructions.
The supplement related to this article is available online at: https://doi.org/10.5194/acp-20-13781-2020-supplement.
CZ and MiX had the original ideas, designed the research, collected the data and prepared the original draft. CZ carried out the data analysis. MiX acquired financial support for the project leading to this publication. CH taught and helped CZ to do the numerical simulation. TW and JL revised the paper and helped to collect the data. CM helped to deal with the emission inventory. MeX and JY helped to collect the data. ML, SL, BZ and MZ reviewed the initial draft and checked the English of the original paper. YJ and DN reviewed the initial draft and helped to improve the work of the health impact.
The authors declare that they have no conflict of interest.
We thank the constructive comments and suggestions from the editor and anonymous reviewers. We are grateful for the financial support from the National Key Research and Development Program of China (2018YFC0213502, 2018YFC1506404), the open research fund of Chongqing Meteorological Bureau (KFJJ-201607), and the Fundamental Research Funds for the Central Universities (020714380047).
This research has been supported by the National Key Research and Development Program of China (grant no. 2018YFC0213502), the open research fund of Chongqing Meteorological Bureau (grant no. KFJJ-201607), the Fundamental Research Funds for the Central Universities (grant no. 020714380047), and the National Key Research and Development Program of China (grant no. 2018YFC1506404).
This paper was edited by Leimings Zhang and reviewed by two anonymous referees.
Allen, R. J., Sherwood, S. C., Norris, J. R., and Zender, C. S.: Recent Northern Hemisphere tropical expansion primarily driven by black carbon and tropospheric ozone, Nature, 485, 350–354, https://doi.org/10.1038/nature11097, 2012.
Anenberg, S. C., Horowitz, L. W., Tong, D. Q., and West, J. J.: An estimate of the global burden of anthropogenic ozone and fine particulate matter on premature human mortality using atmospheric modeling, Environ. Health Perspect., 118, 1189–1195, https://doi.org/10.1289/ehp.0901220, 2010.
Chameides, W. and Walker, J. C. G.: A photochemical theory of tropospheric ozone, J. Geophys. Res., 78, 8751–8760, https://doi.org/10.1029/JC078i036p08751, 1973.
Chan, C. K. and Yao, X.: Air pollution in mega cities in China, Atmos. Environ., 42, 1–42, https://doi.org/10.1016/j.atmosenv.2007.09.003, 2008.
Chen, F. and Dudhia, J.: Coupling an advanced land surface-hydrology model with the Penn State-NCAR MM5 modeling system. Part II: Preliminary model validation, Mon. Weather Rev., 129, 587–604, 2001.
China National Environmental Monitoring Centre: available at: http://106.37.208.233:20035/, last access: 10 November 2020.
Deng, T., Wang, T., Wang, S., Zou, Y., Yin, C., Li, F., Liu, L., Wang, N., Song, L., Wu, C., and Wu, D.: Impact of typhoon periphery on high ozone and high aerosol pollution in the Pearl River Delta region, The Scie. Total Eenviron., 668, 617-630, https://doi.org/10.1016/j.scitotenv.2019.02.450, 2019.
Department of atmospheric science: University of Wyoming, available at: http://weather.uwyo.edu/, last access: 10 November 2020.
Ding, A. J., Wang, T., Thouret, V., Cammas, J.-P., and Nédélec, P.: Tropospheric ozone climatology over Beijing: analysis of aircraft data from the MOZAIC program, Atmos. Chem. Phys., 8, 1–13, https://doi.org/10.5194/acp-8-1-2008, 2008.
Ding, A. J., Fu, C. B., Yang, X. Q., Sun, J. N., Zheng, L. F., Xie, Y. N., Herrmann, E., Nie, W., Petäjä, T., Kerminen, V.-M., and Kulmala, M.: Ozone and fine particle in the western Yangtze River Delta: an overview of 1 yr data at the SORPES station, Atmos. Chem. Phys., 13, 5813–5830, https://doi.org/10.5194/acp-13-5813-2013, 2013.
Ding, A., Nie, W., Huang, X., Chi, X., Sun, J., Kerminen, V.-M., Xu, Z., Guo, W., Petäjä, T., Yang, X., Kulmala, M., and Fu, C.: Long-term observation of air pollution-weather/climate interactions at the SORPES station: a review and outlook, Front. Environ. Sci. Eng., 10, 15, https://doi.org/10.1007/s11783-016-0877-3, 2016.
Dong, J. Y., Liu, X. R., and Zhang, B. Z.: Meta-analysis of association between short-term ozone exposure and population mortality in China, Acta Sci. Circum., 36. 1477–1485, 2016 (in Chinese).
Fan, Q., Lan, J., Liu, Y. M., Wang, X. M., Chan, P. W., Hong, Y. Y., Feng, Y. R., Liu, Y. X., Zeng, Y. J., and Liang, G. X.: Process analysis of regional aerosol pollution during spring in the Pearl River Delta region, China, Atmos. Environ., 122, 829–838, 2015.
Ghude, S. D., Chate, D. M., Jena, C., Beig, G., Kumar, R., Barth, M. C., Pfister, G. G., Fadnavis, S., and Pithani, P.: Premature mortality in India due to PM2.5 and ozone exposure, Geophys. Res. Lett., 43, 4650–4658, https://doi.org/10.1002/2016gl068949, 2016.
Grell, G. A. and Dévényi, D.: A generalized approach to parameterizing convection combining ensemble and data assimilation techniques, Geophys. Res. Lett., 29, 38-31–38-34, https://doi.org/10.1029/2002gl015311, 2002.
Guo, S., Hu, M., Zamora, M. L., Peng, J., Shang, D., Zheng, J., Du, Z., Wu, Z., Shao, M., Zeng, L., Molina, M. J., and Zhang, R.: Elucidating severe urban haze formation in China, P. Natl. Acad. Sci. USA, 111, 17373–17378, https://doi.org/10.1073/pnas.1419604111, 2014.
Hong, S. Y., Dudhia, J., and Chen, S. H.: A revised approach to ice microphysical processes for the bulk parameterization of clouds and precipitation, Mon. Weather Rev., 132, 103–120, 2004.
Hong, S. Y., Noh, Y., and Dudhia, J.: A new vertical diffusion package with an explicit treatment of entrainment processes, Mon. Weather Rev., 134, 2318–2341, 2006.
Hu, J., Chen, J., Ying, Q., and Zhang, H.: One-year simulation of ozone and particulate matter in China using WRF/CMAQ modeling system, Atmos. Chem. Phys., 16, 10333–10350, https://doi.org/10.5194/acp-16-10333-2016, 2016.
Huang, J. P., Fung, J. C. H., Lau, A. K. H., and Qin, Y.: Numerical simulation and process analysis of typhoon-related ozone episodes in Hong Kong, J. Geophys. Res.-Atmos., 110, D05301, https://doi.org/10.1029/2004jd004914, 2005.
Huang, R. J., Zhang, Y., Bozzetti, C., Ho, K. F., Cao, J. J., Han, Y., Daellenbach, K. R., Slowik, J. G., Platt, S. M., Canonaco, F., Zotter, P., Wolf, R., Pieber, S. M., Bruns, E. A., Crippa, M., Ciarelli, G., Piazzalunga, A., Schwikowski, M., Abbaszade, G., Schnelle-Kreis, J., Zimmermann, R., An, Z., Szidat, S., Baltensperger, U., El Haddad, I., and Prevot, A. S.: High secondary aerosol contribution to particulate pollution during haze events in China, Nature, 514, 218–222, https://doi.org/10.1038/nature13774, 2014.
Jerrett, M., Burnett, R. T., Pope, C. A., Ito, K., Thurston, G., Krewski, D., Shi, Y. L., Calle, E., and Thun, M.: Long-Term Ozone Exposure and Mortality., New Engl. J. Med., 360, 1085–1095, 2009.
Jiang, Y. C., Zhao, T. L., Liu, J., Xu, X. D., Tan, C. H., Cheng, X. H., Bi, X. Y., Gan, J. B., You, J. F., and Zhao, S. Z.: Why does surface ozone peak before a typhoon landing in southeast China?, Atmos. Chem. Phys., 15, 13331–13338, https://doi.org/10.5194/acp-15-13331-2015, 2015.
Jiménez, P. A. and Dudhia, J.: Improving the Representation of Resolved and Unresolved Topographic Effects on Surface Wind in the WRF Model, J. Appl. Meteorol. Climatol., 51, 300–316, https://doi.org/10.1175/jamc-d-11-084.1, 2012.
Jin, Y., Andersson, H., and Zhang, S.: Air Pollution Control Policies in China: A Retrospective and Prospects, Int. J. Environ. Res. Public Health, 13, 1219, https://doi.org/10.3390/ijerph13121219, 2016.
Kamens, R., Jang, M., Chien, C. J., and Leach, K.: Aerosol formation from the reaction of alpha-pinene and ozone using a gas-phase kinetics aerosol partitioning model, Environ. Sci. Technol., 33, 1430–1438, 1999.
Kan, H., Chen, R., and Tong, S.: Ambient air pollution, climate change, and population health in China, Environ. Int., 42, 10–19, https://doi.org/10.1016/j.envint.2011.03.003, 2012.
Khoder, M. I.: Atmospheric conversion of sulfur dioxide to particulate sulfate and nitrogen dioxide to particulate nitrate and gaseous nitric acid in an urban area, Chemosphere, 49, 675–684, 2002.
Kim, H.-J. and Wang, B.: Sensitivity of the WRF model simulation of the East Asian summer monsoon in 1993 to shortwave radiation schemes and ozone absorption, Asia-Pac. J. Atmos. Sci., 47, 167–180, https://doi.org/10.1007/s13143-011-0006-y, 2011.
Lelieveld, J., Evans, J. S., Fnais, M., Giannadaki, D., and Pozzer, A.: The contribution of outdoor air pollution sources to premature mortality on a global scale, Nature, 525, 367–371, https://doi.org/10.1038/nature15371, 2015.
Li, L., Chen, C. H., Huang, C., Huang, H. Y., Zhang, G. F., Wang, Y. J., Wang, H. L., Lou, S. R., Qiao, L. P., Zhou, M., Chen, M. H., Chen, Y. R., Streets, D. G., Fu, J. S., and Jang, C. J.: Process analysis of regional ozone formation over the Yangtze River Delta, China using the Community Multi-scale Air Quality modeling system, Atmos. Chem. Phys., 12, 10971–10987, https://doi.org/10.5194/acp-12-10971-2012, 2012.
Li, G. H., Zhang, R. Y., Fan, J. W., and Tie, X. X.: Impacts of black carbon aerosol on photolysis and ozone, J. Geophys. Res.-Atmos., 110, D23206, https://doi.org/10.1029/2005JD005898, 2005.
Li, M., Liu, H., Geng, G., Hong, C., Liu, F., Song, Y., Tong, D., Zheng, B., Cui, H., Man, H., Zhang, Q., and He, K.: Anthropogenic emission inventories in China: a review, Nat. Sci. Rev., 4, 834–866, https://doi.org/10.1093/nsr/nwx150, 2017.
Li, M., Wang, T., Xie, M., Li, S., Zhuang, B., Huang, X., Chen, P., Zhao, M., and Liu, J.: Formation and Evolution Mechanisms for Two Extreme Haze Episodes in the Yangtze River Delta Region of China During Winter 2016, J. Geophys. Res.-Atmos., 124, 3607–3623, https://doi.org/10.1029/2019jd030535, 2019.
Li, M. M., Wang, T., Xie, M., Zhuang, B., Li, S., Han, Y., and Chen, P.: Impacts of aerosol-radiation feedback on local air quality during a severe haze episode in Nanjing megacity, eastern China, Tellus B: Chem. Phys. Meteorol., 69, 1339548, https://doi.org/10.1080/16000889.2017.1339548, 2017a.
Li, M. M., Wang, T., Xie, M., Zhuang, B., Li, S., Han, Y., Song, Y., and Cheng, N.: Improved meteorology and ozone air quality simulations using MODIS land surface parameters in the Yangtze River Delta urban cluster, China, J. Geophys. Res.-Atmos., 122, 3116–3140, https://doi.org/10.1002/2016jd026182, 2017b.
Li, S. H. and Hong, H. P.: Typhoon wind hazard estimation for China using an empirical track model, Nat. Hazards, 82, 1009–1029, https://doi.org/10.1007/s11069-016-2231-2, 2016.
Li, S., Wang, T., Huang, X., Pu, X., Li, M., Chen, P., Yang, X.-Q., and Wang, M.: Impact of East Asian Summer Monsoon on Surface Ozone Pattern in China, J. Geophys. Res.-Atmos., 123, 1401–1411, https://doi.org/10.1002/2017jd027190, 2018.
Liao, J., Wang, T., Jiang, Z., Zhuang, B., Xie, M., Yin, C., Wang, X., Zhu, J., Fu, Y., and Zhang, Y.: WRF/Chem modeling of the impacts of urban expansion on regional climate and air pollutants in Yangtze River Delta, China, Atmos. Environ., 106, 204–214, https://doi.org/10.1016/j.atmosenv.2015.01.059, 2015.
Liao, Z., Gao, M., Sun, J., and Fan, S.: The impact of synoptic circulation on air quality and pollution-related human health in the Yangtze River Delta region, The Sci. Total Environ., 607–608, 838–846, https://doi.org/10.1016/j.scitotenv.2017.07.031, 2017.
Liu, D., Pang, L., and Xie, B.: Typhoon disaster in China: prediction, prevention, and mitigation, Nat. Hazards, 49, 421–436, https://doi.org/10.1007/s11069-008-9262-2, 2009.
Liu, H., Liu, S., Xue, B. R., Lv, Z. F., Meng, Z. H., Yang, X. F., Xue, T., Yu, Q., and He, K. B.: Ground-level ozone pollution and its health impacts in China, Atmos. Environ., 173, 223–230, 2018.
Lou, S., Liao, H., and Zhu, B.: Impacts of aerosols on surface-layer ozone concentrations in China through heterogeneous reactions and changes in photolysis rates, Atmos. Environ., 85, 123–138, https://doi.org/10.1016/j.atmosenv.2013.12.004, 2014.
Lu, X., Hong, J., Zhang, L., Cooper, O. R., Schultz, M. G., Xu, X., Wang, T., Gao, M., Zhao, Y., and Zhang, Y.: Severe Surface Ozone Pollution in China: A Global Perspective, Environ. Sci. Technol. Lett., 5, 487–494, https://doi.org/10.1021/acs.estlett.8b00366, 2018.
Monin, A. S. and Obukhov, A. M.: Basic laws of turbulent mixing in the surface layer of the atmosphere, Contributions of the Geophysical Institute of the Slovak Academy of Sciences, 151, 163–187, 1954.
Monks, P. S., Archibald, A. T., Colette, A., Cooper, O., Coyle, M., Derwent, R., Fowler, D., Granier, C., Law, K. S., Mills, G. E., Stevenson, D. S., Tarasova, O., Thouret, V., von Schneidemesser, E., Sommariva, R., Wild, O., and Williams, M. L.: Tropospheric ozone and its precursors from the urban to the global scale from air quality to short-lived climate forcer, Atmos. Chem. Phys., 15, 8889–8973, https://doi.org/10.5194/acp-15-8889-2015, 2015.
NOAA: NCEP FNL Operational Model Global Tropospheric Analyses, continuing from July 1999, NCAR, Research Data Archive, https://doi.org/10.5065/D6M043C6, 2020.
Shu, L., Xie, M., Wang, T., Gao, D., Chen, P., Han, Y., Li, S., Zhuang, B., and Li, M.: Integrated studies of a regional ozone pollution synthetically affected by subtropical high and typhoon system in the Yangtze River Delta region, China, Atmos. Chem. Phys., 16, 15801–15819, https://doi.org/10.5194/acp-16-15801-2016, 2016.
Shu, L., Xie, M., Gao, D., Wang, T., Fang, D., Liu, Q., Huang, A., and Peng, L.: Regional severe particle pollution and its association with synoptic weather patterns in the Yangtze River Delta region, China, Atmos. Chem. Phys., 17, 12871–12891, https://doi.org/10.5194/acp-17-12871-2017, 2017.
Tang, X. Y., Li, J. L., Dong, Z. X., Wang, Y. Y., Wang, W. X., Qi, L. W., Liu, X. L., Zhang, Y. T., Zhang, X. J., Tian, B. S., Jin, S. W., Yang, L. Q., Zhang, Y. X.: Photochemical pollution in Lanzhou, China – a case study. J. Environ. Sci. China, 1, 31–38, 1989.
Van Dingenen, R., Dentener, F. J., Raes, F., Krol, M. C., Emberson, L., and Cofala, J.: The global impact of ozone on agricultural crop yields under current and future air quality legislation, Atmos. Environ., 43, 604–618, https://doi.org/10.1016/j.atmosenv.2008.10.033, 2009.
Voorhees, A. S., Wang, J., Wang, C., Zhao, B., Wang, S., and Kan, H.: Public health benefits of reducing air pollution in Shanghai: a proof-of-concept methodology with application to BenMAP, The Sci. Total Environm., 485–486, 396–405, https://doi.org/10.1016/j.scitotenv.2014.03.113, 2014.
Wang, T. and Kwok, J. Y. H.: Measurement and analysis of a multiday photochemical smog episode in the Pearl River delta of China, J. Appl. Meteorol., 42, 404–416, 2003.
Wang, X., Zhang, Y., Hu, Y., Zhou, W., Lu, K., Zhong, L., Zeng, L., Shao, M., Hu, M., and Russell, A. G.: Process analysis and sensitivity study of regional ozone formation over the Pearl River Delta, China, during the PRIDE-PRD2004 campaign using the Community Multiscale Air Quality modeling system, Atmos. Chem. Phys., 10, 4423–4437, https://doi.org/10.5194/acp-10-4423-2010, 2010.
Wang, M., Cao, C., Li, G., and Singh, R. P.: Analysis of a severe prolonged regional haze episode in the Yangtze River Delta, China, Atmos. Environ., 102, 112–121, https://doi.org/10.1016/j.atmosenv.2014.11.038, 2015.
Wang, T., Xue, L., Brimblecombe, P., Lam, Y. F., Li, L., and Zhang, L.: Ozone pollution in China: A review of concentrations, meteorological influences, chemical precursors, and effects, The Sci. Total Environ., 575, 1582–1596, https://doi.org/10.1016/j.scitotenv.2016.10.081, 2017.
Wang, T., Gao, T., Zhang, H., Ge, M., Lei, H., Zhang, P., Zhang, P., Lu, C., Liu, C., Zhang, H., Zhang, Q., Liao, H., Kan, H., Feng, Z., Zhang, Y., Qie, X., Cai, X., Li, M., Liu, L., and Tong, S.: Review of Chinese atmospheric science research over the past 70 years: Atmospheric physics and atmospheric environment, Sci. China Earth Sci., 62, 1903–1945, https://doi.org/10.1007/s11430-019-9536-1, 2019.
Wei, X., Lam, K.-S., Cao, C., Li, H., and He, J.: Dynamics of the Typhoon Haitang Related High Ozone Episode over Hong Kong, Adv. Meteorol., 2016, 1–12, https://doi.org/10.1155/2016/6089154, 2016.
Xie, M., Zhu, K., Wang, T., Yang, H., Zhuang, B., Li, S., Li, M., Zhu, X., and Ouyang, Y.: Application of photochemical indicators to evaluate ozone nonlinear chemistry and pollution control countermeasure in China, Atmos. Environ., 99, 466–473, https://doi.org/10.1016/j.atmosenv.2014.10.013, 2014.
Xie, M., Liao, J., Wang, T., Zhu, K., Zhuang, B., Han, Y., Li, M., and Li, S.: Modeling of the anthropogenic heat flux and its effect on regional meteorology and air quality over the Yangtze River Delta region, China, Atmos. Chem. Phys., 16, 6071–6089, https://doi.org/10.5194/acp-16-6071-2016, 2016a.
Xie, M., Zhu, K., Wang, T., Chen, P., Han, Y., Li, S., Zhuang, B., and Shu, L.: Temporal characterization and regional contribution to O3 and NOx at an urban and a suburban site in Nanjing, China, The Sci. Total Environ., 551–552, 533–545, https://doi.org/10.1016/j.scitotenv.2016.02.047, 2016b.
Xie, M., Shu, L., Wang, T.-J., Liu, Q., Gao, D., Li, S., Zhuang, B.-L., Han, Y., Li, M.-M., and Chen, P.-L.: Natural emissions under future climate condition and their effects on surface ozone in the Yangtze River Delta region, China, Atmos. Environ., 150, 162–180, https://doi.org/10.1016/j.atmosenv.2016.11.053, 2017.
Xing, J., Wang, J., Mathur, R., Wang, S., Sarwar, G., Pleim, J., Hogrefe, C., Zhang, Y., Jiang, J., Wong, D. C., and Hao, J.: Impacts of aerosol direct effects on tropospheric ozone through changes in atmospheric dynamics and photolysis rates, Atmos. Chem. Phys., 17, 9869–9883, https://doi.org/10.5194/acp-17-9869-2017, 2017.
Xu, X., Lin, W., Wang, T., Yan, P., Tang, J., Meng, Z., and Wang, Y.: Long-term trend of surface ozone at a regional background station in eastern China 1991–2006: enhanced variability, Atmos. Chem. Phys., 8, 2595–2607, https://doi.org/10.5194/acp-8-2595-2008, 2008.
Yang, J. X., Lau, A. K. H., Fung, J. C. H., Zhou, W., and Wenig, M.: An air pollution episode and its formation mechanism during the tropical cyclone Nuri's landfall in a coastal city of south China, Atmos. Environ., 54, 746–753, https://doi.org/10.1016/j.atmosenv.2011.12.023, 2012.
Ying, M., Zhang, W., Yu, H., Lu, X., Feng, J., Fan, Y., Zhu, Y., and Chen, D.: An Overview of the China Meteorological Administration Tropical Cyclone Database, J. Atmos. Ocean. Technol., 31, 287–301, https://doi.org/10.1175/jtech-d-12-00119.1, 2014.
Zhan, C.-C., Xie, M., Fang, D.-X., Wang, T.-J., Wu, Z., Lu, H., Li, M.-M., Chen, P.-L., Zhuang, B.-L., Li, S., Zhang, Z.-Q., Gao, D., Ren, J.-Y., and Zhao, M.: Synoptic weather patterns and their impacts on regional particle pollution in the city cluster of the Sichuan Basin, China, Atmos. Environ., 208, 34–47, https://doi.org/10.1016/j.atmosenv.2019.03.033, 2019.
Zhang, Q. A., Wu, L. G., and Liu, Q. F.: Tropical Cyclone Damages in China 1983–2006, B. Am. Meteorol. Soc. 90, 489–496, 2009.
Zhao, C., Wang, Y., Yang, Q., Fu, R., Cunnold, D., and Choi, Y.: Impact of East Asian summer monsoon on the air quality over China: View from space, J. Geophys. Res., 115, D09301, https://doi.org/10.1029/2009jd012745, 2010.
Zhao, K., Li, X., Xue, M., Jou, B. J.-D., and Lee, W.-C.: Short-term forecasting through intermittent assimilation of data from Taiwan and mainland China coastal radars for Typhoon Meranti (2010) at landfall, J. Geophys. Res.-Atmos., 117, D06108, https://doi.org/10.1029/2011jd017109, 2012.